Task Classification Model for Visual Fixation, Exploration ... · Task Classification Model for...
4
Task Classification Model for Visual Fixation, Exploration, and Search Ayush Kumar Stony Brook University [email protected] Anjul Tyagi Stony Brook University [email protected] Michael Burch Eindhoven University of Technology [email protected] Daniel Weiskopf University of Stuttgart [email protected] Klaus Mueller Stony Brook University [email protected] Figure 1: Overview of the classifier trained for task prediction. (a) Combine and shuffle the input files for training in the next stage of exploratory analysis. (b) Feature selection to be done in this stage. (c) Feed the task-specific user file with selected features into the trained classifier. (d) Classifier predictions are analyzed in the form of a confusion matrix shown in (e). ABSTRACT Yarbus’ claim to decode the observer’s task from eye movements has received mixed reactions. In this paper, we have supported the hypothesis that it is possible to decode the task. We conducted an exploratory analysis on the dataset by projecting features and data points into a scatter plot to visualize the nuance properties for each task. Following this analysis, we eliminated highly correlated features before training an SVM and Ada Boosting classifier to predict the tasks from this filtered eye movements data. We achieve an accuracy of 95.4% on this task classification problem and hence, support the hypothesis that task classification is possible from a user’s eye movement data. CCS CONCEPTS • Human-centered computing → Visualization; • Comput- ing methodologies → Machine learning algorithms. Permission to make digital or hard copies of all or part of this work for personal or classroom use is granted without fee provided that copies are not made or distributed for profit or commercial advantage and that copies bear this notice and the full citation on the first page. Copyrights for components of this work owned by others than ACM must be honored. Abstracting with credit is permitted. To copy otherwise, or republish, to post on servers or to redistribute to lists, requires prior specific permission and/or a fee. Request permissions from [email protected]. ETRA ’19, June 25–28, 2019, Denver , CO, USA © 2019 Association for Computing Machinery. ACM ISBN 978-1-4503-6709-7/19/06. . . $15.00 https://doi.org/10.1145/3314111.3323073 KEYWORDS Classifier, eye movements, Yarbus, task decoding, visual attention ACM Reference Format: Ayush Kumar, Anjul Tyagi, Michael Burch, Daniel Weiskopf, and Klaus Mueller. 2019. Task Classification Model for Visual Fixation, Exploration, and Search. In 2019 Symposium on Eye Tracking Research and Applications (ETRA ’19), June 25–28, 2019, Denver , CO, USA. ACM, New York, NY, USA, 4 pages. https://doi.org/10.1145/3314111.3323073 1 INTRODUCTION Visual attention is one of the most sought area in the field of com- puter vision and is used in day to day tasks. Extensive studies have been conducted to predict users’ behavior or pattern from the visual attention of the observers. Kumar et al. [Kumar et al. 2018] used multi-metric grouping of eye movements to find out subjects lead- ing to distinct visual groups of similar behavior. Yarbus’ [Yarbus 2013] claim of predicting the observer’s task is one such attempt to use visual attention as a cue to look deep into human cognition. Yarbus was the first one to establish the relationship between eye movements and human cognition, which he formed as a basis of his claim. However, Yarbus’ claim to decode the observer’s task from eye movements has received mixed reaction. Green et al. [Greene et al. 2012] have reconsidered Yarbus’ work and argued against his claim, whereas Borji et al. [Borji and Itti 2014] defended Yarbus and supported their claim with their study. In this paper, we try different classification algorithms to support Yarbus’ claim. The arXiv:1907.12635v1 [cs.LG] 29 Jul 2019
Transcript of Task Classification Model for Visual Fixation, Exploration ... · Task Classification Model for...

Task Classification Model for Visual Fixation, Exploration, andSearch
Ayush KumarStony Brook University
Anjul TyagiStony Brook University
Michael BurchEindhoven University of Technology
Daniel WeiskopfUniversity of Stuttgart
Klaus MuellerStony Brook University
Figure 1: Overview of the classifier trained for task prediction. (a) Combine and shuffle the input files for training in the nextstage of exploratory analysis. (b) Feature selection to be done in this stage. (c) Feed the task-specific user file with selectedfeatures into the trained classifier. (d) Classifier predictions are analyzed in the form of a confusion matrix shown in (e).
ABSTRACTYarbus’ claim to decode the observer’s task from eye movementshas received mixed reactions. In this paper, we have supported thehypothesis that it is possible to decode the task. We conductedan exploratory analysis on the dataset by projecting features anddata points into a scatter plot to visualize the nuance properties foreach task. Following this analysis, we eliminated highly correlatedfeatures before training an SVM and Ada Boosting classifier topredict the tasks from this filtered eye movements data. We achievean accuracy of 95.4% on this task classification problem and hence,support the hypothesis that task classification is possible from auser’s eye movement data.
CCS CONCEPTS• Human-centered computing → Visualization; • Comput-ing methodologies →Machine learning algorithms.
Permission to make digital or hard copies of all or part of this work for personal orclassroom use is granted without fee provided that copies are not made or distributedfor profit or commercial advantage and that copies bear this notice and the full citationon the first page. Copyrights for components of this work owned by others than ACMmust be honored. Abstracting with credit is permitted. To copy otherwise, or republish,to post on servers or to redistribute to lists, requires prior specific permission and/or afee. Request permissions from [email protected] ’19, June 25–28, 2019, Denver , CO, USA© 2019 Association for Computing Machinery.ACM ISBN 978-1-4503-6709-7/19/06. . . $15.00https://doi.org/10.1145/3314111.3323073
KEYWORDSClassifier, eye movements, Yarbus, task decoding, visual attention
ACM Reference Format:Ayush Kumar, Anjul Tyagi, Michael Burch, Daniel Weiskopf, and KlausMueller. 2019. Task Classification Model for Visual Fixation, Exploration,and Search. In 2019 Symposium on Eye Tracking Research and Applications(ETRA ’19), June 25–28, 2019, Denver , CO, USA. ACM, New York, NY, USA,4 pages. https://doi.org/10.1145/3314111.3323073
1 INTRODUCTIONVisual attention is one of the most sought area in the field of com-puter vision and is used in day to day tasks. Extensive studies havebeen conducted to predict users’ behavior or pattern from the visualattention of the observers. Kumar et al. [Kumar et al. 2018] usedmulti-metric grouping of eye movements to find out subjects lead-ing to distinct visual groups of similar behavior. Yarbus’ [Yarbus2013] claim of predicting the observer’s task is one such attemptto use visual attention as a cue to look deep into human cognition.Yarbus was the first one to establish the relationship between eyemovements and human cognition, which he formed as a basis of hisclaim. However, Yarbus’ claim to decode the observer’s task fromeye movements has received mixed reaction. Green et al. [Greeneet al. 2012] have reconsidered Yarbus’ work and argued against hisclaim, whereas Borji et al. [Borji and Itti 2014] defended Yarbusand supported their claim with their study. In this paper, we trydifferent classification algorithms to support Yarbus’ claim. The
arX
iv:1
907.
1263
5v1
[cs
.LG
] 2
9 Ju
l 201
9

ETRA ’19, June 25–28, 2019, Denver , CO, USA Kumar & Tyagi et. al.
results show that task classification is actually possible to predictfrom eye movement data with an accuracy of 95% using modernclassification techniques in machine learning. To support this claim,we have used a dataset from an extensive study carried out byOtero-Millan et al. [Otero-Millan et al. 2008].
The rest of the paper is organized as follows: Section 2 dis-cusses the exploratory analysis part, where we use Data ContextMap[Cheng and Mueller 2016] to visualize task specific details inthe dataset and for feature selection. Then, Section 3 discusses theproposed classifiers to classify the task on the basis of their eyemovements. Section 4 presents the result in the form of a confusionmatrix which contains accuracy results. Finally, Section 5 discussesthe future work and gives concluding remarks.
2 VISUALIZATIONWITH DATA CONTEXTMAP
The data context map (DCM) [Cheng and Mueller 2016] is a toolbuilt to visualize high-dimensional data in the form of a 2D scatterplot. DCM is a variation of the multiple correspondence analysistechnique described in [Tyagi et al. 2018] and is used for numericaldata. DCM projection tries to preserve the correlation betweenvariables and the data points at the same time. The plot consistsof both, variables and data points represented in a scatter plot andthe relative distance between the variables and the data pointssignifies correlation. An example DCM for variables LP, RP, LXhref, LY href, LX Pix and LY Pix is shown in Figure 2. The datacontext map uses multidimensional scaling (MDS) [Kruskal 1964]to project the data points and the variables into lower dimensions.The distance matrix in MDS corresponds to the correlations in caseof inter variable correlation and Euclidean distances in case of interdata correlation. For finding correlation between variables and thedatapoints, the variables are treated as a data point with value 1in the corresponding dimension and zero for all other dimensions.All of these distances are then fused into a single matrix and thematrix is normalized before projecting with MDS.
2.1 AnalysisData context map can point out subtle relationships between vari-ables and the dataset. We evaluated Data Context Maps for eachof the tasks in the datasets to point out interesting correlationsand for feature selection. An example representation is shown inFigure 2 where we show the context map on Finding Waldo task.We can see the that LP (Left Pupil) and RP (Right Pupil) are closeto each other in the projection. This shows that LP and RP have ahigh correlation. It is also interesting to note that LX Pix and LXhref readings show opposite relations to that of LP and RP as theyshow no correlation, since being located far from each other on thecontext map.
Considering the positioning of data points, it is interesting tonote that very few data points lie close to the LX href on the con-text map in Figure 2 . This shows that the LX href readings hadthe least correlation with the data points. This can be understoodwith the concept of randomness in a variable, as more random thedistribution of a variable is, the less is it’s correlation with respectto a set of data points. This analysis not only allows for visualiz-ing inherent correlations, but also aids in variable filtering. After
Figure 2: Data Context Map [Cheng and Mueller 2016] pro-jection of Finding Waldo task on a randomly chosen usertrial. Green points represent mapping of eye movementreadings on a particular timestamp. Blue points representcorresponding variables in the dataset.
carefully analyzing the Data Context Maps of all the four tasks, wefound out that the least five correlated variables are LX Pix, LY Pix,LX href, LY href and LP , which we later used to train the classifiers
3 LEARNING TASK CLASSIFICATIONIn this task classification, we designed our study to classify fourtasks from the fixation dataset. We choose gaze data along with thepupil diameter as analyzed from the the data context map visual-izations for training the classifiers. As part of data preprocessing,we created an ensemble of the data by merging the files of all tasksand for all users. Each row of this merged file, which is a readingof eye movements of a user for a specific task at a timestamp waslabelled with the corresponding task label. After shuffling all theserows with labels, we generated the training data where each data-point is the eye movement reading of a user at a timestamp and thelabel is the label for the task. After the files are merged the datasetis standardized by calculating the z-score for each column in thedataset. As shown in Equation 1, zscore is a method to convert adata distribution to standard normal by subtracting the mean µ anddividing by the standard deviation σ for each column distributionin the dataset.
z =x − µ
σ(1)
We used zscore instead of Min Max normalization since zscoreis more robust towards scaling the outliers. Now that the data isnormalized, we shuffle the data points and split it to train, test, andvalidation sets. The testing and validation sets contain about fifteenpercent of the total data points each in our experiment. A portionof this normalized data was used to train the two classifiers, SVMclassifier and Ada Boosting classifier with decision tree as the baseclassifier. By using the readings of LXPix, LYPix, LX href, LY href,and LP we could train classification models which can predict thetype of task being performed, given the user’s readings over timefor any of the tasks.
Task Classification Model for Visual Fixation, Exploration, and Search ETRA ’19, June 25–28, 2019, Denver , CO, USA
3.1 Method: SVM ClassifierSupport Vector Machines [Cortes and Vapnik 1995] is a well studiedclassifier built to work with binary classification tasks. The main ob-jective is to find the hyper plane which can separate the data points.The data points can be projected to higher dimensions for easierseparation using the kernel function. For multiclass classification,one vs. rest classification [Bottou et al. 1994] technique is designedto use multiple binary classifiers to be trained for every label in thedataset [Hsu and Lin 2002]. Thus, in this case, four different SVMclassifiers are trained to each of the four task classifications. The ithSVM is trained with the samples of the ith class as positive and allothers as negative. For the given training data (x1,y1), ..., (xl ,yl )with the labels in class from 1 to k, the multiclass SVM solves theproblem shown in Equation 2.
minω i ,b i ,ϵ i
12(ωi )Tωi +C
l∑j=1
ϵij(ωi )T
(ωi )Tϕ (x j ) + bi ≥ 1 − ϵij yj = i(ωi )Tϕ (x j ) + bi ≤ −1 + ϵij yj , i
ϵij ≥ 0 j = 1, ..., l
(2)
Minimizing the above function separates the positive and nega-tive labels by maximum margin which can be controlled with thecost term C. In our experiment, the value of C = 1,000 gave the bestaccuracy of around 80%. We trained SVM on 77,000 data pointssampled from the merged dataset with stratified sampling to keepthe number of samples from each task class consistent with othertasks. ϕ is the kernel function which is used to map the data pointsfrom lower to higher dimensions for a better separation of the datapoints. In our experiment, we use the RBF kernel shown in Equa-tion 3 which is a linear combination of non-linear interpolations ofthe input to achieve the highest accuracy with SVMs on this task.The trained SVM classifier is used to predict the task from usertrials by taking the mode of predicted classes for all samples.
f (x) =n∑i=1
αiд(∥x − xi ∥). (3)
3.2 Method: Adaptive BoostingAdaptive Boosting [Freund et al. 1996] is one of the boosting tech-niques where the main idea is to use an ensemble of classifiers totrain on the same dataset. It is based on the concept that trainingmany simple classifiers of accuracy above 50%, the majority votingof these simple classifiers for each data point is likely to producebetter classification results than a complex single classifier. Eachclassifier is trained to perform better in classifying the training datapoints which were misclassified by the previous classifiers. Initially,the probability of picking each sample from the dataset is set to1/N . After each iteration, when a trained classifier is added to theensemble, the probability of generating each sample for the nextclassifier is recalculated. Let ϵk be the sum of probabilities of all themisclassified instances for the classifier Ck . Then for the classifierCK+1, the probability of picking the incorrectly classified samplesby Ck is increased by a factor of βk = (1 − ϵk )/ϵk . These proba-bilities are then normalized so that the sum of probabilities equals
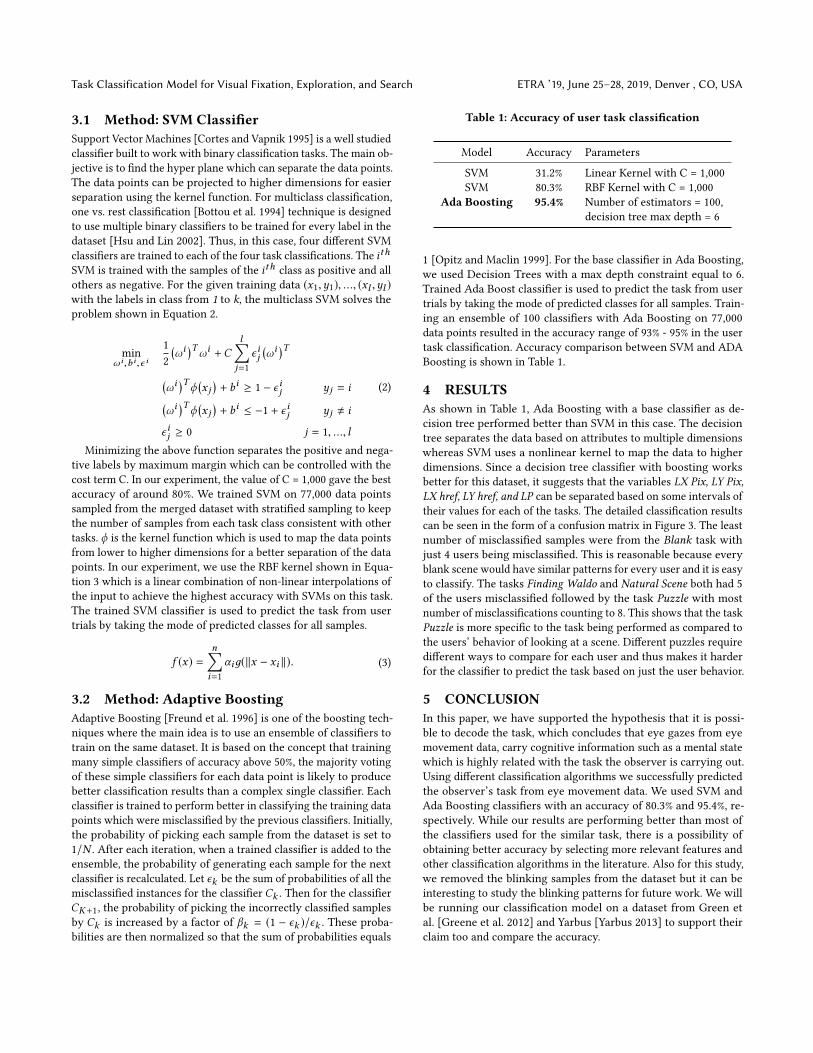
Table 1: Accuracy of user task classification
Model Accuracy ParametersSVM 31.2% Linear Kernel with C = 1,000SVM 80.3% RBF Kernel with C = 1,000
Ada Boosting 95.4% Number of estimators = 100,decision tree max depth = 6
1 [Opitz and Maclin 1999]. For the base classifier in Ada Boosting,we used Decision Trees with a max depth constraint equal to 6.Trained Ada Boost classifier is used to predict the task from usertrials by taking the mode of predicted classes for all samples. Train-ing an ensemble of 100 classifiers with Ada Boosting on 77,000data points resulted in the accuracy range of 93% - 95% in the usertask classification. Accuracy comparison between SVM and ADABoosting is shown in Table 1.
4 RESULTSAs shown in Table 1, Ada Boosting with a base classifier as de-cision tree performed better than SVM in this case. The decisiontree separates the data based on attributes to multiple dimensionswhereas SVM uses a nonlinear kernel to map the data to higherdimensions. Since a decision tree classifier with boosting worksbetter for this dataset, it suggests that the variables LX Pix, LY Pix,LX href, LY href, and LP can be separated based on some intervals oftheir values for each of the tasks. The detailed classification resultscan be seen in the form of a confusion matrix in Figure 3. The leastnumber of misclassified samples were from the Blank task withjust 4 users being misclassified. This is reasonable because everyblank scene would have similar patterns for every user and it is easyto classify. The tasks Finding Waldo and Natural Scene both had 5of the users misclassified followed by the task Puzzle with mostnumber of misclassifications counting to 8. This shows that the taskPuzzle is more specific to the task being performed as compared tothe users’ behavior of looking at a scene. Different puzzles requiredifferent ways to compare for each user and thus makes it harderfor the classifier to predict the task based on just the user behavior.
5 CONCLUSIONIn this paper, we have supported the hypothesis that it is possi-ble to decode the task, which concludes that eye gazes from eyemovement data, carry cognitive information such as a mental statewhich is highly related with the task the observer is carrying out.Using different classification algorithms we successfully predictedthe observer’s task from eye movement data. We used SVM andAda Boosting classifiers with an accuracy of 80.3% and 95.4%, re-spectively. While our results are performing better than most ofthe classifiers used for the similar task, there is a possibility ofobtaining better accuracy by selecting more relevant features andother classification algorithms in the literature. Also for this study,we removed the blinking samples from the dataset but it can beinteresting to study the blinking patterns for future work. We willbe running our classification model on a dataset from Green etal. [Greene et al. 2012] and Yarbus [Yarbus 2013] to support theirclaim too and compare the accuracy.

ETRA ’19, June 25–28, 2019, Denver , CO, USA Kumar & Tyagi et. al.
Figure 3: Confusion matrix of classification results fromAda Boosting with Decision Trees.
ACKNOWLEDGMENTSThis research was partially supported by NSF grant IIS 1527200and MSIT, Korea, under the ICT Consilience Creative program(IITP-2019-H8601-15-1011) supervised by the IITP.
REFERENCESAli Borji and Laurent Itti. 2014. Defending Yarbus: Eye movements reveal observers’
task. Journal of vision 14, 3 (2014), 29–29.Léon Bottou, Corinna Cortes, V Vapnik, JS Denker, H Drucker, I Guyon, LD Jackel, Y
LeCun, UA Muller, E Sackinger, et al. 1994. Comparison of classifier methods: acase study in handwritten digit recognition. In Proceedings of 12th InternationalConference on Pattern Recognition. IEEE, 77–82.
Shenghui Cheng and Klaus Mueller. 2016. The data context map: Fusing data andattributes into a unified display. IEEE transactions on visualization and computergraphics 22, 1 (2016), 121–130.
Corinna Cortes and Vladimir Vapnik. 1995. Support-vector networks. Machine learning20, 3 (1995), 273–297.
Yoav Freund, Robert E Schapire, et al. 1996. Experiments with a new boosting algorithm.In icml, Vol. 96. Citeseer, 148–156.
Michelle R Greene, Tommy Liu, and Jeremy M Wolfe. 2012. Reconsidering Yarbus: Afailure to predict observersâĂŹ task from eye movement patterns. Vision research62 (2012), 1–8.
Chih-Wei Hsu and Chih-Jen Lin. 2002. A comparison of methods for multiclass supportvector machines. IEEE transactions on Neural Networks 13, 2 (2002), 415–425.
Joseph B Kruskal. 1964. Multidimensional scaling by optimizing goodness of fit to anonmetric hypothesis. Psychometrika 29, 1 (1964), 1–27.
Ayush Kumar, Rudolf Netzel, Michael Burch, Daniel Weiskopf, and Klaus Mueller. 2018.Visual Multi-Metric Grouping of Eye-Tracking Data. Journal of Eye MovementResearch 10, 5 (2018), 11.
David Opitz and Richard Maclin. 1999. Popular ensemble methods: An empirical study.Journal of artificial intelligence research 11 (1999), 169–198.
Jorge Otero-Millan, Xoana G Troncoso, Stephen L Macknik, Ignacio Serrano-Pedraza,and Susana Martinez-Conde. 2008. Saccades and microsaccades during visualfixation, exploration, and search: foundations for a common saccadic generator.Journal of vision 8, 14 (2008), 21–21.
Anjul Tyagi, Ayush Kumar, Anshul Gandhi, and Klaus Mueller. 2018. Road Accidentsin the UK (Analysis and Visualization). IEEE VIS.
Alfred L Yarbus. 2013. Eye movements and vision. Springer.