Task 2 of 3: Asset Management Framework
155
NCHRP Web Document 41 (Project SP20-24[11]): Contractors Final Report Phase I Report Task 2 of 3: Asset Management Framework Prepared for: National Cooperative Highway Research Program Transportation Research Board National Research Council Submitted by: Cambridge Systematics, Inc. Cambridge, Massachusetts with Parsons Brinckerhoff Quade and Douglas, Inc. Roy Jorgensen Associates, Inc. Paul D. Thompson February 2002
Transcript of Task 2 of 3: Asset Management Framework

NCHRP Web Document 41 (Project SP20-24[11]): Contractor�s Final Report
Phase I Report
Task 2 of 3: Asset Management Framework
Prepared for: National Cooperative Highway Research Program
Transportation Research Board National Research Council
Submitted by: Cambridge Systematics, Inc.
Cambridge, Massachusetts with
Parsons Brinckerhoff Quade and Douglas, Inc. Roy Jorgensen Associates, Inc.
Paul D. Thompson
February 2002

ACKNOWLEDGMENT This work was sponsored by the American Association of State Highway and Transportation Officials (AASHTO), in cooperation with the Federal Highway Administration, and was conducted in the National Cooperative Highway Research Program (NCHRP), which is administered by the Transportation Research Board (TRB) of the National Research Council.
DISCLAIMER The opinion and conclusions expressed or implied in the report are those of the research agency. They are not necessarily those of the TRB, the National Research Council, AASHTO, or the U.S. Government. This report has not been edited by TRB.
NCHRP Project 20-24(11) Task 2 � Asset Management Framework
Cambridge Systematics, Inc. i
Foreword
State transportation officials at all levels face the task of managing a wide range of assets to meet public, agency, and legislative expectations. These assets include the physical transportation infrastructure (e.g., guideways, structures, and associated features and appurtenances) as well as other types of assets: e.g., an agency�s human resources, finan-cial capacity, equipment and vehicle fleets, materials stocks, real estate, and corporate data and information.
Recognizing its growing importance to transportation agencies worldwide, the American Association of State Highway and Transportation Officials (AASHTO) in 1998 adopted transportation asset management as a priority initiative. At that time a Task Force was formed to develop and implement a Transportation Asset Management Strategic Plan. To respond to several tasks in this Strategic Plan, the National Cooperative Highway Research Program (NCHRP) awarded Project 20-24(11) to a study team headed by Cambridge Systematics, Inc. The goal of this NCHRP project is to develop information on transporta-tion asset management and to apply these findings in producing a Transportation Asset Management Guide for use by AASHTO members and other transportation agencies. The Guide will help agencies to develop and apply the principles, techniques, and tools that can advance the management of their transportation assets.
The overall management framework that has been developed in this study is flexible enough to be adapted and refined for use with, respectively, each type of transportation agency asset listed above. To develop the depth as well as breadth of material needed to build a meaningful first-edition Transportation Asset Management Guide, however, the scope of this study has focused on the particular set of assets that constitutes an agency�s physi-cal transportation infrastructure. This concentration enables asset management princi-ples, methods, examples, and research recommendations to be developed in a concrete, practical, and understandable way. It facilitates comparisons with corresponding work by transportation agencies overseas and by the private sector, which have for the most part adopted a similar scope in their studies. It provides a specific frame of reference within which differences among state departments of transportation (DOTs) can be addressed by particular business management models, approaches, and procedures.
This study therefore interprets transportation asset management as a strategic approach to managing physical transportation infrastructure. Transportation asset management in this context promotes more effective resource allocation and utilization based upon qual-ity information. This concept covers a broad array of DOT functions, activities, and deci-sions: e.g., transportation investment policies; institutional relationships between DOTs and other public and private groups; multimodal transportation planning; program development for capital projects and for maintenance and operations; delivery of agency programs and services; and real-time and periodic system monitoring. All of these man-agement processes have important implications for an agency�s attainment of its goals in public policy, financial resource availability, engineering standards and criteria, mainte-nance and operations levels of service, and overall system performance.

NCHRP Project 20-24(11) Task 2 � Asset Management Framework
ii Cambridge Systematics, Inc.
A number of support activities are involved as well. Information technology can inform many of these management processes, and agencies have already expended considerable sums to develop asset management systems, databases, and other analytic tools. These systems must, however, complement the decision-making processes and organizational structures of individual agencies if they are to operate effectively and support good asset management at all organizational levels. Effective communication of information on asset management between an agency and its governing bodies, stakeholders, and customers is likewise critical to success.
The objectives of this study are to gather information on asset management practices in the U.S. and overseas, develop a framework for transportation asset management, and apply this framework to produce a Transportation Asset Management Guide. The study is organized in two phases:
1. Phase I encompasses information gathering, framework development, and recom-mendation of a research program; and
2. Phase II deals with production of the Guide.
Work to date has completed Phase I. The products of Phase I have been issued in three separate volumes:
• Task 1: A synthesis of current information and practices in asset management;
• Task 2: A comprehensive framework for transportation asset management to provide the framework for development of the Guide; and
• Task 3: A prioritized program of research in asset management.
This report constitutes the second volume above, addressing a comprehensive transportation asset management framework. This framework defines transportation asset management within the context of this study, and establishes its basic concepts and elements. Its man-agement approach is built on the idea that an agency�s processes for resource allocation and utilization are at the core of asset management. Based on this concept, the report builds a framework for agency self-evaluation of its current and desired practices. This framework identifies key characteristics and criteria of transportation asset management in four basic areas relating to resource allocation and utilization: policy goals and objec-tives, planning and programming, program delivery, and information and analysis. State-of-the-art practices illustrate each of these characteristics and criteria to provide benchmarks by which agencies may establish targets for incremental improvement and gauge progress toward these targets. The report also discusses strategies for updating legacy management systems and data to better support asset management, and examines the relationship between transportation asset management and recently adopted stan-dards for financial reporting of transportation infrastructure assets.

NCHRP Project 20-24(11) Task 2 � Asset Management Framework
Cambridge Systematics, Inc. iii 6881.001
Table of Contents
Summary ......................................................................................................................... S-1
1.0 Introduction .................................................................................................................... 1-1 1.1 Transportation Asset Management Worldwide ................................................ 1-1
Background............................................................................................................. 1-1 Growth of Transportation Asset Management.................................................. 1-2
1.2 Transportation Asset Management in the U.S. .................................................. 1-3 1.3 GASB Statement 34 ................................................................................................ 1-4 1.4 Outline of This Report ........................................................................................... 1-5
2.0 Definitions and Concepts ............................................................................................ 2-1 2.1 Definitions and Elements of Asset Management............................................... 2-1
Definitions............................................................................................................... 2-1 Elements of Good Practice .................................................................................... 2-2
2.2 A Resource Allocation and Utilization Process ................................................. 2-5 Overview................................................................................................................. 2-6 Physical Transportation Infrastructure............................................................... 2-8 Customizing the Asset Management Framework............................................. 2-12
2.3 A Way of Doing Business...................................................................................... 2-16
3.0 Framework Construction ............................................................................................. 3-1 3.1 Methods to Describe and Rate Management Processes.................................... 3-1
Objectives of Review.............................................................................................. 3-1 Example #1: Baldrige Criteria � A Comprehensive Framework.................... 3-2 Example #2: Capability Maturity Model for Software � A Targeted Framework ....................................................................................... 3-6 Example #3: Balanced Scorecard � A �Balanced� Approach .......................... 3-7
3.2 Framework of Transportation Asset Management ........................................... 3-8 Lessons of Existing Approaches .......................................................................... 3-8 Building the Asset Management Framework .................................................... 3-9 Evaluation Matrices ............................................................................................... 3-11
3.3 Applications of the Framework to Specific Situations...................................... 3-18 Rationale.................................................................................................................. 3-18 Examples ................................................................................................................. 3-19
4.0 Information Technology Supporting Asset Management..................................... 4-1 4.1 Introduction ............................................................................................................ 4-1 4.2 State of IT Practice Regarding Asset Management ........................................... 4-2
Overview................................................................................................................. 4-2 Systems Platforms.................................................................................................. 4-6 Challenges to Overcome ....................................................................................... 4-7
NCHRP Project 20-24(11) Task 2 � Asset Management Framework
iv Cambridge Systematics, Inc. 6881.001
Table of Contents (continued)
4.3 Sample Information System Requirements ........................................................ 4-8 Asset Inventories.................................................................................................... 4-8 Current Asset Condition and Performance........................................................ 4-9 Projected Asset Condition and Performance ..................................................... 4-9 Cost Estimation and Reporting ............................................................................ 4-10 Needs Identification............................................................................................... 4-10 Project, Program, and Network-Level Evaluation of Proposed Work ........... 4-11 Program Delivery................................................................................................... 4-11
4.4 Alternate Approaches to IT Migration................................................................ 4-12 Introduction to IT Migration ................................................................................ 4-12 Options for Data Management and Integration ................................................ 4-14 Options for Decision-Support Systems............................................................... 4-18
4.5 Use of Management Systems for Scenario Testing............................................ 4-26 4.6 Concluding Remarks ............................................................................................. 4-29
5.0 Conclusion ...................................................................................................................... 5-1
References ....................................................................................................................... R-1
Appendix A � Information Systems for Asset Management � A Maturity Model Approach....................................................................................... A-1
A.1 A Framework for Improvement........................................................................... A-1 Process Perspective ................................................................................................ A-1 Organizing Framework......................................................................................... A-2
A.2 Maturity Scale......................................................................................................... A-6 Maturity Means Being Well-Informed................................................................ A-6 The Five Levels ....................................................................................................... A-7
A.3 Elements of Asset Management Information Technology............................... A-10 Application Catalog............................................................................................... A-11 Data Interfaces ........................................................................................................ A-20 Process Interfaces ................................................................................................... A-27 Technology Infrastructure .................................................................................... A-30 Maturity Scale......................................................................................................... A-32
A.4 Implementation and Measurement ..................................................................... A-35 Step 1 � You Are Here ........................................................................................... A-36 Step 2 � Jump in at the Right Place ...................................................................... A-40 Step 3 � Measure, Evaluate, Improve .................................................................. A-40 Cultural Development........................................................................................... A-42
A.5 Conclusions............................................................................................................. A-43

NCHRP Project 20-24(11) Task 2 � Asset Management Framework
Cambridge Systematics, Inc. v 6881.001
Table of Contents (continued)
Appendix B � Implications of GASB Statement 34 ......................................................... B-1 B.1 Introduction ............................................................................................................ B-1 B.2 Information on Transportation Infrastructure Assets....................................... B-2
Organization of Information................................................................................. B-2 Initial Capitalization of Assets ............................................................................. B-4 Methods to Report Transportation Infrastructure Assets ................................ B-4 Accounting for Network Effects .......................................................................... B-8
B.3 Application of the Modified Approach............................................................... B-11 GASB Requirements and Asset Management Capabilities.............................. B-11 Application of Management Systems ................................................................. B-15
B.4 Application of the Depreciation Approach ........................................................ B-16

vi Cambridge Systematics, Inc. 6881.001
NCHRP Project 20-24(11) Task 2 � Asset Management Framework
This page intentionally left blank.

NCHRP Project 20-24(11) Task 2 � Asset Management Framework
Cambridge Systematics, Inc. vii
List of Tables
2.1 Examples of Tradeoffs Across Program Categories .................................................. 2-14
3.1 Policy Goals and Objectives .......................................................................................... 3-12
3.2 Planning and Programming.......................................................................................... 3-13
3.3 Program Delivery ........................................................................................................... 3-15
3.4 Information and Analysis.............................................................................................. 3-16
A.1 Overall Maturity Scale for Asset Management Information Systems..................... A-8
A.2 Maturity Levels for Asset Management Information Systems ................................ A-33
A.3 Outline for Process Assessment Interviews................................................................ A-38
B.1 Comparison of GASB Modified and Depreciation Approaches.............................. B-7
B.2 Requirements of the Modified Approach Organized for Asset Management ...... B-13
B.3 Example Asset Management Actions Supporting the Modified Approach .......... B-14

viii Cambridge Systematics, Inc. 6881.001
NCHRP Project 20-24(11) Task 2 � Asset Management Framework
This page intentionally left blank.

NCHRP Project 20-24(11) Task 2 � Asset Management Framework
Cambridge Systematics, Inc. ix
List of Figures
2.1 Overview of Resource Allocation and Utilization in Asset Management.............. 2-7
2.2 Example Resource Allocation and Utilization Process in Asset Management...... 2-9
2.3 Asset Management Organizational Coordination and Information Flows ........... 2-17
3.1 Development of the Asset Management Framework................................................ 3-10
3.2 Example Basic Improvements to an Asset Management Process............................ 3-20
3.3 Example of More Advanced Improvement to an Asset Management Process ..... 3-21
4.1 Typical Infrastructure Management Systems............................................................. 4-3
4.2 Typical Management Systems in Transportation Operations, Safety, and Customer Service .................................................................................................... 4-4
4.3 Typical Systems to Manage Agency Resources ......................................................... 4-5
4.4 Typical Systems to Manage Programs and Projects .................................................. 4-6
4.5 Legacy System Interface Approach to Asset Management Data............................. 4-14
4.6 Data Warehouse/Repository Approach to Asset Management.............................. 4-15
4.7 Centralized Database Approach for Asset Management ......................................... 4-16
4.8 Distributed Database Approach for Asset Management.......................................... 4-17
4.9 Example Current Situation in Asset Management Systems..................................... 4-18
4.10 Functions and Standards Approach for Asset Management ................................... 4-20
4.11 New Analytic Tools for Asset Management............................................................... 4-21
4.12 Executive Information System for Asset Management............................................. 4-23
4.13 Fully Integrated Asset Management System.............................................................. 4-24
4.14 Component-Based Asset Management System.......................................................... 4-25
4.15 Example of Budget Scenarios and Effects on Infrastructure Condition ................. 4-28

NCHRP Project 20-24(11) Task 2 � Asset Management Framework
x Cambridge Systematics, Inc.
List of Figures (continued)
4.16 Identification of Points to be Plotted to Relate Condition and Needed Expenditure ...................................................................................................... 4-28
4.17 Resulting Relationship Between Infrastructure Condition and Needed Expenditure ...................................................................................................... 4-29
A.1 Maturity Scales for Information Technology in Asset Management ...................... A-4
A.2 Overall Framework ........................................................................................................ A-6
A.3 Elements of Asset Management Information Technology ....................................... A-11
B.1 Example Deterioration Curve for a Single Asset ....................................................... B-9
B.2 Example Curves for a Single Asset and a Group or Collection of Assets...................... B-11

NCHRP Project 20-24(11) Task 2 � Asset Management Framework
Cambridge Systematics, Inc. S-1
Summary
Transportation asset management represents a strategic approach to managing transpor-tation infrastructure assets. It focuses on a department of transportation�s (DOT�s) busi-ness processes for resource allocation and utilization with the objective of better decision-making based upon quality information and well-defined objectives. Recognizing its growing importance to transportation agencies worldwide, the American Association of State Highway and Transportation Officials (AASHTO) in 1998 adopted asset manage-ment as a strategic initiative, and formed a Task Force to develop and implement a Strategic Plan for Transportation Asset Management.(1) This report addresses Task 2-4-1 in this Strategic Plan: �Propose a general framework for transportation asset management that can be adopted by member states to meet their individual needs.�1
The key principles of asset management represent a way of doing business � a perspective that a department can adopt in looking at its current procedures and seeing how better decisions on infrastructure management can be made with better information. Transpor-tation asset management represents the following ideals:
• Asset Management Is a Philosophy. Asset management is strategic, taking a long view of infrastructure performance and cost, and considering options in a holistic, pro-active, and informed way. It is driven by policy goals and objectives and relies on sys-tematic assessments of performance and cost in making decisions on future actions.
• Asset Management Is a Process. In fact, asset management influences a number of business processes related to infrastructure management in DOTs, including those related to planning, program development and recommendation, engineering of proj??ects and services, and program delivery. Decisions on allocating resources � not only financial resources but also labor skills, real estate, equipment and materials, and information � are policy- and performance-driven, consider a range of alternatives, have clear criteria for decision-making, and investigate the most cost-effective solutions through analyses of tradeoffs. The business processes are managed to elicit effective contributions from all levels of the organization, and to foster communications on asset management needs and accomplishments both within and outside the agency.
• Asset Management Is a Set of Technical Tools. Quality information � accurate, com-plete, timely � is important at all stages of asset management. Information technology is a practical necessity in supporting asset management, although there are many ways in which automated techniques can be beneficially applied.
These elements form the foundation for the asset management framework presented in this report. This framework represents a management structure that can be used by State DOTs to assess their current asset management practices in comparison to benchmarks 1 Ref. (1), page 15.
NCHRP Project 20-24(11) Task 2 � Asset Management Framework
S-2 Cambridge Systematics, Inc.
that illustrate the state-of-the-art. However, developing a practical implementation plan tailored to a specific DOT based on this assessment requires drilling down further to char-acterize the agency in terms of key characteristics of its management environment:
• Policy and institutional framework;
• Program structure and funding;
• Agency processes and procedures;
• Organizational roles; and
• Data and information technology.
Phase II of this project entails the development of a Transportation Asset Management Guide. This guide will help state DOTs analyze these dimensions simultaneously to identify pri-ority areas where asset management principles can be applied most effectively, identify the type of asset management recommendations to implement, and develop a method to track improvement. The Guide will be applicable to DOTs operating in a wide range of institutional, organizational, and technological environments. This report establishes the conceptual framework and principles that will serve as the foundation for the Transportation Asset Management Guide.

NCHRP Project 20-24(11) Task 2 � Asset Management Framework
Cambridge Systematics, Inc. 1-1
1.0 Introduction
��������1.1 Transportation Asset Management Worldwide
Background
Transportation facilities constitute one of the most valuable assets, and account for a major share of public sector investment, in industrialized economies worldwide. These expen-ditures serve to build, operate, and preserve the infrastructure that supports a rich variety of movements of people and goods by ground, air, and water, both domestically and to and from ports of entry. Efficient, economical, and safe transportation is critical to a soci-ety in meeting its goals toward economic progress, social welfare, national defense, domestic security, and emergency preparedness. The structural and operational conditions of transportation facilities are key factors in the performance of the system overall and in the satisfaction of customers with the service provided.
The civil works associated with transportation systems are numerous, substantial, and � with proper maintenance and operation � long-lived. The challenge of managing these facilities has long been recognized by public sector transportation agencies at all levels of government, as well as by authorities chartered to own and operate facilities such as toll-ways, airports, and ports. Functions, responsibilities, and decisions in these agencies his-torically have been organized around a combination of the following:
• Transportation mode (e.g., highway, railway, transit, aviation, marine);
• Significant individual facilities (e.g., toll facility, airfield, port terminal);
• Business process function (e.g., planning, design, construction, maintenance, opera-tions, finance); and
• Technical discipline (e.g., structures, materials, traffic, safety, information technology).
This business approach reflects the wide range of professional expertise needed to manage complex networks and facilities in a public sector environment. However, it also tends to focus each organizational unit on its particular area of responsibility. Absent mechanisms to ensure a wide view of problems and issues, an agency�s business processes and deci-sions may become too focused on individual areas of expertise, rather than contributing to more broadly based analyses, evaluations, and decisions.
Similarly, information and management systems developed by transportation agencies typically focus on individual classes of assets (e.g., highway pavements, bridges and structures, railroad track, airport runways) or specific functions (e.g., capital program-ming, maintenance). A more comprehensive framework would integrate the information and recommendations of these disparate individual management tools within an

NCHRP Project 20-24(11) Task 2 � Asset Management Framework
1-2 Cambridge Systematics, Inc.
organization�s decision processes. This integrated asset management framework would provide agencies with new concepts, methods, criteria, and tools to assist managers in identifying and addressing critical infrastructure needs more effectively and at improved service to the public.
Growth of Transportation Asset Management
In the past several years, transportation agencies throughout the world have engaged a more strategic view of managing facilities, referred to as transportation asset manage-ment.2 Transportation asset management drives a more strategic approach to resource allocation decisions across all transportation assets, broadly defined. It provides a frame-work for an agency to make decisions on investments in new capacity, improvements, preservation, and operations based on better information and in a more holistic and pro-active way. Asset management helps build an awareness of the importance of transporta-tion assets � financially, economically, socially, and technically. It embodies fundamental principles of good practice that can be applied by agencies representing different organ-izational structures, management philosophies and culture, demographic and geographic influences on transportation demand, funding situations, and institutional relationships.
Asset management has been studied by overseas transportation and public works agen-cies for several years. Detailed methodological handbooks and reports have been pro-duced, for example, in Australia and New Zealand. Work has also been done recently in Canada, Finland, and Sweden. The subject is currently receiving considerable attention throughout the developed world, as evidenced by a recently completed compendium by the Organization for Economic Cooperation and Development (OECD) of activities of its member nations in North America, Europe, and Asia.3
Transportation asset management entails more than just a melding of existing procedures or compilation of existing data, however. A comprehensive asset management approach may entail change in how an agency conducts business, reaches decisions, collects and processes data, and communicates information. Good asset management thus requires a strong technical and informational basis that supports effective business processes and
2 The practice is also referred to as total asset management or infrastructure asset management. These
qualifications serve to distinguish this approach, which focuses on civil works or transportation infrastructure specifically, from other management techniques dealing with wholly different categories of assets (e.g., financial portfolios). Certain agencies overseas use asset management or total asset management, since the techniques are applied to transportation facilities as well as other public works: e.g., water supply networks. In the U.S., the American Association of State Highway and Transportation Officials (AASHTO) uses transportation asset management in its Strategic Plan.(1) This latter usage helps to avoid confusion when �assets� or �asset management� are already used in a different context within a state DOT: e.g., to refer to management of buildings and real estate. This report will use transportation asset management and the shorter asset management interchangeably, to mean a strategic approach to managing transportation infrastructure.
3 International and U.S. work in asset management is documented in a separate Synthesis Report produced by this study.

NCHRP Project 20-24(11) Task 2 � Asset Management Framework
Cambridge Systematics, Inc. 1-3
well-functioning channels of communication within the agency�s organization and with external policy bodies, customers, and other interested parties.
��������1.2 Transportation Asset Management in the U.S.
U.S. transportation officials at all levels are faced with the task of managing a wide range of transportation assets that must continually respond to public expectations. Recog-nizing the growing importance of asset management to transportation agencies world-wide, the American Association of State Highway and Transportation Officials (AASHTO) in 1998 adopted asset management as a critical initiative, and formed a Task Force to develop and implement a 10-year Strategic Plan for Transportation Asset Management.(1) The Strategic Plan will ultimately meet five goals:
1. To establish partnerships with other agencies and stakeholders in pursuing asset management;
2. To promote a better understanding of asset management and how it can be used by member states;
3. To foster the development of better asset management techniques, tools, and associ-ated research;
4. To communicate with and inform the leadership of member states on how they can use asset management; and
5. To assist member states as they evaluate and use asset management.
The Federal Highway Administration (FHWA) has recently created an Office of Asset Management to provide leadership in, and serve as an advocate for, more systematic management of highway infrastructure as a public investment. It plays a strong role in promoting system preservation, management tools such as pavement management, bridge management, and applications for economic analysis of system investments, new technology, and outreach and partnering activities. It works with the public and private sector and academia to conduct nationwide programs in asset management.
Both AASHTO and the FHWA have thus played leadership roles in building an aware-ness of transportation asset management throughout the U.S. transportation community. Beginning in 1996, these organizations have co-sponsored a series of workshops on asset management practice that have become major forums for exchanges of ideas and updates of progress in the field. AASHTO and the FHWA have funded this National Cooperative Highway Research Program study (NCHRP Project 20-24(11)) to develop a framework of asset management and document it in a Transportation Asset Management Guide for U.S. transportation agencies. Other organizations such as the American Public Works Association (APWA), the Civil Engineering Research Foundation (CERF), the National Science and Technology Council (NSTC), and the Transportation Research Board (TRB) have formed task forces and/or sponsored research and workshops on asset management.

NCHRP Project 20-24(11) Task 2 � Asset Management Framework
1-4 Cambridge Systematics, Inc.
Individual state DOTs are now pursuing the development of asset management strategies and plans. In addition, several universities have established asset management research centers.4
��������1.3 GASB Statement 34
In June 1999 the Governmental Accounting Standards Board (GASB) approved Statement 34, which updated standards for state and local agencies in preparing reports of their financial condition.(2) New provisions in Statement 34 require state and local agen-cies to include the value of transportation infrastructure as capital assets in these reports. For State DOTs, asset valuation and reporting are required in both a prospective sense (i.e., for assets acquired now or in the future), and in a retroactive sense (i.e., for assets acquired in the past). GASB allows two options for reporting the current financial status of transportation assets:
1. A depreciation approach, in which annual adjustments in asset value are computed in accordance with accepted methods of depreciation based upon historical cost and service life, allowing for recapitalization of existing assets and addition of new capital stock. The expenses of maintaining these assets are also reported in a separate line item.
2. A �modified� approach that provides an alternate method to depreciation, recognizing that transportation infrastructure assets tend to be preserved indefinitely. The modi-fied approach requires an agency to meet certain information and management crite-ria. The modified approach requires a current inventory of infrastructure assets, periodic condition assessments of these assets, estimates of the amount needed to pre-serve these assets at a stated condition level (i.e., information that can be obtained from an asset management system), and comparison with actual preservation and maintenance expenditures. Adjustments in asset value are reported for addition of new capital stock.
While GASB Statement 34 and transportation asset management are not synonymous, the data on transportation infrastructure assets in the GASB 34 financial reports can be very useful for asset management. Similarly, a good asset management approach can develop the data needed for GASB 34 reporting of infrastructure assets. This linkage between GASB 34 standards for financial reporting and transportation asset management is explored reporting in greater detail in Appendix B.
4 Additional details and reference citations for these activities are included in the accompanying
Synthesis Report.

NCHRP Project 20-24(11) Task 2 � Asset Management Framework
Cambridge Systematics, Inc. 1-5
��������1.4 Outline of This Report
This report is one of three documents concluding Phase I of this study. The two other deliverables, prepared as companions to this report, are a Synthesis Report of current asset management practice and a recommended asset management research program. The methodology developed in this report provides the basis for later development of a com-prehensive Transportation Asset Management Guide in Phase II.
The remainder of this report is organized as follows:
• Section 2.0 defines transportation asset management and develops the concepts and principles that characterize its good practice.
• Section 3.0 translates these concepts and principles into a more formal management framework, following a review of management approaches that have been successful in other domains.
• Section 4.0 discusses strategies to migrate agency legacy information systems and databases to better support asset management, and the role of information technology in supporting both better asset management and the infrastructure financial reporting standards of GASB 34.
• Section 5.0 concludes the report.

NCHRP Project 20-24(11) Task 2 � Asset Management Framework
Cambridge Systematics, Inc. 2-1
2.0 Definitions and Concepts
This section is the first of two that will develop the framework of asset management used in this study.
��������2.1 Definitions and Elements of Asset Management
Definitions
The following definitions will guide this study:
Assets
Assets represent an agency�s physical transportation infrastructure.
Transportation Asset Management
Transportation Asset Management represents a strategic approach to man-aging transportation infrastructure.
Transportation agencies manage a wide range of assets to meet public, agency, and legis-lative expectations. Physical transportation infrastructure is one type of asset. Others include an agency�s human resources, financial capacity, equipment and vehicle fleets, materials stocks, real estate, and corporate data and information. The overall manage-ment framework to be developed below is flexible enough to be adapted and refined for use with, respectively, each type of asset above.
To develop the depth as well as breadth of material needed to build a meaningful first-edition Transportation Asset Management Guide, this study focuses on the particular set of assets that constitutes an agency�s physical transportation infrastructure. Other agency assets can be viewed in this context as resources that are allocated and utilized in man-aging the physical transportation infrastructure.
This focus on physical infrastructure enables the elements of asset management � e.g., its principles, methods, examples of practice, and research needs � to be developed in a con-crete, practical, and understandable way. At a general level, it facilitates comparisons with corresponding work by transportation agencies overseas and by the private sector, which have for the most part adopted a similar approach in their studies. More specifi-cally, focusing on a specific type of asset defines a context for this study. It enables a management framework to be built with the depth needed to address different manage-ment situations faced by DOTs across the country � �one size does not fit all.� Specific

NCHRP Project 20-24(11) Task 2 � Asset Management Framework
2-2 Cambridge Systematics, Inc.
examples can be developed to reflect the unique technical, political, institutional, organizational, financial, informational, and managerial situations that relate to infra-structure management across agencies. Recommended business models, management approaches, and evaluation procedures can be tailored to the differences among DOTs within the context of managing physical infrastructure. The remainder of this report will interpret transportation asset management as applying to physical transportation infra-structure specifically, recognizing that future studies may address other types of assets in a corresponding way.
The simplicity of the definitions above reflect the fundamental nature of asset manage-ment. This fundamental approach encompasses a number of possible ways to implement good asset management practices, and allows each agency the latitude to refine the con-cept in the way that best suits its business processes. More will be said about meeting dif-ferent agency needs and situations in the sections below and in the next section. In general, however, the objectives and benefits of asset management implementation are:
• To build, preserve, operate, and reinvest in facilities more cost effectively with improved performance;
• To deliver to an agency�s customers the best value for the public tax dollar spent; and
• To enhance the credibility and accountability of the transportation agency to its gov-erning executive and legislative bodies.
Elements of Good Practice
Elements of good practice elaborate upon the definition of asset management. These ele-ments reflect the concept that transportation asset management should not be considered as a separate new program or initiative, overlaid upon existing procedures and in compe-tition with other items on a department�s agenda. Rather, it represents a way of doing business � a perspective that a department can adopt in looking at its current procedures and seeing how better decisions on physical infrastructure management can be made with better information. In this view, the principles of good asset management can be visual-ized as affecting, simultaneously, the philosophy, processes, and technical tools that underlie an agency�s decisions and uses of information.
Asset Management Is a Philosophy
Asset management represents an approach to managing infrastructure that is strategic and proactive, and places a premium on good information in all aspects and in all departmental units.
• Asset management is holistic. It entails a comprehensive view across a range of assets. It encourages consideration of a full range of options to meet problems or needs. Tradeoffs are explicitly considered among programs, modes, or strategies.

NCHRP Project 20-24(11) Task 2 � Asset Management Framework
Cambridge Systematics, Inc. 2-3
• Asset management as a philosophy may be applied broadly to virtually all func-tional areas of an organization or targeted to particular areas. Increasingly, asset management is being seen as a comprehensive approach that may be successfully applied at virtually all levels and across virtually all functions of an infrastructure-based organization. However, in its evolution, asset management may also be focused on particular areas of emphasis, such as system preservation or, alternately, system expansion and operations. This need for adaptability in responding to the current pol-icy objectives and priorities of different agencies explains why the term �transportation asset management� is often interpreted differently. It also explains why asset man-agement is simultaneously powerful, rigorous, yet flexible.
• Asset management is driven by policy goals and objectives based upon performance. Strategies are analyzed in terms of objective assessments of costs, benefits, and other impacts on the transportation system and levels of service provided to transportation users.
• Asset management takes a long-term view of infrastructure performance and cost. The benefits of different actions are assessed throughout the infrastructure service life, applying economic as well as technical criteria.
• Asset management is proactive. An agency has the latitude to make decisions based on merit. Preventive strategies are encouraged where they are cost effective.
• Asset management policy is influenced and informed by good information. This information describes current and projected system condition and performance that would result from different policies or strategies. It also encompasses user perceptions of system condition and performance, as obtained through surveys or focus groups.
• Asset management is explicit and visible, and serves to clarify and communicate the process and outcomes of resource allocation and program delivery. Asset manage-ment, by virtue of its rational and objective qualities, demystifies and fosters confi-dence in those decision processes that influence the allocation and utilization of scarce resources. In doing so, asset management fosters increased stakeholder participation, buy-in, and adherence to adopted strategies and decisions.
• Viewed as �a way of doing business,� asset management is pervasive, affecting the business practices of every organizational element involved in the functions to which it is applied.
Asset Management Is a Process
Principles of good asset management can suggest ways in which an agency�s business processes and its organizational roles and responsibilities can be strengthened. These process improvements can occur in those activities prior to budget approval � i.e., plan-ning and program development � and in the program delivery and system performance monitoring phases subsequent to budget approval. Major principles governing process improvements are listed below.

NCHRP Project 20-24(11) Task 2 � Asset Management Framework
2-4 Cambridge Systematics, Inc.
• Investment choices and decisions on allocating and applying resources are policy- and performance-driven. Procedures to reach these decisions are consistent with objective information and criteria based on merit. Performance measures consistent with policy goals and objectives are established for management review of both system performance and program delivery.
• Investment choices and decisions on allocating resources are based upon explicit tradeoffs among modes, programs, or strategies. Tradeoffs assess the impacts of more or less investment in a mode, program, or strategy, and help to craft final recommen-dations on how resources will be allocated across competing needs. Managers also understand the implicit tradeoffs in their programs and budgets, and the consequences thereof.
• Asset management entails the translation of policies and plans into optimized investment strategies, and the translation of investment strategies into optimized program delivery. The essence of asset management involves a combination of resource allocation decisions and program delivery strategies that are optimized in relation to specific policy-driven criteria.
• Organizational roles and responsibilities regarding asset management are developed to encourage more strategic and integrated approaches. While strong vertical organ-izational units may exist to maintain core expertise, managed business processes and decisions involve wider participation, as noted below.
• Asset management is interdisciplinary. Decisions on investment choices and resource allocation are based upon expertise and judgment from several quarters of an agency.
• Asset management requires effective communication within and outside the agency. Within the agency, strong communication channels are needed both vertically and horizontally. External communications need to inform policy-makers and other stakeholders of the status of transportation assets and recommended policies and their benefits.
• The agency strives for more effective program delivery. The agency explores innova-tive methods to deliver the range of projects and services required. All available meth-ods are considered, including use of departmental employees, intergovernmental agreements, outsourcing or managed competition, and privatization.
Asset Management Is a Set of Technical Tools
Effective management systems and complete, current, and accurate information on trans-portation infrastructure are practical necessities in meeting the policy and process requirements of asset management. Good asset management implies a systematic, integrated approach to project selection, analysis of tradeoffs, and program and budget decisions. It also implies that the right information be available to the right levels of man-agement at the right times. The principles below support the availability and application of better information to make better decisions in asset management.

NCHRP Project 20-24(11) Task 2 � Asset Management Framework
Cambridge Systematics, Inc. 2-5
• Complete, current, and accurate information on transportation infrastructure assets, including descriptions, location, usage, unique or specialized characteristics, functional and other classification, and data needed for management systems as discussed below.
• An appropriate suite of management systems and databases informs the agency of the status, trends, and needs regarding its infrastructure assets. Typical capabilities of these systems include the following:
− Organization of information within databases describing infrastructure inventory, condition, and performance;
− Analytic models that predict the rate of future change in condition or performance, enabling the agency to forecast future infrastructure needs;
− Decision rules or procedures for applying treatments or actions to maintain, reha-bilitate, replace, or expand transportation infrastructure, with analytic models of resulting costs, benefits, and other impacts; and
− Reports tailored to different organizational levels of management, including senior and executive levels, as well as for public distribution.
• Information on system performance in terms of both proposed targets and values actually achieved in the field. These data may be obtained in a number of ways:
− Periodic surveys and assessments of system condition or levels of service;
− Customer surveys of satisfaction with system condition and agency performance; and
− Incorporation of performance measures and associated backup information within management systems.
• Specialized technical applications that support an agency�s asset management proce-dures. These will vary by agency, but may include advances such as use of geographic information systems (GIS) as a system/data integration platform, economic analysis applications (e.g., generalized life-cycle benefit-cost procedure), and other decision-support tools.
• Applications that assist in program and service delivery, including financial applica-tions (e.g., to compute �total� or �true� cost of agency and contracted services), and management systems for construction project pipeline and construction delivery.
��������2.2 A Resource Allocation and Utilization Process
Asset management is, at its core, a process of resource allocation and utilization. Resources in this context are interpreted broadly, encompassing financial, human, infor-mation, material, and equipment inputs to the management of the physical transportation infrastructure. The process of assigning or distributing these resources and applying them to the agency�s mission is likewise interpreted broadly, encompassing not only the

NCHRP Project 20-24(11) Task 2 � Asset Management Framework
2-6 Cambridge Systematics, Inc.
traditionally understood functions in planning, program development, and budget approval, but also program delivery, system monitoring, data analysis, and input to policy formulation. Agencies that have already taken steps to implement asset manage-ment recognize its strong link to resource allocation and utilization. As processes com-mon to all public-sector transportation organizations, resource allocation and utilization provide an effective vehicle for organizing the principles of asset management in a way that focuses on more effective decision-making.
Overview
As a first step, Figure 2.1 provides a high-level overview of a resource allocation and utili-zation process that reflects the application of asset management to a set of relevant pro-grams. The general nature of the flowchart highlights important basic characteristics of transportation asset management:
• Overall guidance is provided through explicit policy goals and objectives, and the means to test responsiveness to these policies through system monitoring and per-formance measurement.
• An integrated analysis of options and tradeoffs investigates how best to meet the needs of customers while responding to policy goals and objectives. The integrated nature of this step implies consideration of a range of alternatives within a strategic, holistic view. The consideration of tradeoffs implies not only the identification of specific pri-orities within a program area, but also the consideration of different distributions of available resources across program areas.
• Decisions on resource allocation among programs and investment options are made, consistent with policy guidance and the results of the analyses in the preceding step. Resources considered in this step are interpreted broadly: i.e., not only available finan-cial resources, but also other resources such as human skills, equipment and materials, information, intellectual property, hardware, and real estate.
• Once decisions on resource allocation are made, they are implemented through deliv-ery of program services, projects, and products. Asset management entails identifying, from the available mechanisms for delivery, the best one to use according to established criteria: e.g., cost-effectiveness, needed timeliness and quality, availability of requisite skills and other resources, and competing demands for the agency�s own resources.
• The entire process is informed by continual system monitoring and performance meas-urement. Ideally, this information is used to update each step of the process, as indi-cated by the several feedback loops on the left-hand-side of Figure 2.1.
• Quality information supports each step of the process, as illustrated on the right-hand-side of Figure 2.1. This information may describe, for example, current status of the asset population, projections of future status as a function of assumptions regarding policy or funding, costs associated with building and maintaining asset value, benefits derived from assets, results and costs of programs to manage assets, and implications of changes to policies and activities affecting the asset population.

NCHRP Project 20-24(11) Task 2 � Asset Management Framework
Cambridge Systematics, Inc. 2-7
Figure 2.1 Overview of Resource Allocation and Utilization in Asset Management
Policy Goals and Objectives
Integrated Analysis of Options and Tradeoffs
Resource Allocation Decisions, Investment Choices
Implementation - Program Delivery
System Monitoring and Performance Results
Quality Inform
ation
• The process represents a consistent approach top-to-bottom. The methods and criteria for performing analyses and making resource allocation decisions, and the measures used for monitoring system performance, reflect the policy goals and objectives. The programs delivered during the implementation step are those that were intended in the resource allocation decisions. The information that is provided throughout the process supports the needed analyses, criteria, and performance measures.
The high-level framework in Figure 2.1 can be developed and refined to meet the needs of different organizations, in different policy, institutional, technical, and financial settings, and facing different asset management needs. In fact, Figure 2.1 is sufficiently general that it could be interpreted to represent program decisions affecting any of the types of assets discussed earlier. The basic principles of asset management � clear objectives to guide the process, consideration of alternatives, assessment of tradeoffs, use of perform-ance measures, value of good information, and so forth � could apply equally well to resource allocation and utilization processes addressing various types of assets: e.g., human resource development and nurturing programs, options for acquisition of capital, material, or real estate assets, and strategies for developing or enhancing information technology (IT) capabilities. At this high level, the principles and applications of asset management define a very general framework.
To apply this framework in a useful way requires more specific guidelines and examples. There is a need to focus on a particular type of asset, and to tailor the high-level framework to the specific decision processes and information flows needed to manage

NCHRP Project 20-24(11) Task 2 � Asset Management Framework
2-8 Cambridge Systematics, Inc.
those assets. The following section illustrates this development for physical transporta-tion infrastructure.
Physical Transportation Infrastructure
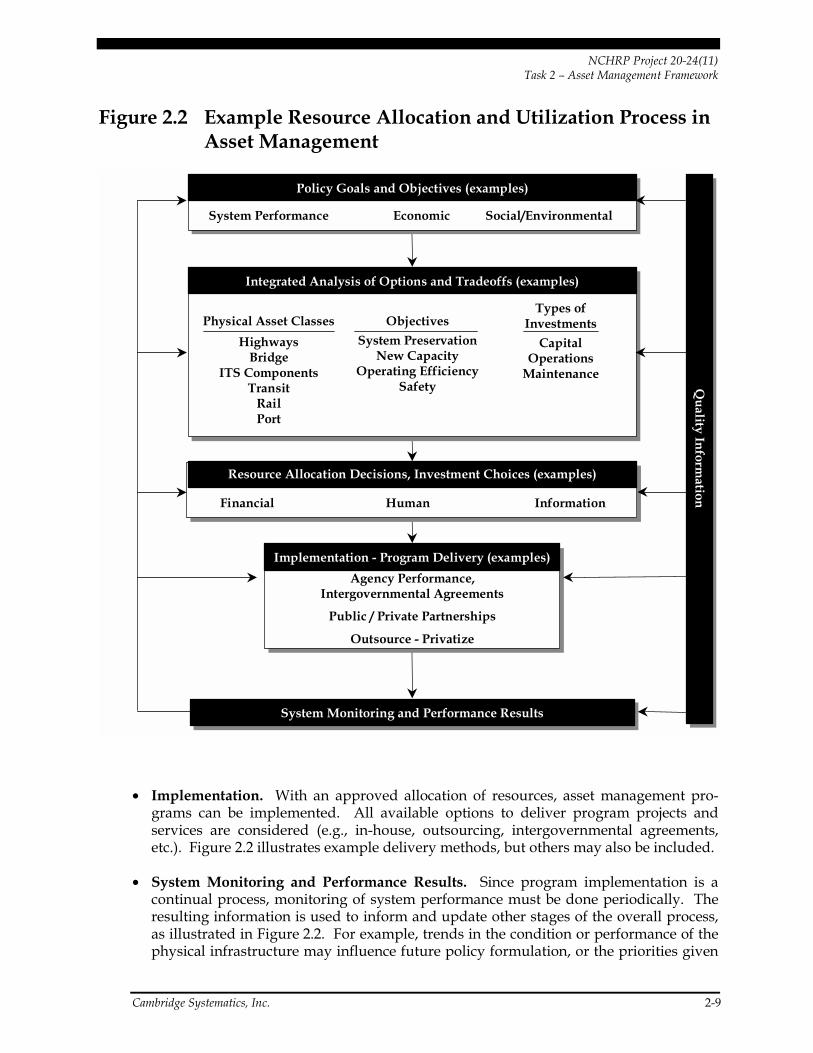
Figure 2.2 illustrates a strategic, integrated, systematic, and interdisciplinary approach to asset management for physical transportation infrastructure. The approach is again cast as a resource allocation and utilization process as in Figure 2.1, but more detailed infor-mation for this particular type of asset has been provided at each stage of the process. The entries in Figure 2.2 are examples, defined broadly and comprehensively to provide a �benchmark� as to how the process could work in a general case. Agencies may tailor and adjust this benchmark example to their specific situations and perspectives on asset man-agement, as discussed later in this section. Note that the blocks in Figure 2.2 are general stages in the process; each block may comprise a number of individual processes and spe-cific procedures, involving several organizational units, and the sequence in which they are performed may be more complicated than that implied in Figure 2.2. With this quali-fication, a discussion of each stage in the example follows.
• Policy Goals and Objectives. The process is driven by stated policy goals and objec-tives. �Goals� are general statements that define priority areas. �Objectives� are actual quantifiable targets that can be used when analyzing alternatives and performing tradeoffs. For example, if enhanced safety is a goal, decreasing accidents by 10 percent over the next two years may be an objective to support that goal.
• Integrated Analysis of Options and Tradeoffs. Several processes and procedures associated with an agency�s planning and programming functions may be conducted at this stage. Among these are the following, as examples: to identify problems and needs within the context of policy objectives, assess available resources and set realistic targets, explore alternatives to address problems and needs within financial con-straints, develop information on the technical characteristics, costs, and impacts of pro-posed approaches, define candidate projects or service levels, analyze their benefits, costs and other impacts, rank or prioritize candidates, and evaluate tradeoffs. These analyses are performed with a wide vision of available alternatives and potential tradeoffs in investment across, for example, modes, classes of physical infrastructure assets, and types of investments (e.g., capital improvements, operations, and mainte-nance). Figure 2.2 suggests a range of asset classes, policy objectives, and types of investments as examples. Agencies may tailor these elements to their specific vision of transportation asset management, as discussed shortly.
• Decisions on Applying Resources, Investment Choices. Based upon the analyses above, decisions can be made on recommended capital projects and levels of service for maintenance and operations (M&O) activities. Program approval finalizes these allo-cations of resources. Financial, human, and information resources are shown as exam-ples in Figure 2.2; other resources (e.g., real estate, equipment and materials) are also included as appropriate.
NCHRP Project 20-24(11) Task 2 � Asset Management Framework
Cambridge Systematics, Inc. 2-9
Figure 2.2 Example Resource Allocation and Utilization Process in Asset Management
Integrated Analysis of Options and Tradeoffs (examples)
Financial
Implementation - Program Delivery (examples)Agency Performance,
Intergovernmental Agreements
Public / Private Partnerships
Outsource - Privatize
System Monitoring and Performance Results
Policy Goals and Objectives (examples)
System Performance Economic Social/Environmental
Physical Asset ClassesHighways
BridgeITS Components
TransitRailPort
Types ofInvestments
CapitalOperations
Maintenance
ObjectivesSystem Preservation
New CapacityOperating Efficiency
Safety
Resource Allocation Decisions, Investment Choices (examples)
Quality Inform
ationHuman Information
• Implementation. With an approved allocation of resources, asset management pro-grams can be implemented. All available options to deliver program projects and services are considered (e.g., in-house, outsourcing, intergovernmental agreements, etc.). Figure 2.2 illustrates example delivery methods, but others may also be included.
• System Monitoring and Performance Results. Since program implementation is a continual process, monitoring of system performance must be done periodically. The resulting information is used to inform and update other stages of the overall process, as illustrated in Figure 2.2. For example, trends in the condition or performance of the physical infrastructure may influence future policy formulation, or the priorities given

NCHRP Project 20-24(11) Task 2 � Asset Management Framework
2-10 Cambridge Systematics, Inc.
to particular programs, projects, or services in resource allocation. Observed impacts of work zones may influence future decisions on methods and timing of program delivery.
• Quality Information. Systems of physical transportation infrastructure are extensive, and the information to describe their inventory, condition, characteristics, performance, costs, and impacts is voluminous. Developing, maintaining, and updating the man-agement systems and data that are needed to describe the asset classes and to support the functions and decisions illustrated in Figure 2.2 is a continuing task. Ensuring that quality information can be provided to all organizational levels in a timely, accurate, and meaningful way to assist them in fulfilling their asset management responsibilities is likewise important to the process.
In expressing resource allocation and utilization in a strategic, integrated, and systematic way, Figure 2.2 suggests a number of �best practices� that build on the discussion of Figure 2.1:
• The approach is policy-driven. Applicable policies include those embodying system performance goals, and broader policies with important transportation implications, such as those specifying economic development or social or environmental initiatives. Other elements of resource allocation � e.g., planning criteria, prioritization factors, system performance measures � are consistent with these policy goals.
• The analysis of options and tradeoffs is strategic, interdisciplinary, and integrated. It encompasses a number of modes and their associated infrastructure, rather than focusing on individual classes of assets. Policy goals and objectives are explicitly con-sidered in identifying modal, programming, or technological options to meet transportation needs. Tradeoffs among modes, programs, and technologies are con-ducted to seek the best performance at the lowest life-cycle cost. Quality information is applied throughout these processes.
• Programs, projects, and services are delivered in the most effective way available. Options for delivery are continually evaluated in terms of the agency�s own labor, financial, and information resources, and those of other providers in the public or pri-vate sectors.
• Decisions at each step are based upon quality information. The various steps in Figure 2.2 � policy formulation, establishment of goals and targets, and program plan-ning, development, and delivery � are based upon current, complete, and accurate information on system condition, performance, and forecasted trends. Management systems and supplementary analytic tools (e.g., for benefit-cost analyses or tradeoff analyses) are applied to these decisions, not as �black-box� solutions, but rather as aids to managers and executives in diagnosing problems and identifying the most effective projects and services. Value is placed on the capabilities and resources to provide this quality information.
• The information base for asset management is continually renewed, with feedback for updates and improvement. Working upward from the bottom in Figure 2.2 to consider the several feedback loops shown:

NCHRP Project 20-24(11) Task 2 � Asset Management Framework
Cambridge Systematics, Inc. 2-11
− Program delivery monitoring documents whether projects and services have been delivered on time and budget, and identifies causes of problems that may require remedy;
− System performance monitoring quantifies the results of past investment decisions, establishes baselines for future decisions, and identifies updates needed in project selection criteria;
− System and customer surveys update information on current asset inventory, con-dition, and performance, and the cost and effectiveness of project treatments and service delivery methods for use in future analyses; and
− Performance trends and comparisons to targets provide information on the status of program accomplishments, needed adjustments (either in areas of program emphasis, or in the target goals and objectives), and a basis for future policy formulation.
The decisions, activities, and flows of information represented in Figure 2.2 encompass the complete life-cycle of a physical infrastructure asset: initial construction, maintenance, operation, rehabilitation, expansion, and reconstruction, replacement or abandonment. How agencies deal with these issues is a function of their approach to long-term infrastructure management and stewardship, their revenue stream and resource allocation priorities, and associated policy goals and objectives. The approaches used by an agency may differ by asset class. While physical infrastructure assets nominally have finite lives, agencies have options in managing the life-cycles of these assets.
With proper preservation and maintenance, the overall system of assets can take on essentially an indefinite physical life. While specific asset classes or their components are subject to deterioration and wear, actions such as preventive and corrective maintenance, rehabilitation, and replacement of damaged items can counteract these trends to keep the overall system of assets available for continuous use, typically years beyond the nominal lives of the individual assets or their components. Most transportation infrastructure assets are managed in this way, but with strategies and specific criteria determined indi-vidually by each agency. Agencies must each decide the most economical and financially and politically acceptable strategy for preserving and maintaining transportation infra-structure while meeting competing needs. In some cases, such as that where an asset is technologically obsolete (e.g., replacement parts no longer available, or materials of con-struction are no longer suitable), or where excessive deterioration is technically or eco-nomically infeasible to repair, a strategy of disposal and replacement may be considered. These decisions can be addressed through the processes represented in Figure 2.2.
Beyond their structural condition, however, assets may be judged to have finite lives for other reasons:
• An asset is no longer needed. Loss of demand may be due to changes in population or demographic characteristics or in local economic conditions, or shifts to competing transportation services, for example.

NCHRP Project 20-24(11) Task 2 � Asset Management Framework
2-12 Cambridge Systematics, Inc.
• An asset no longer can provide the level of service that is needed now or in the future.
• An asset no longer provides a level of service that is consistent with an agency�s physi-cal infrastructure networks or its approach to transportation system stewardship.
These are causes of economic or administrative obsolescence. They may be addressed in several ways: e.g., by upgrading or replacing existing assets if warranted; by abandoning or removing existing assets that are no longer used; or by transferring assets to another agency. These options can likewise be analyzed in a technical, economic, financial, public impact, and administrative dimension in the processes illustrated in Figure 2.2.
Customizing the Asset Management Framework
Decisions at each step in Figure 2.2 are addressed in different ways, depending upon DOT organizational roles and responsibilities and its institutional relationships with other transportation agencies and its legislative and executive governing bodies. Since resource allocation and program approval procedures differ among state DOTs, the discussions below represent a composite simplification of state transportation agency practice. They nonetheless add a useful additional dimension to the asset management framework, and highlight another area in which DOT application of asset management principles are customized.
Policy Guidance by Governing Bodies of Agencies
Policy decisions that are shown at the top of Figure 2.2 are generally made by executive and legislative governing bodies of state DOTs, and communicated to the DOT as policy guidance for implementation. Governing bodies in this context at the state level include the governor and designated task forces, transportation commissions, and boards; the state legislature and legislative committees; and other bodies having political, administra-tive, fiscal, or regulatory oversight of a state DOT. DOTs ideally will engage with their governing bodies to inform this policy-making process wherever possible, and to provide information that supports good asset management practice: e.g., in advising on targets for future system performance. Policy goals and objectives are embodied in statute, regula-tion, or policy directives; collectively, they define the boundaries and overall priorities for an agency�s implementation of asset management.
Political guidance and institutional relationships also influence the analysis of investment options and tradeoffs shown in the second block in Figure 2.2.
• Decisions on modal initiatives, funding, and priorities are shaped by relationships among federal, state, and local agencies, as well as with local and regional (interstate) transit, port, and airport authorities. While situations differ across the country, in gen-eral these decisions are made at a high level through legislative or executive (e.g., transportation commission) adoption of long-range plans, program and budget approvals, and DOT allocations of funding targets across modes prior to more specific planning and programming decisions.

NCHRP Project 20-24(11) Task 2 � Asset Management Framework
Cambridge Systematics, Inc. 2-13
• Legislative and executive priorities may also be expressed through policy guidance and funding decisions affecting specific asset classes, program goals, or types of program investments such as those shown in Figure 2.2.
Policy decisions of this type guide the implementation of transportation asset manage-ment by each agency and determine the latitude of its decisions across classes of assets, modes, and programs. In this sense, the approach to asset management will therefore be unique to each state, and the framework developed in this section and next must adhere to the concept that �one size does not fit all.� Moreover, since policy guidance in effect casts certain decisions as given, it therefore removes them from the discretion of the DOT. For example, to the degree that certain programs or modes or investment categories are given statutory or funding priority, these areas of policy emphasis become a fixed part of an agency�s asset management approach, and further decisions by the DOT must accommo-date these policies.
One Size of Asset Management Does Not Fit All
One implication of this fact is that the benchmark process illustrated in Figure 2.2 is important not because it represents a single, rigid, ideal model at which all agencies will strive to converge, but rather because the principles that it represents can be applied flexi-bly to respond to different sets of policy goals and objectives. By interpreting Figure 2.2 in this way, a framework can be established that lends rigor to the concept of transportation asset management, but nevertheless enables agencies of widely varying characteristics, situations, and capabilities to apply this framework successfully and effectively.
A second implication is that DOTs can tailor their actions to accommodate even very extensive and demanding policy determinations, yet still conform to the principles of good asset management. For example, assume that an agency is faced with a number of established policies determining the priorities, funding, and target objectives to be set for specific modes and programs. Superficially, these determinations might appear to impede the integrated resource allocation process envisioned in Figure 2.2. However, a DOT could address these policies in the context of good asset management by a combination of actions such as the following:
• Implement the stated policies while applying the principles of good asset management cited earlier in the context of stated policies: e.g., consider alternative solutions that respond to the policy goals, maintain high-quality information in decisions and com-munications, apply the most effective mechanisms of program delivery, and provide feedback on system performance;
• Ensure the wise use of resources in fulfilling stated policy goals and objectives through quality assurance, staff training, performance auditing, and customer surveys; and
• Compare data on actual system performance with intended targets, analyze reasons for differences and likely trends, and identify potential shifts in policy direction for discus-sion with governing bodies.
NCHRP Project 20-24(11) Task 2 � Asset Management Framework
2-14 Cambridge Systematics, Inc.
Transportation Agency Processes
The remaining activities in Figure 2.2 are conducted as part of the agency�s planning, pro-gramming, program delivery, and system monitoring processes. Each step in Figure 2.2 entails procedures and decisions involving central office and district/regional staffs. The principles of good asset management cited earlier can be applied to each of these steps to identify potential improvements in procedure and use of information.
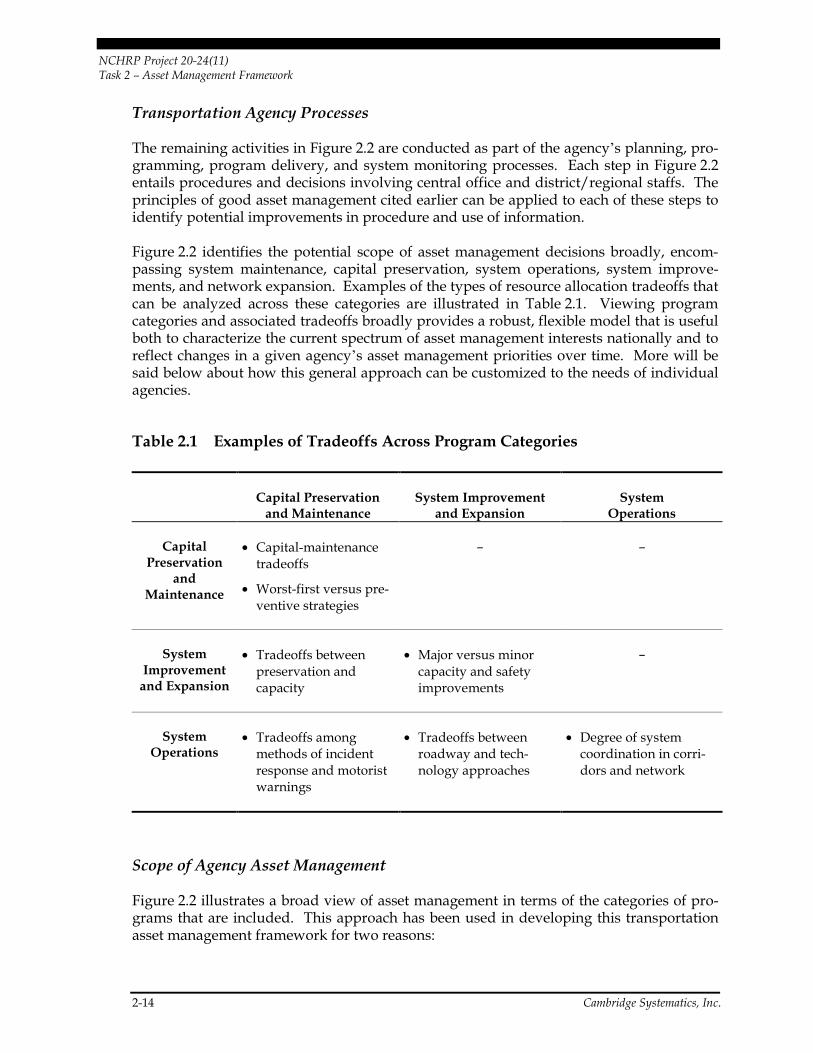
Figure 2.2 identifies the potential scope of asset management decisions broadly, encom-passing system maintenance, capital preservation, system operations, system improve-ments, and network expansion. Examples of the types of resource allocation tradeoffs that can be analyzed across these categories are illustrated in Table 2.1. Viewing program categories and associated tradeoffs broadly provides a robust, flexible model that is useful both to characterize the current spectrum of asset management interests nationally and to reflect changes in a given agency�s asset management priorities over time. More will be said below about how this general approach can be customized to the needs of individual agencies.
Table 2.1 Examples of Tradeoffs Across Program Categories
Capital Preservation and Maintenance
System Improvement and Expansion
System Operations
Capital Preservation
and Maintenance
• Capital-maintenance tradeoffs
• Worst-first versus pre-ventive strategies
� �
System Improvement
and Expansion
• Tradeoffs between preservation and capacity
• Major versus minor capacity and safety improvements
�
System Operations
• Tradeoffs among methods of incident response and motorist warnings
• Tradeoffs between roadway and tech-nology approaches
• Degree of system coordination in corri-dors and network
Scope of Agency Asset Management
Figure 2.2 illustrates a broad view of asset management in terms of the categories of pro-grams that are included. This approach has been used in developing this transportation asset management framework for two reasons:

NCHRP Project 20-24(11) Task 2 � Asset Management Framework
Cambridge Systematics, Inc. 2-15
1. Agencies across the country have different asset management needs and priorities. For example, DOTs managing mature systems, faced with limited budgets, or steeped in a philosophy of �preservation first� may favor their capital preservation and main-tenance programs as their focus of asset management. Other departments, confronted with pressures of population growth, demographic shifts, or economic development needs, may consider system improvement, expansion, and intelligent transportation system (ITS) programs as explicit and vital components of their asset management approach. The general model illustrated in Figure 2.2 allows for this flexibility with the understanding that agencies are not required to address all program categories or potential tradeoffs as part of their asset management implementation.
2. Asset management within an agency may evolve over time, and a general model pro-vides a roadmap guiding continual development. One reason for an evolutionary approach may be changing transportation needs: e.g., growing congestion that may force a broadening of a preservation-oriented approach to include system improve-ments and system operations. A second may be a staged approach to asset manage-ment implementation to focus on the most critical needs first and to mitigate budget impacts and disruptions to existing business processes and organizational unit responsibilities. A third may result from advances in technology (e.g., ITS) and the resulting need to redirect or broaden the focus to new asset management activities.
The framework developed in this report therefore does not presume any particular scope of asset management implementation or its timing. Rather, a general approach is pre-sented in terms of a comprehensive model and a set of accompanying principles of good practice, which will be presented in the next section. An agency may choose the particular scope most appropriate at a given time, in terms of program categories, asset classes, type of investments, and resources to be managed, as well as the staging and timing of imple-mentation. To reiterate a point made earlier: the examples of asset classes, goals and objectives, types of investments, allocated resources, and program delivery mechanisms are illustrative; agencies must define these elements of asset management within their specific situations.
It should also be noted that agencies differ on the level of organizational management and decision-making that they consider within an asset management arena (i.e., activities of a strategic nature). For example, an agency may include long-range planning, program development, tradeoff analyses, and budget approval as properly within an asset man-agement context (essentially, the upper blocks of Figure 2.2), but regard program delivery and system monitoring as involving strictly operational decisions and not part of their asset management effort. Other agencies may regard most or all of the functions illus-trated in Figure 2.2 as within their asset management sphere. Again, the purpose of this report is to accommodate these differing views, and to provide useful guidance in each case.

NCHRP Project 20-24(11) Task 2 � Asset Management Framework
2-16 Cambridge Systematics, Inc.
��������2.3 A Way of Doing Business
Asset management aims to strengthen an agency�s �way of doing business� regarding the management of its infrastructure. Appropriate business processes, reinforced by effective management systems and analytic tools, are a part of making asset management work, as discussed earlier. Other capabilities that are critical to this �way of doing business� include strong executive leadership and example, and organizational roles and responsi-bilities that are aligned with the business processes needed.
An illustration recapping the ways in which asset management can affect an agency�s processes and organizational relationships is shown schematically in Figure 2.3. Vertical elements in the center of Figure 2.3 typify core competencies within an organization. For simplicity, only four such groupings of expertise are shown, corresponding to infrastruc-ture management, operations management, financial management, and safety and other areas of management. Each of these encompasses several disciplines, and potentially cuts across several transportation modes.
Asset management seeks to strengthen organizational responsibilities, procedures, and decisions across these core competencies. At a tactical level, these improvements include procedures, techniques, skills, and analytic tools that increase the effectiveness of program delivery, as shown at the bottom of Figure 2.3. At executive levels of the organization the focus is on the availability of appropriate information for decision-making and for com-municating to governing bodies, customers, and other stakeholders, as shown at the top of Figure 2.3. Achieving a department-wide understanding of asset management and ena-bling the interdisciplinary approaches needed requires effective communication vertically within core competencies and to executive levels, and managed business processes across the department�s organizational units and disciplines, as also depicted in Figure 2.3. Col-lectively, this set of capabilities enables the agency to establish and sustain its approach to asset management in a practical and meaningful way.

NCHRP Project 20-24(11) Task 2 � Asset Management Framework
Cambridge Systematics, Inc. 2-17
Figure 2.3 Asset Management Organizational Coordination and Information Flows
Strategic Information forExecutives, Legislators, Stakeholders
Tactical Information for Effective Program Delivery(e.g., benefit/cost models, predictions of performance
and outcomes, etc.)
Man
agem
ent
Man
agem
ent
Managed Business Processes
Effe
ctiv
e V
ertic
al C
omm
unic
atio
n
Man
agem
ent
Man
agem
ent
Infr
astr
uctu
re
Ope
ratio
nal
Fina
ncia
l
Safe
ty, O
ther

NCHRP Project 20-24(11) Task 2 � Asset Management Framework
Cambridge Systematics, Inc. 3-1
3.0 Framework Construction
This is the second of two sections on development of the transportation asset management framework. Section 2.0 established the definition, principles of good practice, and ways to interpret the scope of transportation asset management in the context of a resource alloca-tion process. In this section these ideas are put in a more structured form, similar to that employed in management self-evaluation methods. As with the concepts explained in Section 2.0, the resulting framework expresses the key characteristics and criteria of asset management with rigor, but in a way that can be applied flexibly to agencies of different characteristics and with different priorities. This framework will form the analytic basis for the Transportation Asset Management Guide to be developed in Phase II of this study.
��������3.1 Methods to Describe and Rate Management Processes
Objectives of Review
An asset management framework enables an agency to 1) assess where it stands today regarding asset management practice, 2) establish targets for future attainment, and 3) chart progress toward those targets. The framework should be rigorous enough to pro-vide useful information to an agency for self-evaluation and for identifying useful direc-tions for improvement, but it should also be flexible enough to apply to the diverse organizational structures and cultures, funding mechanisms, and technological capabili-ties that characterize DOTs across the country today. While the number of factors to be accounted for in viewing asset management in this way is substantial, techniques are available to treat complicated problems like this one within an organized and practical management framework.
Several approaches are available to structure a complex set of organizational, functional, and performance-related characteristics, such as those that typify good asset management, within simple and comprehensible methods of evaluation. The objectives in reviewing existing approaches are not to select one particular method, but rather to suggest ideas on how to structure an asset management framework; to understand concepts and criteria that are important to reflect in a management approach; and to identify the types of measures recommended to gauge the level of attainment within each criterion. Three management evaluation approaches are included in this review:

NCHRP Project 20-24(11) Task 2 � Asset Management Framework
3-2 Cambridge Systematics, Inc.
• Malcolm Baldrige National Quality Award Criteria for Performance Excellence (Baldrige Criteria)(3);
• Carnegie Mellon University�s Capability Maturity Model for Software (SW-CMM)(4); and
• Kaplan and Norton�s Balanced Scorecard (BSC).(5)
Certain state DOTs have already studied or applied the Baldrige Criteria or the BSC approach as part of their management renewal or quality improvement initiatives. The following review may therefore help to relate an asset management approach to other self-improvement techniques with which these agencies are already familiar.
Example #1: Baldrige Criteria � A Comprehensive Framework
Overview � Core Values and Concepts
The Baldrige Criteria are embodied within the Malcolm Baldrige National Quality Award Program, which is managed by the U.S. Department of Commerce, National Institute of Standards and Technology. Each year the quality award is granted based on an evalua-tion of how well award applicants adhere to a comprehensive set of evaluation criteria, referred to as the Core Values and Concepts of the program. The Core Values and Concepts for business organizations include the following:
• Visionary Leadership � An organization�s senior leaders need to set direction while creating a customer focus, maintaining clear and visible values, and generating high expectations.
• Customer-Driven � An organization should take into account all aspects that contrib-ute value to its customers and lead to customer satisfaction, preference, referral and loyalty.
• Organizational and Personal Learning � An organization should make continual improvements to its existing approaches and processes and adapt to change.
• Valuing Employees and Partners � An organization should commit to employees� satisfaction, development, and well-being, and should build internal and external part-nerships to better accomplish its overall goals.
• Agility � An organization should crate a capacity for rapid change and flexibility, such as by improving its product-generation cycle time.
• Focus on the Future � In its strategic planning, an organization should anticipate factors such as customer expectations, new opportunities, and technological developments.

NCHRP Project 20-24(11) Task 2 � Asset Management Framework
Cambridge Systematics, Inc. 3-3
• Managing for Innovation � An organization should make meaningful changes to improve its products, services and processes, and make innovation part of the corpo-rate culture and daily work routines.
• Management by Fact � An organization should make decisions based on measurement and analysis of its performance, using a carefully selected set of performance measures.
• Public Responsibility and Citizenship � An organization�s leadership should stress its responsibilities to the public, and should practice good citizenship.
• Focus and Results and Creating Value � An organization�s strategy should explicitly include all stakeholder requirements, and its performance measurements should focus on key results.
• Systems Perspective � An organization�s leaders should synthesize and align the organization�s goals so that they can manage their entire enterprise, as well as its com-ponents, to achieve performance improvement.
Descriptions of Baldrige Criteria
The Criteria for Performance Excellence, or Baldrige Criteria, are used to evaluate how well applicants support the Core Values and Concepts. The criteria include 19 items, organized within seven categories as described below (paraphrased from the Baldrige Criteria):
1. Leadership � The items in this category measure how an organization�s leaders address values and performance expectation, as well as customer focus, and other aspects of leadership.
1.1 Organizational Leadership � The senior leadership of an organization should set direction, seek future opportunities, and use reviews of organizational performance to lead.
1.2 Public Responsibility and Citizenship � The organization should address the impacts on society of its products, services and operations, anticipate public concerns with its products and services, ensure that it engages in ethical business practices, and support key communities.
2. Strategic Planning � The items in this category describe an organization�s strategy development process, from development to deployment and tracking of strategic plans.
2.1 Strategy Development � The organization should follow a strategic planning process that considers customer and market needs, the competitive environment, and risks, as well as human resource, operational and supplier/partner capabilities and needs.
2.2 Strategy Deployment � The organization should form an action plan for achieving its strategic plan, track the progress of the plan, and communicate the plan within the organization.

NCHRP Project 20-24(11) Task 2 � Asset Management Framework
3-4 Cambridge Systematics, Inc.
3. Customer and Market Focus � This category examines how an organization deter-mines requirements and expectations of customers and markets.
3.1 Customer and Market Knowledge � An organization should determine its target customer market, listen and learn its key requirements, determine product and service features for meeting its customer requirements, and ensure that it continues to listen to and learn from its customers.
3.2 Customer Satisfaction and Relationships � An organization should measure cus-tomer satisfaction in a manner consistent with its business needs and directions, build customer relationships, and follow a complaint management process that ensure effective and prompt resolution of customer complaints.
4. Information and Analysis � This category examines how an organization measures and analyzes its performance.
4.1 Measurement of Organizational Performance � An organization should measure its performance using a carefully selected set of measures and indicators that is consistent with business needs and directions.
4.2 Analysis of Organizational Performance � An organization should conduct analyze its organizational performance, and use those results to support decision-making and daily operations.
5. Human Resource Focus � The items in this category measure how an organization builds and maintains a work environment that support employees� performance excellence and growth.
5.1 Work Systems � An organization�s work and job design, compensation, career pro-gression, and related work force practices should enable its employees to achieve high performance.
5.2 Employee Education, Training and Development � An organization�s education and training support should contribute to achievement of its business objectives, and should help build employee knowledge, skills and capabilities.
5.3 Employee Well-Being and Satisfaction � The organization�s work environment should contribute to employees� well-being, satisfaction and motivation.
6. Process Management � This category characterizes an organization�s key processes.
6.1 Product and Service Processes � The organization�s processes related to product/ service design and production/delivery should incorporate changing customer and market requirements, satisfy key performance requirements.
6.2 Support Processes � The organization�s support processes should satisfy key customer and performance requirements.

NCHRP Project 20-24(11) Task 2 � Asset Management Framework
Cambridge Systematics, Inc. 3-5
6.3 Supplier and Partnering Processes � The organization�s supplier and/or partner processes should incorporate performance requirements, and include incentives to help improve suppliers and partners improve performance and abilities.
7. Business Results � This category examines an organization�s performance and improvement in selected key areas.
7.1 Customer Focused Results � This item measures the organization�s performance in terms of customer satisfaction, customer loyalty, positive referral, customer-perceived value, relationship building and product and service performance.
7.2 Financial and Market Results � This item measures the organization�s performance in terms of financial return, economic value, market share/position, business growth, and entry to new markets.
7.3 Human Resource Results � This item measures the organization�s performance in terms of employee well-being, employee satisfaction, employee development, and work system performance and effectiveness.
7.4 Supplier and Partner Results � This item measures the organization�s performance in terms of supplier and partner performance, and supplier and partner cost improve-ments resulting from supplier and partner performance management.
7.5 Organizational Effectiveness Results � This item measures the organization�s per-formance in terms its key design, production, delivery and support process perform-ance, as well as in terms of its regulatory/legal compliance and citizenship.
Applicants submit written responses to questions addressing each item of the evaluation. Responses are reviewed and scored by a panel of judges. One important aspect of the criteria is that they are intended to be descriptive rather than prescriptive. That is, they are intended to gauge an organization�s level of excellence without specifying how an organi-zation should be structured or what specific tools or techniques should be used by the organization to try to achieve a level of excellence.
Commentary
The Core Values and Concepts listed above are analogous to the strategic characteristics and principles of good asset management that have been described in Section 2.0. The seven categories of rating criteria listed above can also be related to items that would be important in evaluating asset management.
A useful lesson of the Baldrige review is that the rating criteria support, but need not be coincident with, the Core Values and Concepts. Applying this suggestion to our study: the rating criteria to be used in the evaluation matrices should support and be consistent with the principles of good asset management, but need not be the principles themselves (as originally envisioned in the previously Quarterly Report). This suggestion was helpful in the construction of the matrices that will be described later.

NCHRP Project 20-24(11) Task 2 � Asset Management Framework
3-6 Cambridge Systematics, Inc.
Example #2: Capability Maturity Model for Software � A Targeted Framework
Overview
The SW-CMM is intended to measure the maturity of an organization�s software devel-opment process. The model is based on the premise that there is an evolutionary path in the sophistication and level of accomplishment within this process. This evolution pro-gresses from an initial stage, in which software is developed in an ad hoc fashion, to an optimizing stage characterized by an exceptional level of management. The SW-CMM includes the following five levels of maturity:
1. Initial;
2. Repeatable;
3. Defined;
4. Managed; and
5. Optimizing.
To determine what level an organization has achieved, one must assess a series of key process areas. The process areas are different at each level, and are intended to focus an organization on what processes to improve for achieving greater maturity. For instance, for achieving Level Two, processes must be established for basic project management, while for Level Three there is an emphasis on documenting an organization�s software processes.
Commentary
One difference between the SW-CMM and the Baldrige Criteria is in their respective scope. While the Baldrige Criteria view an organization broadly, the SW-CMM addresses a specific, albeit important, process within an organization. The SW-CMM makes no attempt to characterize the overall quality or level of excellence of organizations or their products. Therefore, the rating scheme does not provide a general framework for evalua-tion as would be needed in asset management. However, the rating approach does sug-gest the potentially useful concept of a minimum threshold of performance. If applied to asset management, the implication would be that while all agencies �manage assets� in some way, there might be a lower bound on performance below which they could be described as no longer practicing �asset management.�
The SW-CMM approach differs from the Baldrige Criteria in that it is intended to be pre-scriptive, specifying how an organization should evolve as it improves its software processes.
A third difference between the two approaches is that an organization can rate itself with SW-CMM, making its own determination of its level of adherence to the model�s princi-ples, in lieu of being evaluated remotely by judges, as is the case with Baldrige. This self-evaluation characteristic is clearly the preferred option for asset management.
NCHRP Project 20-24(11) Task 2 � Asset Management Framework
Cambridge Systematics, Inc. 3-7
Example #3: Balanced Scorecard � A �Balanced� Approach
Overview
The Balanced Scorecard (BSC) builds a general approach to measuring and managing an organization. It was developed by Robert Kaplan of the Harvard Business School and David Norton of Renaissance Solutions, Inc. To use the BSC approach, an organization should define objectives, measures, targets and initiatives from each of four perspectives:
1. Financial � This perspective includes measures of whether an organization�s strategy, implementation and execution are contributing to financial improvement, such as in terms of income, return-on-capital-employed, and economic value added.
2. Customer � This perspective includes measures of customer satisfaction, customer retention, new customer acquisition, customer profitability, and market share in tar-geted customer segments.
3. Internal Business Processes � Through this perspective an organization identifies and analyzes its key internal processes for meeting its goals, including those that have the greatest impact on customer satisfaction, and on achieving the organization�s financial objectives.
4. Learning and Growth � Through this perspective an organization identifies the infra-structure the organization must build to create long-term growth and improvement, including aspects of the organization relating to its employees, its information tech-nology and systems, and its organizational procedures.
The BSC approach retains financial measurement as the most important measure of busi-ness performance. However, its authors maintain that over-emphasizing short-term financial results leads to poor strategic decision-making. The BSC adds three additional perspectives to the traditional �scorecard� of financial measures, hence the term �balanced scorecard.� The approach assumes that good financial performance can be most effectively achieved by considering �leading indicators,� characterized by the Internal Business Processes and Learning and Growth perspectives, along with �lagging indicators,� repre-sented by the Financial and Customer perspectives.
The BSC does not specify what objectives or measures an organization should use for the four perspectives. However, the references describing the approach do include guidelines on how to set objectives and measures, as well as on how to use these to manage more effectively. Further, while the approach is clearly designed to be used by for-profit busi-nesses, the approach�s authors offer some limited advice on translating the approach for use with non-profit or government organizations.
Commentary
The BSC, unlike the Baldrige Criteria and SW-CMM, does not directly provide a rating or assessment of an organization. Rather, it provides a framework and set of tools to help

NCHRP Project 20-24(11) Task 2 � Asset Management Framework
3-8 Cambridge Systematics, Inc.
build such a mechanism. It is particularly useful to help organize a numerous set of measures and objectives into a coherent system for rating and assessment.
While the BSC includes four different and valuable perspectives concerning how to meas-ure and manage an organization, its assumption that long-term financial performance is the primary objective of an organization is not immediately well-suited for application to a public agency. In the authors� examples of applying the BSC approach to non-profit and government organizations, the approach is modified somewhat, with financial perform-ance becoming a constraint rather than the primary objective of the organization.
In a separate study, Cambridge Systematics applied the BSC approach, with some adap-tations, to assist a DOT in updating its management processes to generate greater cus-tomer satisfaction. In lieu of the four perspectives identified above, the following five were proposed as more suitable to DOT operations:
1. Customers;
2. Products and Services;
3. Human Resources;
4. Organization; and
5. Financial.
Critical Success Factors and Balanced Scorecard Measurements were then proposed for development in each of these areas.
��������3.2 Framework of Transportation Asset Management
Lessons of Existing Approaches
Each of the three management approaches reviewed above is instructive in developing an asset management rating framework. While the three approaches can provide guidance in shaping the asset management principles and rating criteria, their greater value lies in suggesting how to organize principles, rating criteria, and levels of attainment into a coherent framework. The lessons of this exercise that were most useful in conceiving a unified methodology for asset management are as follows:
• The asset management framework should be founded on a set of basic principles, similar in approach to the Core Values and Concepts of the Baldrige Criteria. The prin-ciples that were articulated in Section 2.0 serve this purpose.
• Specific rating criteria should be developed to support the key principles, but � as sug-gested by the Baldrige approach � need not be related to them one-to-one. These rating criteria need to be defined for transportation asset management.

NCHRP Project 20-24(11) Task 2 � Asset Management Framework
Cambridge Systematics, Inc. 3-9
• The BSC shows the value of incorporating several perspectives simultaneously within a management framework.
− While the BSC�s insight concerning leading (or enabling) and lagging indicators is distinctive, the particular perspectives that are identified above as suitable for busi-nesses are not necessarily relevant to public agencies or to transportation asset management.
− Rather, the idea of blending rigor and flexibility that is suggested in Section 2.0 may be the most appropriate analogy for application to public sector transportation. This approach would build a unified asset management framework that is applicable to agencies of different characteristics.
• Given a particular perspective, one can identify items that can be rated on a scale, in a fashion similar to that used in the SW-CMM. This can facilitate self-evaluation by an agency, identify stages or degrees of improvement, and provide flexibility in focusing the greatest degree of immediate improvement in those areas of highest priority.
Building the Asset Management Framework
Building a framework of transportation asset management involves translating the con-cepts and principles in Section 2.0 into a structured set of management characteristics and measurement criteria analogous to those outlined in the three established approaches above. Achieving this objective comprehensively yet practically took several trials to sharpen the focus on fundamental elements and the most important characteristics of asset management, and to devise the appropriate format and content of each measure-ment criterion.
The process that has resulted in the recommended framework is illustrated in Figure 3.1.
Key elements illustrated by Figure 3.1 are as follows:
• The principles describing the philosophy of asset management are at work throughout the management structure, and are reflected wherever appropriate in key characteris-tics and criteria of good asset management.
• The major processes affecting asset management are organized in three broad areas: policy goals and objectives, planning and programming, and program delivery.
− The breadth and generality of these major process areas enable the framework to apply to different business approaches and decision-making cultures that exist among transportation agencies.
− The process areas can be interpreted broadly. For example, policy goals and objec-tives can include consideration of institutional relationships between the transpor-tation agency and its governing executive and legislative bodies.
− Processes can involve multiple units and layers of an agency�s organization.

NCHRP Project 20-24(11) Task 2 � Asset Management Framework
3-10 Cambridge Systematics, Inc.
Figure 3.1 Development of the Asset Management Framework
Policy Goals and Objectives
Program Delivery
Programming
Asset ManagementPhilosophy
AssetManagement
Processes
Asset ManagementInformation and Tools
Prin
cipl
es
• Analytic capabilities and availability of quality information are assumed to be available throughout the asset management processes, contributing to an informed policy for-mulation, more effective planning and programming analyses and decisions, and sys-tem monitoring of delivered projects and services.
The approach in Figure 3.1, building upon the concepts and principles of Figure 2.2, has led to the organization of relevant management characteristics and evaluation criteria in four areas: one area each for the three process steps shown in Figure 3.1, and the fourth area addressing information and analysis as an important general capability supporting the other three. Collectively, these management characteristics and evaluation criteria reflect the principles and concepts of good asset management described in Section 2.0. These characteristics and criteria are structured in four matrices as described below.

NCHRP Project 20-24(11) Task 2 � Asset Management Framework
Cambridge Systematics, Inc. 3-11
Evaluation Matrices
The four transportation asset management matrices are described by the following statements:
• Policy Goals and Objectives � Does policy guidance encourage and provide incentives for good asset management?
• Information and Analysis � Do information resources effectively support asset man-agement policy and decisions?
• Planning and Programming � Do resource allocation decisions reflect good practice in asset management?
• Program Delivery � Appropriate oversight techniques and follow-through reflect industry good practice in asset management.
The information in each matrix has been organized in three columns:
• The first column identifies basic characteristics of good asset management practice applicable to U.S. transportation agencies. These have been kept to a small number in each matrix to focus on the most important.
• The second column lists specific criteria by which these characteristics can be evalu-ated. They identify the likely places to look in determining whether the policy guid-ance, management procedures, and decision culture that drive investment choices and program delivery conform to the characteristics of good asset management.
• The third column describes the current state-of-the-art of transportation asset manage-ment in each criterion. These ideal practices define benchmarks that agencies can aim toward in seeking to improve their current approach.

NCHRP Project 20-24(11) Task 2 � Asset Management Framework
3-12 Cambridge Systematics, Inc.
Table 3.1 Policy Goals and Objectives Does Policy Guidance Encourage Good Asset Management?
Characteristics Criteria Benchmark � State-of-the-Art
1. Policy goals and objectives reflect a holistic, long-term view of asset per-formance and cost.
Defined goals and objectives
Asset Management is a key catalyst for deci-sion and action
Life-cycle perspective
Goals and objectives are comprehensive, integrated with other statewide policy objectives, and sup-ported by quantitative and measurable performance measures or criteria.
Principles of good asset management are articulated in an agency business plan and clearly recognized throughout the agency as the driving force for resource allocation and utilization.
Goals and objectives embody the perspective of life-cycle economic analyses of asset performance and cost, and encourage strategies with long-term benefits.
2. Goals and objec-tives embody the public interest in good stewardship of transportation assets.
Recognition of asset condition, perform-ance, and public acceptance in policy formulation
Public reporting and accountability
This recognition entails the following characteristics:
• Policy goals and objectives encourage a business-model, customer-oriented approach to asset management.
• Reliable information on asset condition and public perceptions thereof is accounted for in updating policy objectives.
Reported system performance is measured against policy goals and objectives.
3. Policy formulation allows the agency latitude in arriving at performance-driven decisions on resource allocation.
Political process
Agency decision-making
Political decisions on resource allocation among modes or programs are strongly influenced by objective information on expected performance.
The agency makes resource allocation decisions among programs and across geographic regions/ districts based on expected performance rather than by historical splits or formulas that do not correlate with an objective indication of system condition.
4. The agency pro-actively helps to formulate effective asset management policy.
Engagement with policy-makers
Provision of information
The agency actively engages with political leaders and other policy-makers to define expectations of system performance, frame alternative approaches, and outline the consequences of decisions and courses of action relative to these expectations.
The agency�s asset management systems are designed and applied to yield meaningful informa-tion on policy choices and consequences.

NCHRP Project 20-24(11) Task 2 � Asset Management Framework
Cambridge Systematics, Inc. 3-13
Table 3.2 Planning and Programming Do Resource Allocation Decisions Reflect Good Practice in Asset Management?
Characteristics Criteria Benchmark � State-of-the-Art
1. Planning and programming pro-cedures and criteria are consistent and reinforce policy goals and objectives.
Fiscally responsible planning
Program prioritization
Updates and revisions
Development of statewide and urban area long-range plans can be demonstrated to be consistent with policy goals and objectives and with realistic projections of future revenue.
Funding allocation and project prioritization criteria are consistent with and support the state�s and the agency�s policy goals and objectives.
Updates and revisions to the planning and program development process are performed regularly to reflect changes affecting asset management priori-ties in the arenas of:
• Policy (e.g., preserving existing investments, economic development),
• Technology (e.g., new design procedures or materials), or
• Emerging issues (e.g., updated environmental regulations; identification of potentially cata-strophic risks to asset condition or performance).
2. Planning and program develop-ment consider a range of alterna-tives in addressing system deficiencies.
Planning alternatives
Project scope, cost, benefits, impact on performance
Long-range planning identifies and evaluates a range of program alternatives and, as appropriate, modal alternatives to meet present and future deficiencies.
Program development, guided by adopted plans, formulates projects of appropriate scope and devel-ops realistic estimates of their costs, benefits, and impacts on system performance.

NCHRP Project 20-24(11) Task 2 � Asset Management Framework
3-14 Cambridge Systematics, Inc.
Table 3.2 Planning and Programming Do Resource Allocation Decisions Reflect Good Practice in Asset Management? (continued)
Characteristics Criteria Benchmark � State-of-the-Art
3. Performance-based concepts guide planning, program develop-ment, and system monitoring.
Performance-based budgeting
Benchmark achievement
System monitoring
Reporting
Recommended programs and budgets are tied to performance budgeting concepts entailing:
Structuring of costs by activity; and
Relationship of costs to levels of service or perform-ance measures.
The planning and programming process indicates (or �defines�) the resources required to maintain existing assets at target performance levels and at least life-cycle cost.
Performance measures or levels of service are defined and regularly applied to quantify the impacts of program decisions and actions and to provide feedback for future planning and program priorities.
Progress toward stated programmatic system performance targets is measured and reported regularly.
4. Resource alloca-tions and program tradeoffs are based on relative merit and an under-standing of com-parative costs and consequences.
Program building
Consistency
Program tradeoffs
Communication
Organization of projects within programs (program building) results from statewide competition among projects based on objective criteria.
Projects being designed and built respond to, and are consistent with, overall policy guidance for system performance.
Tradeoffs between programs (e.g., Preservation ver-sus Improvement, or System Expansion versus Operations) are based upon analyses of life-cycle benefits and costs, rather than arbitrary formulas or historical splits
The implications of more or less resources allocated to each program are clearly communicated in terms of selected performance measures.

NCHRP Project 20-24(11) Task 2 � Asset Management Framework
Cambridge Systematics, Inc. 3-15
Table 3.3 Program Delivery Are Appropriate Oversight Techniques Reflecting Industry Good Practices Being Implemented?
Characteristics Criteria Benchmark � State-of-the-Art
1. The agency con-siders all available methods of pro-gram delivery.
Cost tracking
Options for delivery
The agency knows its costs for delivering its pro-grams and services (e.g., by activity, bid item, or resource class).
The agency periodically evaluates its options for delivering programs and services: e.g., agency employees, inter-governmental agreements, partnering, outsourcing, managed competition.
2. The agency tracks program outputs and outcomes.
Feedback mechanism
Change process
The agency has the ability to easily track actual proj??ect and service delivery against the program plan so that adjustments can be made.
A formal program change process exists to make needed adjustments in cost, schedule, and scope; document causes; and reallocate funds.
3. Reports on pro-gram delivery accomplishments are communicated and applied.
Internal
External
Department executives and program managers are regularly informed of progress; a well-understood mechanism exists to make needed adjustments.
Policy-makers and key stakeholders are kept informed of program status and adjustments.
4. The approved program is deliv-ered efficiently and effectively.
Delivery measures
Change management
Measures are defined and tracked to gauge success-ful program delivery in terms of schedule, cost, and scope.
The agency has a process to review and revise deliv-ery approaches if improvement is needed.
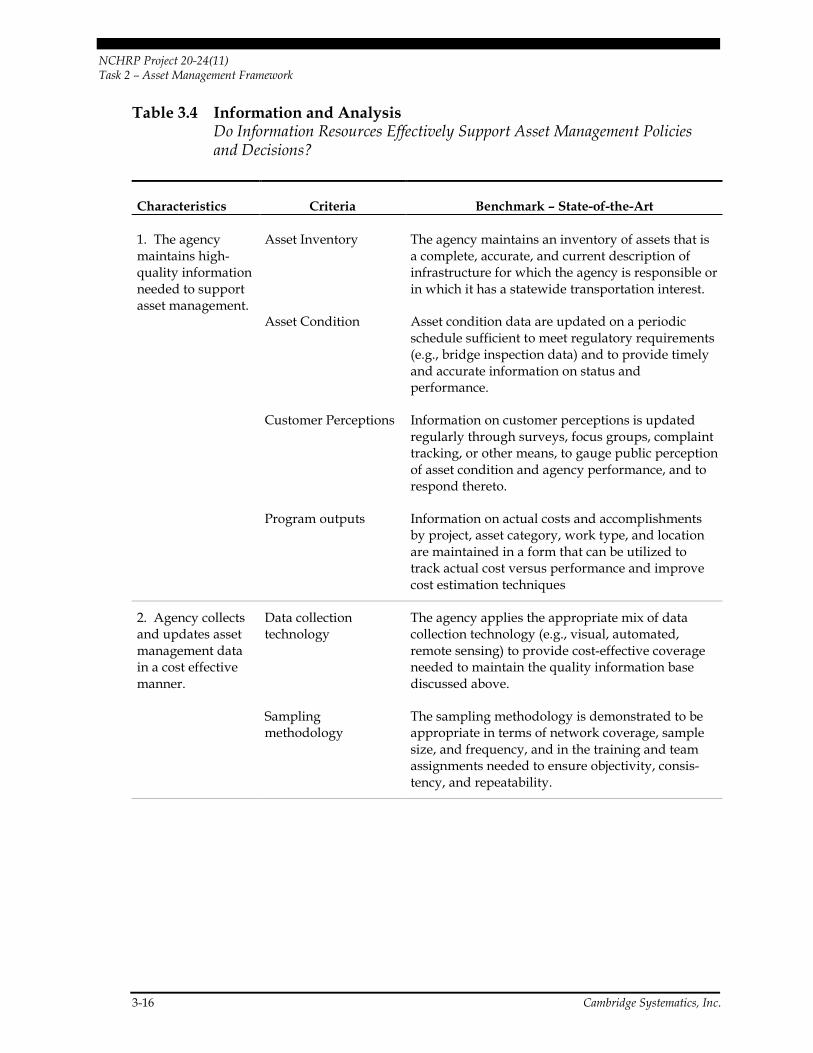
NCHRP Project 20-24(11) Task 2 � Asset Management Framework
3-16 Cambridge Systematics, Inc.
Table 3.4 Information and Analysis Do Information Resources Effectively Support Asset Management Policies and Decisions?
Characteristics Criteria Benchmark � State-of-the-Art
1. The agency maintains high-quality information needed to support asset management.
Asset Inventory
Asset Condition
Customer Perceptions
Program outputs
The agency maintains an inventory of assets that is a complete, accurate, and current description of infrastructure for which the agency is responsible or in which it has a statewide transportation interest.
Asset condition data are updated on a periodic schedule sufficient to meet regulatory requirements (e.g., bridge inspection data) and to provide timely and accurate information on status and performance.
Information on customer perceptions is updated regularly through surveys, focus groups, complaint tracking, or other means, to gauge public perception of asset condition and agency performance, and to respond thereto.
Information on actual costs and accomplishments by project, asset category, work type, and location are maintained in a form that can be utilized to track actual cost versus performance and improve cost estimation techniques
2. Agency collects and updates asset management data in a cost effective manner.
Data collection technology
Sampling methodology
The agency applies the appropriate mix of data collection technology (e.g., visual, automated, remote sensing) to provide cost-effective coverage needed to maintain the quality information base discussed above.
The sampling methodology is demonstrated to be appropriate in terms of network coverage, sample size, and frequency, and in the training and team assignments needed to ensure objectivity, consis-tency, and repeatability.
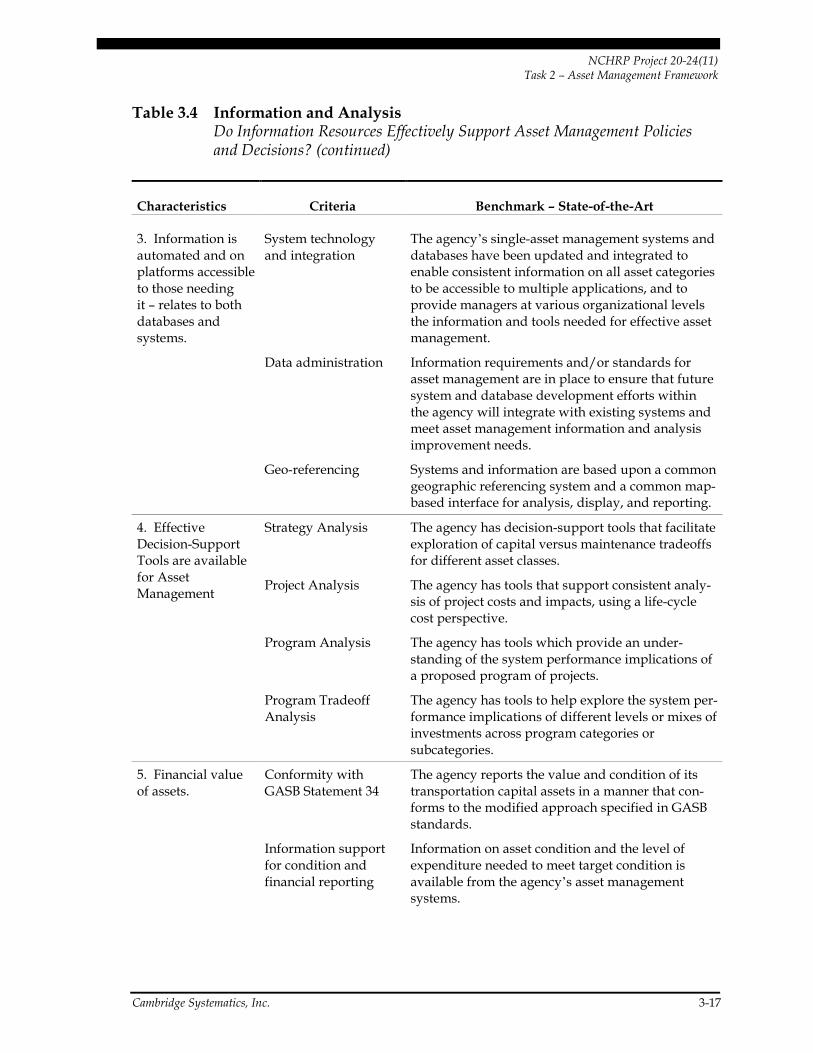
NCHRP Project 20-24(11) Task 2 � Asset Management Framework
Cambridge Systematics, Inc. 3-17
Table 3.4 Information and Analysis Do Information Resources Effectively Support Asset Management Policies and Decisions? (continued)
Characteristics Criteria Benchmark � State-of-the-Art
3. Information is automated and on platforms accessible to those needing it � relates to both databases and systems.
System technology and integration
Data administration
Geo-referencing
The agency�s single-asset management systems and databases have been updated and integrated to enable consistent information on all asset categories to be accessible to multiple applications, and to provide managers at various organizational levels the information and tools needed for effective asset management.
Information requirements and/or standards for asset management are in place to ensure that future system and database development efforts within the agency will integrate with existing systems and meet asset management information and analysis improvement needs.
Systems and information are based upon a common geographic referencing system and a common map-based interface for analysis, display, and reporting.
4. Effective Decision-Support Tools are available for Asset Management
Strategy Analysis
Project Analysis
Program Analysis
Program Tradeoff Analysis
The agency has decision-support tools that facilitate exploration of capital versus maintenance tradeoffs for different asset classes.
The agency has tools that support consistent analy-sis of project costs and impacts, using a life-cycle cost perspective.
The agency has tools which provide an under-standing of the system performance implications of a proposed program of projects.
The agency has tools to help explore the system per-formance implications of different levels or mixes of investments across program categories or subcategories.
5. Financial value of assets.
Conformity with GASB Statement 34
Information support for condition and financial reporting
The agency reports the value and condition of its transportation capital assets in a manner that con-forms to the modified approach specified in GASB standards.
Information on asset condition and the level of expenditure needed to meet target condition is available from the agency�s asset management systems.

NCHRP Project 20-24(11) Task 2 � Asset Management Framework
3-18 Cambridge Systematics, Inc.
��������3.3 Applications of the Framework to Specific Situations
Rationale
The generality of the matrices in Tables 3.1 through 3.4 is desirable for reasons similar to those cited for broad conceptual development in Section 2.0:
• By including a wide range of parameters defining idealized asset management practice, the matrices help DOTs to identify and prioritize those that are most critical to their unique situations.
• By expressing directions for improvement in general terms, the matrices can be adapted to DOTs of different organizational, institutional, management, technological, and financial characteristics.
• By adopting a comprehensive and fundamental view of asset management, the matri-ces continue to provide useful guidance as the characteristics and management priori-ties of DOTs evolve over time.
The matrices in Tables 3.1 through 3.4, combined with the definitions, concepts, and scope of asset management presented in Section 2.0, provide the general model or framework of transportation asset management that will serve as a foundation of the future Transportation Asset Management Guide.
The matrices are generic, and need to be customized to the unique characteristics of each agency. Just as an agency can tailor the scope of asset management to its particular con-cerns and priorities, so should it be able to prioritize among the spectrum of items in the matrices above to develop and act upon the implied management principles in more detail. In fact, based upon preliminary work by the study team in applying these asset management matrices to specific agencies, this process of �drilling down� from the matri-ces to closer consideration of business and decision processes is critical in the following ways:
• It focuses attention on specific actions and tasks that an agency should undertake, and provides a basis for estimating the time and level of effort required;
• It relates these actions and tasks to standard operating procedures and information with which agency managers and staff are already familiar;
• It mobilizes those groups throughout the organization that are responsible for the indi-cated actions and tasks; and
• It expresses the rather broad and sweeping statements in the matrices in more concrete terms, making asset management more comprehensible and credible to agency manag-ers and staff.
NCHRP Project 20-24(11) Task 2 � Asset Management Framework
Cambridge Systematics, Inc. 3-19
The matrices are thus a template that an agency can use to evaluate its current situation, identify targets areas for improvement, and chart progress over time. The matrices are a general blueprint; what are needed are, figuratively, working drawings and details. Illus-trating these for the many facets of asset management is one of the challenges in devel-oping the Transportation Asset Management Guide in Phase II. An example of how the guidance in the matrices can be applied to specific business and decision processes is given below.
Examples
Basic Improvements
Assume that an agency is focusing on one aspect of transportation asset management: e.g., the preservation of its highway infrastructure, focusing on pavement and bridge assets. Specific programs of interest are its capital rehabilitation and replacement pro-grams for pavements or bridges, and its pavement and bridge maintenance programs. For the time being, all relevant programs are considered, regardless of source of funding.
At a basic level, the matrices suggest a policy-driven, performance-based approach that uses performance measures and, for example, maintenance levels of service (LOS), as expressions of targets and measures of accomplishment observed in the field. If an agency has not yet implemented these concepts, then one level of asset management development is that illustrated in Figure 3.2. While Figure 3.2 represents a highly simplified schematic of the many interactions that take place among field-level, district-level, and central office staffs, it nevertheless suggests a number of key actions and developments:
• Specification and communication of target performance and levels of service;
• Explicit application of management systems to relate targets to needed expenditures;
• Implementation of business processes to use these targets and management system resources, together with professional judgment and input from stakeholders, to develop and implement programs that are consistent with targets and that meet fiscal and other resource constraints; and
• System performance monitoring to ensure that the results of program implementation are consistent with intended targets, and to identify any adjustments needed.
Each of these actions can be developed in more detail, with organizational assignments, coordination of actions among groups, trial implementation and adjustment, and final adoption. Items entailing costs or approvals need to be addressed. Communication with an agency�s governing body will engage a dialogue as to how the improvements can be best applied in program development and accountability, and what role the governing body itself can play to ensure most effective development and use of transportation asset management.

NCHRP Project 20-24(11) Task 2 � Asset Management Framework
3-20 Cambridge Systematics, Inc.
Figure 3.2 Example Basic Improvements to an Asset Management Process
Goals/Targets, Condition Data
Performance Measures,Compare with Targets
PMS or BMS
Develop andRecommend Projects
Develop and ImplementCapital Program
Survey Data, LOS Targets
MMS
Identify and ScheduleNeeded Maintenance
Pavement or BridgeMaintenance Program
Performance Measures,Compare with LOS Targets
More Advanced Improvements
As a second example, assume that an agency has attained the concepts and methods illus-trated in Figure 3.2, and looks to the matrices for guidance on developing its asset man-agement practice further. A more advanced stage of development that it can adopt as a goal is illustrated in Figure 3.3. Hallmarks of this more advanced process encompass the gains noted in Figure 3.2 and include the following additional advantages:
• A comprehensive set of goals and targets that apply simultaneously to multiple pro-grams. This development has technical as well as management implications: i.e., the goals must be meaningful in both a capital rehab/replacement and a maintenance context.
• An integrated system data platform in which it is possible to display and analyze mul-tiple program requirements. Many state DOTs are considering their geographic infor-mation system (GIS) as a logical and practical platform for this integration.
• Explicit consideration of tradeoffs. At least two types of tradeoffs are considered in Figure 3.3: capital-maintenance tradeoffs within each asset class (i.e., to determine the economically and technically optimal point at which routine maintenance is no longer feasible, and more substantial rehabilitation or replacement should be considered); and tradeoffs between asset classes (i.e., the pavement and the bridge programs).
• In general, the cooperation between all participating departments and the focus of all relevant programs on the outcome that is desired: namely, more cost-effective preser-vation of infrastructure.
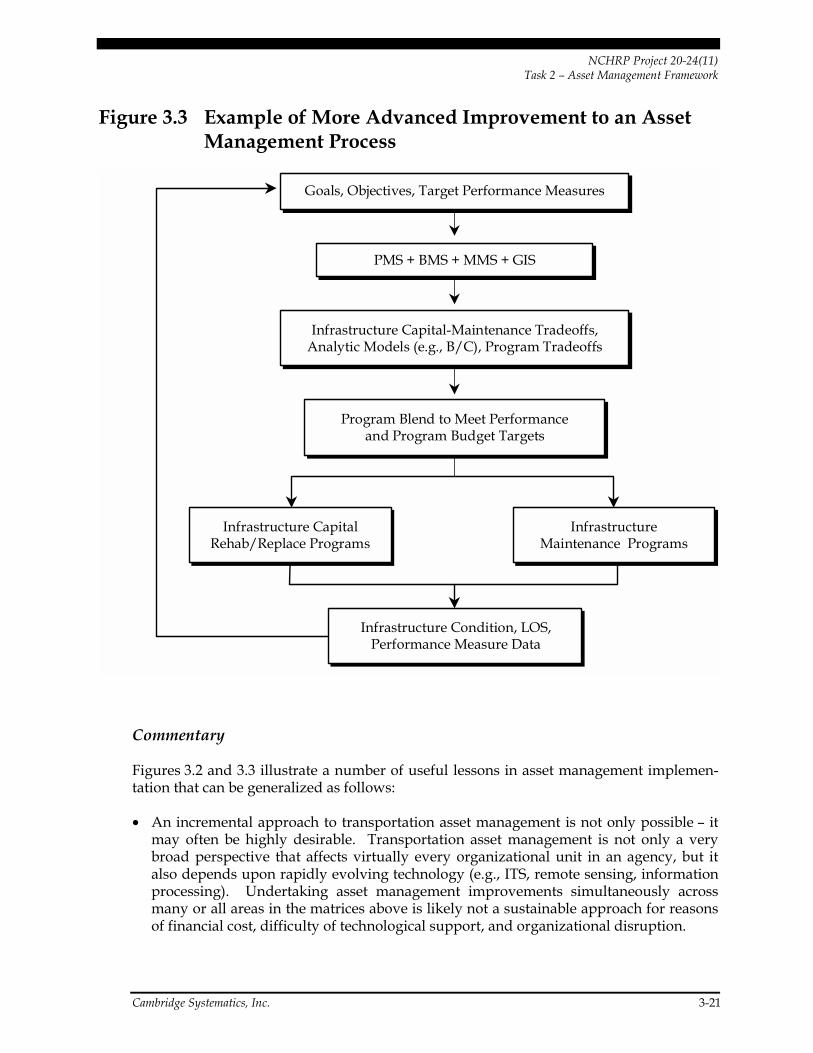
NCHRP Project 20-24(11) Task 2 � Asset Management Framework
Cambridge Systematics, Inc. 3-21
Figure 3.3 Example of More Advanced Improvement to an Asset Management Process
PMS + BMS + MMS + GIS
Infrastructure Capital-Maintenance Tradeoffs,Analytic Models (e.g., B/C), Program Tradeoffs
Program Blend to Meet Performanceand Program Budget Targets
Goals, Objectives, Target Performance Measures
Infrastructure CapitalRehab/Replace Programs
InfrastructureMaintenance Programs
Infrastructure Condition, LOS,Performance Measure Data
Commentary
Figures 3.2 and 3.3 illustrate a number of useful lessons in asset management implemen-tation that can be generalized as follows:
• An incremental approach to transportation asset management is not only possible � it may often be highly desirable. Transportation asset management is not only a very broad perspective that affects virtually every organizational unit in an agency, but it also depends upon rapidly evolving technology (e.g., ITS, remote sensing, information processing). Undertaking asset management improvements simultaneously across many or all areas in the matrices above is likely not a sustainable approach for reasons of financial cost, difficulty of technological support, and organizational disruption.

NCHRP Project 20-24(11) Task 2 � Asset Management Framework
3-22 Cambridge Systematics, Inc.
• Asset management implementation must deal with reality, not perfection. For exam-ple, while the tradeoff analyses in Figures 3.2 and 3.3 may yield a preferred distribution of resources among programs, this distribution may not be possible given funding con-straints, eligibility rules, legislative distribution formulas, and so forth. Principles of good asset management practice recognize these limitations and seek ways to mitigate them when they would otherwise impede a preferred approach.
• While the matrices in Tables 3.1 through 3.4 are organized in individual areas for clar-ity and comprehension, the management principles and criteria that they represent are integrated and should be applied in a consistent, reinforcing way. For example, improvements in management systems should be complemented by business processes that apply that information effectively; performance measures tracked by management systems and used in business processes should be consistent with policy goals and objectives; and so forth.
Additional examples addressing other aspects of asset management will be included in the Transportation Asset Management Guide in Phase II.

NCHRP Project 20-24(11) Task 2 � Asset Management Framework
Cambridge Systematics, Inc. 4-1
4.0 Information Technology Supporting Asset Management
��������4.1 Introduction
Information technology (IT) plays a key role in supporting asset management practice by providing quality information, as suggested in Figure 2.2. Asset management benefits from timely and accurate information on asset characteristics, condition, and performance as well as the ability to assess the cost and impacts of different investment, maintenance, and operations strategies. Agencies that want to strengthen the role of information in asset management will likely consider enhanced data collection procedures and other efforts to promote data integration, better accessibility to needed information, and development of supporting analytic tools. These advances in IT would ideally be under-taken as parts of a coordinated effort to strengthen asset management business processes overall.
Most agencies already have significant investments in data, systems, and the necessary support infrastructure. The key question is not necessarily how to build the ideal new asset management information system, but rather how to build on what is already in place. Agencies can begin to improve asset management immediately, using their existing IT and other organizational resources already in place. The key is to make the best use of available information and systems, now and at each stage of future development. It is the quality and effectiveness of the information provided, rather than the sophistication of the IT systems, that is important in asset management.
This section outlines a number of strategies to migrate legacy information systems, while adding new capabilities, to support transportation asset management. It starts by reviewing the current state of IT as it is typically applied to asset management, and the IT requirements associated with asset management. It then discusses example approaches for building on existing systems and databases, ranging from near-term strategies that provide stronger capabilities at relatively little cost, time and risk, to longer-term strate-gies that result in larger, more sophisticated and highly integrated applications. These are presented as suggestions, so that agencies have a sense of the number and types of options that can be used to enhance legacy systems and databases if needed. The section con-cludes with examples of how scenario-testing capabilities of existing management systems can be applied to analyze different asset management strategies and their implications for cost and performance.

NCHRP Project 20-24(11) Task 2 � Asset Management Framework
4-2 Cambridge Systematics, Inc.
��������4.2 State of IT Practice Regarding Asset Management
Overview
Agencies have considerable IT capabilities supporting transportation asset management. All states have, at a minimum, two basic pools of data: one associated with FHWA�s Highway Performance Monitoring System (HPMS), which provides information on geo-metric, structural, and operational condition for a sample of roads; and the second required by FHWA�s National Bridge Inspection (NBI) Program. Most DOTs, however, have more extensive highway inventories and periodic inspection and condition assess-ment programs. Inspection survey data for assessing the physical condition of infra-structure are obtained through a variety of techniques, including drive-by visual observation, detailed site inspections, non-destructive testing, automated vehicle meas-urements, and photo- and video-logging. Operational data describing real-time condi-tions of the transportation system are likewise obtained through a number of technologies, including cable or loop detectors and cameras for monitoring traffic flow, speed, and vehicle characteristics, and sensors for monitoring road surface temperature and precipi-tation. These data are applied in systems to manage infrastructure, as described in Figure 4.1, and traffic operations and safety, as listed in Figure 4.2.
Figures 4.3 and 4.4 identify systems that, while not addressing infrastructure specifically, play important roles supporting asset management. A number of potential applications are listed in these figures, with key examples including the following:
• Financial management and accounting systems provide comprehensive and authorita-tive information on revenues and expenditures for all agency activities, including asset management in its broadest sense. These systems provide �ground truth� for com-paring tallies of expenditures by other management systems (e.g., in maintenance, equipment, or materials management) and computing adjustments to full activity costs, if needed. Financial system reports are also important to new GASB financial reporting requirements regarding infrastructure that will be discussed in Appendix B.
• Human resource and payroll systems have information on the position, qualifications, organizational unit assignment, wage rate, and benefits multiplier of each employee. These systems are important to asset management in an integrated system environ-ment, where accurate tallies of labor time and cost are needed in tracking expenditures for asset management functions. In such an instance, the time cards submitted by employees that are processed by these systems may also be used as the source of labor time and cost data in performing, for example, construction and maintenance activities.
• Systems and databases in planning, programming, project/construction management, and bid cost analysis provide information on proposed and ongoing projects and costs. These systems are useful in managing project and program delivery and as sources of information on actual cost and time needed to accomplish different types of work.

NCHRP Project 20-24(11) Task 2 � Asset Management Framework
Cambridge Systematics, Inc. 4-3
Figure 4.1 Typical Infrastructure Management Systems
Infrastructure Management Systems
Pavement Management � Nearly all states have pavement management systems (PMS). Experi-ence with these systems over several decades has led to a high degree of refinement regarding information organization and content and decision-support procedures. These systems generally have capabilities for maintaining and reporting the status of the pavement inventory, current and historical condition, forecasts of performance for assessing future needs, and guidance on project and program development.
Management of Bridges and Other Structures � Bridge management systems (BMS) have well-developed data, analytic, and reporting capabilities for bridge structural and operational condi-tion. Some states have employed BMS to represent other structures such as high-mast light fixtures, sign bridges, and minor tunnels. However, this practice is not standardized, and addi-tional systems development may take place in the address these and additional structures (e.g., retaining walls, ITS installations) more specifically. The FHWA has recently awarded a study for initial development work on a Tunnel Management System.
Maintenance Management � Many states have a maintenance management system (MMS) in place. The original uses of these systems were to record information on maintainable highway features, plan and schedule maintenance activities, and estimate budgets and resource require-ments based upon standardized, statewide work-requirement factors. Recently several DOTs have enhanced their analytic approach to maintenance management to develop level-of-service or performance-based methods for maintenance budgeting, bringing MMS closer to the concepts used in PMS and BMS. More integrated MMS are on the horizon that will link maintenance man-agement with other DOT functions in transportation asset management, financial management, resource management, and construction project management.
Other DOT-Maintained Facilities and Features � While many agencies employ their maintenance management systems to monitor condition of facilities (e.g., rest areas) and features (e.g., guard-rail, signs, and signals), some agencies have developed individual management systems to main-tain more detailed information on these items.
Other Modal Facilities � The application of IT to assets of other modes is more varied among DOTs, due to different program responsibilities and levels of budget that DOTs exercise among transit facilities, aviation and maritime facilities, pedestrian ways and bicycle paths, and inter-modal facilities such as park-and-ride lots and stations. Transit routes, pedestrian ways, and bikeways that are part of the highway network may be designated within a highway database or maintained in a separate system or database, while individual modal and intermodal facilities may be addressed by a separate IT application. A complicating factor is that modal responsibili-ties may be vested in more than one agency, in which case the DOT�s role is associated, for exam-ple, more with program funding and monitoring than with line management responsibility. In many cases a DOT�s role in these other modes, and consequently its IT applications, may focus more on operational rather than infrastructure concerns, as discussed in the section below.

NCHRP Project 20-24(11) Task 2 � Asset Management Framework
4-4 Cambridge Systematics, Inc.
Figure 4.2 Typical Management Systems in Transportation Operations, Safety, and Customer Service
Transportation Usage and Customer Services
Highway Usage, Operations and Safety � All states maintain data on traffic (at a minimum, annual average daily traffic or AADT), and accidents by location, though the level of detail and sampling strategy varies. Some states have capabilities in place such as traffic operations centers to track more detailed operational characteristics (e.g., congestion patterns, speeds) for particular facilities.
Congestion, Safety, Public Transit and Intermodal Management Systems � Many states began implementing computerized systems in support of the 1991 ISTEA management system require-ments, which were relaxed in 1995. A 1997 GAO report found that as of 1996, about half of the states were developing all of the ISTEA management systems, and nearly all were developing safety and congestion management systems. However, the degree to which these systems have since been completed and put into operation varies among agencies, as do the respective oper-ating characteristics and scope. The most sophisticated treatments of these topics occurs in traffic operations centers, which monitor traffic speed and congestion in real time, and with ITS installa-tions, which, among other technologies, employ real-time monitoring and information feedback to the traffic stream (e.g., through variable message signs).
Transportation Network Planning Models � Most transportation agencies have basic trip gen-eration, modal split, and traffic assignment modeling capabilities in place to forecast future trans-portation movements, with associated data: e.g., trip origin-destination tables and network characteristics (distance, speed, travel time, cost). These models are used primarily at the regional level, though a number of statewide models are also in use. DOTs may also track demographic data that influence demand for, and impacts of, transportation: e.g., population, employment, socioeconomic characteristics, and travel patterns. Some states have freight as well as passenger travel information.
Customer Information � Some states maintain data on customer perceptions of service quality that are obtained via surveys. Event tracking systems are also used by some DOTs to log cus-tomer questions and comments, initiate any needed work orders, and manage the closure of each item.
Real-Time Weather Information � DOTs in winter climates that may lead to freezing tempera-tures on pavements and snow and ice precipitation may monitor weather conditions in real time. These systems employ sensors that report air and pavement temperature and precipitation on the road surface as they occur. These monitoring systems may be combined with weather forecasting capabilities that apply data on local site conditions within area meteorological models to forecast weather conditions affecting roads.

NCHRP Project 20-24(11) Task 2 � Asset Management Framework
Cambridge Systematics, Inc. 4-5
Figure 4.3 Typical Systems to Manage Agency Resources
Agency Resources
Accounting and Financial Management � DOT systems for comprehensive accounting and finan-cial management are central to tracking and reporting departmental funding and expenditures by program. They document funds expended by program, organizational unit, work task, and type of expenditure, supporting asset management in several ways: e.g.,
• They enable tracking of historical trends in revenues and expenditures, which can be correlated with major program changes and influencing factors.
• They enable agencies to identify the full costs of building, operating, maintaining, and rehabili-tating transportation infrastructure, and to compare the costs of different methods of program delivery.
• They define the �ground truth� for dollars received and spent as a reference for other manage-ment systems. Program costs calculated by other systems (e.g., PMS, BMS, MMS, equipment or materials management, construction project management) can be reconciled against financial system data.
• They can identify the costs of responding to extraordinary or non-typical situations (e.g., emer-gency and disaster response, major inter-district transfers of resources, and special applications of program funds).
Human Resource and Payroll Management � Agencies maintain systems to manage employee information and payrolls. Human resource data back up line managers� assessments of the avail-ability and cost of in-house staff to deliver products and services, influencing decisions on feasible methods of program delivery. Information on labor skills and costs by organizational unit can be applied within integrated maintenance management systems to provide more precise tracking of activity accomplishment as well as single-source input of labor time reporting.
Maintenance Resources � MMS are the primary tool for scheduling and managing maintenance resources across organizational units and for comparing methods of delivery (e.g., in-house labor forces versus outsourcing). They do not, however, track labor usage and costs to the same preci-sion as that employed in human resource systems, payroll systems, and financial management and accounting systems. Moreover, their costing of equipment in terms of simple �rental� rates based on usage (e.g., by hour or mile) and of materials in terms of essentially a unit cost may only approximate the more precise calculations used in other systems.
Equipment and Materials Data � Agencies may track information on heavy equipment (as for con-struction and maintenance) and materials through financial system modules or via specialized equipment and materials management systems designed specifically to reflect agency purchasing and accounting conventions. These systems incorporate algorithms that meet an agency�s specific approaches to cost assignment and accounting: e.g., depreciation or estimation of rental charges for equipment, and stockpile or inventory calculations for materials.
Real Estate and Property Data � Agencies may employ specialized systems to manage right-of-way holdings and acquisitions, as well as buildings and properties ancillary to the transportation network (e.g., maintenance yards, garages for DOT equipment).

NCHRP Project 20-24(11) Task 2 � Asset Management Framework
4-6 Cambridge Systematics, Inc.
Figure 4.4 Typical Systems to Manage Programs and Projects
Programs and Projects
Planning and Programming Information � Agencies often support planning and programming procedures with IT applications identifying the status and characteristics of candidate projects. These systems organize project information within a time horizon, typically 10 to 20 years for planning, six to 10 years for mid-range investment plans, and three to six years for programming. Data usually include project identification by program, proposing agency or division, estimated cost (total or by phase: preliminary engineering, right-of-way acquisition, and construction), planned years of phased implementation, and funding sources. This information may be printed and incorporated as part of a DOT�s long-range plan, its statewide transportation improvement program (STIP), and other agency planning and programming documents.
Project Pipeline and Construction Management � Agencies may also maintain information on construction projects in various phases from preliminary engineering to completion. Project pipe-line systems address project status following approval of the STIP and the annual/biennial con-struction program, as projects move into design, right-of-way acquisition, environmental evaluations, and permitting prior to advertisement of bids (�ad date�). Construction management systems address project implementation following opening of bids and construction contract award, through to project completion and closeout. Project milestones, critical events affecting progress, and payments to contractors are tracked. Approved changes in the scope, cost, and schedule of each project are also recorded.
Bid Costs � Many agencies track the cost of construction projects in terms of a standardized list of bid items and associated unit costs. Each advertised project that includes a particular bid item contributes a paired data point in terms of the unit cost submitted by the winning bidder and the specified quantity of the bid item. At the end of the year the weighted-average unit cost of each bid item is computed from these accumulated data pairs; the unit costs of all bid items are pub-lished or maintained in a database. Data may be computed statewide or by geographic unit such as district or county. These data provide guidance to engineers on current bid prices, reflecting trends in labor, equipment, materials, and subcontractor costs and the local bidding climate.
Systems Platforms
The breadth of the types of systems covered in Figures 4.1 through 4.4 anticipates greater integration of IT data and analytic capabilities in the future. Asset management will bene-fit from a greater integration of existing data, coupled with additional information that agencies will find useful and feasible to gather and process. Observations on the current data and systems platforms now in use are given below. More detailed consideration of how these existing resources may be transformed into an architecture better capable of supporting asset management in the future will be given in later sections.
The comments on the data communication and spatial data platforms are as follows:
• Data Entry, Access, and Reporting Methods � States maintain their data in a variety of ways � mainframe systems, client-server databases, and desktop databases � and have

NCHRP Project 20-24(11) Task 2 � Asset Management Framework
Cambridge Systematics, Inc. 4-7
a variety of systems in place for maintaining and accessing the data related to the sys-tems described in Figures 4.1 through 4.4. These resources include standardized main-frame-based reports, off-the-shelf desktop reporting tools, and custom-built client-server, data warehouse, or web-based applications, which may include a GIS interface.
• Mapping Systems and Geographic Information Systems (GIS) � Maps provide effec-tive visual displays of information on the transportation system. Many states employ either a map-based system or a geographic information system (GIS) for this purpose. Map-based systems are useful for organizing and displaying information such as transportation system usage, facility condition, and planned projects in a network. A GIS can have multiple layers of information on, for example, the transportation system, socioeconomic data, and current and planned land use, and can perform spatial analy-ses on this information. Moreover, links to additional displays can be provided: e.g., additional details on specific aspects of data, photographs, and videologs. Some states are actively pursuing GIS as a platform for integrating information from other man-agement systems as part of their asset management approach.
Challenges to Overcome
Current systems provide certain capabilities to support asset management. However, additional capabilities are often needed to advance the state of practice. Organizations are seeking ways to gain these capabilities efficiently and economically, and to improve inte-gration of data and systems overall. There are a number of technical and organizational obstacles to be overcome:
• Legacy databases and information or decision-support systems represent a mix of IT technologies that have evolved over the past 20 to 30 years. Substantial investments of both dollars and staff time are required to plan and implement system modernization.
• Different departmental units often maintain separate sets of information tailored to their own needs, leading to duplication in data collection and processing, and poten-tially to inconsistencies in information.
• Legacy databases and systems often do not have common standards in, for example, data definition, geographic referencing, network segmentation, and temporal refer-encing. This disparity complicates the integration of data across systems.
• Infrastructure management systems for different classes of assets are not always based on a common analytical or decision-making framework (e.g., incremental benefit-cost, cost-effectiveness criteria, technical criteria, or heuristic decision rules). Therefore, it is difficult to base tradeoff analyses on a common objective or basis of comparison.
• Infrastructure management systems are designed to address a wide variety of business processes including planning and scenario testing, inspection of network condition, project prioritization and programming, work scheduling and quality assurance, model updating, and system performance monitoring. In practice, however, use of these sys-tems is often limited to a single organizational unit or to a more limited set of business processes. The capabilities of these systems are typically not fully used.
NCHRP Project 20-24(11) Task 2 � Asset Management Framework
4-8 Cambridge Systematics, Inc.
• Asset inventory and condition data and the results of analyses from infrastructure management systems are typically detailed and technical. They often lack the customer-orientation or performance-based perspective and �big picture� view that is needed by agency executives and policy-makers.
��������4.3 Sample Information System Requirements
The sample requirements below provide guidelines for migrating IT systems and data in a way that supports asset management. They are organized according to the type of infor-mation and analytic capabilities that are needed. Individual agencies should tailor these examples to their particular practices and system objectives, and may choose to develop requirements in more detail to relate to specific business process, system, and data char-acteristics.
Asset Inventories
• Inventories for different asset classes should be based on a common location-referencing scheme. This standard allows for queries of which assets are present in a given location or network segment, and provides a unified basis for data input, dis-play, and reporting.
• A common set of geographic dimensions and classification categories for summarizing information should be supported across asset types � e.g., districts, corridors, func-tional classes, responsible agency for ownership and operation, climatic or topographic zones, and so forth.
• The coverage and detail of inventory data for each asset class should be established at a level that is appropriate to the scale of investment required for that class, business process requirements, and data collection costs. Choices include, for example, use of a sampling approach versus 100 percent coverage; annual updates versus less frequent surveys; and identification of specific items at individual locations versus aggregate counts within intervals or segments.
• The inventory should include sufficient information on asset characteristics and classifications to support the full range of asset management business processes, including condition assessment, GASB financial reporting of infrastructure assets,5 needs analysis, and ranking. A strategic overview of transportation assets is needed to
5 GASB refers to the financial accounting and reporting standards issued by the Governmental
Accounting Standards Board. Many of the references to GASB in the system requirements listed in this section will apply only if the modified approach is used for financial reporting. Refer to Appendix B for information on GASB reporting standards and their relationship to asset management.

NCHRP Project 20-24(11) Task 2 � Asset Management Framework
Cambridge Systematics, Inc. 4-9
define an inventory of appropriate structure and detail, with standards of precision, accuracy, and timeliness of data collection that meet these varied needs.
• While there may be separate inventories for each class of asset, commonly used data (such as functional classification and AADT) should not be collected more than once. If individual systems require the same kind of information, but in different formats, or at different levels of detail, then automated methods should be established for deriving the necessary information from the primary source.
Current Asset Condition and Performance
• For each type of asset, at least one objective measure of condition should be collected and stored.
• Ideally, historical condition data (possibly in aggregated form) should be maintained and made accessible to support trend reporting and analysis.
• In addition to �raw,� technical condition indicators (e.g., pavement roughness, sign visibility or reflectivity, and percent items deficient), systems should include measures that are useful for policy-making and that reflect the customer perspective. These may include, for example, composite condition or serviceability indexes, customer satisfac-tion ratings, and measures of user cost or benefit.
• Systems or analytic tools should be able to derive values of established agency per-formance measures from raw condition data in an unambiguous and replicable way (e.g., to compute a cracking index as a function of type, severity, and extent of cracking). If the condition measures or indexes are used in the financial reports of infrastructure, they should conform to GASB standards (see Appendix B).
• Condition measures should be consistent with cost and deterioration models, and if appropriate, with methods for reporting assets as required by GASB (see Appendix B).
• Systems should support queries of individual asset condition and of aggregate condi-tion measures, composite measures, and combinations of measures, by location and asset category.
Projected Asset Condition and Performance
• Provide capability to project future asset condition: e.g., using asset deterioration models. Ideally, the system will be able to apply actual data from condition monitoring to automatically update these deterioration models.

NCHRP Project 20-24(11) Task 2 � Asset Management Framework
4-10 Cambridge Systematics, Inc.
• Provide capability to project future values of established agency goals, objectives, or target performance measures.
• Conform to GASB standards on projecting condition in relation to a target condition level, even if the modified approach is not planned to be used (refer to Appendix B).
Cost Estimation and Reporting
• Incorporate models to estimate costs of key activities in transportation asset manage-ment, particularly for projects to build, repair, rehabilitate, and reconstruct infrastruc-ture, and for preventive and routine maintenance. To the degree possible and appropriate, these models should try to achieve the following criteria: accounting for the full costs of an activity; accounting for indirect as well as direct activities; distin-guishing between constant- and current-dollar estimates; clarifying the basis of the cost estimate (e.g., operating costs of equipment in maintenance management systems; depreciation of equipment in equipment management systems); using actual unit costs in lieu of statewide averages; conforming to GASB standards on cost reporting, even if the modified approach is not planned for use (refer to Appendix B); and providing an option to account for ancillary costs (e.g., benefits on labor costs; costs of construction inspection and management as adjustments to project costs; replacement of appurte-nances as part of a construction project).
• Compile and store construction and maintenance cost information so that a time-series of costs can be derived: e.g., by work type, asset or asset class, location and network classification.
• In the case of certain critical assets such as bridges, consider a �failure-cost� approach that reflects an effective penalty borne by the agency and by transportation customers due to closure of a severely deteriorated facility. Such a penalty effectively provides a criterion to undertake needed work before the infrastructure reaches a failed state.
• Include budget constraints in cost estimates performed at a network, system, or pro-gram level. Provide a capability to forecast the annual needed to maintain assets at established condition levels; or, conversely, the condition level that will be attained as a function of constrained budget level.
Needs Identification
• Provide capability to identify specific locations or individual facilities that do not (or will not) meet one or more minimum standards.
• Provide capability to identify multiple types of needs occurring in a given location (e.g., deficiencies due to congestion and to pavement condition).
• Provide capability to estimate the costs of addressing the identified needs (using rules of thumb, or automated evaluation and selection of alternative actions).

NCHRP Project 20-24(11) Task 2 � Asset Management Framework
Cambridge Systematics, Inc. 4-11
• Provide capability to summarize these costs across a variety of dimensions (by type of action, location, type of asset, etc.).
• Provide the capability to easily locate and retrieve information on planned, pro-grammed and pipeline projects in selected locations.
Project, Program, and Network-Level Evaluation of Proposed Work
• Given a list of candidate projects (which may include a mix of assets and project types), provide the capability to rank candidates according to a consistent methodology: e.g., benefit-cost ratio, cost-effectiveness criterion, or other agency criteria, to assist in plan-ning and programming.
• Develop project evaluation tools that have a consistent set of outputs and outcome measures across project types to allow for evaluation of wide range of alternative approaches.
• Provide the capability to evaluate the life-cycle costs and benefits of a given type of project. In asset preservation, provide the capability to estimate the life-cycle costs associated with different capital/maintenance strategies.
• Provide the capability to calculate performance measures associated with a range of investment levels and distributions (e.g., to support tradeoff analyses).
Program Delivery
• Maintain records of actual costs and time of completed projects, including significant changes.
• Summarize information on overall program delivery in terms of cost and time parameters, number of proposed projects completed, and reasons for significant changes.
• Track, store and report on program outcomes in terms of established performance measures.
• Provide capability to derive or update unit costs and cost models based on actual cost data.
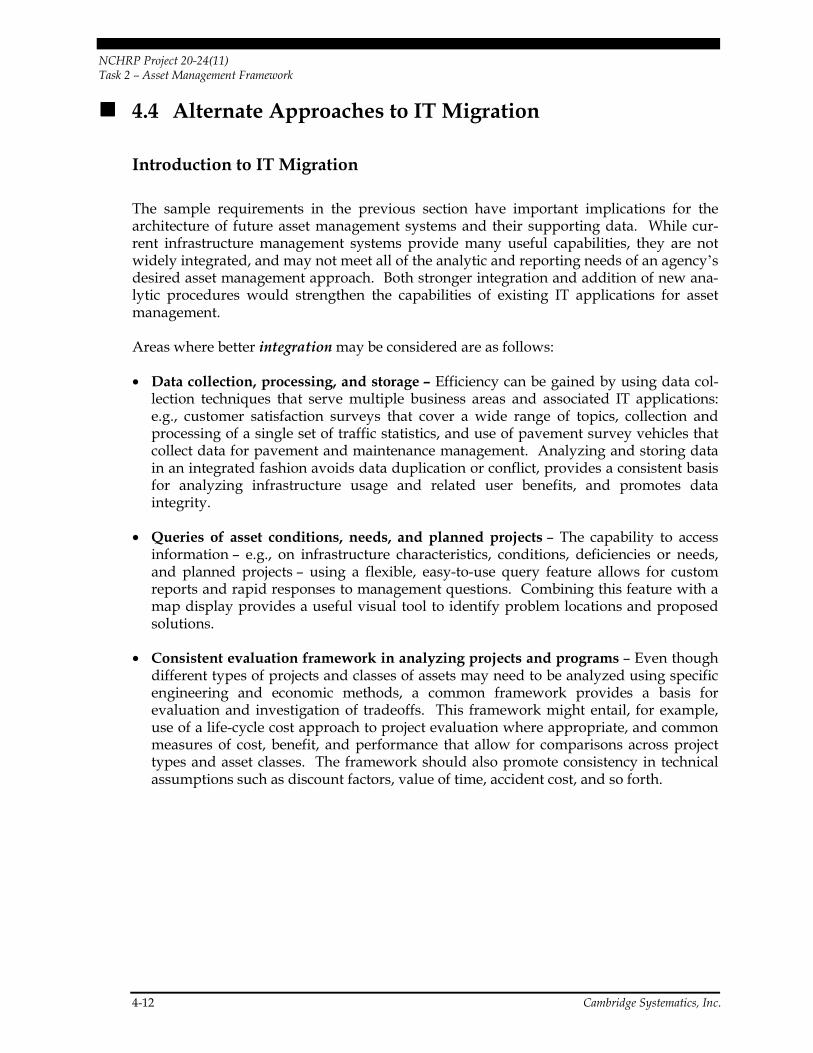
NCHRP Project 20-24(11) Task 2 � Asset Management Framework
4-12 Cambridge Systematics, Inc.
��������4.4 Alternate Approaches to IT Migration
Introduction to IT Migration
The sample requirements in the previous section have important implications for the architecture of future asset management systems and their supporting data. While cur-rent infrastructure management systems provide many useful capabilities, they are not widely integrated, and may not meet all of the analytic and reporting needs of an agency�s desired asset management approach. Both stronger integration and addition of new ana-lytic procedures would strengthen the capabilities of existing IT applications for asset management.
Areas where better integration may be considered are as follows:
• Data collection, processing, and storage � Efficiency can be gained by using data col-lection techniques that serve multiple business areas and associated IT applications: e.g., customer satisfaction surveys that cover a wide range of topics, collection and processing of a single set of traffic statistics, and use of pavement survey vehicles that collect data for pavement and maintenance management. Analyzing and storing data in an integrated fashion avoids data duplication or conflict, provides a consistent basis for analyzing infrastructure usage and related user benefits, and promotes data integrity.
• Queries of asset conditions, needs, and planned projects � The capability to access information � e.g., on infrastructure characteristics, conditions, deficiencies or needs, and planned projects � using a flexible, easy-to-use query feature allows for custom reports and rapid responses to management questions. Combining this feature with a map display provides a useful visual tool to identify problem locations and proposed solutions.
• Consistent evaluation framework in analyzing projects and programs � Even though different types of projects and classes of assets may need to be analyzed using specific engineering and economic methods, a common framework provides a basis for evaluation and investigation of tradeoffs. This framework might entail, for example, use of a life-cycle cost approach to project evaluation where appropriate, and common measures of cost, benefit, and performance that allow for comparisons across project types and asset classes. The framework should also promote consistency in technical assumptions such as discount factors, value of time, accident cost, and so forth.

NCHRP Project 20-24(11) Task 2 � Asset Management Framework
Cambridge Systematics, Inc. 4-13
• Improved decision support in the following areas:
− Executive Information � System capabilities and tools that are specifically designed to provide policy-level information are needed to better support executives and managers needing a �big picture� view.
− Tradeoff Analysis � Methods are needed to assist with tradeoff analysis across asset classes, program categories, and types of investment, making use of comparative analyses of cost and performance measures.
− Benefit/Cost Analysis � Benefit�cost analysis provides a useful, commensurate basis to evaluate different categories of candidate projects. When structured in a life-cycle cost context, it provides an economic framework for analyzing capital-maintenance tradeoffs.
The examples in the following sections address the question: How can the capabilities above be achieved realistically and practically, given existing legacy systems that differ in their analytic assumptions and approach, year of development, systems platform, associated database and data management capabilities, and other characteristics? In fact, a number of approaches can be taken to improve existing IT capabilities, ranging from relatively modest, near-term efforts to more substantial, long-term engagements. A selec-tion of options is outlined below, illustrating different concepts that can be accomplished at different levels of design and development effort, risk, and cost.
The first set of options relates to data management and integration. The second set of options relates to migration of existing decision-support systems to a new system archi-tecture, and development of additional analytic tools for stronger support of asset management. In reality, the two perspectives are intertwined, but several of the options for data migration can be combined with more than one option for system migration. The options encompass incremental changes made to existing systems, complete replacement of several databases and systems, and the development of new systems that provide an integrated view of assets. This organization is not intended to suggest the validity of one model over another. The best model to use for either data or management systems will vary by agency and therefore should be considered on a case by case basis. Similarly, the actual cost of each strategy will depend upon the specific situation at hand. It is possible to stage the migration of data and systems to provide near-term improvement while plan-ning for longer-term redevelopment. For those wishing a more detailed description of an approach to software development for asset management, refer to Appendix A, which is based on a maturity model approach similar to that described in Section 3.0.

NCHRP Project 20-24(11) Task 2 � Asset Management Framework
4-14 Cambridge Systematics, Inc.
Options for Data Management and Integration
Data Model #1 � Legacy System Interfaces
Figure 4.5 illustrates a case where asset data are maintained and updated in separate leg-acy systems. For example, an agency may have a separate pavement database, a bridge database, a sign inventory, a railroad crossing inventory, and so forth. Each of these data-bases has been designed to work with an associated decision-support system. All of these systems are left in place. However, in order to support some improved analysis � for example, integrated display of multiple types of assets in a GIS, or a new ad hoc query system tailored to the needs of executives � a series of legacy system interfaces (LSI�s) is constructed. These LSI�s read data from the legacy systems, and process them into the format needed to support the new, supplementary analysis tools. The new tools that are shown include a GIS, a specialized tool for benefit-cost analysis, and an Executive Information System (EIS) as examples, but others could be included. Model #1 is an incremental, relatively low-cost approach to putting new capabilities in place without major disruption to existing IT capabilities.
Figure 4.5 Legacy System Interface Approach to Asset Management Data
Legacy Systemi
Legacy Systemj
Legacy SystemInterface i
Legacy SystemInterface j
NewAsset Management Analyses,
Functions, or Systems
e.g.,GISe.g.,GIS
e.g.,B/C, Tradeoffs
e.g.,B/C, Tradeoffs
e.g.,EISe.g.,EIS
Legacy Databasei
Legacy Databasej

NCHRP Project 20-24(11) Task 2 � Asset Management Framework
Cambridge Systematics, Inc. 4-15
Data Model #2 � Central Data Warehouse/Repository
Figure 4.6 illustrates the case in which a new data warehouse or other central data repository is built. As in Model #1, existing legacy systems are preserved to serve selected functions, and data continue to be maintained via the legacy systems. However, rather than constructing a specific set of new decision-support systems with interfaces to the leg-acy data, a central data repository or data warehouse is established which is populated (at least in part) by data from each of the legacy systems. The data warehouse or data repository is designed to serve as a resource to multiple organizational units, and may be accessed by several new decision-support tools, which may be implemented over time.
The data warehouse or central repository provides the value of data integration, but with-out the need to modify individual databases that are maintained by different legacy sys-tems. For example, information on highway and transit assets, traffic volumes, transit operations, and respective investment and maintenance policies could be organized within such a central storage area, drawing upon data managed by a PMS, BMS, MMS, roadway management system, public transit system, or other sources. The data ware-house can be designed to offer the additional advantage of efficient data organization for reports that are tailored to specific management needs: e.g., executive-level information, or financial reporting of infrastructure assets as required by GASB (see Appendix B).
Figure 4.6 Data Warehouse/Repository Approach to Asset Management
Legacy Systemi
Legacy Systemi
Legacy Systemj
Legacy Systemj
Legacy Databasei
Legacy Databasei
Legacy Databasej
Legacy Databasej
Data Warehouse orCentral Data Repository
Data Warehouse orCentral Data Repository
NewAsset Management Analyses,
Functions, or Systems
NewAsset Management Analyses,
Functions, or Systems
e.g.,GISe.g.,GIS
e.g.,B/C, Tradeoffs
e.g.,B/C, Tradeoffs
e.g.,EIS
e.g.,EIS
(Functionality of legacy systemsevolves to primarily data input
and selected analyses)
(Periodic update)

NCHRP Project 20-24(11) Task 2 � Asset Management Framework
4-16 Cambridge Systematics, Inc.
Data Model #3 � Centralized Database
Figure 4.7 illustrates the creation of a new, centralized database. This model differs from Model #2 in that the central database becomes the primary location for both data mainte-nance and data retrieval by all affected systems. A variety of specialized applications may be built that draw upon the central database. Legacy systems are no longer used for data updates. They may still be used for selected functions, but they must either be modified to work with the new central database, or mechanisms to populate their individual data-bases from the central database must be put into place.
Compared to Model #2, this approach may require greater up-front investment to replace the databases and associated data management capabilities of the legacy systems. The relative advantage of this approach would be the attainment of a more truly integrated database, with the benefits of integrity, lack of duplication, and consistent treatment. This approach could also be used to provide data needed by new applications: e.g., tradeoff and benefit-cost analyses, and other functions illustrated in Figure 4.7.
Figure 4.7 Centralized Database Approach for Asset Management
Legacy Systemi
Legacy Systemi
Legacy Systemj
Legacy Systemj
Legacy Databasei
Legacy Databasei
Legacy Databasej
Legacy Databasej
Centralized Asset Management DatabaseCentralized Asset Management Database
NewAsset Management Analyses,
Functions, or Systems
NewAsset Management Analyses,
Functions, or Systems
e.g., updatedPMS, BMS, etc.e.g., updated
PMS, BMS, etc.e.g.,
B/C, Tradeoffse.g.,
B/C, Tradeoffs
e.g.,GIS, EIS
e.g.,GIS, EIS
(Legacy systems may ormay not be able to access
centralized database)
(Legacy databases arephased out)
?
(Legacy databases arephased out)
?

NCHRP Project 20-24(11) Task 2 � Asset Management Framework
Cambridge Systematics, Inc. 4-17
Data Model #4 � Distributed Databases
Figure 4.8 illustrates the case in which a set of new, distributed databases is created to serve a variety of decision-support systems and tools. In this model, certain asset data are maintained in the distributed databases, which are designed with common standards. If the legacy systems can be modified feasibly to access the new databases, they are con-verted to do so; otherwise, they retain their legacy databases in the short term, but all new systems and tools access the distributed databases. This model allows for the possibility of keeping one or more existing legacy systems as the location in which current data are maintained, and adding other supplementary databases as needed.
This approach might be used if there is a need to maintain separate databases as opposed to the consolidated databases in the previous examples: e.g., for organizational reasons, or to maintain separate information by mode or asset class. The databases should repre-sent consistent standards, however, so that they may each be accessed by general analytic and systems capabilities shown in Figure 4.8 (e.g., GIS, EIS, specialized analyses).
Figure 4.8 Distributed Database Approach for Asset Management
(Legacy databases may ormay not be able to access
updated databases)? ?
Updated Databasei
Updated Databasei
Updated Database j
Updated Database j
(Updated databasesmay serve more than
one system or function)
Legacy Systemi
Legacy Systemi
Legacy Systemj
Legacy Systemj
Legacy Databasei
Legacy Databasei
Legacy Databasej
Legacy Databasej
NewAsset Management Analyses,
Functions, or Systems
NewAsset Management Analyses,
Functions, or Systems
e.g., updatedPMS, BMS, etc.e.g., updated
PMS, BMS, etc.e.g.,
B/C, Tradeoffse.g.,
B/C, Tradeoffs
e.g.,GIS, EIS
e.g.,GIS, EIS

NCHRP Project 20-24(11) Task 2 � Asset Management Framework
4-18 Cambridge Systematics, Inc.
Options for Decision-Support Systems
System Model #1 � Current Situation and Selective Updates to Existing Systems
Figure 4.9 illustrates a typical current situation: existing systems and data supporting individual asset management functions, but a desire on the part of the agency to provide additional capabilities in key areas (e.g., GIS, EIS, or specialized analytic tools) at relatively low cost. The bottom portion of the diagram with the question mark indicates an agency�s consideration of what IT architecture and system development strategy should be considered to improve asset management capabilities. Each remaining figure in this section will illustrate a different system development process.
Figure 4.9 represents in effect a base case for system migration, but it does not necessarily imply maintaining the status quo. Limited updates may be performed to legacy systems, but with no substantial change in basic architecture. Existing asset management systems would continue to be maintained as separate entities, but could be updated to support asset management better.
Figure 4.9 Example Current Situation in Asset Management Systems
Existing or Updated�Single-Asset� Systems
System
Data
SystemSystem
DataData
System
Data
SystemSystem
DataData
System Development
Process
System System DevelopmentDevelopment
ProcessProcess
Selected Advances forAsset Management
Selected Advances forSelected Advances forAsset ManagementAsset Management
Examples:Examples:Examples:
SpecializedAnalytic
Tools
SpecializedSpecializedAnalyticAnalytic
ToolsToolsGIS
PlatformGISGIS
PlatformPlatformEISEISEIS
What Systems andData ManagementStrategies could Support Better Asset Management??? What Systems andWhat Systems andData ManagementData ManagementStrategies could Strategies could Support Better Support Better Asset Management?Asset Management?

NCHRP Project 20-24(11) Task 2 � Asset Management Framework
Cambridge Systematics, Inc. 4-19
Updates at this stage could include one or more of the following:
• Porting of programs and data to the current generation of computers and software tools;
• Enhanced functionality to provide improved analysis, reporting or display capabilities;
• Database revision to include additional information and/or revised data definitions; and
• Revision of data maintenance strategies to allow for integration of data from central-ized data stores.

NCHRP Project 20-24(11) Task 2 � Asset Management Framework
4-20 Cambridge Systematics, Inc.
System Model #2 � Functions and Standards Approach
Figure 4.10 illustrates the case where centralized, coordinated efforts to improve asset management capabilities focus on defining a framework and a set of standards covering system functions, analytical capabilities, user interface standards, data sharing mecha-nisms, and so forth. Individual business units pursue enhancements to existing systems or development of new tools according to the framework that is developed. This approach would normally be associated with the distributed database option above, but could be compatible with any of the approaches to data migration.
While the systems in this model are not integrated, benefits similar to those from integra-tion can be obtained for asset management, if a consistent framework and set of standards can be successfully applied to each new or updated system. For example, one could envi-sion a suite of new or redeveloped asset management systems (e.g., for pavement, bridge, transit, aviation, or rail) that conform to defined analytic standards such as use of benefit-cost analysis in identifying priorities and prediction of performance measures for tradeoff-analyses.
Figure 4.10 Functions and Standards Approach for Asset Management
Updated and New Systems
Existing �Single-Asset� Systems
System
Data
System
Data
System
Data
System
Data
Unified Functional, Data, Analytic,
Reporting, Other Standards
Updated and New Systems
UpdatedDatabaseUpdatedDatabase
UpdatedSystem
UpdatedSystem
NewDatabase
NewDatabase
NewSystemNew
System
System Development
Process
System Development
Process

NCHRP Project 20-24(11) Task 2 � Asset Management Framework
Cambridge Systematics, Inc. 4-21
System Model #3 � New Asset Management Tools
Figure 4.11 illustrates the case where the system development process focuses on building new tools for asset management that interface with existing management systems and supplement their features (or replace certain features with improved approaches). These tools could range from fairly simple spreadsheet workbooks to large-scale applications.
Figure 4.11 New Analytic Tools for Asset Management
Existing or Updated�Single-Asset� Systems
System
Data
System
Data
System
Data
System
Data
System Development
Process
PrioritizationModule
System Development
Process
New, Specialized Decision SupportModules for Asset Management
New, Specialized Decision SupportModules for Asset Management
Examples:Examples:
TradeoffModule
Asset ValuationModule
OtherModules
PrioritizationModule
TradeoffModule
Asset ValuationModule
OtherModules
(Refer to discussionof data migration options)

NCHRP Project 20-24(11) Task 2 � Asset Management Framework
4-22 Cambridge Systematics, Inc.
Examples of new tools could include the following:
• Project ranking or prioritization tool;
• Benefit-cost calculator for one or more types of projects;
• A level-of-service and performance budgeting tool to incorporate quality assurance concepts in maintenance management;
• A module to conduct �what-if� scenario testing and analysis of tradeoffs;
• Query and reporting tools to generate a standardized set of reports but allow users to easily input ad hoc or unique queries to obtain specialized reports;
• Mapping tools and spatial-query tools; and
• Asset valuation calculator to assist meeting GASB reporting standards (refer to Appendix B).
This option would tend to be used with either the Legacy System Interface or the Central Data Warehouse/Repository database options, since the emphasis is on supplementing but not replacing the legacy systems and their associated databases.

NCHRP Project 20-24(11) Task 2 � Asset Management Framework
Cambridge Systematics, Inc. 4-23
System Model #4 � Executive Information System (EIS)
The approach illustrated in Figure 4.12 assumes that existing management systems are providing satisfactory support at the detailed, technical level for activities such as needs identification, project identification, ranking, and project tracking. However, technical information and analyses may not sufficiently tied to policy and resource allocation deci-sions to be of use to agency executives and senior managers.
System development efforts are thus focused on providing improved asset management capabilities for high-level management through an Executive Information System. The EIS provides the ability for managers to quickly obtain policy-relevant information on asset performance, program and project status, project documentation and justification, and projected and actual program results, for example. It provides functions such as pre-defined and ad hoc reports, mapping, and high-level what-if analysis. It draws informa-tion and analysis results from existing management systems, but allows these results to be examined in an integrated fashion that responds to executive decision needs.
Figure 4.12 Executive Information System for Asset Management
�Executive� AssetManagement System
Complete, Accurate,Consistent, Current Data
Specialized Asset ManagementAnalyses and Decision Support
Reports, Displays
Existing or Updated�Single-Asset� Systems
System
Data
System
Data
System Development
Process
System Development
Process
Supporting SystemFunctions and Capabilities
(e.g., GIS, Financial)
Supporting SystemFunctions and Capabilities
(e.g., GIS, Financial)
(Refer to discussionof data migration options)

NCHRP Project 20-24(11) Task 2 � Asset Management Framework
4-24 Cambridge Systematics, Inc.
System Model #5 � Fully Integrated System
Figure 4.13 illustrates the case where existing management systems are replaced by a new integrated asset management system. This system provides a full set of generic asset management capabilities that are developed using a consistent analytic and data man-agement framework, and that serve multiple assets as well as different functional areas. It entails a complete replacement of current capabilities as indicated at the top of Figure 4.13, and a substantial design and development effort to provide the new capabilities.
This approach supports analyses that are specific to individual asset classes (e.g., pave-ment and bridge life-cycle costing), as well as cross-asset analyses (e.g., tradeoff analysis, which may involve assets in different programs or in different modes). It is designed to integrate with agency financial systems, GIS systems, and other systems in place that can provide supporting information or tools. This option would be compatible with either the centralized or distributed database options.
Figure 4.13 Fully Integrated Asset Management System
1. Define and relate decision support functionsand use cases for all asset classes
2. Design and build corresponding systemarchitecture
1. Define and relate decision support functionsand use cases for all asset classes
2. Design and build corresponding systemarchitecture
System Development ProcessSystem Development Process
Existing �Single-Asset� Systems
System
Data
System
Data
�Fully Integrated� Asset Management System
Input fromSupporting
Components,Tools, and
Systems(e.g., GIS,Financial)
Input fromSupporting
Components,Tools, and
Systems(e.g., GIS,Financial)
Use cases occurring early in processaddress primarily individual asset classes
Use cases occurring early in processaddress primarily individual asset classes
Use cases occurring later in processmostly cut across multiple asset classes
Use cases occurring later in processmostly cut across multiple asset classes
Asset Management DataAvailable to all Components, Tools, and Systems
Asset Management DataAvailable to all Components, Tools, and Systems
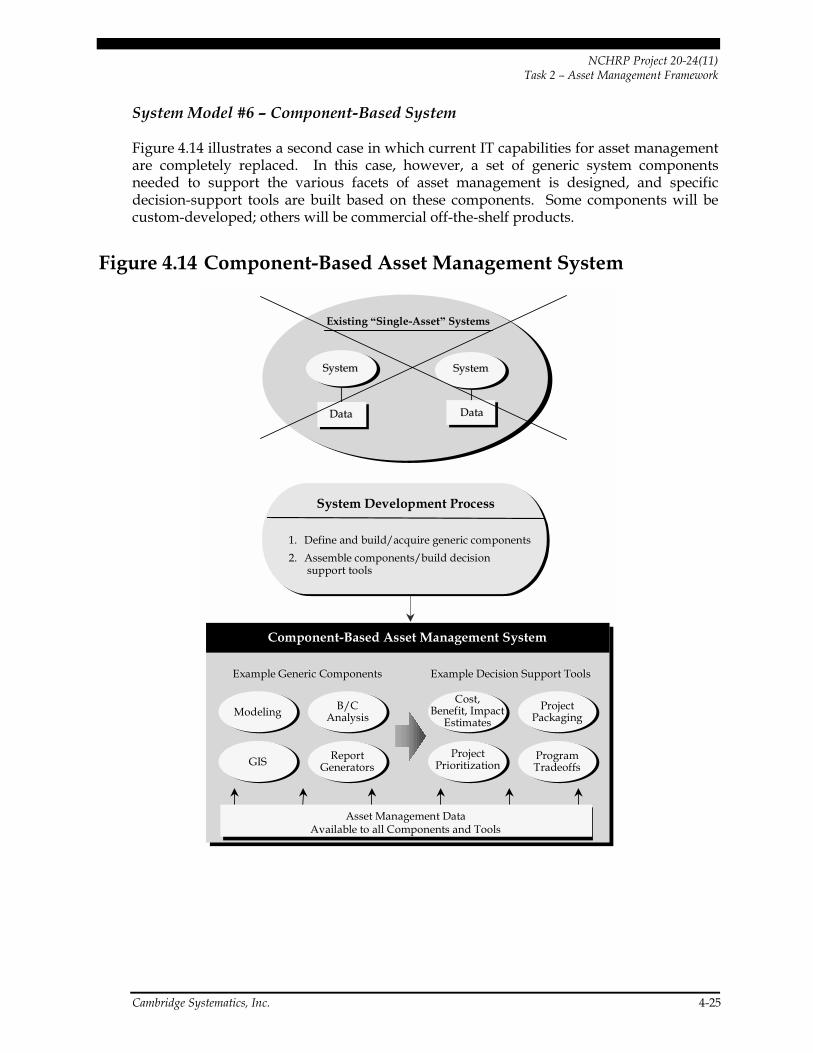
NCHRP Project 20-24(11) Task 2 � Asset Management Framework
Cambridge Systematics, Inc. 4-25
System Model #6 � Component-Based System
Figure 4.14 illustrates a second case in which current IT capabilities for asset management are completely replaced. In this case, however, a set of generic system components needed to support the various facets of asset management is designed, and specific decision-support tools are built based on these components. Some components will be custom-developed; others will be commercial off-the-shelf products.
Figure 4.14 Component-Based Asset Management System
1. Define and build/acquire generic components2. Assemble components/build decision
support tools
System Development Process
Existing �Single-Asset� Systems
System
Data
System
Data
System
Data
System
Data
Component-Based Asset Management System
Example Generic ComponentsExample Generic Components Example Decision Support ToolsExample Decision Support Tools
Modeling
GIS
B/CAnalysis
ReportGenerators
Cost,Benefit, Impact
Estimates
ProjectPrioritization
ProjectPackaging
ProgramTradeoffs
Asset Management DataAvailable to all Components and Tools

NCHRP Project 20-24(11) Task 2 � Asset Management Framework
4-26 Cambridge Systematics, Inc.
As in Model #5, the intent is to replace existing single-asset management systems. How-ever, the approach in Figure 4.14 focuses on creating building blocks, which can then be used as-is, or combined to construct more complex tools. The advantage of the compo-nent approach is that it can provide the flexibility to develop tools that meet the specific needs of different organizational units, and to adapt tools over time as business processes change. However, it is more expensive to develop a generic capability than one that needs to work in only one particular context. Incorporation of off-the-shelf components can counter-balance this added cost.
For example, a complete review of all asset management functions within the agency might indicate a set of requisite functions and analyses that are common to several asset classes and modes: e.g., updates of data on condition and performance, scenario testing under constrained budgets, economic analysis of optimal asset management strategies, and so forth. (These are examples of selected functions only � they do not represent an exhaustive asset management process.) In Model #5, these functions and analyses would be developed within systems modules, which would then be used to analyze different types of infrastructure assets: e.g., pavements, bridges, transitways, signs, ITS devices, rail, aviation facilities, and so forth. Stated another way, current asset management sys-tems such as PMS, BMS, PTMS, and other systems that manage individual types of infra-structure and features would no longer exist. All asset management functions would be handled by the generalized components. This approach clearly requires planning and a good understanding of the agency�s asset management process.
This option, like Model #5, is geared towards replacing most if not all of existing system functionality. Therefore, it would use either the centralized database or the distributed database approach.
��������4.5 Use of Management Systems for Scenario Testing Transportation agencies may already possess several capabilities that can be used at little additional cost to assist both asset management and GASB 34 reporting. This section pro-vides an example of such a capability, scenario testing, to discuss how existing manage-ment system capabilities can be applied to investigate the cost and implications of different asset management strategies. Systems that potentially could include a scenario testing capability are PMS, BMS, those MMS with levels of service defined, public transit asset management systems, and possibly capital programming systems and other systems for specific infrastructure features. The characteristic of interest in these systems is their capability to analyze needed expenditures as a function of target condition levels, network condition constraints, or in the case of maintenance management, levels of service. This scenario testing capability builds upon the set of engineering relationships and mathe-matical decision rules that are designed into the management system.
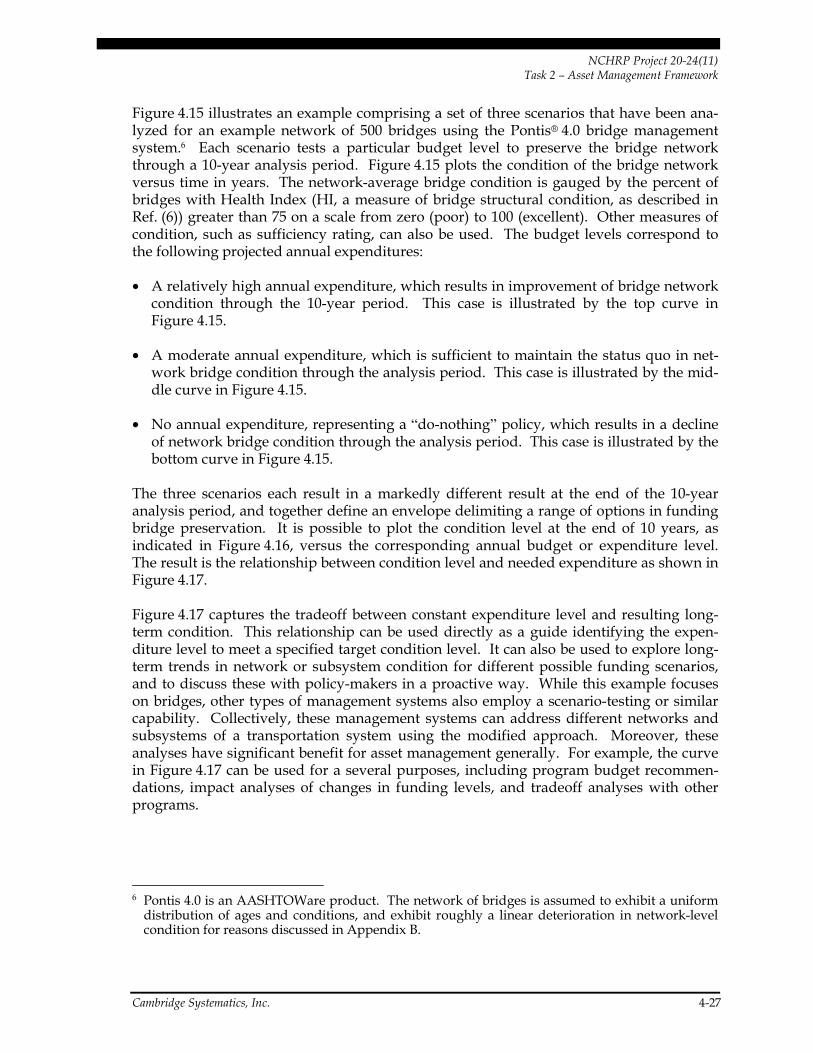
NCHRP Project 20-24(11) Task 2 � Asset Management Framework
Cambridge Systematics, Inc. 4-27
Figure 4.15 illustrates an example comprising a set of three scenarios that have been ana-lyzed for an example network of 500 bridges using the Pontis® 4.0 bridge management system.6 Each scenario tests a particular budget level to preserve the bridge network through a 10-year analysis period. Figure 4.15 plots the condition of the bridge network versus time in years. The network-average bridge condition is gauged by the percent of bridges with Health Index (HI, a measure of bridge structural condition, as described in Ref. (6)) greater than 75 on a scale from zero (poor) to 100 (excellent). Other measures of condition, such as sufficiency rating, can also be used. The budget levels correspond to the following projected annual expenditures:
• A relatively high annual expenditure, which results in improvement of bridge network condition through the 10-year period. This case is illustrated by the top curve in Figure 4.15.
• A moderate annual expenditure, which is sufficient to maintain the status quo in net-work bridge condition through the analysis period. This case is illustrated by the mid-dle curve in Figure 4.15.
• No annual expenditure, representing a �do-nothing� policy, which results in a decline of network bridge condition through the analysis period. This case is illustrated by the bottom curve in Figure 4.15.
The three scenarios each result in a markedly different result at the end of the 10-year analysis period, and together define an envelope delimiting a range of options in funding bridge preservation. It is possible to plot the condition level at the end of 10 years, as indicated in Figure 4.16, versus the corresponding annual budget or expenditure level. The result is the relationship between condition level and needed expenditure as shown in Figure 4.17.
Figure 4.17 captures the tradeoff between constant expenditure level and resulting long-term condition. This relationship can be used directly as a guide identifying the expen-diture level to meet a specified target condition level. It can also be used to explore long-term trends in network or subsystem condition for different possible funding scenarios, and to discuss these with policy-makers in a proactive way. While this example focuses on bridges, other types of management systems also employ a scenario-testing or similar capability. Collectively, these management systems can address different networks and subsystems of a transportation system using the modified approach. Moreover, these analyses have significant benefit for asset management generally. For example, the curve in Figure 4.17 can be used for a several purposes, including program budget recommen-dations, impact analyses of changes in funding levels, and tradeoff analyses with other programs.
6 Pontis 4.0 is an AASHTOWare product. The network of bridges is assumed to exhibit a uniform
distribution of ages and conditions, and exhibit roughly a linear deterioration in network-level condition for reasons discussed in Appendix B.

NCHRP Project 20-24(11) Task 2 � Asset Management Framework
4-28 Cambridge Systematics, Inc.
Figure 4.15 Example of Budget Scenarios and Effects on Infrastructure Condition
0
20
40
60
80
100
0 1 2 3 4 5 6 7 8 9 10Time (years)
Percent of Bridges with HI >75 Percent
No Additional Expenditures, Do Nothing Policy
Moderate Expenditures, Maintain Status Quo
High Expenditures, Increaseover Status Quo
Figure 4.16 Identification of Points to Be Plotted to Relate Condition and Needed Expenditure
0
20
40
60
80
100
0 1 2 3 4 5 6 7 8 9 10Time (years)
Percent of Bridges with HI >75 Percent
Plot
Plot these endpoints versus
annual budget
Plot

NCHRP Project 20-24(11) Task 2 � Asset Management Framework
Cambridge Systematics, Inc. 4-29
Figure 4.17 Resulting Relationship Between Infrastructure Condition and Needed Expenditure
0
5
10
15
20
25
0 20 40 60 80 100Percent Bridges with HI >75% in 10 years
Relative Budget, $Millions/Year
��������4.6 Concluding Remarks
Section 2.0 established a management framework for asset management as a resource allo-cation and utilization process. As illustrated in Figure 2.2, quality information plays a key role in supporting every step of this process. This section has presented strategies for improving IT support of asset management. Near-term strategies include leveraging an agency�s existing IT capabilities through improvements to legacy systems and databases, and use of scenario testing capabilities in existing systems. Long-term strategies include more substantial integration of systems and data, replacement of existing systems with more comprehensive systems, and development of a single application that provides an integrated view of assets.
Agencies may select among these or other strategies depending upon their current tech-nological capability, overall IT plans, objectives for asset management, and financial and organizational considerations. The following items should be kept in mind in developing an IT strategy for transportation asset management:
• Defining an architecture for databases and systems that support asset management will establish clear guidance on the requirements to be met by each system, and insure that the capabilities of different systems are coordinated and non-duplicative.
• Developing an IT implementation plan that addresses applications related to asset management and that is based on the selected architecture will ensure that improve-ments are made efficiently and that they support one another. The plan should include, among other items, the following:

NCHRP Project 20-24(11) Task 2 � Asset Management Framework
4-30 Cambridge Systematics, Inc.
− Identified legacy system enhancements;
− GIS capabilities and requirements;
− Data storage requirements;
− System integration priorities and considerations; and
− Needs for new system capabilities.
• System integration can provide a broader view of the resource allocation issues and assist in tradeoff analyses across modes and asset types. Nonetheless, asset manage-ment practice can be advanced even with current IT capabilities that are used more effectively. Getting started on asset management can take advantage of short-term strategies, and need not require or await large-scale integration efforts.
• A phased approach to IT enhancements is often feasible. Advantages of a staged approach include reduction in technical and financial risk, availability of results that can be used quickly, and ability to make mid-course corrections as needed.

NCHRP Project 20-24(11) Task 2 � Asset Management Framework
Cambridge Systematics, Inc. 5-1
5.0 Conclusion
This report has described a transportation asset management framework to assist DOTs in conducting a self-evaluation of their asset management practice, and to provide guidelines in identifying potential areas for improvement. The objective of this framework is to pro-vide a conceptual basis for producing a Transportation Asset Management Guide in Phase II of this study. As a strategic approach to managing transportation infrastructure, asset management encompasses a number of important DOT business processes and decisions affecting how its transportation system is built, operated, maintained, rehabilitated, and renewed. Given this breadth of scope, development of the framework has focused on the most important aspects of transportation asset management, taking care to account for the needs of different agencies and various organizational levels. The framework that has resulted provides management guidance in four critical areas:
• Policy goals and objectives, emphasizing a strategic viewpoint, good stewardship of assets, and a proactive DOT role in influencing formulation of policies affecting asset management.
• Planning and programming processes, encouraging consistency with policy goals and objectives, a performance-based approach to planning and program development, systematic evaluation of alternative solutions to problems and needs, and resource allocations based upon a firm understanding of tradeoffs in costs and consequences.
• Program delivery processes, proposing consideration of all available mechanisms of delivering projects and services, the development, use, and communication of quality information on program accomplishments, and efficient and effective delivery of the recommended program.
• Information and analysis, stressing the importance of high-quality information at all stages of asset management, cost-effective data collection and updates, and availability of decision-support tools to support asset management business processes.
In each of these areas, a management structure has been built that identifies the charac-teristics and criteria of good asset management, and provides examples of state-of-the-art practice. These guidelines are organized in a series of matrices developed in Section 3.0. This idealized framework provides a general treatment of asset management, but permits flexibility and adaptability among DOTs that differ in the status of their asset inventory and in their business environment: e.g., policy goals, management philosophy, techno-logical capability, organizational structure, and funding situation. This report has dis-cussed basic concepts to deal with the situation that �one size cannot fit all.� Moreover, the framework permits agencies to adopt an incremental approach in applying asset man-agement guidance, and to focus on specific areas of high priority in near-term implemen-tation. The Transportation Asset Management Guide will bring these ideas together in providing guidance for use by agencies across the country.

NCHRP Project 20-24(11) Task 2 � Asset Management Framework
5-2 Cambridge Systematics, Inc.
The report has also looked at topics that are related to asset management, and that can assist in the effectiveness of its implementation.
The role of quality information is important to asset management in terms of both the cur-rent and projected status of an agency�s asset inventory, and the analysis of options in resource allocation and utilization to manage infrastructure assets well, strategically and tactically. Management systems and databases are a practical necessity in asset manage-ment, and DOTs have already invested significant sums to develop IT capabilities. This report reviews current DOT systems that apply to asset management, and suggests a number of strategies that agencies may consider to update or renew their legacy systems and data as part of their asset management implementation.
There has been much recent interest among DOTs in the financial reporting standards of GASB Statement 34 that now apply to transportation infrastructure. While asset man-agement and GASB 34 are not the same, they are related, and the conduct of one can assist and reinforce the other. Information on how asset management can benefit from GASB 34, and vice versa, is given in Appendix B.

NCHRP Project 20-24(11) Task 2 � Asset Management Framework
Cambridge Systematics, Inc. R-1
References
1. AASHTO Task Force on Transportation Asset Management, Strategic Plan 2000-2010 (December 2000).
2. Governmental Accounting Standards Board, Basic Financial Statements � and Management�s Discussion and Analysis � for State and Local Governments, Statement 34, GS34 (June 1999).
3. Baldrige National Quality Program, National Institute of Standards and Technology, Baldrige National Quality Program Criteria for Performance Excellence, 2000.
4. Carnegie Mellon Software Engineering Institute, Capability Maturity Model (SW-CMM) for Software, summary description from the URL http://www.sei.cmu.edu/ activities/cmm/cmm.sum.html, March 2000.
5. Kaplan, Robert S. and David P. Norton, The Balanced Scorecard: Translating Strategy into Action, Harvard Business School Press, Boston, 1996.
6. Richard W. Shepard and Michael B. Johnson, �California Bridge Health Index,� Proceedings of the 8th International Bridge Management Conference, Denver, Colorado (1999).
7. Edgar P. Small, Terry Philbin, Michael Fraher, and George Romack, �The Current Status of Bridge Management System Implementation in the United States,� Proceedings of the 8th International Bridge Management Conference, Denver, Colorado (1999).
8. Watts Humphrey, Characterizing the Software Process: A Maturity Framework, Technical Report CMU/SEI-87-TR-11, Carnegie-Mellon University Software Engineering Institute (1987).
9. Mark C. Paulk, ed., The Capability Maturity Model: Guidelines for Improving the Software Process, Carnegie Mellon University Software Engineering Institute (1994).
10. Crosby, Philip B., Quality is Free: The Art of Making Quality Certain, McGraw-Hill (1979).
11. Sami Zahran, Software Process Improvement: Practical Guidelines for Business Success, Addison-Wesley (1998).
12. Grady Booch, Object Solutions: Managing the Object-Oriented Project, Addison-Wesley (1996).

NCHRP Project 20-24(11) Task 2 � Asset Management Framework
R-2 Cambridge Systematics, Inc.
13. American Association of State Highway and Transportation Officials, AASHTO Guide for Commonly-Recognized (CoRe) Structural Elements and Smart Flags (1995).
14. Martin Fowler, Analysis Patterns: Reusable Object Models, Addison-Wesley (1997).
15. Ivar Jacobson, The Object Advantage: Business Process Reengineering with Object Technology, Addison-Wesley (1995).
16. Mark Mlynarski and Jay A. Puckett, Bridge Software Validation Guidelines and Examples, NCHRP Project 12-50, unpublished work in progress.
17. Barry W. Boehm, Software Engineering Economics, Prentice-Hall (1981).
18. Mark Lorenz and Jeff Kidd, Object-Oriented Software Metrics, Prentice-Hall (1994).
19. William Perry, Effective Methods for Software Testing, Wiley (1995).
20. Governmental Accounting Standards Board, Guide to Implementation of GASB Statement 34 on Basic Financial Statements � and Management�s Discussion and Analysis � for State and Local Governments: Questions and Answers, GQA34 (April 2000).
21. www.gasb.org, or http://accounting.rutgers.edu/raw/gasb/
22. Federal Highway Administration, Primer: GASB 34, Office of Asset Management (November 2000).

Appendix A

NCHRP Project 20-24(11) Task 2 � Asset Management Framework
Cambridge Systematics, Inc. A-1
Information Systems for Asset Management �A Maturity Model Approach
��������A.1 A Framework for Improvement
Experience in recent years with asset management systems has shown that there is not usually a direct linkage between implementing an asset management system and sud-denly having better asset management. A recent FHWA survey, for example, found that only eight of the 26 states surveyed are actually using the decision-support functionality of their Bridge Management Systems to assist in routine decision-making.(7) Yet nearly all of these states have had BMS software running in their organizations for at least seven years, and nearly all said that they intended to use these tools in the future. Agencies that have not fully implemented their asset management systems frequently cite numerous barriers, including management interest and understanding, data availability, trust in the data, communication among related systems, the need for reports focused on immediate problems of interest, and flexibility.
In fact, few of these barriers are problems that can be solved �once and for all.� Continu-ous technological change, for example, ensures that the quest for communication among systems will never be fully addressed for very long. Turnover of elected officials and management ensures that a set of management reports, no matter how well refined, will soon need to be rewritten in order to stay relevant.
Effective use of technology in asset management is a process, not an end. It is a process of continuous improvement, a process of constantly assessing and incrementally enhancing the quality of information provided to decision-makers.
Process Perspective
Normally, the development of improved asset management systems is a growth process. Just as it is necessary to be able to walk before running, it is necessary to have an asset inventory before collecting condition data, a performance data collection process before calculating performance measures, and management understanding of the system before the results can actually be used in decision-making.
Every organization is unique in its policy concerns, technical resources, and priorities. However, many of the fundamental requirements of asset management are universal. Relying on these fundamental requirements, it is possible to develop an organizing

NCHRP Project 20-24(11) Task 2 � Asset Management Framework
A-2 Cambridge Systematics, Inc.
framework to gauge the agency�s current position � its maturity level in asset manage-ment technology � and its most sensible next steps.
Organizing Framework
An organizing framework for asset management technology improvement is presented here, based on the Carnegie Melon Software Capability Maturity Model (CMM) described in Section 3.0(4,8,9), and on similar earlier efforts such as Crosby�s Quality Management Maturity Grid.(10)
The CMM focused on software development concerns, but the same underlying concepts apply to any technology-based activity, including providing decision-support information to asset management. The framework presented here draws heavily from the thought process behind the CMM and uses some of the same terminology, which should be famil-iar to information technology managers.
The usefulness of this organizing framework stems from its ability to structure process planning and management, to ensure that all the bases are covered and that implementa-tion steps are taken in a reasonable order that does not waste time or money. The frame-work is directed first toward senior management, to help them initiate the process and know what to expect over time. The framework is also directed toward the professional staff, to help them understand how all the activities fit together, and how they all contrib-ute toward the goal of improved information for asset management decision-making. Several major elements are necessary in order for the framework to be complete:
• A maturity scale, to describe the general order of events in a way that allows each organization to reliably locate its current position and next steps. The maturity scale is necessarily based on a critical path-style order of precedence that is common to all transportation agencies. For example, management use of policy optimization infor-mation cannot occur without first implementing software to produce that information, which cannot occur without an established method for measuring performance, which cannot occur without first collecting and storing condition and performance data in a database. The maturity scale is emphatically not a value judgment: it does not sepa-rate �good� organizations from �bad� ones. Every agency is on a journey toward improved asset management, and the maturity scale merely provides the �you are here� marker on a map of that journey.
• An application catalog, listing the many types of information systems and related technologies that may be of service to asset management. The catalog includes both existing and new systems. Many older information systems can � often must � be relied upon in an asset management strategy in both the short and long terms. Usually each type of information system has a well-defined place on the maturity scale: one system must be in place before another one can be implemented. Also, each organiza-tion has its own unique technology needs depending, for example, on its size, the types of existing systems in place, its management style, and its position on the maturity scale. The catalog is organized according to essential asset management business proc-esses, but many alternatives are available in each category.

NCHRP Project 20-24(11) Task 2 � Asset Management Framework
Cambridge Systematics, Inc. A-3
• Data interfaces, allowing data to be collected reliably, to move from one system to another, to be reused for many purposes, and to be universally understood. Incom-patibility of data interfaces is frequently cited as the most common technical cause of an inability to relate data among existing asset management systems. This part of the framework establishes the categories of data requirements that are practically universal in asset management: definitions and assumptions, referencing, accuracy, precision, timeliness, coverage, granularity, and aggregation. It also provides a list of questions to ask and typical solutions to data problems.
• Process interfaces, referring specifically to the business processes for feeding, main-taining, and accessing information systems. This section describes all the work that needs to be done to set up, maintain, and support information systems in the service of asset management. The issues to be addressed include workflow coordination, nego-tiation of data standards, technical support services, training, quality assurance, quality control, and public information. The discussion does not cover software development or procurement, which are covered very well in other sources.(11,12) It emphasizes the types of business processes that are relatively unique to asset management and might not be present in an organization that does not need asset management.
• Technology infrastructure, the background databases, systems, and networks that move data around the organization and serve it up reliably to each system user. Asset management imposes certain requirements on the technical infrastructure that often do not exist in other applications: for example, network-level asset analysis software usu-ally needs very high network bandwidth and �number-crunching horsepower,� even more than engineering design software or CADD systems. Certain relatively new technologies in the areas of networking (especially the Internet), databases, geographic information systems, and component-based software are especially useful in asset management, and deserve consideration in any new system development efforts.
The technology dimensions of applications, data interfaces, process interfaces, and infra-structure can each have their own maturity scales, as indicated in Figure A.1. An organi-zation can be in different places on each scale, though the differences in position among scales are not usually very large because of the interdependencies among the scales. To assess the agency�s location on each scale, several important considerations are relevant:

NCHRP Project 20-24(11) Task 2 � Asset Management Framework
A-4 Cambridge Systematics, Inc.
Figure A.1 Maturity Scales for Information Technology in Asset Management
Initial Awakening Organized Managed Optimizing
Overall �
Use of Applications �
Data Interfaces �
Process Interfaces �
Technology Infrastructure �
• Application Types � The existence and types of systems to support each major asset management business process reflect its maturity. For example, the existence of policy optimization software is associated with a more mature organization than is project-level sorting and ranking. For the purposes of this framework, the �existence� of a system means that the software is installed, a working database for it is populated, and the software is actually used by decision-makers to some extent.
• Implementation Depth � This is the degree to which the applications are actually relied upon for their intended purposes. Assessing the agency�s position on this scale depends on objective evidence. For example, seeing pavement management system-derived reports in handout materials provided to a legislative committee is more advanced than merely having a pavement management system installed on agency computers.
• Attitude � Most of the discussion in this report presupposes that an organization wants to know its current status in asset management, recognizes that it always can improve (no matter how good it already is), and wants to do so. The first maturity level is char-acterized by a situation in which improved asset management is not perceived as a strong need and is not a part of the management agenda. Not only can an agency at the highest maturity level continue to improve its asset management processes, but it must do so, since continuous improvement is a requirement of that maturity level. A positive attitude toward process quality must exist at all levels of the organization, top to bottom.
• Communication � Since asset management is an interdisciplinary process involving the coordinated activity of many parts of the organization, the information systems owe much of their value to their ability to act as a communications medium. Asset man-agement systems translate among engineering, planning, and economic perspectives: for example, they translate bridge condition data into management information on the costs and benefits of bridge repair actions. They keep central and district offices equally informed on the status of the inventory and on projects underway. They

NCHRP Project 20-24(11) Task 2 � Asset Management Framework
Cambridge Systematics, Inc. A-5
coordinate the information flows needed in program and resource planning. In a mature process, the technology helps all involved units of the agency to have a common understanding of current inventory health, needs, problems, and initiatives.
• Measurement � To manage asset management information systems as a process, it is extremely important to have reliable knowledge of the full cost of the technology, its effectiveness in enhancing program delivery, asset performance, and customer satis-faction. Methods to measure the cost and effectiveness of technology are covered in depth in Section A.4.
• Efficiency � Asset management systems should promote productivity in the use of scarce resources. This includes efficiency in the use and maintenance of transportation assets, as well as economical use of staff and data in the asset management process. Issues of special interest include the extent of data sharing and the automation of data collection.
• Training � Asset management information systems are a specialized breed, using con-cepts from engineering, economics, and statistics that are sometimes unfamiliar to transportation agency management and staff. An essential part of process improve-ment is recognition of the importance of staff training, and investing the necessary time and money at all levels for continuing education.
• Currency � This is the extent to which the asset management technology base is kept useful to serve current needs. Management needs and technology advancements should be assessed on a continuing basis, and systems should be updated accordingly, in a timely way. It does not necessarily mean large investments in new technology unless such investments are justified, on a cost/benefit basis, by management needs, and are consistent with available resources.
• Planning � Related to currency, planning for asset management information systems involves anticipating management needs before they become acute, allowing enough time for system procurement or development. A mature planning process takes a pro-active approach, advancing new initiatives off-line rather than in a fire-fighting style.
These considerations cut across all of the technology dimensions. Using this framework, an organization can find its current location on each dimension, which will then indicate the most appropriate next steps for advancement. See Figure A.2.
Given this comprehensive picture of what it takes to have effective information systems supporting asset management, it is natural to wonder whether upward movement on the maturity scale is expensive. The answer, of course, is that any new initiative worth doing costs money, and must find its proper place in the competition with other priorities. However, because the framework focuses on process design, rather than on procurement or development of new systems, each organization has great flexibility to choose an appropriate level of investment. This can be adjusted over time, as the agency develops a better understanding of the full costs of technology improvement, and the associated benefits.

NCHRP Project 20-24(11) Task 2 � Asset Management Framework
A-6 Cambridge Systematics, Inc.
Figure A.2 Overall Framework
��������A.2 Maturity Scale
A maturity scale is a convenient, linear way of describing the complex evolution of a busi-ness process over time. It assumes that organizations want to improve the way they do business, and provides an organized way of identifying the business� current evolutionary stage and where it might feasibly evolve next. Every organization can locate its current status at some point on the maturity scale, just as any person can recite his age. Similarly, there is no implied value judgment, just as there is no meaningful way to say that child-hood is �bad� and adulthood is �good.� Every organization must pass through the early maturity stages in order to reach the later ones. Unlike birthdays, however, advancement along the maturity scale is not automatic: it is a goal that must be actively pursued, and inaction can cause movement in the opposite direction.
Most emphatically, the unrelenting advance of technology in no way changes an organi-zation�s maturity in its use of that technology. The problems and solutions here can occur with any kind of technology: they are human and organizational, not technological.
Maturity Means Being Well-Informed
An essential ingredient of all the process quality literature is that the costs and impacts of improvements must be well understood. Senior managers need to establish specific
Overall
Use of applications
Data interfaces
Process interfaces
Technology infrastructure
Initial Awakening Organized Managed Optimized
�
�
�
�
�
Application types
Implementation depth
Attitude
Communication
Measurement
Efficiency
Training
Currency
Planning
Optimizing
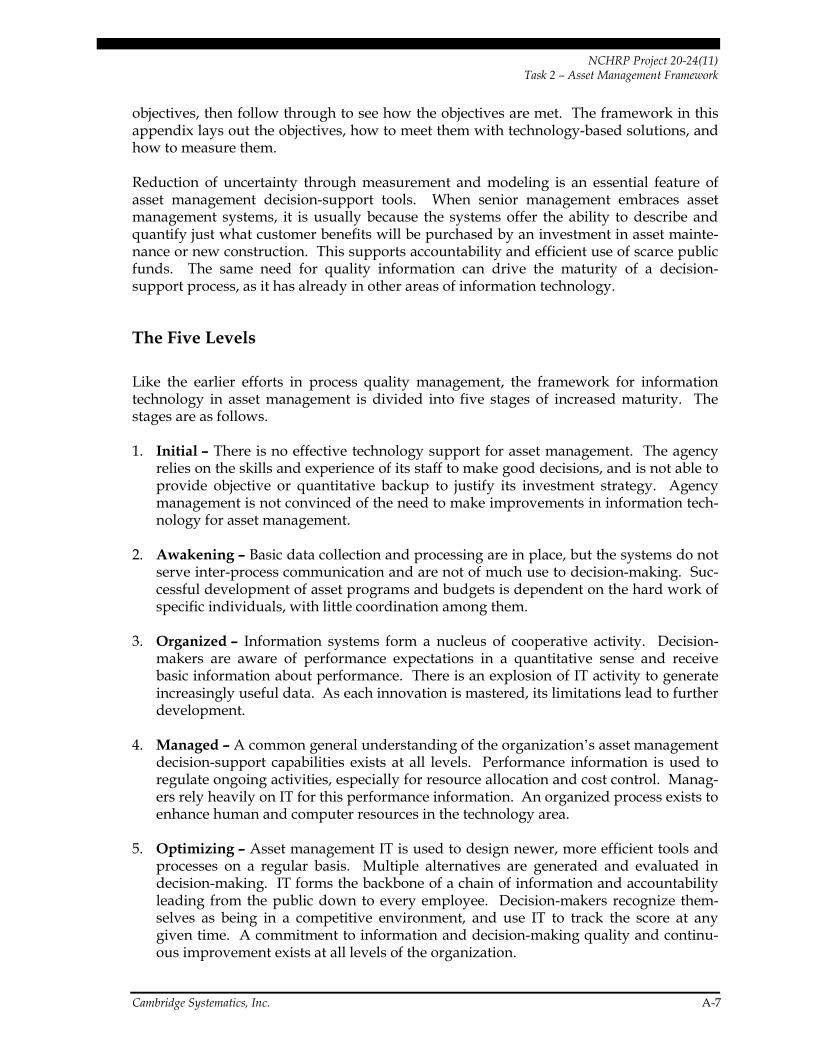
NCHRP Project 20-24(11) Task 2 � Asset Management Framework
Cambridge Systematics, Inc. A-7
objectives, then follow through to see how the objectives are met. The framework in this appendix lays out the objectives, how to meet them with technology-based solutions, and how to measure them.
Reduction of uncertainty through measurement and modeling is an essential feature of asset management decision-support tools. When senior management embraces asset management systems, it is usually because the systems offer the ability to describe and quantify just what customer benefits will be purchased by an investment in asset mainte-nance or new construction. This supports accountability and efficient use of scarce public funds. The same need for quality information can drive the maturity of a decision-support process, as it has already in other areas of information technology.
The Five Levels
Like the earlier efforts in process quality management, the framework for information technology in asset management is divided into five stages of increased maturity. The stages are as follows.
1. Initial � There is no effective technology support for asset management. The agency relies on the skills and experience of its staff to make good decisions, and is not able to provide objective or quantitative backup to justify its investment strategy. Agency management is not convinced of the need to make improvements in information tech-nology for asset management.
2. Awakening � Basic data collection and processing are in place, but the systems do not serve inter-process communication and are not of much use to decision-making. Suc-cessful development of asset programs and budgets is dependent on the hard work of specific individuals, with little coordination among them.
3. Organized � Information systems form a nucleus of cooperative activity. Decision-makers are aware of performance expectations in a quantitative sense and receive basic information about performance. There is an explosion of IT activity to generate increasingly useful data. As each innovation is mastered, its limitations lead to further development.
4. Managed � A common general understanding of the organization�s asset management decision-support capabilities exists at all levels. Performance information is used to regulate ongoing activities, especially for resource allocation and cost control. Manag-ers rely heavily on IT for this performance information. An organized process exists to enhance human and computer resources in the technology area.
5. Optimizing � Asset management IT is used to design newer, more efficient tools and processes on a regular basis. Multiple alternatives are generated and evaluated in decision-making. IT forms the backbone of a chain of information and accountability leading from the public down to every employee. Decision-makers recognize them-selves as being in a competitive environment, and use IT to track the score at any given time. A commitment to information and decision-making quality and continu-ous improvement exists at all levels of the organization.

NCHRP Project 20-24(11) Task 2 � Asset Management Framework
A-8 Cambridge Systematics, Inc.
Table A.1 provides a detailed outline of each maturity level. Since these are broad-brush characterizations made up of numerous specific criteria, each organization will see itself at more than one level. This is normal and useful. Generally the overall level of the agency will be apparent, and the areas where a lower level might be more accurate represent fruitful opportunities for advancement. The overall transition from one level to the next happens gradually, with activity on many fronts, each with its own timetable.
Table A.1 Overall Maturity Scale for Asset Management Information Systems
1 � Initial 2 � Awakening 3 � Organized 4 � Managed 5 � Optimizing
Application types
No use of decision-support tools
Basic data col-lection and reporting
Basic �what-if� analysis, ranking by condition indicators
Performance information used for evalua-tion, priority-setting and resource allocation
Optimization tools widely used, every decision-maker has a suitable application
Implementation depth
Management at all levels unaware or adverse
Complete reli-ance on individ-ual effort, some experimentation with organizing frameworks that are not imple-mented
Management commits resources and assigns responsibilities, performance measurement, geographic ref-erencing, and data frameworks are developed
Useful appli-cations are developed and deployed, adhering to the frameworks
Decision-makers routinely use their applica-tions and make adjustments based on feedback
Attitude No perception of need to improve technology
Awareness of the possibility of improvement, grass-roots efforts
Curiosity, some frustration with information quality and cost, information seen as valuable for securing budget approvals.
Decision-makers rely on IT, demand that systems be kept up-to-date
Employees fol-low performance data regularly, units compete with each other based on per-formance accom-plishments
Communication Unreliable Printed reports passed around manually, recoded and re-entered to share data in rare cases
Ad hoc auto-mated sharing of data in selected cases
Common gen-eral under-standing of asset management capabilities at all levels, widespread data-sharing
Internal and external com-munications are well-organized, professional-quality, drawing data from any systems needed

NCHRP Project 20-24(11) Task 2 � Asset Management Framework
Cambridge Systematics, Inc. A-9
Table A.1 Overall Maturity Scale for Asset Management Information Systems (continued)
1 � Initial 2 � Awakening 3 � Organized 4 � Managed 5 � Optimizing
Measurement None Some recording of work accom-plishment
Verification of deterioration, accomplishment, and cost data
Reliable, verified estimates of costs and project outcomes. Per-formance data used to guide agency activities
Cost and per-formance data are used to design and optimize sys-tems, employees at all levels find ways to improve performance
Efficiency Information very expensive
Certain types of inventory and condition reports easy to get
More reports are readily available, but large invest-ment in IT with uncertain costs and benefits
Cost controls at the project man-agement level are in place
New system initiatives to reduce data collection and processing costs, increase reliabil-ity and security
Training None Allowed for certain urgently needed skills
Numerous small internal training efforts, more demand for external training
Internal and external training are routinely budgeted to adequate levels
Feedback from training is used to steadily improve courses
Currency Management needs unmet
A recognition of information needs, but each decision-maker fends for himself
Demand for information growing much faster than supply
Process assessment repeated periodically, management needs met in a timely way
Decision-makers redesign their parts of the process to streamline and improve performance
Planning Purely fire-fighting
Limited to one-person efforts
Explosion of initiatives, beyond available resources
Formal process is in place to select, budget, and program IT initiatives
An organized effort in place to identify improvement opportunities and redesign existing systems as needed
Each of these five levels takes time to emerge. It is impossible, for example, to advance from level 2 to level 5 by a single software development project, no matter how much money is spent. The speediest advancement is accomplished by a choreographed set of smaller initiatives, with the speed maximized only by making sure none of the required ingredients is allowed to languish. This is a management challenge, but a feasible and rewarding one, for any transportation agency.

NCHRP Project 20-24(11) Task 2 � Asset Management Framework
A-10 Cambridge Systematics, Inc.
��������A.3 Elements of Asset Management Information Technology
Founded as it is on the availability and use of consistent, objective information, asset man-agement depends on the use of appropriate technology and business processes to deliver the information to decision-makers. Naturally, all managers want the information in a useful and understandable format, focused on the decision-maker�s immediate needs, at the right level of detail and quality, quickly. While these desires are universal, the most cost-effective way to carry them out differs from one organization to another.
Moreover, the well-known asset management applications such as pavement and bridge management systems, are just the tip of an iceberg of technology that must exist in order to deliver the required information. Figure A.3 depicts the entire iceberg. The structure of this diagram is important because it reflects not only different types of underlying tech-nology, but also different market structures for providing that technology. Applications, for example, are the software on decision-makers� desktops, have strong user interfaces, and contain the business logic of the system. Since asset management applications so far have primarily been developed and used by engineers, they have a strong engineering content. For the same reason, applications are very specialized. Since much of the data collected in the field are interpreted and entered by professionals with decision-making needs, the data collection systems are also considered applications.
The remaining three parts of Figure A.3 can be conceptualized as the glue holding the applications together. They move data among providers and consumers, including from data collection staff to decision-makers, and from one decision-maker to another. Because of this major role of connecting applications together, they are called interfaces.
• Data interfaces, the standards and conventions for defining and referencing data, are highly agency-specific and are normally developed in-house by negotiation. In the absence of a specific process for establishing data standards, they are still defined by default in a very agency-specific way by means of the combination of application pur-chasing decisions that the agency has made.
• Process interfaces are the set of human (as opposed to technological) activities which are necessary to make effective use of the applications. These include, for example, definition of which business processes will provide inputs to and use outputs from the various systems, and ensuring that staff have the necessary training and support to use the systems.
• Technology infrastructure is the set of shared hardware and software that enables integration across applications, and provides economies of scale for system develop-ment, maintenance and support. The economic aspect of this is important to keep in mind, because all of the components of this infrastructure have non-technology alternatives. For example, shared databases can be replaced by ad hoc copying and transformation of data from one application to another, and computer networks can be replaced by diskettes (�sneaker net�). Any benefit-cost analysis of IT investments in this area can include a comparison to default non-technology solutions.

NCHRP Project 20-24(11) Task 2 � Asset Management Framework
Cambridge Systematics, Inc. A-11
Figure A.3 Elements of Asset Management Information Technology
Even though applications are the business end of the iceberg, the underlying components make much of the difference between an application that is well used, and one that sits on the shelf. Although the cost of delivering data to the applications is certainly one consid-eration, often a more compelling consideration is the speed and reliability with which the data are delivered. These translate into usability and management trust in the application.
Application Catalog
Asset management IT applications are discussed below according to the following six key asset management business processes that they would serve:
ApplicationsInventoriesData collection systemsPavement needsBridge needsMaintenance needsPavement policyBridge policy
Maintenance policyLong-range planningPrioritizationBudgetingResource allocationWork recordingEffectiveness evaluation
DataInterfaces
ProcessInterfaces
TechnologyInfrastructure
PerformanceMeasures
ReferencingSystems
DatabaseRelationships
WorkflowCoordination
StandardsNegotiation
TechnicalSupport
Training
QualityAssurance
PublicInformation
Databases
DataInterchangeStandards
GeographicInformationSystems
SharedHardware
& Networks
SharedSoftware

NCHRP Project 20-24(11) Task 2 � Asset Management Framework
A-12 Cambridge Systematics, Inc.
• Performance Data Collection;
• Planning and Policy Development;
• Project Identification and Analysis;
• Project Prioritization;
• Budgeting and Resource Allocation; and
• Program Implementation and Effectiveness Evaluation.
Each of these business processes is associated with different user groups, and each has a distinct set of inputs and outputs. While some applications can (and typically do) serve more than one of these processes, application functionality can be delivered to each user group by different, unrelated applications, as long as the underlying interfaces do their job of supporting communication.
One of the important lessons that has been learned about information systems to date is that it is difficult to develop a single application that effectively serves multiple functions and user groups. Rather than attempting to put into place a system that is �all things to all people,� it is often more effective to have a set of smaller systems geared to supporting specific business processes but tied together with data interfaces, process interfaces, and a common technology infrastructure. As organizations move further up the maturity scale, they establish stronger capabilities for implementing and managing these interfaces.
Performance Data Collection
The performance data collection process is concerned with collecting information on asset characteristics, condition and performance, and making this information available to other related business processes (e.g., project identification and evaluation). Applications to support performance data collection have historically been an integral part of applications for needs identification � for example, pavement condition surveys focused exclusively on the data needed to identify project-level needs, and data entry and needs analysis occurred in the same application system.
As the industry has evolved, data collection approaches have emerged which involve col-lection and processing of a wide range of data serving the needs of multiple applications and business processes as part of a single effort. An individual survey effort can yield, for example, compilation of network-level performance data, logging roadside facilities, and noting drainage and other roadside problems. Viewing Performance Monitoring as a separate function can increase the cost-effectiveness of data collection efforts, and facili-tates an integrated view across asset types and activities. The challenge is to ensure that monitoring activities effectively serve multiple business functions. Examples of opportu-nities for economies of scale include:
• Using a pavement condition survey vehicle to collect any other useful data that can be gathered in the same pass;
• Using a customer satisfaction survey to inform a wide range of asset management functions;

NCHRP Project 20-24(11) Task 2 � Asset Management Framework
Cambridge Systematics, Inc. A-13
• Using accident data to gather certain road user data, such as vehicle occupancy, speed, and alcohol use;
• Using ultrasonic crack detection equipment not only for bridges, but also for light and signal poles and other non-bridge structures;
• Using a bridge inspection process to collect data needed for bridge load rating; and
• Collecting traffic count data at locations that are useful for multiple asset management purposes.
Important technology infrastructure elements that have enabled an integrated approach to performance monitoring include adoption of GIS and GPS technologies, implementation of integrated databases and data warehouses, and new data collection technologies employing vehicles which can collect a variety of video and sensor-based information simultaneously.
Data interfaces are also a key to successful implementation of integrated and cost-effective performance monitoring efforts. Examples of data interface conventions that an agency can use are:
• AASHTO CoRe elements for bridges;(13)
• U.S. DOT/FHWA National Bridge Inventory;
• International Road Roughness Index;
• AASHTO Commonly Recognized Maintenance Elements (currently under development);
• Federal Transit Administration Section 15 Reporting System;
• Agency-specific definitions of raw performance measures;
• Agency-wide conventions for economic inflation and discounting assumptions;
• Geographic referencing conventions; and
• Asset identification schemes, such as identification numbers, and bar coding.
Because of the expense of data collection, organizations are sometimes reluctant to take on new initiatives that improve the extent and quality of data on system performance. Use of standardized data interface conventions and an agency-wide view which capitalizes on opportunities to achieve economies of scale can significantly improve the return on data collection investment.
Project Identification and Evaluation
Project identification and evaluation is a process in which a given asset (e.g., bridge, pavement section) is analyzed to determine what, if any, action should be taken to main-tain or improve its performance. At the most basic level, this activity is done based on engineering judgment or rules of thumb. However, a number of IT and analytical tools can be applied to:

NCHRP Project 20-24(11) Task 2 � Asset Management Framework
A-14 Cambridge Systematics, Inc.
• Easily assemble information on asset characteristics, performance, and use.
• Identify pipeline projects which have implications for definition and scheduling of new work.
• Identify relevant subarea or corridor plans.
• Review past projects and maintenance activities in order to better understand under-lying problems.
• Review past deterioration patterns (for this location, and for this category of asset).
• Predict likely future deterioration patterns.
• Identify and screen a set of appropriate treatments.
• Automatically determine if a facility satisfies an agency�s warrants for taking action.
• Generate reasonable project cost estimates using standard unit costs.
• Conduct a basic life-cycle cost analysis � using discounted cash flow to summarize the future agency costs that may occur. This is used to compare alternative definitions of the project, including do nothing.
• Conduct advanced life-cycle cost analysis, incorporating non-agency costs such as travel time, safety, and air quality.
• Conduct an optimization analysis, which generates a large number of alternative defi-nitions of the project to determine which one minimizes life-cycle costs or maximizes benefits.
• Assist in project design � automated procedures, worksheets and checklists, to help the engineer define the scope of the project. These help to ensure that all design standards are met, and that required scope elements such as safety features are included.
To the extent that these techniques are actually integrated into decision-making, they rep-resent increasing levels of maturity. The least mature organizations might rely on rules of thumb based on expert judgment. The more mature organizations will have been involved in creating their own more advanced techniques and regard them as a conven-ient, objective way to consider many important factors when selecting from among many alternatives.
The use of more advanced techniques does not in any way make the less advanced tech-niques less useful. An agency using optimization techniques, for example, still needs a reliable cost estimation capability. The converse, however, is true: an optimization capa-bility is not very useful unless reliable cost estimation and scoping methods have already been established.

NCHRP Project 20-24(11) Task 2 � Asset Management Framework
Cambridge Systematics, Inc. A-15
Pavement and bridge management systems are the best-known project identification tools, owing much of their success to the ability to summarize current engineering research and the agency�s cost experience into practical methods to define, estimate, and select projects. The credibility of these systems depend to a great extent on an agency�s ability to develop quality inputs such deterioration rates, costs, and economic parameters. Many agencies have asset management systems sitting on the shelf because management does not have confidence in the underlying cost data used to estimate needs.
Having management system tools that are useful also depends on several supporting pro??cesses within an organization. The data collection process for inventory and condition data may be most obvious, but processes for developing other types of data are also important. For example:
• Nearly all facility management systems require traffic data, so traffic data collection procedures must be defined in a way that provides the necessary coverage.
• Most management systems require safety data in some form, either actual accident data or some way of representing the safety implications of project selection decisions.
• Since safety and traffic data are not limited to specific facility types, and since many transportation agencies developed data collection procedures for traffic and safety before asset management systems even existed, the organization often needs a process for converting data from the older systems into a form that can be accessed in the newer management systems. A process for geographic referencing and conversion is therefore needed.
• The project development process requires reliable cost estimation models, but normally cannot produce them. Therefore, another part of the organization must take on this responsibility, usually by analyzing maintenance management data and bid tabula-tions. Agencies lacking this capability have great difficulty advancing to any higher level of maturity in their asset management processes.
• The output of the project identification process is information, intended to flow into priority-setting, planning, and budgeting processes downstream. For this flow to occur, the organization needs various standards and conventions for performance measures, costing parameters, economic assumptions, traffic growth assumptions, facility identification, and workflow coordination. Usually these standards need to be negotiated, and they evolve over time. A well-understood process for negotiating and maintaining the standards is essential.
So again, just as was the case in Performance Monitoring, project identification and evaluation is not an island, but is connected to many other applications by many neces-sary linkages. The need for these linkages exists regardless of the technology chosen to assist the analysis.
Planning and Policy Development
Planning and Policy development is concerned with establishing a strategic framework of goals and objectives, performance measures and standards (which can be at the statewide,

NCHRP Project 20-24(11) Task 2 � Asset Management Framework
A-16 Cambridge Systematics, Inc.
subarea, corridor and subnetwork level). As defined here, it also encompasses develop-ment of long-range strategies such as major facilities or service expansion, coordinated programs of corridor or subarea improvements, asset maintenance or replacement inter-vals or criteria, and new technology investments. Planning and policy development is performed within a political and regulatory context, and must be cognizant of and responsive to the needs of the agency�s customers. Approaches vary widely among agen-cies, and technological support tools also differ.
The effectiveness of a policy analysis tool can be judged based on its ability to inform decision-makers of how the performance of a specific facility, class of facilities, or the transportation system as a whole, might be affected by a given strategy under considera-tion. The information requires a context in order to be useful, and that context is a defini-tion of performance expectations that the decision-maker shares with his co-workers, the organization, and the public. A policy analysis tool must therefore, at a minimum, be able to calculate performance measures according to agreed-upon definitions, in a way that is sensitive to the characteristics of the policy being analyzed.
The existence of performance expectations is necessary in order to get past even the first maturity level of policy decision support. Many organizations have asset management policy optimization tools in their possession that offer no useful functionality because their users do not have a context of performance goals or an agreed-upon way of expressing changes in performance.
Beyond this basic functional requirement, a policy analysis tool is most useful if it is sen-sitive to a reasonably wide range of policy scenarios and assumptions, if it uses data that are readily available, if it is fast and responsive in adapting to new inputs, and if it expresses its outputs in a form that communicates the results clearly to others.
In the current state-of-the-practice, asset management systems typically offer policy analy-sis functionality in the same application as needs identification. From a software devel-oper�s standpoint this is reasonable, because one way of estimating the outcome of a policy is to simulate the project-level decision-making process that results from that pol-icy. Thus, the needs identification algorithms are reused in the policy analysis. This approach has its limitations, however, because the people making the policy decisions are often not the same people who make project-level decisions. For policy-makers in many agencies, an analysis tool based on project-level needs identification is too detailed and data hungry to be useful. Also, for certain types of applications in maintenance manage-ment, no project-level needs identification tool exists upon which a network-level analysis can be based.
A small number of pavement and bridge management systems have addressed this issue by clearly separating the policy analysis from needs identification, even using separate, unrelated models for the two purposes. This allows the two groups, policy developers and project engineers, to mature at their own separate rates. When this approach is fol-lowed, the separate applications still must be connected by common definitions of per-formance measures; common definitions of facility inventory components, conditions, and actions; and usually by shared data.

NCHRP Project 20-24(11) Task 2 � Asset Management Framework
Cambridge Systematics, Inc. A-17
When policy analysis tools are closely wedded to project development tools, the agency must reach a sufficient maturity level with the project-level tools before it can even start to use the policy support. In that case the policy analysis relies on certain assumptions about the project-level process, and the policy decision-maker needs to have confidence that these assumptions are valid. An alternative approach is to develop the two types of tools separately, linked only by common standards. In this case, if the policy analyst is unsure of his project development assumptions, he can investigate alternative or simplified assumptions to get the information he needs.
Optimization is considered to be a mature form of policy analysis, when used in an appropriate fashion. Organizations lacking confidence in their decision-making processes and support tools tend to shy away from optimization, regarding it as an artificial or unaccountable way of making decisions. In practice, organizations that successfully employ optimization have confidence in their decision-support tools and decision-making processes. They view optimization not as a substitute for decision-making, but a way to make decision-making more reliable by considering more alternatives within the same objective framework they would have used anyway.
Organizations that do not yet have a well-established project-level needs identification process in place and do not wish to use optimization still have some good alternatives available. The only essential ingredients are a framework for evaluating performance, sources for the necessary data, and necessary technical skills, such as in statistics. With these alone, the analyst can use off-the-shelf software tools and techniques such as spread-sheets and statistical modeling tools to develop useful and compelling policy analyses.
Project Prioritization
Prioritization is the essential process where project-level needs are reconciled with net-work-level resource constraints and performance goals. The tension between needs and resources is universal, influencing all other parts of asset management. Technology sup-porting asset management should communicate relevant priority-related information to and from all the other processes.
Priority-setting and resource allocation interact strongly with each other, representing a potentially high bandwidth of communication. However, these are not combined into a single application because often they are performed by different people. Priority-setting in many agencies is done wholly or partially by district administrators, while capital budgeting is more frequently done in a headquarters office. Priority-setting is relatively fluid during parts of the year when future funding levels are unknown This means decision-support tools have to be sensitive to alternative funding levels. The uncertainty of budget constraints, as well as uncertainty regarding project readiness, is why priority-setting is frequently regarded as a sorting or ranking process rather than a simple go/no go decision.
Decision-support tools for priority setting, at their best, combine all relevant asset types and project activity types in a common framework where they compete for scarce resources based on common performance measures. However, this vision has not often been implemented in practice, so far. To make this a reality, there must be an agreed-upon performance measurement framework, and standardized project definition

NCHRP Project 20-24(11) Task 2 � Asset Management Framework
A-18 Cambridge Systematics, Inc.
assumptions covering scoping and costing. Also required is a common system for identifying and locating assets, a common activity identification scheme, and the neces-sary technology infrastructure to bring the relevant data together on demand, since many of the inputs are under constant change.
The same engineering specialization that has fostered rapidly advancing techniques of project-level needs identification, has erected barriers to network-level prioritization, budgeting, and resource allocation. This result has arisen because the agencies and devel-opers responsible for the excellent project-level tools have not yet invested in the shared resources of data interfaces, process interfaces, and technology infrastructure that make it possible to pull data from these systems to serve outside applications.
Many pavement and bridge management systems contain priority-setting algorithms, which are in use in some agencies for ranking projects within fairly narrowly defined categories. Although these tools are in many cases quite advanced, they are of limited use for the agency-wide prioritization decision-support needs of organizations. This is because each management system has its own internal scheme for measuring perform-ance, and its own needs identification logic that is incompatible with the other systems. Also, many of the systems lack flexibility to adapt to an organization�s chosen perform-ance measurement framework or costing assumptions.
What is needed by many organizations, but does not exist so far, is a separate priority-setting support application that draws data as needed from other systems, such as pave-ment and bridge management, but translates it into a common agency-wide performance and cost framework so projects can compete on a level playing field. Such a system would also need to allow the separate entry of projects and programs not generated by any other management system but competing for the same pot of money. Such an application could be quite simple, such as a spreadsheet, or could be a more specialized product. The diffi-cult aspect of it is the need to adapt to the structure of each contributing system that the agency has in place.
Budgeting and Resource Allocation
In most transportation agencies, budgeting is a negotiated process with legislative com-mittees and other outside parties that supply funding for infrastructure investments. (A few agencies have dedicated tax funding, which reduces budgeting uncertainties consid-erably but calls for a similar type of decision support, focused on resource allocation.) Because it is usually a negotiated process, the outcome of budgeting is not known in advance, but unfolds over the year. The most mature organizations have established a constructive relationship with funding bodies, often by being very responsive to requests for information that allow the funding bodies to do their work efficiently. The most important type of information is tradeoff analysis, or �bang for the buck.� The operative questions is, how much additional performance can the agency provide, if it is given a certain amount of additional funding, or if the funds were allocated differently?
The answer to this question is closely tied to the priority-setting process. Any decision-support tool for budgeting would need access to the same list of projects or needs as was used in priority-setting, and must incorporate the same performance and cost framework. An effective decision-support tool should express the benefits of each project in a common

NCHRP Project 20-24(11) Task 2 � Asset Management Framework
Cambridge Systematics, Inc. A-19
way based on a performance measurement framework. In addition, such a system would need superior communication tools, such as mapping, images, and statistical graphics, to communicate the tradeoffs effectively to the layman.
Like the priority tool, a decision-support application for budgeting and resource allocation would not be technically complex if it is built on the same shared interfaces that have already been shown to be needed for other parts of asset management. The tool could easily be a spreadsheet. The difficult part is establishing the standards and conventions that allow the results of other business processes to brought together in this way.
Program Implementation and Effectiveness Evaluation
It is often unrecognized that program implementation, the actual design and construction of facilities, is not only a major output of a transportation agency but also a major input of the asset management process. Recording of work accomplishments and tracking of costs is essential to a credible forward-looking set of asset management decision-support tools. Although most organizations collect some form of work accomplishment data, often in an accounting, contract management, or maintenance management system, the data are often unusable for asset management. Many times the deficiencies are trivial and have a rea-sonable cost to correct. For example, many agencies fail to record bridge identifiers on their records of bridge maintenance work, making it impossible to associate the work with past and subsequent condition data. This problem can readily be solved if management is willing, through the use of Global Positioning System devices in state vehicles, and suit-able language in maintenance contracts.
Usually the basic requirement asset management imposes on financial management sys-tems is a simple description of the work that was done, and the resources that were used � labor, materials, equipment, and contract costs. A separate process of cost accounting must be applied in order to determine the actual economic cost of the work in a form compatible with future planning. In agencies that have mature processes for this, a staff of two to five people typically use a large collection of spreadsheets and other simple pro-grams to estimate unit costs expressed in relation to planning quantities. These simple programs are, in the best cases, fed periodically with data by a downloading process from contract management or maintenance management systems. In the worst of cases, the data may have to be manually entered from printed reports, sometimes on a sampled basis.
Many agencies are reluctant to tinker with large, often ancient financial management sys-tems, but gathering reliable work accomplishment data is essential to advancement of an asset management process. Graduation from the second to the third maturity level, where asset management is able to function in an organized, cohesive way because of its infor-mation systems, cannot happen unless management has confidence in the cost estimates produced by the needs identification process. Lacking this confidence, resources will not be committed to advance any further. Many transportation agencies are knocking at this door today, and need to make the commitment to overcome this difficult hurdle to make further progress.

NCHRP Project 20-24(11) Task 2 � Asset Management Framework
A-20 Cambridge Systematics, Inc.
A Tinker-Toy Model of Asset Management Systems
The Application Catalog demonstrates that in many cases, management systems can offer more to asset management decision support by offering less. That is, it is not necessary for each management system to build in multiple applications and hard-wire a set of per-formance measures, asset identification schemes, and other shared data. The systems can be simpler and more flexible if the organization itself provides the glue to hold the appli-cations together into a cohesive asset management system.
When agencies have met with success in asset management IT, this is in fact the approach they have often taken. It is true that many organizations are not using the priority-setting and budgeting features of their pavement and bridge management systems, but many of these agencies do, in fact, have IT support for these processes. A common approach is to extract project-level needs identification or condition data from an existing, operational off-the-shelf pavement or bridge management system, develop performance measures outside the system that are compatible with the agency�s own preferences, and then com-bine these results with those derived from other systems into a common framework. The common framework may be a sorting or tracking system for program development, or it may be a geographic information system. So these agencies have not abandoned their off-the-shelf packages, but have simply put to use the parts of these systems they find useful, and have ignored the rest.
It is helpful, therefore, to think of an asset management system not as one big, monolithic computer program, but rather as a collection of smaller programs connected by a common framework. These smaller programs could be existing off-the-shelf software packages, or could be new programs developed in-house or by the private sector. Given the existence of the framework, agencies could develop, procure, or replace the individual applications each on its own time scale, mixing and matching components to serve their own needs. This �tinker-toy� model of asset management systems is an effective way to achieve results quickly and create a manageable process to advance on the maturity scale.
Data Interfaces
How does an organization create this common framework? A major aspect of the frame-work that is frequently missing in current practice is a set of standards and conventions that will be collectively labeled Data Interfaces. When an agency�s pavement and bridge management systems both produce a data item called �project benefits,� but the two quantities are not defined in the same way, this indicates a need for a data interface. When one system segments the road network at intersections, while another one segments it at mileposts, this is another place where a data interface is needed.
Data interfaces help information systems to talk with one another, but more importantly they allow new systems to derive the data they need from multiple existing systems. The discussions of data flows in the Application Catalog make it clear that this is a widespread need in asset management.
Data interfaces also help to prevent asset classes from �falling through the cracks.� For example, a bridge inventory may omit sign structures because they are considered to be

NCHRP Project 20-24(11) Task 2 � Asset Management Framework
Cambridge Systematics, Inc. A-21
parts of signs, while the sign inventory may omit them because they have characteristics of bridges. It does not matter which one is correct, as long as sign structures are repre-sented somewhere in the system.
Performance Measures
It was emphasized in the Application Catalog that a management system feature to trade off cost versus performance is a sterile exercise if the decision-maker has no framework of performance expectations. Developing such a framework requires four main ingredients:
1. An agreed-upon set of defined performance measures;
2. A process for determining reasonable and achievable performance objectives;
3. An accountability process to create incentives for all involved parties to strive toward those objectives; and
4. A way to tell, at any given time, how well the objectives are being met.
All of these ingredients imply information technology requirements. The first of these is given greatest emphasis because, at today�s state of the practice, a large number of organi-zations lack the basic set of definitions that make the other ingredients possible. For the purposes of IT design, performance measures can be grouped in the following categories:
1. Raw condition data, such as bridge element condition states, pavement roughness and rutting, sign reflectivity, and average grass height;
2. Raw performance data, such as travel time, accident rates, and customer satisfaction survey results;
3. Normalized performance indexes, such as a zero to 100 �health index� scale of facility condition, a safety index representing facility accident risk, or a customer satisfaction index representing the impact of a wide range of facility conditions on satisfaction survey results; and
4. Economic performance indicators, such as avoided future agency costs, user costs, asset valuation, and benefit/cost ratios.
These four categories are arranged in the order in which they are usually implemented. Each relies on all of the ones before it for inputs to the calculation. Each contributes in its own way to the realization of the needed performance framework.
Raw condition data can be standardized on an industry-wide basis, because it is quite repeatable from one agency to another. For example, the AASHTO CoRe Bridge Elements, adopted by AASHTO in 1995, have been widely accepted by the states as a basis for bridge inspection and bridge inventories, even though there is no Federal requirement that they be used. AASHTO is also currently starting the process of standardizing highway maintenance elements in the same way. With this standardization in place, the

NCHRP Project 20-24(11) Task 2 � Asset Management Framework
A-22 Cambridge Systematics, Inc.
private sector will be in a position of lower risk to develop data collection equipment and inventory systems to make the routine calculation of performance measures possible.
Raw performance data may also be standardized relatively soon, because this, also, is uni-versal. Even in the absence of industry standards, organizations can safely develop a set of basic raw performance measures without worry that a future industry standard will be much different. The key here is to stick with basic transportation values that are a part of every transportation agency�s mission, such as travel time, reliability, safety, comfort, customer satisfaction, and security.
Raw condition and performance data are the outputs of the Performance Monitoring application, serving then as inputs to needs identification, policy development, and long-range planning. Raw condition data are also used in conjunction with work accomplishment data to develop predictive models for planning purposes, especially facility deterioration and cost estimation. Because these raw indicators are highly objec-tive, they can form the basis for performance objectives for many parts of the asset management process. Using deterioration models, even existing asset management sys-tems can predict the outcome of policy and project decisions in terms of raw condition measures. Existing transportation planning tools can often predict raw performance sta-tistics as a result of certain types of infrastructure investments. Existing asset manage-ment systems can also summarize the current raw condition data for the inventory, to tell decision-makers how they are doing at any given point in time.
Raw condition data are often too detailed for certain purposes, especially routine reporting of the state of the system to elected officials and the public, and budget negotia-tions. For these purposes, it is useful to develop summary normalized performance indexes that are not specific to asset types and do not require an engineering under-standing of the component�s functional role. California, for example, has summarized the conditions of 108 types of bridge elements into a summary indicator, the Bridge Health Index, describing the overall health of a bridge or the inventory as a whole. This approach could be extended to other types of assets, since it is defined in a way that is related to asset valuation and not tied specifically to bridges.
Performance indexes form a very good basis for State-of-the-System reports delivered routinely to elected officials and the public. With a complete inventory and Performance Monitoring process in place, these reports can be updated on a frequent basis or on demand. Performance objectives for the agency can be developed and tracked on this basis, as is already done in several states. Several state DOT web sites have very good examples of public reporting of agency performance using summarized indexes.
The calculation of normalized performance indexes would logically be another output of the performance monitoring application, since that application has all the necessary inputs to the calculation and since several other applications would use the results. Agencies should not wait for this to be standardized on an industry-wide basis, since there is no guarantee that that will happen any time soon. Instead, define an indicator scale that makes sense and is consistent across all asset types, that can be computed with readily available data.
NCHRP Project 20-24(11) Task 2 � Asset Management Framework
Cambridge Systematics, Inc. A-23
Economic performance measures are still somewhat controversial, in that they are highly processed in relation to the raw condition and performance data from which they are cal-culated. However, this level of processing has some very attractive benefits: it permits comparisons to be made across different types of agency objectives; it provides a uniform, objective way to compare project benefits with costs; and it supports comparisons to be made with non-transportation investments. Economic benefits are widely used in pave-ment and bridge management systems because they facilitate an automated calculation of relative priorities of maintenance investments.
Economic performance measures often require a knowledge of maintenance and improvement alternatives that are available to the decision-maker, so they require infor-mation found in the needs identification application. This would be a logical place to calculate them. The outputs of this process are useful to policy development, long-range planning, prioritization, budgeting, and resource allocation.
In the past, the definition of economic performance has been closely tied to specific pave-ment or bridge management systems, each system choosing a definition that is convenient for the analytical framework used in that system. It is unlikely that there will be industry standardization of these measures any time soon, but the number of definitions used in existing systems is quite limited. Calculations to convert one definition to another are possible, and can be provided within an agency�s own data interfaces.
Establishment of a performance measurement framework is on the critical path for asset management maturity in many agencies. It is tempting to spend a lot of time agonizing over these definitions, fearing that they will be difficult to change later. To a certain extent this fear is justified, because performance measurement systems do have some inertia. However, the potential to spend extra time on refinement is almost unlimited, so man-agement must set a clear process and time constraint to get the job done, allowing suffi-cient time for thorough discussion and negotiation, but no more. Six months is generally sufficient for most transportation organizations.
Geographic and Temporal Referencing
A frequent source of confusion with asset management data is the use of inconsistent ref-erencing systems for geographic and temporal data. When experienced within an agency, these problems are almost always ascribed to �historical reasons.� Often the historical reasons are very good ones: for example, an accident database whose geographic refer-encing system emphasizes intersection approaches is very logical, considering that inter-sections are where most accidents occur. Other times the reasons are accidental, resulting from lack of awareness by system developers of referencing systems already in use. In recent years improved GIS technology has made the differences among referencing sys-tems transparent in many cases, but quite a few organizations still have memories of geographic referencing projects that took far longer and cost far more than was expected.
An organization can help to avoid future confusion by specifying a referencing system and requiring that all future systems be compatible with it, convertible by the agency�s existing GIS software. The organization can make this requirement practical to meet by providing the ability to convert among the most common types of referencing, such as route/milepost, a link/node system, latitude/longitude, and state plane coordinate

NCHRP Project 20-24(11) Task 2 � Asset Management Framework
A-24 Cambridge Systematics, Inc.
systems. Application developers should not have to provide this conversion functionality themselves.
An obvious advantage of having an agency-wide geographic referencing system is the ability to incorporate network and thematic maps as communication media for any appli-cation, without drastically increasing the cost of that application. The value extends far beyond the convenient production of maps, however. It supports the ability to find proj??ect interrelationships, environmental concerns, construction traffic problems, and potential economies of scale.
Agencies that have had bad experiences with geographic referencing efforts in the past should recognize that the effort is worth the expense, but may have been hindered in the past by an underestimation of the time and cost required. Contacting similar size agencies that have successfully completed such an effort is a logical first step.
Temporal referencing is another frequent source of confusion, especially the distinction between calendar years, agency fiscal years, and Federal fiscal years. Some of the older systems needed for asset management employ Federal fiscal years because of past reliance on Federal funding for asset investments, even though this reliance today is much less significant. This has been known to cause subtle errors akin to the �year 2000 problem,� errors that are very hard for the user of a report to notice. Usually the error is more of a distraction than a serious problem, but even such distractions should be avoided if possi-ble. Because so much of asset management is tied to the budgeting process, adopting the budgeting fiscal year as the standard is an appropriate approach for many agencies.
For the vast majority of organizations, referencing issues are not on the critical path to maturity. As a result, there is no reason for most asset management technology initiatives to wait for resolution of referencing problems. Developing an agency-wide referencing capability does take time, and can be allowed to proceed at its own pace while other ini-tiatives are underway.
Database Relationships
The question seems too trivial until you try to implement an information system: what is a bridge? Or, even more difficult, what is a project need? If a sign structure is a kind of bridge, does that mean it has to be inspected every two years? In geographic referencing terms, is a bridge a linear segment or a point facility? If two rehabilitation projects are near each other and might share economies of scale if performed together, are they one need or two? For a project to be a �need,� does it merely have to improve performance in some way, or does it have to satisfy some criterion of cost-effectiveness?
While it is not hard to answer these questions in the context of a specific decision to be made, it is indeed very difficult to standardize these definitions across the agency in a way that will satisfy a wide range of decision-making requirements. As difficult as it may be, a certain amount of standardization is extremely valuable in facilitating the interaction among asset management applications. It is necessary to draw clear lines delineating the scope of each part of the system, to clarify development and ownership responsibilities, to ensure that system designers and developers understand what they are expected to do, and to make sure nothing important falls through the cracks. These kinds of questions are

NCHRP Project 20-24(11) Task 2 � Asset Management Framework
Cambridge Systematics, Inc. A-25
grouped under the category of �database relationships� because the design of a database is the place where these questions first start to have an acute impact on information tech-nology. It is essential that the full range of asset management application users are heav-ily involved in resolving these issues. While this can be a time-consuming process, it is well worth the investment.
It deserves emphasis to say that the solution at this point in the development of an organi-zation�s asset management systems does not require the development of a big compre-hensive database. It requires only the broadest outlines of a database, with the details to be filled in later. Although broad and sketchy, the decisions made in this framework do have a great deal of inertia, because systems will be developed that are organized around the definitions that are chosen. These decisions are difficult, though not impossible, to change later.
So where should the line be drawn to define how much detail is needed at this point? For a long time, the systems analysis field had no good answer, so there was a slippery slope that started with defining the most important database tables, then went on to define all the tables because there was no clear place to stop; then defined the most important data items, and went on to define all the items, because again there was no clear place to stop. Before long, the agency had spent a lot of time and money making decisions that did not really have to be made until an actual application was developed.
Fortunately the systems analysis field has matured in recent years, has recognized this type of problem in many types of organizations, and has provided a solution, called Object-Oriented Analysis (OOA)(14). In a sense, �object-oriented� is both a very good and very bad name for this methodology. It is very good because it focuses on the physical manifestations, the actual substantial objects, that are described or manipulated by a busi-ness process or software system. These are the aspects of the problem that are least likely to change, and the ones that are most important to the long-term stability of an informa-tion system. �Object-oriented� is a bad name because it is too easily confused with Object-Oriented Programming, a completely different pursuit even though it has the same philosophical underpinnings. OOA is not the activity of a computer programmer: it is the activity of a systems analyst, a person whose job is to find a logical structure of a problem in order to organize, but not design or develop, feasible, stable solutions that may or may not include information technology.
Many agencies have difficulty at this point in asset management because they did not anticipate having to stop to define what a bridge is, did not realize it would be so difficult, and did not know of an organized, reasonably expedient way to do it. OOA offers an answer to this need.
The role of OOA in asset management system design must be clearly understood. It is not properly a prerequisite for application development, because applications developed before the OOA is completed are not made obsolete by it. It is a part of the Data Interfaces section of the framework because it provides an interface among systems, not necessarily the foundation of systems. Nevertheless, new systems developed after the OOA is com-plete can benefit greatly by organizing data and functionality in a form that is most con-sistent with the overall architecture of the asset management framework.

NCHRP Project 20-24(11) Task 2 � Asset Management Framework
A-26 Cambridge Systematics, Inc.
OOA is, at present, very agency-specific, though it is possible in the future that certain parts could be standardized industry-wide. The AASHTO Bridge Elements and Maintenance Elements are, in fact, a possible basis for standardizing a part of the object-oriented analysis. Parts of the analysis that are most closely associated with decision-making concepts are the hardest to standardize, since each agency has its own areas of policy emphasis. The essential ingredients of the analysis that are needed for the asset management framework are:
• A list of the major kinds of objects (technically known as �classes�) that the information systems will describe, focusing exclusively on the objects that are represented in more than one application.
• A list of the major types of data (technically �properties�) that must be known about each object, focusing exclusively on those that are shared among applications.
• A �Webster�s Dictionary� type of definition of each class and property, containing just the information that must be known in order to clearly communicate data from one application to another. Importantly, this includes underlying assumptions that affect the use of the data item in applications other than where it was produced.
• Some basic requirements of the classes and properties that affect their ability to be shared, including:
− Referencing � Are the objects points, lines, or areas, and what referencing system will be preferred.
− Accuracy � When data items are estimates of unknown field observations, how close should they typically be to the true value, and how much potential bias is allowed.
− Precision � How many digits of numerical precision.
− Timeliness � How often must the data be collected, and how much variation from the schedule is permitted.
− Coverage � What facility types, geographic areas, and ownership categories are included. For example, are local, Federal or turnpike authority bridges included? Are gravel roads included in the pavement database? Are guide signs included in the sign inventory? What are the minimum requirements for a project to be consid-ered a need?
− Granularity and Aggregation � At what levels of detail should it be possible to extract the data.
The main limitation that prevents the slippery slope problem from occurring is that each question�s response must be limited to those issues that affect sharing of data among applications. Questions that affect only one application are specifically excluded from the analysis. Naturally, it is necessary to first define what the applications are before embarking on the identification of classes and objects. In fact, this is the first part of the process that needs an explicit list of applications. OOA offers a technique for identifying applications also: it is called Use Case Analysis.(15)

NCHRP Project 20-24(11) Task 2 � Asset Management Framework
Cambridge Systematics, Inc. A-27
The list of classes is the most important part of the analysis, because it has the most inertia. This is where it is decided, for example, that sign structures are a kind of bridge, that they have most of the same kinds of structural data as bridges, but they do not carry roadways and are not inspected every two years. These decisions are made separately from any ongoing system development efforts, but are obviously influenced by those efforts. For example, the example decision about sign structures would be made if the agency has already included sign structures in its bridge inventory or intends to do so in the near future. Subsequent efforts to develop other applications, such as a priority-setting application, will assume that data on sign structures is available or soon will be. If it is not yet, then the addition of sign structures will become a priority activity for enhancement of the bridge inventory.
The list of properties and information about data requirements are somewhat more fluid, tending to change over time as requirements change. However, a state of constant change or unregulated change in the definitions would be disruptive, forcing each application to be modified frequently. The regulatory process for these changes is described in a later section under Process Interfaces.
An object-oriented analysis such as what is described here should take no more than six months for a systems analyst to complete. It is in fact a facilitated process of negotiation, so it should be expected that there will be multiple drafts that are commented upon by many affected people. The process can occur simultaneously with other parts of the Data Interfaces already described. Issues that become too controversial to be resolved in six months, and which do not have any immediate impacts on the implementation of asset management applications, can be put aside. But the process should not be allowed to delay any impending system development or implementation efforts for longer than the six-month period. Executive-level arbitration is sometimes required.
Process Interfaces
Moving data from one application to another, and making the separate applications func-tion as a cohesive whole, is not completely automatic. It is necessary to have people whose job is to create the process and keep it running. All of the roles described here take the form of being a facilitator supporting the application users. In fact, many of the roles can be filled by selected application users themselves. The information technology profes-sional roles, such as programmers, database administrators, network administrators, etc. are not addressed in detail here as they are similar to other information technology roles outside of asset management.
Workflow Coordination
The asset management process includes regular hand-offs of responsibility at several points. For example, after a pavement condition survey is completed, the focus moves to project needs identification, where project needs are handed off to priority-setting, which passes candidate program information along to budgeting. It is usually the responsibility of the application users to ensure that hand-offs are completed successfully, though the technology can contribute some support by issuing notification e-mails and by tracking

NCHRP Project 20-24(11) Task 2 � Asset Management Framework
A-28 Cambridge Systematics, Inc.
where each project currently stands. Traditionally, many transportation agencies have used clerical staff to keep the process moving smoothly, and there is no reason why this cannot continue to be the case in agencies where this has worked well.
Negotiation of Data Standards
The object-oriented analysis process can evolve into a set of data standards over time. This process should be allowed to evolve gradually, making no decision before it is neces-sary to do so. As new applications emerge, the need will often arise to modify the stan-dards. When this happens, a routine, negotiated process can handle it efficiently. In designing the asset management framework, it is useful to recognize that changes to data standards tend to adversely impact data providers more than data consumers, because the former have to modify their systems to satisfy the needs of the latter. To keep the nego-tiation process balanced, look for ways that all applications can serve as both providers and consumers. For example, the Performance Data Collection process can benefit from knowledge of current agency priorities, to help in structuring their own work. A two-way flow of data here can make a negotiation process more likely to reach resolution expediently.
Negotiation is a skill that not all application users may possess. Each organization should have specific individuals, with negotiation skills, who are assigned to mediate negotia-tions that require it. A senior manager can often be effective as a mediator, because he or she often has a stake in a quick resolution but may not have a preference as to the techni-cal details of the resolution. Information technology professionals are also sometimes effective mediators, contributing their technical knowledge to the solution if they are otherwise disinterested.
Technical Support Services
Users of asset management applications, like all software users, sometimes need technical help learning new systems and solving problems. Effective technical support is an important step forward in the maturity of the process, because it reduces an organiza-tion�s vulnerability to relying on the lone guru. Certain parts of technical support, such as dealing with parts of the technology infrastructure, are best left to information technology professionals. Other parts, especially dealing with the use of decision-support applica-tions, are best left to other users. When application software is purchased from outside companies, the availability of technical support is an important consideration.
Training
To ensure that in-house technical support is most effective, training is essential. A model frequently used in asset management is to engage an outside software vendor or consult-ant to train a select group of users, who then have the responsibility to train the remaining users. However, it is important to recognize that with asset management systems, the mechanical training of how to use the software is a smaller concern than procedural training on how the information in the software affects how the employee is expected to do his job.

NCHRP Project 20-24(11) Task 2 � Asset Management Framework
Cambridge Systematics, Inc. A-29
Quality Assurance
A prominent feature of the maturity scale is steadily increasing management trust in the information received from asset management systems. Data quality is naturally an important part of this. Decision-makers that seriously intend to rely on a new data source will often take measures to test its quality, even going so far as to site check a sample of data to see if it agrees with reality and to verify that they understand it correctly. This is to be encouraged. Similarly, decision-makers with a healthy skepticism will test the cal-culation of performance measures and other outputs of decision-support software by trying it with a range of realistic and unrealistic input scenarios to see if the model behaves as expected.
In a maturing organization these activities will occur whether they are planned or not, but the most advanced agencies do not leave quality to chance. A systematic process of testing data quality and decision-support models is required.
Well-established procedures for testing data quality already exist in many areas of asset management. Calibration of testing equipment is one obvious example. Another is auditing, which is effective with visual data collection processes such as bridge inspection. Either supervisors or inspectors from other districts are brought in to conduct their own data collection process, whose results are then compared with the crew being audited. Differences between the two inspections are investigated, and sometimes refresher training of the crew may be indicated. Aggregate results of this periodic activity are tracked and reported over time, and are used to refine the training and hiring process.
An analogous, but automated, process can occur with decision-support software. NCHRP Project 12-50 is currently developing a structured methodology for testing engineering software that works well on any type of analytical software, including asset management systems.(16) The concept behind the approach is to use a parallel software program, such as another vendor�s product or a spreadsheet program specifically developed for testing, that duplicates the functionality being tested. A testing controller program, usually another spreadsheet, systematically generates a large number of typical input cases and boundary cases, feeds them to the subject software in a batch-oriented manner, then com-pares the results graphically. Discrepancies become quite obvious in this way. The method requires that each discrepancy be investigated and explained.
Communication of Results
Communication issues can be rather sensitive in asset management, particularly commu-nication of agency performance, needs, and future work. One of the ways the general public and elected officials immediately recognize a mature organization is the clarity and consistency � overall professionalism � of its communications. This public impression is harmed when two officials speak to the press, giving conflicting versions of the same story. It is harmed when the story changes over a short time period, or when the agency commits to delivery of a specific project at a specific time and cost and then does not deliver as promised. It is harmed when the story is too difficult for the layman to understand.

NCHRP Project 20-24(11) Task 2 � Asset Management Framework
A-30 Cambridge Systematics, Inc.
Internal communications are subject to the same concerns: agency employees develop an impression of their management through the quality of their communications.
Asset management technology offers some valuable tools to improve communications quality, especially maps, images, and statistical graphics. But the explosion of communi-cation possibilities, especially those presented by the Internet, also call for vigilant human intervention. It is easy for persuasive but incorrect or premature information to be released. A poor quality web site reflects poorly on the organization. Incomplete infor-mation makes citizens wonder what is being swept under the rug.
The possibility of better communications presented by the Internet is quickly becoming a requirement. Public pressure for accountability, and the increasing degree of sophistica-tion of transportation and non-transportation agencies in measuring and reporting their own performance, may create competitive pressure to hasten the maturity of asset man-agement information systems.
Technology Infrastructure
Elements of the underlying hardware and software of asset management technology can also be structured into a maturity scale, but not necessarily by the age of the equipment. A mainframe computer, used to its potential, can participate in a mature infrastructure as well as any more modern computer. What is important is how the resources are used to support improved asset management.
Databases
Usually the first major software acquisition in asset management is a database manager. In the early days of pavement and bridge management systems, each package had its own internal database with limited capability to communicate with others. This has become less of a problem in recent years, as newer systems employ industry standards such as Open Database Connectivity (ODBC) to allow them to communicate with multiple com-mercial database managers. The AASHTO Pontis bridge management system, for exam-ple, has been certified with Oracle, Sybase Adaptive Server Anywhere, and Microsoft Access, and has also been implemented in Sybase SQL Server. There is very little extra coding necessary to work with additional databases, only more testing.
For a period in the early to mid 1990s, many transportation agencies enacted requirements that all new applications be developed using an agency-standard database platform that was selected by a competitive bidding process. Often, these requirements faded from lack of enforcement, since the anticipated technical problems from having multiple database platforms failed to materialize. Today, there is still some additional cost associated with providing technical support and software development services on more than one data-base manager, which still leads agencies to specify preferences. But nearly all organiza-tions have more than one database manager in use and will continue to do so indefinitely in the future. All major database managers today support the ODBC standard, so appli-cations developed using these systems are technically open to access from a wide range of outside systems.

NCHRP Project 20-24(11) Task 2 � Asset Management Framework
Cambridge Systematics, Inc. A-31
Data Interchange Standards
The fact that a database is accessible through ODBC does not necessarily imply that the access is reliable or convenient for system developers. Before time and money are invested in creating a linkage with an existing system it is necessary to have some assur-ance that the access will continue to be allowed, and that some control will be placed on changes to the database to minimize disruptions. The aspects of the database that outside developers must rely upon are collectively known as data interchange standards. These standards can take the form of a partial database schema of the source database, or can be expressed as an intermediate data format, such as an SQL view, an XML-structured text file, or a flat ASCII file. The choice of format is usually based on development conven-ience and database security concerns. In typical modern applications an SQL view is used when the source and destination data are already well structured in a modern database manager, and when access will occur over an internal network. XML files are often used when data will be sent over the Internet or to an unknown destination outside the agency.
When initial discussions about data sharing occur, often the system developer has consid-erable flexibility about the format and structure of the data, and a lengthy negotiation ensues to find the best format acceptable to both the developer and the provider. Fulfillment of the arrangement may entail considerable work on the part of the provider if the request is not one that was anticipated when the source database was first developed.
Fortunately, an organization that has developed an object-oriented analysis is less often surprised by unanticipated data requests. By specifying an overall architecture for asset management systems, the OOA limits the number of alternatives available to both requester and provider, and helps to ensure that a feasible alternative will be identified by guiding both developers to a common vision of how systems will interact. The OOA acts as a preventive measure, resolving many data interchange problems before they occur.
Geographic Information Systems
Geographic Information Systems (GIS) have matured remarkably in the past 10 years. Originally released as closed systems with proprietary internal data formats, these sys-tems now are much easier to connect through databases and even through component-based software systems. A GIS serves three major roles in asset management:
1. Supporting flexible geographic referencing by converting data among reference sys-tems;
2. Providing geographic analysis functionality, such as finding all wetlands within 500 feet of a bridge; and
3. Drawing maps.
By now it should be clear that drawing maps, though the most obvious application of GIS, is not the only important one. Resolving different referencing systems is a key require-ment of the Data Interface framework described earlier. Many transportation agencies today consider their GIS to be indispensable, and well worth the expense and effort of implementation.

NCHRP Project 20-24(11) Task 2 � Asset Management Framework
A-32 Cambridge Systematics, Inc.
Networking and Shared Hardware
Asset management applications tend to be fairly demanding of network and hardware resources. Any user of a pavement or bridge management system on a significant-size inventory will attest that a great deal of time is spent moving data, especially in network-level policy analyses. GIS is also demanding, especially in terms of output devices. Because the hardware tends to be relatively inexpensive compared to the software and data, few organizations have reservations about allocating funding for the fastest available hardware to run asset management software.
Shared Software Components
A promising new technology that is highly compatible with object-oriented analysis is component-based software. The goal of component-based software is to reduce the com-plexity and cost of software systems by dividing them up into small components, that interact with each other through standardized interfaces. The reader will recognize that this concept is philosophically similar to the idea of breaking up a large asset management system into smaller applications that each has its own user group and life cycle.
The concept of component-based software is at least 20 years old, with CORBA being the first well-known set of standards for defining the interfaces among components. In recent years Microsoft has aggressively expanded into this area with its DCOM standard and related ActiveX technology. Microsoft standards now dominate the market. Many of the software systems familiar to transportation professionals today make extensive use of component-based technology. These include Microsoft Office, AutoCAD, Visio, Netscape, and S-Plus. Two AASHTO software systems, the Virtis bridge load rating system and the Opis bridge design system, are largely component-based.
Component technology offers a very efficient way of sharing data and functionality among computer programs connected by a network or the Internet. The ability to share functionality is a major advance. A budgeting application, for instance, can use a priority-setting algorithm borrowed from the prioritization application without having to recode or maintain it. Any application can borrow GIS functionality from ArcView by using MapObjects, without much additional coding or complexity.
Maturity Scale
Table A.2 summarizes key characteristics for each of the five maturity levels, organized according to applications, data interfaces, process interfaces, and technology infrastructure.

NCHRP Project 20-24(11) Task 2 � Asset Management Framework
Cambridge Systematics, Inc. A-33
Table A.2 Maturity Levels for Asset Management Information Systems
1 � Initial 2 � Awakening 3 � Organized 4 � Managed 5 � Optimizing
Applications • Asset perform-ance data is limited, incon-sistent and unreliable
• Little or no use of information systems to sup-port decisions
• Basic inventory and condition data manage-ment applica-tions for major assets in place; data quality uneven
• Basic asset data reporting capa-bility in place
• Asset manage-ment software used in limited fashion to sup-port needs identification and ranking based on raw condition and performance
• Little or no integration of different decision-support tools
• Facility-level data has gained credibility and is used extensively
• Integrated approach to data collection is pursued for some groups of applications
• Rudimentary network-level analysis tools exist, but pre-dictive capa-bilities not yet well-developed or used
• Project-level life-cycle analy-sis calculations are supported, relying on judgment-based predictions of future work.
• Decision-support tools are an integral part of the agency�s resource allo-cation process
• Decision-support tools include credible capabilities to predict future facility deterio-ration and per-formance.
• Improved life-cycle costing capabilities are in place which make use of predictive models and integrate user costs
• Network-level priority-setting and budgeting applications have access to economic per-formance meas-ures and are used for what-if analysis.
• Decision-support tools are further enhanced to integrate opti-mization capa-bilities and provide quick-response trade-off analysis
• Decision-support tools used to generate and evaluate many alternative strategies
• Each decision-maker makes effective use of support tools tailored to their needs

NCHRP Project 20-24(11) Task 2 � Asset Management Framework
A-34 Cambridge Systematics, Inc.
Table A.2 Maturity Levels for Asset Management Information Systems (continued)
1 � Initial 2 � Awakening 3 � Organized 4 � Managed 5 � Optimizing
Data Interfaces
• No quantitative performance measurement framework defined.
• No data sharing across applications
• Inconsistencies in data across systems exist.
• Set of raw con-dition and per-formance meas-ures defined and published.
• Reports showing infor-mation from multiple system can be pro-duced via a partially auto-mated process � still requires moderate level of time and effort.
• Process to establish geographic referencing standards underway but not complete.
• More sophisti-cated perform-ance measures allowing cross-asset compari-sons are established
• Ad hoc data sharing arrangements are in place among applica-tion users
• Geographic referencing is sufficiency reli-able to allow for on-demand maps showing asset data
• Effort to define asset manage-ment informa-tion architec-ture underway
• Consistent eco-nomic perform-ance measures are defined and calculated for all asset classes
• Asset manage-ment architec-ture relied on for new system development/ enhancement efforts
• All asset management systems incorporate standards for geographic referencing, performance measurement, costing, and asset identification.
• Senior decision-makers are able to generate lists of project needs across asset types, showing the same set of cost and performance measures.
• Geographic analysis of per-formance data, planned work, and needs across asset types is routinely performed.
• Efficient and effective agency-wide data sharing framework firmly estab-lished
• Established processes in place for adapting to changing needs.

NCHRP Project 20-24(11) Task 2 � Asset Management Framework
Cambridge Systematics, Inc. A-35
Table A.2 Maturity Levels for Asset Management Information Systems (continued)
1 � Initial 2 � Awakening 3 � Organized 4 � Managed 5 � Optimizing
Process Interfaces
• No organized processes for data coordina-tion, quality assurance, or technical sup-port across functional units
• Ad hoc support and training is provided by a small number of application-specific experts.
• Centralized public informa-tion function established, but with relatively limited set of products
• Work flow coordination processes starting to be established
• Organized application training sup-port functions are in place
• Basic data quality assur-ance program in place
• Formal work flow coordina-tion processes operating smoothly
• Well-estab-lished infra-structure for support, QA, and training
• All process interfaces are regularly evaluated and improved
Technology Infrastructure
• Technology infrastructure limited to net-work support and Internet access, but only used for sharing printers and file servers.
• Network access to some applications
• Basic reporting and limited mapping capa-bilities in place
• Basic data interchange standards exist to allow some data sharing
• GIS capability in place
• Data inter-change stan-dards fully established
• Extensive use of shared applica-tions and data-bases via local network and/or intranet
• Software com-ponents are shared among applications to reduce incon-sistencies and reduce mainte-nance costs.
• Performance statistics for networks, serv-ers, and other shared hard-ware are used to adjust system capacity to meet demand
��������A.4 Implementation and Measurement
There is a lot of technology out there to help with asset management, some if it rather complex, all of it potentially useful for the right organization at the right time. Timing is the key. Confidence in a high-tech solution is hard to develop unless one is already confi-dent that lower-tech solutions have been mastered and exploited as far as they can go.
Organizations that are not at the top of the maturity scale � which is the vast majority of them � should not regard themselves as defeated or inadequate. Every agency at every

NCHRP Project 20-24(11) Task 2 � Asset Management Framework
A-36 Cambridge Systematics, Inc.
level needs to improve. The maturity scale is an invitation to action, because it helps to focus the action on the places where it can be most effective in the near term.
Step 1 � You Are Here
The essential first step is an assessment of the organization�s current place on the maturity scale. When assessing this position, keep in mind that maturity in the use of IT in asset management is defined by how well the technology is used, not how advanced it is. Maturity is defined by cohesiveness, shared purpose, and reliable communication among the workforce at large, especially the cohesiveness of decision-makers. Having brilliant individuals who excel because of their individual effort is not mature, just lucky.
The method for finding an organization�s place on the maturity scale is called Process Assessment. The basic steps in process assessment are as follows:
1. Establish Sponsorship � The process assessment and improvement effort will con-sume a modest amount of time and effort beyond the participants� normal duties. Senior management must provide the necessary resources. Their willingness to do so is an indication that at least the possibility of improvement has been recognized. That is a good sign.
2. Form a Team � The team conducting the assessment should consist of a cross-section of individuals, perhaps five in all, representing multiple levels of the organization and multiple locations if the agency is decentralized. A group too large will take too long to complete the exercise. Keep in mind that the purpose of the exercise is fact-finding, not consensus-building, so choose people for their skills and attitude to get the job done promptly. The participants need to be familiar with the descriptions of maturity levels and with the asset management process in general, as documented in this report.
3. Conduct Interviews � Team members fan out to interview asset management decision-makers across the organization. In a small- to medium-size agency, this could include every decision-maker. In a large agency, it might be a random sample. It is important to protect the statistical validity of the results, so do not focus on the most vocal people, and do not perform the interviews in groups, where the vocal ones tend to dominate. Management needs to have confidence that the results are a true picture of where the agency stands. Make sure all the application areas � performance monitoring, needs identification, policy development, long-range planning, prioritiza-tion, budgeting, and program implementation � are covered, and add any others you think are important. The outline described below is a useful way to structure the interviews, designed to use everyone�s time efficiently. It can be provided to the interviewees in advance. Each interview should be limited to one hour. In all, the one-on-one interviews should take about two days per team member over a period of about a month, for a total of 20 person-days. Travel time and expenses for district office interviews are additional.
4. Write a Brief Report � Responses to the interviews should be kept anonymous. The team prepares a brief management briefing on the interview results, a summary of

NCHRP Project 20-24(11) Task 2 � Asset Management Framework
Cambridge Systematics, Inc. A-37
where the agency stands. This can be in the same format as the interview outline, but the briefing should deviate from the outline when the structure of responses demand it. For example, management confidence and decision-support tools might be differ-ent for pavements than for other types of assets. This is useful information and should be documented. A typical report might be five pages long.
5. Senior Management Briefing � The team conducts one or more briefing sessions for senior management. Multiple briefings may be required because of scheduling issues. Allow 30 minutes for the briefing and another 30 minutes for discussion. An outline for the briefing could be as follows:
• Purpose of the exercise, including background on asset management and the maturity scale;
• Interview results;
• Recommended next steps (see the next section); and
• What is needed now from senior management, including assignment of responsi-bility, resources, and a statement of endorsement of the effort.
The tone of the report and the briefing should be positive and factual: here is where we stand, here are the places we need to improve next (focusing on near-term actions), here is what needs to be done, and here is what we need from you.
An important undertone that management should read into the briefing, but may not need to be stated explicitly, is that the recommended actions are the highest-priority IT initiatives for asset management, and this means that any other initiatives currently being contemplated or underway are lower priority. A rearrangement of priorities is the result that most often is needed, but an increase in resources to cover both new and existing ini-tiatives might also be warranted in specific cases. Initiatives that are lower-priority, per-haps because they are too far ahead of the agency on the maturity scale, do not have to be cancelled, but may have to be slowed if they draw too many resources away from the highest-priority actions.
Table A.3 is the recommended outline for the interviews. The structure follows obviously from the maturity scale and the four major elements of asset management information technology. However, the questions asked about these topics should be non-technical in nature, focusing on how the information is actually used today in decision-making. Have the interviewees talk about how they make decisions, not about the technology itself. Obviously the outline should be shortened and tailored to fit each interviewee.
All of the interview responses have to be interpreted in the context of the interviewee�s application area, so make sure this is defined clearly. It might not map exactly onto the taxonomy given earlier in this report, so be sure to note the differences. Besides helping to understand the responses, this will be valuable background for the object-oriented analy-sis, if that is shown to be a logical next step. Be sure to note the scope of decision-making: what kinds of assets, what kinds of activities, what geographic area, what types of high-ways, what time of year.

NCHRP Project 20-24(11) Task 2 � Asset Management Framework
A-38 Cambridge Systematics, Inc.
Table A.3 Outline for Process Assessment Interviews
Application Area
Scope of Decision-Making
Status and Description of Decision-Support Tools Distinguish existing, useful, and used in each case Types of information in the system: Asset inventory Asset condition (raw or indexes) Transportation or activity performance (raw or indexes) Economic performance (what kind) Historical cost or resource consumption Project, program, or policy cost estimation Project, program, or policy output prediction Project, program, or policy performance prediction Priority information Activity status information (what kind) Tradeoff analysis (describe) What-if analysis (describe) Optimization capability (what kind) To what other people is the output sent, and do they use it Do they receive feedback from others on the information they provide Have the systems been improved based on this feedback
Data Interfaces Performance measurement Determine whether the following exist and how they affect decision-making Also who has access to this information (internal and external) Quantitative performance expectations A process for negotiating and updating performance expectations A way of finding out the current status of performance Are decisions changed based on reported performance Geographic referencing Does the person have access to geographic mapping or analysis tools Are they useful and are they used to help in decision-making Are they useful/used in presenting the results of decisions to others
Database relationships Does an overall architecture exist How detailed is it Do applications adhere to it Find examples of where it is not working
Process Interfaces Workflow coordination How is it coordinated How coordinated is it
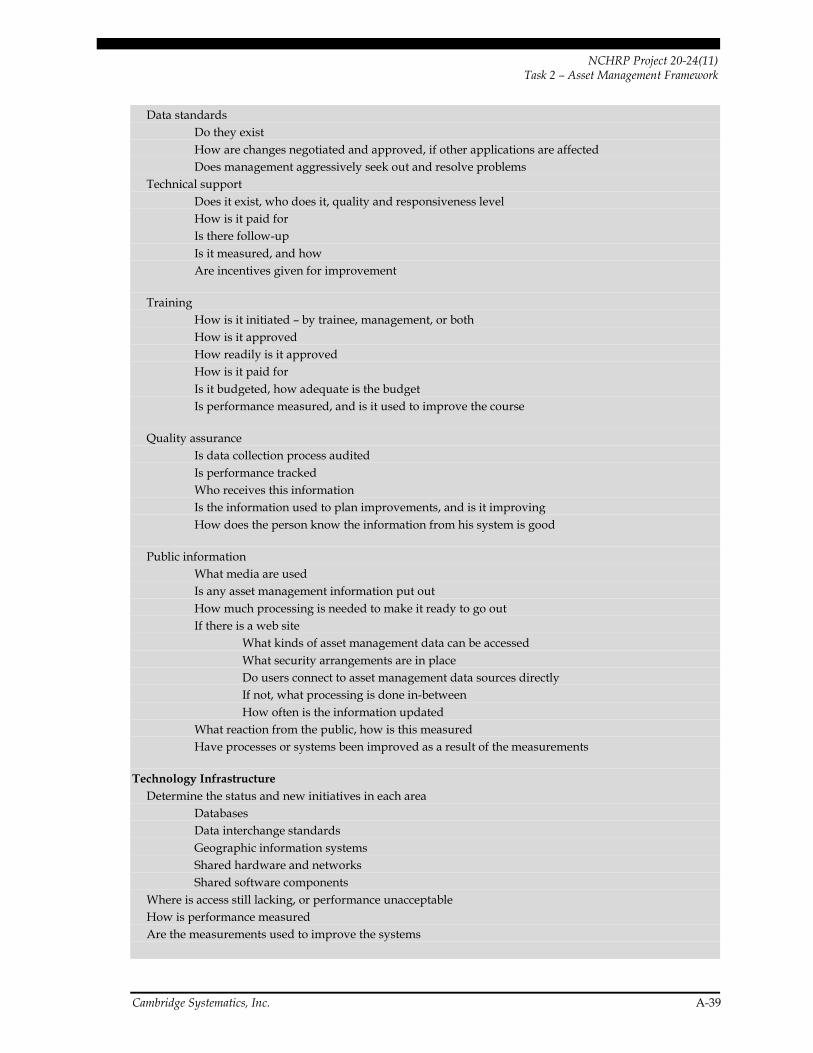
NCHRP Project 20-24(11) Task 2 � Asset Management Framework
Cambridge Systematics, Inc. A-39
Data standards Do they exist How are changes negotiated and approved, if other applications are affected Does management aggressively seek out and resolve problems Technical support Does it exist, who does it, quality and responsiveness level How is it paid for Is there follow-up Is it measured, and how Are incentives given for improvement
Training How is it initiated � by trainee, management, or both How is it approved How readily is it approved How is it paid for Is it budgeted, how adequate is the budget Is performance measured, and is it used to improve the course
Quality assurance Is data collection process audited Is performance tracked Who receives this information Is the information used to plan improvements, and is it improving How does the person know the information from his system is good
Public information What media are used Is any asset management information put out How much processing is needed to make it ready to go out If there is a web site What kinds of asset management data can be accessed What security arrangements are in place Do users connect to asset management data sources directly If not, what processing is done in-between How often is the information updated What reaction from the public, how is this measured Have processes or systems been improved as a result of the measurements
Technology Infrastructure Determine the status and new initiatives in each area Databases Data interchange standards Geographic information systems Shared hardware and networks Shared software components Where is access still lacking, or performance unacceptable How is performance measured Are the measurements used to improve the systems

NCHRP Project 20-24(11) Task 2 � Asset Management Framework
A-40 Cambridge Systematics, Inc.
Step 2 � Jump in at the Right Place
The next step is to formulate a set of recommendations. These follow directly from the maturity scales. The scales represent a very generic cookbook approach, so naturally it is necessary to adjust it to fit the organization�s needs while remaining consistent with the overall sequence of events. The most likely adjustment that needs to be made is that cer-tain parts of the agency will be more advanced than others. The more advanced parts may, in fact, be held back by the less advanced ones, so the latter need priority. Especially be sure to look for differences by type of asset, by type of activity (maintenance, rehabili-tation, major construction, for example), by geographic area or office, by type of highway, and by time of year. Also note areas of uncertainty where interview responses are incon-sistent. These may need further investigation.
Be very circumspect about large new IT investments unless the agency is really at the right level of maturity for it. The lower maturity levels tend to need lower-tech approaches, where the increment of resource requirements is more in data collection and quality con-trol, less in data processing. At the lower levels of maturity, large development efforts are very risky because the agency has not developed the metrics necessary to estimate costs. There is no need to increase the level of risk. Instead, start right away to measure costs and impacts of existing IT projects, so the agency will be ready to take on more ambitious projects when the time is right.
Usually there will be a fairly long list of next steps that are needed. Use the framework of Table A.1 to organize them into a manageable structure that senior management can act upon. In some cases it will be necessary to form one or more steering committees to over-see an effort. Other times, a more informal cooperation among two or three people is enough. The solution should fit the size of the problem. In most cases, a steering com-mittee to oversee asset management activities in general is required, as discussed else-where in this report, and that group can oversee the technology initiatives as well, since those are so integral to the overall process.
Step 3 � Measure, Evaluate, Improve
Information technology in asset management is often perceived as high-risk by senior management, because the costs and benefits are uncertain. Therefore, it is important to take it a step at a time, focusing on incremental steps that are understandable and quanti-fiable at the agency�s current state of maturity. Take measurements of costs and results, to set the stage for the following steps. Never neglect to measure: this is the only way a maturing organization will know where it stands and it is the only way to reduce the risks of the next steps to an acceptable level to proceed.
The benefits and processes of measurement of asset performance have been emphasized already in previous sections of this report. What is needed in addition is measurement of the process itself. A framework for measuring the benefits of asset management technol-ogy initiatives has five parts:

NCHRP Project 20-24(11) Task 2 � Asset Management Framework
Cambridge Systematics, Inc. A-41
1. Advancement along the Maturity Scale � This is measured by repeating the process assessment once every couple of years to see how things have improved. This dimen-sion focuses on the quality of information, and is non-economic by nature. It is the most reliable benefit measure during the first three stages of maturity.
2. Data Error Rates � Another non-economic but important and quite measurable bene-fit, data quality is assessed by an auditing process as described earlier in this report. Measurement of data quality can begin even at level 1, and is instrumental in helping the agency to advance, by building management confidence.
3. Improvements in Raw Performance Indicators � At levels 2 and 3, asset performance data become available and can be used to track the quality of decision-making in terms of performance improvements or customer satisfaction per dollar of maintenance investment. It is difficult to separate the effect of the technology from effects caused by other changes at the same time, such as infrastructure investments and general organizational process improvements. However, the discipline of performance meas-urement must be established as soon as it becomes possible, and there is much to learn even in the early stages.
4. Avoided Asset Costs � Once the fourth level of maturity has been reached, the asset management systems are able to quantify their own benefits. These include avoided future agency costs because of timely maintenance, and avoided user and social costs due to increased safety and mobility. Note that this level of maturity is not reached by a mere technical capability to compute these numbers, but by having developed man-agement confidence in these numbers by having successfully passed each of the earlier stages.
5. Avoided Decision-Support Costs � Initiatives to reduce the cost of gathering and processing data can result in significant savings to agencies, and the impacts of these efforts should be measured. Just as with constructed facilities, it is necessary to have a very good idea of the cost of technology before any estimates of avoided costs have credibility.
The problem of estimating the costs of information technology are the same in asset man-agement as they are in other types of information systems. Guidance on software devel-opment costs and measurement techniques can be found.(17,18) Much of this applies equally well to non-software projects.
One-of-a-kind initiatives, such as establishing a geographic referencing system, are best estimated initially by consulting other agencies that have already completed the process. Once the project is underway, measure the rate of progress relative to resources put in, to validate and adjust the initial cost assumptions.
Establishment of strong management control on technology-based projects is essential for success. A sound management approach is to define specific deliverables, each with a standard of quality and a defined way of measuring completion. Progress is recognized only when a deliverable is completed to the established standard. The amount of effort needed to develop a list of deliverables and quality standards is small, on the order of two to five percent of the project, and is a requirement of good project management. The time

NCHRP Project 20-24(11) Task 2 � Asset Management Framework
A-42 Cambridge Systematics, Inc.
interval between deliverables depends to some extent on the type of project and manage-ment style, but should be one week to one month for internal management and no more than three months for systems developed by outside parties.
All information technology initiatives, even Performance Monitoring processes, have sev-eral cost components beyond technology development. These are:
• Testing � The testing requirement can range from 10 percent of a project for turnkey systems, to 50 percent for new development of complex software systems(19). Even if a system is provided by an outside vendor, allow 10 percent for internal testing related to acceptance and deployment. The cost of testing can never be avoided. Even new vis-ual data collection processes, lacking any kind of technology support, need testing.
• Administration � Agencies tend to differ in their administrative cost factors, usually because of differences in how they account for support and overhead costs. This should be estimated and tracked from accounting data.
• Written Documentation � In some cases, such as the object-oriented analysis, docu-mentation is the entire deliverable. In other cases, such as deploying off-the-shelf soft-ware, documentation cost is limited to how the new system fits into existing business processes. The productivity of technical writers in an organization is relatively easy to measure. Ref. (17) provides a very thorough treatment of documentation costs.
• Training � An allowance for training should be made in any new technology initiative. For systems delivered by outside vendors, a �train the trainer� model is usually best, as discussed earlier.
• Support � The costs of a help desk, vendor support, and user-to-user support should be factored in.
Technology projects are subject to the same problems of cost estimation and scope creep as construction projects. Often the problem can be traced to a disorganized scoping proc-ess, where the person estimating the project does not have access to reliable information on unit costs and is not able to quantify all of the scope elements that will be needed to complete the project. In the same way that asset management needs work accomplish-ment data in order to validate costing assumptions, information technology needs similar tracking data to develop and validate technology cost assumptions.
Cultural Development
A difficult but very important aspect of the process assessment is the depth of institution-alization of information technology and the asset management process. As described in Ref. (11), depth can be evaluated at three levels:
1. Agency Administrative Level � Organizational structure has been modified as needed to support the process. Teams have been formed and resources allocated to pursue specific initiatives to advance the process.

NCHRP Project 20-24(11) Task 2 � Asset Management Framework
Cambridge Systematics, Inc. A-43
2. Project and Team Level � Project managers focus on performance measures and quantitative accomplishments of the process as a whole, and not just on the work of individuals. This helps to align projects with the agency-level performance framework.
3. Personal Level � Individual decision-makers define their job requirements in terms of the process, measuring their success according to its contribution to agency-wide objectives as evidenced by the performance measurement framework. Decision-makers feel blinded if the decision-support information is for any reason withdrawn, such as by a system outage.
Institutionalization at the first level can cause systems to be developed and placed on people�s desks, but it cannot ensure that the systems are useful. At the second level, the systems are likely to be useful, but might not be used. Only at the third level are they used, so only there do they contribute to process maturity.
This depth of implementation is an extremely important thing to look for and measure in the process assessment. If a decision-maker reports that a priority-setting application is available on his desk, but is not very useful, this is important information for deciding what to do next. It may mean that the maturity level of this part of the organization is not at the level of the tool, which points to questions to ask to determine the true maturity level. For example, perhaps the data quality is insufficient, or training has not been pro-vided, or system interfaces are not far enough along to provide the full set of data required, or the decision-maker does not know how the tool relates to his performance expectations. If the maturity level is adequate, then this information may mean that the project team that developed the tool needs revised guidance on management needs that may have changed.
An important thing to keep in mind about institutionalization is that it takes time. Although there is a valid role for salesmanship and even a bit of �arm-twisting� to develop interest in process improvement, personal experience is what makes the largest difference. A decision-maker is unlikely to become interested in life-cycle cost analysis unless she is already sure that a sufficient quality of condition data are available. She is most likely to become convinced of this if she has seen condition-based reports, in a form she can verify for herself, come across her desk for an extended period of time. Her confi-dence level will increase faster if she has seen reports from an auditing process, showing an improvement in error rates over time.
��������A.5 Conclusions
Information technology support of asset management is an integrated system, in the sense that it is a highly coordinated set of human activities and computer systems that work together to provide support to decision-makers. However, this does not mean that it is one big computer system.

NCHRP Project 20-24(11) Task 2 � Asset Management Framework
A-44 Cambridge Systematics, Inc.
Because of its complexity and the large number of people involved, it is more useful to think of an asset management system as a collection of decision-support applications, tied together by an ongoing process. A large computer system is opaque, hard to understand, inflexible, expensive, and risky. A process is transparent, understandable to management, can readily be tuned and improved, can be sized to fit an agency�s resources, and is controllable.
When viewed as a process, asset management technology is subject to the philosophy and techniques of continuous improvement. This approach involves understanding how the parts of the process work together to affect its outcome, how to identify the parts that need improvement the most, and how over time to bring all parts of the process along in concert to increase its overall maturity.

Appendix B

NCHRP Project 20-24(11) Task 2 � Asset Management Framework
Cambridge Systematics, Inc. B-1
Implications of GASB Statement 34
��������B-1 Introduction
The Governmental Accounting Standards Board (GASB) is a private, non-profit organiza-tion that sets financial reporting standards for state and local governments throughout the U.S. In June 1999 GASB issued Statement 34, which updates these requirements and introduces new information in a government�s financial reports.(2) An important change in Statement 34 that affects DOTs and other transportation agencies is the inclusion of capital infrastructure assets in these reports. Infrastructure assets are defined by GASB as �long-lived capital assets that normally are stationary in nature and normally can be pre-served for a significantly greater number of years than most capital assets.�7 Roads, bridges, and tunnels are among these infrastructure assets, as are other types of public works infrastructure: e.g., water and sewer systems, dams, drainage systems, and lighting systems. Buildings are not included in GASB�s definition of infrastructure for purposes of Statement 34, unless they are ancillary to a network of infrastructure assets (e.g., rest area buildings, or maintenance depots attached to a highway network).
By now including infrastructure in financial reports, Statement 34 promotes more com-plete disclosure of governmental operations, better accountability for stewardship of a highly valued class of capital assets, and additional information useful for economic, social, and political decisions. If structured correctly, this information can play an impor-tant role in an agency�s overall transportation asset management. Financial reports that conform to the standards of GASB 34 can contribute additional information on the status and future condition and cost of transportation infrastructure; moreover, an agency that practices good asset management principles should have no problem in meeting the GASB financial reporting requirements. While transportation asset management and GASB 34 are not the same, they can represent very complementary and mutually rein-forcing activities.
In addition to Statement 34 itself, several other sources are available to guide DOTs in meeting the new infrastructure reporting requirements:
• GASB has prepared an Implementation Guide that provides questions and answers to assist agencies in responding to the standards in Statement 34.(20)
• A number of supporting papers, articles, and examples are available on GASB�s web site.(21)
• The Federal Highway Administration has published a summary of the GASB standards as related to transportation infrastructure, with illustrations of reports and
7 Ref. (2), paragraph 19.

NCHRP Project 20-24(11) Task 2 � Asset Management Framework
B-2 Cambridge Systematics, Inc.
management�s discussion and analysis, and a discussion of asset management as it relates to GASB 34.(22)
• Other commentary on GASB 34 appears in publications and web sites of DOT technol-ogy transfer centers, professional associations, and trade journals.
The basics of infrastructure financial reporting in terms of methodology, schedule of implementation, transition period milestone dates, and agency criteria for implementation have been well covered in these sources. Much of this material will not be duplicated here; rather, this section focuses on the relationship of GASB Statement 34 to transporta-tion asset management and its concepts, methods and tools. The purpose is to show how agencies can bring their asset management and their financial reporting activities to work together to provide consistent information on the status and future needs of transporta-tion infrastructure. An underlying theme is that agencies already possess several capa-bilities that can be used to advantage, and at little additional cost, for both better asset management and GASB 34.
Statement 34 provides guidance on the format and content of the required information on infrastructure. However, it leaves several important decisions on specifics � e.g., choice of reporting method, classification of networks and subsystems of infrastructure assets, and assignment of applicable condition levels � to the respective managing and financial reporting agencies. While the following sections provide examples that relate GASB stan-dards and asset management, the decisions on the actual methods and values to be used should be made by DOTs in consultation with their state financial administrators.
Section B.2 covers general information on transportation infrastructure assets called for by GASB Statement 34 in the depreciation and the modified approaches, respectively. It summarizes required characteristics of this information and presents an overall compari-son of the modified and depreciation methods, pointing out relevance to good asset man-agement practice where appropriate. Since GASB 34 refers to collections of assets explicitly � e.g., in major asset classes, networks, or subsystems � there is also a discussion of network effects on computations, and their implications for the modified and deprecia-tion approaches. Following this general information, there are two sections that go into more detail on the relationship between GASB 34 and transportation asset management. Section B.3 provides this context for the modified approach, and Section B.4, for the depreciation approach.
��������B.2 Information on Transportation Infrastructure Assets
Organization of Information
The GASB standards allow flexibility in how DOTs organize, analyze, and report infor-mation on their transportation infrastructure, so long as the approach meets the needs of the particular reporting method used. The advantage of this guideline approach is that it accommodates the different types of infrastructure networks, methods of condition assessment, management systems, and information capabilities of each transportation

NCHRP Project 20-24(11) Task 2 � Asset Management Framework
Cambridge Systematics, Inc. B-3
agency. Calculations and reporting of infrastructure may be made at several levels depending upon the reporting method used, including the following:8
• Major class of asset: e.g., public works infrastructure as one of several classes of capital assets, or transportation infrastructure as one of several categories of public works infrastructure (allowed for the depreciation approach only);
• Networks, which are groups of assets or components of assets that, taken collectively, provide an overall service: e.g., a road or rail network, or separate highway networks comprising roadways and bridge structures, respectively (allowed for the depreciation and the modified approaches);
• Subsystems of networks, which comprise network assets and components that are similar, and that provide a particular type or level of service: e.g., Interstate highways within a road network, residential streets within a municipal network, or high-speed track within a rail network (allowed for the depreciation and the modified approaches); and
• Individual assets, if there is a need to analyze these separately: e.g., major bridges and intermodal facilities (allowed for the depreciation approach only).
The thrust of the GASB standards is toward viewing infrastructure as a system of assets, rather than by individual asset or component. This approach simplifies analyses and reporting, and enables agencies to apply information already available at a network or program level. In considering a highway system, for example, an agency may analyze it at the level of a network of assets (e.g., a roadway network or a network of bridge spans), by functional subsystem of the network (e.g., Interstate, National Highway System (NHS), and Other Roads), by type-of-surface subsystem (e.g., asphalt-paved, concrete-paved), or by other definitions of subsystems.9 Reports may be presented at one level, with sup-porting information documented at a more detailed level.
From an engineering perspective, transportation systems such as highway networks have many asset components that DOTs often manage within individual inventories and man-agement systems. For example, a �roadway� may include the pavement and shoulder structure; roadbed and embankment; traffic signs, signals, and markings; guardrail and appurtenances; subsurface drainage; and lighting, among other components. It is com-mon for DOTs to track the condition, work accomplishment, and expenditures associated with these items in specialized management systems or as part of highway maintenance management. For purposes of financial reporting, however: If an agency chooses to
8 Major asset classes, networks, and subsystems of assets are discussed in several parts of Ref. (2),
including paragraphs 19, 20, 22, 23, 150, and 156. Examples of major asset classes are given in paragraph 20; and of networks and subsystems of assets, in footnotes to paragraph 22. Major general infrastructure assets, which are discussed with respect to retroactive reporting of infrastructure, are defined in a footnote to paragraph 148; criteria for these assets are defined at a network and subsystem level in paragraph 156. Exercise 10 in Ref. (20) illustrates the determination of major general infrastructure networks.
9 Refer to Q&A 67 in Ref. (20) for additional examples.
NCHRP Project 20-24(11) Task 2 � Asset Management Framework
B-4 Cambridge Systematics, Inc.
capitalize all of these items collectively as part of a highway transportation system, then information for all of these items would be reported as part of a roadway network or sub-system overall.
Reporting assets as a network or subsystem, rather than by individual asset or component, affects how certain calculations are structured, and is required if the modified approach is used (refer to next section). These points will be discussed further below.
Initial Capitalization of Assets
Statement 34 requires that infrastructure assets be reported as part of the government-wide statement of net assets. The value reported establishes the initial capitalization amount of this infrastructure. Assets are to be expressed in actual, or historical, cost. If data are not available to document historical cost, estimates may be used. Any estimation method complying with Statement 34 may be applied; examples of appropriate methods include the following:
• Calculate the current replacement cost of similar infrastructure, and deflate this cost to the historical year in which the infrastructure in question was constructed or last sig-nificantly reconstructed or improved.
• Estimate historical cost from supporting information in, for example, bond documents, engineering reports, capital program or project expenditure records, or minutes of meetings.
In terms of transportation asset management, this initial capitalization amount for infra-structure provides context for discussing and justifying recommended transportation pro-grams and strategies. Transportation infrastructure has come to represent hundreds of billions of dollars in investment by all levels of government. The reporting of this capi-talization amount as called for by GASB 34 provides a quantitative basis for the total value of transportation infrastructure in place.
Methods to Report Transportation Infrastructure Assets
Choice of Reporting Methods
Statement 34 allows two methods for reporting infrastructure assets specifically: a depre-ciation approach, and a modified approach.
Capital assets are typically depreciated through their useful lives and are reported net of accumulated depreciation in the statement of net assets, according to GASB standards. Exceptions include inexhaustible capital assets such as land and land improvements. Depreciation expense may be calculated at the level of an asset class, a network, a subsys-tem, or an individual asset. It is computed by allocating the net cost of depreciable assets

NCHRP Project 20-24(11) Task 2 � Asset Management Framework
Cambridge Systematics, Inc. B-5
(historical cost less residual value10) over their estimated useful lives. In applying the depreciation approach, activities that preserve the asset (i.e., that extend its useful life, but that do not provide additional capacity or efficiency) are capitalized11; activities that maintain the asset but do not extend its useful life are expensed.
Based upon discussions with AASHTO, the FHWA, and other organizations, however, GASB recognized that transportation and other types of public infrastructure networks do not depreciate in the sense normally associated with equipment, for example. Rather, infrastructure systems have very long or indefinite lives that are sustained through a combination of maintenance and preservation. Moreover, DOTs have for many years employed management systems that track infrastructure condition and employ decision rules to help identify needed repairs and their costs. The modified approach for infra-structure asset reporting was developed to address these characteristics of infrastructure assets. Agencies that meet certain criteria in their management practices have the option of reporting eligible infrastructure assets by the modified approach, in which case these assets are not depreciated. Agencies retain the option, however, of depreciating these infrastructure assets instead if they so choose. Agencies may also elect to report certain networks or subsystems of infrastructure assets according to the modified approach, but to depreciate others, even though they too are eligible for use of the modified approach.
Requirements of the Modified Approach
The modified approach requires certain criteria to be met by both the managing agency and the infrastructure being considered:
1. The infrastructure assets must be part of a network or subsystem of assets. Such assets are termed �eligible� for the modified approach;
2. The agency must manage these eligible assets using a management system that has the characteristics described below; and
3. The agency must document that these eligible assets are being preserved approxi-mately at or above a condition level disclosed by the agency.
The first criterion states that infrastructure assets must be part of a systematic grouping to be eligible for the modified approach. By extension, the management system capabilities, condition measure, and target condition level required by items 2 and 3 must also apply to this network or subsystem. Recall, however, that agencies have flexibility in defining their networks and subsystems in a way that conforms to their infrastructure asset inventory and management practices.
10 The residual value of infrastructure assets may be negligible after demolition and removal costs
are accounted for, as noted in the response to Question 45 in Ref. (20). 11 If the activity is, for example, a pavement overlay that restores strength lost through deterioration
of the old surface layer, the cost of the overlay is added to the capitalization amount, and the cost and accumulated deterioration associated with the old surface layer are removed. Refer to Q&A 41 in Ref. (20).

NCHRP Project 20-24(11) Task 2 � Asset Management Framework
B-6 Cambridge Systematics, Inc.
The second criterion calls for a management system that meets the following requirements:
• It maintains a current inventory of the eligible assets;
• Its data on the condition of eligible assets must be based upon periodic field surveys. These surveys must be performed at least every three years, and they may be based upon statistical samples. They must be conducted by or contracted for by the man-aging agency. The resulting condition assessments must be substantially replicable, and should be expressed by a quantitative measure or index.
• It must be able to estimate each year the annual amount needed to maintain and pre-serve the eligible assets at or above the target condition level disclosed by the agency.
The third criterion calls for the agency to document, based upon the most recent series of condition surveys and assessments, that the eligible assets are indeed serving at a condi-tion level at or above the target disclosed by the agency. This intended condition level must reflect high-level policy established by administrative or executive decision or by legislative action.
These criteria are meant to address substantial or material items, and to allow agencies reasonable flexibility in meeting them. For example, in establishing quantitative condition assessments, agencies may select measures or indexes that conform best to their engi-neering practice and customer expectations: i.e., accounting for the types of eligible infra-structure assets, their materials properties, geographic and climatic conditions, and other factors affecting performance and serviceability. Asset conditions that briefly fall below intended condition levels by a small amount do not necessarily violate the criteria above, provided the overall trend maintains conditions above the disclosed condition level.12 Condition levels may be staged over the long term to represent, for example, a progressive trend of incremental improvement, but specific levels must be disclosed each year. If war-ranted, agencies may issue revised condition levels for infrastructure assets; these must still reflect high-level policy direction, however, and be disclosed in the financial reports. All of these options, handled properly, are consistent with good asset management practice.
If these requirements of the modified approach cannot be met in a substantial or material way, then the agency must revert in the following year to the depreciation approach for the network or subsystem in question.
12 Comparisons to the disclosed condition level are formally evaluated only after completed
condition assessment cycles. For example, if it takes three years to complete the assessment of all assets in a network or subsystem, the determination of whether the condition level has been met (and this requirement of the modified approach has been satisfied) is made at the conclusion of the cycle � i.e., in the third year. Refer to Ref. (2), paragraph 24, and Q&A 64 and 65 in Ref. (20).

NCHRP Project 20-24(11) Task 2 � Asset Management Framework
Cambridge Systematics, Inc. B-7
Comparison of Methods
A comparison of the two methods from the perspective of financial reporting is presented in Table B.1. The modified approach is shown first, since it reflects practices closely related to those of good asset management that were discussed in Sections 2.0 and 3.0 of this report. Nonetheless, if an agency chooses to employ the depreciation method for one or more types of infrastructure assets, there are ways to improve its usefulness as well for asset management. These methods will be discussed in more detail in Sections B.3 and B.4, respectively, regarding their relationship to asset management.
Table B.1 Comparison of GASB Modified and Depreciation Approaches
Item Modified Approach Depreciation Approach
Assumptions • Indefinite useful life
• Deterioration arrested through continual maintenance, rehabilita-tion, or replacement
• Estimated useful life for depreciation
• Net asset value exhausted when fully depreciated until recapitalized
Allowable scope of application
• Networks of assets
• Subsystems of networks
• Classes of assets
• Networks of assets
• Subsystems of networks
• Individual assets Preservation (e.g., rehabilitation or replacement)
• Treated as expense
• Impact reflected in sustained or improved network condition as monitored in periodic surveys
• Treated as recapitalization of asset or portion thereof
• Impact reflected as positive adjust-ment to net asset value
Maintenance • Treated as expense
• Impact may be reflected in rate of deterioration used in management systems
• Treated as expense
• Impact reflected in rate of depreciation
Changes in net asset value
• Use actual (historical) or estimated historical cost
• Net value of in-service assets remains constant over time, with no depreciation or recapitalization
• Adjustments due to added new capacity or efficiency (+) or abandonment (�)
• Use actual (historical) or estimated historical cost
• Net value of in-service assets changes each period due to depre-ciation or recapitalization
• Adjustments due to depreciation (�), recapitalization (+), added new capacity or efficiency (+), or abandonment (�)

NCHRP Project 20-24(11) Task 2 � Asset Management Framework
B-8 Cambridge Systematics, Inc.
Accounting for Network Effects
Examples in GASB Standards
Both the modified and the depreciation methods will usually be applied to collections of infrastructure assets, which may be organized within major asset classes, networks, or subsystems. Several practical requirements of dealing with these collections of assets are embodied in GASB standards: e.g.,
• If a subsystem of assets is reported using the modified approach, then the associated management system and financial report documentation13 called for by the GASB stan-dards must likewise apply to this subsystem (Ref. (2), paragraphs 23, 24, and 132).
• Agencies may use only one method to assess the condition of an individual network or subsystem, and use of that method must be consistent throughout each complete assessment cycle (Ref. (2), paragraphs 23, 24, 132, and 133; Ref. (20), Q&A 75 and 255).
• If multiple agencies report parts of the same network or subsystem, the same approach should be used by each agency (Ref. (20), Q&A 56).
These standards reinforce several objectives consistent with good asset management, including clarity in analyses and reports, relevance of analytic tools and management information to the assets at hand, consistency of condition measurements and target condition levels with the infrastructure assets considered, and simplification of calcula-tions where warranted. There is an additional implication that is not addressed directly by the GASB standards, however, which is important to computing rates of deterioration and depreciation for collections of assets as opposed to individual assets. This �network effect� is described in the following section.
Network Effects in Deterioration and Depreciation
Changes in assets over time are reflected in both the modified and the depreciation approaches.
In the modified approach, changes in assets are reported in terms of asset condition as compared to the intended condition level. These changes in asset condition are estimated by transportation asset management systems using deterioration models, which account for the effects of factors such as existing condition, traffic, environment, structural and materials properties, age, and level of maintenance. Since these models are applied sequentially to each asset within a network or subsystem, with the results summed or averaged for the group as a whole, asset management systems automatically account for network effects on changes in infrastructure condition.
In the depreciation approach, changes in assets are reported as depreciation expenses, not condition. The choice of the depreciation model(s) and the scope of application (to asset 13 Required Supplemental Information, or RSI.

NCHRP Project 20-24(11) Task 2 � Asset Management Framework
Cambridge Systematics, Inc. B-9
classes, networks, subsystems, or individual assets) is left to the managing agency. Any established depreciation method may be used, so long as it is systematic and rational. Straight-line depreciation is the simplest and perhaps best known, but others can be cho-sen that are non-linear.14 Because important transportation assets such as pavements or bridge decks are described by deterioration models that are non-linear, there may be a tendency to want to choose non-linear depreciation models for these assets. The following example explores this assumption.
Figure B.1 illustrates a sample deterioration function for a single asset: e.g., one segment of pavement, or a single bridge deck. Assume that its form is that of a logit function or �S-shaped� model for generality and simplicity; however, the findings below apply as well to other functional forms. The condition scale is likewise generalized, with 100 repre-senting excellent condition and 0, failed condition. The asset is assumed to be taken out of service just prior to reaching condition level 25, which occurs between years 15 and 20 in Figure B.1. Now assume a network or subsystem of similar assets, all subject to this same deterioration model. The question is: What is the average deterioration trend in this col-lection of similar assets?
Figure B.1 Example Deterioration Curve for a Single Asset
Condition
0
10
20
30
40
50
60
70
80
90
100
0 5 10 15 20 25Time
14 Refer to Ref. (20), Q&A 44 for examples.

NCHRP Project 20-24(11) Task 2 � Asset Management Framework
B-10 Cambridge Systematics, Inc.
The answer depends upon the distribution of current conditions of the assets � in effect, their age distribution. If all of the assets were built or renewed at essentially the same time, the network deterioration curve would track very closely to the model for a single asset. However, if the ages are distributed in a spectrum from new to old, then the net-work trend would appear as shown by the second curve in Figure B.2. This curve was generated by assuming a collection of assets with uniformly distributed ages, with all assets subject to the deterioration function in Figure B.1. The network curve is essentially linear, with explanation as follows. In the network example, the current conditions of the assets can be displayed as points that fall along the full length of the deterioration curve in Figure B.1. This means that some of the assets are deteriorating at a rapid rate (i.e., those older than 10 years), while others are deteriorating at a slower rate (i.e., those younger than 10 years). The resulting effect is for these different rates of change to offset one another so that the composite rate of deterioration for the network or subsystem as a whole is essentially linear, with a slope midway between the maximum and the minimum rates of deterioration for a single asset.
This example suggests that a linear depreciation schedule may be the most appropriate one to select for a collection of similar assets in a subsystem or network. A uniform distri-bution of asset age or current condition would not be unusual in a DOT asset inventory. It would be the expected result of a history where annual program funding and accom-plishment targets (e.g., miles of roadway or numbers of structures constructed, rehabili-tated, and maintained) have tracked a stable path from year to year. Even if the distribution of asset ages or current conditions is not exactly uniform, the linear model may still represent a good approximation. Deviations from a uniform distribution of age or current condition might result, for example, from clusters of assets built during peak construction periods, or from significant fluctuations in past funding. Nonetheless, in a subsystem with large numbers of individual assets as is often the case in transportation, there is a �homogenization� of condition and performance data at an aggregate level that smoothens the average deterioration trend. In summary, the more assets in a subsystem and the more uniform their distributions of current condition or age, the more likely that a linear depreciation model is a reasonable choice for the depreciation approach to GASB 34 financial reporting.

NCHRP Project 20-24(11) Task 2 � Asset Management Framework
Cambridge Systematics, Inc. B-11
Figure B.2 Example Curves for a Single Asset and a Group or Collection of Assets
Condition
0
10
20
30
40
50
60
70
80
90
100
0 5 10 15 20 25Time
Single Asset
Network of Assetswith Uniformly
Distributed Ages
To clarify once again, the phenomenon illustrated in Figures B.1 and B.2 applies to the modified approach as well, although it may not be as apparent since it is accounted for internally within asset management systems. The network effect smoothens the aggregate deterioration curve for a subsystem of assets, bringing it closer to a linear deterioration model.
��������B.3 Application of the Modified Approach
GASB Requirements and Asset Management Capabilities
The information called for in the modified approach relates directly to good practice in transportation asset management. This is not to say that the two concepts are identical. The modified approach is for financial reporting specifically, and good asset management practices go beyond the information and procedures specified for the modified approach. Nonetheless, properly applied, the two concepts are consistent and reinforce each other in the following ways:

NCHRP Project 20-24(11) Task 2 � Asset Management Framework
B-12 Cambridge Systematics, Inc.
• An agency that practices good asset management should find the GASB 34 modified approach consistent with its current practices and straightforward to comply with; and
• An agency that applies the modified approach correctly will find the information use-ful for its transportation asset management.
Table B.2 restructures the information required by the modified approach in a way that is meaningful for performance-based asset management. The four cells of the table set up comparisons between actual and intended asset condition in a network or subsystem, and between actual and intended maintenance and preservation expenditures to achieve these respective condition values. Each cell of this table identifies the specific information called for by GASB, with references to Statement 34(2) and key supporting information in the GASB Implementation Guide(20). The descriptions in Table B.2 are brief and focus on essential points. For example, it is presumed that the assets in question are eligible for use of the modified approach, so this requirement is not repeated in the table entries.15
A corresponding structure of basic asset management capabilities and procedures is shown in Table B.3. Table B.3 builds upon the concepts and principles of asset manage-ment practice in Sections 2.0 and 3.0 to outline procedures for responding to the GASB infrastructure reporting standards. Since policy goals and objectives, performance-based planning and project selection, program delivery monitoring, and system performance monitoring are all staples of effective asset management, the procedures in Table B.3 are natural extensions of these techniques.
Additional points to note for each cell of Table B.3 are as follows:
• Surveys of actual infrastructure condition � GASB requires consistency in the method, basis, and scale of infrastructure condition surveys. While survey techniques can be changed and new technology introduced, these changes must be accomplished at the completion of a survey: i.e., when the condition of the entire network or subsystem has been assessed. GASB standards allow periods up to three years to obtain a complete assessment, including the use of statistical sampling.
15 Refer to Section B.2 for more detailed descriptions of the standards of the modified approach if
needed.

NCHRP Project 20-24(11) Task 2 � Asset Management Framework
Cambridge Systematics, Inc. B-13
Table B.2 Requirements of the Modified Approach Organized for Asset Management
Asset Condition Maintenance and
Preservation Expenditures
Actual • Maintain asset inventory and conduct condition assessments at least every 3 years using a management system
• Report assessments as RSI for at least the 3 most recent complete cycles (potentially 3 to 9 years of data), with dates of assessments
• Disclose basis of condition measure-ment and measurement scale used, or any change in assessment method, basis, or scale, in notes to RSI
• Disclose any factors that significantly affect reported trends in notes to RSI
• References: Ref. (2) Para. 24, 132, 133; Ref. (20) Q&A 255
• Expense all expenditures for assets, excluding additions and improvements, in period incurred
• Compare to intended expenditures needed to meet or exceed disclosed con-dition level; report comparison as RSI for each of past 5 reporting periods
• Disclose any factors that significantly affect trends reported in notes to RSI
• References: Ref. (2) Para. 25, 133
Intended • Establish intended condition level by administrative or executive policy or legislative action
• Disclose intended condition level, or changes in this level, in notes to RSI
• Disclose any factors that significantly affect trends reported in notes to RSI
• References: Ref. (2) Para. 23, 133; Ref. (20) Q&A 65, 70, 71
• Employ a management system able to estimate annual expenditure needed to maintain and preserve assets at dis-closed condition level
• Calculate this amount at beginning of fiscal year
• Compare to amounts actually expensed; report comparison as RSI for each of past 5 reporting periods
• Disclose any factors that significantly affect trends reported in notes to RSI
• References: Ref. (2) Para. 23, 132, 133

NCHRP Project 20-24(11) Task 2 � Asset Management Framework
B-14 Cambridge Systematics, Inc.
Table B.3 Example Asset Management Actions Supporting the Modified Approach
Asset Condition Maintenance and
Preservation Expenditures
Actual • Conduct periodic surveys of asset condition using consistent, replicable methods
• Analyze raw data for quality control and to compute condition measures
• Process data in asset management sys-tems to update inventory condition and performance
• Report condition and performance measures and trends by network and subsystem
• Report factors that significantly affected infrastructure condition in relation to intended target
• Compile financial management and accounting information on capital and maintenance program expenditures by network or subsystem
• Analyze program, financial, and project information to identify (a) expenditures for maintenance and preservation of assets, and (b) expenditures associated with additions and improvements
• Compile �maintenance and preserva-tion� expenditures from all relevant programs
• Report factors that significantly affected expenditures in relation to intended levels and programs
Intended • Communicate information on current and projected system condition to inform governing bodies in policy formulation
• Work with governing bodies in defining policy goals and objectives supporting effective asset management and consistent with program resources
• Express policy goals and objectives as target condition levels by network or subsystem, to be disclosed in notes to RSI
• Monitor program delivery and docu-ment factors significantly affecting intended goals and objectives or target condition levels
• Apply management systems to estimate projected annual expenditures needed to preserve and maintain assets at disclosed condition level
• Estimate these annual expenditures for networks and subsystems at beginning of fiscal year
• Monitor program delivery to document factors significantly affecting intended expenditures
• Documentation of actual expenditures for maintenance and preservation � Actual expenditures for maintenance and preservation can be obtained from financial man-agement and accounting data on construction and maintenance programs.
− For construction programs, identification of projects by program category and reviews of typical projects, if needed, can assist in distinguishing significant

NCHRP Project 20-24(11) Task 2 � Asset Management Framework
Cambridge Systematics, Inc. B-15
�additions and improvements� from �preservation.� Note that �preservation� expenditures in this context may include not only amounts from programs associ-ated with rehabilitation or reconstruction projects, but also amounts from safety programs and those portions of system improvement and expansion programs that do not contribute to increased capacity or efficiency. The full cost of capital �preser-vation� programs should be reported, including preliminary engineering activities, construction management and inspection, traffic operations during construction, and project closeout.
− For maintenance programs, generally the entire amount of program expenditures can be included. The full cost of the maintenance program should be reported, including activities for travel time, mobilization, traffic control, equipment mainte-nance, yard maintenance, training, and other �indirect� activities. If a maintenance management system (MMS) is used to estimate total program costs, a comparison of MMS totals with those of the agency�s financial management system can be used to estimate the adjustment factor needed to convert MMS data to a �total cost� basis.
• Estimated Expenditures to Meet Condition Levels � A DOT�s asset management sys-tems must be used in the modified approach to estimate the expenditures needed to achieve the intended condition level. This process is illustrated with an example in the following section.
Application of Management Systems
Agencies already possess several capabilities that can be used at little additional cost to improve both asset management and GASB 34 reporting through the modified approach. The asset management systems that may typically be applied by a DOT in meeting these standards include its pavement management system (PMS), bridge management system (BMS), maintenance management system (MMS), and possibly other systems for specific infrastructure features. The characteristic of interest in these systems is their capability to analyze needed expenditures as a function of target condition levels, network condition constraints, budget constraints, or in the case of maintenance management, levels of serv-ice. This basic capability is referred to as �scenario testing,� and builds upon the set of engineering relationships and mathematical decision rules that are designed into the management system. Section 4.0 discusses scenario testing and its implications for asset management in detail. In terms of the GASB modified approach, scenario testing enables an agency to predict the funding level required to achieve and maintain a condition target.
The cost models of management systems are often developed based upon particular engi-neering assumptions regarding use of the cost results. It may therefore be necessary to adjust the management system results to render them compatible with other data appearing in the infrastructure financial reports discussed in Appendix B. Examples of the types of adjustments that may be needed include the following:
• Adjustments in cost totals to account for additional items that may be included in typi-cal project work. For example, pavement projects may include additional costs for work on ancillary drainage items, guardrail, roadsides, signs, pavement markings, and

NCHRP Project 20-24(11) Task 2 � Asset Management Framework
B-16 Cambridge Systematics, Inc.
so forth. If the PMS estimates do not include these, they may need to be added through, for example, a documented adjustment factor.
• Adjustments in cost totals to account for �indirect� project work, if not already factored into the management system cost models. This work would include, for example, design, construction management and inspection, traffic management and control, and project administration. For maintenance work, adjustments may be needed for travel time, work in yards or for equipment maintenance, allowances for training and other professional or employee services, and other instances of routine, indirect activities.
• Conversions from constant dollar totals to current dollar projections (i.e., including inflation), to match the �actual� dollar amounts called for in Statement 34.
��������B.4 Application of the Depreciation Approach
GASB Statement 34 permits the use of the depreciation approach to report infrastructure assets. Depreciation is not as close as the modified approach to asset management prac-tice for several reasons:
• From an overall perspective, transportation infrastructure does not depreciate in the same way that equipment and other capital assets do. Provided that infrastructure assets are adequately preserved and maintained, it is their relatively long lives that jus-tify GASB�s allowance of the modified approach. Long asset lives effectively reduce annual depreciation expenses to a negligible level.
• Depreciation procedures follow standard accounting conventions, which may not cor-relate to the needs of transportation asset management. For example, the cost basis of depreciable assets is historical cost, reduced each year by a depreciation amount; how-ever, expenditures for repair or renewal are in current-year dollars, which in general will not match the depreciation expense.
• By their nature, depreciation calculations do not make direct use of an agency�s man-agement systems or other analytic and informational tools at the agency�s disposal. Supporting information and computations therefore need to be established outside of these IT resources.
Agencies may nevertheless choose, or be required by GASB standards, to apply the depre-ciation approach in infrastructure reporting. While depreciation may not yield ideal information for asset management, there are several steps that a DOT may take to increase the value of information that the depreciation approach does provide: e.g., to identify groups of assets in which there may be underinvestment. Examples of steps that can assist in this process are as follows:
• Divide assets into depreciable and non-depreciable components. For example, in a roadway structure, the top layers of pavement and shoulder, which may be recycled or overlaid, could constitute the depreciable component of the structure. Other

NCHRP Project 20-24(11) Task 2 � Asset Management Framework
Cambridge Systematics, Inc. B-17
components, including the pavement foundation, roadbed or embankment, and major drainage items could be considered non-depreciable. In a bridge, the deck and certain elements of the superstructure and substructure (particularly those that require the most frequent and significant rehabilitation or replacement) could be depreciable; other elements could be considered non-depreciable. While this exercise requires profes-sional judgment, the objective is to focus attention on those items that account for the most frequent major expenditures for preservation and maintenance. Judging certain items as non-depreciable does not mean that they do not deteriorate or that they never require preservation; it only means that, as an approximation, they do not contribute significantly to the depreciation calculation.
• Identify depreciation models and estimated useful lives that reflect the in-service lives of the depreciable components of assets, as judged by typical intervals between preser-vation projects, for example. For many collections of transportation assets, a straight-line depreciation schedule may be suitable as suggested in Figure B.2. Estimates of useful life can reflect average values if collections of assets (e.g., by asset class, network, or subsystem) are considered. GASB permits the use of composite and group depre-ciation rates, which may be applied to simplify calculations where warranted.
• Update depreciation estimates periodically, as permitted by GASB 34. Depreciation rates reflect a number of factors with respect to infrastructure, including the quality of initial construction, effect of traffic loads, geographic and climatic effects, maintenance and rehabilitation policies, and technology of construction and maintenance used. The rate of deterioration may need to be adjusted as these factors change, or as assets are removed and new assets added to reported totals as the result of preservation actions. (Several useful items with respect to the deterioration approach are discussed in Ref. (20), Q&A 43-52. Q&A 50-52 are particularly relevant to updates of useful life and to composite and group depreciation rates.)


![PLEDGE FOR A PUBLIC ASSET DECLARATION FRAMEWORK Asset... · 2018-03-02 · PLEDGE FOR A PUBLIC ASSET DECLARATION FRAMEWORK [ 2 ] PLEDGE FOR A PUBLIC ASSET DECLARATION FRAMEWORK I](https://static.fdocuments.in/doc/165x107/5e6cf54805280950a607e14f/pledge-for-a-public-asset-declaration-framework-asset-2018-03-02-pledge-for.jpg)