Timor Leste Suai Airport Consultancy 10 09 2011 Construction Supervision
SERN
ATTACHMENT 2
Tasi Mane - Suai Supply Base EIA
Marine Environment Technical Report
DRAFT
301012-01504-EN-REP-0002
23 March 2012
Level 7, QV1 Building 250 St Georges Terrace Perth WA 6000 Australia Tel: +61 8 9278 8111 Fax: +61 8 9278 8110 www.worleyparsons.com WorleyParsons Services Pty Ltd ABN 61 001 279 812
© Copyright 2012 WorleyParsons Services Pty Ltd

SERN
TIMOR LESTE SOUTH COAST EIA
MARINE ENVIRONMENT SUAI TECHNICAL REPORT
PROJECT 301012-01406-EN-R – TIMOR LESTE SOUTH COAST EIA
REV DESCRIPTION ORIG REVIEW WORLEY- PARSONS APPROVAL
DATE CLIENT APPROVAL
DATE
A Issued for internal review
E McGinty
H Houridis
N/A
12-03-12 N/A
B Issued for client review
23 Mar 12
Disclaimer
This report has been prepared on behalf of and for the exclusive use of the Democratic Republic
of Timor-Leste, and is subject to and issued in accordance with the agreement between the
Democratic Republic of Timor-Leste and WorleyParsons Services Pty Ltd. WorleyParsons
Services Pty Ltd accepts no liability or responsibility whatsoever for it in respect of any use of or
reliance upon this report by any third party.
Copying this report without the permission of the Democratic Republic of Timor-Leste or
WorleyParsons Services Pty Ltd is not permitted.

SERN
TIMOR LESTE SOUTH COAST EIA
MARINE ENVIRONMENT SUAI TECHNICAL REPORT
Page 1 301012-01406-EN-R : Rev B
CONTENTS
1. INTRODUCTION ................................................................................................................ 4
1.1 Project Setting ..................................................................................................................... 4
1.2 Study Objectives ................................................................................................................. 4
1.3 Regulatory Context ............................................................................................................. 6
2. REGIONAL PERSPECTIVE ............................................................................................... 8
2.1 Climate ................................................................................................................................ 8
2.2 Biogeography ...................................................................................................................... 8
2.3 Bathymetry .......................................................................................................................... 9
2.4 Tides ................................................................................................................................... 9
2.5 Water Temperature ............................................................................................................. 9
2.6 Coastal Processes .............................................................................................................. 9
2.7 Biological Environment ..................................................................................................... 10
2.7.1 Mangroves ........................................................................................................... 10
2.7.2 Intertidal ............................................................................................................... 10
2.7.3 Coral Reefs .......................................................................................................... 11
2.7.4 Offshore Benthic Habitats .................................................................................... 11
2.7.5 Marine Fauna ....................................................................................................... 11
2.7.6 Marine Protected Areas ....................................................................................... 12
3. FIELD METHODS ............................................................................................................. 13
3.1 Sampling Locations........................................................................................................... 13
3.2 Water Quality .................................................................................................................... 16
3.2.1 Physicochemical Profiling .................................................................................... 16
3.2.2 Chemical Sampling .............................................................................................. 16
3.2.3 Water Quality Criteria ........................................................................................... 16
3.2.4 Data Analysis ....................................................................................................... 17
3.3 Sediment Quality............................................................................................................... 17
SERN
TIMOR LESTE SOUTH COAST EIA
MARINE ENVIRONMENT SUAI TECHNICAL REPORT
Page 2 301012-01406-EN-R : Rev B
3.3.1 Sample Collection ................................................................................................ 17
3.3.2 Chemical Testing ................................................................................................. 17
3.3.3 Sediment Quality Criteria ..................................................................................... 17
3.3.4 Data Analysis ....................................................................................................... 17
3.4 Benthic Habitat .................................................................................................................. 18
3.4.1 Data Collection and Mapping ............................................................................... 18
3.4.2 Data Analysis ....................................................................................................... 18
3.5 Plankton ............................................................................................................................ 20
3.5.1 Sample Collection ................................................................................................ 20
3.5.2 Laboratory Analysis ............................................................................................. 20
3.5.3 Statistical Analysis ............................................................................................... 20
3.6 Infauna .............................................................................................................................. 21
3.6.1 Sample Collection ................................................................................................ 21
3.6.2 Laboratory Method ............................................................................................... 21
3.6.3 Statistical Analysis ............................................................................................... 22
3.7 Quality Control and Assurance ......................................................................................... 22
4. RESULTS ......................................................................................................................... 23
4.1 Water Quality .................................................................................................................... 23
4.1.1 Physicochemical Water Quality ........................................................................... 23
4.1.2 Chemical Water Quality ....................................................................................... 29
4.2 Sediment Quality............................................................................................................... 36
4.2.1 Chemical Sediment Quality .................................................................................. 36
4.2.2 Particle Size ......................................................................................................... 40
4.3 Benthic Habitat .................................................................................................................. 42
4.3.1 Substrate .............................................................................................................. 42
4.3.2 Biota ..................................................................................................................... 42
4.3.3 Reef Adjacent to Development Area ................................................................... 45
4.4 Plankton ............................................................................................................................ 45

SERN
TIMOR LESTE SOUTH COAST EIA
MARINE ENVIRONMENT SUAI TECHNICAL REPORT
Page 3 301012-01406-EN-R : Rev B
4.4.1 Fish Larvae and Eggs .......................................................................................... 45
4.5 Infauna .............................................................................................................................. 48
5. DISCUSSION .................................................................................................................... 51
5.1 Water Quality .................................................................................................................... 51
5.2 Sediment Quality............................................................................................................... 52
5.3 Benthic Habitat .................................................................................................................. 53
5.4 Plankton ............................................................................................................................ 54
5.5 Infauna .............................................................................................................................. 54
6. CONCLUSION .................................................................................................................. 55
7. REFERENCES ................................................................................................................. 56

SERN
TIMOR LESTE SOUTH COAST EIA
MARINE ENVIRONMENT SUAI TECHNICAL REPORT
Page 4 301012-01406-EN-R : Rev B
1. INTRODUCTION
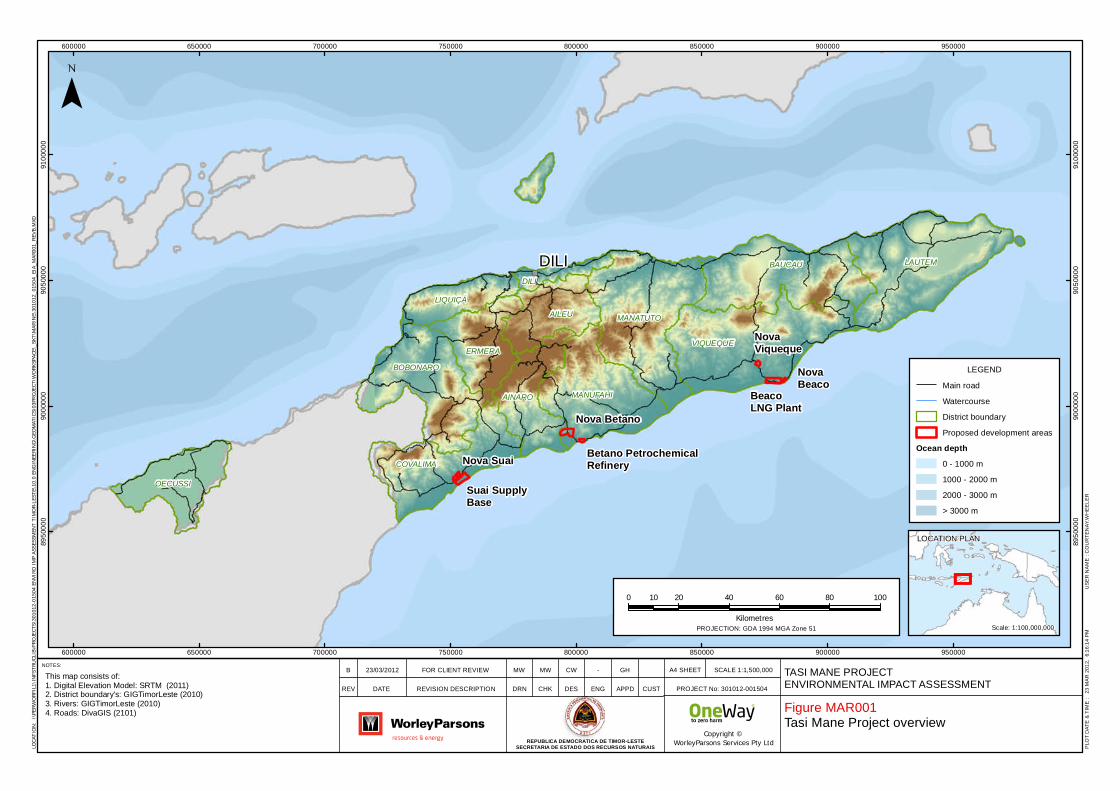
The Tasi Mane Project is a multi-year development of three industrial clusters on the south coast of
Timor. The project will involve development of a coastal zone from Suai to Beaço providing the
infrastructure required to support a growing domestic petroleum industry. Tasi Mane will include the
Suai Supply Base cluster, the Betano Refinery and Petrochemical Industry cluster, and the Beaço
LNG-Plant cluster (SDP 2011) (Figure MAR001).
WorleyParsons was commissioned by the Secretaria de Estado dos Recursos Naturais (SERN), on
behalf of the Government of Timor-Leste (GoTL), on December 2011, to prepare an Environmental
Impact Assessment (EIA) to describe the likely environmental and social impacts associated with the
proposed development.
As part of the EIA, WorleyParsons undertook marine environmental surveys at each of the three
development sites. This report presents data for the Suai development area. Data from the Betano
and Beaco development areas will be presented in a separate report.
1.1 Project Setting
The scope for this study is the supply base component of the Tasi Mane project, herein referred to as
the Tasi Mane – Suai Supply Base Project (‘the project’).
The project comprises the following components:
Supply base area;
Industrial estate;
A new town, Nova Suai;
Upgrade to the existing Suai Airport; and
Two crocodile reserves.
1.2 Study Objectives
This study was undertaken to provide a baseline description of the marine environment within and
adjacent to the proposed development at Suai. The collection of baseline data was undertaken to
address the paucity of existing knowledge from the southern coastline of Timor-Leste and also forms
the basis for assessment of impacts associated with the project.
Suai SupplyBase
Nova Suai Betano PetrochemicalRefinery
Nova Betano
NovaViqueque
BeacoLNG Plant
NovaBeaco
DILI LAUTEMBAUCAU
VIQUEQUE
MANATUTO
MANUFAHI
AILEU
BOBONARO
COVALIMA
AINARO
OECUSSI
ERMERA
LIQUIÇÁDILI
600000
600000
650000
650000
700000
700000
750000
750000
800000
800000
850000
850000
900000
900000
950000
950000
8950
000
8950
000
9000
000
9000
000
9050
000
9050
000
9100
000
9100
000
LEGENDMain roadWatercourseDistrict boundaryProposed development areas
Ocean depth0 - 1000 m1000 - 2000 m2000 - 3000 m > 3000 m
0 20 40 60 80 10010
KilometresPROJECTION: GDA 1994 MGA Zone 51
LOCATION PLAN
B FOR CLIENT REVIEW
Figure MAR001
This map consists of:1. Digital Elevation Model: SRTM (2011)2. District boundary's: GIGTimorLeste (2010)3. Rivers: GIGTimorLeste (2010)4. Roads: DivaGIS (2101) Tasi Mane Project overview
MW - GHCW
Scale: 1:100,000,000
LOCA
TION
: \\P
ERWO
RFIL1
\INFS
TRUC
LIB\P
ROJE
CTS\
3010
12-0
1504
ENVI
RO IM
P ASS
ESSM
ENT T
IMOR
-LEST
E\10
.0 EN
GINE
ERIN
G\GE
OMAT
ICS\0
3PRO
JECT
\WOR
KSPA
CE\_S
KT\M
ARIN
E\30
1012
_015
04_E
IA_M
AR00
1_RE
VB.M
XD
REV DRN
PLOT
DAT
E & T
IME
: 23
MAR
2012
, 6:16
:14 P
M
DATE REVISION DESCRIPTION CHK ENGDES APPD CUST
A4 SHEET
Copyright ©WorleyParsons Services Pty Ltd
USER
NAM
E : C
OURT
ENAY
.WHE
ELER
NOTES: MW23/03/2012 TASI MANE PROJECT ENVIRONMENTAL IMPACT ASSESSMENT
SCALE 1:1,500,000
PROJECT No: 301012-001504
REPUBLICA DEMOCRATICA DE TIMOR-LESTESECRETARIA DE ESTADO DOS RECURSOS NATURAIS

SERN
TIMOR LESTE SOUTH COAST EIA
MARINE ENVIRONMENT SUAI TECHNICAL REPORT
Page 6 301012-01406-EN-R : Rev B
In addition, the assessment was undertaken to provide sufficient information to meet the GoTL
objectives for the protection of the environment.
The scope of work included undertaking the following tasks:
Describing the condition and extent of benthic marine habitats that occur within the vicinity of
the study area;
Describing ambient marine water quality, including both physiochemical and chemical
properties from the coastal waters within the study area;
Describing sediment quality of surface sediments from within the study area;
Describing the abundance and diversity of benthic infauna from within the study area; and
Describing the marine fish larvae, eggs and plankton present within the study area.
1.3 Regulatory Context
The Democratic Republic of Timor-Leste (RDTL) became a signatory to the United Nations
Convention on Biological Diversity (UNCBD) in 2007. A thematic assessment report of Timor-Leste
was prepared for the UNCBD by Alves (2007). Under this Convention, countries are obliged to
develop a National Biodiversity Strategy and Action Plan (NBSAP) which involves identifying actions
and measures for conservation of biodiversity. Timor-Leste is yet to develop regulations and policy
documents specifically addressing biodiversity conservation.
There are several laws and regulations from previous administrations (United Nations Transitional
Administration in East Timor (UNTAET) and Indonesian) that concern environmental protection and
biodiversity conservation in Timor-Leste:
Law No. 5, 1990 on Conservation of Biological Resources and their Ecosystems;
Law No. 5, 1994 Concerning Biodiversity;
Government Regulation No. 28, 1985 on Forest Protection;
Government Regulation No. 51, 1993 on Environmental Impact Analysis;
UNTAET Regulation No. 2000/17; and
UNTAET Regulation No. 2000/19.
UNTAET Regulation No. 2000/19 on protected places (30 June 2000) was in place for the purpose of
protecting designated areas, endangered species, wetlands, mangrove areas, historic, cultural and
artistic sites, conservation of biodiversity and protection of the biological resources of Timor-Leste.
Fifteen natural areas were protected under this regulation and have been designated as Protected

SERN
TIMOR LESTE SOUTH COAST EIA
MARINE ENVIRONMENT SUAI TECHNICAL REPORT
Page 7 301012-01406-EN-R : Rev B
Natural Areas (PNAs). The majority comprise primary forest areas, coral reefs, mangroves, wetland
habitat and mountain summits above 2,000 m.
The State Secretariat for the Environment (SEMA), under the Ministry of Economy and Development,
and the Ministry of Agriculture, Forestry and Fisheries (MAFF) are the two government agencies with
primary responsibilities for the environment. SEMA deals with the environmental issues in the sectors,
and MAF deals with resource management, including; forests, fisheries, and biodiversity conservation.
With the change in government administration from the United Nations (UN) to Timor-Leste, there is
no environmental legislation currently in place in Timor-Leste. The aforementioned legislation from the
previous administration, however, will provide some guidance as to the expected legislation that will
be developed for GoTL.

SERN
TIMOR LESTE SOUTH COAST EIA
MARINE ENVIRONMENT SUAI TECHNICAL REPORT
Page 8 301012-01406-EN-R : Rev B
2. REGIONAL PERSPECTIVE
Physical, biological and environmental data for the marine and coastal environment in Timor-Leste is
very scarce (Sandlund et al., 2001). The information presented within this section provides regional
context to the project area and is primarily based on data compiled as part of oil and gas approvals
documentation for areas located in the southern section of Timor-Leste territorial waters (Eni 2007,
20010a, 2010b).
2.1 Climate
Timor-Leste has two annual seasons and three climatic zones which are the result of monsoon
activity. The two distinct seasons are the Northwest Monsoon (wet season) from November to May
and the Southeast Monsoon (dry season) from April to September with brief transitional periods in
between (Timor-Leste, 2006).
High rainfall is associated with the Northwest Monsoon and low rainfall with the Southeast Monsoon.
Heavy rainfalls are also associated with tropical cyclones and thunderstorm activity. Mean annual
rainfall for the Timor Sea region is 1,770mm (Heyward et al., 1997).
The majority of cyclones occur in the region between January and March, with the most severe
cyclones most often occurring in the months December to April (SKM, 2001). Most (75%) of these
cyclones are not fully mature, having an estimated wind speed of less than 80 km/h. Severe cyclones,
with wind speeds exceeding 100km/h occur, on average, once every 2.6 years (Heyward et al., 1997).
2.2 Biogeography
The island of Timor-Leste is part of the Malay Archipelago, representing the largest and easternmost
of the Lesser Sunda Islands (World Bank, 2009). The island is non-volcanic, part of the Outer Banda
Arc, derived from the basement of rocks of the Australian continental margin (Audley Charles, 1993 in
Rhee et al. 2004) and is characteristically limestone with karst formations. The terrain in Timor-Leste is
almost consistently steep and as a result has a number of large fast flowing rivers running to the sea.
Rainfall is fairly uniform throughout the year over the mountain range that runs through the middle of
the country.
Keefer (2000) reported that rainfall intensity is usually greatest during the North West Monsoon
(December-March) period, particularly those in northern locations, while in the southern sites many of
the high daily rain totals were recorded in the May-August period. Rivers originating in the mountains
and flowing into the sea on the southern side of Timor-Leste, therefore, have consistent flow for the
majority of the year.
SERN
TIMOR LESTE SOUTH COAST EIA
MARINE ENVIRONMENT SUAI TECHNICAL REPORT
Page 9 301012-01406-EN-R : Rev B
The rates of fluvial sediment flux on the island and the broader region are naturally high as a result of
the mountainous terrain, highly erodible strata and the high seasonal rainfall. The lack of estuaries,
along with the narrow width of coastal shelf along East Timor’s south coast implies that river discharge
is likely to discharge sediment directly to the slope and deeper offshore waters (Milliman et al., 1999).
2.3 Bathymetry
Only limited bathymetrical information of the Timor-Leste coastline is available.
A review of the Australia – East Timor, Timor Sea, Dillon Shoal to East Timor chart (AUS charts 902
and 903 produced by RAN), navigation chart shows the seabed to slope rapidly from the shoreline to
deep water. This steep slope was also confirmed during the field surveys within the project footprint. In
some places water depths of 200m can be found less than 1km offshore (Australia – East Timor,
Timor Sea, Dillon Shoal to East Timor chart).
2.4 Tides
The Timor Sea region is influenced by the Pacific-Indian Ocean Throughflow. This produces a current
moving at a rate of between 0.1 and 0.4 m/s throughout the year in the Timor Sea between Timor-
Leste and northern Australia (Molcard et al., 1996).
Tidal currents in the region are anti-clockwise rotational, commencing flood towards the NE and ebb
towards the SW. Speeds will range from about 0.02 m/s on neap tides to 0.1 m/s on springs.
Surface currents are expected to reflect seasonal wind regimes. Local wind-driven surface currents
may attain maximum speeds of 0.7 ms-1 during extreme wind surges. More typically speeds would be
in the range of 0.2 ms-1 to 0.4 ms-1.
2.5 Water Temperature
Seawater temperatures in the Timor Sea region range from 25ºC to 31ºC at the surface and 22ºC to
25ºC below 150 m (OMV, 2003) and down to 10ºC at the seafloor (Heyward et al., 1997).
2.6 Coastal Processes
There is little known about the coastal processes along the Timor-Leste coastline. Ocean currents
have been found to flow from east to west through the Timor Trench and Timor Sea up to a maximum
of 0.7 m/s (MetOcean Engineers, 2004). The predominant wave direction for Timor-Leste is from the
East (MetOcean Engineers, 2004) which is most likely to create net littoral movement of material from
east to west.

SERN
TIMOR LESTE SOUTH COAST EIA
MARINE ENVIRONMENT SUAI TECHNICAL REPORT
Page 10 301012-01406-EN-R : Rev B
The recent field surveys confirmed that sections of coastline inspected between Suai, Betano and
Beaco consist of a combination of sandy beaches and limestone rock ledges which extend from the
shoreline as intertidal reef flats and slope down steeply towards the seabed. The sandy beaches
consist of medium to fine sand with silt. Heavy rains produce significant runoff from the large rivers
generating extensive turbid plumes in the coastal environment.
2.7 Biological Environment
Habitats vary along the coastline because of the local influences of seasonal rainfall, local geology
and topography, river discharges, and regional offshore oceanographic features, as well as the impact
of human occupation. This results in spatial differences in marine habitats, with the north coast being
different from the south coast and with the eastern edge of the island having attributes that differ from
those to the west (GoTL 2006d).
Timor-Leste has been identified as part of the Wallacea region in Southeast Asia which has been
identified as a biodiversity ‘hotspot’ (CI, 2007). The most ecologically important marine habitats in the
Timor Sea region, in terms of biodiversity and productivity can be grouped into:
The various submerged banks or shoals on the northern Australian continental shelf and shelf
slope;
The coastal intertidal coral reefs and shallow (20m to 30 m) reefs; and
The mangrove and seagrass areas located along the Timor and northern Australian coast and
islands (Sandlund et al. 2001; SKM 2001).
2.7.1 Mangroves
Mangroves occupy approximately 7,500 acres along the coastline of Timor-Leste. On the south coast,
they tend to form small communities at the mouths of streams and in marshy or swampy terrain
(timorNET, 2007). The mangroves species that occur along the coast of Timor-Leste include,
Bruguiera parvifolia, Sonneratia alba, Rhizophora conjugata, Excoecaria agallocha, Avicennia marina,
Aegiceras corniculatum, Acanthus ilicifolius, Lumnitzera racemosa, Heritiera litoralis, Acanthus
ilicifolius, Achrosticum aureum, Xylocarpus granatum, Corypha utan, Pandanus odoratissimus, Cycas
circinalis, Dolichandrone spathacea and Melaleuca leucadendron (timorNET, 2007).
2.7.2 Intertidal
Wyatt (2004) surveyed a small area of the nearshore coastal marine environment on the south coast
of Timor-Leste. Brittle stars (ophiuroids) and other mobile organisms as well as a total of 27 taxa,
mostly sessile species, were identified as inhabiting the reef platform. The main taxa present were
algae, sponges (poriferans), corals (scleractinians), ascidians, anemones and forams.

SERN
TIMOR LESTE SOUTH COAST EIA
MARINE ENVIRONMENT SUAI TECHNICAL REPORT
Page 11 301012-01406-EN-R : Rev B
2.7.3 Coral Reefs
Timor-Leste is near the centre of the global region with the highest coral species diversity (the
Wallacea region). A high diversity of coral reefs exist in southern Timor-Leste with 301-500 species
identified (Burke et al., 2002).
A series of surveys conducted in Indonesian waters between 1990 and 1998 (Burke et al., 2002)
determined that the percentage of coral reefs in good or excellent condition (live coral cover of more
than 50%) in eastern Indonesia were 45% compared to only 23% in western Indonesia. Burke et al.
(2002) also identified a number of coral reefs along the Timor-Leste coast, including five distinct
communities along the south coast of Timor-Leste, that were considered to be at Medium to High risk
of impact from the combined effects of coastal development, marine-based pollution, sedimentation,
overfishing and destructive fishing.
2.7.4 Offshore Benthic Habitats
Heyward et al. (1997) identified four broad benthic communities for the Big Bank Shoals area,
encompassing the shallow banks to the deep water: Halimeda (shallow waters); encrusting sponges
(shallow waters); coral filter-feeders (shallow waters); and continental shelf communities (deep water).
With little sea floor topography and hard substrate, such areas offered minimal habitat diversity or
niches for animals to occupy. Detritus-feeding crustaceans, holothurians and echinoderms tend to be
the dominant epibenthic organisms of these habitats, however, where an area of hard substrate is
available filter-feeding heterotrophs, such as sponges, soft corals and gorgonians may occur
(Heyward et al., 1997).
2.7.5 Marine Fauna
The marine fauna of the Timor Sea is part of the Indo-West Pacific biogeographical Province. The
majority of species are widely distributed in this region (Wilson & Allen, 1987).
A number of whale, dolphin and porpoise species have broad distributions (including the Timor Sea).
Of these, a number of whale species are considered endangered, vulnerable or might be encountered
due to their migratory habit. These include the Blue whale, Humpback whale, Sperm whale, Bryde’s
whale, Antarctic Minke whale and Killer whale. Some are very rare (blue whale), or usually restricted
to deep or cool waters (Sperm whale), and are very unlikely to be encountered in this region
(Bannister et al., 1996). Humpback whales (Megaptera novaeangliae), which are seasonally the most
abundant whale along the Western Australian coast, complete their northern migration in the Camden
Sound area of the West Kimberley (reported in Woodside, 2000).

SERN
TIMOR LESTE SOUTH COAST EIA
MARINE ENVIRONMENT SUAI TECHNICAL REPORT
Page 12 301012-01406-EN-R : Rev B
A number of dolphins may occur within the project area. These species include the Irrawaddy dolphin,
the Australian snubfin dolphin, the long snouted spinner dolphin, the spotted bottlenose dolphin,
Risso's dolphin, the Indo-Pacific humpback dolphin and the pantropical spotted dolphin.
Dugongs (Dugong dugon) occur within Timor-Leste waters. Major concentrations of dugongs tend to
occur in areas coinciding with sizeable seagrass beds. These areas are typically in shallow water
(depths less than 10m) and are relatively protected (Marsh, 2006).
There are six turtle species that may be encountered, including the Flatback, Olive, Hawksbill,
Leatherback and particularly the Loggerhead turtle and the Green turtle. Jaco Island and Tutuala
beach have been identified as turtle nesting sites (Nunes, 2001) and other breeding sites may exist on
the south coast of Timor-Leste where the appropriate conditions exist.
The distribution of the saltwater crocodile, Crocodylus porosus, encompasses Timor-Leste and the
islands and coasts surrounding the Timor Sea. The animals usually inhabit territories within tidal river
systems and estuaries, sometimes around coastal areas and in freshwater rivers or water bodies and
are sometimes found long distances from shore (Ross, 1998). The saltwater crocodile is listed as Low
Risk, Least Concern in the International Union for Conservation of Nature (IUCN) Red List.
Sea snakes are expected in the Timor Sea region, with as many as 15 species known to occur in
northern Australian waters (Storr et al., 1986).
FishBase (2006) lists 144 marine fish species in 38 families for Timor-Leste waters, with one species,
the bigeye tuna (Thunnus obesus) listed as Threatened, 18 of the species as being pelagic and 10 of
the species as being deep water. Many of the species listed for Timor-Leste are found throughout the
tropics and are important commercial species, such as the tunas, mackerels and snappers.
The whale shark (Rhincodon typus) is listed in FishBase (2006) as occurring within Timor- Leste
waters and is considered threatened. The Great White Shark (Carcharodon carcharias) may transit the
region (Environment Australia, 2002) and is considered to be vulnerable. There are at least 49 species
of sharks identified as occurring within an area which encompasses Australian territorial waters within
the Timor Sea (Last & Stevens, 1994). The most prolific of the shark species in the Timor Sea region
are the whalers, represented by at least 12 species.
2.7.6 Marine Protected Areas
The nearest currently declared marine conservation zones or marine protected areas to the project
area is the Jaco Island Marine Park, at the eastern end of Timor-Leste.

SERN
TIMOR LESTE SOUTH COAST EIA
MARINE ENVIRONMENT SUAI TECHNICAL REPORT
Page 13 301012-01406-EN-R : Rev B
3. FIELD METHODS
3.1 Sampling Locations
Water quality, sediment quality, benthic infauna and plankton samples were collected at both
nearshore (250 m from shore) and offshore (750 m from shore) over a 10 day period between 10 and
20 December 2011 and over a five day period between 18-22nd
February 2012. During this period, the
sea conditions were calm with 5 to 10 knot winds and 0 to 0.2 m swell. The average temperature was
34°C with rainfall most afternoons. A total of five inshore and five offshore samples were collected at
sites adjacent to the proposed supply base at Suai (Figure MAR002). Inshore sites were located
between 4 to 8m depth. Offshore sites were in up to 20 m depth.
Video footage was collected over a two day period between 10 and 20 December 2011. Towed video
footage was used to obtain information on the marine benthic habitat present at the study site. Video
transects ranging between 300 to 500 m extended vertically from the shoreline (Figure MAR002).
Each transect commenced in a depth of approximately 2.5 m extending out to the 10m depth contour.
A total of eight transects were completed at the Suai study site distanced approximately 600 m apart.
GPS co-ordinates were collected at each sampling site (using a handheld Garmin GPS) and are
presented in Table MAR001.
Table MAR001 Table showing GPS coordinates
Scope Name Start_
Latitude
Start_
Longitude
Finish_
Latitude
Finish_
Longitude
Benthic
Habitat
T13 -9.322910 125.304583 -9.325875 125.308027
T14 -9.317825 125.308985 -9.322340 125.312975
T15 -9.313723 125.314310 -9.317388 125.317523
T16 -9.311017 125.321140 -9.315273 125.324497
T17 -9.307683 125.325358 -9.311818 125.328720
T18 -9.304322 125.330383 -9.308332 125.332778
T19 -9.302047 125.337477 -9.305573 125.340358
T20 -9.298175 125.343183 -9.302352 125.345827
Water and
Sediment
Quality,
Benthic
Infauna,
Fisheries
SBMI1 -9.321541 125.305665
SBMO1 -9.324749 125.308861
SBMI2 -9.311132 125.320884
SBM02 -9.313338 125.323397
SBMI3 -9.301943 125.339699
SBMO3 -9.304842 125.340077
SERN
TIMOR LESTE SOUTH COAST EIA
MARINE ENVIRONMENT SUAI TECHNICAL REPORT
Page 14 301012-01406-EN-R : Rev B

750000
750000
755000
755000
760000
760000
8965
000
8965
000
8970
000
8970
000
LEGENDWater and sediment quality sample sitesTowline survey resultsMain roadMinor roads and tracksWatercourse
Suai development areaSuai Supply BaseNova SuaiSuai Airport Crocodile habitat
0 0.5 1 1.5 2 2.50.25
Kilometres
LOCATION PLAN
This map contains:1. Imagery Suai: SRTM (2011)2. Imagery: DigitalGlobe (2008 - 2010)3. Rivers: GIGTimorLeste (2010)4. Roads: DivaGIS (2010)
¯
Scale: 1:7,000,000
LOCA
TION:
I:\P
ROJE
CTS\3
0101
2-015
04 EN
VIRO
IMP A
SSES
SMEN
T TIM
OR-LE
STE\
10.0
ENGI
NEER
ING\
GEOM
ATIC
S\03P
ROJE
CT\W
ORKS
PACE
\_SKT
\3010
12_0
1504
_EIA
_F05
0.MXD
USER
NAM
E : M
ELAN
IE.WE
BB
NOTES:
DRAFT
Timor-Leste
B FOR CLIENT REVIEW
Figure MAR002Suai marine study area and sampling sites
MW GH
REV DRN
PLOT
DAT
E & TI
ME :
22 M
AR 20
12, 1
1:45:2
1 AM
DATE REVISION DESCRIPTION CHK ENGDES APPD CUST
A4 SHEET 1:50,000
Copyright ©WorleyParsons Services Pty Ltd
EM22/03/2012 TASI MANE PROJECT ENVIRONMENTAL IMPACT ASSESSMENT
SCALE
PROJECT No: 301012-001504
REPUBLICA DEMOCRATICA DE TIMOR-LESTESECRETARIA DE ESTADO DOS RECURSOS NATURAIS
See Figure F048
See Figure F047
Projection: WGS 1984 UTM Zone 51S
SERN
TIMOR LESTE SOUTH COAST EIA
MARINE ENVIRONMENT SUAI TECHNICAL REPORT
Page 16 301012-01406-EN-R : Rev B
3.2 Water Quality
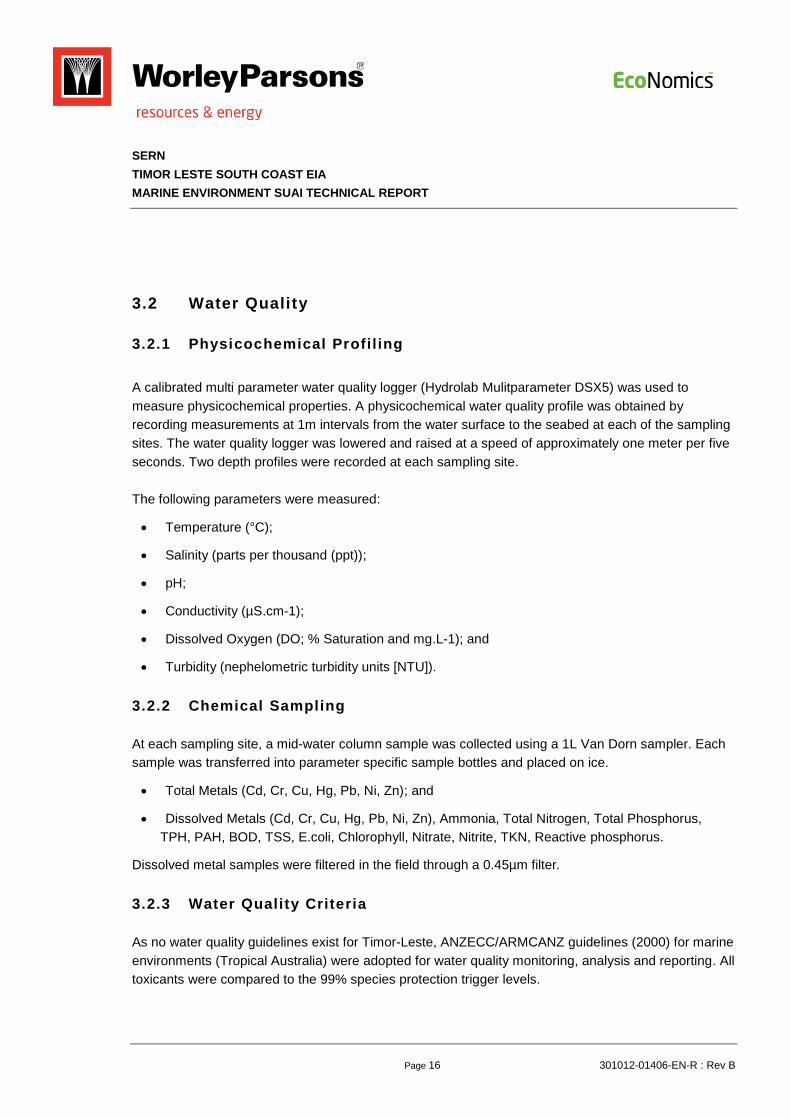
3.2.1 Physicochemical Profil ing
A calibrated multi parameter water quality logger (Hydrolab Mulitparameter DSX5) was used to
measure physicochemical properties. A physicochemical water quality profile was obtained by
recording measurements at 1m intervals from the water surface to the seabed at each of the sampling
sites. The water quality logger was lowered and raised at a speed of approximately one meter per five
seconds. Two depth profiles were recorded at each sampling site.
The following parameters were measured:
Temperature (°C);
Salinity (parts per thousand (ppt));
pH;
Conductivity (µS.cm-1);
Dissolved Oxygen (DO; % Saturation and mg.L-1); and
Turbidity (nephelometric turbidity units [NTU]).
3.2.2 Chemical Sampling
At each sampling site, a mid-water column sample was collected using a 1L Van Dorn sampler. Each
sample was transferred into parameter specific sample bottles and placed on ice.
Total Metals (Cd, Cr, Cu, Hg, Pb, Ni, Zn); and
Dissolved Metals (Cd, Cr, Cu, Hg, Pb, Ni, Zn), Ammonia, Total Nitrogen, Total Phosphorus,
TPH, PAH, BOD, TSS, E.coli, Chlorophyll, Nitrate, Nitrite, TKN, Reactive phosphorus.
Dissolved metal samples were filtered in the field through a 0.45µm filter.
3.2.3 Water Quality Criteria
As no water quality guidelines exist for Timor-Leste, ANZECC/ARMCANZ guidelines (2000) for marine
environments (Tropical Australia) were adopted for water quality monitoring, analysis and reporting. All
toxicants were compared to the 99% species protection trigger levels.

SERN
TIMOR LESTE SOUTH COAST EIA
MARINE ENVIRONMENT SUAI TECHNICAL REPORT
Page 17 301012-01406-EN-R : Rev B
3.2.4 Data Analysis
Physicochemical data collected was analysed by calculating descriptive statistics for each parameter.
Chemical data was tabulated and compared to adopted guideline levels.
3.3 Sediment Quality
3.3.1 Sample Collection
Surface sediment samples (0-0.3 m) were collected using a Van Veen grab sampler. The Van Veen
sampler was lowered to the seabed before being retrieved with a grab sample. Sediment samples
were then geophysically logged. The sample was then homogenised in a stainless steel mixing bowl
before being transferred into a sterilised 250 mL glass jar and a 250 ml plastic bag. Each sample was
then stored at 4°C and couriered to a NATA accredited laboratory for analysis.
3.3.2 Chemical Testing
Parameters identified for laboratory analysis were developed based on likely contaminants to be
encountered during construction and operation of a port and associated facilities. Sediment samples
were analysed for the following parameters:
Metals (Al, As, Cd, Cr, Cu, Fe, Pb, Hg, Ni and Zn);
Nutrients (Nitrate, Nitrite, Total Nitrogen, Total Phosphorus and Sulphate); and
Particle Size Distribution (PSD).
3.3.3 Sediment Quality Criteria
As no sediment quality guidelines exist for Timor-Leste, the interim sediment quality guideline (ISQG)
found in ANZECC/ARMCANZ (2000) were used as a basis for comparing relative metal
concentrations. Sediment nutrient concentration results from Suai were compared against relevant
published literature as there are no comparable benchmarks within the ANZECC/ARMCANZ (2000)
guidelines.
PSD is a measure of the relative proportion of particle size classes within a given sediment sample.
Results have been presented based on the classifications displayed in Figure Mar 011.
3.3.4 Data Analysis
Laboratory results were collated, concentrations were tabulated and any spatial trends identified. All
values were then compared with relevant sediment quality criteria.

SERN
TIMOR LESTE SOUTH COAST EIA
MARINE ENVIRONMENT SUAI TECHNICAL REPORT
Page 18 301012-01406-EN-R : Rev B
3.4 Benthic Habitat
3.4.1 Data Collection and Mapping
A total of eight transects were completed at the Suai study site. Transects were approximately 600m
apart covering a 5 km section of coastline.
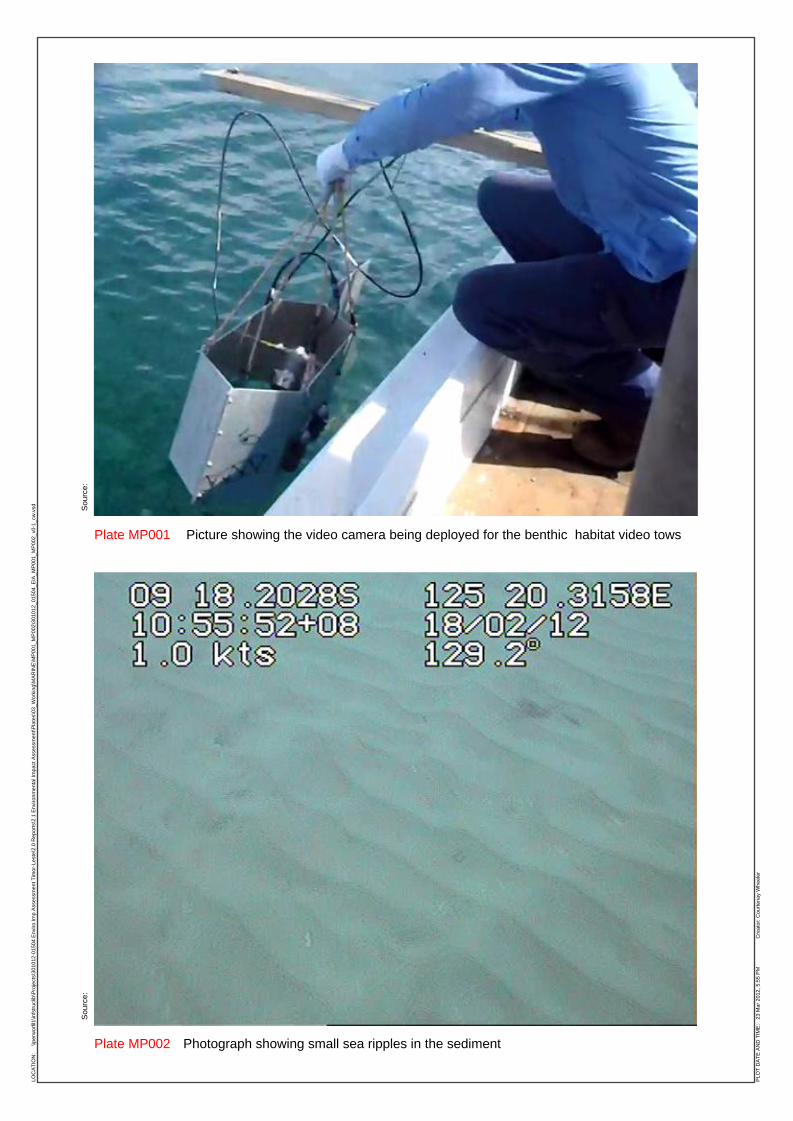
The benthic habitat was recorded using an underwater video camera (Splash Cam) (Plate MP001).
The remotely operated video camera was towed behind a vessel travelling at a speed of 1 knot or
less. The camera was attached to a swimming device, permitting the camera to face forward and
travel in a straight direction. High definition video footage was taken approximately 50 cm above the
substratum and recorded to a hard drive. Co-ordinates of the video transects were tracked using a
GPS (Starfish) and overlayed onto the video along with time and date information to allow geo-
referencing of the processed habitat data.
The video footage was analysed by marine scientists experienced in classifying benthic habitats.
Maps displaying the distribution of habitats, including substrate and biota were then produced across
the study area.
3.4.2 Data Analysis
A customised WorleyParsons system for benthic habitat classification was adapted from the national
intertidal and subtidal benthic habitat classification scheme (Mount et al., 2007) and used to classify
the observed habitats. The level of taxonomic detail that can be classified was restricted by
environmental condition such as water visibility, sea state and tide. For the purpose of generating a
habitat map, biota was defined as:
Hard coral;
Invertebrates;
Algae;
Seagrass; and
Substrate was classified as sediment (soft) or reef (hard).
A qualitative classification method was applied to define the cover (density) of specific biota and
substrata types as dense (>75%), medium (25-75%) or sparse (0-25%). Substrate type was defined
using the Wentworth grade scale of particle sizes (Wentworth, 1922).
LO
CA
TIO
N:
\\perw
orf
il1\infs
truclib
\Pro
jects
\301012-0
1504 E
nviro Im
p A
ssessm
ent T
imor-
Leste
\2.0
Report
s\2
.1 E
nvironm
enta
l Im
pact A
ssessm
ent\
Pla
tes\0
3_W
ork
ing\M
AR
INE
\MP
001_M
P002\3
01012_01504_E
IA_M
P001_M
P002_v0-1
_cw
.vsd
PLO
T D
AT
E A
ND
TIM
E:
23 M
ar
2012, 5:5
5 P
MC
reato
r: C
ourt
enay W
heele
r
Sourc
e:
Sourc
e:
Plate MP001 Picture showing the video camera being deployed for the benthic habitat video tows
Plate MP002 Photograph showing small sea ripples in the sediment

SERN
TIMOR LESTE SOUTH COAST EIA
MARINE ENVIRONMENT SUAI TECHNICAL REPORT
Page 20 301012-01406-EN-R : Rev B
3.5 Plankton
3.5.1 Sample Collection
A plankton net was towed behind a vessel travelling at <1 knot over a 100m transect at each site. The
plankton net comprised of a 0.8 m diameter with 800 µm mesh sieve. Once the sample had been
collected in the sieve, the contents were then transferred to a sample vial. Ethanol (100%) was added
to the vial to preserve the sampled larvae.
3.5.2 Laboratory Analysis
The plankton fauna was removed from the plastic sampling vial and placed in a 125µm sieve. The
excess ethanol used for preservation of the samples was then captured in a storage container for
chemical disposal. Water was then flushed over the sample, to remove any remaining ethanol. The
entire sample was placed in Ward Counting Wheel, with the corresponding site label. The Ward
Counting Wheel was placed under a Stereo-Microscope (Olympus SZ61 Microscope) and slowly
turned under the microscope allowing the fauna to be counted and identified. Taxonomy identification
was conducted using the most up to date references available for the geographic region. Taxonomic
names and abundances were recorded on laboratory sheets for each site. After taxonomy
identification was completed the fauna was returned to the vial with 70% ethanol for long term storage.
As plankton samples collected presented with very low abundance, the sorting methodology adopted
did not following the standard plankton sub-sampling methods. Instead 100% of the sample volume
was sorted for plankton, fish eggs and fish larvae.
3.5.3 Statistical Analysis
Statistical analysis of the plankton was conducted using Primer ver.6 (Clarke, 2001). Cluster and
multidimensional scaling (MDS) analyses were performed to represent groupings of samples with a
similar faunal and community composition.
Both the cluster and MDS were based on a similarity matrix produced using the Bray-Curtis similarity
co-efficient, with standardisation and square-root transformation. Standardisation is essential for
sampling techniques where exact sampling volumes are unknown and sampling bias can occur
between replicates.
Transformations are required for datasets where more common fauna could potentially outweigh the
rarer fauna when determining similarity between samples. Applying a transformation will define a
balance between the contribution of common and rarer fauna (Clarke, 2001).
The adequacy of an MDS plot is represented by a stress value, in the range of 0.0 to >0.3.
Interpretation of the stress value was as follows:

SERN
TIMOR LESTE SOUTH COAST EIA
MARINE ENVIRONMENT SUAI TECHNICAL REPORT
Page 21 301012-01406-EN-R : Rev B
<0.05 gives an excellent representation of sites;
<0.1 is a good ordination with no real prospect of misleading interpretation;
<0.2 still gives a potentially useful ordination, although values at the upper end of this scale
should not be relied upon in great detail; and
>0.3 indicates that the points are close to being arbitrary and placement of sites within the
ordination are completely random (Clarke, 2001).
An Analysis of Similarities (ANOSIM) is used in conjunction with a cluster and MDS to provide a
significant value (p=0.05) for differences between samples and grouping seen in the MDS ordination.
SIMPER analysis is used to determine which species contribute the most to the differences between
sites and the construction of the MDS ordination.
3.6 Infauna
3.6.1 Sample Collection
Surface sediment samples (0-0.3 m) were collected using a Van Veen grab. A total of three replicates
were collected per sample location. Upon collection of each replicate sample, the samples were
combined and sieved through a 1 mm mesh sieve. All samples were transferred to a sample container
and preserved in 100% ethanol.
3.6.2 Laboratory Method
Macroinvertebrate samples were processed and fauna identified at Benthic Australia laboratories. The
sediment and fauna were placed in a 125µm sieve. The excess ethanol used for preservation of the
samples was captured in a storage container for chemical disposal. Water was flushed through the
sediment in the 125µm sieve, to remove any remaining ethanol from the sample. The entire sample
was placed in a large petri-dish with the corresponding site label. The petri-dish was placed under a
Stereo-Microscope (Olympus SZ61 Microscope). A level 5 grade forceps was used to systematically
sort through the sediment and remove all fauna that was found. Fauna were placed in a vial with 70%
ethanol, and a label with the corresponding site information. Once all the sediment from the site was
sorted, the vial of fauna was placed to one side awaiting taxonomic identification.
The specimens were then placed into a small petri-dish for taxonomic identification under a stereo-
microscope, (Olympus SZ61 Microscope). Taxonomy was conducted using the most up to date
references available for the geographic region. Taxonomic names and abundances were recorded on
laboratory sheets for each site. After taxonomy was completed the fauna was returned to the vial with
70% ethanol for long term storage.

SERN
TIMOR LESTE SOUTH COAST EIA
MARINE ENVIRONMENT SUAI TECHNICAL REPORT
Page 22 301012-01406-EN-R : Rev B
3.6.3 Statistical Analysis
Statistical analysis of the marine benthic fauna was conducted using the same methods as plankton
(see Section 3.5.3).
3.7 Quality Control and Assurance
All sampling equipment was deployed from the side of the vessel, to ensure the risk of contamination
from the engine, discharge was reduced. Engines were also switched off where practicable to
minimize further risk of contamination. Personnel undertaking water and sediment collection for
sampling wore latex gloves at all times to prevent cross-contamination, all sampling equipment was
cleaned with Decon90 prior to use and rinsed with seawater between samples.
The multi-parameter water quality logger was calibrated to manufacture specifications and using
standardised solutions in field. A minimum of two depth profiles were recorded at each site to improve
data accuracy. The water quality logger and Van Dorn sampler were weighted down to counteract the
effects of the currents pulling the equipment horizontally through the water column.
Water and sediment quality samples were analysed by ALS Group. ALS has NATA certification for all
analyses requested and QA/QC plans and protocols to support this certification. The integrity of the
samples was assured by the use of Chain of Custody (CoC) documentation, which accompanied the
samples from the time of collection until receipt by ALS. Samples were chilled on collection and
dispatched to the laboratory frozen in chilled containers.
As part of the NATA requirements, the laboratory analyses for water and sediment quality included
quality control testing of samples, including duplicate samples (the same sample analysed more than
once), blanks (containing no levels of the analytes to be analysed), spiked samples (containing known
additions of the analytes to appropriate matrices) and standard samples (samples containing known
concentrations of the analytes - also known as reference standards). All samples were analysed within
laboratory holding times.
QA/QC was conducted on five benthic infauna samples. This method requires five samples to be
sorted twice. On the second sort any missed fauna are collected in a separate vial. The total missed
fauna is divided by the total collected in the first sort and a percentage error calculated. The error is
expected to be below 10%. If the sorting error is above 10% then each additional samples is checked
until the percentage error is below 10%. QA\QC was not used on the plankton samples due to
insufficient sample numbers.

SERN
TIMOR LESTE SOUTH COAST EIA
MARINE ENVIRONMENT SUAI TECHNICAL REPORT
Page 23 301012-01406-EN-R : Rev B
4. RESULTS
4.1 Water Quality
Vertical profiles of physicochemical water quality recorded at each sampling site have been
graphically presented in in the sections below. Laboratory data for chemical water quality, including
nutrients, metals and hydrocarbons were also analysed, with a summary of results presented
separately below. Comparisons of results with ANZECC/ARMCANZ (2000) are based on default
trigger values provided for Tropical Australia (Inshore Waters).
4.1.1 Physicochemical Water Quality
A summary of the physicochemical water quality data collected at each site is presented in Table
MAR002. Sites have been classified according to nearshore or offshore locations. Trends in the data
set have been provided where relevant and differences in data between nearshore and offshore sites
identified.
Temperature
Temperatures recorded at nearshore and offshore sites were similar, ranging between 30.2°C and
31.6°C. Maximum nearshore and offshore temperatures were observed at SMBI2 and S2O
respectively (Table MAR002; Figure MAR003).
Vertical profiles of the mean temperature values for nearshore and offshore sites are shown in Figure
MAR003. Both nearshore and offshore areas experienced a slight decrease in mean temperature with
an increase in depth. Surface temperatures for the nearshore sites ranged between 31.3 °C (surface)
and 31°C (seabed), and 31.1 °C (surface) and 30.5 (near seabed) for the offshore sites. Slight
variation in temperature was identified at offshore sites between 16m and 18m.
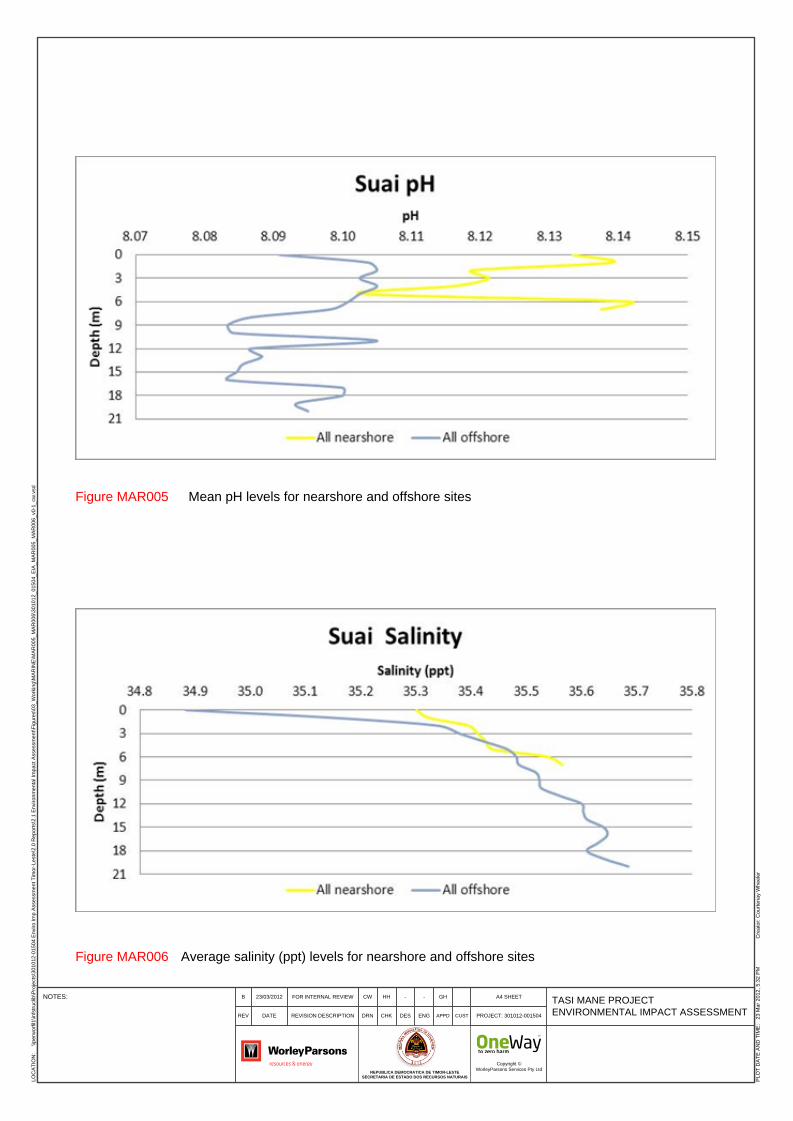
pH
A mean pH of 8.1 was observed at both the nearshore and offshore sites. Inshore sites ranged
between 8.0 and 8.2 while offshore sites showed less variability, ranging between 8.0 and 8.1. (Table
MAR002; Figure MAR004).
A higher variation in pH was observed at nearshore sites compared with offshore sites. Low variation
was generally observed at all offshore sites (Figure MAR005).

NOTES: GH--CW HHB FOR INTERNAL REVIEW23/03/2012TASI MANE PROJECT
ENVIRONMENTAL IMPACT ASSESSMENTPROJECT: 301012-001504
A4 SHEET
Copyright ©
WorleyParsons Services Pty LtdREPUBLICA DEMOCRATICA DE TIMOR-LESTE
SECRETARIA DE ESTADO DOS RECURSOS NATURAIS
DESCHK APPD CUSTDRN ENGREV REVISION DESCRIPTIONDATE
LO
CA
TIO
N:
\\perw
orf
il1\infs
truclib
\Pro
jects
\301012-0
1504 E
nviro Im
p A
ssessm
ent T
imor-
Leste
\2.0
Report
s\2
.1 E
nvironm
enta
l Im
pact A
ssessm
ent\
Fig
ure
s\0
3_W
ork
ing\M
AR
INE
\MA
R003_M
AR
004\3
01012_01504_E
IA_M
AR
003_M
AR
004_v0-1
_cw
.vsd
PLO
T D
AT
E A
ND
TIM
E:
23 M
ar
2012, 5:4
4 P
MC
reato
r: C
ourt
enay W
heele
r
Mean temperature (°C) levels for nearshore and offshore sites
Comparison of average pH levels for offshore sites, outliers from nearshore sites as well
as the average nearshore levelsFigure MAR004
Figure MAR003
NOTES: GH--CW HHB FOR INTERNAL REVIEW23/03/2012TASI MANE PROJECT
ENVIRONMENTAL IMPACT ASSESSMENTPROJECT: 301012-001504
A4 SHEET
Copyright ©
WorleyParsons Services Pty LtdREPUBLICA DEMOCRATICA DE TIMOR-LESTE
SECRETARIA DE ESTADO DOS RECURSOS NATURAIS
DESCHK APPD CUSTDRN ENGREV REVISION DESCRIPTIONDATE
LO
CA
TIO
N:
\\perw
orf
il1\infs
truclib
\Pro
jects
\301012-0
1504 E
nviro Im
p A
ssessm
ent T
imor-
Leste
\2.0
Report
s\2
.1 E
nvironm
enta
l Im
pact A
ssessm
ent\
Fig
ure
s\0
3_W
ork
ing\M
AR
INE
\MA
R005_M
AR
006\3
01012_01504_E
IA_M
AR
005_M
AR
006_v0-1
_cw
.vsd
PLO
T D
AT
E A
ND
TIM
E:
23 M
ar
2012, 5:3
2 P
MC
reato
r: C
ourt
enay W
heele
r
Mean pH levels for nearshore and offshore sites
Average salinity (ppt) levels for nearshore and offshore sitesFigure MAR006
Figure MAR005
SERN
TIMOR LESTE SOUTH COAST EIA
MARINE ENVIRONMENT SUAI TECHNICAL REPORT
Page 26 301012-01406-EN-R : Rev B
Salinity
Variations in salinity levels were observed spatially between the nearshore and offshore sites, and by
depth (Table MAR002). Figure MAR006 shows a gradual increase in salinity with increase in depth for
both nearshore and offshore sites. Salinity recorded at nearshore sites varied between 35.1 ppt and
35.6 ppt while offshore sites displayed greater variability ranging between 34.8 ppt and 35.7 ppt (Table
MAR002). Maximum nearshore and offshore salinity was observed at SMBI3 and SBMO3 sites
respectively. No variation was found in mean salinity at nearshore and offshore sites (35.4 ppt) (Table
MAR002) Salinity recorded at SBMI2 was considerably lower than mean salinity at nearshore and
offshore sites ranging between 35.0 ppt and 35.2 ppt (Figure MAR006).
Turbidity
Turbidity recorded at nearshore and offshore sites displayed large variability. Nearshore sites varied
between 0.6 NTU and 47.4 NTU while offshore sites ranged between 3.1 NTU to 20.0 NTU. Maximum
turbidity displayed at nearshore and offshore sites were observed at SMBI3 and SBMO3 respectively.
These levels were substantially higher than other nearshore and offshore sites which displayed
maximum turbidity levels ranging between 7.1 NTU to 14.0 NTU respectively (Table MAR002).
Higher turbidity was recorded at site SBMI3 compared with all other nearshore sites, ranging between
10 to 40 NTU (Figure MAR007). Generally, nearshore turbidity levels ranged between 1 and 7 NTU.
Turbidity levels offshore were found to increase with depth, increasing from around 4 NTU near the
surface to 12 NTU near the seabed.
Turbidity values were generally less than the ANZECC/ARMCANZ (2000) guideline of 1-20 NTU
(Table MAR002). Higher values were most likely associated with high rainfall events and associated
run-off.

NOTES: GH--CW GHiB FOR INTERNAL REVIEW23/03/2012TASI MANE PROJECT
ENVIRONMENTAL IMPACT ASSESSMENTPROJECT: 301012-001504
A4 SHEET
Copyright ©
WorleyParsons Services Pty LtdREPUBLICA DEMOCRATICA DE TIMOR-LESTE
SECRETARIA DE ESTADO DOS RECURSOS NATURAIS
DESCHK APPD CUSTDRN ENGREV REVISION DESCRIPTIONDATE
LO
CA
TIO
N:
\\perw
orf
il1\infs
truclib
\Pro
jects
\301012-0
1504 E
nviro Im
p A
ssessm
ent T
imor-
Leste
\2.0
Report
s\2
.1 E
nvironm
enta
l Im
pact A
ssessm
ent\
Fig
ure
s\0
3_W
ork
ing\M
AR
INE
\MA
R007_M
AR
008\3
01012_01504_E
IA_M
AR
007_M
AR
008_v0-1
_cw
.vsd
PLO
T D
AT
E A
ND
TIM
E:
23 M
ar
2012, 5:0
5 P
MC
reato
r: C
ourt
enay W
heele
r
Turbidity (NTU) levels for nearshore sites (A); Mean turbidity (NTU) levels for inshore
and offshore sites (B)
Mean dissolved oxygen (% sat) for nearshore and offshore sitesFigure MAR008
Figure MAR007

SERN
TIMOR LESTE SOUTH COAST EIA
MARINE ENVIRONMENT SUAI TECHNICAL REPORT
Page 28 301012-01406-EN-R : Rev B
Dissolved Oxygen
Dissolved oxygen levels recorded at nearshore sites ranged between 99.0% and 103.07% saturation
while offshore sites displayed slightly more variability ranging between 95.3% and 101.5% saturation.
Maximum nearshore and offshore dissolved oxygen levels were observed at SI1 and SBMO3
respectively.
Dissolved oxygen levels decreased with increasing depth at both nearshore and offshore sites. Figure
MAR08 shows dissolved oxygen levels (% saturation) to be lower at offshore sites compared to
nearshore sites. Mean dissolved oxygen values were 101.3% saturation for the nearshore sites,
compared with 98.2% saturation at the offshore sites (Table MAR002).
Table MAR002 Physiochemical water quality parameters for nearshore and offshore sites at
Suai, 17 December 2011
Minim
um
Value
Maximum
Value
Median Mean 20th
Percentile
80th
Percentil
e
Standard
Deviation
Temperature Nearshore 30.78 31.59 31.21 31.24 30.96 31.52 0.04
(°C) Offshore 30.20 31.47 30.89 30.92 30.73 31.05 0.08
pH Nearshore 8.02 8.17 8.12 8.10 8.05 8.13 0.01
Offshore 8.04 8.14 8.11 8.10 8.07 8.13 0.00
Conductivity Nearshore 53.05 53.80 53.60 53.49 53.32 53.70 0.05
(mS/cm) Offshore 52.63 53.93 53.60 53.54 53.35 53.84 0.05
Salinity Nearshore 35.08 35.60 35.47 35.40 35.28 35.53 0.04
(ppt) Offshore 34.76 35.73 35.48 35.43 35.28 35.63 0.03
Turbidity Nearshore 0.60 47.37 5.90 9.00 3.67 12.50 5.88
(NTU) Offshore 3.10 20.00 6.22 6.95 4.10 10.18 1.64
Dissolved
Oxygen
Nearshore 99.03 103.07 101.13 101.22 100.28 101.81 0.30
(% Sat) Offshore 95.25 101.50 98.04 98.80 96.25 100.56 0.61
Dissolved
Oxygen
Nearshore 6.12 6.33 6.20 6.22 6.16 6.24 0.02
(mg/L) Offshore 5.91 6.73 6.10 6.14 6.01 6.21 0.02
SERN
TIMOR LESTE SOUTH COAST EIA
MARINE ENVIRONMENT SUAI TECHNICAL REPORT
Page 29 301012-01406-EN-R : Rev B
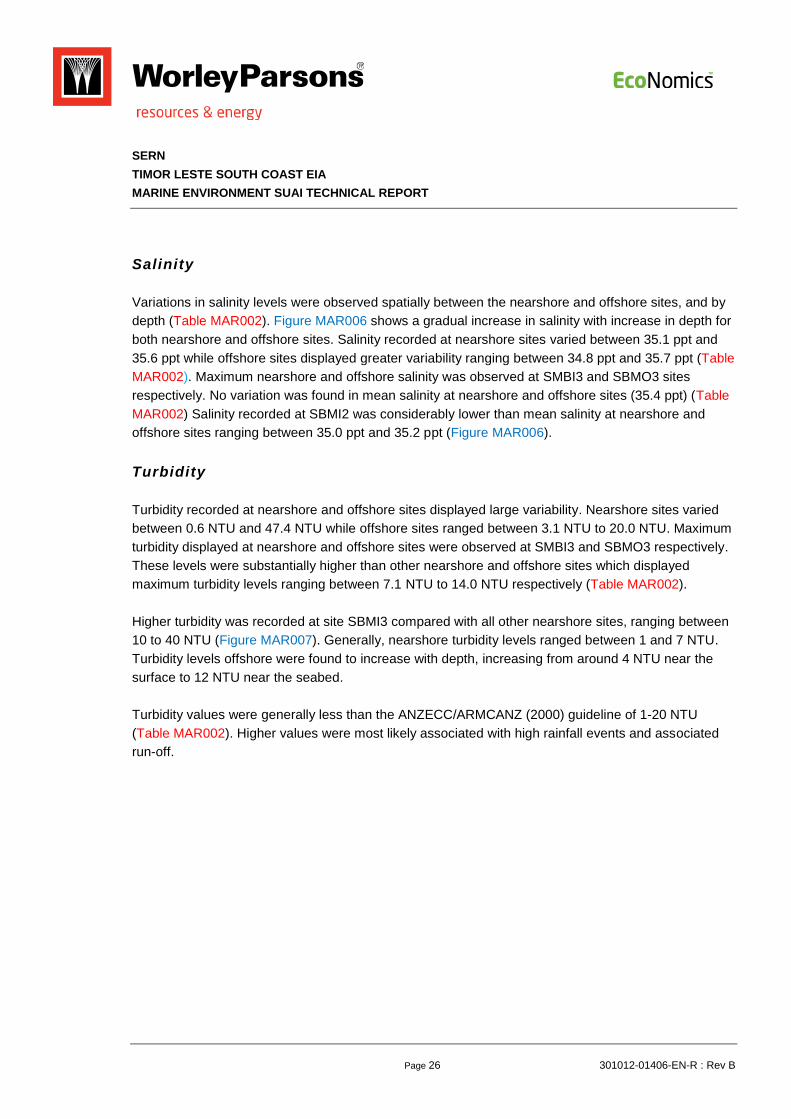
Suspended Solids
Suspended solids (TSS) at nearshore sites had an average concentration of 32.6 mg/L while offshore
sites displayed a higher average concentration 35.8 mg/L. These TSS values are consistent with
turbidity results from both inshore and offshore sites and confirm that ambient turbidity is relatively
high, although within the range expected for coastal areas receiving high rainfall runoff. Maximum
nearshore and offshore suspended solids were observed at SBMI3 and SO1 respectively (Table
MAR003). There are no default trigger values for TSS in ANZECC/ARMCANZ (2000).
Table MAR003 Summary of Total Suspended Solids (TSS) for nearshore and offshore sites,
Suai
Site TSS (mg/L)
LOR * 5
Nearshore
SBMI1 17
SBMI2 30
SBMI3 54
SI1 41
SI2 21
Offshore
SBM01 22
SBM02 30
SBM03 27
S01 55
S02 45
*Limit of Reporting
4.1.2 Chemical Water Quality
Nutrients
A summary of results describing nutrient water quality parameters for nearshore and offshore sites are
presented in Table MAR004.
Ammonia recorded at nearshore sites varied between 0.02 mg/L and 0.03 mg/L while offshore sites
displayed more variability ranging between <0.02 mg/L and 0.1 mg/L. Maximum nearshore ammonia
concentrations were observed at SI1 and SBMI1 while maximum ammonia concentrations offshore
was recorded at SO1. All sites exceeded the ANZECC/ARMCANZ (2000) guideline value of 10µg/L.

SERN
TIMOR LESTE SOUTH COAST EIA
MARINE ENVIRONMENT SUAI TECHNICAL REPORT
Page 30 301012-01406-EN-R : Rev B
Nitrite and Nitrate (NOx) concentrations were below the LOR (0.01 mg/L) at all sites both nearshore
and offshore sites. The ANZECC/ARMCANZ (2000) guideline value for NOx is 0.008 mg/L (8µg/L).
Total nitrogen (TN) concentrations recorded at nearshore sites were similar to TN concentrations
recorded offshore. Nearshore TN concentrations ranged between <0.1 mg/L and 1.1 mg/L while
offshore sites ranged between <0.1 mg/L and 0.9 mg/L. Maximum nearshore and offshore total
nitrogen was observed at SBMI2 and SO1 respectively. Five of the ten sites exceeded the
ANZECC/ARMCANZ (2000) guideline value of 0.1 mg/L (100µg/L).
Given that nitrate and nitrite levels were below the LOR, total nitrogen concentrations were comprised
entirely of the organic nitrogen TKN for samples. Consequently, the summary statistics calculated for
TN were identical to those concentrations calculated for TKN. Generally TN and TKBN concentrations
were similar across all sites both nearshore and offshore.
Total phosphorus recorded sites varied between <0.05 mg/L and 0.05 mg/L. No variability was
observed between nearshore and offshore sites. Maximum total phosphorus concentrations were
observed at near shore site SBMI3 and offshore site SO1. All concentrations were equal to or less
than the limit of reporting of 0.05 mg/L. The LOR is higher than the ANZECC/ARMCANZ (2000)
guideline value of 0.015 mg/L (or 15µg/L).
Reactive phosphorus concentrations recorded at both the nearshore and offshore sites measured
below the LOR of 0.01 mg/L. The LOR is higher than the ANZECC/ARMCANZ (2000) guideline value
of 0.005 mg/L (or 5µg/L).
Chlorophyll a and Biochemical Oxygen Demand
Both nearshore and offshore chlorophyll a concentrations were negligible, all reporting less than the
LOR of 1 mg/m³ and below the ANZECC/ARMCANZ (2000) guideline level of 1.4 mg/m³ Table
MAR005.

SERN
TIMOR LESTE SOUTH COAST EIA
MARINE ENVIRONMENT SUAI TECHNICAL REPORT
Page 31 301012-01406-EN-R : Rev B
Table MAR004 Nutrient water quality parameters for nearshore and offshore sites, Suai.
Nutrients Site Ammonia Nox TKN TN TP RP
mg/L mg/L mg/L mg/L mg/L mg/L
LOR * 0.01 0.10 0.10 0.10 0.01 0.01
ANZECC 0.01 0.008 - 0.1 0.015 0.5
Nearshore SBMI1 0.03 <0.01 0.5 0.5 <0.05 <0.01
SBMI2 0.02 <0.01 1.1 1.1 <0.05 <0.01
SBMI3 0.02 <0.01 <0.5 <0.1 0.05 <0.01
SI1 0.03 <0.01 0.5 0.5 <0.05 <0.01
SI2 0.02 <0.01 <0.5 <0.1 <0.05 <0.01
Offshore SBM01 0.07 <0.01 <0.5 <0.1 <0.05 <0.01
SBM02 0.04 <0.01 <0.5 <0.1 <0.05 <0.01
SBM03 0.05 <0.01 0.7 0.7 <0.05 <0.01
S01 0.1 <0.01 0.9 0.9 0.05 <0.01
S02 0.02 <0.01 <0.5 <0.1 <0.05 <0.01
* Limit of Reporting Bold indicates values above the ANZECC limit
Biochemical Oxygen Demand (BOD) is used as an indicator of organic loading based on the amount
of dissolved oxygen needed by aerobic biological organisms to break down organic material within a
body of water. BOD levels were below the LOR at all sites with the exception of one offshore site
(SO2) where a value of 21 mg/L was recorded. All other sites measured BOD levels <2 mg/L.

SERN
TIMOR LESTE SOUTH COAST EIA
MARINE ENVIRONMENT SUAI TECHNICAL REPORT
Page 32 301012-01406-EN-R : Rev B
Table MAR005 Chlorophyll a and BOD values, Nearshore and offshore sites, Suai
Site Chl a BOD
mg/m3 mg/L
LOR * 1 2
ANZECC 1.40 n/a
Nearshore SBMI1 <1 <2
SBMI2 - <2
SBMI3 <1 <2
SI1 <1 <2
SI2 <1 <2
Offshore SBM01 <1 <2
SBM02 <1 <2
SBM03 <1 <2
S01 <1 <2
S02 <1 21
* Limit of Reporting
Bold indicates values above ANZECC
Metals
Total and dissolved metal concentrations recorded from the near shore and offshore sampling sites
are presented in Table MAR006 and Table MAR007, respectively. All data was then compared with
the ANZECC/ARMCANZ (2000) guideline values. Results were also averaged for nearshore and
offshore sites with mean values presented below.

SERN
TIMOR LESTE SOUTH COAST EIA
MARINE ENVIRONMENT SUAI TECHNICAL REPORT
Page 33 301012-01406-EN-R : Rev B
Table MAR006 Total metal concentrations for near shore and offshore sites, Suai
Site Mercury Cadmium Chromium Copper Lead Nickel Zinc
Metals mg/L µg/L µg/L µg/L µg/L µg/L µg/L
LOR* 0.0001 0.2 0.5 1.0 0.2 0.5 5
ANZECC 0.1 0.7 7.7 0.3 2.2 7 7
Nearshore SBMI1 <0.0001 <0.20 <0.5 2 <0.2 <0.5 <5
SBMI2 <0.0001 <0.20 <0.5 2.1 0.3 <0.5 <5
SBMI3 <0.0001 <0.20 0.6 1.6 0.2 0.8 <5
SI1 <0.0001 <0.20 0.5 6.4 <0.2 <0.5 8
SI2 <0.0001 <0.20 0.8 <1.0 <0.2 0.6 <5
Offshore SBM01 <0.0001 <0.20 0.6 1.6 0.2 <0.5 <5
SBM02 <0.0001 <0.20 <0.5 1.1 <0.2 <0.5 <5
SBM03 <0.0001 <0.20 <0.5 1.2 0.3 0.6 10
S01 <0.0001 <0.20 0.5 1.4 <0.2 <0.5 <5
S02 <0.0001 <0.20 0.7 4.5 0.8 0.8 <5
* Limit of Reporting
Bold indicates values above ANZECC

SERN
TIMOR LESTE SOUTH COAST EIA
MARINE ENVIRONMENT SUAI TECHNICAL REPORT
Page 34 301012-01406-EN-R : Rev B
Table MAR007 Dissolved metal concentrations for nearshore and offshore sites, Suai
Site Mercury Cadmium Chromium Copper Lead Nickel Zinc
Metals mg/L µg/L µg/L µg/L µg/L µg/L µg/L
LOR* 0.0001 0.2 0.5 1.0 0.2 0.5 5
ANZECC 0.1 0.7 7.7 0.3 2.2 7 7
Nearshore SBMI1 <0.0001 <0.20 <0.5 <1.0 0.20 0.60 <5
SBMI2 <0.0001 <0.20 <0.5 <1.0 0.30 0.50 5
SBMI3 <0.0001 <0.20 0.50 1.10 <0.2 <0.5 <5
SI1 <0.0001 <0.20 0.50 3.60 <0.2 <0.5 <5
SI2 <0.0001 <0.20 0.50 <1.0 <0.2 <0.5 <5
Offshore SBM01 <0.0001 <0.20 <0.5 2.60 <0.2 0.50 <5
SBM02 <0.0001 <0.20 <0.5 <1.0 <0.2 <0.5 <5
SBM03 <0.0001 <0.20 0.60 <1.0 <0.2 0.50 <5
S01 <0.0001 <0.20 0.50 2.00 <0.2 0.60 <5
S02 0.0001 <0.20 0.50 1.80 0.40 0.50 <5
* Limit of Reporting
Bold indicates values above ANZECC
Dissolved and total mercury concentrations were below the LOR of 0.0001 mg/L at all sites. One
offshore site displayed a mercury concentration of 0.0001 mg/L identical to the ANZECC/ARMCANZ
(2000) trigger level.
Dissolved and total concentrations of cadmium were <0.20µg/L at both nearshore and offshore sites,
and therefore less than the ANZECC/ARMCANZ (2000) trigger value of 0.7µg/L.
Dissolved chromium concentrations collected from nearshore samples were similar to concentrations
displayed from offshore sites. Maximum nearshore dissolved chromium concentrations were observed
at SBMI3, SI1 and SI2, while maximum offshore concentrations were recorded at SMB03. All sites
were less than the ANZECC/ARMCANZ (2000) trigger value of 7.7µg/L.

SERN
TIMOR LESTE SOUTH COAST EIA
MARINE ENVIRONMENT SUAI TECHNICAL REPORT
Page 35 301012-01406-EN-R : Rev B
Dissolved copper concentrations collected from nearshore samples varied between <1.0µg/L and
3.6µg/L while offshore sites displayed less variability ranging between <1.0µg/L and 2.6µg/L.
Maximum nearshore and offshore dissolved copper concentrations were observed at SI1 and SBM01
respectively. SBMI2, SBMO2, SBMI3 AND SBMO3 all exceeded the ANZECC/ARMCANZ (2000)
trigger value of 0.3µg/L.
Total copper concentrations collected from nearshore samples varied between <1.0µg/L and 6.4µg/L
while offshore sites displayed less variability ranging between <1.0µg/L and 4.5µg/L. Maximum
nearshore and offshore total copper concentrations were observed at SI1 and S02 respectively.
Results confirm that most of the copper present in water is attached to particulates.
Dissolved lead concentrations were above the LOR of 0.1µg/L at two nearshore sites (SMBI1 and
SMBI2) and one offshore site (S2O). Total lead concentrations comparable between sites ranging
between 0.2µg/L and 0.3µg/L nearshore and <0.2µg/L to 0.4µg/L for offshore sites. All sites were
below the ANZECC/ARMCANZ (2000) trigger value of 2.2µg/L (Table MAR007).
Dissolved nickel concentrations were above the LOR at two sites nearshore (SMBI1 and SMBI2) and
four sites offshore (SMB01, SMB03, S1O and S2O), while all remaining sites recorded concentrations
below the LOR of 0.5µg/L. Total nickel concentrations were above the LOR at nearshore sites SMBI2
and SMBI3 and at offshore sites SBM03 and S2O (Table MAR007).
Mean total nickel concentrations were similar for nearshore and offshore sites while dissolved nickel
concentrations were slightly higher nearshore when compared to offshore. All sites were below the
ANZECC/ARMCANZ (2000) trigger value of 7µg/L.
Dissolved zinc concentrations were generally below the LOR of 1µg/L, however a value of 5µg/L was
observed at the nearshore site SMBI2, which is above the LOR, but below the ANZECC/ARMCANZ
(2000) trigger value of 7µg/L. Concentrations of total zinc however were above the LOR but below the
trigger except for SI1 which recorded a total zinc concentration of 8µg/L and offshore site SBM03
which displayed a concentration of 10µg/L (Table MAR007).
Hydrocarbons
Total Petroleum Hydrocarbons (TPH; C10 to C36 Fraction), Total Recoverable Hydrocarbons (TRH;
>C10 to C40 Fraction) and Polynuclear Aromatic Hydrocarbons (PAH) were measured at all sites
nearshore and offshore. All hydrocarbon concentrations were less than the LOR (Table MAR008).

SERN
TIMOR LESTE SOUTH COAST EIA
MARINE ENVIRONMENT SUAI TECHNICAL REPORT
Page 36 301012-01406-EN-R : Rev B
Table MAR008 Hydrocarbon concentrations for nearshore and offshore sites at Suai
Hydrocarbons Site Total TPH
Total TRH Total PAH
µg/L µg/L µg/L
LOR* 50 100 0.5
Nearshore SBMI1 <50 <100 <0.5
SBMI2 <50 <100 <0.5
SBMI3 <50 <100 <0.5
SI1 <50 <100 <0.5
SI2 <50 <100 <0.5
Offshore SBM01 <50 <100 <0.5
SBM02 <50 <100 <0.5
SBM03 <50 <100 <0.5
S01 <50 <100 <0.5
S02 <50 <100 <0.5
* Limit of Reporting
4.2 Sediment Quality
4.2.1 Chemical Sediment Quality
Laboratory data for chemical sediment quality including; nutrients, metals and hydrocarbons, was
analysed, with a summary of the results presented below.
Nutrients
A summary of sediment nutrient parameter results collected from nearshore and offshore sites are
presented in Table MAR009. There are no sediment quality criteria for nutrients.

SERN
TIMOR LESTE SOUTH COAST EIA
MARINE ENVIRONMENT SUAI TECHNICAL REPORT
Page 37 301012-01406-EN-R : Rev B
Table MAR009 Nutrient sediment quality parameters for nearshore and offshore sites, Suai
Nutrients Site Ammonia NOx TKN TN TP
mg/kg mg/kg mg/kg mg/kg mg/kg
LOR* 20 0.1 20 20 2
Nearshore SBMI1 <20 0.8 170 170 499
SBMI2 - - - - -
SBMI3 <20 <0.1 340 340 403
SI1 <20 <0.1 100 100 602
SI2 <20 <0.1 210 210 542
Offshore SBM01 <20 <0.1 290 290 513
SBM02 <20 <0.1 260 260 509
SBM03 <20 <0.1 380 380 431
S01 <20 <0.1 620 620 516
S02 20 <0.1 840 840 485
* Limit of Reporting - No Sample Result
Nitrogen concentrations collected from nearshore samples ranged between 100 mg/kg and 340 mg/kg
while offshore sites displayed more variability ranging between 260 mg/kg and 840 mg/kg. Maximum
nearshore and offshore nitrogen concentrations were observed at 340 mg/kg and 840 mg/kg
respectively.
Total phosphorus concentrations for nearshore and offshore sites are presented in MAR011.
Phosphorus concentrations collected from nearshore samples varied between 403 mg/kg and 602
mg/kg while offshore sites displayed less variability ranging between 431 mg/kg and 516 mg/kg.
Maximum nearshore and offshore phosphorus concentrations were observed at SI1 and SO1
respectively.
Metals
Metal levels identified within the sediment at nearshore and offshore sites are presented in Table
MAR010. All data was compared with ANZECC/ARMCANZ (2000) guideline values. Results that were
above the ANZECC guidelines were averaged for nearshore and offshore sites and graphically
displayed for comparison.

NOTES: GH--CW HHB FOR INTERNAL REVIEW23/03/2012TASI MANE PROJECT
ENVIRONMENTAL IMPACT ASSESSMENTPROJECT: 301012-001504
A4 SHEET
Copyright ©
WorleyParsons Services Pty LtdREPUBLICA DEMOCRATICA DE TIMOR-LESTE
SECRETARIA DE ESTADO DOS RECURSOS NATURAIS
DESCHK APPD CUSTDRN ENGREV REVISION DESCRIPTIONDATE
LO
CA
TIO
N:
\\perw
orf
il1\infs
truclib
\Pro
jects
\301012-0
1504 E
nviro Im
p A
ssessm
ent T
imor-
Leste
\2.0
Report
s\2
.1 E
nvironm
enta
l Im
pact A
ssessm
ent\
Fig
ure
s\0
3_W
ork
ing\M
AR
INE
\MA
R009_M
AR
010\3
01012_01504_E
IA_M
AR
009_M
AR
010_v0-1
_cw
.vsd
PLO
T D
AT
E A
ND
TIM
E:
23 M
ar
2012, 5:2
9 P
MC
reato
r: C
ourt
enay W
heele
r
Mean nitrogen values for nearshore and offshore sediment, with the ANZECC guideline
value shown in red
Mean values of phosphorus for nearshore and offshore, with the ANZECC guideline value
shown in redFigure MAR010
Figure MAR009

SERN
TIMOR LESTE SOUTH COAST EIA
MARINE ENVIRONMENT SUAI TECHNICAL REPORT
Page 39 301012-01406-EN-R : Rev B
Table MAR010 Metal sediment quality parameters for nearshore and offshore sites at Suai
Metals Site Cadmium Chromium Copper Lead Nickel Zinc Mercury
mg/kg mg/kg mg/kg mg/kg mg/kg mg/kg mg/kg
LOR* 0.1 1 1 1 1 1 0.01
ANZECC 1.5 80 65 50 21 200 0.15
Nearshore SBMI1 <0.1 16 18 <1.0 24.4 32.3 0.01
SBMI2 - - - - - - -
SBMI3 <0.1 14.2 29.6 2.7 28.1 46.5 0.03
SI1 <0.1 <1.0 <1.0 <1.0 <1.0 <1.0 0.02
SI2 <0.1 <1.0 <1.0 <1.0 <1.0 <1.0 0.01
Offshore SBM01 <0.1 14.9 16.5 <1.0 24.6 32.2 0.02
SBM02 <0.1 17.8 17.8 <1.0 28.9 38 0.02
SBM03 <0.1 15.8 28 1.2 27.5 45.3 0.12
S01 <0.1 <1.0 <1.0 <1.0 <1.0 <1.0 0.05
S02 <0.1 <1.0 <1.0 <1.0 <1.0 <1.0 0.04
* Limit of Reporting - No Sample Result Bold indicates values above ANZECC
Nickel concentrations collected from nearshore samples and offshore displayed similar variation
ranging varied between <1.0 mg/kg and 28.9 mg/kg. Maximum nearshore and offshore nickel
concentrations were observed at SBMI3 and SBMO2 respectively. All sites located between the
Karoulun and Raiketan Rivers exceeded the adopted ANZECC (2000) guideline value of 21 mg/kg.
The remaining sites to the south of these rivers were found at levels less than 1.0 mg/kg (Table
MAR010).

SERN
TIMOR LESTE SOUTH COAST EIA
MARINE ENVIRONMENT SUAI TECHNICAL REPORT
Page 40 301012-01406-EN-R : Rev B
Hydrocarbons
A summary of hydrocarbon (TPH, TRH and PAH) concentrations collected from sediment samples
from nearshore and offshore environments at Suai are presented in Table MAR011. Hydrocarbon
concentrations were below the LOR for all nearshore and offshore sites.
Table MAR011 Summary of hydrocarbon sediment quality parameters for nearshore and
offshore sites at Suai
Hydrocarbons
Site Total TPH
Total TRH Total PAH
mg/kg mg/kg mg/kg
LOR* 50 50 0.5
Nearshore
SBMI1 <50 <100 <0.5
SBMI2 <50 <100 <0.5
SBMI3 <50 <100 <0.5
SI1 <50 <100 <0.5
SI2 <50 <100 <0.5
Offshore
SBM01 <50 <100 <0.5
SBM02 <50 <100 <0.5
SBM03 <50 <100 <0.5
S01 <50 <100 <0.5
S02 <50 <100 <0.5 * Limit of Reporting
4.2.2 Particle Size
Particle size distribution (PSD) at inshore sites was dominated by sand (mean = 71%, n =4), with
some fines (mean = 29%, n = 4) whereas offshore sites were dominated by fines (mean = 63%, n = 5),
with some sand (mean = 37%, n = 5) (Figure MAR011).

NOTES: GH--CW HHB FOR INTERNAL REVIEW23/03/2012TASI MANE PROJECT
ENVIRONMENTAL IMPACT ASSESSMENTPROJECT: 301012-001504
A4 SHEET
Copyright ©
WorleyParsons Services Pty LtdREPUBLICA DEMOCRATICA DE TIMOR-LESTE
SECRETARIA DE ESTADO DOS RECURSOS NATURAIS
DESCHK APPD CUSTDRN ENGREV REVISION DESCRIPTIONDATE
LO
CA
TIO
N:
\\perw
orf
il1\infs
truclib
\Pro
jects
\301012-0
1504 E
nviro Im
p A
ssessm
ent T
imor-
Leste
\2.0
Report
s\2
.1 E
nvironm
enta
l Im
pact A
ssessm
ent\
Fig
ure
s\0
3_W
ork
ing\M
AR
INE
\MA
R011\3
01012_01504_E
IA_M
AR
011_v0-1
_cw
.vsd
PLO
T D
AT
E A
ND
TIM
E:
23 M
ar
2012, 5:2
8 P
MC
reato
r: C
ourt
enay W
heele
r
Mean PSD at Suai inshore and Suai offshore sitesFigure MAR011

SERN
TIMOR LESTE SOUTH COAST EIA
MARINE ENVIRONMENT SUAI TECHNICAL REPORT
Page 42 301012-01406-EN-R : Rev B
4.3 Benthic Habitat
4.3.1 Substrate
The substrate recorded in the study area comprised of either sediment or rock. Sediment substrate
was recorded across all surveyed transects, including areas where rock was present. Sediment was
the dominant substrate type found within the study area comprising mainly sand and silt. The
sediment profile was relatively flat with small ripples (<10 cm) in some areas (Plate MP002, in Section
3.4.2).
The only hard substrate recorded was rock in the form of cobbles (64-256 mm) and boulders (> 256
mm). Rocks comprised between 10 to 15% of the surveyed transect area and were found to be
located close to the shore at a maximum distance of 450 m from the shoreline (Figure MAR012).
4.3.2 Biota
The presence of biota was always associated with the presence of hard substrate (Figure MAR013).
The only biota found present on the rocks was turf algae. The density of turf algae covering the rock
within transects ranged from sparse (<25%) to dense (>75%), but more commonly covered <25% of
the substrate (Figure MAR012).

754000
754000
756000
756000
758000
758000
8968
000
8968
000
8970
000
8970
000
LEGENDBiota and substrate
Algae (rock)Algae (rock, sand)Algae, coral, invertebrate (coral rubble, sand)Algae, invertebrate (rock)Algae, invertebrate (sand, coral rubble)Coral (coral reef)Seagrass, algae (rock)(rock)(sand)Main roadMinor roads and tracksWatercourse
Suai development areaSuai Supply BaseNova SuaiSuai Airport Crocodile reserve
0 0.25 0.5 0.75 10.125
Kilometres
LOCATION PLAN
This map contains:1. Imagery Suai: SRTM (2011)2. Imagery: DigitalGlobe (2008 - 2010)3. Rivers: GIGTimorLeste (2010)4. Roads: DivaGIS (2010)
Scale: 1:7,000,000
LOCA
TION:
\\P
ERWO
RFIL1
\INFS
TRUC
LIB\PR
OJEC
TS\30
1012
-0150
4 ENV
IRO
IMP A
SSES
SMEN
T TIM
OR-LE
STE\1
0.0 EN
GINE
ERIN
G\GE
OMAT
ICS\0
3PRO
JECT
\WOR
KSPA
CE\_S
KT\30
1012
_015
04_E
IA_F
047.M
XD
USER
NAM
E : C
OURT
ENAY
.WHE
ELER
NOTES:
DRAFT
Timor-Leste
Projection: WGS 1984 UTM Zone 51S
B FOR CLIENT REVIEW
Figure MAR012Suai benthic habitat tow paths
MW GH
REV DRN
PLOT
DAT
E & TI
ME :
22 M
AR 20
12, 6
:39:47
PM
DATE REVISION DESCRIPTION CHK ENGDES APPD CUST
A4 SHEET 1:25,000
Copyright ©WorleyParsons Services Pty Ltd
EM23/03/2012 TASI MANE PROJECT ENVIRONMENTAL IMPACT ASSESSMENT
SCALE
PROJECT No: 301012-001504
REPUBLICA DEMOCRATICA DE TIMOR-LESTESECRETARIA DE ESTADO DOS RECURSOS NATURAIS

749000
749000
750000
750000
751000
751000
752000
752000
8965
000
8965
000
8966
000
8966
000
LEGENDMinor roads and tracks
Biota and substrateAlgae (rock)Algae (rock, sand)Algae, coral, invertebrate (coral rubble, sand)Algae, invertebrate (rock)Algae, invertebrate (sand, coral rubble)Coral (coral reef)Seagrass, algae (rock)(rock)(sand)
0 0.2 0.4 0.60.1
Kilometres
LOCATION PLAN
This map contains:1. Imagery Suai: SRTM (2011)2. Imagery: DigitalGlobe (2008 - 2010)3. Rivers: GIGTimorLeste (2010)4. Roads: DivaGIS (2010)
Scale: 1:7,000,000
LOCA
TION:
\\P
ERWO
RFIL1
\INFS
TRUC
LIB\PR
OJEC
TS\30
1012
-0150
4 ENV
IRO
IMP A
SSES
SMEN
T TIM
OR-LE
STE\1
0.0 EN
GINE
ERIN
G\GE
OMAT
ICS\0
3PRO
JECT
\WOR
KSPA
CE\_S
KT\M
ARIN
E\301
012_
0150
4_EIA
_MAR
013_
REVB
.MXD
USER
NAM
E : C
OURT
ENAY
.WHE
ELER
NOTES:
DRAFT
Timor-Leste
B FOR CLIENT REVIEW
Figure MAR013Suai reef area benthic habitat tow paths
MW GH
REV DRN
PLOT
DAT
E & TI
ME :
23 M
AR 20
12, 6
:26:35
PM
DATE REVISION DESCRIPTION CHK ENGDES APPD CUST
A4 SHEET 1:14,500
Copyright ©WorleyParsons Services Pty Ltd
EM23/03/2012 TASI MANE PROJECT ENVIRONMENTAL IMPACT ASSESSMENT
SCALE
PROJECT No: 301012-001504
REPUBLICA DEMOCRATICA DE TIMOR-LESTESECRETARIA DE ESTADO DOS RECURSOS NATURAIS
Insert 1
See insert 1

SERN
TIMOR LESTE SOUTH COAST EIA
MARINE ENVIRONMENT SUAI TECHNICAL REPORT
Page 45 301012-01406-EN-R : Rev B
4.3.3 Reef Adjacent to Development Area
A coral reef is located approximately 5km to the south west of the Suai development. The reef is
predominantly a low diversity reef flat. Limestone rock was the primary substrate of the reef. The main
biotic classes found on the reef flat were algae (turf, Padina, brown and green), seagrass and sparse
patches of soft coral. Dense seagrass meadows were found along the reef flats but were limited in
extent.
The reef flat drops steeply into deep water. The greatest coral diversity was generally found within 5 to
8m of the surface which then gradually declined below 8 m. The band of rich coral growth is very
narrow, being approximately 50 m wide. The dominant species found were Acropora and plating
Porites.
The dense coral cover gradually changes into a mix of algae and invertebrates found growing on a
coral rubble substrate from approximately 8 to 12 m. Brown algae was the main type of algae present
with the invertebrates mainly consisting of seawhips, sponges and gorgonians. The band of
algae/invertebrates found growing on coral rubble was narrow, being approximately 100 m wide.
Generally from a depth 10m sand was observed as part of the substrate until 12 m below surface,
where it turned into 100% sand.
4.4 Plankton
A total of 367 planktonic fauna from 17 taxonomic groups were collected during the baseline survey.
The most abundant fauna were larvaceans (n=97), followed by copepods (n=93) and pteropods
(n=47). Plate MP004 shows the top three most abundant fauna.
4.4.1 Fish Larvae and Eggs
A total of 4 fish larvae and 13 fish eggs were collected in the plankton trawls (Plate MP005). The
larvae collected were all of similar anatomy, possibly from the same species. Identification of larval fish
is difficult; however, following the taxonomic guide of Leis and Carson-Ewart (2004), the fish collected
have the following characters:
Body is very elongated (body depth < 10% of body length); and
Gut is short < 50% of body length.
This matches Group 3 in Leis and Carson-Ewart (2004), from this group it is most likely the fish larvae
are from the family Blennidae.

LO
CA
TIO
N:
\\perw
orf
il1\infs
truclib
\Pro
jects
\301012-0
1504 E
nviro Im
p A
ssessm
ent T
imor-
Leste
\2.0
Report
s\2
.1 E
nvironm
enta
l Im
pact A
ssessm
ent\
Pla
tes\0
3_W
ork
ing\M
AR
INE
\MP
003_M
P004\3
01012_01504_E
IA_M
P003_M
P004_v0-1
_cw
.vsd
PLO
T D
AT
E A
ND
TIM
E:
23 M
ar
2012, 6:0
1 P
MC
reato
r: C
ourt
enay W
heele
r
Sourc
e:
Sourc
e:
Plate MP003 Map showing turf algae present on the rocks, adjacent to the Suai footprint area
Plate MP004Most abundant fauna collected in plankton trawls. (top left - larvaceans; top right –
Calanoidea Copopods; bottom – Pteropoda)

LO
CA
TIO
N:
\\perw
orf
il1\infs
truclib
\Pro
jects
\301012-0
1504 E
nviro Im
p A
ssessm
ent T
imor-
Leste
\2.0
Report
s\2
.1 E
nvironm
enta
l Im
pact A
ssessm
ent\
Pla
tes\0
3_W
ork
ing\M
AR
INE
\MP
005_M
P006\3
01012_01504_E
IA_M
P005_M
P006_v0-1
_cw
.vsd
PLO
T D
AT
E A
ND
TIM
E:
23 M
ar
2012, 6:0
6 P
MC
reato
r: C
ourt
enay W
heele
r
Sourc
e:
Sourc
e:
Plate MP005Larval fish and eggs collected in plankton trawls (Not to scale); Fish 1-2mm in length;
Eggs 0.5 – 1mm in diameter
Plate MP006
Most abundant fauna collected in benthic grabs. Top left - Hydrozoan; top right –
Tellinidae; bottom – Terebellidae (Terebellidae specimen only a representative
photograph)

SERN
TIMOR LESTE SOUTH COAST EIA
MARINE ENVIRONMENT SUAI TECHNICAL REPORT
Page 48 301012-01406-EN-R : Rev B
The cluster plot and MDS ordination showed three groupings of sampling sites. The overlay, of the
cluster plot onto the MDS ordination showed the majority of sites have a 60% similarity grouping
(green circles; Figure MAR017). A one-way ANOSIM comparing each community was not able to be
conducted for each site as the survey design did not account for replicate plankton trawls. However,
allocating the samples by ‘S’ location; ‘SBM’ location and ‘SMB’ location as indicated by groupings in
the MDS ordination, the one-way ANOSIM showed no significant difference between these groups
(Global R=0.207; p=0.139; Figure MAR015).
A SIMPER analysis determined the fauna contributing to the differences between sites. The most
dominant fauna Calanoids, Pteropoda and Larvaceans had a 60% combined contribution to the
difference between sites (Table MAR012).
Table MAR012 SIMPER analysis results for plankton fauna contributing to all site
differences
Species Av.Abund Contrib% Cum.%
Calanoid 5.19 39.24 39.24
Pteropoda 3.57 19.45 58.69
Larvaceans 2.89 10.32 69.01
Gastropoda 1.61 6.44 75.45
Fish eggs 1.22 5.7 81.16
Crab Zoea 1.27 4.55 85.71
Chaetognaths 1.64 4.05 89.76
Prawn Larvae 1.14 2.91 92.68
4.5 Infauna
A total of 238 macroinvertebrates from 61 taxonomic groups were collected during this baseline
survey. The most abundant family was the Tellinidae bivalves (n=16), followed by the spaghetti worms
Terebellidae (n=15) and a branching Hydrozoan (n=14). Plate MP004 shows the top three most
abundant fauna. The Terebellidae specimen shown in Plate MP004 is only a representative
photograph; and not a specimen collected during the survey.

SERN
TIMOR LESTE SOUTH COAST EIA
MARINE ENVIRONMENT SUAI TECHNICAL REPORT
Page 49 301012-01406-EN-R : Rev B
The cluster plot showed no strong groupings of sampling site or replicates (Figure MAR016). This was
supported in the MDS ordination which shows all sites generally grouped together. The overlay, of the
cluster plot onto the MDS ordination showed the majority of sites have a 40% similarity grouping
(green circles; Figure MAR017). A one-way ANOSIM comparing each community, supports the
findings that there is no significant difference between the sites, with a global R=0.103 (p=0.148). A
SIMPER analysis showed that the fauna contributing to the differences between sites, with the most
dominant fauna Tellinidae, having 27.2% contribution to the difference between sites (Table MAR013).
Table MAR013 SIMPER analysis results for fauna contributing to all site differences.
Species Av.Abund Contrib% Cum.%
Tellinidae 1.93 27.22 27.22
Pasiphaeidae 1.61 17.04 44.25
Ampeliscidae 1.29 8.86 53.12
Nephtyidae 1.11 8.26 61.38
Spionidae 1.22 7.41 68.78
Veneridae 0.95 5.68 74.46
Naticidae 0.88 4.62 79.08
Terebellidae 0.89 4.61 83.69
Dentaliidae 0.87 4.06 87.75
Ogyrididae 0.8 2.69 90.43
Sternapsidae 0.68 2.27 92.7
Alphiidae 0.65 1.91 94.62
Pilumnidae 0.55 1.62 96.24
Ocypodidae 0.49 0.96 97.2
Lysianassidae 0.36 0.81 98.01
Sipuncula 0.33 0.69 98.71
Leucosiidae 0.45 0.52 99.23
Portunidae 0.37 0.3 99.53
Sigalionidae 0.24 0.24 99.77
Corbulidae 0.23 0.23 100

NOTES: GH--CW HHB FOR INTERNAL REVIEW23/03/2012TASI MANE PROJECT
ENVIRONMENTAL IMPACT ASSESSMENTPROJECT: 301012-001504
A4 SHEET
Copyright ©
WorleyParsons Services Pty LtdREPUBLICA DEMOCRATICA DE TIMOR-LESTE
SECRETARIA DE ESTADO DOS RECURSOS NATURAIS
DESCHK APPD CUSTDRN ENGREV REVISION DESCRIPTIONDATE
LO
CA
TIO
N:
\\perw
orf
il1\infs
truclib
\Pro
jects
\301012-0
1504 E
nviro Im
p A
ssessm
ent T
imor-
Leste
\2.0
Report
s\2
.1 E
nvironm
enta
l Im
pact A
ssessm
ent\
Fig
ure
s\0
3_W
ork
ing\M
AR
INE
\MA
R014_M
AR
015\3
01012_01504_E
IA_M
AR
014_M
AR
015_v0-1
_cw
.vsd
PLO
T D
AT
E A
ND
TIM
E:
23 M
ar
2012, 5:2
7 P
MC
reato
r: C
ourt
enay W
heele
r
Cluster plot showing the similarity of plankton survey sites
Comparison of average pH levels for offshore sites, outliers from nearshore sites as well
as the average nearshore levelsFigure MAR015
Figure MAR014

NOTES: GH--CW HHB FOR INTERNAL REVIEW23/03/2012TASI MANE PROJECT
ENVIRONMENTAL IMPACT ASSESSMENTPROJECT: 301012-001504
A4 SHEET
Copyright ©
WorleyParsons Services Pty LtdREPUBLICA DEMOCRATICA DE TIMOR-LESTE
SECRETARIA DE ESTADO DOS RECURSOS NATURAIS
DESCHK APPD CUSTDRN ENGREV REVISION DESCRIPTIONDATE
LO
CA
TIO
N:
\\perw
orf
il1\infs
truclib
\Pro
jects
\301012-0
1504 E
nviro Im
p A
ssessm
ent T
imor-
Leste
\2.0
Report
s\2
.1 E
nvironm
enta
l Im
pact A
ssessm
ent\
Fig
ure
s\0
3_W
ork
ing\M
AR
INE
\MA
R016_M
AR
017\3
01012_01504_E
IA_M
AR
016_M
AR
017_v0-1
_cw
.vsd
PLO
T D
AT
E A
ND
TIM
E:
23 M
ar
2012, 5:2
6 P
MC
reato
r: C
ourt
enay W
heele
r
Cluster plot showing the similarity of macroinvertebrate survey sites
MDS ordination of macroinvertebrate samples. Circles show similarity groupings from the
Cluster analysisFigure MAR017
Figure MAR016

SERN
TIMOR LESTE SOUTH COAST EIA
MARINE ENVIRONMENT SUAI TECHNICAL REPORT
Page 51 301012-01406-EN-R : Rev B
5. DISCUSSION
5.1 Water Quality
Physicochemical water quality
Results collected during the field investigation between 16 and 18 December 2011 indicated that
marine water quality conditions at Suai are generally considered typical of a tropical marine ecosystem
at the start of the wet season (Kirono, 2010). Physicochemical water quality parameters varied
between nearshore and offshore sites, and are mainly related to differences in depth and their
proximity to riverine discharges along the coast.
Temperature was found to generally decrease at a rate of 0.10°C per 5 m across all sites. This is most
likely a consequence of the sunlights limitation in penetrating the water column with depth. Generally
the offshore temperature was 0.20°C less than nearshore. This can be attributed to an influence of
currents offshore and therefore an increased susceptibility to mixing, in comparison to the shallower
nearshore waters (Prince et al., 1986).
An increase in salinity was noted in both nearshore and offshore sites with depth. Surface waters from
the offshore sites were slightly less saline than surface waters from the nearshore sites but the
difference was minor and less than 0.4 ppt. The difference in the inshore sites was in the order of 0.2
ppt. The difference noted may be due to the flow of freshwater runoff from the rivers to the west and
east of the site, however no significant pycnocline (density gradient) was evident indicating that
coastal waters are well mixed.
No trend in pH was apparent and the dataset too small to draw any conclusions relating to temporal or
spatial variation. The pH values in the offshore sites varied between 8.09 and 8.10, while inshore sites
varied between 8.11 and 8.14.
Generally turbidity gradually increased with depth at both locations. There was also significant
variability noted within the inshore sites, in particular at a Site SBMI3 which had much higher turbidity
than other inshore sites. This is most likely attributed to its proximity to a major riverine discharge near
the northern boundary of the project site. Of the offshore sites, SBMO3 (and to a lesser extent
SBM02) were also elevated compared with other sites but only beyond the 5 m water depth. It is likely
that rainfall events mobilise large volumes of sediment from within the catchment discharging them
into the ocean causing ambient turbidity levels in the coastal environment to become elevated.
Dissolved oxygen decreased with increasing depth in the offshore sites with a less apparent trend in
the inshore sites. Near the surface, water is found to more readily mixed with the atmosphere through
wave action that causes oxygen to become dissolved. With increasing depth, DO is taken up by

SERN
TIMOR LESTE SOUTH COAST EIA
MARINE ENVIRONMENT SUAI TECHNICAL REPORT
Page 52 301012-01406-EN-R : Rev B
respiration or biological oxygen demand and there is less turbulence from wave action reducing the
level of atmospheric oxygen available for dissolution.
Chemical water quality
Concentrations of nutrients were generally below the laboratories limit of reporting (LOR) for all
nearshore and offshore sites, with the exception of ammonia and total nitrogen. Ammonia levels were
found to be generally higher in the offshore sites and exceeded the recommended
ANZECC/ARMCANZ (2000) trigger level at all sites. Similarly, total nitrogen exceeded recommended
trigger levels at five of the ten sites sampled; however, exceedances occurred in both inshore and
offshore sites. No spatial trends were apparent in the data.
Low concentrations of total and dissolved metals were observed in offshore and nearshore sites
except for total and dissolved copper concentrations which exceeded the ANZECC/ARMCANZ (2000)
guidelines at five sites, namely Sites SBM13, SI1, SBMO1, SO1, and SO2. Copper is considered a
naturally occurring metal in the marine environment, particularly from rivers and from ocean
sediments, therefore high concentrations observed may indicate copper concentrations are likely to be
naturally high. Similarly, total concentrations of zinc at SBMO3 and SI1 exceeded the
ANZECC/ARMCANZ (2000) trigger for zinc, however all dissolved concentrations were less than the
trigger level.
5.2 Sediment Quality
Concentrations of total nitrogen and phosphorus were relatively high in coastal sediments.
Concentrations of total nitrogen were generally higher in the offshore sites and highest at Sites S02
and S01. Concentrations of phosphorous were consistent across all sites with no trend apparent.
Total nitrogen concentrations observed at all sampling sites were comprised of 100% organic nitrogen
(TKN) which indicates that nitrogen found in sediments within the study area are of organic origin.
Organic sources of nitrogen found in the study area are likely derived from agriculture activities along
the Karoulin and Raiketan Rivers. Organic nitrogen that form the primary constituent of natural
fertilizing techniques are washed into the catchment before discharging from the river mouth into the
ocean (Carpenter et al., 1998).
All metal concentrations in marine sediments were less than the ANZECC/ARMCANZ (2000) sediment
quality guidelines except for nickel. Elevated concentrations were recorded from sites SBMI1, SBMI 3
as well as sites SBMO1, SBMO2 and SBMO3. Interestingly, concentrations of chromium, copper and
zinc were also above the limits of reporting whereas concentrations at remaining sites were
consistently less than their respective limit of reporting.
All hydrocarbons were at levels less than the limit of reporting at both nearshore and offshore sites.

SERN
TIMOR LESTE SOUTH COAST EIA
MARINE ENVIRONMENT SUAI TECHNICAL REPORT
Page 53 301012-01406-EN-R : Rev B
Particle size distribution in sediments at Suai followed expectations, with shallower inshore sites
dominated by sand, and deeper offshore sites dominated by fines. These fine fractions of sediment
are likely sourced from riverine systems, becoming resuspended by currents and wave energy in the
shallower areas, eventually settling in deeper areas offshore.
5.3 Benthic Habitat
The southern Timor-Leste coastline consists of a combination of sandy beaches and limestone rock
ledges that extend from the shoreline as intertidal reef flat areas that then slope down steeply towards
the seabed. In some places along the southern coastline, water depths of 200m can be found less
than 1km offshore (Australia – East Timor, Timor Sea, Dillon Shoal to East Timor chart produced by
RAN). The sandy beaches consist of medium to fine sand with silt. During heavy rains, sediments are
mobilised from the surrounding catchment and enter the ocean causing large sediment plumes. Aerial
photographs associated with the Suai area show turbid plumes moving from east to west along the
Suai coastline.
The benthic habitat within the study area is dominated by sediment. Given the high elevation and
seasonal rainfall in catchments draining to the south coast of East Timor, a natural high flux of fluvial
sediments occurs. In addition, deforestation in the region, which is evident to varying extents in aerial
photographs, is likely to have enhanced sediment supply. Hard substratum made up approximately
13% of the surveyed transects. The primary hard substrate along the south coast of Timor-Leste is
highly erodible coastal limestone, formed by acidification of shell material and ocean movement along
the coastline. The only hard substrate found in the Suai footprint area was weathered coastal
limestone.
Within the study area, brown turf algae was the primary biotic benthic community. The turf algae was
primarily associated with areas of hard substrate and generally had <25% coverage. There is a coral
reef located to the south west of the main Suai footprint region.
The fringing reef identified adjacent to the Suai study area is typical of the fringing reef systems found
in South East Asia (Burke et al., 2002). The reef generally consisted of a low diversity reef flat which
falls steeply into deep water. The greatest coral diversity was generally found within 5 to 10m of the
surface which then gradually declines below 10m as depth increases and light diminishes. A high
diversity of coral reefs exist in southern Timor-Leste with 301-500 species identified (Burke et al.,
2002). The band of rich coral growth is very narrow, being approximately 50m wide.
Seagrass communities have previously been identified in northern parts of Timor-Leste. Dense
seagrass meadows were found along the reef flats adjacent to the Suai footprint region. Meadows
identified within the study area were generally limited in extent and are not considered to provide a
significant resource for grazing by dugongs and turtles.

SERN
TIMOR LESTE SOUTH COAST EIA
MARINE ENVIRONMENT SUAI TECHNICAL REPORT
Page 54 301012-01406-EN-R : Rev B
5.4 Plankton
Plankton communities identified from samples collected in the study area were dominated by
calanoids, pteropods and larvaceans, which also had a 60% combined contribution to the difference
between sites. The planktonic communities showed potential groupings in the MDS, however, these
were not supported by the ANOSIM. It is most likely that the fish larvae are from the family Blennidae.
Similarly a low diversity and abundance of fish larvae and eggs were also collected in the plankton
trawls.
The diversity and abundance observed in this survey event are more likely a reflection of sampling
being undertaken during the day. Significantly more and larger zooplankton is caught at night and is
responsible for a large proportion of zooplankton variability, due to diel (diurnal) vertical migration
(Suthers et al., 2009). Migratory patterns can be variable and are known to differ with the sex and age
of species, habitat type and season (Van Gool & Ringelberg, 1998). In some seasons or years there
may be no difference between day and night zooplankton abundance, in other years there may be a
significant difference (Suthers & Rissik, 2009).
5.5 Infauna
The macroinvertebrate communities during the baseline sampling event were species rich in
polychaetes and crustaceans, each contributing to 29% of the community fauna. It is common for
either polychaetes or crustaceans to be the dominant benthic fauna in sandy sediments from the
Australasian region (Long & Poiner, 1994; Currie & Small, 2005). The most abundant family was
Tellinidae (bivalves), which also had a 27.2% contribution to the difference between sites. The benthic
community showed no significant differences across sites.

SERN
TIMOR LESTE SOUTH COAST EIA
MARINE ENVIRONMENT SUAI TECHNICAL REPORT
Page 55 301012-01406-EN-R : Rev B
6. CONCLUSION
The marine waters on the southern coast of Timor-Leste are generally well mixed with little physical
stratification. Some of the variation noted in physical and chemical parameters is most likely due to the
effects of freshwater associated with the numerous rivers that discharge along this section of
coastline.
Large volumes of sediment are transported into coastal areas by rivers during the rainy season.
Runoff from the surrounding catchment is the most likely source of nutients and contaminants into the
inshore marine environment.
Given the importance of rainfall, significant seasonal differences in water quality is likely between the
wet and dry seasons.
Infaunal communities were similar across all sites and composition was typical of sand dominated
sediments elsewhere in the region. Plankton species richness and abundance was low but largely
reflected a day time community composition with few differences noted between the grouped sites.
Fish larvae and eggs were also present in low numbers. Overall, the marine communities during the
baseline survey showed no significant different in faunal composition across sites.
The benthic habitat within the study area is predominantly sediment. Hard substratum made up 13%
of the surveyed transects. Within the study area, brown turf algae was the primary biotic benthic
community. The turf algae was primarily associated with areas of hard substrate and generally had
<25% coverage. The coral reef located on the western side of the Suai footprint region consisted of a
low diversity limestone reef flat which dropped steeply into deep water. A thin band of rich corals
occurs from the 5 to 8m depth contour which grades into an algae and invertebrate dominated habitat
from 8 to 12m. Beyond the 12m depth, the habitat is sand.

SERN
TIMOR LESTE SOUTH COAST EIA
MARINE ENVIRONMENT SUAI TECHNICAL REPORT
Page 56 301012-01406-EN-R : Rev B
7. REFERENCES
Adey, W. H. (1982). Algal turf scrubber, Google Patents.
ANZECC/ARMCANZ. (2000). Australian and New Zealand Guidelines for Fresh and Marine Water
Quality.
ANZECC/ARMCANZ. (2000). Water Quality and Monitoring Guidelines. National Water Quality Management Strategy.
Blomqvist, S. (1991). Quantitative sampling of soft bottom sediments: problems and solutions. Marine Ecology Progress Series, 72, pp.295-304.
Burke, L., L. Selig and M. Spalding. (2002). Reefs at Risk in Southeast Asia [Online]. http://www.wri.org/publication/reefs-risk-southeast-asia. Retrieved February 2008.
Carpenter S. R. Caraco N. F,Correll D. I, Howarth R. W., Sharpley A.N.,and Smith V. H. (1998) Nonpoint Pollution of Surface Waters with Phosphorus and Nitrogen.
Clarke, K.R. (2001). PRIMER v5, User Manual. PRIMER-E. UK: Plymouth. pp. 91.
Currie, D.R. & Small, K.J. (2005). Macrobenthic community responces to long-term environmental change in an east Australian sub-tropical estuary. Estuarine, Coastal and Shelf Science, 63, pp.315–31.
Elliot, J.M. & Drake, C.M. (1981). A comparative study of seven grabs used for sampling benthic macroinvertebrates in rivers. Freshwater Biology, 11, pp.99–120. ENI (2007). 3D Seismic Survey Environment Plan. ENI-0000-BN-0001 15 MAY 2007 ENI (2010a) Cova-1 Exploration Drilling Environmental Management Plan and Monitoring Program TL-HSE-PL-005. April 2010
ENI (2010b). GEOSTREAMER® TRIAL 2D SEISMIC SURVEY ENVIRONMENTAL MANAGEMENT PLAN, May 2010. FishBase (2006). FishBase. World Wide Web electronic publication. Froese, R. and D. auly. Eds., www.fishbase.org, version (10/2006).
Gallardo, V.A. (1965). Observations on the biting profiles of three 0.1m2 bottom-samplers. Ophelia, 2, pp.319–22. GoTL (Government of Timor-Leste). 2006. Agriculture, Forestry and Fisheries: Priorities and Proposed Sector Investment Program. Heyward, A Pinceratto, E and Smith, L (eds). (1997). Big Bank Shoals of the Timor Sea. An environmental resource atlas. eBook, Australian Institute of Marine Science, Townsville.,
SERN
TIMOR LESTE SOUTH COAST EIA
MARINE ENVIRONMENT SUAI TECHNICAL REPORT
Page 57 301012-01406-EN-R : Rev B
Johnson, G. V., Zhang, H. Cause and Effects of Soil Acidity
Keefer, G. (2000). Report on the Restoration of Meteorological Network – Timor Loro’Sae. Report II,
United Nations Transitional Administration in Timor- Leste, Dili.
Kirono,D. (2010). Climate change in Timor-Leste – a brief overview on future climate projections. Prepared for the Department of Climate Change and Energy Efficiency (DCCEE).
Last, PR & Stevens, JD (1994). Sharks and rays of Australia. CSIRO, Canberra, Australia.
Leis, J.M. & Carson-Ewart, B.M. (2004). The Larvae of the indo-pacific coastal fishes – An identification guide to marine fish larvae. 2nd Edition. Australia Museum, Sydney Australia.
Long, B.G. & Poiner, I.R. (1994a). Infaunal benthic community structure and function in the Gulf of Carpentaria, northern Australia. Australian Journal of Marine and Freshwater Research, 45, p.293–316.
Marsh, H (2006). Dugong dugon. In: IUCN 2006. 2006 IUCN Red List of Threatened Species.
MetOcean Engineers (2004). Preliminary Metocean Conditions for Prospective Pipeline Routes from
Sunrise to East Timor. WEL.
Mount, R., Bircher, P and Newton, N, (2007). National Intertidal/Subtidal Benthic Habitat Classification Scheme. School of Geography and Environmental Studies, University of Tasmania.
Neal Blossom, Copper in the Ocean Environment. Date accessed 23/02/2012; http://www.google.com.au/search?q=Copper+in+the+Ocean+Environment+Neal+Blossom1&sourceid=ie7&rls=com.microsoft:en-US&ie=utf8&oe=utf8&redir_esc=&ei=5uhFT8bELarPmAX1o9GJDg
Nittrouer, C.A, Austin, J.A, Field, M.E, Kravitz, J.H, Syvitski, J.P.M, Wiberg, P.L. (2007). From sediment transport to sequence stratigraphy.
Nunes, MN (2001) The Natural Resources of East Timor. A physical, geographical and ecological review. Sustainable Development and the Environment in East Timor: Proceedings of the Conference on Sustainable Development in East Timor, 2001, Anderson, R & Deutsch, C Eds. Timor Aid, Dili, Timor-Leste.
Pawlowicz, R., D. G. Wright, and F. J. Millero (2010). The effects of biogeochemical processeson oceanic conductivity/salinity/density relationships and the characterization of real seawater.
Price, J. F' and Weller, Robert A. (1986) Diurnal Cycling' Observations and Models of the Upper Ocean Response to Diurnal Heating, Cooling, and Wind Mixing. Journal of Geophysical Research, vol. 91, no. C7, Pages 8411-8427
Riddle, M.J. (1978). Bite profiles of some benthic grab samplers. Estuarine Coastal Shelf Science, 29, pp.285–92
SERN
TIMOR LESTE SOUTH COAST EIA
MARINE ENVIRONMENT SUAI TECHNICAL REPORT
Page 58 301012-01406-EN-R : Rev B
Riley J.P and Chester, R (1979). Introduction to Marine Chemistry. Academic Press Inc. London.
Ross, JP (ed.). (1998). Crocodiles. Status Survey and Conservation Action Plan [Online]. 2nd
Edition. IUCN/SSC Crocodile Specialist Group. IUCN, Gland, Switzerland and Cambridge, UK. (http://www.flmnh.ufl.edu/natsci/herpetology/act-plan/plan1998a.htm).
Sandlund, OT, Bryceson, I, de Carvalho, D, Rio, N, da Silva, J, Silva, MI (2001). Assessing Environmental Needs and Priorities in East Timor. Final Report. UNDP Dili and Norwegian Institute for Nature Research, Trondheim, Norway.
SKM (2001) Sunrise Gas Project Draft Environmental Impact Statement for Woodside Energy Ltd, Sinclair Knight Merz, Perth, Australia. Storr, GM, Smith, LA & Johnstone, RE (1986). Snakes of Western Australia. WA Museum, Perth, Australia.
Suthers, I.M & Rissik, D. (2009). Plankton – A guide to their ecology and monitoring for water quality.
CSIRO Publishing. Collingwood, Australia.
timorNET (2007). East Timor, an Information Service on East Timor. University of Coimbra,
Portugal.
Tomczak, M. & Godfrey S. J. (2003). Regional Oceanography: An Introduction
Van Gool, E. & Ringelberg, J., (1998). Light-induced migration behavior of Daphnia modified by food
and predator kairomones. Animal Behaviour, 56, pp. 741-747.
Wentworth, C. K. (1922). A scale of grade and class terms for clastic sediments. Journal of Geology
30: 377-392. Wilson, BR & Allen, GR (1987). Major components and distribution of marine fauna. In: Fauna of Australia, Vol 1A - General articles. Australian Government Publishing Service, Canberra Australia. Wyatt, ASJ (2004). Preliminary survey of the nearshore coastal marine environment of the southcoast of East Timor: a baseline for assessing the impacts of a developing nation. Bachelor of Engineering thesis, University of Western Australia (Nov 2004).