Tariff Rate Quotas – Free Trade or Non-Tariff Barriers?
58
I Tariff Rate Quotas ± Free Trade or Non-Tariff Barriers? The Case of Norwegian Seafood Exports to the EU Linda Norum Ur Thesis for the Degree Master of Philosophy in Economics UNIVERSITY OF OSLO May 2014
Transcript of Tariff Rate Quotas – Free Trade or Non-Tariff Barriers?

I
Tariff Rate Quotas
Free Trade or Non-Tariff Barriers?
The Case of Norwegian Seafood Exports to the EU
Linda Norum Ur
Thesis for the Degree Master of Philosophy in Economics
UNIVERSITY OF OSLO May 2014

II

III
Tariff Rate Quotas F ree T rade or Non
Tariff Barriers? The Case of Norwegian
Seafood Exports to the E U .

IV
Copyright Linda Norum Ur
2014
Tariff Rate Quotas- Free Trade or Non Tariff Barriers?
The case of Norwegian Seafood Exports to The EU.
Linda Norum Ur
http://www.duo.uio.no
Print: Reprosentralen, Universitetet i Oslo
V
Executive Summary
In an effort trying to lower tariffs and induce more trade, The Uruguay Round (1995) allowed
for the introduction of Tariff-rate quotas (TRQs) as a transitional tool aiming towards lower
tariffs in world trade (FAO 2000). A TRQ allows for a certain amount of a good to be
imported or exported with a reduced or zero tariff. When the TRQ is fully utilized, a higher
tariff is put on all exceeding goods being exported or imported. Compared to a situation with
tariffs, the TRQs saves the exporter or importer costs in terms of tariffs not paid to the holder
of the TRQ licenses. But does this mean that TRQs are the same as free trade?
This thesis examines the existence of costs related to the utilization of the TRQs in the
specific case of Norwegian seafood export to the EU. As Norway`s most important seafood
market, EU`s trade regulations are very important. Norway has zero tariff on the import of
most whitefish products (Norges fiskerihøgskole 2006). Salmon has low tariffs (2%), but for
pelagic fish and crustaceans/mollusks the tariffs are high. Mackerel (20% ) and herring (15%)
are examples of products with high tariffs. The TRQs, make it possible to import a certain
amount of seafood without paying tariffs. Norway can import seafood to the EU under 73
TRQs. Earlier papers has show that the existence of TRQs saved the Norwegian exporters
143 million NOK (Melchior 2007). But are the TRQs representing free trade or are they
rather a non - tariff barrier? For example; are there costs related to the documentation of
seafood origin? Or how large are the costs when having to rent storage in Denmark or
Sweden to be able to secure a TRQ fraction before the TRQ is full?
The case of Norwegian seafood export to the EU is examined through theory of the import
quota, analysis of the utilization data for the TRQs and a business survey, asking Norwegian
exporters directly what kind of costs they are experiencing utilizing the TRQs. Combining
the business survey with quantitative utilization data for the TRQs allowed for a more
comprehensive analysis of the effect of the TRQs on the Norwegian seafood exporter.
Overall the transaction costs related to the TRQs are modest, but varying across the different
seafood groups. As expected, the processed pelagic fish and crustaceans/mollusks are facing
large barriers due to small TRQs and high out-of quota tariffs.
Examining the utilization data in light of partial equilibrium import quota theory revealed that
42% of the TRQs are binding and that half of these bound TRQs are filled within 1/3 of the

VI
quota period. In a market where the majority of exporters are delivering the seafood DDP1
this means that the importer collects the quota rent and neither exporters nor consumers in the
EU countries are benefitting from the TRQs. When comparing the utilization data from
2012/2013 with data from 2005/2006, the percent of binding TRQs has gone down from 60%
to 42, but the speed at which the binding TRQs are filled is still the same. This indicates that
the granting of TRQs has been able to follow the developments in the market to a certain
extent, but some TRQs are still to small and represent a barrier to trade for the products
concerned.
The survey results revealed that the transaction costs were not of great concern. But it still
introduced challenges. 61% of the firms in the survey reported on uncertainty and risk being
a problem related to the utilization of the TRQs. Firms further reported on lack of ability to
plan ahead due to small TRQs and uncertainty related to facing a full TRQ at the border. Two
firms confirmed having lost market shares and chosen not to invest in the EU market due to
the TRQ system. These costs related to uncertainty and risk clearly represents a barrier to
trade, but could not be quantified by the exporters in my survey. A comprehensive
examination of these costs in light of uncertainty theory is outside the scope of this thesis, but
I encourage a trade-interested student to examine this further.
1 Seller is responsible for all duties, tariffs and transportation before delivering to buyer.

VII

VIII
Preface
I would like to thank my supervisor Arne Melchior at NUPI for his invaluable guidance in
writing this thesis. First, for letting me become a part of the exciting environment at NUPI,
and second for sharing his knowledge and experience in trade and seafood research. I will
always be grateful for the opportunity to work in such an excellent research environment.
I am most grateful to the Norwegian Seafood Council for providing me with data and facts
about the Norwegian seafood export market. Thank you also to the organizations and firms I
contacted for informational interviews and ta big thank you to the Norwegian exporters that
participated in the business survey. This thesis would not have existed without your
responses.
Lastly I would like to thank my family and friends for their patience and support through this
process. Especially I would like to thank my dad, sister and boyfriend for proofreading the
thesis at the final stage.
Any errors in this thesis are my responsibility alone.

IX

X
Table of Contents Executive Summary ............................................................................................................ V
Preface ............................................................................................................................. V I I I
1 Introduction ....................................................................................................................... 1
1.1 Outline of paper ................................................................................................................... 1
2 Background ....................................................................................................................... 3
2.1 The history and use of T RQs worldwide ........................................................................... 3
2.2 Why are import quotas harmful for trade? ...................................................................... 3
2.3 Norwegian seafood export................................................................................................... 4
2.4 E U and seafood trade .......................................................................................................... 6
2.5 The regulation of seafood trade between Norway and the E U ........................................ 7
2.6 How to take advantage of the E U`s T RQs ......................................................................... 9
2.7 Conclusions from part 2: Background ............................................................................ 10
3 The economic impact of T R Qs ....................................................................................... 11
3.1 Theory of the import quota ............................................................................................... 11
3.2 Modeling effects of an import quota ................................................................................ 11
3.3 The tariff equivalence ........................................................................................................ 12
3.4 Administration of the quota and quota rent administration ......................................... 13
3.5 The import quota in an economy with imperfect competition ...................................... 15
3.6 The Tariff Rate Quota and quota rent allocation ........................................................... 17
3.7 Conclusions from part 3: Theory ..................................................................................... 19
4 A quantitative analysis of utilization data ................................................................... 20
4.1 Utilization of the 3 different T R Q groups ....................................................................... 22
4.2 Speed and quota rent ......................................................................................................... 26
4.3 A re transaction costs related to tariff preference? ......................................................... 29
4.4 Small, unfilled T R Qs ......................................................................................................... 30
4.5 Conclusions from part 4: A quantitative analysis of utilization data ........................... 31
5 Business Survey ............................................................................................................... 33
5.1 C reating the survey ........................................................................................................... 34
5.2 Administrating the survey ................................................................................................ 35
5.3 Survey questions and results ............................................................................................ 37
5.4 Conclusions from part 5: Business survey....................................................................... 42
6 Conclusions .......................................................................................................................... 43
7 References ............................................................................................................................ 45

XI
8 Appendix .............................................................................................................................. 46
8.1 Business Survey questions (In Norwegian)...................................................................... 46

1
1 Introduction -tariff barriers, food safety and
Non-tariff barriers (NTBs) and how they affect trade is a highly
relevant issue, both in the light of the ongoing EEA cohesion grants negotiations between
Norway (together with the EEA countries) and the EU, but also as a growing phenomenon
worth studying in itself.
NTBs are all barriers, which inhibit trade in other ways than through tariffs. Under the
broadest definition NTBs comprise all measures other than tariffs that restricts or otherwise
distort trade flows (OECD).Examples of NTBs are import quotas, special licenses, standards
for the quality of goods etc. After the WTOs decision to reduce the use of tariffs, the use of
NTBs has risen. Disguised as rules and regulations these barriers work in the same way as
tariffs; reducing trade flows and harming the global trade.
n
the ways which (Stern 1997)
A particular form of trade barrier is the so-called tariff rate quota (TRQ), which imply that
imports at reduced tariffs are allowed within a specified quantity. While TRQs aim to reduce
trade costs by lowering tariff, they may create new costs related to their administration and
use. For example, some TRQs are auctioned so instead of a tariff, the traders have to pay a
quota price. This paper will examine the rent resource cost/seeking behavior related to the use
of such quotas.
1.1 Outline of paper
This paper examines the TRQs for Norwegian seafood export to the EU in particular and
examine whether these are a barrier to trade, in the form of costs for the Norwegian
exporters. Earlier papers have explored the effect of new WTO regulations (Norges
fiskerihøgskole 2006) and the expansion of the EU (Melchior 2002) on Norwegian seafood
exports by examining the tariff equivalence and utilization of import quotas. In my thesis I
will conduct a survey asking the exporters directly what their costs are related to the
utilization of these import quotas. It is important to remember that the TRQs are saving

2
Norwegian exporters millions of NOK in tariffs. In fact Melchior (2007) finds that
Norwegian exporters saved 143 million NOK (6% of the export value) in tariffs in 2005. A
number that has probably increased with 50 million NOK following the increased number of
TRQs. Compared to a situation with tariffs the TRQs offer a better alternative. But the
situation is not all black and white and this paper seeks to find out if there exist hidden costs
utilizing this TRQ system.
First, the paper will provide background information by briefly presenting the history and use
of TRQs worldwide and 7 reasons for why import quotas can be harmful for trade.
Furthermore Norway as a seafood exporter to the EU is presented, before examining the EU
tariff and TRQ system and how seafood trade between Norway and the EU is regulated. The
second part of the thesis will concentrate on economic theory of the import quota,
administration and rent sharing. The third part is a quantitative study that will address how
TRQ utilization data can give us an indication of whether a TRQ is a barrier or not. The
fourth part of the thesis will focus on a qualitative survey preformed on Norwegian seafood
exporters. The survey aims to reveal if there exist rent seeking /transaction costs related the
use of the TRQs and if so, how large they are. Examples of transaction costs or rent seeking
costs can be renting of storage in a EU country to ensure delivery within the TRQ or costs
related to the documentation of origin when utilizing compensation TRQs. Other costs can be
no one is guaranteed a quota. Finally, the conclusion part discusses the TRQs within the
context of the theory, the utilization data and the survey.

3
2 Background
2.1 The history and use of T R Qs worldwide
The Uruguay Round (1995) induced the creation of over 13000 new TRQs as the GATT
(General Agreement on Tariffs and Trade) tried to lower tariffs and increase trade. In an
effort trying to exchange complex tariff systems and quantity restrictions (QR) with an all
tariff-based system WTO allowed for the introduction of Tariff-rate quotas in a period of
transition (FAO, 2000). In some cases the new TRQs contributed to a higher level of trade,
but in others they have contributed to discrimination and put restrictions on trade (Skully
2001). TRQs are in many cases used by governments to keep competitive foreign firms out of
their markets and protect their less competitive domestic firms. One example is the US sugar
import quota. The US has TRQs for sugar and these are allocated by earlier trade flows
(Skully 2001). The allocation of US sugar TRQs is historically based on sugar trade between
1975 and 1980. This results in a situation where no new sugar producers are able to enter the
US sugar market. This also means that the ones already exporting to the US cannot expand
their exports to the US; the TRQs are the same every year (Skully 2001). In the theory
chapter we will go into how an administration like this is discriminating and creates rent
seeking behavior.
Another country having a fair amount of TRQs is Norway. As the Uruguay round forced
countries to reduce tariffs, Norway now protects its agricultural sector by enforcing TRQs. 55
of the 65 TRQs Norway has on agricultural products are allocated by auction. When the
TRQs are auctioned the sellers of the quota licenses, often the authorities in the importing
country, collect the rents. (Skully 2001)We will get back to the quota rent under the theory
chapter. A third way of allocating a TRQ is by first come first serve. This is the way the EU`s
TRQs for seafood are allocated and we will examine how this allocation can lead to hidden
costs for the Norwegian exporters.
2.2 Why are import quotas harmful for trade?
NTBs can harm international trade.
4
1. Reduction in quantity exported the most direct and obvious way an import quota can
harm international trade
2. Increase in price of goods exported- as an effect of a reduction in quantity.
3. A change in elasticity of demand can be an effect of reducing quantity and increasing
price. Often quotas can have the effect of reducing this elasticity so that the consumers will
be less responsive to changes in prices at a later stage.
4. The variability of an import quota. - As opposed to a tariff, the effect of a quota will vary
over time as the import of the same amount every period, the effect will vary as it is
independent from exchange rates, supply and demand etc. The fact that import quotas often
in the same way tariffs can.
5. The uncertainty in implementation of import quotas can also be a barrier for exporters.
Risk can arise when there is uncertainty related to who can take advantage of the quota in
question. A quota, allocated on a first come first serve basis can create involve risk because
there is uncertainty related to when the quota will be filled.
6. Welfare cost. As the import quotas are distorting trade flows this causes welfare costs. By
using the cost and quantity measures of the import quota one can identify the welfare cost by
estimating the deadweight loss in a partial equilibrium.
7. Resource cost. Welfare costs are also increased due to administration related to the import
quota. These are direct administration costs in terms of actually enforcing the import quota
and costs related to rent seeking behavior; resources used by exporters in order to obtain the
quota rent.
2.3 Norwegian seafood export
Today the Norwegian seafood is known all over the world and Norway delivers fish to
consumers in more than 130 countries. Numbers show that in 2012 Norway exported seafood
at a value of 61 billion NOK, a 17% increase since 2011. This large increase was caused by a

5
rising demand for and production of Norwegian salmon2. Compared to the rest of the world
this makes Norway the second largest exporter of fish. Being Norway`s third most important
export article, after oil and gas, it is needless to say that trade policies for this sector are
crucial to the Norwegian authorities and to the industry.
Figure 1: Seafood export in 2012 (Ministry of Trade and Fisheries, 20133)
goes to the EU. Additionally, Norway is
the most important supplier of seafood to the European market. By country, Russia is the
most important importer with a value of 5,9 billion NOK in 2012 followed by France and
Poland whit values at respectively 4,8 and 3,8 billion NOK. Markets in Asia are growing
rapidly, but the EU continues to be the most important market for Norway (Ministry of Trade
and Fisheries, 2013). It is therefore interesting to look at the TRQ system for Norwegian
seafood export to the EU and how it is affecting Norwegian exporters.
2 http://www.seafood.no/Nyheter-og-media/Nyhetsarkiv/Pressemeldinger/Kraftig-økning-i-sjømateksporten
3 Fact sheet on Norwegian seafood production and consumption published by The Ministry of Trade and
Fisheries found at http://www.regjeringen.no/nb/dep/nfd/dok/veiledninger_brosjyrer/2013/fakta-om-fiskeri-og-
havbruk-2013.html?id=733532
02000400060008000100001200014000160001800020000
1000 USD

6
Figure 2: Norwegian seafood export (numbers provided by Norwegian Seafood Council)
2.4 E U and seafood trade
EUs Tariffs on seafood are bound in the WTO. The bound MFN - tariffs (Most Favored
Nations) represents the maximum level of tariffs EU can put on seafood. Still there is room
for setting lower or zero tariffs. As the largest seafood importer in the world the EU utilizes a
range of different preferential tariffs, tariff quotas and zero tariff periods when importing
seafood. This is both to make sure their citizens get the seafood they demand, while at the
same time also protecting their own suppliers and producers. The different tariff reductions
on seafood import to the EU are:
Most favored Country tariffs (MFN)
WTO bound TRQs (e.g. cod, herring and clip fish)
WTO bound zero tariff periods (e.g. herring and mackerel)
Autonomous (for all third countries) tariff reductions (e.g. cod and shrimp)
Autonomous TRQs with reduced or zero tariff (e.g. herring)
Additionally there are tariff reductions for some groups. The GSP, EBA, ACP and OCT4
countries pay zero tariffs on seafood exported to the EU. Additionally EU has Free Trade
4 GSP= EUs tariff preferences for developing countries, EBA=Everything But Arms, EUs tariff preferences for
the least developed countries (zero tariff on seafood imports), ACP= EUs tariff preferences for African,
0500 0001 000 0001 500 0002 000 0002 500 0003 000 0003 500 0004 000 0004 500 000
1994
1996
1998
2000
2002
2004
2006
2008
2010
2012
Export rest of theworld
Export EU

7
Agreements (FTAs) with countries like Iceland and Chile giving them tariff reductions and
TRQs for some seafood products. Norway has also been given tariff preferences and TRQs
for different seafood products.(Norges fiskerihøgskole 2006). The regulation of seafood trade
between the EU and Norway is quite complex and will be explained in the following.
2.5 The regulation of seafood trade between Norway
and the E U
1973. Through protocol 9 in the EEA agreement Norway has zero tariff on the import of most
whitefish products (Norges fiskerihøgskole 2006). For salmon, EU MFN tariffs are also
relatively low, foe example 2% for fresh or frozen whole salmon. For pelagic fish and
crustaceans/mollusks, however, the EU has relatively high MFN tariffs and Norway has
limited tariff reductions under the EEA agreement. For these products, TRQs play a
particularly important role. Norway can export under 73 TRQs. Nine of these are GATT
TRQs open for all WTO members, 25 are autonomous TRQs open for all countries and 39
are compensation TRQs open only for Norwegian seafood. These have been negotiated in
relation to the expansion of the EU in 1986, 1995, 2004, 2007 and 2009. The sizes of these
quotas were based on the already existing trade flows between Norway and the respective EU
country before they were included in the EU. The main goal of creating these TRQs was to
allow the continuation of the already ongoing trade5. The first compensation TRQs were
given to Norway in relation to the inclusion of Spain and Portugal in 1986. Portugal was a
member of EFTA at the time and Spain had a free trade agreement with EFTA. The
negotiations granted Norway some tariff reductions and TRQs on important export products
to Portugal and Spain; clip fish, stock fish and other products of cod. Though TRQs
transferred some of the tariff the EU would have been able to collect without the TRQ to the
Norwegian exporters, the tariff of about 13 % was still introduced as an out-of- quota tariff,
Caribbean and Pacific countries (zero tariff on seafood imports), OCT=Overseas Countries and Territories (zero
tariff on seafood imports)
5 http://www.seafood.no/Markedsinformasjon/Markedsadgang/Tollkvoter-til-EU/Om-tollkvoter

8
making it hard for Norwegian exporters to export after the quota is filled. We will take a
closer look at the utilization of these TRQs and how they affect trade later.
The second group of TRQs came with the inclusion of Sweden, Austria and Finland in
1995(Sissener 2003) These TRQs included many types of fish, among them salmon,
mackerel and herring. The TRQs introduced for Norwegian seafood in 1995 are for the most
part the same every year and does not leave the exporters the opportunity to expand their
engagement in the European market. A study done on the utilization of these TRQs in 2004
came to the conclusion that over half of the TRQs were fully utilized before the quota period
was over, which indicates that the TRQ is binding and that the export from Norway is limited
due to the TRQs (Sissener 2003). It was also found that some of the TRQs on produced
goods were hardly used at all. This could mean that the Norwegian produced products are not
competitive in this area or that the demand for the particular good is not high enough.
In 2004 Latvia, Lithuania, Estonia, Poland, Czech Republic, Slovenia, Slovakia, Hungary,
Cyprus and Malta were confirmed as EU members. The result of these negotiations was
TRQs for both cod and herring. Bulgaria and Romania followed as EU members in 2007
giving Norway new and expanded TRQs for herring, mackerel, shrimp, capelin and catfish.
The latest to join the EU was Croatia in 2013.
The negotiations related to the inclusion of Croatia and compensation quotas started in
January this year and are still ongoing. Six of the compensation TRQs expired in April 2014,
meaning they will have to be renegotiated, giving the exporters yet another risk to put into
their calculations. The last time these TRQs were negotiated it took 1,5 years before an
agreement was reached and the TRQs were implemented. The compensation TRQ of 1400
tons processed herring given for the inclusion of Croatia will not be implemented until the
negotiations are finalized. An alternative is to have it implemented on a temporary basis, but
this all depends on the outcome of the negotiations. According to the seafood council the
ongoing negotiations are mainly negotiations about the 6 expiring TRQs, but in theory all
compensation TRQs are open to adjustments. Of course the Norwegian fishing industry
wants Norwegian authorities to push for lower tariffs and larger TRQs. The challenge related
to the negotiations from 1994 and onward is that they are running alongside and linked to the
-
off EU countries as well as a fee for getting access to the EU market, the linking can both be
a pro and a con for a good result seen from the Norwegian exporters view.

9
2.6 How to take advantage of the E U`s T R Qs
The compensation TRQs are reserved only for Norwegian Fish, so to be able to export under
this TRQ you have to document that the fish is of Norwegian origin. Yet, another way to
export seafood to the EU is through the autonomous TRQs introduced by the EU to ensure
raw material for the production of seafood inside the EU. These autonomous TRQs are not
origin conditioned and any country can take advantage of them. GATT TRQs, introduced due
to WTO regulations, can be used by any WTO country. The Norwegian Seafood Council
encourages the utilization of the GATT and autonomous TRQs before the use of the
compensation TRQs to get as much Norwegian seafood into the EU as possible6.
All of
of fish being imported are imported at a zero or very low tariff and when the TRQ is full, an
out -of -quota tariff has to be paid for the amount of fish exceeding the TRQ amount. When
getting to the border a firm can import within these TRQs if the TRQ in question is not filled.
Norwegian Seafood Council announces the status of each TRQ every day. But the license to
import is not given to the exporters until the goods are physically at the border. This leads to
a race for the exporters to get their share of the TRQ before the quota is full. This way of
administrating the TRQ can lead to hidden costs for the exporters, for example by forcing
them to move seasons or pay for storage in an EU country to be able to take advantage of the
quota early.
The compensations TRQs on Norwegian seafood are set based on a historical level and are
not increased yearly or adjusted to the market. In cases when the quota actually is smaller
than the import it indicates that either the market has decreased for that particular product or
the Norwegian producers are no longer competitive. After the inclusion of many new east
European countries into the EU, Norwegian exporters have gotten more competition from
producers located within the EU7. These can be explanations of why some TRQs are not
being fully utilized. Another important issue is that some exporters might be competitive
within the quota, but if the quota fills up, they are not competitive within the out-of-quota-
6 http://www.seafood.no/Markedsinformasjon/Markedsadgang/Tollkvoter-til-EU/Om-tollkvoter
7 Anonymous interview 1

10
tariff and so they end up not taking the risk to invest in more production. For some of the
TRQs; processed herring and mackerel, the out-of quota-tariffs are as high as 15 and 20 per
cent respectively.
2.7 Conclusions from part 2: Background
Norway has 73 TRQs for importing seafood to the EU and that many of these were
established with the expansion of the EU to compensate for earlier free trade with different
EU states. Some of these TRQs are large compared to the actual import from Norway,
meaning they represent millions of NOK saved in tariffs for Norwegian exporters (Melchior,
2007). Melchior (2007) estimated that the TRQs saved Norwegian exporters of about 143
million NOK in 2005. But TRQs are not the same as free trade. This paper examines the
possible cost for the Norwegian exporter utilizing these TRQs. These costs can be related to
many things; the TRQ being too small, cost related to documentation of origin, how the
TRQs are administered etc. These questions will be addressed in the third and fourth part of
the paper. Now, the theory of import quotas will be presented.

11
3 The economic impact of T R Qs
3.1 Theory of the import quota
An import quota is a regulation on how much can be imported of a specific product. The
import quota is restrictive in the sense that it restricts the import amount in absolute terms;
when the quota is filled, the import stops. This means that it is only effective if it is binding.
It is binding if it allows a smaller amount than what is usually imported. If the quota is larger
than the usual trade flow, not binding, then trade continues as normal and the import quota
has no effect on trade. The TRQ also has a restriction on the amount imported, but it is not
absolute as one can still import after the TRQ is full, but at a higher tariff level. If the out-of-
quota tariff is very high, so high that it restricts imports completely after the quota is filled,
then it has the same effect as an import quota.
This chapter will illustrate the impact of import quota and later TRQs in a partial equilibrium
framework, showing how it works in an economy with perfect competition and in a
monopolist economy. Further the welfare costs and how the quota rent is allocated with
different quota administrations is demonstrated before briefly introducing some new rent
seeking theories. These theories will be helpful in understanding the utilization data and the
survey results.
3.2 Modeling effects of an import quota
On the following pages, the effects of an import quota is modeled, presenting its tariff
equivalent, as it has the same effect as a tariff under the condition of perfect competition.
The purpose is to examine how an import quota affects trade and the welfare gain. Bhagwati
(1965) argues that a quota, limiting the amount of goods being imported, will work in the
same way as a tariff under the assumption of perfect competition. This implies that for each
quota there exists a tariff equivalent.

12
3.3 The tar iff equivalence
Figure 3 illustrates how an import quota under the assumption of perfect competition can
have the same effect as a tariff. In this and in all models in this thesis world prices are
assumed as given. A world price p* that lies below the equilibrium between domestic supply
and demand is assumed. C0 and Y0 represents quantity consumed and quantity produced
respectively. The amount of import into this market then becomes Co-Y0=M0. The same
relationship is shown in figure 3b with M0 on the import demand curve M= D-S. The same
starting point can be used to examine the introduction of a tariff.
Figure 3: The effect of an import quota (Feenstra 2004)
When the import quota Q is introduced, import is limited to m1. This restriction of import
causes the price to shift up. When the price effect from the import quota Q in figure 3b is
transferred to figure 3a, the new price p1 gives us the domestic supply Y1 and the demand C1.
The effect of this quota is the same as if the government decided to introduce a tariff. With
the introduction of a tariff equal to the difference between p1 and p* it results in exactly the
same effect with respect to demand and supply. Consequently, for a world economy with
perfect competition it is possible to argue that every import quota has a tariff equivalent. The
theory makes clear that an import quota will reduce supply and increase prices and in that
way be a barrier to trade. In part 3, this theory will assist in examining the utilization of the
13
TRQs for seafood export to the EU. If a TRQ is filled before the quota period is over and the
export stops when it is filled, then the TRQ is binding and most likely prohibiting further
trade that would have taken place if the TRQ had not existed.
3.4 Administration of the quota and quota rent
administration
The above demonstrated how a TRQ in combination with a prohibitive tariff can work in the
same way as a tariff. There is however differences in the way that firms adapt to quotas as
opposed to tariffs. To be able to say something about the difference between the import quota
and a tariff, it is necessary to look at the welfare change from having an import quota to that
of having a tariff (Feenstra 2004).
Figure 3 illustrates that the welfare change from introducing a quota is the consumer surplus
loss: (a+b+c+d), and the producer surplus gain +(a). So the total change in welfare is
(b+c+d). In the case with a tariff, the area c would be collected as profits for the government
and end up with (b+d) as the total change in welfare. But in the case with a quota, c can end
up different places depending on how the quota is administered.
First, consider administration of the import quota by auction of the licenses. If it is assumed
that the auction is well organized and effective, the surplus c and the rent, will be collected by
the auctioneer. Assuming the auctioneer is the government of the importing country, the
welfare change will be: -(a+b+c+d) consumer surplus loss + (a) producer surplus gain + (c)
auction revenue = -(b+d). The result is equal to the result with a tariff.
Second, consider distribution of the import quotas can be given to the government of the
restrictions (VER) as the government of the exporting country are the one handing out the
import licenses to the exporting firms. When this plays out in terms of the domestic welfare
change, c now is collected by the foreign firm so that the result becomes: - (a+b+c+d)
consumer welfare loss + (a) domestic producer surplus = -(b+c+d). The total welfare loss
domestically is larger than with the tariff.
Third, consider a situation where the quota licenses are given to home producers. In this case,
the home producers are able to import goods at price p* and then sell again at the domestic

14
market at price p1. The home producers can collect the quota rent as profits, leading to the
welfare change: -(a+b+c+d) consumer surplus loss + (a+c) producer surplus gain = -(b+d).
The result where the quota licenses are given to the home producers provides the same
welfare loss as when we introduced a tariff. This result however rests on the assumption that
the home firms do not take on activities such as rent seeing, meaning they will act in an
t seeing activities can be as costly as the rent itself.
This implies that profit equals zero and the whole area c is lost. This would lead to a change
in welfare equal to: - (a+b+c+d) consumer surplus loss + (a) producer surplus loss= -(a+b+c)
which is larger than for the case with the tariff (Feenstra 2004).
As we have seen through the partial equilibrium theory of import quotas; administration is
very important. Deardorff and Stearn argue that the best way of administrating an import
quota is by auction. Auction of import licenses in open competitive bidding and also allowing
resale of these the price of the quotas will be equal to the anticipated difference between the
price of the good in the domestic market and the price of the good on the world market. In
other words there will be no possibility of rent seeking behavior and the government can
collect the quota price as revenue (Stern 1997)
The OECD report on non-tariff barriers from 1997 also states that auction is the better way of
prefer, but which governments only occasionally use, involves the auctioning of import
licenses this report the argument of competing the price of the quota
down to the difference between domestic price and the world market price is repeated.
The exact same result is found in Skully (2001) where it is also argued that the historically
based allocation of licenses is the most discriminatory method of administration. Additionally
Skully shows that the first come first serve basis, the EU TRQs are allocated by, can give us
somewhat of a biased trade in the way that the goods will most likely be cheaper at start of
the TRQ period. (Skully 2001) This argument being an alternative to the assumed argument
in the partial equilibrium theory, that all trade happens instantaneously, so that there exists a
quota rent to be collected.
15
3.5 The import quota in an economy with imperfect
competition
Next, a market with imperfect competition is evaluated. Bhagwati (2005) has examined a
monopolistic domestic market. With a tariff, the monopolist can choose to sell his product at
the price p+1. If the monopolist increases the price more than that, the consumers will buy
the imported good to the price p+1. However, with an import quota the monopolist will be
protected by the quota, giving the monopolist the opportunity to set a higher price than p+1.
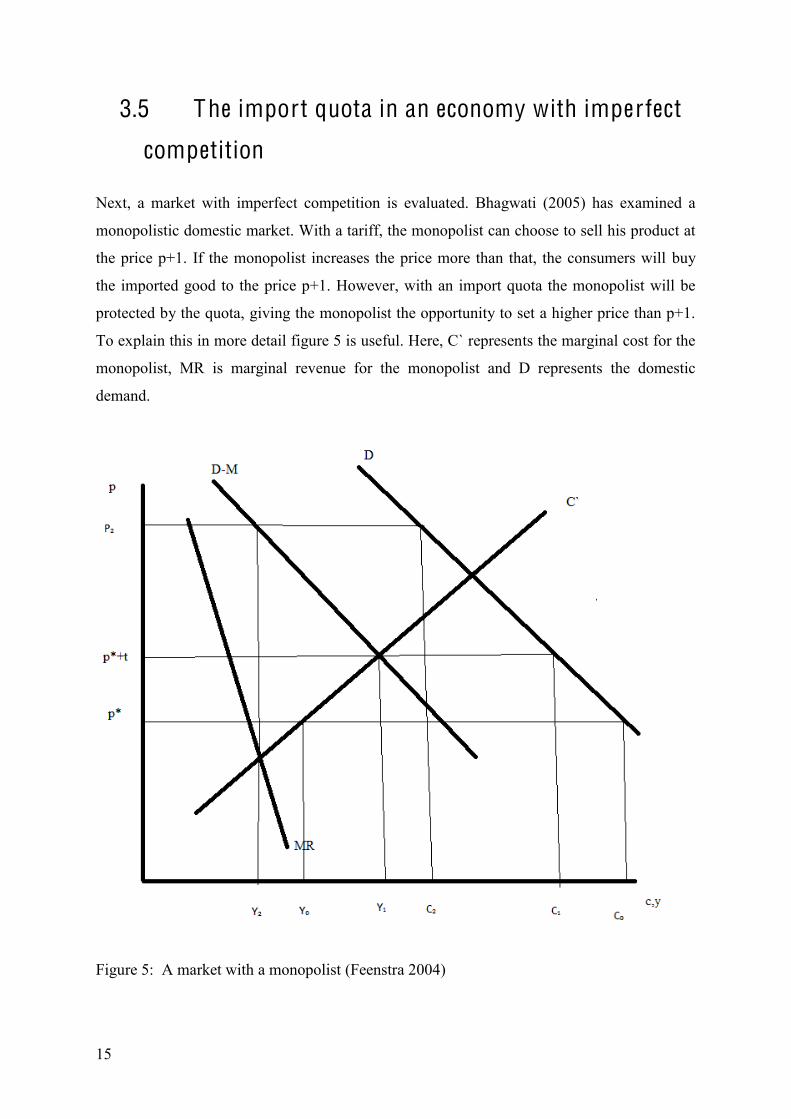
To explain this in more detail figure 5 is useful. Here, C` represents the marginal cost for the
monopolist, MR is marginal revenue for the monopolist and D represents the domestic
demand.
Figure 5: A market with a monopolist (Feenstra 2004)
16
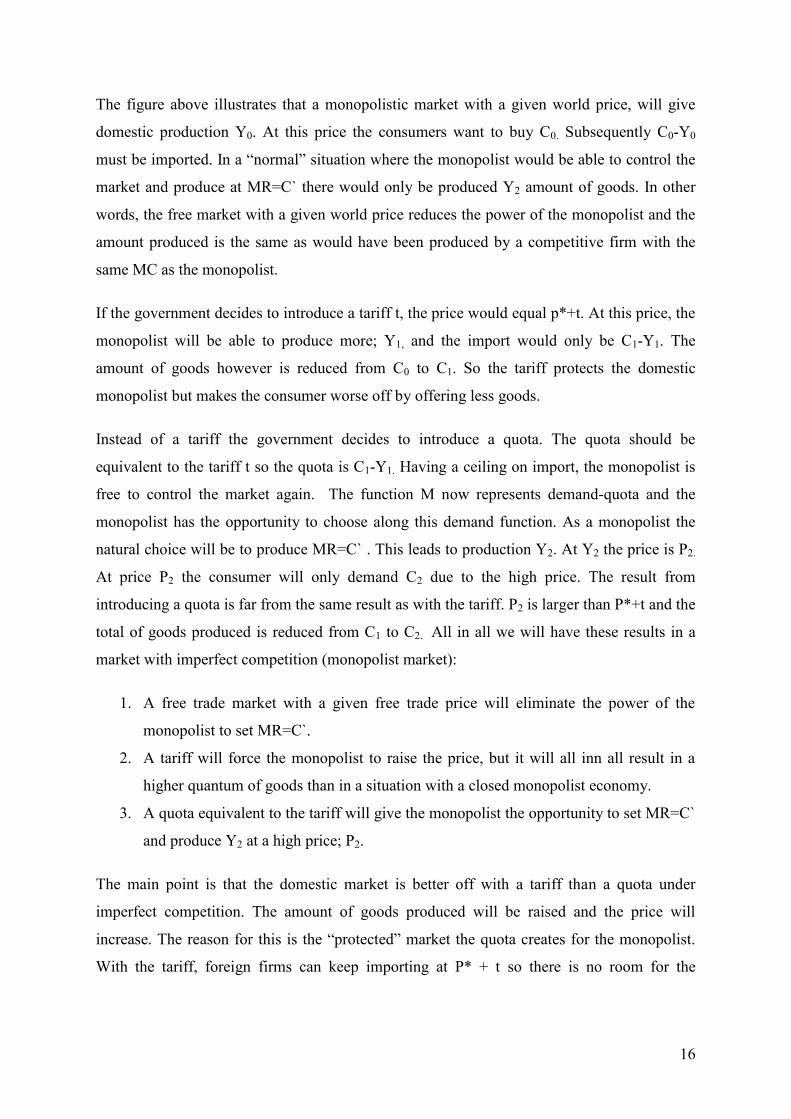
The figure above illustrates that a monopolistic market with a given world price, will give
domestic production Y0. At this price the consumers want to buy C0. Subsequently C0-Y0
market and produce at MR=C` there would only be produced Y2 amount of goods. In other
words, the free market with a given world price reduces the power of the monopolist and the
amount produced is the same as would have been produced by a competitive firm with the
same MC as the monopolist.
If the government decides to introduce a tariff t, the price would equal p*+t. At this price, the
monopolist will be able to produce more; Y1, and the import would only be C1-Y1. The
amount of goods however is reduced from C0 to C1. So the tariff protects the domestic
monopolist but makes the consumer worse off by offering less goods.
Instead of a tariff the government decides to introduce a quota. The quota should be
equivalent to the tariff t so the quota is C1-Y1. Having a ceiling on import, the monopolist is
free to control the market again. The function M now represents demand-quota and the
monopolist has the opportunity to choose along this demand function. As a monopolist the
natural choice will be to produce MR=C` . This leads to production Y2. At Y2 the price is P2.
At price P2 the consumer will only demand C2 due to the high price. The result from
introducing a quota is far from the same result as with the tariff. P2 is larger than P*+t and the
total of goods produced is reduced from C1 to C2. All in all we will have these results in a
market with imperfect competition (monopolist market):
1. A free trade market with a given free trade price will eliminate the power of the
monopolist to set MR=C`.
2. A tariff will force the monopolist to raise the price, but it will all inn all result in a
higher quantum of goods than in a situation with a closed monopolist economy.
3. A quota equivalent to the tariff will give the monopolist the opportunity to set MR=C`
and produce Y2 at a high price; P2.
The main point is that the domestic market is better off with a tariff than a quota under
imperfect competition. The amount of goods produced will be raised and the price will
With the tariff, foreign firms can keep importing at P* + t so there is no room for the

17
monopolist to raise the price by producing less goods, but with the quota that is possible.
(Feenstra 2004)
Both in a competitive and not competitive marked the administration of the quota effects the
welfare gain and allocation of the quota rent. The TRQs for seafood import to the EU are
administered on a first come first serve basis. In part 4, a survey will examine what kind of
rent seeking behavior exists among exporters in this market.
3.6 The Tariff Rate Quota and quota rent allocation
So far the cases addressed have been with finite import quotas, meaning that when the quota
is filled, there is no possibility to import more. The tariff rate quota (TRQ) can be
implemented in many different ways. Consider a TRQ where the tariff is zero on all goods
imported within the quota, and then, when the quota is full, there will be a tariff t to pay on
all goods exceeding the quota quantum.
As shown in figure 6 a TRQ will have somewhat the same effect on the domestic market as a
regular import quota. Going back to the assumption of perfect competition the supply curve
shifts up to the supply + tariff curve when the TRQ is filled, If the trade happens
immediately, the result will most likely be that the price for the consumer is p + t. In the same
way as with the regular import quota there will be quota rent to collect. Comparing figure 4b
with figure 6 the import quota results in a higher price p1 then what is the case for the TRQ:
p+t. In terms of total welfare surplus a TRQ is better than an import quota.

18
Figure 6: How a TRQ works (Melchior 2007)
In the situation where the TRQ is lower than Qt and we get a price p+t we also get an amount
saved t*(Qt-TRQ), which is the quantum sold without a tariff. If the sale of the particular
good is sold gradually so that the quota can gradually fill up and the importer can sell the first
quantum to consumers for a price without the tariff, then this saved amount may potentially
benefit the consumers. But if all the goods are sold instantaneously, this difference between p
the import quota (Melchior 2007).
In part 3 of this thesis the speed at which the TRQs are filled will be examined. The theory on
speed will be helpful in determining what actors can collect the quota.
So far the theory suggests that whoever attains a TRQ license also collects the rent. But other
factors such as imperfect competition and who has the right to import can also determine the
allocation of the quota rents in the end (Boughner et.al, 2000.) For the case where licenses are
given to importing or exporting firms one runs the risk of giving the license to high cost or

19
inefficient firms. If we on the other hand have a situation where licenses are not given to
firms, then the rent seeking behavior and bargaining power determine the allocation of the
rent. For example in a case where exporting licenses are allocated and we assume importing
firms are fully competitive. The exporting firms will have bargaining power and get all the
rents. In this case a welfare gain will still be attainable if the exporting firms are low cost
firms. But if the licenses are given to high cost firms the rent will be lost. Allowing resale of
the licenses can solve this inefficiency. (Boughner et.al, 2000.) In a situation where both
exporters and importers are given licenses, the rent most likely will not be shared equally
unless the bargaining powers are also equal. In Hornig, Boisvert and Blandford (1990) it is
show that exporters were able to extract more of the rent than the importers in the US import
market for cheese.
The theory of bargaining power and market structure in rent sharing will be helpful in
determining what actors can collect the quota rent when examining the utilization data and
the business survey results in part 3 and 4.
3.7 Conclusions from part 3: Theory
The following can be extracted from the theory chapter:
A TRQ only effects trade if it is binding
The TRQ is binding if the TRQ is filled
A TRQ works in the same way as an import quota if the TRQ is binding and the out-
of quota tariff is too high
The administration of the TRQ is important. Auction is the best way to administer a
TRQ and resale of licenses limits the deadweight loss.
The speed at which the TRQs are being filled, the market structure and the bargaining
power of the importers and exporters decides who can collect the quota rent.

20
4 A quantitative analysis of utilization data This part analyzes the utilization data of the TRQ for seafood import to the EU. First,
illustrations of the different utilization scenarios are presented.
F igure a
F igure b
Figure a illustrates a TRQ that does not have any effect on the trade flow because the demand
for imported goods are lower than the TRQ amount. Figure b illustrates the situation where
the TRQ is binding as the imported amount is exactly the same as the TRQ amount.
F igure c
F igure d
Figure c illustrates a TRQ that is binding, but not prohibitive. The TRQ for Norwegian
salmon works like this as the out-of-quota tariff is only 2% and there is still export going on

21
after the TRQ is filled. Figure d illustrates a TRQ with a very high out-of quota tariff, making
it hard to be competitive after the TRQ is filled.
To say with certainty that the TRQ is binding and prohibitive we need data for total export
within each TRQ. Using data for the total export within each TRQ group comparing it with
the size of the TRQs it would have been possible to examine if the export stopped when the
TRQ was filled. Unfortunately this data was not possible to retrieve. I will therefore have to
make the assumption that a full TRQ is a binding, but maybe not prohibiting TRQ. If the out-
of-quota tariff is high I will assume it is prohibitive, but if it is low I will assume it is not.
This chapter will examine the utilization data for compensation TRQs, GATT TRQs and
autonomous TRQs for seafood import to the EU. Further it examines the speed at which the
TRQs are being filled. If the TRQs are filled fast, and most of the year/TRQ period goes by
with exporters paying the out-of-quota tariff, then the importer or exporter will be the ones to
collect the quota rent, as the price will most likely be high all year. If, on the other hand,
vacant TRQs are available most of the year, it is likely that the price impact is smaller The
speed analysis will also be compared with the utilization speed for the TRQs in 2005/2006
examined in Melchior (2007). Analyzing the development in TRQ fill rate might give an
indication of how well the TRQ system has kept up with the market and if there exist a cost
related to the lack of variability in TRQs. Lastly this chapter will use the utilization data to
examine if there is a relationship between the tariff preference of exporting within a TRQ and
the utilization of this TRQ. If there is a positive relationship this indicates that there exists
large transaction costs utilizing the TRQ.

22
4.1 Utilization of the 3 different T R Q groups
Figure 8: Utilization of compensation TRQs for Norwegian seafood 2012/ 2013 (based on
data supplied by the Norwegian Seafood Council)
Figure 8 shows the utilization of the compensation TRQs for seafood originated from
Norway for 2012/ 2013. Twenty of the forty-eight TRQs were filled 100%. This amount to a
total of 42% binding TRQs, meaning that 42% of the TRQs are a barrier to trade in the sense
that only a portion of the trade is done without a tariff. 42% of the TRQs are working in the
way that is shown in figure b or c. If the out-of- quota tariff is high we are in figure b,
meaning that the TRQ is both binding and prohibitive. The TRQ for fresh Mackerel, with an
out-of-quota tariff of 20%, is an example of this kind of TRQ. If the out-of-quota tariff is low
we are in figure c, meaning that the TRQ is just binding, but not prohibitive. The TRQ for
salmon, with an out-of-quota tariff of 2%, is an example of this kind of TRQ. The rest of the
TRQs are then not binding as the total amount exported was smaller than the TRQ amount.
These can still be barriers to trade in terms of all the other measures we have addressed in
this thesis, for example if out-of-quota tariff is very high and the fear of not making the TRQ
before it is filled is too big, then we are dealing with a barrier. As soon as a TRQ makes
exporters act different than in a situation with free trade we can potentially be looking at a
barrier to trade. The higher the utilization percent, the more likely we are dealing with a TRQ
that can be a barrier to trade; depending on the TRQ period, size and out-of-quota tariff.
0102030405060708090100
1 4 7 10131619222528313437404346
Utilization of the compensation TRQs for Norwegian seafood
Utilization of thecompensation TRQs forNorwegian seafood

23
Figure 9: Utilization of GATT TRQs 2012/2013 (data supplied by the Norwegian Seafood
Council)
Figure 9 shows the utilization of the GATT TRQs, TRQs open for all WTO countries. As
have been the case for many years, 70 % of these were fully utilized (seafood council).This
also includes the TRQ for processed cod, being used by many Norwegian exporters. Since
these TRQs can be used by any WTO country, raw fish from foreign countries, like Russia,
can be bought, processed in Norway and exported within these TRQs. The Norwegian
Seafood Council recommends using the GATT and autonomous TRQs ahead of using the
compensation TRQ when it is possible. With this in mind 70% of the GATT TRQs being
fully utilized might not be that surprising Still, the TRQ for herring has not been filled the
last 4 years, having been full every year dating all the way back to 20048.
8 Data supplied by the Norwegian Seafood Council
0102030405060708090100
1 2 3 4 5 6 7 8 9 10
Utilization data, GATT TRQs for seafood
Utilization in %

24
Figure 10: Utilization of autonomous TRQs 2012/2013 (data supplied by the Norwegian
Seafood Council)
The figure above shows the utilization of the autonomous TRQs, TRQs open to all countries.
These TRQs are purely for raw material for the EU`s processing industry. Here only 5 out of
25 TRQs were filled in 2012/2013, but 3 of these are cod and shrimp TRQs, important to
Norwegian exporters. Some of these TRQs are not even relevant for Norway, exemplified as
pacific salmon and octopus. We do not have exact numbers on how much of Norwegian raw
material was exported within these TRQs, but one might speculate why the number has
increased as the TRQs for processed food are very small and the raw material autonomous
TRQs are of a larger magnitude. Whether or not Norwegian businesses have moved from
processed to raw delivery of seafood, the Norwegian processing industry has been robbed of
some revenue due to the EU TRQ system (Melchior, 2007).
A similar exercise of looking at utilization data for TRQs was done by Melchior (2007) with
trade data from 2005/2006. Comparing todays data with the data from 2005/2006 can give an
indication of how well the TRQ system has adapted to development in the seafood imports to
the EU. The data used was utilization of compensation TRQs and 3 TRQs important for
Norwegian exporters; the GATT TRQ for herring and two autonomous TRQs for cod.
0102030405060708090100
1 3 5 7 9 11 13 15 17 19 21 23 25
Utilization of autonomous TRQs for seafood
Utilization in %
25
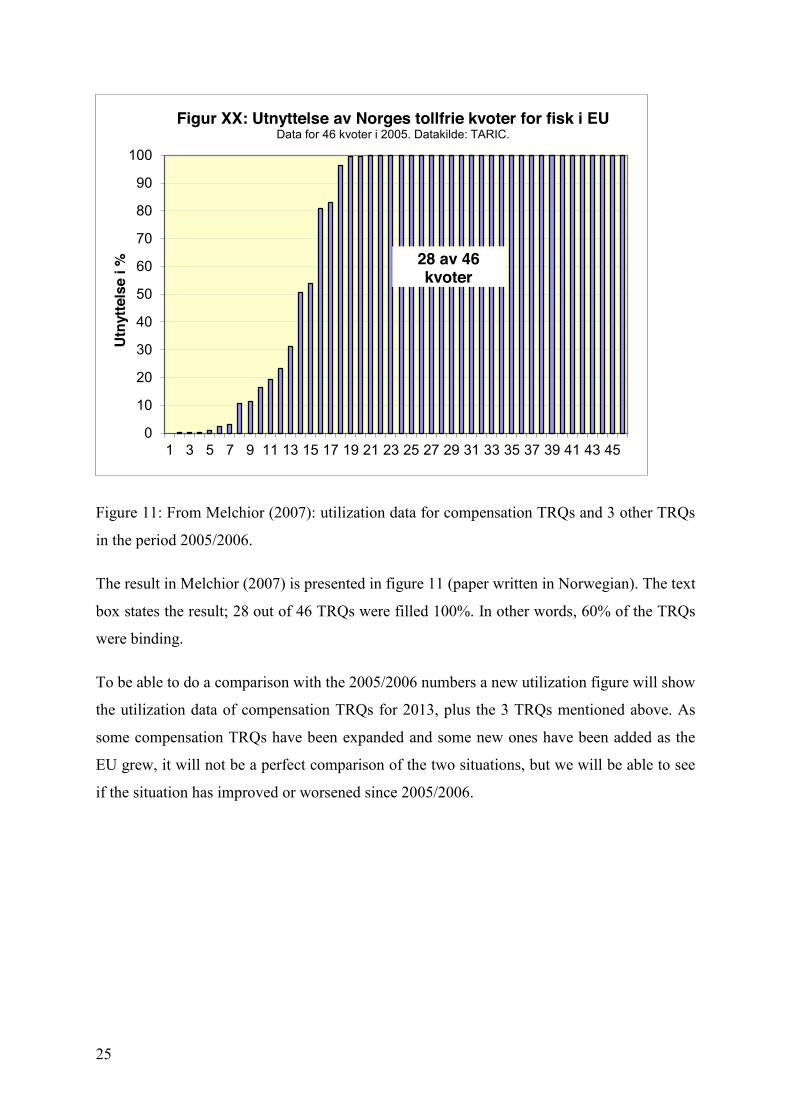
Figure 11: From Melchior (2007): utilization data for compensation TRQs and 3 other TRQs
in the period 2005/2006.
The result in Melchior (2007) is presented in figure 11 (paper written in Norwegian). The text
box states the result; 28 out of 46 TRQs were filled 100%. In other words, 60% of the TRQs
were binding.
To be able to do a comparison with the 2005/2006 numbers a new utilization figure will show
the utilization data of compensation TRQs for 2013, plus the 3 TRQs mentioned above. As
some compensation TRQs have been expanded and some new ones have been added as the
EU grew, it will not be a perfect comparison of the two situations, but we will be able to see
if the situation has improved or worsened since 2005/2006.
0
10
20
30
40
50
60
70
80
90
100
1 3 5 7 9 11 13 15 17 19 21 23 25 27 29 31 33 35 37 39 41 43 45
Utn
ytte
lse
i %
Figur XX: Utnyttelse av Norges tollfrie kvoter for fisk i EU Data for 46 kvoter i 2005. Datakilde: TARIC.
28 av 46 kvoter

26
Figure 12: Utilization data for compensation TRQs and 3 more TRQs for the period
2012/2013 (based on data supplied by the Norwegian Seafood Council).
The above figure shows the utilization data for compensation TRQs and the 3 TRQs included
two. We here see that 21 out of 50 TRQs have been fully utilized. This amounts to a binding
share of 42%. As we are here dealing with quite small numbers, a decrease from 60% to 42%
is not that big, but it is a clear improvement from the 2005/2006 numbers. This shows that the
compensation TRQs have been able to keep up with the development within the seafood
export market and that the system is not as prohibitive as it was in 2006/2007. This is
positive, but one cannot exclude the possibility that the TRQ system has actually made
exporters flee the EU market and found new markets. Another explanation can be, as some
exporters have reported, that exporters have established new or underlying businesses in the
EU to avoid the whole TRQ system. One could do more research on this issue by looking
into trade flows from Norway to the EU over the last decade. It could for example be
interesting to examine the possible change in trade flows before and after the entrance of a
country into the EU. But this is outside the scope of this thesis and will not be addressed here.
4.2 Speed and quota rent
Many of EU`s TRQs for seafood are binding. With a binding TRQ there is a quota rent to be
collected. Examining the speed at which the TRQ is filled can give an indication on what
0102030405060708090100
1 4 7 1013161922252831343740434649
Utilization of TRQs 2013
Utilization of TRQs 201321 of 50 TRQs

27
actors will be able to collect this rent. If it is filled fast and tariff is paid most of the year, the
importers or exporters most likely will be able to collect the rent (Melchior 2007).
We examine the 22 compensation TRQs, the 6 GATT TRQs and the 6 autonomous TRQs
that were fully utilized in 2013 and set up a figure showing how fast they were filled. Figure
13 shows how much of the TRQ period that were gone before the TRQ was filled. If the TRQ
lasts for a year and was filled after 6 months the number will be 6/12= 0,5. If the TRQ period
was 6 months and the TRQ was filled after 2 months, the number is 2/6= 0.33.
Figure 13: speed at which all the TRQs (compensation, GATT and autonomous) are filled for
2013 (based on data supplied by the Norwegian Seafood Council).
From figure 13 we see that half of the TRQs were filled before 1/3 of the period had gone by.
This means that we have a situation where trade goes on most of the year with a tariff. When
the period without a tariff is so small, the market price will most likely be a price including
the tariff, and the consumers will not benefit from the TRQ. The quota rent will most likely
go to the exporter or importer for the TRQs being filled quickly. For the TRQs being filled
further out in the period and at the end of the period the situation might be better for the
consumers in the sense that it is easier to hold the price low and the benefit from the TRQ,
the quota rent, will be collected by the consumers in terms of a lower price. The quota rent
will most likely be collected by different actors depending on how fast the TRQ is filled. Of
course, the possibility of collecting the quota rent for the importers and exporters also depend
on the elasticity of demand from the consumer side. If the price elasticity for one particular
00,10,20,30,40,50,60,70,80,91
1 3 5 7 9 11 1315 1719 2123 2527 29
Speed at which the TRQs are filled
Speed at which the TRQsare filled

28
seafood group is high, it will not be that easy for the importers and exporters to collect the
quota rent by keeping the price high (Norges fiskerihøgskole, 2006)
From the theory of rent sharing the rent allocation also depends on the market structure and
the bargaining power of the importers and exporters. In the case with the EUs TRQs the
exporters are the actors with less bargaining power as the importers can choose the exporters
offering the lowest price. The exporters who are able to export within the TRQ will offer a
lower price compared to those who have to pay the out-of-quota tariff e
The fact that most
exporters also deliver their goods DDP, meaning the exporter is responsible for all duties,
tariffs and transport until it reaches the importer, also supports this. This result is based on an
assumption that there is perfect competition in both the export and the import market.
Comparing with Melchior (2007) we look at the same speed graph for 2005/2006 data. The
result was very similar to the one for 2012/2013. The text box in the figure saying that half of
the TRQs are being filled before 1/3 of the period has gone by. The figure from Melchior still
having compensation TRQs plus 3 others and the 2012/2013 having all TRQ, compensation,
GATT and autonomous it is not a good sign that the most resent data are no better than the
2005/2006 data. This might indicate that even though there seams to be better situation today
in terms of how many TRQs being binding, the pressure on those that are binding is still the
same.
29
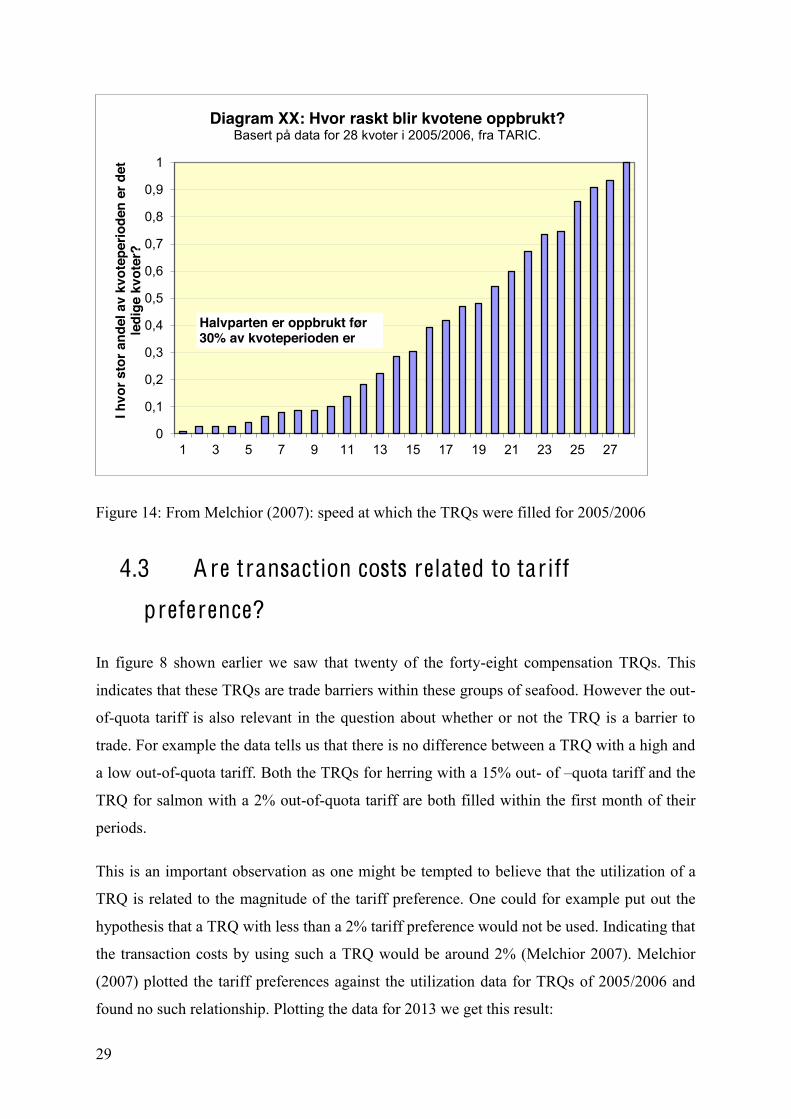
Figure 14: From Melchior (2007): speed at which the TRQs were filled for 2005/2006
4.3 A re transaction costs related to tariff
preference?
In figure 8 shown earlier we saw that twenty of the forty-eight compensation TRQs. This
indicates that these TRQs are trade barriers within these groups of seafood. However the out-
of-quota tariff is also relevant in the question about whether or not the TRQ is a barrier to
trade. For example the data tells us that there is no difference between a TRQ with a high and
a low out-of-quota tariff. Both the TRQs for herring with a 15% out- of quota tariff and the
TRQ for salmon with a 2% out-of-quota tariff are both filled within the first month of their
periods.
This is an important observation as one might be tempted to believe that the utilization of a
TRQ is related to the magnitude of the tariff preference. One could for example put out the
hypothesis that a TRQ with less than a 2% tariff preference would not be used. Indicating that
the transaction costs by using such a TRQ would be around 2% (Melchior 2007). Melchior
(2007) plotted the tariff preferences against the utilization data for TRQs of 2005/2006 and
found no such relationship. Plotting the data for 2013 we get this result:
0
0,1
0,2
0,3
0,4
0,5
0,6
0,7
0,8
0,9
1
1 3 5 7 9 11 13 15 17 19 21 23 25 27
I hvo
r sto
r and
el a
v kv
otep
erio
den
er d
et
ledi
ge k
vote
r?
Diagram XX: Hvor raskt blir kvotene oppbrukt? Basert på data for 28 kvoter i 2005/2006, fra TARIC.
Halvparten er oppbrukt før 30% av kvoteperioden er

30
Figure 15: Utilization of the TRQs on the horizontal axis and the tariff preference of
exporting within the TRQ on the vertical axis give us the relationship between the two for
2013 (based on data supplied by the Norwegian Seafood Council).
From this scatter plot we can see that there is no clear pattern. Both TRQs with a large tariff
preference, having a high out- of quota tariff, and the TRQs having a low tariff preference,
a low-out-of-quota tariff are both being filled 100% or hardly filled at all. This tells us that
there might not be too high transaction costs related to the use of these TRQs.
4.4 Small, unfilled T R Qs
Going through all of these TRQs a curiosity appears with the very small TRQs for very
specific types of seafood that are hardly being utilized at all. Take for example the
compensation TRQ for processed salmon. The TRQ being 300 and by the end of the period
the utilization is only 2%. This can have many explanations. One is that the TRQ is so small
that the exporters do not bother using it, though we have seen that there is not a positive
relationship between the tariff preference and the utilization data, meaning that there should
be no reason not to use the TRQs. For the TRQ for processed salmon the out of-quota tariff
is much higher than the tariff for unprocessed salmon. For this reason exporters may choose
to go for the less risky TRQ. In other words, exporters might be competitive within the TRQ,
but not with the out-of-quota tariff put on top. This might be the case for many of these small
0
5
10
15
20
25
30
0 20 40 60 80 100
Relationship between utilization and the out-‐of-‐quota tariff
Relationship betweenutilization and the out-‐of-‐quota tariff

31
TRQs. The fact that they are small also gives them a higher risk of getting filled up fast, so
the risk might be too big of not making the border before the TRQ is filled. This is also
administrating the TRQs makes it risky to go for small TRQs such as the one for processed
salmon. If you put a high out-of-quota tariff on top of a small TRQ exporters may find it too
risky to utilize that TRQ.
Another explanation, also confirmed by some companies, is that the Norwegian processing
industry within some seafood groups are just not competitive enough. The growing
competition from processors within the EU makes it hard for Norwegian processors to keep
up. We will take a closer look at the feedback from seafood exporters in the following
chapter.
4.5 Conclusions from part 4: A quantitative analysis
of utilization data
By using utilization data from 2012/2013 we have found that: 42% of the compensation
TRQs, 70% of the GATT TRQs and 20% of the autonomous TRQs in 2012/2013 were
binding. Compared to data from 2006/2007 the number of binding TRQs has gone down, but
the TRQs are still being filled at the same speed. This indicates that the TRQ system has
managed to keep up with the development in the seafood import market, but some seafood
groups continues to be problematic. The TRQs for fresh mackerel and herring are examples
of such TRQs. They both fill up fast and have high out-of-quota tariffs: Fresh mackerel
(20%) and fresh herring (15%).
Examining the speed at which all the TRQs (compensation, GATT and autonomous) were
filled we found that 50% were filled before 1/3 of the TRQ period had gone by. This is telling
us that the importers and/or exporters trading within these TRQs can collect the quota rent
because the price is most likely to be held high the whole period.
When comparing the tariff preference within a TRQ and the rate of utilization we found that
there was no clear relationship. This indicates that transaction costs are not very high for
these TRQs. The next chapter will examine this more extensively with a business survey.
Analyzing the utilization data it became clear that there exists some very small TRQs that are

32
hardly used at all. This indicates t
, or a lack of competitiveness from the Norwegian exporter
side. This issue will also be addressed in the business survey.

33
5 Business Survey To examine how the TRQs affect Norwegian seafood exporters, a business survey was
created to collect data directly from the exporters. Data collected directly from the exporters
give a more nuanced understanding of the situation as one can get more detailed answers to
the underlying issues related to the TRQs. The purpose was to find out if there exist rent
seeking costs or transaction costs related to the utilization of the TRQs and if so, how large
these are.
As mentioned in the introduction the TRQs are saving the Norwegian exporters millions in
tariffs every year, but are there hidden costs related to these TRQs that are not being
accounted for when negotiating about the size etc. By using a business survey asking the
exporters what kind of transaction costs they encounter and how large they are we can get a
better understanding of how these TRQs effect trade flows between Norway and the EU.
Example of a transaction cost can be the costs related to the documentation of origin when
utilizing the compensation TRQs earmarked for fish with Norwegian origin. (the fish is
labeled according to the nationality of the boat that caught it.) In the survey a question
examining this issue would as if the exporter has experienced costs related to the
documentation process and if so, how large these cots are. Another example of cost is the
investment or renting costs to get access to storage in an EU country to ensure a fraction of
the TRQ before it is filled. The Norwegian Seafood Council reports that as much as 3500
tons of clip fish went through Denmark in 2013 and was most likely stored there to secure a
part of the GATT TRQ before going to Portugal where it is consumed.
The business survey will also asked what TRQs are experienced as too small (binding) and
how that affects the exporters. Related to the administration of the TRQs the survey will
if the exporters would rather prefer another type of administration. From the utilization and
theory chapter one might expect that the exporters would want an
certain how much one has to pay for a TRQ so this is not certain. One must also remember
that the auction system is the best system from the perspective of the welfare gain of the
whole society, but not from the perspective of the private exporter. Recapturing the result on
the no existing relationship between the tariff preference by utilizing a TRQ and the

34
utilization rate one will also expect that the transaction costs might not be large in total. But
as the utilization data highlighted, there are large differences between the TRQs and the
business survey will also reflect that.
The challenge when conducting a business survey is however the possible analytical issues
arising with the use of human experience as the main source of data. There might be an
existence of bias, faulty memory or personal agendas. For example; as the thesis is part of a
publicly funded project, the exporters might have the incentive to report larger costs than
observed, to convince the Norwegian authorities that this is a more serious problem than it
really is. Another issue is non-response and low response rates, as few responses provide less
robust results than optimal. Another issue related to non-responsiveness is the possible bias
of respondents being systematically different from the non-respondents. For example, all
respondents being small companies and all non-respondents being large companies, the
survey would be biased trying to represent all Norwegian seafood exporters exporting to the
EU. Even though there are some possible analytical issues related to a business survey this is
still the best way to get data that can supplement the utilization data analysis and give a better
understanding of how these TRQs work.
5.1 C reating the survey
The Norwegian Seafood Council was contacted at an early stage to get an impression of what
kinds of problems and potential costs that existed in this market. To be able to put together a
survey with the most important barriers and possible costs related to them, pilot interviews
were conducted with 3 exporters, Norges Fiskarlag, The Norwegian Seafood Federation and
the Norwegian Seafood Council. Additionally, my supervisor Arne Melchior contributed
with valuable input as an experienced researcher within the field. Constructing the survey and
the questions it became clear that there existed a gap between what kind of information that
would be most favorable for the thesis and what would be possible to obtain from the
exporters. The most interesting information for the thesis would be to get information on a
EU Tariq number level on exactly how many tons had been exported within and outside of a
TRQ the last quota period. From other researcher`s experience I learned that this kind of data
would be very hard to get obtain as it would be time consuming for the exporters, and they
might not even have those exact numbers registered. As I realized this, but still saw it as very
valuable information if some exporters would be willing to report on this; I chose to add the

35
question as a voluntary part at the end of the survey. Concluding the survey, only one
exporter had answered the question, confirming my beliefs about this being too detailed
information to be asking for.
The survey was made up of yes and no questions with one or two sub questions. The reason
behind the simplicity of answers to a question were based on an assumption that the people
getting these surveys are very busy people who does not have the time to answer a long and
demanding survey.
survey. This was a very user friendly survey tool, allowing the construction of a number of
questions, distributing these to a larger number of businesses through the program`s email
function and lastly presenting aggregated results for the whole survey in real time. This
online questionnaire sent by email, was the best option as the goal was a quantitative survey.
Getting as many answers as possible was also the goal when creating a very simple question
scheme. One example question:
Does the documentation of origin related to the use of the compensation TRQs represent a
cost for your company?
Yes
No
If yes, how large is the cost (in per cent of the sales price)
In the sub questions the program collected some answers on the cost of different issues
related to the TRQs, but most exporters answered that it was impossible to calculate the cost.
5.2 Administrating the survey
All together the survey consisted of 27 questions, including the informational questions
covering size of company etc. Through the Norwegian Seafood Councils database on seafood
exporters 199 companies exporting to the EU market was extracted.

36
The survey was sent out to these 199 exporting companies 11th of December. A reminder was
sent out both 18th of December and 7th of January. Out of the 199 companies contacted 16
replied that they were not eligible for the survey, either by no longer being exporters to the
EU, having shut down their business or for other reasons. The survey was concluded 24
January 2014. After conclusion of the survey, 19 companies had answered all or some
questions in the survey. This also included the pilot interviews. The choice of completing an
online survey could have been replaced with all phone based interview, but even though the
response rate was not sufficient enough to get a quantitative study, the results points in a
certain direction and can be valuable for further research within the field of TRQs.
As the survey was sent out to exporters only based on their registration as a EU exporter, it
reached out randomly to both small and large businesses. As the survey also consisted of
questions related to the size and share value of the company the bias of only getting reports
from one group of exporters was avoided. The number of employees within the companies
ranged from 2 to 200 and the turnover ranged from 1 million to 1 billion NOK.
The questionnaire in Norwegian can be found in the Appendix. The answers are exempt from
the paper due to firm sensitive data. The most important questions and results will be
reviewed in the following.
Has your business utilized the TRQs when exporting seafood to the EU the last 3 years?
Yes
No
16 out of 19 answered yes. As all of these firms have reported of exporting goods to the EU
this could mean that these firms find the costs related to utilizing the TRQs so high that they
choose not to use them, the tariff on the good the firm is exporting is of no relevant size or
the TRQ has been full at the time the firm imported their goods to the EU. Most likely these
firms are exporting salmon, a product that has only a 2% tariff level. The survey continues
with answers from 17-18 firms, indicating that at least two of the firms have not answered all
questions, most likely because the question was not relevant. If we assume these firms are not
utilizing the TRQs because the tariff on their exported goods are so low, the percentage of
firms reporting of costs would have gone down if they had answered the whole survey. This
means that the survey might overestimate the importance of costs. But if we assume the firms

37
are not utilizing the TRQs because the cost of doing so is too high, then the survey is
underestimating the importance of costs. Either way the number of firms answering the
survey is too small to give quantitative result, but can give us a hint about the costs related to
these TRQs.
Has your business adapted and made changes, by for example renting storage close to the
border, changed seasons or taken advantage of middleman in the hope of attaining a part of
a TRQ?
Yes
No
If yes, how much do these adjustments amount to in NOK?
2 out of 19 companies, 11% answered yes. One company reported of renting storage in a EU
country before the TRQ was full while the other reported use of storage for freezing and
establishment of daughter companies in both Denmark and Sweden.
The main result attained from this business survey is that the costs related to the TRQs are
existing, but on the whole modest. For some seafood groups the costs are substantial and the
result might have been different with a narrower group of business. If for example the
business survey was distributed to companies only exporting within the pelagic seafood
groups the result might have shown higher costs.
5.3 Survey questions and results
Is your business experiencing costs relating to the documentation needed to use the
compensation TRQs for Norwegian fish?
Yes
No
If yes, how much do these costs amount to?
4 out of 18 companies, 22%, answered yes. Of the companies reporting costs there were huge
differences in the size of these costs. Some reported that the costs would amount to the same,

38
independent of the amount of seafood exported, while other`s reported on costs ranging from
2 to 15% of the sales price.
Have the TRQs led to uncertainty and made risk analysis harder for your firm?
Yes
No
If yes, in what way?
11 firms, 61% of the companies that answered the survey answered yes on this question. This
amounts to one of the highest affirmative scores in the survey. Many of the comments saying
that the planning of a year is very difficult as you never know when the TRQ will be filled.
Especially for the exporters of mackerel with an out-of-quota tariff of 20% it becomes very
difficult to plan the season. Also for the exporters of processed seafood it is reported that it is
difficult to plan for the purchasing of raw material. Some of these TRQ are so small that it is
even reported that the TRQ is filled up while a load of seafood is on its way to the border.
Is it a problem that the TRQs are too small and are filled too fast?
Yes
No
If yes, for what TRQ is this a problem?
61% of the firms answered yes on this question and the reported TRQs were:
Shrimp, Processed herring, crab, processed cod, stock fish, clip fish and mackerel. This
confirmed the suspicion from last chapter that these are the binding TRQs representing a
barrier for these specific seafood groups.
Has your business lost market shares due to the inclusion of new countries in the EU and the
shift from free trade to the TRQ system?
Yes
No

39
If yes, how much approximately has your business lost due to this?
2 of 16 companies, 13% answered yes. They were not able to give a cost estimate, but as
expected it was reported that the Polish market is a market where this has been a problem for
Norwegian exporters. The follow up question to this was.
Has your business made the decision of not entering markets in the EU due to the TRQ
system?
Yes
No
The answers here were the same as in the previous question. Although 13% is not a huge
number, especially when we know we are only talking about two companies in this survey, it
is still worrying that some companies report of this being the situation. This is certainly
pointing in the direction that these TRQs are a barrier to trade. Although the costs cannot be
pinpointed as great and vary a lot across the different seafood groups one still has to
acknowledge it is a problem that the reporting of companies choosing not to invest in markets
exists at all. Of course this can be a result of Norwegian firms not being competitive, and
reporting that the TRQs is the reason, but most likely the TRQs and making the EU market
bigger has contributed to Norway having a disadvantage when it comes to competitiveness.
Is your company exporting also after the TRQ is filled?
Yes
No
If yes, what seafood products do you export after the TRQ is filled and how much?
13 answered yes and 5 companies no on this question. Resulting in 28% reporting of not
exporting after the TRQ is filled. This indicates the same as we saw in the utilization data,
some TRQs have an out-of-quota tariff so high that it stops Norwegian exporters from trading
after the TRQ is filled. In other words, some of the TRQs work in the same way as binding
import quotas. This question also relates to the rent sharing theory. Exporting when the quota
is filled also depends on whether the exporter or importer pays the out-of-quota tariff. The
utilization chapter indicated that the Norwegian exporters carry this cost. The pilot interviews

40
confirmed that this was the case for most exporters. Even though the TRQs are importing
quotas given to importers, the exporters are the ones actually handling the TRQs at the
border, paying the out-of-quota tariffs and signing papers. One exporter reported on having
an arrangement with an importer paying the out-of-quota tariff when the TRQ was full, but
most exporters reported on lost agreements when the out-of-quota tariff was initiated.
To get a better impression of how the exporters` perception of the TRQ system and the
pt
and the tariff vs TRQ issue.
The TRQs for Norweg
administrating the TRQ? (For example a system were the TRQs are auctioned)
Yes
No
If yes, what kind of system would your company prefer?
94% of the companies answered no to this question. 16 out of 17 companies did not want
another system of administration for the TRQs. This is not a very surprising answer as the
possible quota rent will disappear due to free competition or go to the EU authorities. The
auctioning is the best option according to our theory in terms of the minimal welfare loss, but
as an exporter you are a profit maximizer and auction might remove the quota rent you gain
as an exporter within the TRQ in today`s system. On the other had an auction system could
possibly remove some of the uncertainty and risk related to the fear of not making a TRQ in
time. As this survey reports of high risk and uncertainty it is a puzzle why the exporters do
not want another less uncertain system.
I would prefer a moderate tariff instead of a TRQ?
I totally disagree
I disagree
I agree

41
I totally agree
I don`t know
If yes, how high can this tariff be?
32% of the companies totally disagreed with this statement, followed by 16% disagreeing.
21% agreed, while only 11% totally agreed. 21% had no opinion. The spread in the answers
shows the diversity within this system. As we have seen indications of in both the utilization
data and the other survey questions, the differences between the TRQs are large. For some
seafood groups the TRQ moves tariff revenues from the EU to the Norwegian seafood
exporters by giving them large TRQs allowing them to export to the EU at a zero-tariff the
whole TRQ period. For others the TRQs represents barriers to trade in terms of binding
quotas and high out-of-quota tariffs. For those companies agreeing with the statement, they
wanted tariffs ranging from 0 to 5%. This probably means that for those exporting within a
TRQ that is either small or has a high out-of-quota tariff or both, a tariff is preferable to a
TRQ. A tariff will be stable and not represent the same risk for the exporters. For those
exporting within a large TRQ that is not binding or within a TRQ with a very low out-of-
quota tariff, a tariff will not represent a better situation. The result from this last question
would most likely have been different if companies had been chosen based on what kind of
seafood they exported. A survey with only pelagic seafood exporters would typically result in
a higher percentage of agreeing answers.

42
5.4 Conclusions from part 5: Business survey
Figure 16: Survey results; positive (yes) answers in per cent
Even though the survey indicates that the problems and costs related to the adjustments
utilizing the TRQs are minor and linked to specific seafood groups, we can see from figure X
that there are issues creating barriers for the Norwegian exporters. The number of companies
reporting of costs related to documentation of Norwegian origin was somewhat higher than
anticipated, but the most alarming result to be extracted from this survey is the high number
of firms reporting on the high level of uncertainty and risk related to these TRQs. 61% of the
firms answered that the TRQs had raised uncertainty levels and made risk analyses harder.
With small TRQs, a first come first serve policy and high out-of-quota tariffs makes planning
ahead very difficult as the risk is high ending up paying the high out-of-tariff quota,
producing negative results. The same percentage answered yes on the question of the TRQs
being too small which indicates that the problem with risk is related to the fact that the TRQs
are binding and being filled very fast. The two questions measuring the most severe
consequences of the TRQs, asking if exporters have actually lost market shares and decided
not to go into a EU market due to the TRQs did not have a large number of yes answers. But
the fact any companies at all answered yes to this question is a sign that we are dealing with
trade barriers so severe that we are losing shares in the EU market.
0
20
40
60
80
100
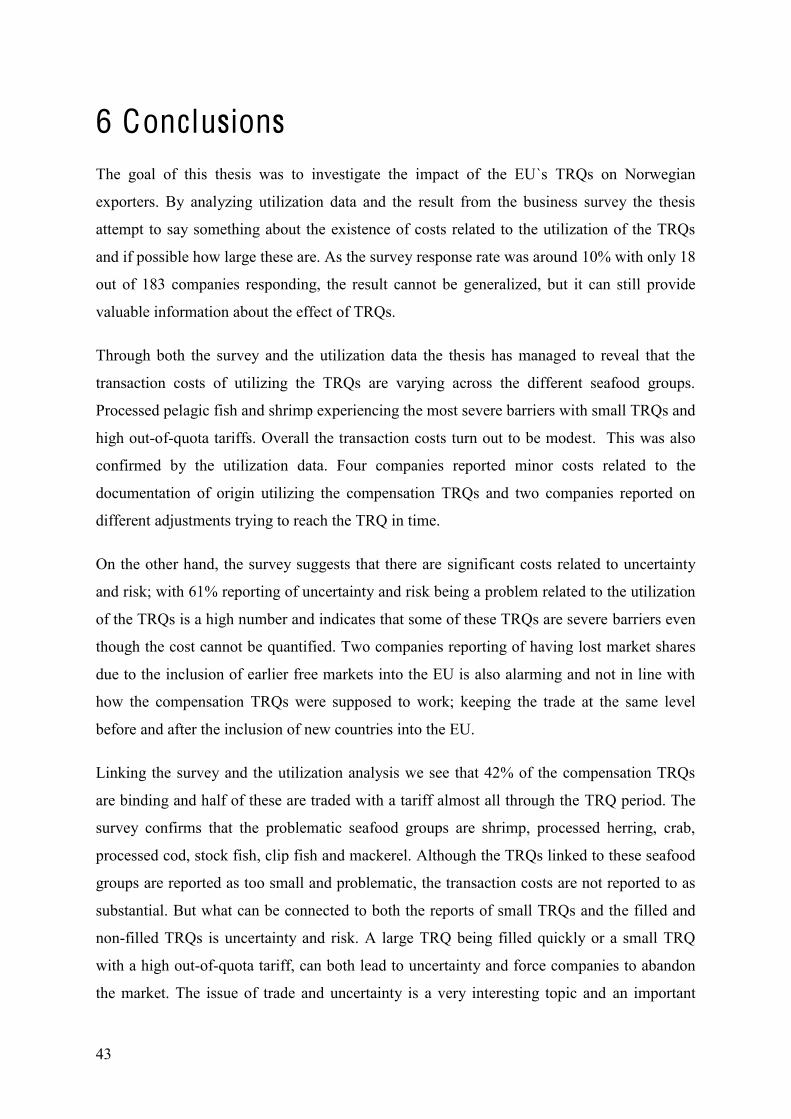
43
6 Conclusions The goal of this thesis was to investigate the impact of the EU`s TRQs on Norwegian
exporters. By analyzing utilization data and the result from the business survey the thesis
attempt to say something about the existence of costs related to the utilization of the TRQs
and if possible how large these are. As the survey response rate was around 10% with only 18
out of 183 companies responding, the result cannot be generalized, but it can still provide
valuable information about the effect of TRQs.
Through both the survey and the utilization data the thesis has managed to reveal that the
transaction costs of utilizing the TRQs are varying across the different seafood groups.
Processed pelagic fish and shrimp experiencing the most severe barriers with small TRQs and
high out-of-quota tariffs. Overall the transaction costs turn out to be modest. This was also
confirmed by the utilization data. Four companies reported minor costs related to the
documentation of origin utilizing the compensation TRQs and two companies reported on
different adjustments trying to reach the TRQ in time.
On the other hand, the survey suggests that there are significant costs related to uncertainty
and risk; with 61% reporting of uncertainty and risk being a problem related to the utilization
of the TRQs is a high number and indicates that some of these TRQs are severe barriers even
though the cost cannot be quantified. Two companies reporting of having lost market shares
due to the inclusion of earlier free markets into the EU is also alarming and not in line with
how the compensation TRQs were supposed to work; keeping the trade at the same level
before and after the inclusion of new countries into the EU.
Linking the survey and the utilization analysis we see that 42% of the compensation TRQs
are binding and half of these are traded with a tariff almost all through the TRQ period. The
survey confirms that the problematic seafood groups are shrimp, processed herring, crab,
processed cod, stock fish, clip fish and mackerel. Although the TRQs linked to these seafood
groups are reported as too small and problematic, the transaction costs are not reported to as
substantial. But what can be connected to both the reports of small TRQs and the filled and
non-filled TRQs is uncertainty and risk. A large TRQ being filled quickly or a small TRQ
with a high out-of-quota tariff, can both lead to uncertainty and force companies to abandon
the market. The issue of trade and uncertainty is a very interesting topic and an important

44
issue for further research. For an interesting contribution on trade under uncertainty and
choice of export market, see Aarseth (2002).

45
7 References Boughner, de Gorter, and Sheldon (2000), The Economics of Two-Tier Tariff Rate Import
Quotas, Agricultural and Resource Economics Review, pp 58 - 69
Feenstra, R. C. (2004). Advanced International Trade: Theory and Evidence, Princeton
University Press, pp 254-263
FAO (2000) Multilateral Trade Negotiations on Agriculture, a resource manual, Rome; FAO.
Melchior, A. (2002). EUs utvidelse og handelsvilkårene for norsk fiskeeksport (In
Norwegian, The Expansion of the EU and regulation for Norwegian seafood export) , NUPI
639
Melchior, A. (2007). "WTO eller EU medlemsskap?" (In Norwegian, WTO or EU
membership?) Norsk fiskerinæring og EUs handelsregime, NUPI.
Norges fiskerihøgskole (2006). "EUs tollregime for norsk sjømat og hvordan en ny WTO-
avtale kan påvirke norsk tollpreferanse." (In Norwegian, EU`s tariff regime for Norwegian
seafood and the effect of a new WTO agreement on Norwegian tariff preferences).
Universitetet i Tromsø
OECD (2005) Looking Beyond Tariffs, the role of non-tariff barriers in world trade, Paris:
OECD
Sissener, Bjørndal og Asche (2003). "EFTA-frihandelsavtaler-døråpnere for norsk
fiskeeksport? " (In Norwegian, EFTA Free Trade Agreements - dooropeneres for Norwegian
seafood export?), SNF-rapport 12/03
Skully, D. W. (2001). Economics of Tariff-Rate Quota administration. Technical Bulletin,
United States Department of Agriculture , pp 1-27.
Stern, D. (1997). Measurment of non-tariff barriers,Paris: OECD.

46
8 Appendix
8.1 Business Survey questions (In Norwegian)9
1. Har din bedrift eksportert produkter til EU som er underlagt tollfrie kvoter de siste 3 år?
2. Har din bedrift gjort tilpasninger, som for eksempel innfrysning, bruk av mellomledd,
endret sesongmønster e.l. for å sikre seg en del av en tollfri kvote?
a) Hvis ja, hvilke tilpasninger er gjort?
b) Hva har disse tilpasningene kostet bedriften(prosentandel av salgspris)?
3. Er det betydelige kostnader knyttet til dokumentering og selve prosessen rundt den
praktiske importen av deres produkter i EU (sammenlignet med en tollfri prosess)?
a) Hvis ja, omtrent hvor store er disse kostnadene (svar i prosent av salgspris)?
4. Har de tollfrie kvotene ført til usikkerhet og gjort risikoberegninger vanskeligere for din
bedrift?
a) Hvis ja, på hvilken måte?
b) Hvor store er de samlede utgiftene din bedrift har i forbindelse med utnyttelsen av
de tollfrie kvotene (lagringskostnader, risikoberegninger osv) ?
5. De tollfrie kvotene tildeles per i dag etter et « første mann til mølla» prinsipp, vil det være
ønskelig for din bedrift å endre denne ordningen (til for eksempel en ordning der kvotene
auksjoneres bort)?
a) Hvis ja, hvilken ordning vil din bedrift foretrekke?
9 The survey questions are given numbers for the purpuse of order in the appendix only. The informational
questions are not included.

47
6. Er det et problem at de tollfrie kvotene er for små og brukes opp for fort?
a) Hvis ja, for hvilke kvoter (løpenummer) er dette et problem?
7. Eksporterer din bedrift til EU land også etter at den tollfrie kvoten er oppbrukt?
a) Hvis ja, for hvilke produkter gjelder dette og hvor mye eksporterte din bedrift etter
at kvoten var oppbrukt i 2012?
8. Er du enig i følgende påstand?
svært uenig
uenig
enig svært enig
vet ikke
a) Hvis enig, hvor høy kan denne tollen være?
9. Har din bedrift mistet markedsandeler de siste 20 årene grunnet innlemmingen av flere
land i EU og overgangen fra frihandel til kvoter?
a) Hvis ja, kan du oppgi et omtrentlig overslag over tapt omsetning grunnet denne
overgangen?
10. Har din bedrift latt være å satse på markeder i EU grunnet kvotesystemet?
11. Har din bedrift innspill til hvilke krav norske myndigheter bør stille i forhandlingene om
nye tollfrie kvoter?