Targeted Cluster Identification and Strategic Alignment
70
Targeted Cluster Identification and Strategic Alignment Pacific Mountain Workforce Development Council September 2012
Transcript of Targeted Cluster Identification and Strategic Alignment

Targeted Cluster Identification and Strategic Alignment
Pacific Mountain Workforce Development Council
September 2012

1
Contents Acknowledgment .......................................................................................................................................... 2
Introduction .................................................................................................................................................. 2
Report Structure ........................................................................................................................................... 3
Targeted Industry and Cluster Selection Methodology ................................................................................ 3
Data-Driven Regional Economic Strategy Alignment.................................................................................... 4
Industry Cluster Data Analysis ...................................................................................................................... 8
Cluster Analysis and Supply Chain Overview .......................................................................................... 14
Cluster Summary ..................................................................................................................................... 15
Food production ..................................................................................................................................... 17
Wood product and paper manufacturing ............................................................................................... 19
Life sciences ............................................................................................................................................ 21
Chemical product and plastics manufacturing ....................................................................................... 23
IT/Telecommunications .......................................................................................................................... 25
Boundary Spanners ................................................................................................................................. 26
Conclusion ................................................................................................................................................... 29
Appendix A: Strategy Alternatives Matrix .................................................................................................. 31
Appendix B: Variables and Cluster Selection Process ................................................................................. 39
Appendix C: Detailed Cluster Tables ........................................................................................................... 42
Appendix D: Employment Distribution ....................................................................................................... 52
Appendix E: Cluster Occupation Overview ................................................................................................. 57
Appendix F: Tourism and recreation........................................................................................................... 61
Appendix G: Boundary-Spanning Industries ............................................................................................... 67

2
Acknowledgment Economic Modeling Specialists Int. (EMSI) and J Robertson and Co. gratefully acknowledge the excellent
support of the staff at the Pacific Mountain Workforce Development Council in making this study
possible. Special thanks go to:
Michael Cade – Thurston Co. EDC, Executive Director
Cathy Russ – Pacific Co. EDC, Executive Director
Tami Garrow – Satsop Business Park, Chief Executive Officer
Amy Hatfield – Olympic College, Dean of Workforce Development
Sheri Nelson – Sierra Pacific Industries, Community Relations Manager
Todd Dixon – WA State Employment Security Department, Area Director
Dick Larman – Lewis Co. EDC, Executive Director
Tim Gibbs – Greater Grays Harbor Inc., Executive Director
Lisa Smith – Enterprise for Equity, Executive Director
Bob Hitt – Toad Hall Cranberry Farms - Owner
Bob Guenther – Thurston, Lewis and Mason Co. Labor Council, President
Dr. Jim Walton – Centralia Community College - President
Dr. Gerald Pumphrey – South Puget Sound Community College, President
Dr. Edward (Ed) Brewster – Grays Harbor Community College – President
Cheryl Fambles – Chief Executive Officer - Pacific Mountain WDC
John Loyle – Director, Strategic Initiatives - Pacific Mountain WDC
Craig Clark – Planner and Equal Opportunity Officer - Pacific Mountain WDC
Introduction In recent years, the Pacific Mountain Workforce Development Council (PMWDC) leadership has
recognized a need to engage in a rigorous data-driven process of identifying target clusters and
development strategies. The primary goal of this process is geared toward developing strategies to
attract, grow, and diversify industries within the region in order to strengthen the regional economy and
increase economic stability. A secondary goal is to increase strategic collaboration between leaders and
stakeholders within the region. To this end, PMWDC has championed a data-driven, consensus-based
targeted industry cluster analysis—with informed feedback from county and regional stakeholders—of
the region to identify and prioritize industry development opportunities. Based on these industry
opportunities, PMWDC and regional leaders can strategically align economic development, workforce,
and education resources to accelerate the growth and position of key industry clusters in the region.
To provide background assessment and guidance in this industry cluster selection and strategy
development process, PMWDC contracted with Economic Modeling Specialists Int. and its partner, J
3
Robertson and Co. This report presents and describes the data-driven strategies and data assessments
for each of the identified five clusters.
Report Structure This report is structured into two primary components that focus directly on each of the selected
industry clusters—food production; wood product and paper manufacturing; life sciences; chemical
product and plastics manufacturing; and IT/Telecommunications. The first component builds upon data-
driven strategic analysis to present a strategic action plan framework focusing on best-value
opportunities and organizational capacity for each cluster. The second component comprises the
detailed data-driven analysis used to identify existing strategies and alignment with regional
opportunities and gaps.
The reader should note that although general descriptions of the clusters are presented, the industries
identified within the clusters are specifically customized to the region (note: the region consists of Greys
Harbor, Lewis, Mason, Pacific, and Thurston Counties). In other words, each cluster only contains
regionally relevant industry sectors and not all industry sectors that could potentially fall within broad
cluster descriptions.
Targeted Industry and Cluster Selection Methodology Targeting industry clusters for development, though not a new concept, has become the focus of more
sophisticated research, information, and processes. Targeting clusters allows an area to focus on
industry recruitment, retention, expansion, and development programs rather than attempting to
spread resources across too many industry development directions. Ultimately, developing targeted
cluster strategies allows for a more efficient allocation of limited community, county and regional
resources. However, not all industries provide equal opportunity for development. As a result,
identifying data-driven approaches to selecting potentially successful industry cluster targets has
become a new mantra for economic development.
To address the need for clear industry cluster targets, EMSI used a series of metrics to describe various
aspects of industries and worked with a leadership group designated by PMWDC to identify the
selection criteria used to articulate industry clusters. The leadership group included representatives
from private enterprises, economic development councils, local community colleges, and other public
and private enterprises. The following list summarizes the targeted industry clusters identified by the
consultants and leadership team:
Food production: Comprised of industries involved in agriculture production and fishing, as well
as the transformation of livestock, agricultural products, and other consumable natural
resources into products for immediate and final consumption. The cluster contains supply chain
components ranging from agribusiness, transportation/distribution, and final consumption (e.g.,
supermarkets, restaurants, amusement parks, etc.).

4
Wood product and paper manufacturing: The core industries range from logging and sawmills
to different types of wood manufacturing. Since logging and sawmills are represented within the
core industries, the industrial inputs include the engineering and industrial machinery that go
into the core industries. Purchasers and distributors include a wide variety of industries such as
hospitals, which require a wide range of wood and paper products, and soft drink
manufacturing, which primarily buy specific products like cardboard.
Life sciences: This cluster’s core industries are involved in the development and manufacturing
of health-care products, such as electromedical products, as well as specialty and niche medical
services, such as laboratories, diagnostic imaging, and kidney dialysis centers. Industries
providing administrative and engineering services are represented in the industrial inputs,
whereas medical facilities such as dentists play the role of purchasers and distributors.
Chemical product and plastics manufacturing: The core industries are comprised of activities
focused on the production of value-add chemicals, such as basic inorganic and organic chemical
manufacturing, as well as the production of various plastic products. Inputs to these industries
include plastics material and resin products, as well as the research and development behind
the manufacturing. Purchasers are mostly within other manufacturing and industrial industries
IT/telecommunications: Industries specializing in performing computer programming and data
processing related services, including custom services, internet hosting, and other computer-
related services, comprise the core industries. This sector is particularly entrepreneurial-
focused, given the high number of proprietors and self-employed jobs. The industrial inputs
revolve around engineering, administrative, and other service-based industries required by the
core industries. The purchasers include a variety of industries, such as hospitals, that use the
core industries’ services.
J Robertson and Co. then worked with PMWDC and the leadership group to develop a strategic
action framework based on a regional economic strategy alignment matrix that identified the data-
driven gaps and opportunities. The next section will focus on these strategies, while further detail on
the data analysis behind these cluster strategies will be discussed later in the report.
Data-Driven Regional Economic Strategy Alignment The regional strategies framework represents a compendium of targeted initiatives the Pacific Mountain
partners can pursue to bolster core industry strengths and address gaps in critical supply chain inputs
and workforce capacity. The framework is not intended to serve as a comprehensive economic
development plan for the entire region or any individual partner. The primary goal, rather, is to identify
specific measures participating organizations can take to supplement or otherwise enhance existing
work plans.
The strategies presented here have been identified as priorities from among a more comprehensive list
of alternatives considered by the project leadership team. Each strategy and summary rationale is
derived from the Strategy Alternatives Matrix attached as Appendix A. The Strategy Alternatives Matrix

5
also provides a summarized listing of trends and data points driving productivity leakage and/or
emerging opportunities in each industry cluster.
In addition to an initial set of coordinating strategies to guide implementation of key recommendations
as well as future communication with partners, the project team has outlined specific initiatives to
address each of the five target industry clusters and workforce development opportunities therein. The
complete regional strategies framework includes six sections, as follows:
Coordinating Strategies
Food Manufacturing
Wood Products Manufacturing
Life Sciences
Chemical Products Manufacturing
IT/Telecommunications

6
While one additional target cluster was also studied, “entertainment and recreation,” the leadership
team opted to remove it from the regional strategies framework given the predominance of supply
chain industries compared to core industries, the lack of available data for significant tribal operations in
the region and the relatively unique form the industry takes in each part of the region. Recognizing its
economic value in the region participating Economic Development Councils will continue to pursue
development of arts, entertainment and recreation/tourism industries as part of their individual work
plans. Additionally, the Pacific Mountain Workforce Development Council recognizes tremendous
workforce development opportunities with the tribal communities in the region. Using this document
as the basis for dialogue PMWDC hopes to build and enhance existing partnerships.
Strategies are organized in a matrix format, beginning on the next page. Each of the 32 strategies is
preceded by an opportunity/rational statement, and followed by clarifying notes, a suggested lead
implementer and proposed timeline. The lead implementer is not expected to move the strategy ahead
on its own in some cases, but rather to spearhead or coordinate efforts with other partners.
7
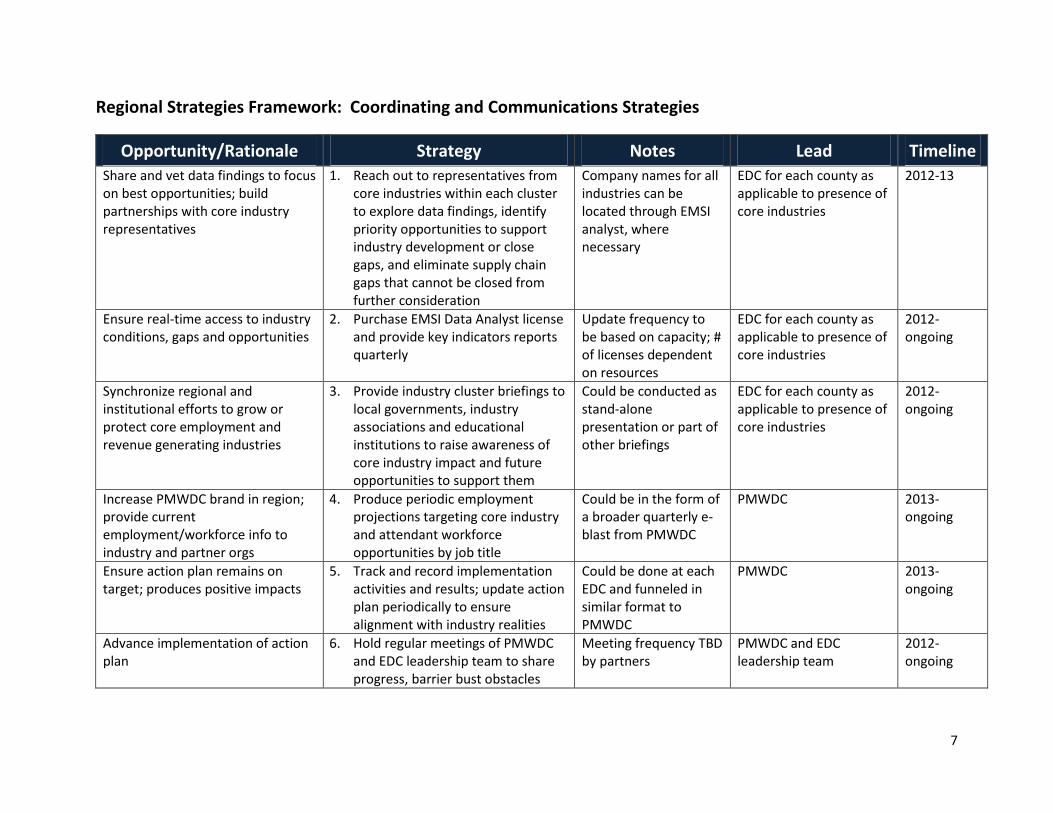
Regional Strategies Framework: Coordinating and Communications Strategies
Opportunity/Rationale Strategy Notes Lead Timeline
Share and vet data findings to focus on best opportunities; build partnerships with core industry representatives
1. Reach out to representatives from core industries within each cluster to explore data findings, identify priority opportunities to support industry development or close gaps, and eliminate supply chain gaps that cannot be closed from further consideration
Company names for all industries can be located through EMSI analyst, where necessary
EDC for each county as applicable to presence of core industries
2012-13
Ensure real-time access to industry conditions, gaps and opportunities
2. Purchase EMSI Data Analyst license and provide key indicators reports quarterly
Update frequency to be based on capacity; # of licenses dependent on resources
EDC for each county as applicable to presence of core industries
2012-ongoing
Synchronize regional and institutional efforts to grow or protect core employment and revenue generating industries
3. Provide industry cluster briefings to local governments, industry associations and educational institutions to raise awareness of core industry impact and future opportunities to support them
Could be conducted as stand-alone presentation or part of other briefings
EDC for each county as applicable to presence of core industries
2012-ongoing
Increase PMWDC brand in region; provide current employment/workforce info to industry and partner orgs
4. Produce periodic employment projections targeting core industry and attendant workforce opportunities by job title
Could be in the form of a broader quarterly e-blast from PMWDC
PMWDC 2013-ongoing
Ensure action plan remains on target; produces positive impacts
5. Track and record implementation activities and results; update action plan periodically to ensure alignment with industry realities
Could be done at each EDC and funneled in similar format to PMWDC
PMWDC 2013-ongoing
Advance implementation of action plan
6. Hold regular meetings of PMWDC and EDC leadership team to share progress, barrier bust obstacles
Meeting frequency TBD by partners
PMWDC and EDC leadership team
2012-ongoing

8
Regional Strategies Framework: Food Manufacturing
Opportunity/Rationale Strategy Notes Lead Timeline
Industry has had strongest job growth and represents largest total sales output; systems needed to protect continued viability and productivity
7. Develop a food safety/food security initiative to help expand employment, protect viability of core industries and prevent loss from bad food distributed at market
Coordinate with IMPACT Washington to elevate issues and opportunity, marshal resources
Lewis EDC 2013-ongoing
8. Ensure balance in critical area rules to protect growers without unnecessarily impacting other job and revenue producers
This is an ongoing PMWDC Board discussion – would require lead and/or partners to play an advocacy role
EDC leadership team 2012-ongoing
The region imports almost $80m in manufactured food goods annually. Many additional imports come from industrial inputs required by local food producers.
9. Partner with WSU Extension offices and other partners to develop a stop-leakage strategy targeting our dependence on external supplies of corn syrup, concentrate and other industrial inputs
Will require coordination with core industry partners
EDC for each county as applicable to presence of core industries
2013-ongoing
10. Research other animal food manufacturing to identify potential local opportunities
See above EDC leadership team 2013
Local institutions import a considerable percentage of food products; opportunity to increase local market share
11. Help market local food (farm to fork) to local hoteliers, restaurants and other institutions
Partnership opportunity with restaurant association, tourism promotion agencies, farms, fresh food movement, etc.
? 2012-ongoing

9
Regional Strategies Framework: Wood Products Manufacturing
Opportunity/Rationale Strategy Notes Lead Timeline
Despite setbacks, cluster remains top local exporter with highest job and earnings multiplier effect and best location quotient; also second highest sales output of all clusters with job growth projected for 2012-2018
12. Find ways to market and find new markets for forest product goods
Partner with the Forest Stewardship Council and other certifying orgs to identify additional timber tract and value added opportunities
EDC leadership team 2013-ongoing
13. Support land use regulations and land use designations that allow for wood products manufacturing throughout region
Goal: protect existing industrial/manufacturing sites while also allowing for micro-opportunities in infrastructure-served areas
EDC leadership team 2012-ongoing
Nearly $6m in shipping and freight purchased outside PMWDC region annually by wood products sector
14. Identify opportunities to provide more locally-sourced shipping and specialty freight services
Could be coordinated as broader outreach effort with TDL suppliers with core industry input
EDC leadership team 2013-ongoing
Core industries continue to import high percentages of certain industrial inputs
15. Work with core industries to reduce imports for wood preservation and paper mills
Start w/ core industries to find out why and if it can be solved
EDC leadership team 2013-ongoing
Greatest future growth potential projected to come from innovation and value added products
16. Research and potentially establish Innovation and Partnership Zone (IPZ) designation in all five counties
IPZ offers opportunity to market innovation sites; does not come with funding at present
EDC leadership team 2013-ongoing
Most job growth expected to occur in wood container and pallet manufacturing, and custom architectural and millwork manufacturing
17. Identify and develop cross-walk training for separating JBLM personnel in core industries that have high projected annual openings for skilled jobs
Not limited to JBLM work force; PMWDC to coordinate with employers to ID best way to supply qualified candidates
PMWDC 2013-ongoing

10
Regional Strategies Framework: Life Sciences
Opportunity/Rationale Strategy Notes Lead Timeline
Companies increasingly looking for single sites capable of supporting R&D, office, long term rehabilitative care, etc
18. Promote the adoption of land use policies that accommodate flexible zoning required for life sciences synergy
PMWDC region most likely to serve as satellite site for established industries; but may serve mix of 1099 workers as well – seeking shared space
EDC for each county as applicable to presence of core industries
2013-ongoing
Cluster has highest overall percentage of input imports (more than 50% of total); largest gaps are medical laboratories (92%); diagnostic imaging centers (81%); electromedical and electrotherapeutic apparatus manufacturing (80%); Overall, the region imports $429 million worth of core life science goods and services.
19. Research and pursue opportunities to build presence of medical and dental laboratories and diagnostic imaging centers
Outreach to providers, users to determine if an how the gap can be closed
EDC leadership team 2013-ongoing
20. Assess viability of recruiting or growing electrotherapeutic apparatus manufacturer
See above EDC leadership team 2013
$13m of industrial input purchased outside region: at, $6.5m, administrative management and general management consulting services is the largest import
21. Coordinate with local health care providers to understand and address significant importation of administrative and general management services
Some of these services may be contracted outside due to regional provider contracts or specialized consulting; necessary?
EDC leadership team 2013
Gaps in workforce compatibility are particularly wide: R&D in physical, engineering, and life sciences (except biotech) (30%); general medical / surgical hospitals (26%)
22. Coordinate with local health care providers to develop a strategic approach to closing gap in trained personnel for engineering, general medical and surgical hospitals
While most workforce issues/opportunities will be addressed by PMWDC, this category will require a full-court-press
PMWDC and EDC leadership team
2013-ongoing
11
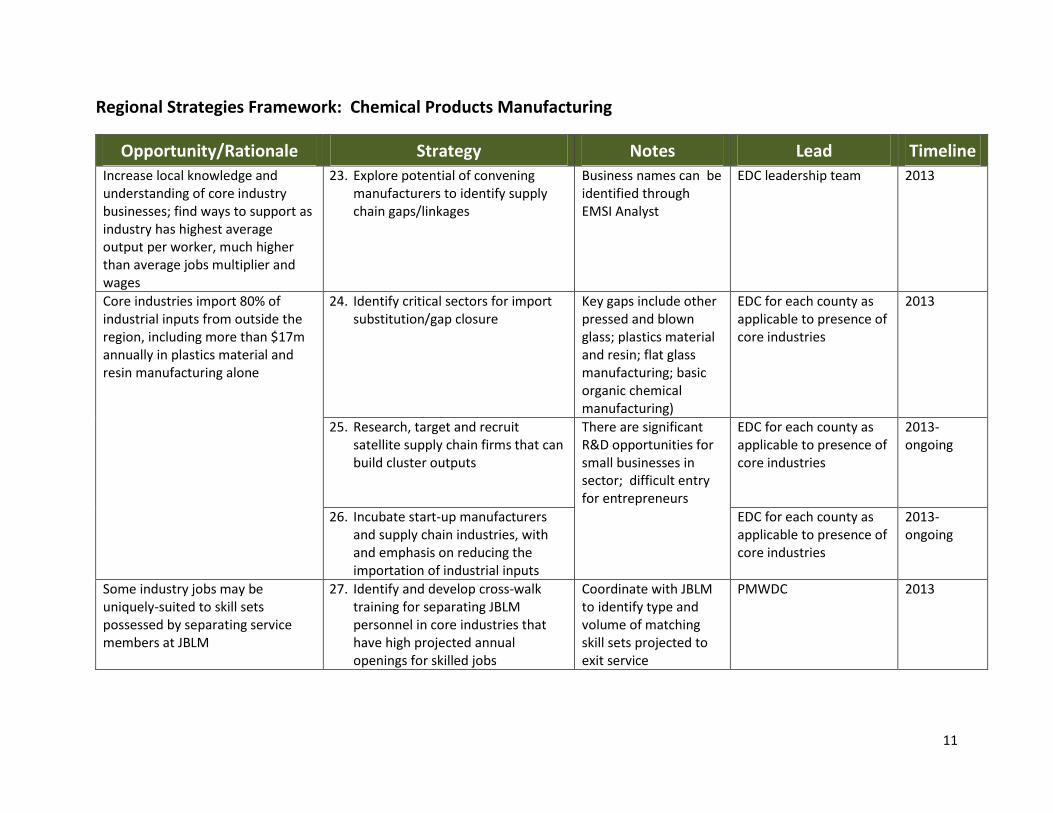
Regional Strategies Framework: Chemical Products Manufacturing
Opportunity/Rationale Strategy Notes Lead Timeline
Increase local knowledge and understanding of core industry businesses; find ways to support as industry has highest average output per worker, much higher than average jobs multiplier and wages
23. Explore potential of convening manufacturers to identify supply chain gaps/linkages
Business names can be identified through EMSI Analyst
EDC leadership team 2013
Core industries import 80% of industrial inputs from outside the region, including more than $17m annually in plastics material and resin manufacturing alone
24. Identify critical sectors for import substitution/gap closure
Key gaps include other pressed and blown glass; plastics material and resin; flat glass manufacturing; basic organic chemical manufacturing)
EDC for each county as applicable to presence of core industries
2013
25. Research, target and recruit satellite supply chain firms that can build cluster outputs
There are significant R&D opportunities for small businesses in sector; difficult entry for entrepreneurs
EDC for each county as applicable to presence of core industries
2013-ongoing
26. Incubate start-up manufacturers and supply chain industries, with and emphasis on reducing the importation of industrial inputs
EDC for each county as applicable to presence of core industries
2013-ongoing
Some industry jobs may be uniquely-suited to skill sets possessed by separating service members at JBLM
27. Identify and develop cross-walk training for separating JBLM personnel in core industries that have high projected annual openings for skilled jobs
Coordinate with JBLM to identify type and volume of matching skill sets projected to exit service
PMWDC 2013

12
Regional Strategies Framework: IT/Telecommunications
Opportunity/Rationale Strategy Notes Lead Timeline
Industry growth will occur where capacity is strong and growing; access to high speed communications system allows more fluid siting (i.e. rural areas)
28. Determine and promote telecommunications capacity to support and site rural telework centers
Resulting inventory can also be used as marketing supplement in this and other industry clusters
EDC leadership team 2013
Opportunity to build on recent growth of “computer system design services” and other related core sectors by showing momentum and marketing available locations
29. Inventory, package and market locally available office space to IT/Telecom businesses looking to grow or relocate
In addition to helping grow IT/Tel-com industry, this strategy can help repurpose existing office buildings being vacated as government downsizes
EDC leadership team 2013-ongoing
30. Market Washington State Information Services facility (Olympia) to data warehousers/computer system management firms
Thurston EDC 2013
High rate of participation for entrepreneurs, high start-up costs = opportunity to incubate next generation workforce/employer base
31. Explore the feasibility/desirability of establishing one or more business tech innovation centers/incubators to build momentum in cluster
Similar centers created with support from employers who need specialized skill sets; could also include investment funds (e.g. angel network, etc.)
EDC leadership team 2014
Opportunity to coordinate with local educational partners to build clustered training programs for high-demand IT and engineering jobs
32. Market existing, and supplement where needed, training programs that prepare local workers for high-skilled IT jobs with high annual projected openings
Job growth: Software Engineers; Network Systems and Data Communications Analysts; Network and Systems Administrators
PMWDC and EDC leadership team
2013-ongoing
13
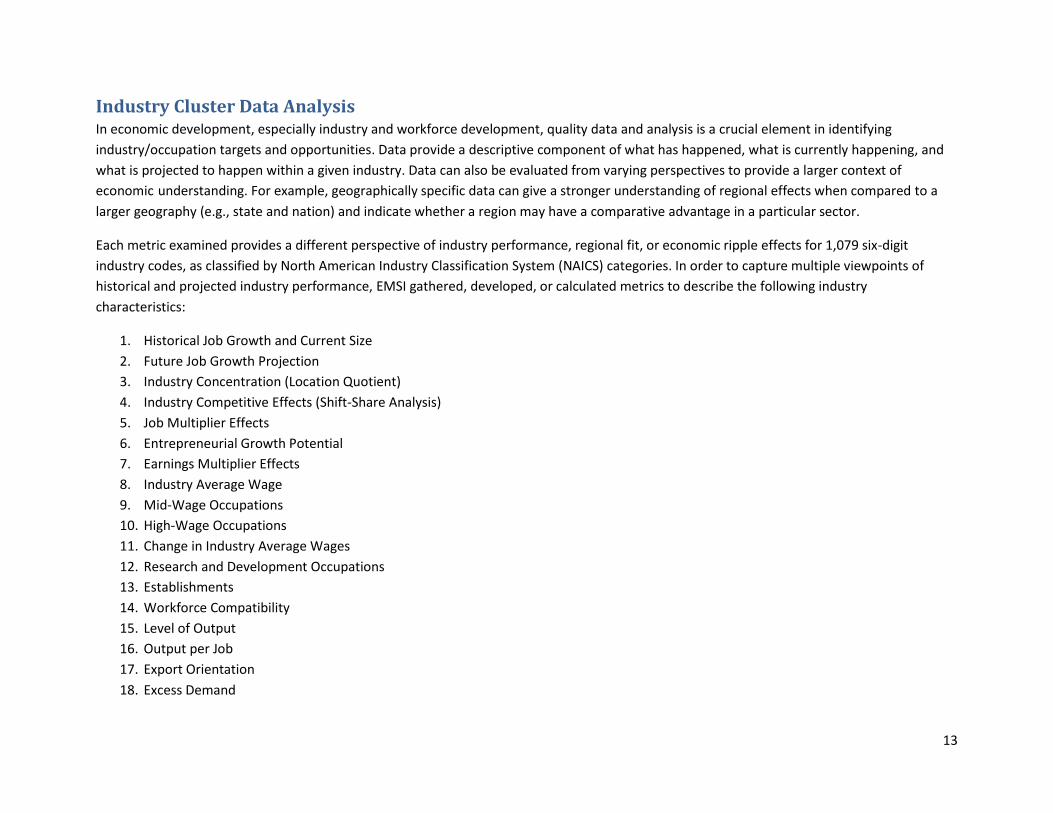
Industry Cluster Data Analysis In economic development, especially industry and workforce development, quality data and analysis is a crucial element in identifying
industry/occupation targets and opportunities. Data provide a descriptive component of what has happened, what is currently happening, and
what is projected to happen within a given industry. Data can also be evaluated from varying perspectives to provide a larger context of
economic understanding. For example, geographically specific data can give a stronger understanding of regional effects when compared to a
larger geography (e.g., state and nation) and indicate whether a region may have a comparative advantage in a particular sector.
Each metric examined provides a different perspective of industry performance, regional fit, or economic ripple effects for 1,079 six-digit
industry codes, as classified by North American Industry Classification System (NAICS) categories. In order to capture multiple viewpoints of
historical and projected industry performance, EMSI gathered, developed, or calculated metrics to describe the following industry
characteristics:
1. Historical Job Growth and Current Size
2. Future Job Growth Projection
3. Industry Concentration (Location Quotient)
4. Industry Competitive Effects (Shift-Share Analysis)
5. Job Multiplier Effects
6. Entrepreneurial Growth Potential
7. Earnings Multiplier Effects
8. Industry Average Wage
9. Mid-Wage Occupations
10. High-Wage Occupations
11. Change in Industry Average Wages
12. Research and Development Occupations
13. Establishments
14. Workforce Compatibility
15. Level of Output
16. Output per Job
17. Export Orientation
18. Excess Demand
14
See Appendix B for the definitions of the above variables used in the targeted industry analysis. Out of the list of metrics, the leadership team
prioritized shiftshare, earnings multiplier, and jobs multiplier. The consulting team also focused on projected growth as well as industries with
average wages above $15.00 per hour.
Cluster Analysis and Supply Chain Overview Before diving into the data results, it is necessary to first describe the components of the clusters. The metrics listed above were initially used to
select the industries that serve as the hub, or core, of each of the six clusters. Core industries seldom meet all selection criteria; however, those
in which most (or some) of this criteria are met were ultimately selected. Additionally, the identified core industries are not all-encompassing.
For instance, chemical product and plastics manufacturing focuses on a smaller number of high-potential NAICS categories that have increasing
employment, have high job multipliers, and/or show strong competitive effects in the surrounding region.
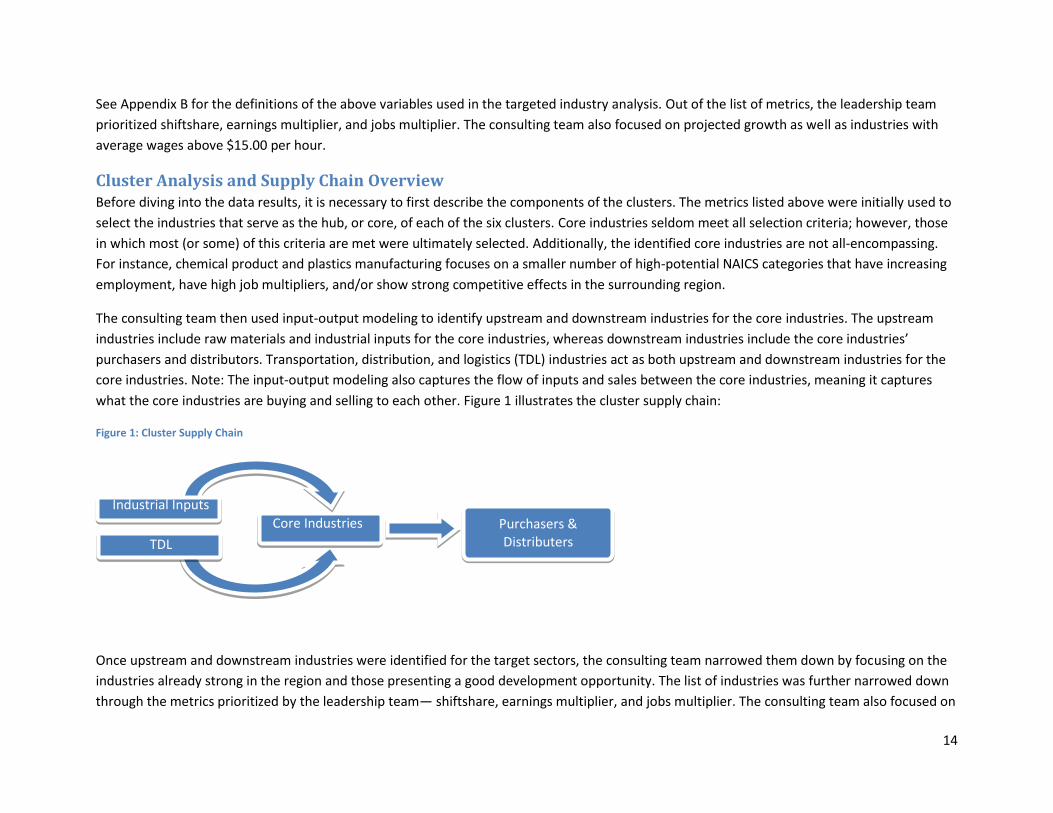
The consulting team then used input-output modeling to identify upstream and downstream industries for the core industries. The upstream
industries include raw materials and industrial inputs for the core industries, whereas downstream industries include the core industries’
purchasers and distributors. Transportation, distribution, and logistics (TDL) industries act as both upstream and downstream industries for the
core industries. Note: The input-output modeling also captures the flow of inputs and sales between the core industries, meaning it captures
what the core industries are buying and selling to each other. Figure 1 illustrates the cluster supply chain:
Figure 1: Cluster Supply Chain
Once upstream and downstream industries were identified for the target sectors, the consulting team narrowed them down by focusing on the
industries already strong in the region and those presenting a good development opportunity. The list of industries was further narrowed down
through the metrics prioritized by the leadership team— shiftshare, earnings multiplier, and jobs multiplier. The consulting team also focused on
Core Industries
Industrial Inputs
TDL
Purchasers &
Distributers
15
projected growth, industries with average wages above $15.00 per hour, as well as the supply chain characteristics of level of sales from and the
imports to the core industries.
In addition to analyzing the clusters by how the industries are performing given certain metrics, EMSI took a further look at the occupations and
workforce required within the core industries of the clusters. This was done by looking at the staffing patterns of the industries and the level of
education they typically require. Also, since it is critical for the region to be well-aligned with supplying the core industries with the necessary
mid- to high-skilled labor, the consultants determined whether postsecondary education programs exist within the region to provide the
required education.
Further data and description are provided in the following sections of the report for each target cluster. In order to summarize cluster
information, data are aggregated by one of four roles in the supply chain: the core industries; inputs (raw materials and industrial inputs); TDL;
and purchasers and distributors. Detailed core industry data are presented throughout the report, but detailed cluster data are only available in
Appendix C. Employment distribution maps by county are available in Appendix D, as well as occupation and education data for each cluster in
Appendix E. Finally, note that only data on the prioritized metrics are provided in the report tables. Detailed cluster data for all of the metrics are
provided in separate excel tables.
Cluster Summary Before digging into the data results for each of the clusters, it is important to provide a brief overview of all of the clusters. Table 1 presents each
cluster’s data results for just the core industries as well as the cluster as a whole. Note that the entertainment and recreation cluster is included
in the table. However, due to the broad focus of the cluster as well as lack of supporting data, the leadership group chose to remove this cluster
from the strategy focus and will address it instead within their individual counties/areas. Appendix F holds the available regional data for the
entertainment and recreation cluster.
As seen in the table, in terms of the current size of each cluster, the entertainment and recreation cluster is currently the largest cluster, and
chemical product and plastics manufacturing is the smallest. The latter is also the smallest in terms of the size of the core industries, but the core
industries also have one of the highest jobs multipliers, which points to more development potential and relevant supply-chain linkages within
the region. The life sciences core industries are projected to add the most jobs from 2012 to 2018. While life sciences already has one of the
highest projections, the growth within the core industries could also lead to additional value-add benefits (e.g. sales, employment and earnings)
within the rest of the cluster.
16
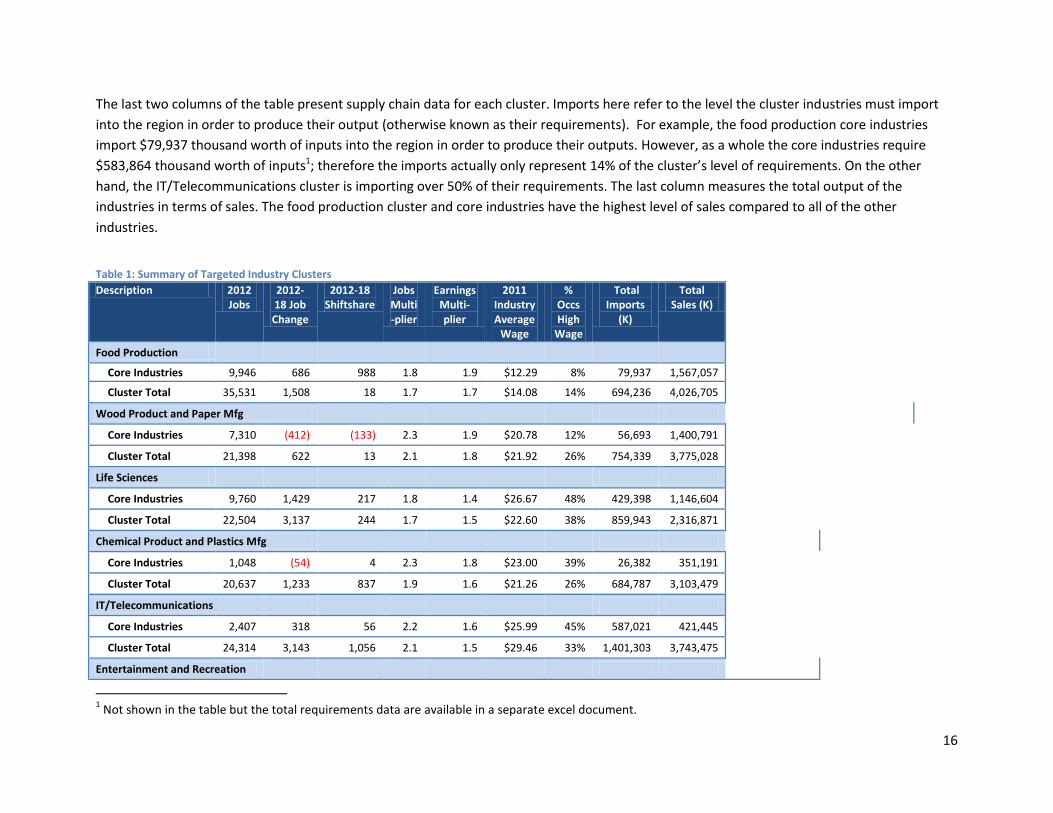
The last two columns of the table present supply chain data for each cluster. Imports here refer to the level the cluster industries must import
into the region in order to produce their output (otherwise known as their requirements). For example, the food production core industries
import $79,937 thousand worth of inputs into the region in order to produce their outputs. However, as a whole the core industries require
$583,864 thousand worth of inputs1; therefore the imports actually only represent 14% of the cluster’s level of requirements. On the other
hand, the IT/Telecommunications cluster is importing over 50% of their requirements. The last column measures the total output of the
industries in terms of sales. The food production cluster and core industries have the highest level of sales compared to all of the other
industries.
Table 1: Summary of Targeted Industry Clusters
Description 2012 Jobs
2012-18 Job Change
2012-18 Shiftshare
Jobs Multi-plier
Earnings Multi-plier
2011 Industry Average
Wage
% Occs High
Wage
Total Imports
(K)
Total Sales (K)
Food Production
Core Industries 9,946 686 988 1.8 1.9 $12.29 8% 79,937 1,567,057
Cluster Total 35,531 1,508 18 1.7 1.7 $14.08 14% 694,236 4,026,705
Wood Product and Paper Mfg
Core Industries 7,310 (412) (133) 2.3 1.9 $20.78 12% 56,693 1,400,791
Cluster Total 21,398 622 13 2.1 1.8 $21.92 26% 754,339 3,775,028
Life Sciences
Core Industries 9,760 1,429 217 1.8 1.4 $26.67 48% 429,398 1,146,604
Cluster Total 22,504 3,137 244 1.7 1.5 $22.60 38% 859,943 2,316,871
Chemical Product and Plastics Mfg
Core Industries 1,048 (54) 4 2.3 1.8 $23.00 39% 26,382 351,191
Cluster Total 20,637 1,233 837 1.9 1.6 $21.26 26% 684,787 3,103,479
IT/Telecommunications
Core Industries 2,407 318 56 2.2 1.6 $25.99 45% 587,021 421,445
Cluster Total 24,314 3,143 1,056 2.1 1.5 $29.46 33% 1,401,303 3,743,475
Entertainment and Recreation
1 Not shown in the table but the total requirements data are available in a separate excel document.
17
Core Industries 9,089 527 146 1.6 1.5 $19.80 11% 175,407 318,278
Cluster Total 39,174 3,380 103 1.6 1.5 $18.53 19% 923,594 3,359,644
Source: EMSI Complete Employment – 1.2012; EMSI input-output model calculations
Food production The food production cluster is comprised of core industries involved in agriculture production and fishing, as well as the transformation of the
agriculture products, livestock, fish, and other consumable natural resources into products for immediate and final consumption. The cluster
contains supply chain components ranging from agribusiness, transportation and distribution, and final consumption such as supermarkets and
restaurants.
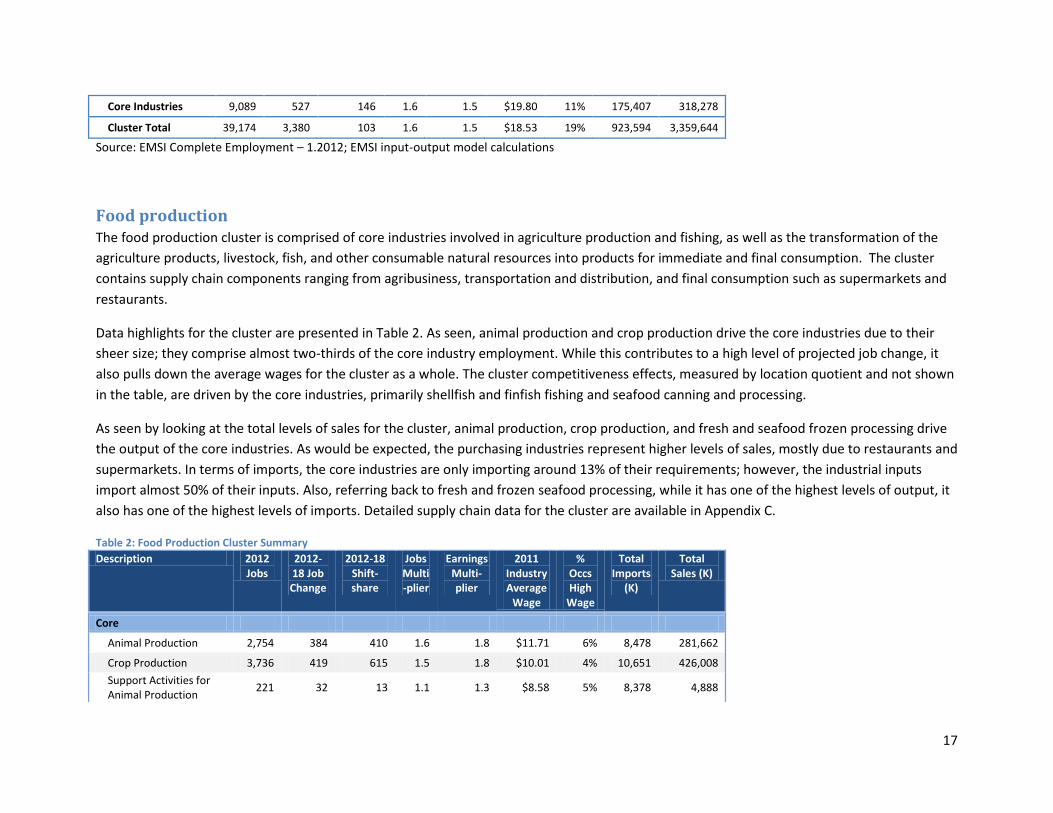
Data highlights for the cluster are presented in Table 2. As seen, animal production and crop production drive the core industries due to their
sheer size; they comprise almost two-thirds of the core industry employment. While this contributes to a high level of projected job change, it
also pulls down the average wages for the cluster as a whole. The cluster competitiveness effects, measured by location quotient and not shown
in the table, are driven by the core industries, primarily shellfish and finfish fishing and seafood canning and processing.
As seen by looking at the total levels of sales for the cluster, animal production, crop production, and fresh and seafood frozen processing drive
the output of the core industries. As would be expected, the purchasing industries represent higher levels of sales, mostly due to restaurants and
supermarkets. In terms of imports, the core industries are only importing around 13% of their requirements; however, the industrial inputs
import almost 50% of their inputs. Also, referring back to fresh and frozen seafood processing, while it has one of the highest levels of output, it
also has one of the highest levels of imports. Detailed supply chain data for the cluster are available in Appendix C.
Table 2: Food Production Cluster Summary
Description 2012 Jobs
2012-18 Job Change
2012-18 Shift-share
Jobs Multi-plier
Earnings Multi-plier
2011 Industry Average
Wage
% Occs High
Wage
Total Imports
(K)
Total Sales (K)
Core
Animal Production 2,754 384 410 1.6 1.8 $11.71 6% 8,478 281,662
Crop Production 3,736 419 615 1.5 1.8 $10.01 4% 10,651 426,008
Support Activities for Animal Production
221 32 13 1.1 1.3 $8.58 5% 8,378 4,888
18
Fruit and Vegetable Canning
123 (16) (8) 3.7 2.7 $25.03 16% 7,489 62,610
Wineries 133 29 13 2.5 2.7 $15.04 6% 3,932 37,563
Coffee and Tea Mfg 62 11 5 2.5 2.8 $11.84 21% 2,504 13,128
Fresh and Frozen Seafood Processing
944 23 (38) 2.6 2.8 $11.74 15% 19,857 316,048
Finfish Fishing 552 (83) (36) 1.3 1.3 $17.37 7% 402 32,741
Shellfish Fishing 680 (15) 32 1.3 1.3 $15.27 11% 317 36,083
All Other Misc Food Mfg 39 (7) (4) 4.3 3.1 $21.09 25% 1,819 21,839
Soft Drink Mfg 145 (10) (12) 3.4 2.3 $25.59 23% 5,575 111,802
Frozen Fruit, Juice, and Vegetable Mfg
266 (2) 29 3.6 2.8 $20.33 18% 1,016 131,442
Dried and Dehydrated Food Mfg
106 5 19 2.7 2.6 $16.23 16% 464 34,750
Seafood Canning 91 (38) (3) 2.2 2.7 $9.66 15% 2,718 26,391
Breweries 65 (46) (47) 2.1 2.1 $15.13 22% 5,868 22,992
Ice Mfg 29 0 (1) 1.8 2.4 $10.18 5% 467 7,112
Core totals 9,946 686 988 1.8 1.9 $12.29 8% 79,937 1,567,057
Inputs 1,533 144 (21) 2.5 1.8 $31.36 44% 235,717 395,352
Purchasers and Distributors
21,432 617 (834) 1.5 1.6 $12.89 16% 318,107 1,699,047
TDL 2,620 61 (115) 1.8 1.6 $20.57 10% 60,475 365,249
Cluster Total 35,531 1,508 18 1.7 1.7 $14.08 14% 694,236 4,026,705
Source: EMSI Complete Employment – 1.2012; EMSI input-output model calculations
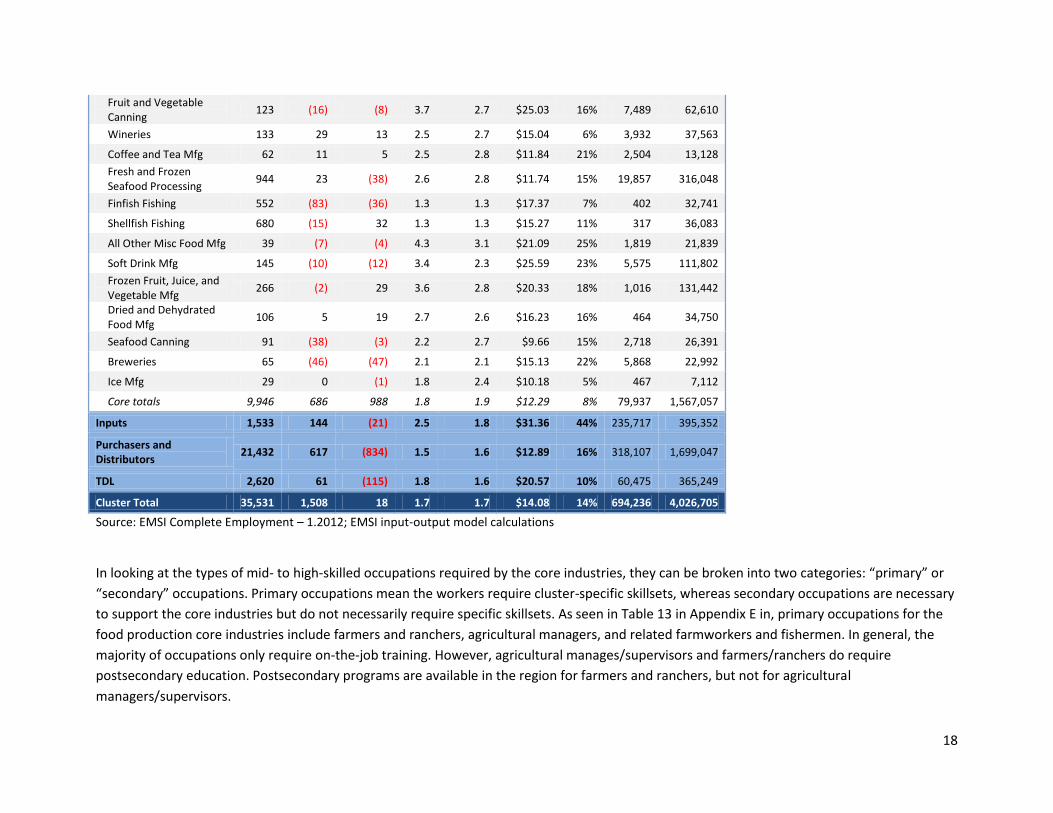
In looking at the types of mid- to high-skilled occupations required by the core industries, they can be broken into two categories: “primary” or
“secondary” occupations. Primary occupations mean the workers require cluster-specific skillsets, whereas secondary occupations are necessary
to support the core industries but do not necessarily require specific skillsets. As seen in Table 13 in Appendix E in, primary occupations for the
food production core industries include farmers and ranchers, agricultural managers, and related farmworkers and fishermen. In general, the
majority of occupations only require on-the-job training. However, agricultural manages/supervisors and farmers/ranchers do require
postsecondary education. Postsecondary programs are available in the region for farmers and ranchers, but not for agricultural
managers/supervisors.

19
Wood product and paper manufacturing The wood product and paper manufacturing cluster is comprised of core industries ranging from logging and sawmills to different types of wood
manufacturing. Since logging and sawmills are represented within the core industries, the industrial inputs include the engineering and industrial
machinery that go into the core industries. Purchasers and distributors include broad industries such as hospitals, which require a wide range of
wood and paper products, to narrower industries, such as soft drink manufacturing, which primarily buy specific products (i.e., cardboard).
In looking at Table 3, the core industries as a whole are projected to experience negative job growth between 2012 and 2018. However, a few
industries, such as hardwood veneer and plywood manufacturing and wood container and pallet manufacturing are expected to grow during
that time. The cluster as a whole is also expected to have negative comparative effects, as measured through shiftshare. These are primarily
driven by logging and softwood veneer manufacturing. However, again there are a few exceptions, such as hardwood veneer manufacturing and
sawmills.
The logging and sawmill industries comprise almost 50% of the total output for the wood product and paper manufacturing core industries.
These industries import very little of their requirements, which demonstrates their existing strength within the region. In fact, as a whole, the
core industries import a fairly small amount (10%) into the region. The industrial inputs, on the other hand, import over 60% of their
requirements into the region. These include engineering services and other value-add manufacturing industries. Detailed supply chain data for
the cluster are available in Appendix C.
Table 3: Wood Product and Paper Manufacturing Cluster Summary
Description 2012 Jobs
2012-18 Job Change
2012-18 Shiftshare
Jobs Multi-plier
Earnings Multi-plier
2011 Industry Average
Wage
% Occs High
Wage
Total Imports
(K)
Total Sales (K)
Core
Logging 1,663 (222) (155) 2.2 1.7 $20.86 9% 11,477 282,960
Wood Preservation 25 3 3 1.9 2.0 $14.86 10% 6,263 2,419
Sawmills 2,341 (58) 206 2.7 2.0 $23.54 9% 5,147 412,043
Paper (except Newsprint) Mills
58 (51) (35) 2.6 2.0 $26.25 8% 6,876 28,307
Paperboard Mills 38 (30) (26) 3.5 1.9 $44.84 95% 2,452 21,513

20
Other Millwork (including Flooring)
112 (46) (25) 1.7 2.0 $11.99 7% 2,404 14,896
Wood Window and Door Mfg
251 (91) (64) 2.2 2.0 $17.10 13% 1,493 50,417
Hardwood Veneer and Plywood Mfg
198 76 68 2.2 2.0 $17.42 3% 620 29,748
Softwood Veneer and Plywood Mfg
578 (79) (170) 2.5 2.0 $22.68 4% 461 139,658
Corrugated and Solid Fiber Box Mfg
151 (44) (27) 3.6 2.4 $31.77 98% 3,261 83,571
Cut Stock, Resawing Lumber, and Planing
47 (26) (21) 2.1 2.0 $17.40 9% 456 10,479
Wood Kitchen Cabinet and Countertop Mfg
238 (2) (7) 1.7 1.6 $16.87 11% 1,835 24,857
Wood Container and Pallet Mfg
204 114 53 1.9 2.1 $12.27 8% 1,254 32,421
Pulp Mills 207 7 8 3.2 2.1 $30.83 8% 116 71,526
Custom Architectural Woodwork and Millwork Mfg
47 64 40 2.3 3.1 $9.82 37% 2,959 10,017
Support Activities for Forestry
622 6 (12) 1.2 1.3 $12.99 17% 256 25,245
All Other Miscellaneous Wood Product Mfg
47 (9) (4) 2.2 2.1 $18.21 6% 340 7,892
Coated and Laminated Paper Mfg
60 11 14 2.1 2.0 $18.71 0% 8,218 15,359
Truss Mfg 79 (27) (10) 1.9 2.1 $12.96 48% 350 12,362
Prefabricated Wood Building Mfg
96 0 25 1.7 2.0 $11.56 9% 311 11,031
Engineered Wood Member (except Truss) Mfg
99 (15) 11 2.6 2.1 $21.97 3% 36 26,318
Timber Tract Operations
55 7 5 6.9 2.9 $35.75 18% 80 57,474
Forest Nurseries and Gathering of Forest Products
94 0 (9) 2.8 3.0 $10.69 20% 27 30,281
Core Totals 7,310 (412) (133) 2.3 1.9 $20.78 12% 56,693 1,400,791
Inputs 2,361 367 102 2.2 1.5 $30.26 46% 345,340 446,949
21
Purchasers and Distributors
8,994 602 166 2.0 1.8 $21.12 36% 258,786 1,551,032
TDL 2,733 65 (121) 1.8 1.6 $20.42 11% 93,521 376,257
Cluster Total 21,39
8 622 13 2.1 1.8 $21.92 26% 754,339 3,775,028
Source: EMSI Complete Employment – 1.2012; EMSI input-output model calculations
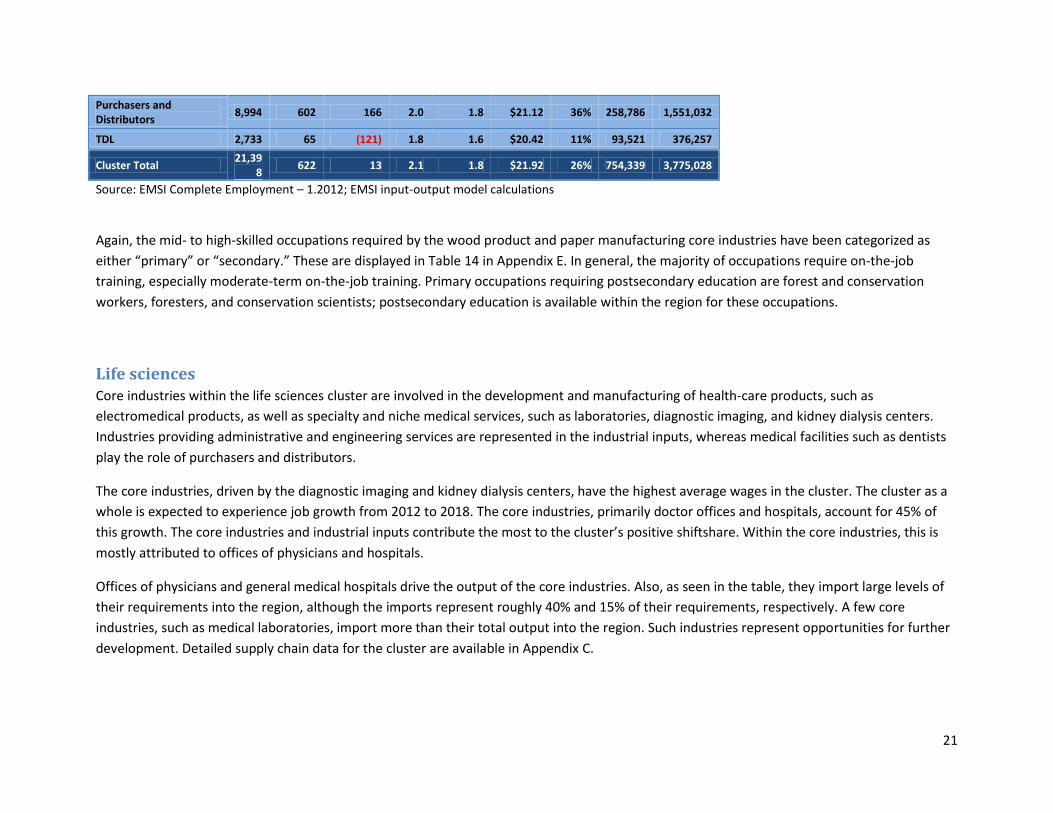
Again, the mid- to high-skilled occupations required by the wood product and paper manufacturing core industries have been categorized as
either “primary” or “secondary.” These are displayed in Table 14 in Appendix E. In general, the majority of occupations require on-the-job
training, especially moderate-term on-the-job training. Primary occupations requiring postsecondary education are forest and conservation
workers, foresters, and conservation scientists; postsecondary education is available within the region for these occupations.
Life sciences Core industries within the life sciences cluster are involved in the development and manufacturing of health-care products, such as
electromedical products, as well as specialty and niche medical services, such as laboratories, diagnostic imaging, and kidney dialysis centers.
Industries providing administrative and engineering services are represented in the industrial inputs, whereas medical facilities such as dentists
play the role of purchasers and distributors.
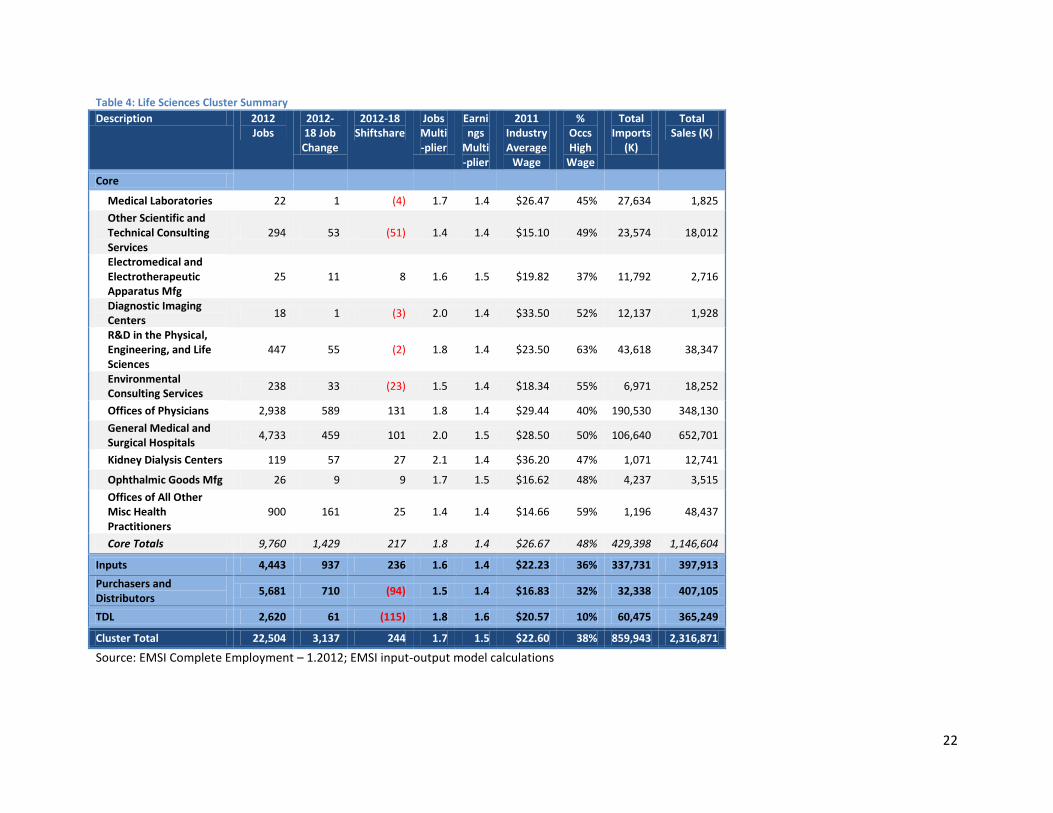
The core industries, driven by the diagnostic imaging and kidney dialysis centers, have the highest average wages in the cluster. The cluster as a
whole is expected to experience job growth from 2012 to 2018. The core industries, primarily doctor offices and hospitals, account for 45% of
this growth. The core industries and industrial inputs contribute the most to the cluster’s positive shiftshare. Within the core industries, this is
mostly attributed to offices of physicians and hospitals.
Offices of physicians and general medical hospitals drive the output of the core industries. Also, as seen in the table, they import large levels of
their requirements into the region, although the imports represent roughly 40% and 15% of their requirements, respectively. A few core
industries, such as medical laboratories, import more than their total output into the region. Such industries represent opportunities for further
development. Detailed supply chain data for the cluster are available in Appendix C.
22
Table 4: Life Sciences Cluster Summary
Description 2012 Jobs
2012-18 Job Change
2012-18 Shiftshare
Jobs Multi-plier
Earnings
Multi-plier
2011 Industry Average
Wage
% Occs High
Wage
Total Imports
(K)
Total Sales (K)
Core
Medical Laboratories 22 1 (4) 1.7 1.4 $26.47 45% 27,634 1,825
Other Scientific and Technical Consulting Services
294 53 (51) 1.4 1.4 $15.10 49% 23,574 18,012
Electromedical and Electrotherapeutic Apparatus Mfg
25 11 8 1.6 1.5 $19.82 37% 11,792 2,716
Diagnostic Imaging Centers
18 1 (3) 2.0 1.4 $33.50 52% 12,137 1,928
R&D in the Physical, Engineering, and Life Sciences
447 55 (2) 1.8 1.4 $23.50 63% 43,618 38,347
Environmental Consulting Services
238 33 (23) 1.5 1.4 $18.34 55% 6,971 18,252
Offices of Physicians 2,938 589 131 1.8 1.4 $29.44 40% 190,530 348,130
General Medical and Surgical Hospitals
4,733 459 101 2.0 1.5 $28.50 50% 106,640 652,701
Kidney Dialysis Centers 119 57 27 2.1 1.4 $36.20 47% 1,071 12,741
Ophthalmic Goods Mfg 26 9 9 1.7 1.5 $16.62 48% 4,237 3,515
Offices of All Other Misc Health Practitioners
900 161 25 1.4 1.4 $14.66 59% 1,196 48,437
Core Totals 9,760 1,429 217 1.8 1.4 $26.67 48% 429,398 1,146,604
Inputs 4,443 937 236 1.6 1.4 $22.23 36% 337,731 397,913
Purchasers and Distributors
5,681 710 (94) 1.5 1.4 $16.83 32% 32,338 407,105
TDL 2,620 61 (115) 1.8 1.6 $20.57 10% 60,475 365,249
Cluster Total 22,504 3,137 244 1.7 1.5 $22.60 38% 859,943 2,316,871
Source: EMSI Complete Employment – 1.2012; EMSI input-output model calculations
23
As a whole, the life sciences cluster requires a highly skilled workforce, one of the highest out of all of the identified targeted industry clusters.
This was measured through the workforce compatibility metric, which takes into account the higher-skilled labor needs of an industry (see
Appendix B for a definition). As displayed in Table 15 of Appendix E, the occupation analysis confirmed these data-- the majority of priority
occupations require higher levels of postsecondary education. Priority occupations include physicians and surgeons, nurses, medical assistants,
medical secretaries, and nursing aides. Regional postsecondary programs were available for most of the priority occupations, with the exception
of those requiring a first professional degree such as physicians and surgeons.
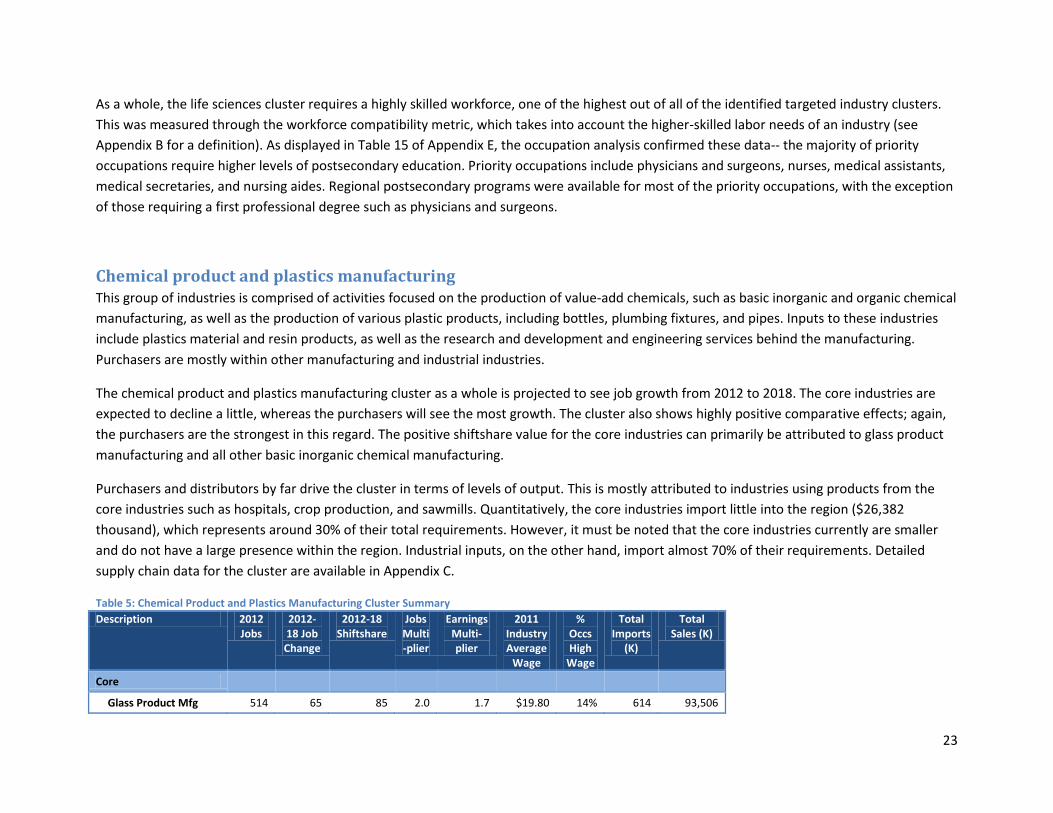
Chemical product and plastics manufacturing This group of industries is comprised of activities focused on the production of value-add chemicals, such as basic inorganic and organic chemical
manufacturing, as well as the production of various plastic products, including bottles, plumbing fixtures, and pipes. Inputs to these industries
include plastics material and resin products, as well as the research and development and engineering services behind the manufacturing.
Purchasers are mostly within other manufacturing and industrial industries.
The chemical product and plastics manufacturing cluster as a whole is projected to see job growth from 2012 to 2018. The core industries are
expected to decline a little, whereas the purchasers will see the most growth. The cluster also shows highly positive comparative effects; again,
the purchasers are the strongest in this regard. The positive shiftshare value for the core industries can primarily be attributed to glass product
manufacturing and all other basic inorganic chemical manufacturing.
Purchasers and distributors by far drive the cluster in terms of levels of output. This is mostly attributed to industries using products from the
core industries such as hospitals, crop production, and sawmills. Quantitatively, the core industries import little into the region ($26,382
thousand), which represents around 30% of their total requirements. However, it must be noted that the core industries currently are smaller
and do not have a large presence within the region. Industrial inputs, on the other hand, import almost 70% of their requirements. Detailed
supply chain data for the cluster are available in Appendix C.
Table 5: Chemical Product and Plastics Manufacturing Cluster Summary
Description 2012 Jobs
2012-18 Job Change
2012-18 Shiftshare
Jobs Multi-plier
Earnings Multi-plier
2011 Industry Average
Wage
% Occs High
Wage
Total Imports
(K)
Total Sales (K)
Core
Glass Product Mfg 514 65 85 2.0 1.7 $19.80 14% 614 93,506

24
Made of Purchased Glass
All Other Misc Chemical Product and Preparation Mfg
122 (12) (25) 3.0 2.2 $25.89 57% 1,623 75,403
All Other Basic Inorganic Chemical Mfg
67 (23) (13) 5.2 2.2 $51.16 25% 13,961 89,090
All Other Basic Organic Chemical Mfg
40 23 28 1.7 1.5 $17.90 19% 3,430 4,896
Other Pressed and Blown Glass and Glassware Mfg
13 3 9 2.0 1.8 $20.04 10% 5,002 3,017
Plastics Bottle Mfg 83 (35) (44) 1.9 1.5 $25.67 100% 1,081 26,292
Plastics Pipe and Pipe Fitting Mfg
124 (7) (5) 1.8 1.5 $22.58 59% 494 35,853
Plastics Plumbing Fixture Mfg
85 (68) (31) 1.8 1.7 $16.84 99% 177 23,133
Core Totals 1,048 (54) 4 2.3 1.8 $23.00 39% 26,382 351,191
Inputs 3,714 366 101 1.7 1.5 $21.81 35% 408,375 406,989
Purchasers and Distributors
13,255 860 847 2.0 1.7 $21.11 26% 189,556 1,980,050
TDL 2,620 61 (115) 1.8 1.6 $20.57 10% 60,475 365,249
Cluster Total 20,637 1,233 837 1.9 1.6 $21.26 26% 684,787 3,103,479
Source: EMSI Complete Employment – 1.2012; EMSI input-output model calculations
In general, the core industries within the chemical product and plastics manufacturing cluster require on-the-job training, especially moderate-
term on-the-job training (see Table 16 in Appendix E). Since the core industries are currently not well established within the region, there are not
many jobs, nonetheless annual job openings, within the priority occupations. Of the priority occupations, chemical plant and systems operators
are the only ones requiring higher education and skills levels, but no relevant postsecondary education programs are present within the region.
25
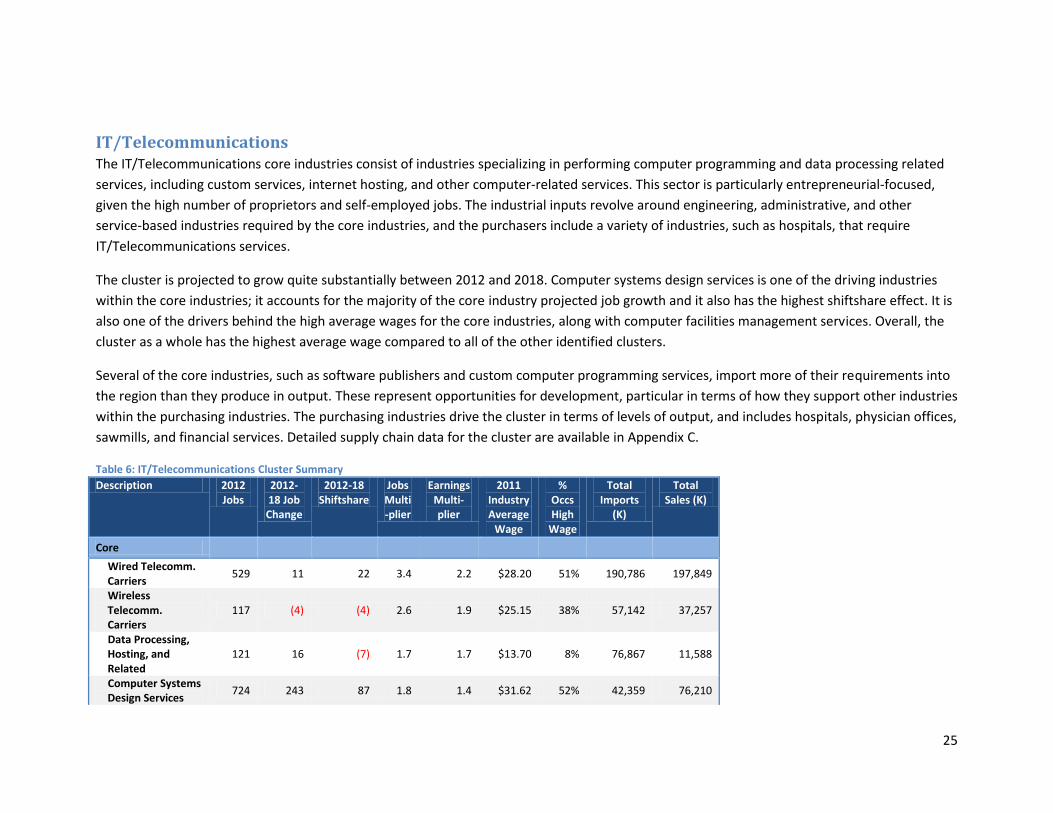
IT/Telecommunications The IT/Telecommunications core industries consist of industries specializing in performing computer programming and data processing related
services, including custom services, internet hosting, and other computer-related services. This sector is particularly entrepreneurial-focused,
given the high number of proprietors and self-employed jobs. The industrial inputs revolve around engineering, administrative, and other
service-based industries required by the core industries, and the purchasers include a variety of industries, such as hospitals, that require
IT/Telecommunications services.
The cluster is projected to grow quite substantially between 2012 and 2018. Computer systems design services is one of the driving industries
within the core industries; it accounts for the majority of the core industry projected job growth and it also has the highest shiftshare effect. It is
also one of the drivers behind the high average wages for the core industries, along with computer facilities management services. Overall, the
cluster as a whole has the highest average wage compared to all of the other identified clusters.
Several of the core industries, such as software publishers and custom computer programming services, import more of their requirements into
the region than they produce in output. These represent opportunities for development, particular in terms of how they support other industries
within the purchasing industries. The purchasing industries drive the cluster in terms of levels of output, and includes hospitals, physician offices,
sawmills, and financial services. Detailed supply chain data for the cluster are available in Appendix C.
Table 6: IT/Telecommunications Cluster Summary
Description 2012 Jobs
2012-18 Job Change
2012-18 Shiftshare
Jobs Multi-plier
Earnings Multi-plier
2011 Industry Average
Wage
% Occs High
Wage
Total Imports
(K)
Total Sales (K)
Core
Wired Telecomm. Carriers
529 11 22 3.4 2.2 $28.20 51% 190,786 197,849
Wireless Telecomm. Carriers
117 (4) (4) 2.6 1.9 $25.15 38% 57,142 37,257
Data Processing, Hosting, and Related
121 16 (7) 1.7 1.7 $13.70 8% 76,867 11,588
Computer Systems Design Services
724 243 87 1.8 1.4 $31.62 52% 42,359 76,210

26
Software Publishers
162 31 7 2.5 1.8 $24.68 61% 113,639 38,130
Custom Computer Programming Services
427 47 (32) 1.5 1.4 $19.08 35% 97,075 30,129
Other Computer Related Services
151 (35) (34) 1.7 1.4 $27.42 46% 5,000 14,140
Computer Facilities Mgmt Services
55 5 7 1.9 1.4 $34.61 60% 2,456 6,233
Computer/Office Machine Repair and Maintenance
121 4 9 1.5 1.4 $16.09 29% 1,696 9,909
Core Totals 2,407 318 56 2.2 1.6 $25.99 45% 587,021 421,445
Inputs 4,787 852 172 1.6 1.4 $18.86 33% 393,963 365,542
Purchasers and Distributors
14,500 1,912 944 2.3 1.5 $35.14 36% 359,844 2,591,239
TDL 2,620 61 (115) 1.8 1.6 $20.57 10% 60,475 365,249
Cluster Total 24,314 3,143 1,056 2.1 1.5 $29.46 33% 1,401,303 3,743,475
Source: EMSI Complete Employment – 1.2012; EMSI input-output model calculations
As a whole, as measured by the workforce compatibility metric, the IT/Telecommunications cluster requires one of the most highly skilled
workforces out of all of the identified targeted industry clusters. This was confirmed through the occupation analysis (see Table 17 in Appendix
E), which found that the majority of priority occupations require higher levels of postsecondary education. Priority occupations include network
systems analysis, computer software engineers, computer programmers, and several other occupations requiring specific IT or computer-based
skills. Programs are available in the region for almost all of the priority occupations.
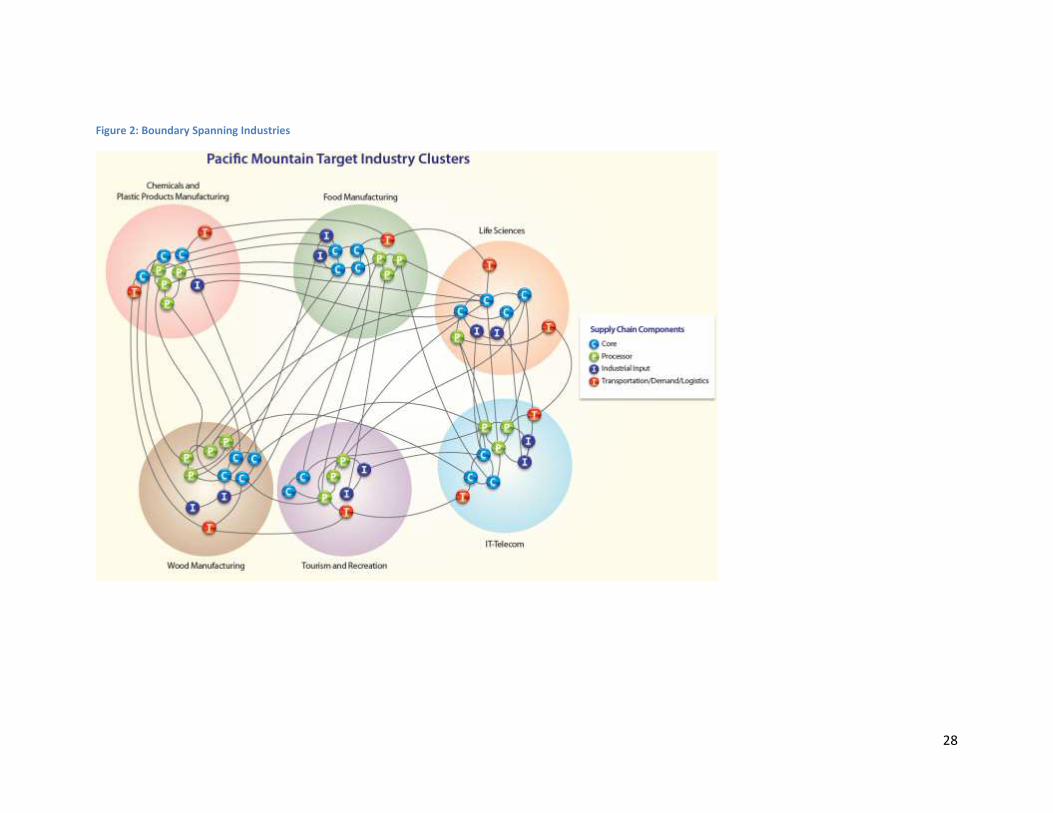
Boundary Spanners Through the consulting team’s data analysis, it became clear that several industries are present in multiple clusters. These have been termed as
“boundary spanning” industries. These industries present unique development opportunities. Through the targeting of these boundary spanning
industries, developmental impacts could be seen throughout several clusters, not just one. Note that these industries can play different roles
within the supply chains of different clusters.
27
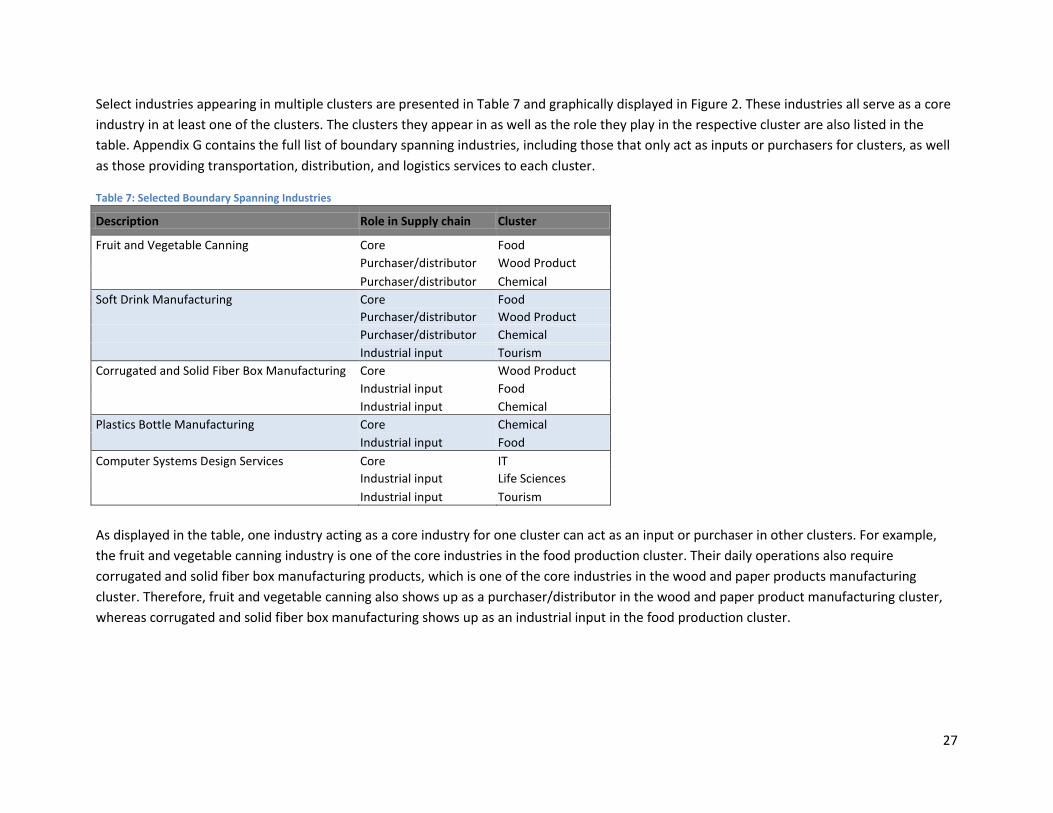
Select industries appearing in multiple clusters are presented in Table 7 and graphically displayed in Figure 2. These industries all serve as a core
industry in at least one of the clusters. The clusters they appear in as well as the role they play in the respective cluster are also listed in the
table. Appendix G contains the full list of boundary spanning industries, including those that only act as inputs or purchasers for clusters, as well
as those providing transportation, distribution, and logistics services to each cluster.
Table 7: Selected Boundary Spanning Industries
Description Role in Supply chain Cluster
Fruit and Vegetable Canning Core Food
Purchaser/distributor Wood Product
Purchaser/distributor Chemical
Soft Drink Manufacturing Core Food
Purchaser/distributor Wood Product
Purchaser/distributor Chemical
Industrial input Tourism
Corrugated and Solid Fiber Box Manufacturing Core Wood Product
Industrial input Food
Industrial input Chemical
Plastics Bottle Manufacturing Core Chemical
Industrial input Food
Computer Systems Design Services Core IT
Industrial input Life Sciences
Industrial input Tourism
As displayed in the table, one industry acting as a core industry for one cluster can act as an input or purchaser in other clusters. For example,
the fruit and vegetable canning industry is one of the core industries in the food production cluster. Their daily operations also require
corrugated and solid fiber box manufacturing products, which is one of the core industries in the wood and paper products manufacturing
cluster. Therefore, fruit and vegetable canning also shows up as a purchaser/distributor in the wood and paper product manufacturing cluster,
whereas corrugated and solid fiber box manufacturing shows up as an industrial input in the food production cluster.
28
Figure 2: Boundary Spanning Industries

29
Conclusion
Regional cluster identification and strategy alignment involves close and candid collaboration between regional leaders, decision-makers and
stakeholders to determine a mutually beneficial path for regional growth and development. The Pacific Mountain region’s leaders included
representation from economic development, workforce development, education/training, business associations. Through a data-driven decision
making process, the leadership selected five key target clusters, which include: Food Manufacturing; Wood Products Manufacturing; Life
Sciences; Chemical and Plastic Products Manufacturing; and IT/Telecommunications. These clusters show strong potential for growth and
diversification of the regional economy, but require the regional leaders to pool resources and champion initiatives to assist the growth of local
businesses and entrepreneurs, recruit new industry and leverage other opportunities for economic growth.
Specific strategies and opportunities include coordination with other regional stakeholders, such as: research and development in food safety at
Washington State University’s extension campus and agricultural research station; Joint Base Lewis McChord (JBLM) activities and training, as
well as separating service men with diversified training and skill sets; business incubation for small R&D companies, manufacturers and
technology firms at locations such as Satsop Business Park.
Ultimately, the data-driven content and strategies in this report provide a foundation for identifying opportunities for development; prioritizing
strategies and action items; tracking progress toward achieving cluster specific job and value creation outcomes.2 The information presented
does not represent an exhaustive assessment of development opportunities. As the leadership begins to execute strategies and economic
conditions continue to change, new opportunities and strategies will likely emerge. The consulting team recommends that the leadership team
leverage the applicable data and strategies as well as update data and information, as new opportunities emerge.
2 Data, analysis, cluster-relevant connections and supply-chain opportunities are highlighted for each sector. Further quantitative assessment is also available
in the appendices below.

30
31
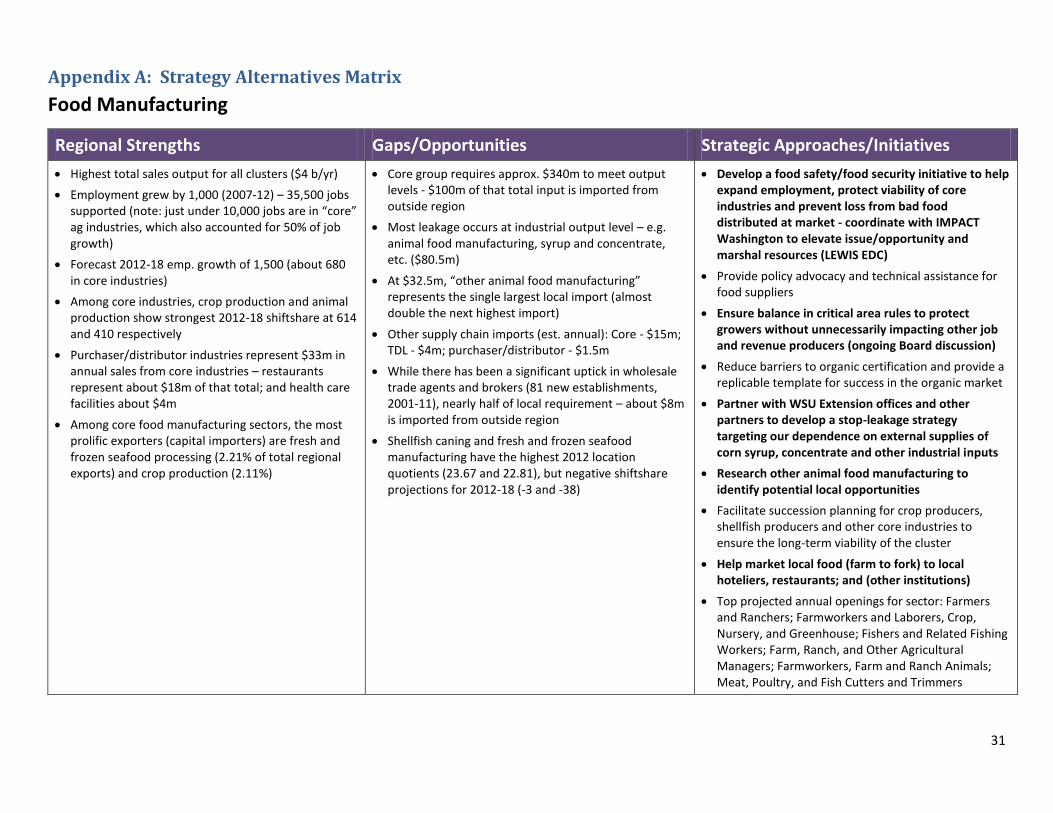
Appendix A: Strategy Alternatives Matrix
Food Manufacturing
Regional Strengths Gaps/Opportunities Strategic Approaches/Initiatives
Highest total sales output for all clusters ($4 b/yr)
Employment grew by 1,000 (2007-12) – 35,500 jobs supported (note: just under 10,000 jobs are in “core” ag industries, which also accounted for 50% of job growth)
Forecast 2012-18 emp. growth of 1,500 (about 680 in core industries)
Among core industries, crop production and animal production show strongest 2012-18 shiftshare at 614 and 410 respectively
Purchaser/distributor industries represent $33m in annual sales from core industries – restaurants represent about $18m of that total; and health care facilities about $4m
Among core food manufacturing sectors, the most prolific exporters (capital importers) are fresh and frozen seafood processing (2.21% of total regional exports) and crop production (2.11%)
Core group requires approx. $340m to meet output levels - $100m of that total input is imported from outside region
Most leakage occurs at industrial output level – e.g. animal food manufacturing, syrup and concentrate, etc. ($80.5m)
At $32.5m, “other animal food manufacturing” represents the single largest local import (almost double the next highest import)
Other supply chain imports (est. annual): Core - $15m; TDL - $4m; purchaser/distributor - $1.5m
While there has been a significant uptick in wholesale trade agents and brokers (81 new establishments, 2001-11), nearly half of local requirement – about $8m is imported from outside region
Shellfish caning and fresh and frozen seafood manufacturing have the highest 2012 location quotients (23.67 and 22.81), but negative shiftshare projections for 2012-18 (-3 and -38)
Develop a food safety/food security initiative to help expand employment, protect viability of core industries and prevent loss from bad food distributed at market - coordinate with IMPACT Washington to elevate issue/opportunity and marshal resources (LEWIS EDC)
Provide policy advocacy and technical assistance for food suppliers
Ensure balance in critical area rules to protect growers without unnecessarily impacting other job and revenue producers (ongoing Board discussion)
Reduce barriers to organic certification and provide a replicable template for success in the organic market
Partner with WSU Extension offices and other partners to develop a stop-leakage strategy targeting our dependence on external supplies of corn syrup, concentrate and other industrial inputs
Research other animal food manufacturing to identify potential local opportunities
Facilitate succession planning for crop producers, shellfish producers and other core industries to ensure the long-term viability of the cluster
Help market local food (farm to fork) to local hoteliers, restaurants; and (other institutions)
Top projected annual openings for sector: Farmers and Ranchers; Farmworkers and Laborers, Crop, Nursery, and Greenhouse; Fishers and Related Fishing Workers; Farm, Ranch, and Other Agricultural Managers; Farmworkers, Farm and Ranch Animals; Meat, Poultry, and Fish Cutters and Trimmers

32
Wood Products Manufacturing
Regional Strengths Gaps/Opportunities Strategic Approaches/Initiatives
Highest overall LQ of all six industry clusters (7.38)
Highest exporter cluster (capital importer) at nearly 15% of regional total
Despite the overall downturn in forest products industry, several local industries maintain high national location quotients (LQs): softwood veneer and plywood manufacturing (34.42); pulp mills (26.71); sawmills (23.12); and engineered wood member – except truss - manufacturing (20.63)
Strongest jobs and earnings multiplier effect, followed by IT/Telecom and Chemical products, et al
Second highest total output sales after food manufacturing, but highest output per job ($176k)
Most jobs lost 2007-12 forecast to be regained 2012-18 (about 600)
By far and away the largest purchaser and supplier of goods and services among all six target clusters ($427m of $502m required inputs provided by core local industries; sales from local core industries totals nearly $380m...next highest sales total from local core is $169m lower)
Only 15% of core industry inputs are imported from outside region – with the next lowest total being food manufacturing at 30% (i.e. wood products core sectors are indispensible to local supply chain)
Just over 7k jobs in wood products manufacturing help support an additional 14k jobs in supply chain industries
Employment decline realized and projected in most core industries; only 4 of 23 core industries expected to grow jobs
Only two core industries have and/or will generate significant employment opportunities between 2007 and 2018: wood container and pallet manufacturing (237 jobs); and custom architectural and millwork manufacturing (82 jobs)
Timber tract operations trails only logging and sawmills in percent of total regional exports, and has among the highest jobs and earning multipliers as well as output per job (over $1m) for just 71 jobs including 1099 workers
The most significant supply chain imports: wholesale trade agents and brokers ($8.7m); engineering services ($7m); adhesive manufacturing ($5.7m)
Among core industries, the highest percentage of imports are in: wood preservation (66% or $1.2m); and paper mills – excluding newsprint (42% or $2m)
In the TDL component of supply chain, notable annual out of region sales include: general freight trucking-local ($2.8m); freight transportation arrangement ($2.1m); and specialized freight – except used goods trucking, long-distance ($1.9m)
Core industries with the greatest disparity between skilled labor needed and available local workforce (by % gap): timber tract operations (37%); support activities for forestry (32%); wood kitchen cabinet and countertop manufacturing (31%); custom architectural woodwork and millwork manufacturing (11%)
Find ways to market (or find new markets for) forest product goods (Partner with the Forest Stewardship Council and other certifying associations to identify additional timber tract and value added opportunities)
Develop a security investment pool to fund advocacy or emergency support measures that protect critical core and supply chain industries (look at regional investment fund)
Identify and develop cross-walk training for separating JBLM personnel in core industries that have high projected annual openings for skilled jobs
Support land use regulations and land use designations that allow for wood products manufacturing throughout region – protect industrial and manufacturing sites
Research and potentially establish Innovation and Partnership Zone (IPZ) designation in all five counties
Identify opportunities to provide more locally-sourced shipping and specialty freight services
Work with core industries to reduce imports for wood preservation and paper mills
Recruit and/or train carpenters and specialty woodworkers (partner with GHC, New Market, SPSCC, et al)
Top projected annual openings for sector: Logging Equipment Operators; Sawing Machine Setters; Operators, and Tenders, Wood; Laborers and Freight, Stock, and Material Movers, Hand; Industrial Truck and Tractor Operators; Woodworking Machine Setters, Operators, and Tenders, Except Sawing
33
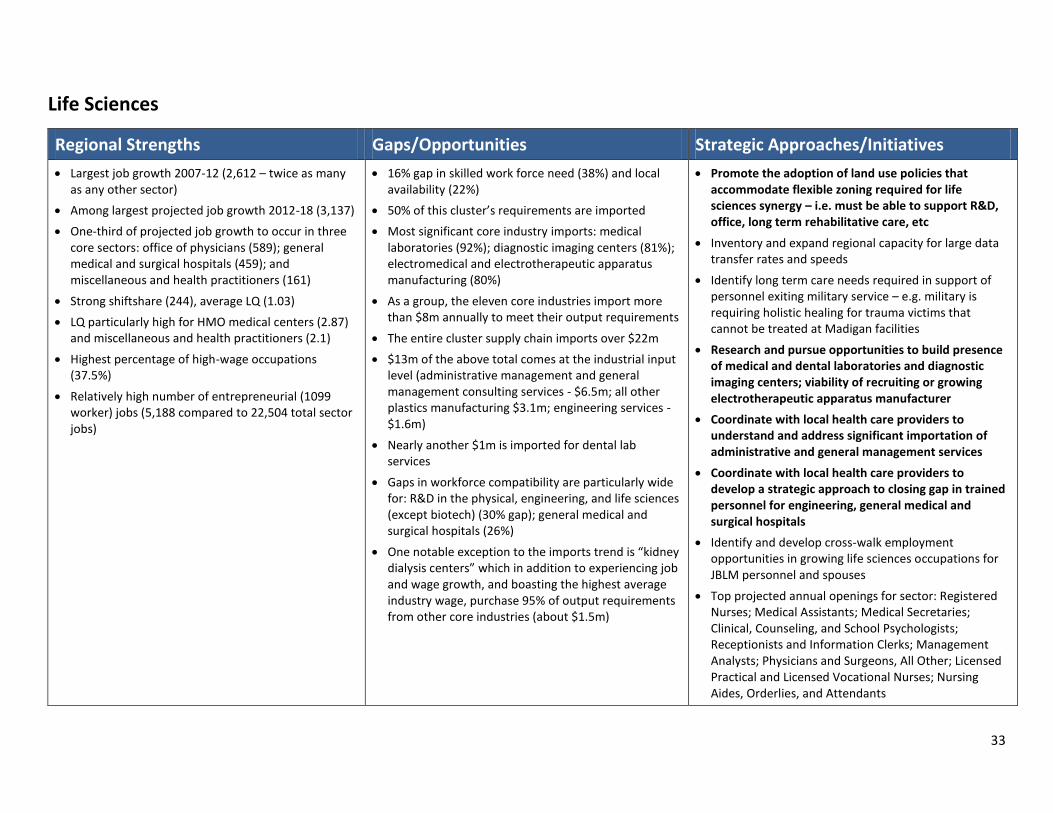
Life Sciences
Regional Strengths Gaps/Opportunities Strategic Approaches/Initiatives
Largest job growth 2007-12 (2,612 – twice as many as any other sector)
Among largest projected job growth 2012-18 (3,137)
One-third of projected job growth to occur in three core sectors: office of physicians (589); general medical and surgical hospitals (459); and miscellaneous and health practitioners (161)
Strong shiftshare (244), average LQ (1.03)
LQ particularly high for HMO medical centers (2.87) and miscellaneous and health practitioners (2.1)
Highest percentage of high-wage occupations (37.5%)
Relatively high number of entrepreneurial (1099 worker) jobs (5,188 compared to 22,504 total sector jobs)
16% gap in skilled work force need (38%) and local availability (22%)
50% of this cluster’s requirements are imported
Most significant core industry imports: medical laboratories (92%); diagnostic imaging centers (81%); electromedical and electrotherapeutic apparatus manufacturing (80%)
As a group, the eleven core industries import more than $8m annually to meet their output requirements
The entire cluster supply chain imports over $22m
$13m of the above total comes at the industrial input level (administrative management and general management consulting services - $6.5m; all other plastics manufacturing $3.1m; engineering services - $1.6m)
Nearly another $1m is imported for dental lab services
Gaps in workforce compatibility are particularly wide for: R&D in the physical, engineering, and life sciences (except biotech) (30% gap); general medical and surgical hospitals (26%)
One notable exception to the imports trend is “kidney dialysis centers” which in addition to experiencing job and wage growth, and boasting the highest average industry wage, purchase 95% of output requirements from other core industries (about $1.5m)
Promote the adoption of land use policies that accommodate flexible zoning required for life sciences synergy – i.e. must be able to support R&D, office, long term rehabilitative care, etc
Inventory and expand regional capacity for large data transfer rates and speeds
Identify long term care needs required in support of personnel exiting military service – e.g. military is requiring holistic healing for trauma victims that cannot be treated at Madigan facilities
Research and pursue opportunities to build presence of medical and dental laboratories and diagnostic imaging centers; viability of recruiting or growing electrotherapeutic apparatus manufacturer
Coordinate with local health care providers to understand and address significant importation of administrative and general management services
Coordinate with local health care providers to develop a strategic approach to closing gap in trained personnel for engineering, general medical and surgical hospitals
Identify and develop cross-walk employment opportunities in growing life sciences occupations for JBLM personnel and spouses
Top projected annual openings for sector: Registered Nurses; Medical Assistants; Medical Secretaries; Clinical, Counseling, and School Psychologists; Receptionists and Information Clerks; Management Analysts; Physicians and Surgeons, All Other; Licensed Practical and Licensed Vocational Nurses; Nursing Aides, Orderlies, and Attendants
34
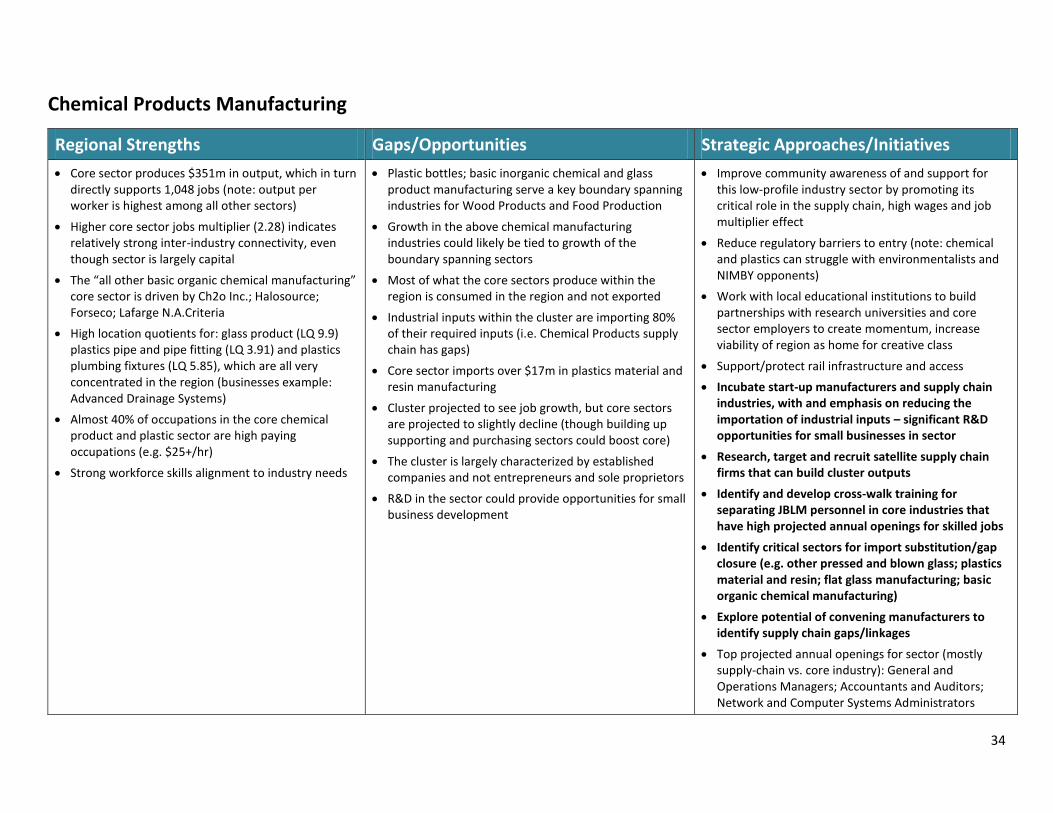
Chemical Products Manufacturing
Regional Strengths Gaps/Opportunities Strategic Approaches/Initiatives
Core sector produces $351m in output, which in turn directly supports 1,048 jobs (note: output per worker is highest among all other sectors)
Higher core sector jobs multiplier (2.28) indicates relatively strong inter-industry connectivity, even though sector is largely capital
The “all other basic organic chemical manufacturing” core sector is driven by Ch2o Inc.; Halosource; Forseco; Lafarge N.A.Criteria
High location quotients for: glass product (LQ 9.9) plastics pipe and pipe fitting (LQ 3.91) and plastics plumbing fixtures (LQ 5.85), which are all very concentrated in the region (businesses example: Advanced Drainage Systems)
Almost 40% of occupations in the core chemical product and plastic sector are high paying occupations (e.g. $25+/hr)
Strong workforce skills alignment to industry needs
Plastic bottles; basic inorganic chemical and glass product manufacturing serve a key boundary spanning industries for Wood Products and Food Production
Growth in the above chemical manufacturing industries could likely be tied to growth of the boundary spanning sectors
Most of what the core sectors produce within the region is consumed in the region and not exported
Industrial inputs within the cluster are importing 80% of their required inputs (i.e. Chemical Products supply chain has gaps)
Core sector imports over $17m in plastics material and resin manufacturing
Cluster projected to see job growth, but core sectors are projected to slightly decline (though building up supporting and purchasing sectors could boost core)
The cluster is largely characterized by established companies and not entrepreneurs and sole proprietors
R&D in the sector could provide opportunities for small business development
Improve community awareness of and support for this low-profile industry sector by promoting its critical role in the supply chain, high wages and job multiplier effect
Reduce regulatory barriers to entry (note: chemical and plastics can struggle with environmentalists and NIMBY opponents)
Work with local educational institutions to build partnerships with research universities and core sector employers to create momentum, increase viability of region as home for creative class
Support/protect rail infrastructure and access
Incubate start-up manufacturers and supply chain industries, with and emphasis on reducing the importation of industrial inputs – significant R&D opportunities for small businesses in sector
Research, target and recruit satellite supply chain firms that can build cluster outputs
Identify and develop cross-walk training for separating JBLM personnel in core industries that have high projected annual openings for skilled jobs
Identify critical sectors for import substitution/gap closure (e.g. other pressed and blown glass; plastics material and resin; flat glass manufacturing; basic organic chemical manufacturing)
Explore potential of convening manufacturers to identify supply chain gaps/linkages
Top projected annual openings for sector (mostly supply-chain vs. core industry): General and Operations Managers; Accountants and Auditors; Network and Computer Systems Administrators

35
36
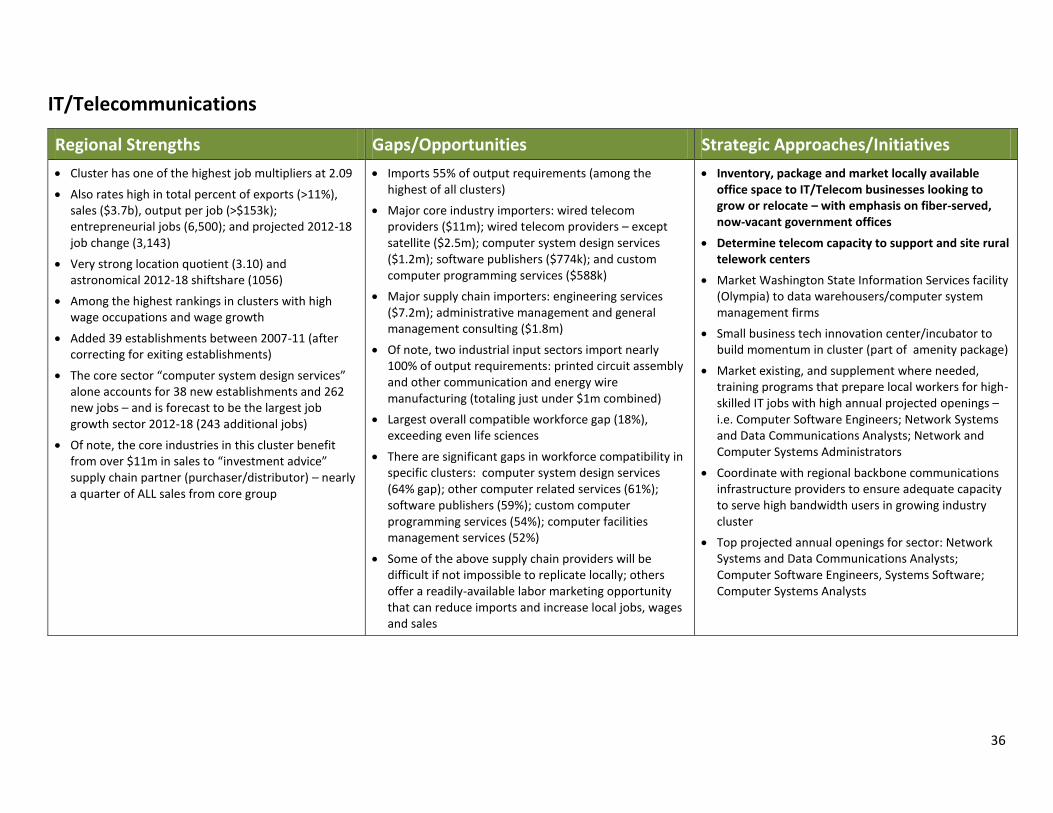
IT/Telecommunications
Regional Strengths Gaps/Opportunities Strategic Approaches/Initiatives
Cluster has one of the highest job multipliers at 2.09
Also rates high in total percent of exports (>11%), sales ($3.7b), output per job (>$153k); entrepreneurial jobs (6,500); and projected 2012-18 job change (3,143)
Very strong location quotient (3.10) and astronomical 2012-18 shiftshare (1056)
Among the highest rankings in clusters with high wage occupations and wage growth
Added 39 establishments between 2007-11 (after correcting for exiting establishments)
The core sector “computer system design services” alone accounts for 38 new establishments and 262 new jobs – and is forecast to be the largest job growth sector 2012-18 (243 additional jobs)
Of note, the core industries in this cluster benefit from over $11m in sales to “investment advice” supply chain partner (purchaser/distributor) – nearly a quarter of ALL sales from core group
Imports 55% of output requirements (among the highest of all clusters)
Major core industry importers: wired telecom providers ($11m); wired telecom providers – except satellite ($2.5m); computer system design services ($1.2m); software publishers ($774k); and custom computer programming services ($588k)
Major supply chain importers: engineering services ($7.2m); administrative management and general management consulting ($1.8m)
Of note, two industrial input sectors import nearly 100% of output requirements: printed circuit assembly and other communication and energy wire manufacturing (totaling just under $1m combined)
Largest overall compatible workforce gap (18%), exceeding even life sciences
There are significant gaps in workforce compatibility in specific clusters: computer system design services (64% gap); other computer related services (61%); software publishers (59%); custom computer programming services (54%); computer facilities management services (52%)
Some of the above supply chain providers will be difficult if not impossible to replicate locally; others offer a readily-available labor marketing opportunity that can reduce imports and increase local jobs, wages and sales
Inventory, package and market locally available office space to IT/Telecom businesses looking to grow or relocate – with emphasis on fiber-served, now-vacant government offices
Determine telecom capacity to support and site rural telework centers
Market Washington State Information Services facility (Olympia) to data warehousers/computer system management firms
Small business tech innovation center/incubator to build momentum in cluster (part of amenity package)
Market existing, and supplement where needed, training programs that prepare local workers for high-skilled IT jobs with high annual projected openings – i.e. Computer Software Engineers; Network Systems and Data Communications Analysts; Network and Computer Systems Administrators
Coordinate with regional backbone communications infrastructure providers to ensure adequate capacity to serve high bandwidth users in growing industry cluster
Top projected annual openings for sector: Network Systems and Data Communications Analysts; Computer Software Engineers, Systems Software; Computer Systems Analysts
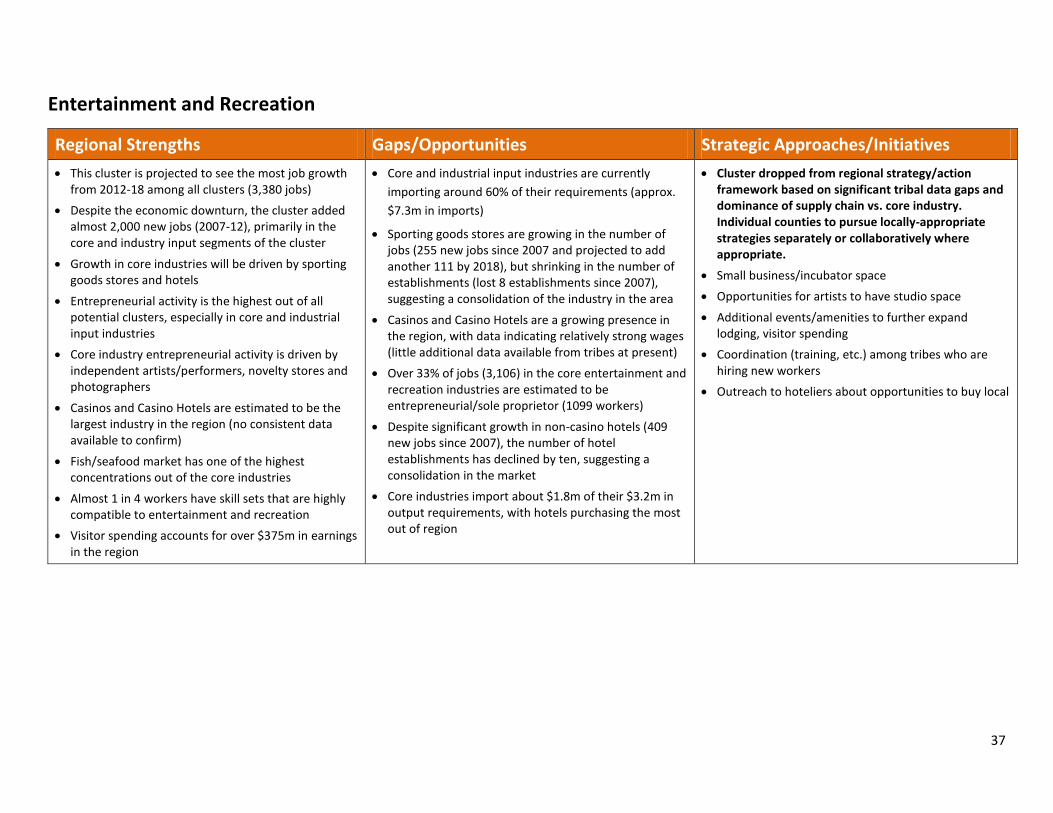
37
Entertainment and Recreation
Regional Strengths Gaps/Opportunities Strategic Approaches/Initiatives
This cluster is projected to see the most job growth from 2012-18 among all clusters (3,380 jobs)
Despite the economic downturn, the cluster added almost 2,000 new jobs (2007-12), primarily in the core and industry input segments of the cluster
Growth in core industries will be driven by sporting goods stores and hotels
Entrepreneurial activity is the highest out of all potential clusters, especially in core and industrial input industries
Core industry entrepreneurial activity is driven by independent artists/performers, novelty stores and photographers
Casinos and Casino Hotels are estimated to be the largest industry in the region (no consistent data available to confirm)
Fish/seafood market has one of the highest concentrations out of the core industries
Almost 1 in 4 workers have skill sets that are highly compatible to entertainment and recreation
Visitor spending accounts for over $375m in earnings in the region
Core and industrial input industries are currently
importing around 60% of their requirements (approx.
$7.3m in imports)
Sporting goods stores are growing in the number of jobs (255 new jobs since 2007 and projected to add another 111 by 2018), but shrinking in the number of establishments (lost 8 establishments since 2007), suggesting a consolidation of the industry in the area
Casinos and Casino Hotels are a growing presence in the region, with data indicating relatively strong wages (little additional data available from tribes at present)
Over 33% of jobs (3,106) in the core entertainment and recreation industries are estimated to be entrepreneurial/sole proprietor (1099 workers)
Despite significant growth in non-casino hotels (409 new jobs since 2007), the number of hotel establishments has declined by ten, suggesting a consolidation in the market
Core industries import about $1.8m of their $3.2m in output requirements, with hotels purchasing the most out of region
Cluster dropped from regional strategy/action framework based on significant tribal data gaps and dominance of supply chain vs. core industry. Individual counties to pursue locally-appropriate strategies separately or collaboratively where appropriate.
Small business/incubator space
Opportunities for artists to have studio space
Additional events/amenities to further expand lodging, visitor spending
Coordination (training, etc.) among tribes who are hiring new workers
Outreach to hoteliers about opportunities to buy local

38

39
Appendix B: Variables and Cluster Selection Process As mentioned in the industry cluster data analysis section, EMSI looked at several metrics when
evaluating all industries within the region. Definitions for each of those metrics are provided below:
Historical Job Growth and Current Size: Measures the current employment and past performance of an
industry sector and identifies whether industries have been growing/declining/emerging and the rate of
change.
Future Job Growth Projection: Incorporates historical growth and performance with additional factors
and expectations of growth/decline at a larger geographic scale (i.e., state or nation-wide and even
global expectations). Industry projection rates are based off of Florida’s Department of Economic
Opportunity – Labor Market Statistics Center projections and adjusted to current employment
estimates.
Industry Concentration (Location Quotient): The location quotient variable is a comparative statistic
used to calculate relative employment concentration of a given industry against the average
employment of the industry in a larger geography (e.g., nation). Industries with a higher location
quotient (usually greater than 1.2) indicate that a region/state has a comparative advantage or
specialization in the production of that good or service.
Industry Competitiveness Effect (Shift-Share Analysis): A standard method of regional economic
analysis that attempts to separate regional job growth into its component causes. The three main
causes identified are the “national growth effect,” which is regional growth that can be attributed to the
overall growth of the entire U.S. economy; the “industrial mix effect,” which is regional growth that can
be attributed to positive trends in the specific industry or occupation at a national level; and the
“regional competitiveness effect,” which is growth that cannot be explained by either overall or
industry-specific trends. A positive value indicates that an industry has a regional competitive advantage
compared to the nation. Note: Positive shift share values do not explain why an industry has a
competitive advantage, only that there are potential factors that contribute to the industry’s ability to
outperform the national average rate of growth/decline.
Job Multiplier Effects: A jobs multiplier indicates how important an industry is in regional job creation.
For example, a jobs multiplier of 3 would mean that for every job created by that industry, 2 other jobs
would be created in other industries (for a total of 3 jobs). Higher job multipliers in industries that are
associated with higher average wages tend to have larger positive impacts on an economy.
Entrepreneurial Growth Potential: Entrepreneurship contributes to economic growth by creating new
businesses. Through EMSI’s data system, it is possible to separate jobs in the region that are
characterized as traditional employment and those that are characterized as proprietor or
entrepreneurial. Those in traditional employment are captured by W-2 payrolls, whereas proprietors file
1099s with the IRS. Typically, proprietors are also not covered by unemployment insurance unlike
traditional employees. Note: EMSI uses a combination of data sources, including Bureau of Labor
Statistics, Bureau of Economic Analysis and IRS, to capture all of these elements.
40
Earnings Multiplier Effects: An earnings multiplier indicates the level of additional earnings associated
with adding one new dollar of earnings to an industry in an economy. This variable is important in
understanding how targeted investment in an industry (especially higher-paying industries) affects the
overall quality of jobs created.
Industry Average Wage: This metric is calculated based on an industry staffing pattern and the average
occupational wage associated with that staffing pattern. The industry average wages provides a
perspective on the quality of jobs within a given industry, answering the question of whether the
industry typically provides family-sustaining wages. This was further broken down by looking at the
percentage of mid-wage occupations in the industry (defined as between $18.50 - $25.00 per hour) and
the percentage of high-wage occupations in the industry (defined as being over $25.00 per hour).
Finally, in order to see whether wages have been increasing or decreasing, the percentage change in
wages from 2007-2011 was also calculated.
Research and Development (R&D) occupations: This metric is calculated based on industry staffing
patterns and represents the percentage of occupations within the industry that can be classified as
STEM occupations. The U.S. Department of Labor defines about 110 occupation codes as STEM.
Establishments: This metric looks at the level of change in business numbers within the industry from
2007-2011. The level of change in establishments can be a factor in determining the stage of an
industry. For example, if the number of establishments declined while job numbers remained strong,
then the industry could be consolidating.
Workforce Compatibility: The compatibility metric is derived from a proprietary dataset developed by
EMSI, which utilizes measured O*NET occupational competencies to identify similarities in skill sets. The
metric in this analysis is important for one reason, specifically to provide an understanding of the
capabilities of a region/state’s workforce to fill the labor needs within a given industry, especially the
higher-skilled labor needs (measured using O*NET Job Zone codes 3 and higher). For example, if half of
an industry’s labor needs are high-skill workers and a third of the regional workforce can fill those labor
needs, we would conclude that the industry is a good fit for the region’s workforce capabilities.
Level of output: This variable was measured in two ways for this analysis – output in terms of sales and
output in terms of the level of sales per job. Measured using an input-output model, output in terms of
sales calculates the level of sales the industry is generating within the region. Note that sales figures,
unlike income figures, do leak out of the region. Since employment levels vary significantly between
industries, production output amounts also vary. To account for this and provide a comparable metric,
output per job was calculated.
Export Orientation: This variable can be measured in more than one way. Through the development of
an input-output model, metrics estimating export amounts can be calculated for each six-digit NAICS
code. Since employment levels vary significantly between industries, production output and export
amounts also vary. To account for this and provide a comparable metrics, percentage of all exports was
calculated. Industries that predominately export their product bring new money into the economy,
which in turn drive many other local sectors and service providers. Furthermore, export-oriented

41
industries that require less labor input per unit of output can generate significant amounts of new
dollars for an economy through job and output growth. Knowing these sectors helps to understand the
economic benefits gained from targeted sector strategies.
Excess Demand (regional imports): Measured using an input-output model, excess demand can also be
viewed as regional imports. The model calculates the level of inputs the core industries require to make
their outputs (total requirements). The model then also calculates local absorption to see how much of
those requirements are available within the region. Therefore, regional imports, or excess demand, is
calculated by determining how much of a good or service is purchased from outside the area and can
indicate the area’s inability to produce its own supply. The consulting team cautions against over-
interpreting this variable, as cross-hauling (inter-regional and inter-state trade) does exist due to
specialization in other areas. However, if a region or state has a high level of industry requirements and
is only producing a small portion of output to meet those requirements with the remaining amount
being imported, then an opportunity may exist to further develop that particular industry. This would be
considered a demand-driven industry development approach.
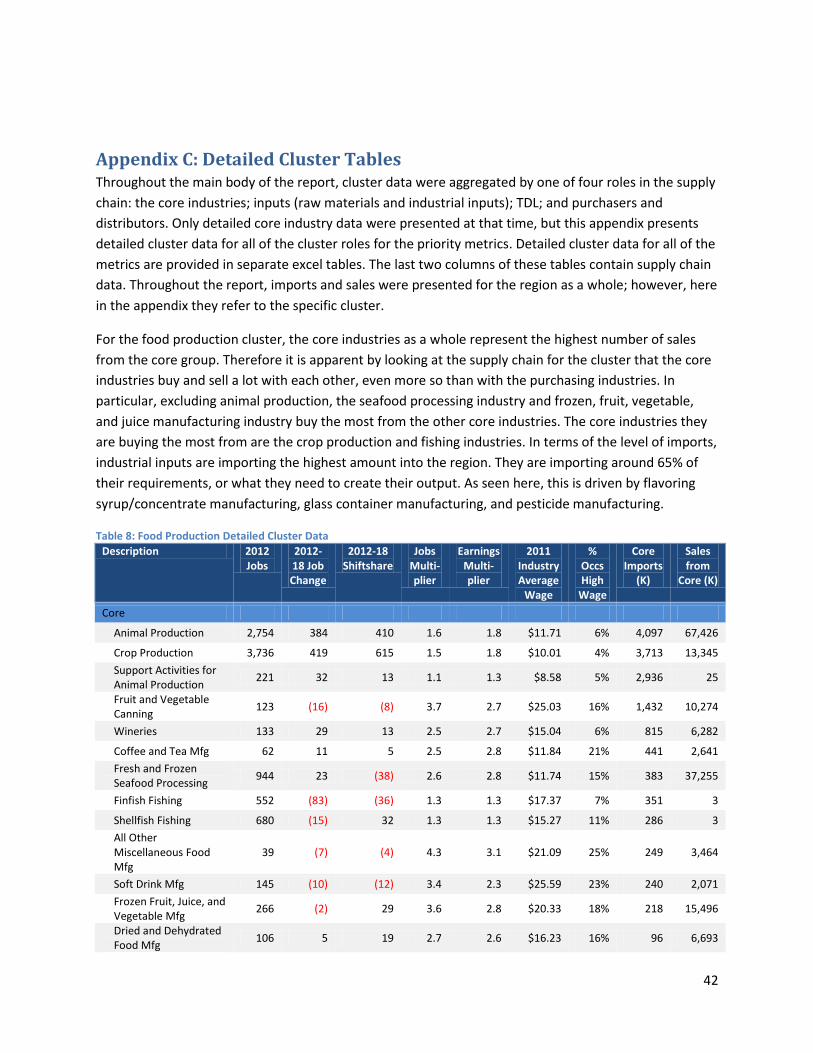
42
Appendix C: Detailed Cluster Tables Throughout the main body of the report, cluster data were aggregated by one of four roles in the supply
chain: the core industries; inputs (raw materials and industrial inputs); TDL; and purchasers and
distributors. Only detailed core industry data were presented at that time, but this appendix presents
detailed cluster data for all of the cluster roles for the priority metrics. Detailed cluster data for all of the
metrics are provided in separate excel tables. The last two columns of these tables contain supply chain
data. Throughout the report, imports and sales were presented for the region as a whole; however, here
in the appendix they refer to the specific cluster.
For the food production cluster, the core industries as a whole represent the highest number of sales
from the core group. Therefore it is apparent by looking at the supply chain for the cluster that the core
industries buy and sell a lot with each other, even more so than with the purchasing industries. In
particular, excluding animal production, the seafood processing industry and frozen, fruit, vegetable,
and juice manufacturing industry buy the most from the other core industries. The core industries they
are buying the most from are the crop production and fishing industries. In terms of the level of imports,
industrial inputs are importing the highest amount into the region. They are importing around 65% of
their requirements, or what they need to create their output. As seen here, this is driven by flavoring
syrup/concentrate manufacturing, glass container manufacturing, and pesticide manufacturing.
Table 8: Food Production Detailed Cluster Data
Description 2012 Jobs
2012-18 Job Change
2012-18 Shiftshare
Jobs Multi-plier
Earnings Multi-plier
2011 Industry Average
Wage
% Occs High
Wage
Core Imports
(K)
Sales from
Core (K)
Core
Animal Production 2,754 384 410 1.6 1.8 $11.71 6% 4,097 67,426
Crop Production 3,736 419 615 1.5 1.8 $10.01 4% 3,713 13,345
Support Activities for Animal Production
221 32 13 1.1 1.3 $8.58 5% 2,936 25
Fruit and Vegetable Canning
123 (16) (8) 3.7 2.7 $25.03 16% 1,432 10,274
Wineries 133 29 13 2.5 2.7 $15.04 6% 815 6,282
Coffee and Tea Mfg 62 11 5 2.5 2.8 $11.84 21% 441 2,641
Fresh and Frozen Seafood Processing
944 23 (38) 2.6 2.8 $11.74 15% 383 37,255
Finfish Fishing 552 (83) (36) 1.3 1.3 $17.37 7% 351 3
Shellfish Fishing 680 (15) 32 1.3 1.3 $15.27 11% 286 3
All Other Miscellaneous Food Mfg
39 (7) (4) 4.3 3.1 $21.09 25% 249 3,464
Soft Drink Mfg 145 (10) (12) 3.4 2.3 $25.59 23% 240 2,071
Frozen Fruit, Juice, and Vegetable Mfg
266 (2) 29 3.6 2.8 $20.33 18% 218 15,496
Dried and Dehydrated Food Mfg
106 5 19 2.7 2.6 $16.23 16% 96 6,693
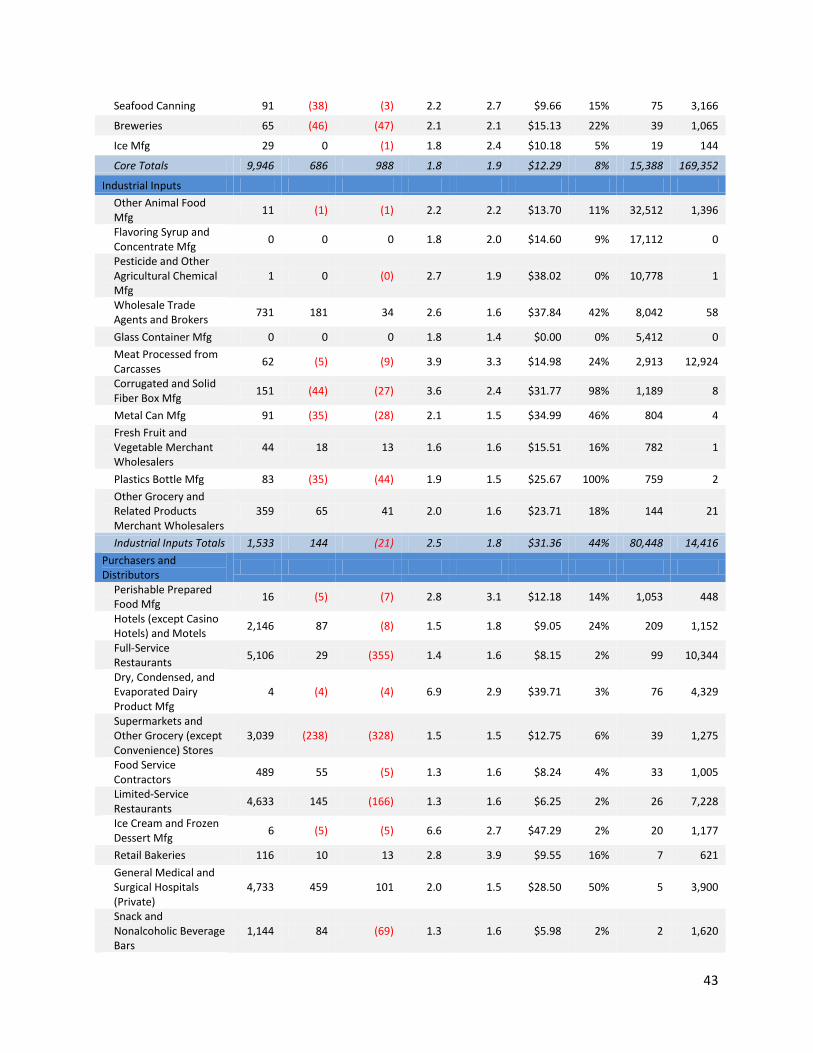
43
Seafood Canning 91 (38) (3) 2.2 2.7 $9.66 15% 75 3,166
Breweries 65 (46) (47) 2.1 2.1 $15.13 22% 39 1,065
Ice Mfg 29 0 (1) 1.8 2.4 $10.18 5% 19 144
Core Totals 9,946 686 988 1.8 1.9 $12.29 8% 15,388 169,352
Industrial Inputs
Other Animal Food Mfg
11 (1) (1) 2.2 2.2 $13.70 11% 32,512 1,396
Flavoring Syrup and Concentrate Mfg
0 0 0 1.8 2.0 $14.60 9% 17,112 0
Pesticide and Other Agricultural Chemical Mfg
1 0 (0) 2.7 1.9 $38.02 0% 10,778 1
Wholesale Trade Agents and Brokers
731 181 34 2.6 1.6 $37.84 42% 8,042 58
Glass Container Mfg 0 0 0 1.8 1.4 $0.00 0% 5,412 0
Meat Processed from Carcasses
62 (5) (9) 3.9 3.3 $14.98 24% 2,913 12,924
Corrugated and Solid Fiber Box Mfg
151 (44) (27) 3.6 2.4 $31.77 98% 1,189 8
Metal Can Mfg 91 (35) (28) 2.1 1.5 $34.99 46% 804 4
Fresh Fruit and Vegetable Merchant Wholesalers
44 18 13 1.6 1.6 $15.51 16% 782 1
Plastics Bottle Mfg 83 (35) (44) 1.9 1.5 $25.67 100% 759 2
Other Grocery and Related Products Merchant Wholesalers
359 65 41 2.0 1.6 $23.71 18% 144 21
Industrial Inputs Totals 1,533 144 (21) 2.5 1.8 $31.36 44% 80,448 14,416
Purchasers and Distributors
Perishable Prepared Food Mfg
16 (5) (7) 2.8 3.1 $12.18 14% 1,053 448
Hotels (except Casino Hotels) and Motels
2,146 87 (8) 1.5 1.8 $9.05 24% 209 1,152
Full-Service Restaurants
5,106 29 (355) 1.4 1.6 $8.15 2% 99 10,344
Dry, Condensed, and Evaporated Dairy Product Mfg
4 (4) (4) 6.9 2.9 $39.71 3% 76 4,329
Supermarkets and Other Grocery (except Convenience) Stores
3,039 (238) (328) 1.5 1.5 $12.75 6% 39 1,275
Food Service Contractors
489 55 (5) 1.3 1.6 $8.24 4% 33 1,005
Limited-Service Restaurants
4,633 145 (166) 1.3 1.6 $6.25 2% 26 7,228
Ice Cream and Frozen Dessert Mfg
6 (5) (5) 6.6 2.7 $47.29 2% 20 1,177
Retail Bakeries 116 10 13 2.8 3.9 $9.55 16% 7 621
General Medical and Surgical Hospitals (Private)
4,733 459 101 2.0 1.5 $28.50 50% 5 3,900
Snack and Nonalcoholic Beverage Bars
1,144 84 (69) 1.3 1.6 $5.98 2% 2 1,620
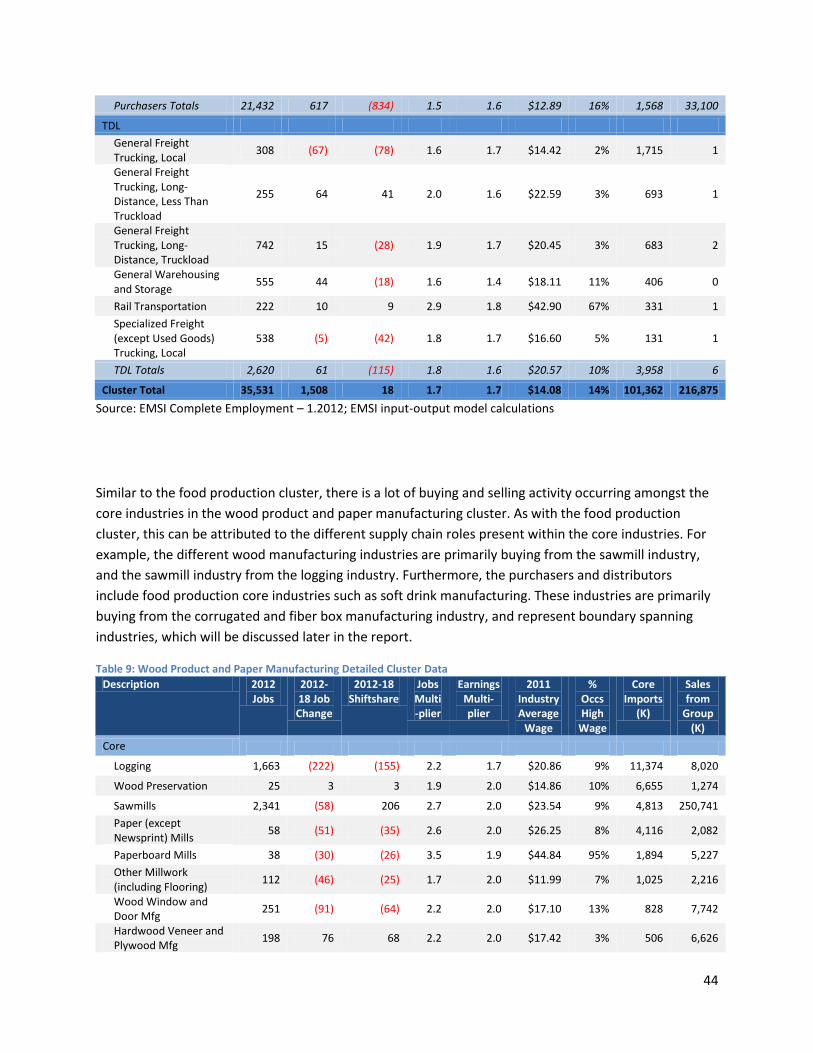
44
Purchasers Totals 21,432 617 (834) 1.5 1.6 $12.89 16% 1,568 33,100
TDL
General Freight Trucking, Local
308 (67) (78) 1.6 1.7 $14.42 2% 1,715 1
General Freight Trucking, Long-Distance, Less Than Truckload
255 64 41 2.0 1.6 $22.59 3% 693 1
General Freight Trucking, Long-Distance, Truckload
742 15 (28) 1.9 1.7 $20.45 3% 683 2
General Warehousing and Storage
555 44 (18) 1.6 1.4 $18.11 11% 406 0
Rail Transportation 222 10 9 2.9 1.8 $42.90 67% 331 1
Specialized Freight (except Used Goods) Trucking, Local
538 (5) (42) 1.8 1.7 $16.60 5% 131 1
TDL Totals 2,620 61 (115) 1.8 1.6 $20.57 10% 3,958 6
Cluster Total 35,531 1,508 18 1.7 1.7 $14.08 14% 101,362 216,875
Source: EMSI Complete Employment – 1.2012; EMSI input-output model calculations
Similar to the food production cluster, there is a lot of buying and selling activity occurring amongst the
core industries in the wood product and paper manufacturing cluster. As with the food production
cluster, this can be attributed to the different supply chain roles present within the core industries. For
example, the different wood manufacturing industries are primarily buying from the sawmill industry,
and the sawmill industry from the logging industry. Furthermore, the purchasers and distributors
include food production core industries such as soft drink manufacturing. These industries are primarily
buying from the corrugated and fiber box manufacturing industry, and represent boundary spanning
industries, which will be discussed later in the report.
Table 9: Wood Product and Paper Manufacturing Detailed Cluster Data
Description 2012 Jobs
2012-18 Job Change
2012-18 Shiftshare
Jobs Multi-plier
Earnings Multi-plier
2011 Industry Average
Wage
% Occs High
Wage
Core Imports
(K)
Sales from
Group (K)
Core
Logging 1,663 (222) (155) 2.2 1.7 $20.86 9% 11,374 8,020
Wood Preservation 25 3 3 1.9 2.0 $14.86 10% 6,655 1,274
Sawmills 2,341 (58) 206 2.7 2.0 $23.54 9% 4,813 250,741
Paper (except Newsprint) Mills
58 (51) (35) 2.6 2.0 $26.25 8% 4,116 2,082
Paperboard Mills 38 (30) (26) 3.5 1.9 $44.84 95% 1,894 5,227
Other Millwork (including Flooring)
112 (46) (25) 1.7 2.0 $11.99 7% 1,025 2,216
Wood Window and Door Mfg
251 (91) (64) 2.2 2.0 $17.10 13% 828 7,742
Hardwood Veneer and Plywood Mfg
198 76 68 2.2 2.0 $17.42 3% 506 6,626
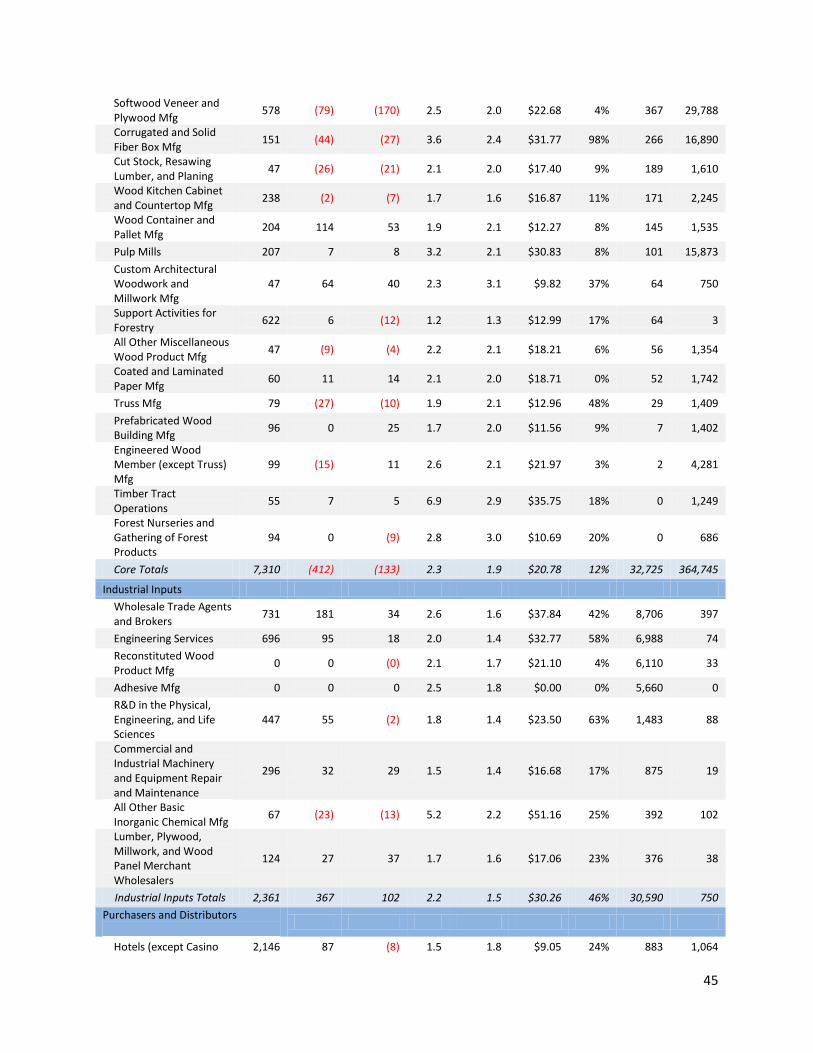
45
Softwood Veneer and Plywood Mfg
578 (79) (170) 2.5 2.0 $22.68 4% 367 29,788
Corrugated and Solid Fiber Box Mfg
151 (44) (27) 3.6 2.4 $31.77 98% 266 16,890
Cut Stock, Resawing Lumber, and Planing
47 (26) (21) 2.1 2.0 $17.40 9% 189 1,610
Wood Kitchen Cabinet and Countertop Mfg
238 (2) (7) 1.7 1.6 $16.87 11% 171 2,245
Wood Container and Pallet Mfg
204 114 53 1.9 2.1 $12.27 8% 145 1,535
Pulp Mills 207 7 8 3.2 2.1 $30.83 8% 101 15,873
Custom Architectural Woodwork and Millwork Mfg
47 64 40 2.3 3.1 $9.82 37% 64 750
Support Activities for Forestry
622 6 (12) 1.2 1.3 $12.99 17% 64 3
All Other Miscellaneous Wood Product Mfg
47 (9) (4) 2.2 2.1 $18.21 6% 56 1,354
Coated and Laminated Paper Mfg
60 11 14 2.1 2.0 $18.71 0% 52 1,742
Truss Mfg 79 (27) (10) 1.9 2.1 $12.96 48% 29 1,409
Prefabricated Wood Building Mfg
96 0 25 1.7 2.0 $11.56 9% 7 1,402
Engineered Wood Member (except Truss) Mfg
99 (15) 11 2.6 2.1 $21.97 3% 2 4,281
Timber Tract Operations
55 7 5 6.9 2.9 $35.75 18% 0 1,249
Forest Nurseries and Gathering of Forest Products
94 0 (9) 2.8 3.0 $10.69 20% 0 686
Core Totals 7,310 (412) (133) 2.3 1.9 $20.78 12% 32,725 364,745
Industrial Inputs
Wholesale Trade Agents and Brokers
731 181 34 2.6 1.6 $37.84 42% 8,706 397
Engineering Services 696 95 18 2.0 1.4 $32.77 58% 6,988 74
Reconstituted Wood Product Mfg
0 0 (0) 2.1 1.7 $21.10 4% 6,110 33
Adhesive Mfg 0 0 0 2.5 1.8 $0.00 0% 5,660 0
R&D in the Physical, Engineering, and Life Sciences
447 55 (2) 1.8 1.4 $23.50 63% 1,483 88
Commercial and Industrial Machinery and Equipment Repair and Maintenance
296 32 29 1.5 1.4 $16.68 17% 875 19
All Other Basic Inorganic Chemical Mfg
67 (23) (13) 5.2 2.2 $51.16 25% 392 102
Lumber, Plywood, Millwork, and Wood Panel Merchant Wholesalers
124 27 37 1.7 1.6 $17.06 23% 376 38
Industrial Inputs Totals 2,361 367 102 2.2 1.5 $30.26 46% 30,590 750
Purchasers and Distributors
Hotels (except Casino 2,146 87 (8) 1.5 1.8 $9.05 24% 883 1,064
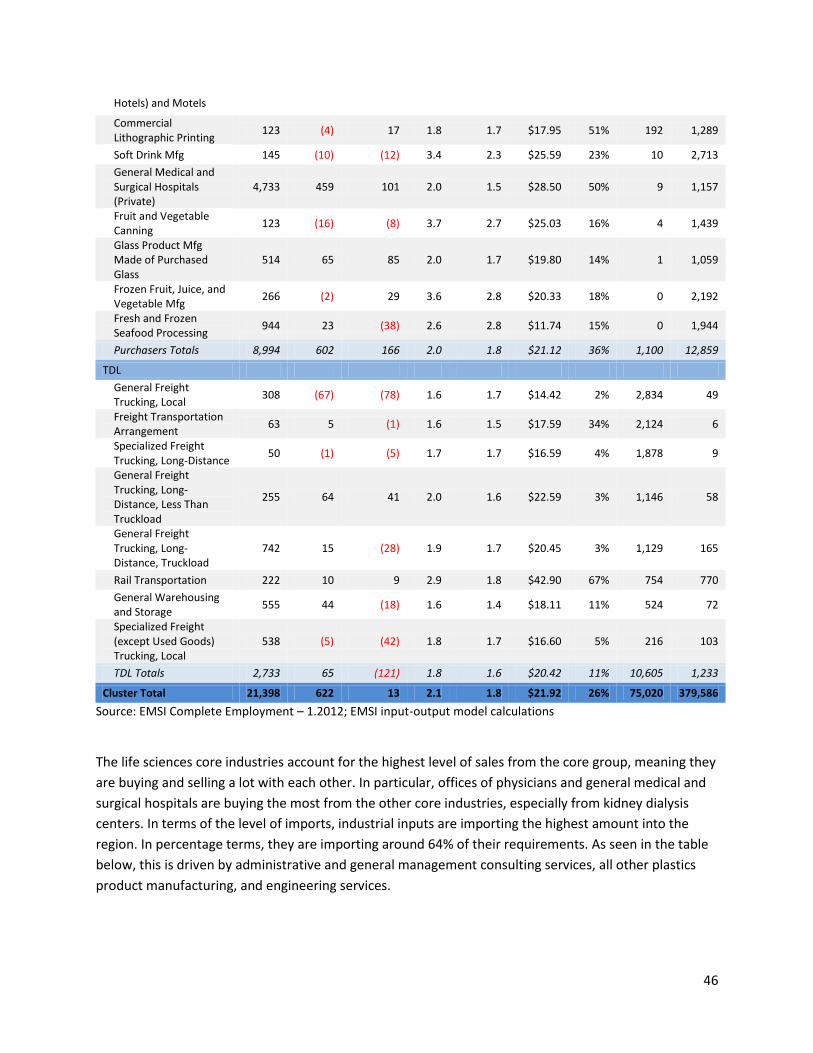
46
Hotels) and Motels
Commercial Lithographic Printing
123 (4) 17 1.8 1.7 $17.95 51% 192 1,289
Soft Drink Mfg 145 (10) (12) 3.4 2.3 $25.59 23% 10 2,713
General Medical and Surgical Hospitals (Private)
4,733 459 101 2.0 1.5 $28.50 50% 9 1,157
Fruit and Vegetable Canning
123 (16) (8) 3.7 2.7 $25.03 16% 4 1,439
Glass Product Mfg Made of Purchased Glass
514 65 85 2.0 1.7 $19.80 14% 1 1,059
Frozen Fruit, Juice, and Vegetable Mfg
266 (2) 29 3.6 2.8 $20.33 18% 0 2,192
Fresh and Frozen Seafood Processing
944 23 (38) 2.6 2.8 $11.74 15% 0 1,944
Purchasers Totals 8,994 602 166 2.0 1.8 $21.12 36% 1,100 12,859
TDL
General Freight Trucking, Local
308 (67) (78) 1.6 1.7 $14.42 2% 2,834 49
Freight Transportation Arrangement
63 5 (1) 1.6 1.5 $17.59 34% 2,124 6
Specialized Freight Trucking, Long-Distance
50 (1) (5) 1.7 1.7 $16.59 4% 1,878 9
General Freight Trucking, Long-Distance, Less Than Truckload
255 64 41 2.0 1.6 $22.59 3% 1,146 58
General Freight Trucking, Long-Distance, Truckload
742 15 (28) 1.9 1.7 $20.45 3% 1,129 165
Rail Transportation 222 10 9 2.9 1.8 $42.90 67% 754 770
General Warehousing and Storage
555 44 (18) 1.6 1.4 $18.11 11% 524 72
Specialized Freight (except Used Goods) Trucking, Local
538 (5) (42) 1.8 1.7 $16.60 5% 216 103
TDL Totals 2,733 65 (121) 1.8 1.6 $20.42 11% 10,605 1,233
Cluster Total 21,398 622 13 2.1 1.8 $21.92 26% 75,020 379,586
Source: EMSI Complete Employment – 1.2012; EMSI input-output model calculations
The life sciences core industries account for the highest level of sales from the core group, meaning they
are buying and selling a lot with each other. In particular, offices of physicians and general medical and
surgical hospitals are buying the most from the other core industries, especially from kidney dialysis
centers. In terms of the level of imports, industrial inputs are importing the highest amount into the
region. In percentage terms, they are importing around 64% of their requirements. As seen in the table
below, this is driven by administrative and general management consulting services, all other plastics
product manufacturing, and engineering services.
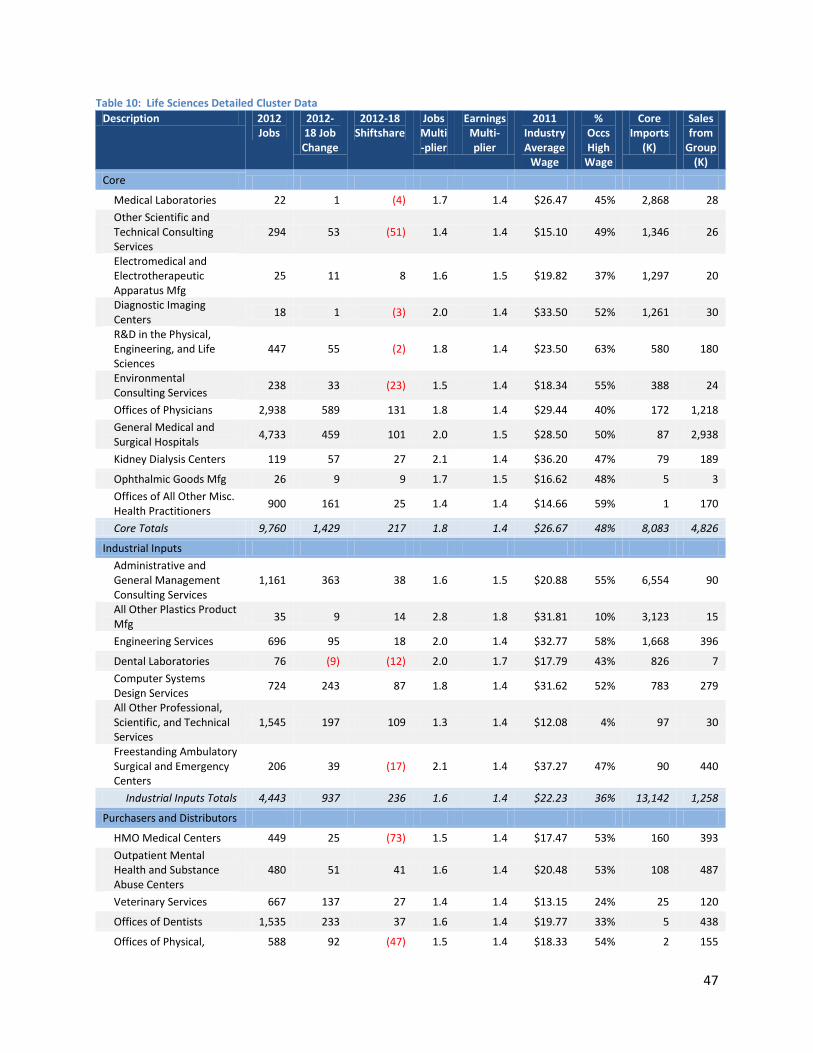
47
Table 10: Life Sciences Detailed Cluster Data
Description 2012 Jobs
2012-18 Job Change
2012-18 Shiftshare
Jobs Multi-plier
Earnings Multi-plier
2011 Industry Average
Wage
% Occs High
Wage
Core Imports
(K)
Sales from
Group (K)
Core
Medical Laboratories 22 1 (4) 1.7 1.4 $26.47 45% 2,868 28
Other Scientific and Technical Consulting Services
294 53 (51) 1.4 1.4 $15.10 49% 1,346 26
Electromedical and Electrotherapeutic Apparatus Mfg
25 11 8 1.6 1.5 $19.82 37% 1,297 20
Diagnostic Imaging Centers
18 1 (3) 2.0 1.4 $33.50 52% 1,261 30
R&D in the Physical, Engineering, and Life Sciences
447 55 (2) 1.8 1.4 $23.50 63% 580 180
Environmental Consulting Services
238 33 (23) 1.5 1.4 $18.34 55% 388 24
Offices of Physicians 2,938 589 131 1.8 1.4 $29.44 40% 172 1,218
General Medical and Surgical Hospitals
4,733 459 101 2.0 1.5 $28.50 50% 87 2,938
Kidney Dialysis Centers 119 57 27 2.1 1.4 $36.20 47% 79 189
Ophthalmic Goods Mfg 26 9 9 1.7 1.5 $16.62 48% 5 3
Offices of All Other Misc. Health Practitioners
900 161 25 1.4 1.4 $14.66 59% 1 170
Core Totals 9,760 1,429 217 1.8 1.4 $26.67 48% 8,083 4,826
Industrial Inputs
Administrative and General Management Consulting Services
1,161 363 38 1.6 1.5 $20.88 55% 6,554 90
All Other Plastics Product Mfg
35 9 14 2.8 1.8 $31.81 10% 3,123 15
Engineering Services 696 95 18 2.0 1.4 $32.77 58% 1,668 396
Dental Laboratories 76 (9) (12) 2.0 1.7 $17.79 43% 826 7
Computer Systems Design Services
724 243 87 1.8 1.4 $31.62 52% 783 279
All Other Professional, Scientific, and Technical Services
1,545 197 109 1.3 1.4 $12.08 4% 97 30
Freestanding Ambulatory Surgical and Emergency Centers
206 39 (17) 2.1 1.4 $37.27 47% 90 440
Industrial Inputs Totals 4,443 937 236 1.6 1.4 $22.23 36% 13,142 1,258
Purchasers and Distributors
HMO Medical Centers 449 25 (73) 1.5 1.4 $17.47 53% 160 393
Outpatient Mental Health and Substance Abuse Centers
480 51 41 1.6 1.4 $20.48 53% 108 487
Veterinary Services 667 137 27 1.4 1.4 $13.15 24% 25 120
Offices of Dentists 1,535 233 37 1.6 1.4 $19.77 33% 5 438
Offices of Physical, 588 92 (47) 1.5 1.4 $18.33 54% 2 155

48
Occupational and Speech Therapists, and Audiologists
Nursing Care Facilities 1,962 172 (79) 1.5 1.4 $14.30 18% 1 232
Purchasers Totals 5,681 710 (94) 1.5 1.4 $16.83 32% 300 1,826
TDL
General Freight Trucking, Local
308 (67) (78) 1.6 1.7 $14.42 2% 299 16
General Warehousing and Storage
555 44 (18) 1.6 1.4 $18.11 11% 181 18
General Freight Trucking, Long-Distance, Less Than Truckload
255 64 41 2.0 1.6 $22.59 3% 121 18
General Freight Trucking, Long-Distance, Truckload
742 15 (28) 1.9 1.7 $20.45 3% 119 52
Rail Transportation 222 10 9 2.9 1.8 $42.90 67% 37 37
Specialized Freight (except Used Goods) Trucking, Local
538 (5) (42) 1.8 1.7 $16.60 5% 23 33
TDL Totals 2,620 61 (115) 1.8 1.6 $20.57 10% 780 174
Cluster Total 22,504 3,137 244 1.7 1.5 $22.60 38% 22,306 8,084
Source: EMSI Complete Employment – 1.2012; EMSI input-output model calculations
Unlike the previously discussed clusters, there is not as much buying and selling occurring between the
core industries in the chemical product and plastics manufacturing cluster. Rather, core industries from
the other clusters are buying from the chemical product and plastics manufacturing cluster, particularly
from the plastics bottle manufacturing and basic organic chemical manufacturing industries. Out of this
cluster’s core industries, glass product manufacturing is buying the most from the other core industries.
Industrial inputs are importing the largest amount into the region; around 80% of their total
requirements. As seen in the table below, this is primarily due to plastics material and resin
manufacturing.
Table 11: Chemical Product and Plastics Manufacturing Detailed Cluster Data
Description 2012 Jobs
2012-18 Job Change
2012-18 Shiftshare
Jobs Multi-plier
Earnings Multi-plier
2011 Industry Average
Wage
% Occs High
Wage
Core Imports
(K)
Sales from
Group (K)
Core
Glass Product Mfg Made of Purchased Glass
514 65 85 2.0 1.7 $19.80 14% 209 4,691
All Other Miscellaneous Chemical Product and Preparation Mfg
122 (12) (25) 3.0 2.2 $25.89 57% 239 2,858
All Other Basic Inorganic Chemical Mfg
67 (23) (13) 5.2 2.2 $51.16 25% 187 2,402
All Other Basic Organic Chemical Mfg
40 23 28 1.7 1.5 $17.90 19% 3,102 1,953
Other Pressed and Blown Glass and Glassware Mfg
13 3 9 2.0 1.8 $20.04 10% 2,351 12
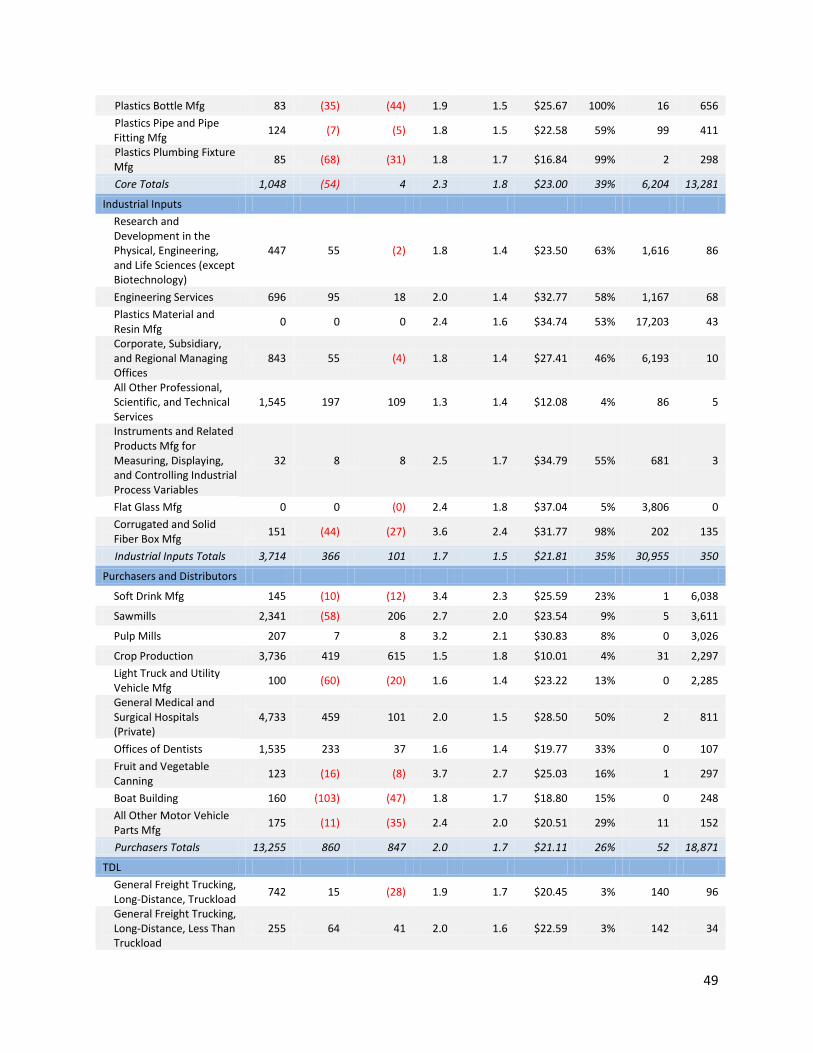
49
Plastics Bottle Mfg 83 (35) (44) 1.9 1.5 $25.67 100% 16 656
Plastics Pipe and Pipe Fitting Mfg
124 (7) (5) 1.8 1.5 $22.58 59% 99 411
Plastics Plumbing Fixture Mfg
85 (68) (31) 1.8 1.7 $16.84 99% 2 298
Core Totals 1,048 (54) 4 2.3 1.8 $23.00 39% 6,204 13,281
Industrial Inputs
Research and Development in the Physical, Engineering, and Life Sciences (except Biotechnology)
447 55 (2) 1.8 1.4 $23.50 63% 1,616 86
Engineering Services 696 95 18 2.0 1.4 $32.77 58% 1,167 68
Plastics Material and Resin Mfg
0 0 0 2.4 1.6 $34.74 53% 17,203 43
Corporate, Subsidiary, and Regional Managing Offices
843 55 (4) 1.8 1.4 $27.41 46% 6,193 10
All Other Professional, Scientific, and Technical Services
1,545 197 109 1.3 1.4 $12.08 4% 86 5
Instruments and Related Products Mfg for Measuring, Displaying, and Controlling Industrial Process Variables
32 8 8 2.5 1.7 $34.79 55% 681 3
Flat Glass Mfg 0 0 (0) 2.4 1.8 $37.04 5% 3,806 0
Corrugated and Solid Fiber Box Mfg
151 (44) (27) 3.6 2.4 $31.77 98% 202 135
Industrial Inputs Totals 3,714 366 101 1.7 1.5 $21.81 35% 30,955 350
Purchasers and Distributors
Soft Drink Mfg 145 (10) (12) 3.4 2.3 $25.59 23% 1 6,038
Sawmills 2,341 (58) 206 2.7 2.0 $23.54 9% 5 3,611
Pulp Mills 207 7 8 3.2 2.1 $30.83 8% 0 3,026
Crop Production 3,736 419 615 1.5 1.8 $10.01 4% 31 2,297
Light Truck and Utility Vehicle Mfg
100 (60) (20) 1.6 1.4 $23.22 13% 0 2,285
General Medical and Surgical Hospitals (Private)
4,733 459 101 2.0 1.5 $28.50 50% 2 811
Offices of Dentists 1,535 233 37 1.6 1.4 $19.77 33% 0 107
Fruit and Vegetable Canning
123 (16) (8) 3.7 2.7 $25.03 16% 1 297
Boat Building 160 (103) (47) 1.8 1.7 $18.80 15% 0 248
All Other Motor Vehicle Parts Mfg
175 (11) (35) 2.4 2.0 $20.51 29% 11 152
Purchasers Totals 13,255 860 847 2.0 1.7 $21.11 26% 52 18,871
TDL
General Freight Trucking, Long-Distance, Truckload
742 15 (28) 1.9 1.7 $20.45 3% 140 96
General Freight Trucking, Long-Distance, Less Than Truckload
255 64 41 2.0 1.6 $22.59 3% 142 34

50
General Warehousing and Storage
555 44 (18) 1.6 1.4 $18.11 11% 90 31
General Freight Trucking, Local
308 (67) (78) 1.6 1.7 $14.42 2% 352 28
Specialized Freight (except Used Goods) Trucking, Local
538 (5) (42) 1.8 1.7 $16.60 5% 27 60
Rail Transportation 222 10 9 2.9 1.8 $42.90 67% 230 57
TDL Totals 2,620 61 (115) 1.8 1.6 $20.57 10% 981 305
Cluster Total 20,637 1,233 837 1.9 1.6 $21.26 26% 38,193 32,808
Source: EMSI Complete Employment – 1.2012; EMSI input-output model calculations
Since the IT/Telecommunications core industries are very interlinked with each other, they are buying
and selling a lot amongst each other. However, purchasers and distributors buy more from the core
industries. As seen in the table below, this is primarily due to hospitals and investment advice
industries. Quantitatively, the core industries import the most into the region. However, in percentage
terms, this is less than 50% of their requirements. Industrial inputs, on the other hand, import around
70% of their requirements, primarily in terms of administrative and engineering services.
Table 12: IT/Telecommunications Detailed Cluster Data
Description 2012 Jobs
2012-18 Job Change
2012-18 Shiftshare
Jobs Multi-plier
Earnings Multi-plier
2011 Industry Average
Wage
% Occs High
Wage
Core Imports
(K)
Sales from
Group (K)
Core
Wired Telecomm Carriers 529 11 22 3.4 2.2 $28.20 51% 11,040 13,014
Wireless Telecomm Carriers (except Satellite)
117 (4) (4) 2.6 1.9 $25.15 38% 3,327 2,525
Data Processing, Hosting, and Related Services
121 16 (7) 1.7 1.7 $13.70 8% 1,371 352
Computer Systems Design Services
724 243 87 1.8 1.4 $31.62 52% 831 1,278
Software Publishers 162 31 7 2.5 1.8 $24.68 61% 774 464
Custom Computer Programming Services
427 47 (32) 1.5 1.4 $19.08 35% 589 287
Other Computer Related Services
151 (35) (34) 1.7 1.4 $27.42 46% 201 290
Computer Facilities Management Services
55 5 7 1.9 1.4 $34.61 60% 96 113
Computer and Office Machine Repair and Maintenance
121 4 9 1.5 1.4 $16.09 29% 12 60
Core Totals 2,407 318 56 2.2 1.6 $25.99 45% 18,241 18,384
Industrial Inputs
Engineering Services 696 95 18 2.0 1.4 $32.77 58% 7,207 1,144
Administrative and General Mngt Consulting Services
1,161 363 38 1.6 1.5 $20.88 55% 1,813 566
Office Administrative Services
581 76 4 1.5 1.4 $15.40 22% 1,151 292
All Other Telecomm 30 7 2 2.2 2.1 $16.85 43% 971 397

51
R&D in the Physical, Engineering, and Life Sciences
447 55 (2) 1.8 1.4 $23.50 63% 535 520
All Other Professional, Scientific, and Technical Services
1,545 197 109 1.3 1.4 $12.08 4% 200 351
Graphic Design Services 252 52 14 1.3 1.4 $9.93 14% 577 62
Printed Circuit Assembly (Electronic Assembly) Mfg
1 0 1 1.2 1.3 $13.54 24% 478 0
Other Communication and Energy Wire Mfg
0 0 0 1.7 1.4 $28.87 30% 466 0
Internet Publishing and Broadcasting and Web Search Portals
74 7 (11) 2.0 1.6 $28.17 39% 223 260
Industrial Inputs Totals 4,787 852 172 1.6 1.4 $18.86 33% 13,622 3,593
Purchasers and Distributors
Telemarketing Bureaus and Other Contact Centers
828 168 95 1.3 1.4 $10.60 15% 218 579
Investment Advice 1,185 391 165 3.8 1.5 $94.83 28% 122 11,087
Computer and Computer Peripheral Equipment and Software Merchant Wholesalers
791 210 269 4.6 1.6 $87.34 51% 18 2,552
Offices of Physicians 2,938 589 131 1.8 1.4 $29.44 40% 9 1,608
General Medical and Surgical Hospitals (Private)
4,733 459 101 2.0 1.5 $28.50 50% 8 3,216
Sawmills 2,341 (58) 206 2.7 2.0 $23.54 9% 2 2,826
Offices of Dentists 1,535 233 37 1.6 1.4 $19.77 33% 0 579
Computer Training (Private)
149 (80) (60) 3.4 1.4 $83.84 35% 0 939
Purchasers Totals 14,500 1,912 944 2.3 1.5 $35.14 36% 376 23,385
TDL
General Freight Trucking, Long-Distance, Less Than Truckload
255 64 41 2.0 1.6 $22.59 3% 21 184
General Warehousing and Storage
555 44 (18) 1.6 1.4 $18.11 11% 60 173
General Freight Trucking, Local
308 (67) (78) 1.6 1.7 $14.42 2% 51 155
General Freight Trucking, Long-Distance, Truckload
742 15 (28) 1.9 1.7 $20.45 3% 20 519
Rail Transportation 222 10 9 2.9 1.8 $42.90 67% 9 630
Specialized Freight (except Used Goods) Trucking, Local
538 (5) (42) 1.8 1.7 $16.60 5% 4 325
TDL Totals 2,620 61 (115) 1.8 1.6 $20.57 10% 165 1,985
Cluster Total 24,314 3,143 1,056 2.1 1.5 $29.46 33% 32,405 47,348
Source: EMSI Complete Employment – 1.2012; EMSI input-output model calculations
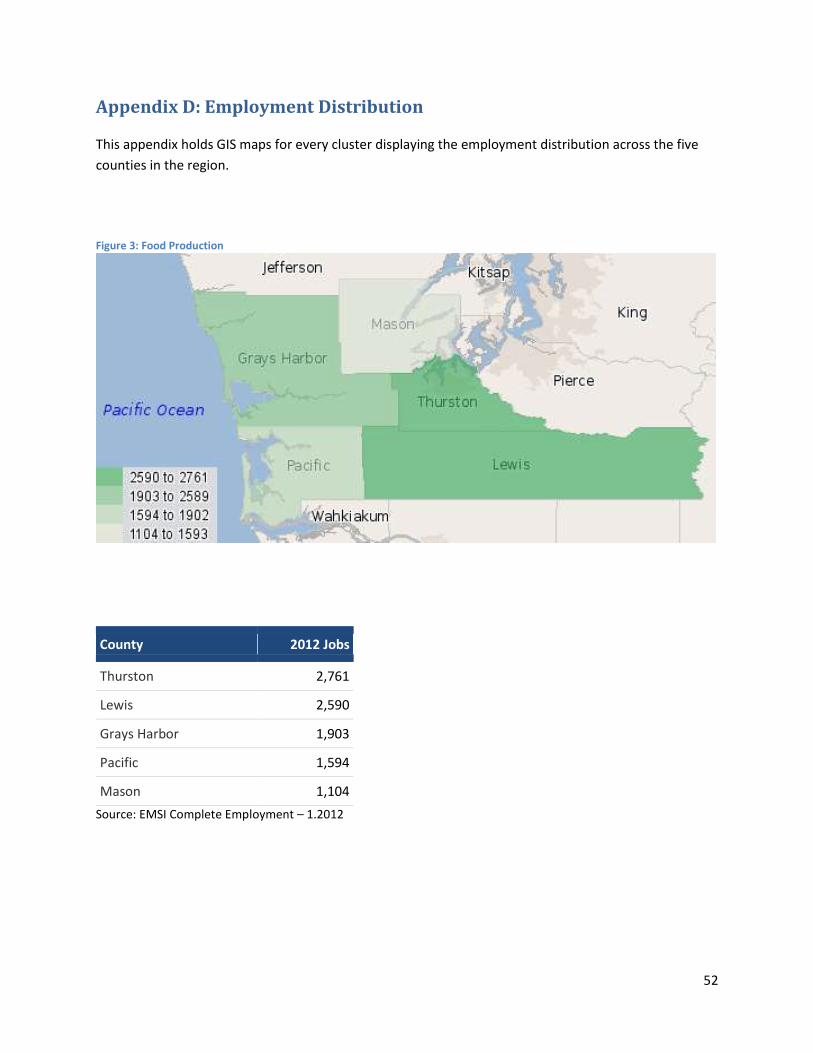
52
Appendix D: Employment Distribution
This appendix holds GIS maps for every cluster displaying the employment distribution across the five
counties in the region.
Figure 3: Food Production
County 2012 Jobs
Thurston 2,761
Lewis 2,590
Grays Harbor 1,903
Pacific 1,594
Mason 1,104
Source: EMSI Complete Employment – 1.2012

53
Figure 4: Wood Product and Paper Manufacturing
County 2012 Jobs
Lewis 2,474
Grays Harbor 2,183
Thurston 1,329
Mason 1,060
Pacific 279
Source: EMSI Complete Employment – 1.2012
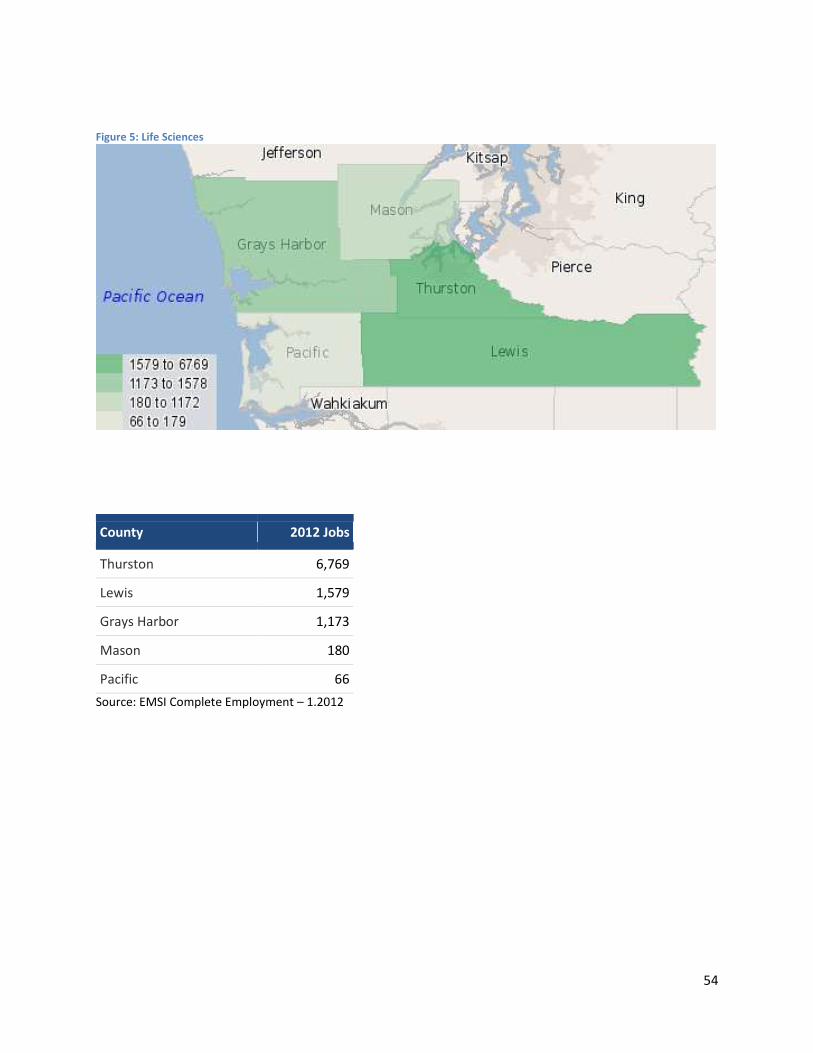
54
Figure 5: Life Sciences
County 2012 Jobs
Thurston 6,769
Lewis 1,579
Grays Harbor 1,173
Mason 180
Pacific 66
Source: EMSI Complete Employment – 1.2012
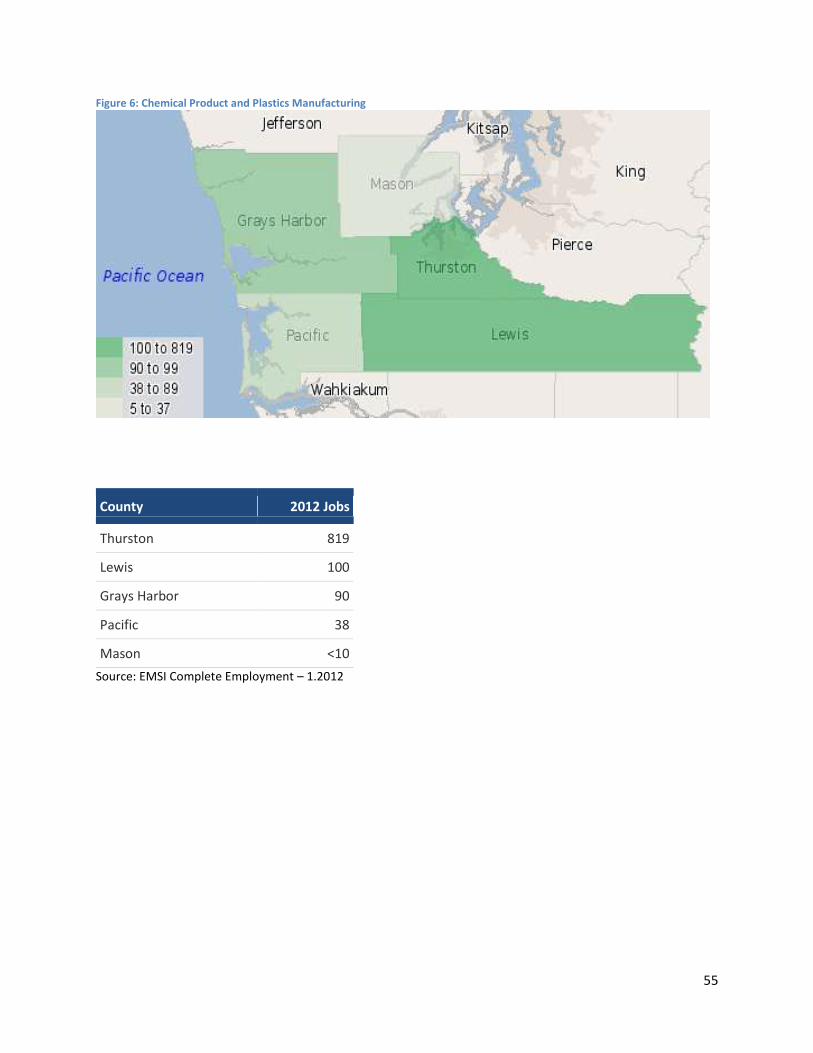
55
Figure 6: Chemical Product and Plastics Manufacturing
County 2012 Jobs
Thurston 819
Lewis 100
Grays Harbor 90
Pacific 38
Mason <10
Source: EMSI Complete Employment – 1.2012

56
Figure 7: IT/Telecommunications
County 2012 Jobs
Thurston 1801
Lewis 233
Mason 171
Grays Harbor 165
Pacific 42
Source: EMSI Complete Employment – 1.2012
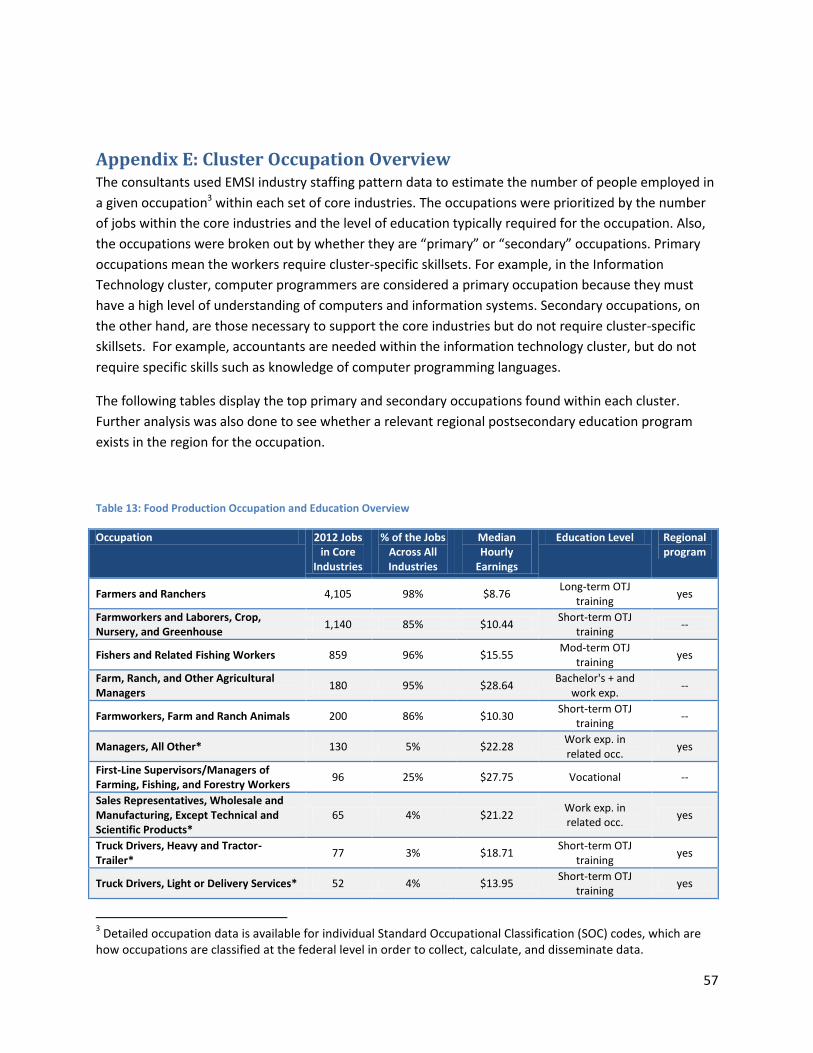
57
Appendix E: Cluster Occupation Overview The consultants used EMSI industry staffing pattern data to estimate the number of people employed in
a given occupation3 within each set of core industries. The occupations were prioritized by the number
of jobs within the core industries and the level of education typically required for the occupation. Also,
the occupations were broken out by whether they are “primary” or “secondary” occupations. Primary
occupations mean the workers require cluster-specific skillsets. For example, in the Information
Technology cluster, computer programmers are considered a primary occupation because they must
have a high level of understanding of computers and information systems. Secondary occupations, on
the other hand, are those necessary to support the core industries but do not require cluster-specific
skillsets. For example, accountants are needed within the information technology cluster, but do not
require specific skills such as knowledge of computer programming languages.
The following tables display the top primary and secondary occupations found within each cluster.
Further analysis was also done to see whether a relevant regional postsecondary education program
exists in the region for the occupation.
Table 13: Food Production Occupation and Education Overview
Occupation 2012 Jobs in Core
Industries
% of the Jobs Across All Industries
Median Hourly
Earnings
Education Level Regional program
Farmers and Ranchers 4,105 98% $8.76 Long-term OTJ
training yes
Farmworkers and Laborers, Crop, Nursery, and Greenhouse
1,140 85% $10.44 Short-term OTJ
training --
Fishers and Related Fishing Workers 859 96% $15.55 Mod-term OTJ
training yes
Farm, Ranch, and Other Agricultural Managers
180 95% $28.64 Bachelor's + and
work exp. --
Farmworkers, Farm and Ranch Animals 200 86% $10.30 Short-term OTJ
training --
Managers, All Other* 130 5% $22.28 Work exp. in related occ.
yes
First-Line Supervisors/Managers of Farming, Fishing, and Forestry Workers
96 25% $27.75 Vocational --
Sales Representatives, Wholesale and Manufacturing, Except Technical and Scientific Products*
65 4% $21.22 Work exp. in related occ.
yes
Truck Drivers, Heavy and Tractor-Trailer*
77 3% $18.71 Short-term OTJ
training yes
Truck Drivers, Light or Delivery Services* 52 4% $13.95 Short-term OTJ
training yes
3 Detailed occupation data is available for individual Standard Occupational Classification (SOC) codes, which are
how occupations are classified at the federal level in order to collect, calculate, and disseminate data.
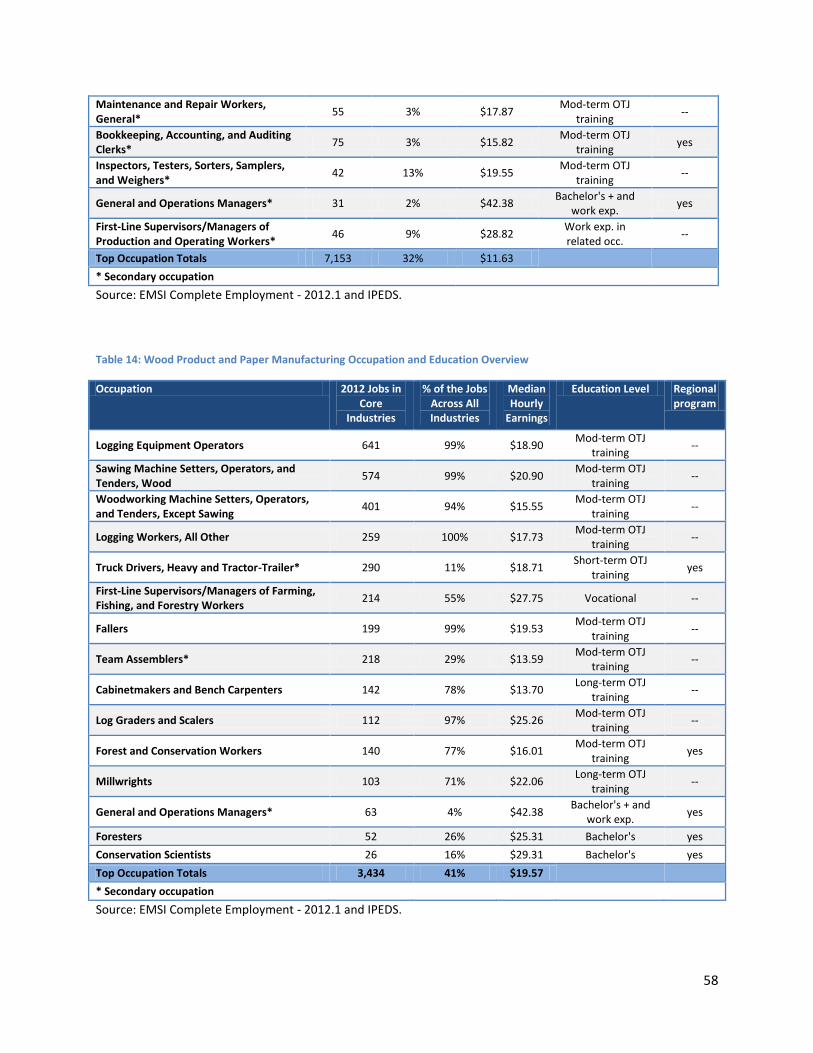
58
Maintenance and Repair Workers, General*
55 3% $17.87 Mod-term OTJ
training --
Bookkeeping, Accounting, and Auditing Clerks*
75 3% $15.82 Mod-term OTJ
training yes
Inspectors, Testers, Sorters, Samplers, and Weighers*
42 13% $19.55 Mod-term OTJ
training --
General and Operations Managers* 31 2% $42.38 Bachelor's + and
work exp. yes
First-Line Supervisors/Managers of Production and Operating Workers*
46 9% $28.82 Work exp. in related occ.
--
Top Occupation Totals 7,153 32% $11.63
* Secondary occupation
Source: EMSI Complete Employment - 2012.1 and IPEDS.
Table 14: Wood Product and Paper Manufacturing Occupation and Education Overview
Occupation 2012 Jobs in Core
Industries
% of the Jobs Across All Industries
Median Hourly
Earnings
Education Level Regional program
Logging Equipment Operators 641 99% $18.90 Mod-term OTJ
training --
Sawing Machine Setters, Operators, and Tenders, Wood
574 99% $20.90 Mod-term OTJ
training --
Woodworking Machine Setters, Operators, and Tenders, Except Sawing
401 94% $15.55 Mod-term OTJ
training --
Logging Workers, All Other 259 100% $17.73 Mod-term OTJ
training --
Truck Drivers, Heavy and Tractor-Trailer* 290 11% $18.71 Short-term OTJ
training yes
First-Line Supervisors/Managers of Farming, Fishing, and Forestry Workers
214 55% $27.75 Vocational --
Fallers 199 99% $19.53 Mod-term OTJ
training --
Team Assemblers* 218 29% $13.59 Mod-term OTJ
training --
Cabinetmakers and Bench Carpenters 142 78% $13.70 Long-term OTJ
training --
Log Graders and Scalers 112 97% $25.26 Mod-term OTJ
training --
Forest and Conservation Workers 140 77% $16.01 Mod-term OTJ
training yes
Millwrights 103 71% $22.06 Long-term OTJ
training --
General and Operations Managers* 63 4% $42.38 Bachelor's + and
work exp. yes
Foresters 52 26% $25.31 Bachelor's yes
Conservation Scientists 26 16% $29.31 Bachelor's yes
Top Occupation Totals 3,434 41% $19.57
* Secondary occupation
Source: EMSI Complete Employment - 2012.1 and IPEDS.

59
Table 15: Life Sciences Occupation and Education Overview
Occupation 2012 Jobs in Core
Industries
% of the Jobs Across All Industries
Median Hourly
Earnings
Education Level Regional program
Registered Nurses 1,562 53% $34.09 Associate's yes
Medical Assistants 517 66% $15.47 Mod-term OTJ
training yes
Medical Secretaries 572 55% $17.34 Mod-term OTJ
training yes
Clinical, Counseling, and School Psychologists 323 43% $30.24 Doctoral yes
Management Analysts* 245 16% $28.05 Bachelor's + and
work exp. yes
Physicians and Surgeons, All Other 260 74% $69.68 First professional --
Nursing Aides, Orderlies, and Attendants 245 16% $11.62 Vocational yes
Radiologic Technologists and Technicians 170 78% $28.30 Associate's --
Physician Assistants 99 73% $40.75 Master's --
Family and General Practitioners 115 71% $71.08 First professional --
Surgical Technologists 101 71% $18.67 Vocational yes
Medical Records and Health Information Technicians
127 53% $14.98 Associate's yes
First-Line Supervisors/Managers of Office and Administrative Support Workers*
131 8% $21.61 Work exp. in related occ.
yes
Computer Software Engineers, Systems Software*
97 8% $40.71 Bachelor's yes
Network and Computer Systems Administrators*
94 7% $31.73 Bachelor's yes
Top Occupation Totals 4,658 33% $29.91
* Secondary occupation
Source: EMSI Complete Employment - 2012.1 and IPEDS.
Table 16: Chemical Product and Plastics Manufacturing Occupation and Education Overview
Occupation 2012 Jobs in Core
Industries
% of the Jobs Across All Industries
Median Hourly
Earnings
Education Level Regional program
Chemical Plant and System Operators 60 71% $26.65 Long-term OTJ
training --
Team Assemblers* 62 8% $13.59 Mod-term OTJ
training --
Extruding and Drawing Machine Setters, Operators, and Tenders, Metal and Plastic
47 43% $11.29 Mod-term OTJ
training --
Maintenance and Repair Workers, General* 33 2% $17.87 Mod-term OTJ
training --
Sales Representatives, Wholesale and Manufacturing, Except Technical and Scientific Products*
18 1% $21.22 Work exp. in related occ.
yes
Molding, & Casting Machine Setters, Operators, and Tenders, Metal & Plastic
18 30% $13.07 Mod-term OTJ
training --
Inspectors, Testers, Sorters, and Samplers* 24 7% $19.55 Mod-term OTJ
training --
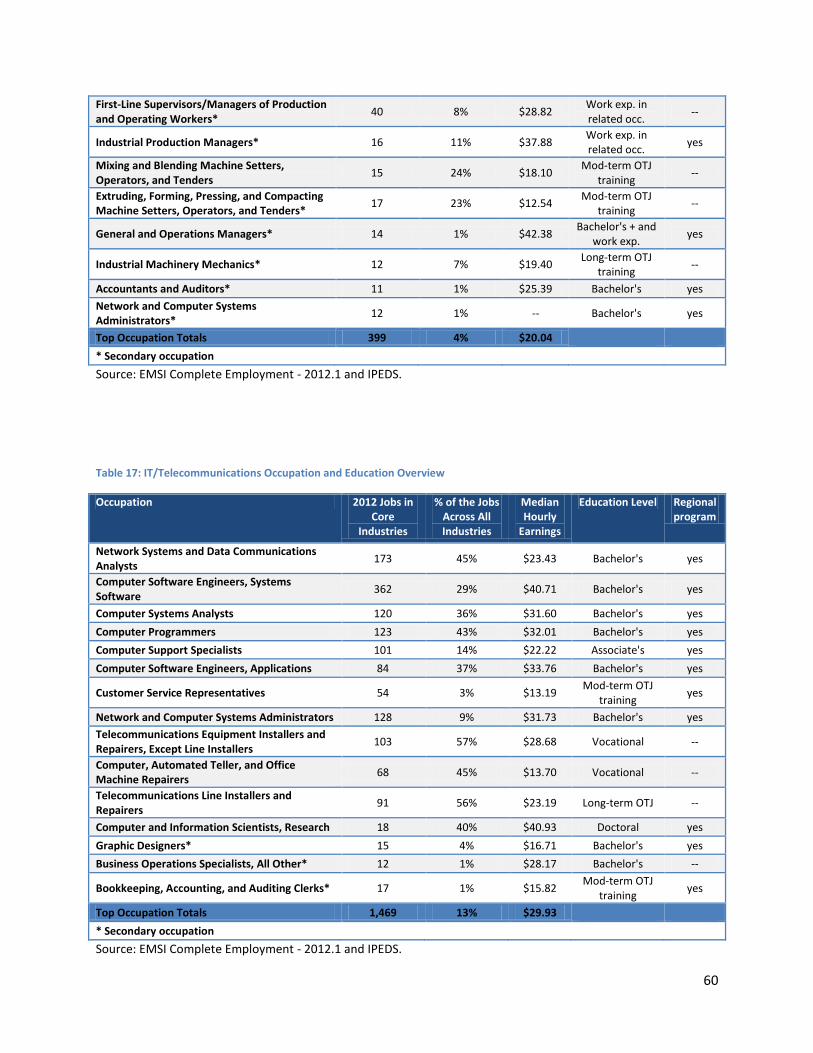
60
First-Line Supervisors/Managers of Production and Operating Workers*
40 8% $28.82 Work exp. in related occ. --
Industrial Production Managers* 16 11% $37.88 Work exp. in related occ. yes
Mixing and Blending Machine Setters, Operators, and Tenders
15 24% $18.10 Mod-term OTJ
training --
Extruding, Forming, Pressing, and Compacting Machine Setters, Operators, and Tenders*
17 23% $12.54 Mod-term OTJ
training --
General and Operations Managers* 14 1% $42.38 Bachelor's + and
work exp. yes
Industrial Machinery Mechanics* 12 7% $19.40 Long-term OTJ
training --
Accountants and Auditors* 11 1% $25.39 Bachelor's yes
Network and Computer Systems Administrators*
12 1% -- Bachelor's yes
Top Occupation Totals 399 4% $20.04
* Secondary occupation
Source: EMSI Complete Employment - 2012.1 and IPEDS.
Table 17: IT/Telecommunications Occupation and Education Overview
Occupation 2012 Jobs in Core
Industries
% of the Jobs Across All Industries
Median Hourly
Earnings
Education Level Regional program
Network Systems and Data Communications Analysts
173 45% $23.43 Bachelor's yes
Computer Software Engineers, Systems Software
362 29% $40.71 Bachelor's yes
Computer Systems Analysts 120 36% $31.60 Bachelor's yes
Computer Programmers 123 43% $32.01 Bachelor's yes
Computer Support Specialists 101 14% $22.22 Associate's yes
Computer Software Engineers, Applications 84 37% $33.76 Bachelor's yes
Customer Service Representatives 54 3% $13.19 Mod-term OTJ
training yes
Network and Computer Systems Administrators 128 9% $31.73 Bachelor's yes
Telecommunications Equipment Installers and Repairers, Except Line Installers
103 57% $28.68 Vocational --
Computer, Automated Teller, and Office Machine Repairers
68 45% $13.70 Vocational --
Telecommunications Line Installers and Repairers
91 56% $23.19 Long-term OTJ --
Computer and Information Scientists, Research 18 40% $40.93 Doctoral yes
Graphic Designers* 15 4% $16.71 Bachelor's yes
Business Operations Specialists, All Other* 12 1% $28.17 Bachelor's --
Bookkeeping, Accounting, and Auditing Clerks* 17 1% $15.82 Mod-term OTJ
training yes
Top Occupation Totals 1,469 13% $29.93
* Secondary occupation
Source: EMSI Complete Employment - 2012.1 and IPEDS.
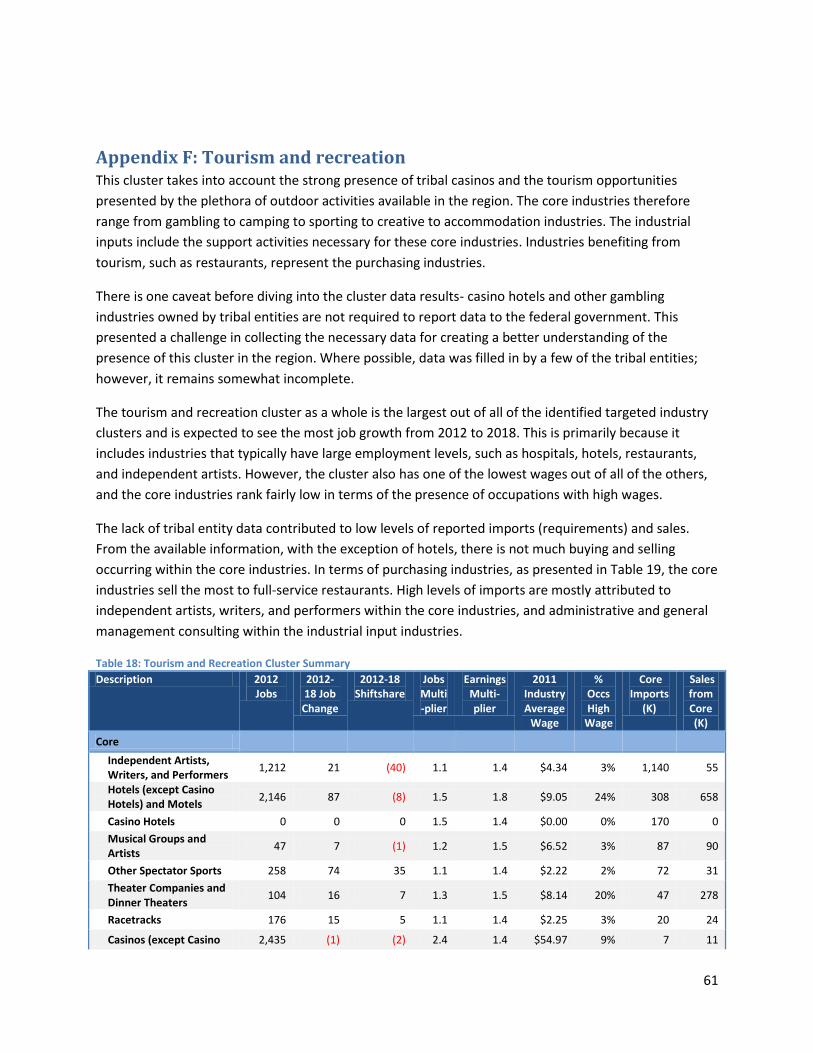
61
Appendix F: Tourism and recreation This cluster takes into account the strong presence of tribal casinos and the tourism opportunities
presented by the plethora of outdoor activities available in the region. The core industries therefore
range from gambling to camping to sporting to creative to accommodation industries. The industrial
inputs include the support activities necessary for these core industries. Industries benefiting from
tourism, such as restaurants, represent the purchasing industries.
There is one caveat before diving into the cluster data results- casino hotels and other gambling
industries owned by tribal entities are not required to report data to the federal government. This
presented a challenge in collecting the necessary data for creating a better understanding of the
presence of this cluster in the region. Where possible, data was filled in by a few of the tribal entities;
however, it remains somewhat incomplete.
The tourism and recreation cluster as a whole is the largest out of all of the identified targeted industry
clusters and is expected to see the most job growth from 2012 to 2018. This is primarily because it
includes industries that typically have large employment levels, such as hospitals, hotels, restaurants,
and independent artists. However, the cluster also has one of the lowest wages out of all of the others,
and the core industries rank fairly low in terms of the presence of occupations with high wages.
The lack of tribal entity data contributed to low levels of reported imports (requirements) and sales.
From the available information, with the exception of hotels, there is not much buying and selling
occurring within the core industries. In terms of purchasing industries, as presented in Table 19, the core
industries sell the most to full-service restaurants. High levels of imports are mostly attributed to
independent artists, writers, and performers within the core industries, and administrative and general
management consulting within the industrial input industries.
Table 18: Tourism and Recreation Cluster Summary
Description 2012 Jobs
2012-18 Job Change
2012-18 Shiftshare
Jobs Multi-plier
Earnings Multi-plier
2011 Industry Average
Wage
% Occs High
Wage
Core Imports
(K)
Sales from Core (K)
Core
Independent Artists, Writers, and Performers
1,212 21 (40) 1.1 1.4 $4.34 3% 1,140 55
Hotels (except Casino Hotels) and Motels
2,146 87 (8) 1.5 1.8 $9.05 24% 308 658
Casino Hotels 0 0 0 1.5 1.4 $0.00 0% 170 0
Musical Groups and Artists
47 7 (1) 1.2 1.5 $6.52 3% 87 90
Other Spectator Sports 258 74 35 1.1 1.4 $2.22 2% 72 31
Theater Companies and Dinner Theaters
104 16 7 1.3 1.5 $8.14 20% 47 278
Racetracks 176 15 5 1.1 1.4 $2.25 3% 20 24
Casinos (except Casino 2,435 (1) (2) 2.4 1.4 $54.97 9% 7 11
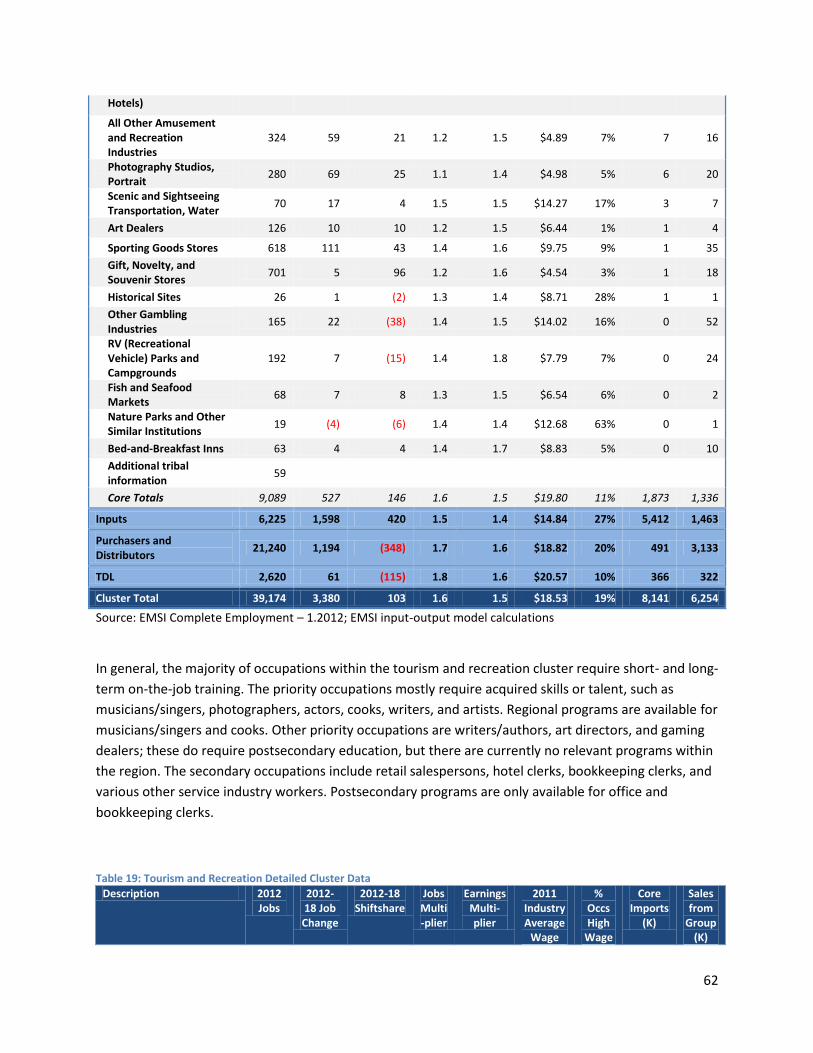
62
Hotels)
All Other Amusement and Recreation Industries
324 59 21 1.2 1.5 $4.89 7% 7 16
Photography Studios, Portrait
280 69 25 1.1 1.4 $4.98 5% 6 20
Scenic and Sightseeing Transportation, Water
70 17 4 1.5 1.5 $14.27 17% 3 7
Art Dealers 126 10 10 1.2 1.5 $6.44 1% 1 4
Sporting Goods Stores 618 111 43 1.4 1.6 $9.75 9% 1 35
Gift, Novelty, and Souvenir Stores
701 5 96 1.2 1.6 $4.54 3% 1 18
Historical Sites 26 1 (2) 1.3 1.4 $8.71 28% 1 1
Other Gambling Industries
165 22 (38) 1.4 1.5 $14.02 16% 0 52
RV (Recreational Vehicle) Parks and Campgrounds
192 7 (15) 1.4 1.8 $7.79 7% 0 24
Fish and Seafood Markets
68 7 8 1.3 1.5 $6.54 6% 0 2
Nature Parks and Other Similar Institutions
19 (4) (6) 1.4 1.4 $12.68 63% 0 1
Bed-and-Breakfast Inns 63 4 4 1.4 1.7 $8.83 5% 0 10
Additional tribal information
59
Core Totals 9,089 527 146 1.6 1.5 $19.80 11% 1,873 1,336
Inputs 6,225 1,598 420 1.5 1.4 $14.84 27% 5,412 1,463
Purchasers and Distributors
21,240 1,194 (348) 1.7 1.6 $18.82 20% 491 3,133
TDL 2,620 61 (115) 1.8 1.6 $20.57 10% 366 322
Cluster Total 39,174 3,380 103 1.6 1.5 $18.53 19% 8,141 6,254
Source: EMSI Complete Employment – 1.2012; EMSI input-output model calculations
In general, the majority of occupations within the tourism and recreation cluster require short- and long-
term on-the-job training. The priority occupations mostly require acquired skills or talent, such as
musicians/singers, photographers, actors, cooks, writers, and artists. Regional programs are available for
musicians/singers and cooks. Other priority occupations are writers/authors, art directors, and gaming
dealers; these do require postsecondary education, but there are currently no relevant programs within
the region. The secondary occupations include retail salespersons, hotel clerks, bookkeeping clerks, and
various other service industry workers. Postsecondary programs are only available for office and
bookkeeping clerks.
Table 19: Tourism and Recreation Detailed Cluster Data
Description 2012 Jobs
2012-18 Job Change
2012-18 Shiftshare
Jobs Multi-plier
Earnings Multi-plier
2011 Industry Average
Wage
% Occs High
Wage
Core Imports
(K)
Sales from
Group (K)
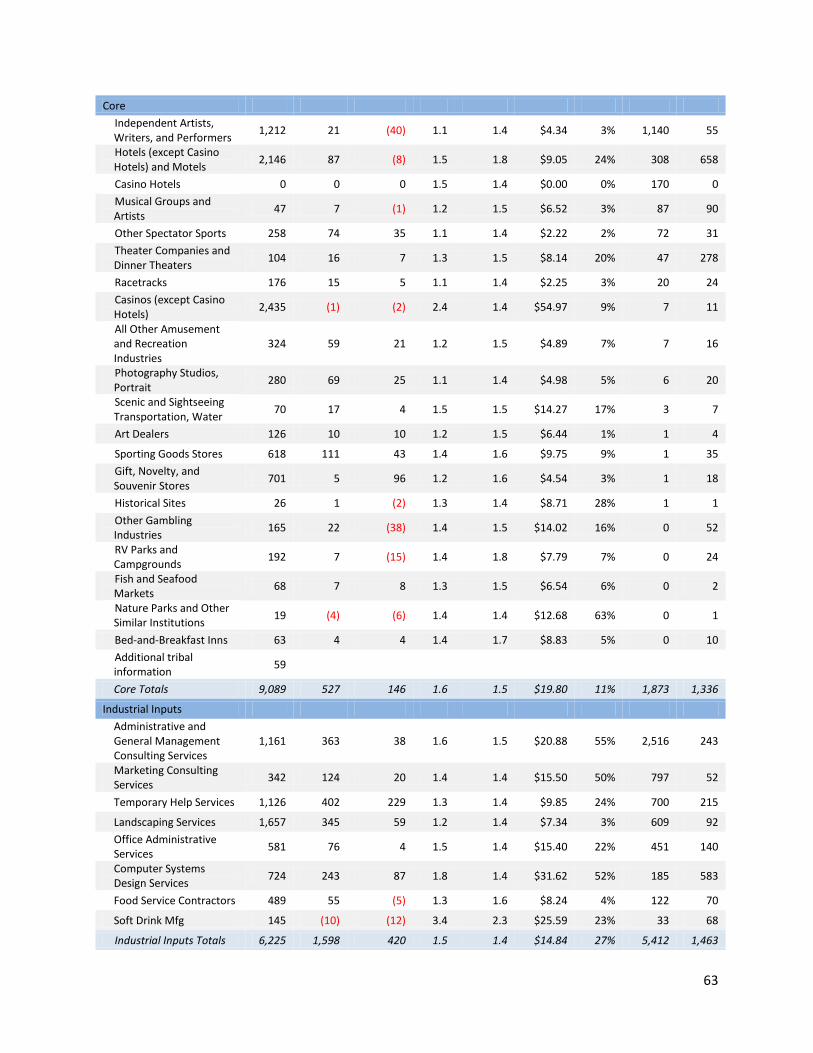
63
Core
Independent Artists, Writers, and Performers
1,212 21 (40) 1.1 1.4 $4.34 3% 1,140 55
Hotels (except Casino Hotels) and Motels
2,146 87 (8) 1.5 1.8 $9.05 24% 308 658
Casino Hotels 0 0 0 1.5 1.4 $0.00 0% 170 0
Musical Groups and Artists
47 7 (1) 1.2 1.5 $6.52 3% 87 90
Other Spectator Sports 258 74 35 1.1 1.4 $2.22 2% 72 31
Theater Companies and Dinner Theaters
104 16 7 1.3 1.5 $8.14 20% 47 278
Racetracks 176 15 5 1.1 1.4 $2.25 3% 20 24
Casinos (except Casino Hotels)
2,435 (1) (2) 2.4 1.4 $54.97 9% 7 11
All Other Amusement and Recreation Industries
324 59 21 1.2 1.5 $4.89 7% 7 16
Photography Studios, Portrait
280 69 25 1.1 1.4 $4.98 5% 6 20
Scenic and Sightseeing Transportation, Water
70 17 4 1.5 1.5 $14.27 17% 3 7
Art Dealers 126 10 10 1.2 1.5 $6.44 1% 1 4
Sporting Goods Stores 618 111 43 1.4 1.6 $9.75 9% 1 35
Gift, Novelty, and Souvenir Stores
701 5 96 1.2 1.6 $4.54 3% 1 18
Historical Sites 26 1 (2) 1.3 1.4 $8.71 28% 1 1
Other Gambling Industries
165 22 (38) 1.4 1.5 $14.02 16% 0 52
RV Parks and Campgrounds
192 7 (15) 1.4 1.8 $7.79 7% 0 24
Fish and Seafood Markets
68 7 8 1.3 1.5 $6.54 6% 0 2
Nature Parks and Other Similar Institutions
19 (4) (6) 1.4 1.4 $12.68 63% 0 1
Bed-and-Breakfast Inns 63 4 4 1.4 1.7 $8.83 5% 0 10
Additional tribal information
59
Core Totals 9,089 527 146 1.6 1.5 $19.80 11% 1,873 1,336
Industrial Inputs
Administrative and General Management Consulting Services
1,161 363 38 1.6 1.5 $20.88 55% 2,516 243
Marketing Consulting Services
342 124 20 1.4 1.4 $15.50 50% 797 52
Temporary Help Services 1,126 402 229 1.3 1.4 $9.85 24% 700 215
Landscaping Services 1,657 345 59 1.2 1.4 $7.34 3% 609 92
Office Administrative Services
581 76 4 1.5 1.4 $15.40 22% 451 140
Computer Systems Design Services
724 243 87 1.8 1.4 $31.62 52% 185 583
Food Service Contractors 489 55 (5) 1.3 1.6 $8.24 4% 122 70
Soft Drink Mfg 145 (10) (12) 3.4 2.3 $25.59 23% 33 68
Industrial Inputs Totals 6,225 1,598 420 1.5 1.4 $14.84 27% 5,412 1,463

64
Purchasers and Distributors
Full-Service Restaurants 5,106 29 (355) 1.4 1.6 $8.15 2% 366 717
Limited-Service Restaurants
4,633 145 (166) 1.3 1.6 $6.25 2% 95 501
Computer and Computer Peripheral Equipment and Software Merchant Wholesalers
791 210 269 4.6 1.6 $87.34 51% 13 654
Supermarkets and Other Grocery Stores
3,039 (238) (328) 1.5 1.5 $12.75 6% 9 239
General Medical and Surgical Hospitals (Private)
4,733 459 101 2.0 1.5 $28.50 50% 4 485
Offices of Physicians 2,938 589 131 1.8 1.4 $29.44 40% 4 536
Purchasers Totals 21,240 1,194 (348) 1.7 1.6 $18.82 20% 491 3,133
TDL
General Warehousing and Storage
555 44 (18) 1.6 1.4 $18.11 11% 181 36
General Freight Trucking, Local
308 (67) (78) 1.6 1.7 $14.42 2% 95 24
General Freight Trucking, Long-Distance, Truckload
742 15 (28) 1.9 1.7 $20.45 3% 39 80
General Freight Trucking, Long-Distance, Less Than Truckload
255 64 41 2.0 1.6 $22.59 3% 39 28
Specialized Freight (except Used Goods) Trucking, Local
538 (5) (42) 1.8 1.7 $16.60 5% 7 50
Rail Transportation 222 10 9 2.9 1.8 $42.90 67% 5 104
TDL Totals 2,620 61 (115) 1.8 1.6 $20.57 10% 366 322
Cluster Total 39,174 3,380 103 1.6 1.5 $18.53 19% 8,141 6,254
Source: EMSI Complete Employment – 1.2012; EMSI input-output model calculations
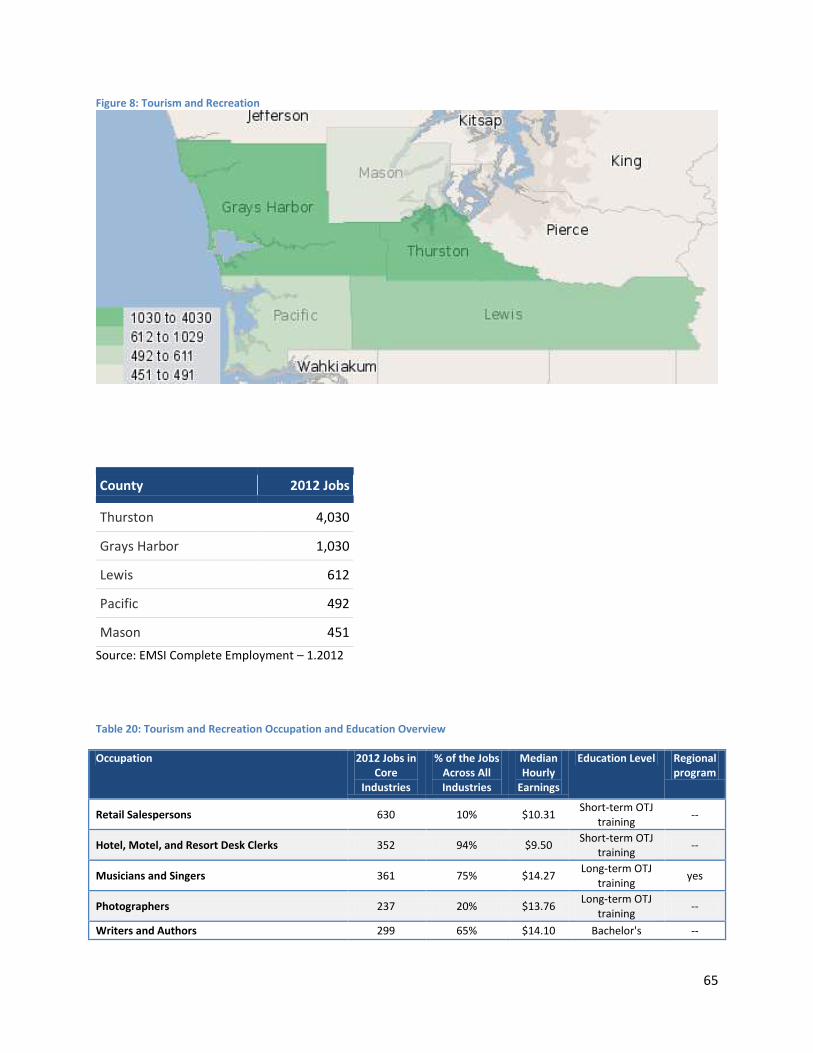
65
Figure 8: Tourism and Recreation
County 2012 Jobs
Thurston 4,030
Grays Harbor 1,030
Lewis 612
Pacific 492
Mason 451
Source: EMSI Complete Employment – 1.2012
Table 20: Tourism and Recreation Occupation and Education Overview
Occupation 2012 Jobs in Core
Industries
% of the Jobs Across All Industries
Median Hourly
Earnings
Education Level Regional program
Retail Salespersons 630 10% $10.31 Short-term OTJ
training --
Hotel, Motel, and Resort Desk Clerks 352 94% $9.50 Short-term OTJ
training --
Musicians and Singers 361 75% $14.27 Long-term OTJ
training yes
Photographers 237 20% $13.76 Long-term OTJ
training --
Writers and Authors 299 65% $14.10 Bachelor's --
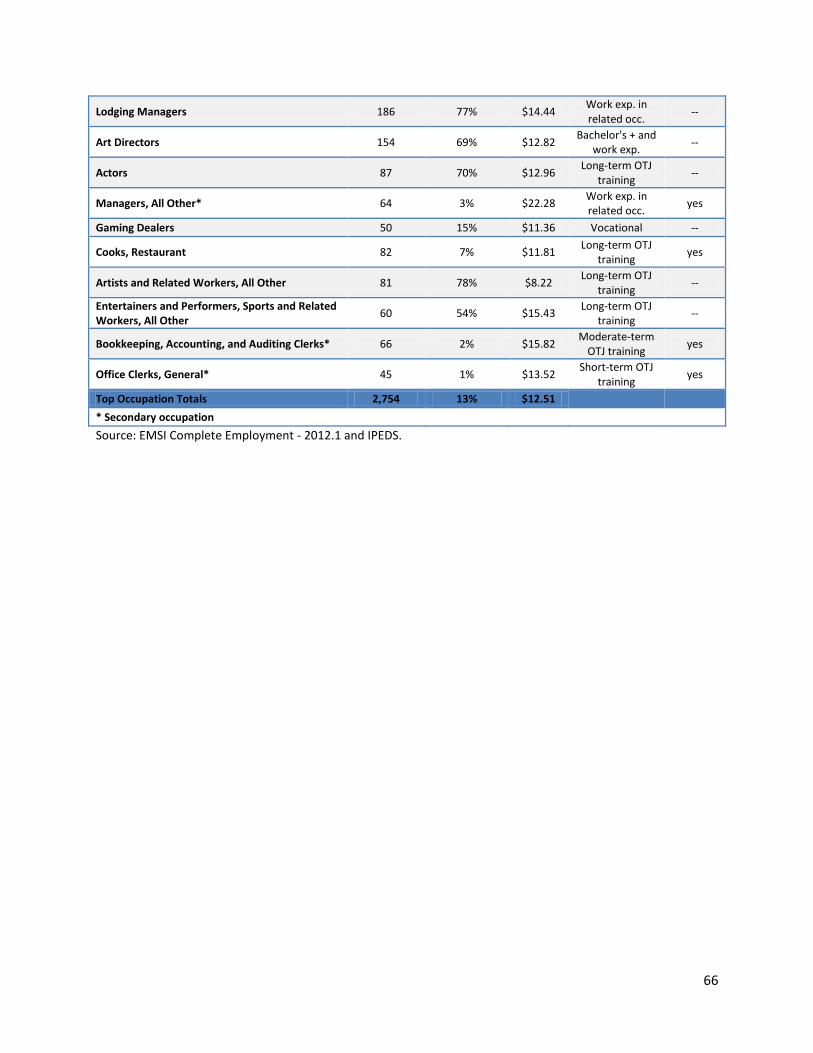
66
Lodging Managers 186 77% $14.44 Work exp. in related occ.
--
Art Directors 154 69% $12.82 Bachelor's + and
work exp. --
Actors 87 70% $12.96 Long-term OTJ
training --
Managers, All Other* 64 3% $22.28 Work exp. in related occ.
yes
Gaming Dealers 50 15% $11.36 Vocational --
Cooks, Restaurant 82 7% $11.81 Long-term OTJ
training yes
Artists and Related Workers, All Other 81 78% $8.22 Long-term OTJ
training --
Entertainers and Performers, Sports and Related Workers, All Other
60 54% $15.43 Long-term OTJ
training --
Bookkeeping, Accounting, and Auditing Clerks* 66 2% $15.82 Moderate-term
OTJ training yes
Office Clerks, General* 45 1% $13.52 Short-term OTJ
training yes
Top Occupation Totals 2,754 13% $12.51
* Secondary occupation
Source: EMSI Complete Employment - 2012.1 and IPEDS.

67
Appendix G: Boundary-Spanning Industries As discussed in the section on boundary spanners, several industries were identified as being present in
multiple clusters. While a selected list was included in Table 21, the following table includes all of those
industries. Note that some of the industries serve as a part of the core industries in at least one sector,
while other industries serve only input, purchasing, or TDL roles. They are listed in order of NAICS code,
not necessarily level of perceived importance by the consulting team.
NAICS Code
Description Role in Supply chain Cluster
111000 Crop Production Core Food Production
Purchaser/distributor Chemical Manu
311411 Frozen Fruit, Juice, and Vegetable Manufacturing Core Food Production
Purchasers/distributors Wood Product
311421 Fruit and Vegetable Canning Core Food Production
Purchasers/distributors Wood Product
Purchaser/distributor Chemical Manu
311712 Fresh and Frozen Seafood Processing Core Food Production
Purchasers/distributors Wood Product
312111 Soft Drink Manufacturing Core Food Production
Purchasers/distributors Wood Product
Purchaser/distributor Chemical Manu
Industrial input Tourism
321113 Sawmills Core Wood Product
Purchaser/distributor Chemical Manu
Purchaser/distributor IT
Purchaser/distributor Tourism
322110 Pulp Mills Core Wood Product
Purchaser/distributor Chemical Manu
322211 Corrugated and Solid Fiber Box Manufacturing Core Wood Product
Industrial Input Food Production
Industrial input Chemical Manu
325188 All Other Basic Inorganic Chemical Manufacturing Core Chemical Manu
Industrial Input Wood Product
326160 Plastics Bottle Manufacturing Industrial Input Food Production
Core Chemical Manu
327215 Glass Product Manufacturing Made of Purchased Glass Core Chemical Manu
Purchasers/distributors Wood Product
541512 Computer Systems Design Services Core IT

68
Industrial input Life Sciences
Industrial input Tourism
541712 R&D in the Physical, Engineering, and Life Sciences Core Life Sciences
Industrial Input Wood Product
Industrial input Chemical Manu
Industrial input IT
621111 Offices of Physicians (except Mental Health Specialists) Core Life Sciences
Purchaser/distributor IT
Purchaser/distributor Tourism
622110 General Medical and Surgical Hospitals (Private) Core Life Sciences
Purchasers/distributors Wood Product
Purchaser/Distributor Food Production
Purchaser/distributor Chemical Manu
Purchaser/distributor IT
Purchaser/distributor Tourism
721110 Hotels (except Casino Hotels) and Motels Core Tourism
Purchasers/distributors Wood Product
Purchaser/Distributor Food Production
722110 Full-Service Restaurants Purchaser/Distributor Food Production
Purchaser/distributor Tourism
722211 Limited-Service Restaurants Purchaser/Distributor Food Production
Purchaser/distributor Tourism
722310 Food Service Contractors Industrial input Tourism
Purchaser/Distributor Food Production
423430 Computer and Computer Peripheral Equipment and Software Merchant Wholesalers
Purchaser/distributor IT
Purchaser/distributor Tourism
425120 Wholesale Trade Agents and Brokers Industrial Input Food Production
Industrial Input Wood Product
445110 Supermarkets and Other Grocery (except Convenience) Stores Purchaser/Distributor Food Production
Purchaser/distributor Tourism
482110 Rail Transportation TDL Food Production
TDL Wood Product
TDL Life Sciences
TDL Chemical Manu
TDL IT
TDL Tourism
484110 General Freight Trucking, Local TDL Food Production
TDL Wood Product
TDL Life Sciences
TDL Chemical Manu
TDL IT
TDL Tourism

69
484121 General Freight Trucking, Long-Distance, Truckload TDL Food Production
TDL Wood Product
TDL Life Sciences
TDL Chemical Manu
TDL IT
TDL Tourism
484122 General Freight Trucking, Long-Distance, Less Than Truckload TDL Food Production
TDL Wood Product
TDL Life Sciences
TDL Chemical Manu
TDL IT
TDL Tourism
484220 Specialized Freight (except Used Goods) Trucking, Local TDL Food Production
TDL Wood Product
TDL Life Sciences
TDL Chemical Manu
TDL IT
TDL Tourism
493110 General Warehousing and Storage TDL Food Production
TDL Wood Product
TDL Life Sciences
TDL Chemical Manu
TDL IT
TDL Tourism
541330 Engineering Services Industrial Input Wood Product
Industrial input Life Sciences
Industrial input Chemical Manu
Industrial input IT
541611 Administrative Management and General Management Consulting Services
Industrial input Life Sciences
Industrial input IT
Industrial input Tourism
541990 All Other Professional, Scientific, and Technical Services Industrial input Life Sciences
Industrial input Chemical Manu
Industrial input IT
561110 Office Administrative Services Industrial input IT
Industrial input Tourism
621210 Offices of Dentists Purchaser/distributor Life Sciences
Purchaser/distributor Chemical Manu
Purchaser/distributor IT