Target efficiency of disability benefits for older...
34
Ruth Hancock, Marcello Morciano Health Economics Group, University of East Anglia Stephen Pudney Institute for Economic and Social Research, University of Essex supported by the ESRC work-in-progress: please do not quote or cite Target efficiency of disability benefits for older people in Britain
Transcript of Target efficiency of disability benefits for older...

Ruth Hancock, Marcello Morciano Health Economics Group, University of East Anglia
Stephen Pudney
Institute for Economic and Social Research, University of Essex
supported by the ESRC
work-in-progress: please do not quote or cite
Target efficiency of disability benefits for older people in Britain

Outline • Policy Background • The personal costs of disability • Measuring financial need, final income and target
efficiency • Data and simulation methods • Assessment of the current system of disability benefits for
older people • Assessment of reforms • Conclusions

Policy Background • Tight Local Authority (LA) budgets for social care services have
resulted in scrutiny of the disability benefits (DBs) system to see if money spent on DBs could be released for social care.
• Many more older people receive DBs than receive LA care; DBs have a non means-tested component whereas LA care is largely means-tested.
• Integrating DBs into social care suggested as an option by Wanless (2006), Green Paper on Social Care (2009) but dropped in 2010 White Paper. Dilnot left DBs intact but suggested re-branding Attendance Allowance.
• Commission on the Future of Health and Social Care in England, recently suggested means testing DBs for older people to release money to put into health and social care.
• Important to take account of disability costs in any assessment of whether DBs are going to people who need them (Hancock and Pudney, 2014).
The personal costs of disability • Various estimates of the personal costs faced by disabled people
have been made using the compensating variation principle (e.g. Zaidi and Burchardt, 2005; Jones and O’Donnell, 1995).
• Costs faced by disabled older people have been found to be substantial on average (£100 pw, 2007 prices) and strongly related to level of disability (Morciano et al, 2014).
• Recent non parametric approach produces costs which are lower on average (£48-£61), but still exceed mean levels of disability benefits (£28) or total public support (£47) and are strongly-related to severity of disability (Hancock et al, 2013).
• The standard parametric approach is prone to large overestimates unless standard assumptions hold; the non parametric approach may produce underestimates.
• We use the non parametric estimates so that policy conclusions are not driven by overestimates of disability costs.
• Our estimates aim to identify the effect of severity of disability on material living standards not on ‘happiness’.

Estimated disability costs compared with value of external support received (April 2007 prices)
Source: Hancock et al. (2013). Based on 4 years of data from the Family Resources Survey – around 21,000 pensioner units
Aims of public support for older disabled people
• To compensate, at least partially, for the costs that disabilities bring? • Targeting support on those least able to afford those costs e.g. those
whose incomes after meeting those costs would be below some threshold (a poverty line?)
• Three relevant income definitions: – Income before any public support (disability benefits and LA
services), net of disability costs i.e. achievable standard of living in the absence of public support – ‘pre-benefit income’
– Final income, including disability benefits and the value of LA services for comparison against a poverty threshold to which disability costs have been added
– Final income, including disability benefits and the value of LA services, net of disability costs i.e. standard of living achievable with public support, for comparison with non disabled people

The disability benefit system (April 2012 rates)
• Attendance Allowance (AA) and Disability Living Allowance (DLA), non means tested, non taxable, non contributory, disregarded in assessable income for mean-tested benefits, mutually exclusive
• Can be included in assessable income for means tests for social care after an allowance for disability-related expenditure
• Contributions to personal disability costs, not earnings replacement • AA, claimable from age 65
– £77.45 or £51.85 p.w; 1.6m GB recipients; £5.4bn annual cost • DLA must be claimed before age 65 but can continue after 65
– payable rates range from £20.55 to £131.95 (‘care’ and ‘mobility’ components); 0.9m DLA recipients aged 65+; £3.9bn annual cost
• Disability-related addition to means-tested benefits via the severe disability premium (SDP) £58.20, if AA or DLA (care) rec’d at middle or higher rate, subject to certain conditions. Annual cost for 65+: 20% of total DBs ???
• DLA is gradually being replaced by Personal Independence Payment – same structure but new assessment procedures
Methods (I)
Data • Four years of Family Resources Survey (FRS) data (2004/5 to
2007/8) restricted to households containing a single person aged 65+ or a couple where one partner is 65+ and the other has attained the (then) state pension age. Around 20,000 ‘pensioner units’.
Simulation model • CARESIM, used here as a static tax-benefit model for private
household population; simulates income tax liabilities, entitlements to means-tested benefits, liability for user contribution to Local Authority home care.
• Varies levels of components of disability benefits for those reporting receipt or extends/removes receipt according to disability level
• Disability level measured by an index constructed from self-reported difficulties in 9 domains of life e.g. getting around the home, recognising when in danger
• All money values expressed in 2012 prices

Methods (II)
Take-up of means-tested benefits assigned randomly, according to assumed take-up rates 1. Pension Credit, entitled to Guarantee Credit: 77% 2. Pension Credit, entitled to Savings Credit only: 55% 3. Housing Benefit/Council Tax Benefit, receiving Pension Credit: 100% 4. Housing Benefit, not receiving Pension Credit: 87% 5. Council Tax Benefit, not receiving Pension Credit, renters: 86% 6. Council Tax Benefit, not receiving Pension Credit, owners: 38%
No explicit response to change in entitlement but if reforms affect entitlement to Pension Credit/Guarantee Credit/Savings Credit, they can affect take-up

Is disability benefit expenditure well-targeted by
financial need?

Disability benefits expenditure by income decile, HBAI AHC definition (includes DBs)
0%
5%
10%
15%
20%
25%
30%
1 (low) 2 3 4 5 6 7 8 9 10(high)
% o
f DB
expe
nditu
re
Decile of income (pensioner units)
HBAI AHC (includes DBs, no allowance for disabilitycosts)

Disability benefits expenditure by income decile, HBAI and pre-DBs definitions
0%
5%
10%
15%
20%
25%
30%
1 (low) 2 3 4 5 6 7 8 9 10(high)
% o
f DB
expe
nditu
re
Decile of income (pensioner units)
HBAI AHC (includes DBs, no allowance for disabilitycosts)Pre-DBs, AHC
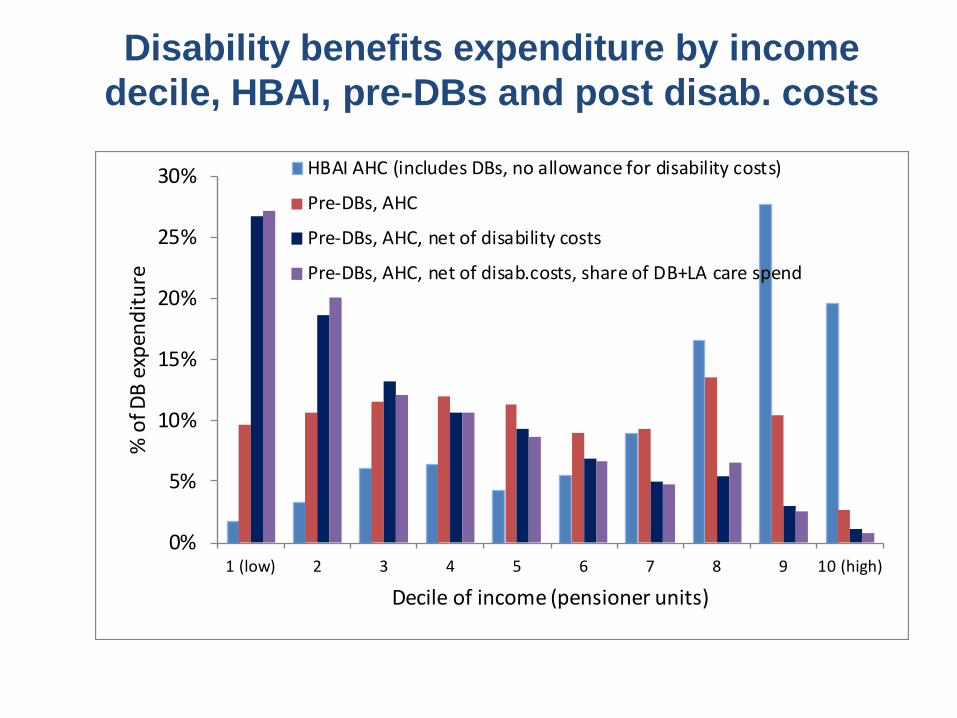
Disability benefits expenditure by income decile, HBAI, pre-DBs and post disab. costs
0%
5%
10%
15%
20%
25%
30%
1 (low) 2 3 4 5 6 7 8 9 10 (high)
% o
f DB
expe
nditu
re
Decile of income (pensioner units)
HBAI AHC (includes DBs, no allowance for disability costs)
Pre-DBs, AHC
Pre-DBs, AHC, net of disability costs
Pre-DBs, AHC, net of disab.costs, share of DB+LA care spend
Target efficiency
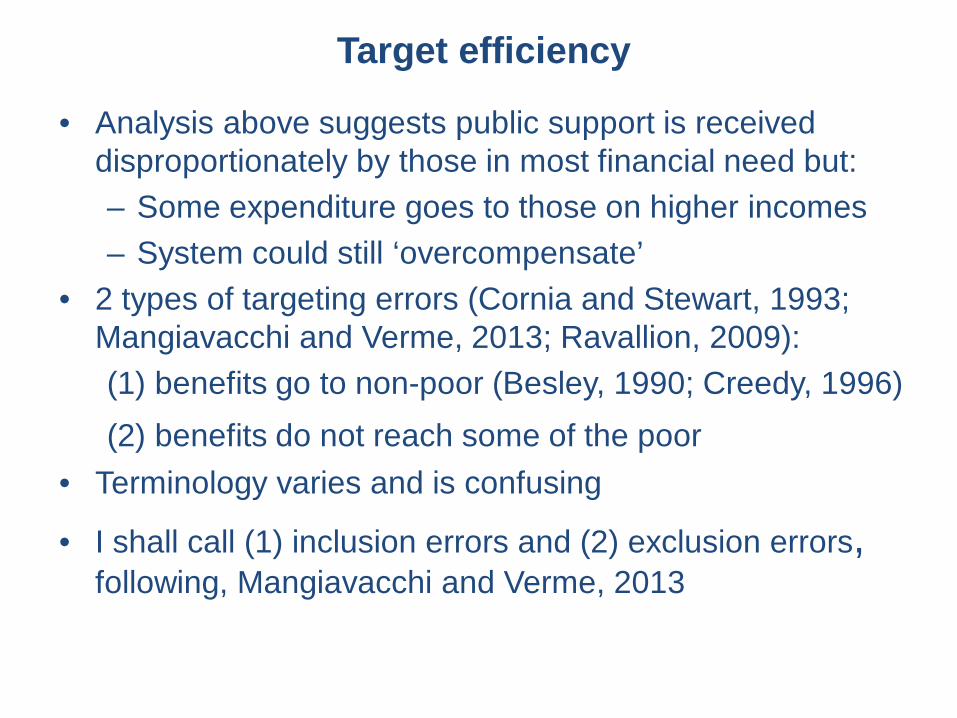
• Analysis above suggests public support is received disproportionately by those in most financial need but: – Some expenditure goes to those on higher incomes – System could still ‘overcompensate’
• 2 types of targeting errors (Cornia and Stewart, 1993; Mangiavacchi and Verme, 2013; Ravallion, 2009): (1) benefits go to non-poor (Besley, 1990; Creedy, 1996) (2) benefits do not reach some of the poor
• Terminology varies and is confusing
• I shall call (1) inclusion errors and (2) exclusion errors, following, Mangiavacchi and Verme, 2013

Operationalising targeting errors
• Define a poverty threshold, or range of thresholds – % of minimum income level within Pension Credit plus disability
costs – compare with income including DBs and the value of care services
but before deduction of disability costs as these are added to the threshold
• Define the scale of inclusion errors as: – % of total net transfers to older people which goes to the pre-
transfer non-poor or brings the pre-transfer poor above the poverty threshold (Creedy’s ‘spill-over effects’)
• Define the scale of exclusion errors as: – the additional transfers that would be needed to eliminate poverty
as % of total transfers to older people
• NB: use total transfers rather than just disability-related as some changes to disability benefits can affect receipt of other means-tested benefits through changes in take-up

Two measures of poverty
Foster, Greer and Thorbecke, 1984:
𝐹𝐹𝐹 𝑎 = ∑ 𝐼(𝑦𝑖 < 𝑍)(1 − 𝑦𝑖 𝑍� )𝑎 𝑁𝑖
𝑁
a=0: head count i.e. % of people with incomes (y) below
poverty threshold Z a=2: FGT(2), higher weight given to greater shortfalls
below poverty threshold

Understanding the current system of DBs for older people
Cost change as % of net transfers
Cost change as % of total DBs, MTBs and LA care
Remove all DBs including SDP -11% -33%
Remove AA/DLA, retain SDP, current take-up of MTBs
-9% -27%
Remove AA/DLA, retain SDP, full take-up of MTBs by older disabled people
-6% -17%
Remove SDP, retain AA/DLA -2% -6%
Remove DLA mobility -2% -7%
Current system with full take-up of MTBs by older disabled people
+3% +9%
Fully compensate for disability costs | disability level through AA/DLA, remove SDP
+20% +60%
Fully compensate for disability costs | disability level through SDP, remove AA/DLA (current take-up)
+6% +18%

Head count poverty rates, upper 50% of disability
0%
20%
40%
60%
80%
100%
% in
pov
erty
poverty threshold
No AA, DLA or SDPNo AA or DLA, SDP retained, current MTB take-up ratesNo AA or DLA, SDP retained, full take-up of MTBsAA/DLA retained, SDP abolishedNo DLA mobilityCurrent policy and MTB take-up ratesCurrent policy with full take-up of MTBsNo AA/DLA, disability costs fully compensated thro' SDPDisability costs fully compensated through AA, no SDP

Head count poverty rates, lower 50% of disability
0%
20%
40%
60%
80%
100%
% in
pov
erty
poverty threshold
No AA, DLA or SDPNo AA or DLA, SDP retained, current MTB take-up ratesNo AA or DLA, SDP retained, full take-up of MTBsAA/DLA retained, SDP abolishedCurrent policy and MTB take-up ratesCurrent policy with full take-up of MTBsNo DLA mobilityNo AA/DLA, disability costs fully compensated thro' SDPDisability costs fully compensated through AA, no SDP

FGT(2) poverty index, upper 50% of disability
0.00
0.02
0.04
0.06
0.08
0.10
0.12
0.14
FGT
pove
rty
inde
x
poverty threshold
No AA, DLA or SDPNo AA or DLA, SDP retained, current MTB take-up ratesNo DLA mobilityAA/DLA retained, SDP abolishedCurrent policy and MTB take-up ratesNo AA or DLA, SDP retained, full take-up of MTBsCurrent policy with full take-up of MTBsNo AA/DLA, disability costs fully compensated thro' SDPDisability costs fully compensated through AA, no SDP

FGT(2) poverty index, lower 50% of disability
0.00
0.02
0.04
0.06
0.08
0.10
0.12
0.14
FGT
pove
rty
inde
x
poverty threshold
No AA, DLA or SDPNo AA or DLA, SDP retained, current MTB take-up ratesNo AA or DLA, SDP retained, full take-up of MTBsAA/DLA retained, SDP abolishedCurrent policy and MTB take-up ratesCurrent policy with full take-up of MTBsNo DLA mobilityNo AA/DLA, disability costs fully compensated thro' SDPDisability costs fully compensated through AA, no SDP
Inclusion errors as % of total transfers
0
0.1
0.2
0.3
0.4
0.5
0.6
DB e
xpen
ditu
re g
oing
to n
on p
oor o
r brin
ging
poo
r ab
ove
pove
rty
line
as a
pro
pn o
f tot
al n
et tr
ansf
ers
poverty threshold
Disability costs fully compensated through AA, no SDPNo AA/DLA, disability costs fully compensated thro' SDPCurrent policy with full take-up of MTBsCurrent policy and MTB take-up ratesNo DLA mobilityNo AA or DLA, SDP retained, current MTB take-up ratesNo AA or DLA, SDP retained, full take-up of MTBsNo AA, DLA or SDP

Exclusion errors as % of total transfers
0%
10%
20%
30%
40%
50%
60%
70%
80%
% p
oor (
pre-
bene
fits)
and
not r
ecei
vein
g disa
bilty
-re
late
d be
nefit
s
poverty threshold
No AA, DLA or SDPNo AA or DLA, SDP retained, current MTB take-up ratesCurrent policy and MTB take-up ratesNo AA or DLA, SDP retained, full take-up of MTBsCurrent policy with full take-up of MTBsNo DLA mobilityNo AA/DLA, disability costs fully compensated thro' SDPDisability costs fully compensated through AA, no SDP

Some potential revenue-neutral reforms
(1) Increase AA/DLA by 40% for high rate recipients in the top 30% of the disability distribution (No new benefit recipients)
(2) Increase AA/DLA by 24% for those in top 20% of disability distribution, also ensuring that all those in the top 20% (including non recipients) get this enhanced rate AA/DLA. High rate AA/DLA halved for other high rate recipients, middle rate of AA/DLA removed.
(3) Remove AA/DLA, increase SDP by 90% for all in top 20% of disability, current take-up patterns
(4) Remove AA/DLA, increase SDP by 90% for all in top 20% of disability, reduce SDP by 25% for other high rate AA/DLA recipients, no SDP for middle rate AA/DLA recipients, with full take-up of MTBs by the top 20% of disabled.
DLA mobility and lower rate of DLA care removed throughout. In (1) those receiving only higher DLA mobility transferred to middle rate DLA care
Poverty impacts
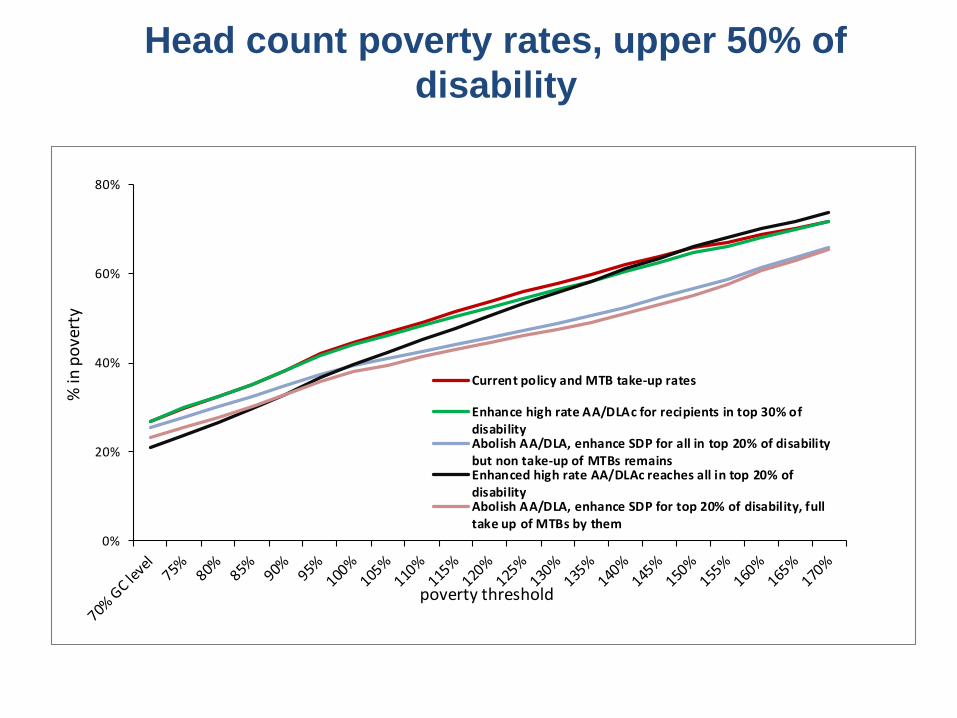
Head count poverty rates, upper 50% of disability
0%
20%
40%
60%
80%
% in
pov
erty
poverty threshold
Current policy and MTB take-up rates
Enhance high rate AA/DLAc for recipients in top 30% ofdisabilityAbolish AA/DLA, enhance SDP for all in top 20% of disabilitybut non take-up of MTBs remainsEnhanced high rate AA/DLAc reaches all in top 20% ofdisabilityAbolish AA/DLA, enhance SDP for top 20% of disability, fulltake up of MTBs by them
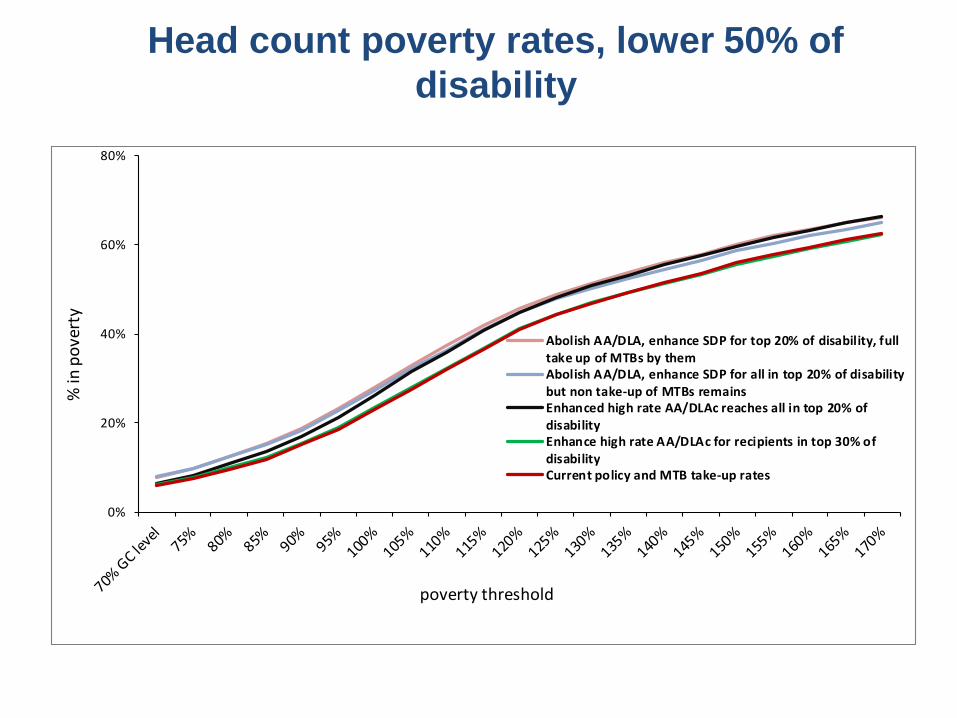
Head count poverty rates, lower 50% of disability
0%
20%
40%
60%
80%
% in
pov
erty
poverty threshold
Abolish AA/DLA, enhance SDP for top 20% of disability, fulltake up of MTBs by themAbolish AA/DLA, enhance SDP for all in top 20% of disabilitybut non take-up of MTBs remainsEnhanced high rate AA/DLAc reaches all in top 20% ofdisabilityEnhance high rate AA/DLAc for recipients in top 30% ofdisabilityCurrent policy and MTB take-up rates

FGT(2) poverty index, upper 50% of disability
0.00
0.02
0.04
0.06
0.08
0.10
0.12
FGT
pove
rty
inde
x
poverty threshold
Abolish AA/DLA, enhance SDP for all in top 20% of disabilitybut non take-up of MTBs remainsEnhance high rate AA/DLAc for recipients in top 30% ofdisabilityCurrent policy and MTB take-up rates
Abolish AA/DLA, enhance SDP for top 20% of disability, fulltake up of MTBs by themEnhanced high rate AA/DLAc reaches all in top 20% ofdisability

FGT(2) poverty index, lower 50% of disability
0.00
0.02
0.04
0.06
0.08
0.10
0.12
FGT
pove
rty
inde
x
poverty threshold
Abolish AA/DLA, enhance SDP for all in top 20% of disability but non take-up of MTBs remains
Abolish AA/DLA, enhance SDP for top 20% of disability, full take up of MTBs by them
Enhanced high rate AA/DLAc reaches all in top 20% of disability
Enhance high rate AA/DLAc for recipients in top 30% of disability
Current policy and MTB take-up rates

Targeting errors

Inclusion errors as % of total transfers
0
0.02
0.04
0.06
0.08
0.1
0.12
0.14
0.16
0.18
0.2
DB e
xpen
ditu
re g
oing
to n
on p
oor o
r brin
ging
poo
r ab
ove
pove
rty
line
as a
pro
pn o
f tot
al n
et tr
ansf
ers
poverty threshold
Enhance high rate AA/DLAc for recipients in top 30% of disability
Current policy and MTB take-up rates
Abolish AA/DLA, enhance SDP for all in top 20% of disability but nontake-up of MTBs remainsAbolish AA/DLA, enhance SDP for top 20% of disability, full take up ofMTBs by themEnhanced high rate AA/DLAc reaches all in top 20% of disability

Exclusion errors as % of total transfers
0
0.05
0.1
0.15
0.2
0.25
0.3
0.35
extr
a sp
endi
ng n
eede
d to
brin
g po
or n
on re
cipi
ents
of
DBs
to p
over
ty li
ne a
s pro
pn o
f to
tal n
et
tras
nfer
s
poverty threshold
Abolish AA/DLA, enhance SDP for all in top 20% ofdisability but non take-up of MTBs remainsEnhance high rate AA/DLAc for recipients in top 30%of disabilityCurrent policy and MTB take-up rates
Abolish AA/DLA, enhance SDP for top 20% ofdisability, full take up of MTBs by themEnhanced high rate AA/DLAc reaches all in top 20% ofdisability
Emerging conclusions • Poverty impact and target efficiency can be achieved
without means-testing if rates of benefit are more closely related to severity of disability and benefits reach the most severely disabled
• If this is achieved within existing budget, those with lower levels of disability will lose
• Discussion of integrating DBs and social care needs to consider ‘exclusion errors’ for social care
• Removing DBs from social care recipients adds to Local Authority costs

References • Berthoud, R., J. Lakey, and S. McKay (1993), The Economic Problems of Disabled People, Policy
Studies Institute, London. • Besley, T. (1990) Means testing versus universal provision in poverty alleviation programmes.
Economica 57 119-129 • Cornia, A.C. and Stewart, F. (1993) Two errors of targeting Journal of International Development 5 459-
496 • Creedy J (1996) Comparing tax and transfer systems: poverty, inequality and target efficiency.
Economica 63 S163-S174 • Foster, J., Greer, J. and Thorbecke, E. (1984) A class of decomposable poverty measures.
Econometrica 52(3) 761-766 • Hancock, R., Morciano, M. and Pudney S. (2013) Nonparametric estimation of a compensating
variation: the costs of disability. ISER working paper 2013-26 • Hancock, R., and S. Pudney (2014), “Assessing the distributional impact of reforms to disability benefits
for older people in the UK: implications of alternative measures of income and disability costs,” Ageing and Society 34 232-257
• Jones, A. and O'Donnell, O. (1995). Equivalence scales and the costs of disability. Journal of Public Economics 56, 273-289.
• Morciano M., R. Hancock and S. Pudney (2014) Disability costs and equivalence scales in the older population in Great Britain. Review of Income and Wealth Available at Earlyview http://onlinelibrary.wiley.com/doi/10.1111/roiw.12108/abstract
• Ravallion, M. (2009). How relevant is targeting to the success of an antipoverty program? The World Bank Research Observer 24(2): 205-231.
• Wanless, D. (2006) Securing Good Care for Older People: Taking a Long-Term View. London: King`s Fund.
• Zaidi, A. and T. Burchardt (2005), “Comparing incomes when needs differ: Equivalization for the extra costs of disability in the UK,” Review of Income and Wealth, 51(1), 89-114