Target Date Funds: Characteristics and Performance Target Date Funds: Characteristics and...
34
1 Target Date Funds: Characteristics and Performance Edwin J. Elton Stern School of Business, New York University Martin J. Gruber Stern School of Business, New York University Andre de Souza Fordham University Christopher R. Blake Fordham University AUGUST242015 Christopher R. Blake, formerly Joseph Keating, S.J. Distinguished Professor, Fordham University, is deceased prior to publication.Send correspondence to Martin J. Gruber, Stern School of Business, New York University, 44 West 4th Street, New York, NY 10012; telephone 212-998-0333; fax 212-995-4233. E-mail: [email protected] .
Transcript of Target Date Funds: Characteristics and Performance Target Date Funds: Characteristics and...
1
Target Date Funds:
Characteristics and Performance
Edwin J. Elton
Stern School of Business, New York University
Martin J. Gruber
Stern School of Business, New York University
Andre de Souza Fordham University
Christopher R. Blake
Fordham University
AUGUST242015
Christopher R. Blake, formerly Joseph Keating, S.J. Distinguished Professor, Fordham University, is deceased prior to publication.Send correspondence to Martin J. Gruber, Stern School of Business, New York University, 44 West 4th Street, New York, NY 10012; telephone 212-998-0333; fax 212-995-4233. E-mail: [email protected].

2
Abstract
As a result of poor asset allocation decisions by 401(k) participants, 72% of all plans now
offer target date funds, and participants heavily invest in them. Here, we study the characteristics
and performance of TDFs, providing a unique view byemploying data on TDFs holdings. .We
show that additional expenses charged by TDFs are largely offset by the low-cost share
classesthey hold, not normally open to theirinvestors.Additionally, TDFs are very active in their
allocation decisions and increasingly bet on nonstandard asset classes.However, TDFs do not
earn alpha from timing or their selection of individual assets. (JEL G11. G23.)
3
There is a vast literature in financial economics thatfinds that participants in 401(k) and
403(b) plans generally make suboptimal asset allocation decisions.1In response to this evidence,
plans have started to offer options in whichthe asset allocation decision is made for the investor
and in particular options in whichthe allocation changes as a function of time to retirement.These
latter options are referred to as target date funds (TDF).
Target date funds have become an important component of pension plans. The growing
use of TDFs is no doubt helped by the Department of Labor expanding the set of acceptable
default options to include TDFs.In 2011, 72% of the 401(k) plans offered target date funds, and
by 2012, 41% of 401(k) investors held target date funds, and 20% of all 401(k) assets were
invested in target date funds (VanDerhei et al. 2012, 2013; Barons 2014). Target date funds are
rapidly growing in importance for 401(k) investors. From 2008 to 2012,the fundsgrew from 160
to 481 billion in assets, with 91% of these assets in retirement plans. In addition, 43% of the
assets of recently hired employees in their 20s with 401(k) plans are invested in target date funds
(VanDerhei et al. 2012, 2013).
All of the target date funds that exist have a goal of reducing the percentage invested in
stocks over time; yet, the theoretical and empirical support for this asset allocation pattern is
mixed. Samuelson (1963) and Merton (1969) derive results demonstrating thatconstant
proportions are optimal. A number of subsequent authors have derived conditions in whicha
change in stock proportions is optional. These conditions often involve assumptions about labor
income (see, for example, Bodie, Merton, and Samuelson 1991;Campbell et al. 2001;Campbell
and Viceira 2002;Cocco, Gomes, and Maenhout 2005). Based on assumptions about labor
1 See, for example, Ameriks and Zeldes (2004), Benartzi and Thaler (2001), Madrian and Shea (2001), Agnew and
Balduzzi (2002, 2003), Liang and Weisbenner (2006), Huberman and Sengmuller (2003), and Elton, Gruber, and
Blake (2007).
4
income, the authors derive an optimum decrease in stock allocation over time. On the other hand,
Shiller (2005) has postulated conditions under which an increase in stock proportions is optimal.
There is little empirical evidence for the optimality of decreasing stock allocation and
increasing bond allocation over time. Poterba et al. (2005, 2009) simulate wealth and utility of
wealth at retirement and find for most investors 100% in equity or a fixed proportion strategy
dominates increasing the proportion invested in fixed income as the target date nears.
This paper does not attempt to add to the important literature on the optimal pattern of
allocation over time.Rather, it addresses a second set of issues: given the intended allocation of a
TDF is the investor well-served by management’s selection of assets.
Several papers are related to ours.Bhattacharya, Lee, and Pool (2013) show that funds of
funds (which include TDFs) increase their investment in funds within their fund family after
experiencinglarge outflows.We examine only TDFs, and we do not find similar results.Balduzzi
and Reuter (2013) (using a two-index model) show that TDFs with the same target date have
very different bond stock mixes,total returns, and residual returns.We also find great variation in
the bond stock mix across funds with the same target date.However, our analysis goes well
beyond Balduzzi and Reuter’s(2013) in that we examine many other characteristics of TDFs and
place great emphasis on understanding their expenses and performance.Sandya (2011) examines
several of the issues we also examine. She compares the performance of target date funds and
balanced funds.Her conclusions principally use the alpha from a time-series regression of returns
of TDFs onbond and stock factors to examine performance and infer management behavior.We
collect data on and use the holdings of TDFs to directly see management actions.We employ a
methodology estimating alphas and factor sensitivities that corrects for the changing risk profiles
of TDFs over time and explicitly adjusts for the increased use of new asset categories by TDFs

5
over time.Using this methodology, our results on issues that are in common differ from many of
those reported in Sandya.
This is the first study to examine in detail the holdings of TDFs to determine what they
are doing and how well they are doing it.Our study is unique in that we have data on the exact
holdings of each target date fund, as well as return and expense data not only on each target date
fund but also on each of the funds held.This impacts the type of analysis we perform and the
conclusions we reach throughout this paper. In the first section we will discuss our sample. This
is followed by a section discussing the holdings of target date funds and the expenses associated
with their holdings.More specifically, we examine the composition of the assets held by target
date funds and how this has changed over time.We find that the actual composition is
substantially different from how TDFs have been characterized.
Most target date funds hold a series of other funds: either publicly traded mutual funds or master
trusts. These target date funds are funds of funds, and investors pay fees on the underlying funds
and usually pay an added fee to the target date fund itself, the size of which depends on the share
class that an investor purchases. In the second part ofSection2we examine the size of these fees.
We find that most target date funds invest in low-cost share classes of mutual funds
which are not available to all but very wealthy investors or institutional investors. We show that
the underlying share classes have sufficiently low expense ratios so that for most investors the
cost of buying the target date fund with its added expense ratio is only slightly higher than if an
investor bought the underlying funds directly.
In the third section we examine performance.There are two aspects of
performance:timing and asset selection. Most target date funds start with a planned series of
asset allocations over time, but then vary from the plan depending on perceived market
6
conditions.We show that the stock bond timing decisions do not enhance the performance of
TDFs.They detract from it, if anything.
The other aspect of performance is asset selection.We find that TDFs have negative
alphas similar to those found for mutual funds in general.Finally, we find that a simple strategy
of investing in index funds at the initial allocation of the TDF provides lower risk, higher returns,
and higher Sharpe ratios than those associated with the TDF.
A number of authors have provided evidence that some mutual funds behave in ways that
hurt shareholder performance but help to meet fund family objectives.Given that we have
holdings data, we can examine some of these issues directly and we do so in Section4.
1. Sample
There are close to 1,100 target date funds listed in Morningstar. Many of these represent
different proportions of the same underlying mutual funds. For example, a fund family might
offer TDFs for 2020, 2025, 2030,. . . 2050, with several share classes offered for each of these
horizons.The different dated TDFs from one fund family will usually hold most of its assets in
the same underlying funds, though in different proportions. The principal difference is that the
funds with target dates close to the present hold more in debt-type funds and less in equity-type
funds.2 The planned pattern of asset allocation over time for a particular fund is usually referred
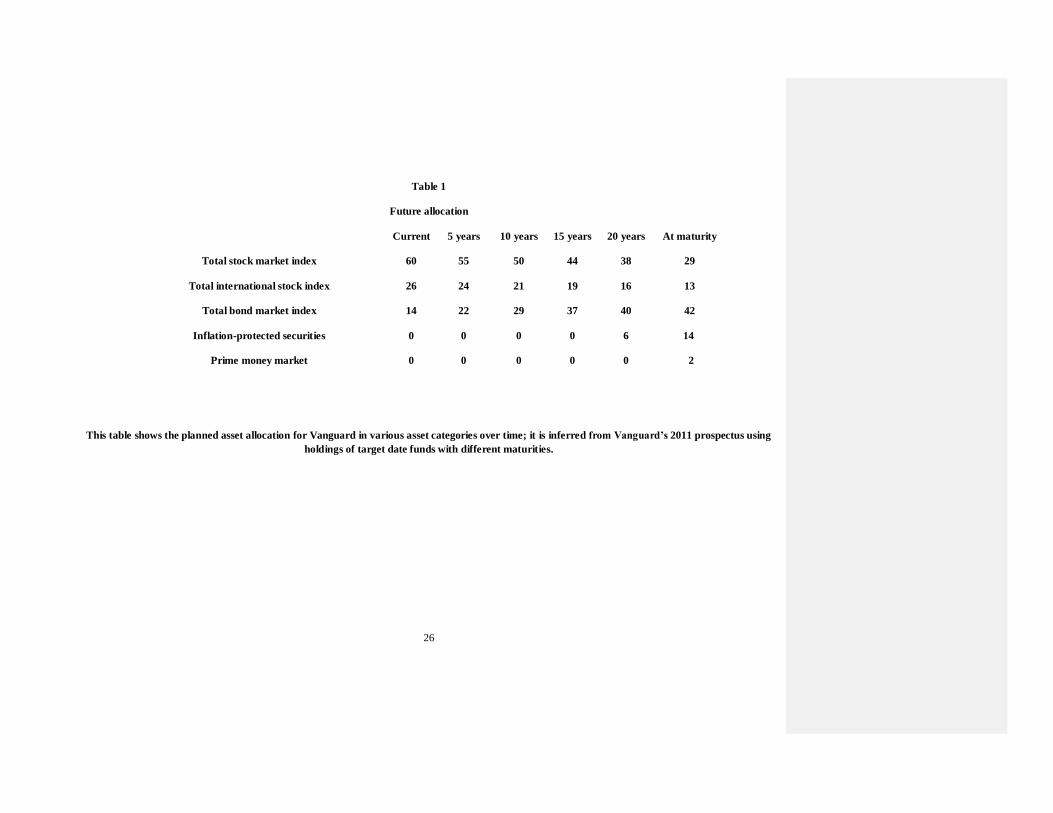
to as its glide path. Table 1 shows the glide path for the Vanguard Target Date Fund.3 If a
particular TDF deviates from its glide path, all TDFs with different target dates from the same
fund family are likely to deviate in a parallel manner from their glide paths since there is
2 In addition, TDFs sometimes hold more risky securities, such as commodities and futures.
3 Vanguard is unusual in that it is one of the few TDFs that gives numeric data for its intended glide path. Most
TDFs simply present a picture of their glide paths.
7
normally one management team handling all the fund families’ TDFs. Given this high
commonality, we selected only one dated fund from the dates offered. We chose 2035 if it
existed, and 2030 otherwise.Our final sample contained one target date from each fund family
that offered target date funds.There are fiftyfamilies offering target date funds:40 of the funds
havea target date of 2035, and 10have a target date of 2030.There are intotal 229 funds in our
sample, representing different share classes of the fiftydistinct funds.4We chose 2035 as our
baseyear as a trade-off between being on a part of the glide path where changes in the equity
allocation are fairly constant and yet some changes do occur.We have data from 2004 through
2012.However, many of the funds started after 2004.
Our sample is more recent than that used by Balduzzi and Reuter (2013),and the majority
of our data occur after the passage of the Pension Protection Act of 2006.Our sample consists of
two types of data.The first type is data at the TDF level.This includes monthly return data, yearly
expense data, and the monthly investment by the TDF in each underlying fund.The second type
is data at the level of the underlying fund.For each fund held by a TDF, we have monthly return,
yearly expenses, and the Morningstar classification. The collection of underlying data allows us
to perform analysis that hasnot been previously done.In particular,we preform four types:First,
we calculate expenses on the TDF and the funds they hold and compare them to what an investor
would have to pay if s/heconstructed the TDF directly.Second, it allows us to see exactly what
TDFs are investing in at a point in time and over time.Third, it allows us to measure performance
more accurately because we can account for changes in the betas on any TDF that occur because
4 The difference between the 1,100 target date funds (with each share class counted as a fund) and the 229 in our
final sample is due to our selecting one target date (2035 or 2030) from each fund family.
8
of changes in the underlying fundsheld by the TDF.Fourth,by examining changes in holdings, we
can explore the rationale for management’s choices.
2. Characteristics of Target Date Funds
In this section we examine both the types of investments made by target date funds and
the nature and size of the expenses associated with these funds.
2.1 Holdings
The typical TDF in our sample invests in 17 funds on average with 68% holding 10 or
more and 24% holding 25 or more funds. This understates the actual diversity in holdings
because the funds with few holdings generally hold master trusts, which themselves hold
multiple types of securities. Most target date funds are not the simple mixture of debt and equity
envisioned in many papers. This can be seen clearly from Table 2. In addition to the normal
domestic and international debt and equity funds, a high percentage of target date funds have
added emerging markets debt and equity funds, domestic and international real estate funds, and
commodity funds to their holdings. While one of these new investments, domestic real estate,
was first held by TDFs in 2004, others appear later: commoditiesappear in 2006, and emerging
market debt appears in 2007. Furthermore, a large percentage of target date funds that held these
categories did not do so in their first year of existence. At the extreme, 81% of the funds that
held international real estate added this category of investments one or more years after the fund
started. The percentage of TDF funds holding any category increasedover time.For 2011,the
percentage of funds holding these new categories varied from a low of 22.2% for emerging
market debt to a high of over 75% for emerging market equity. Recall that the majority of these
funds have a target date of 2035 (or, in a few cases, 2030), so that these target date funds are
holding and increasing their investment in investment types that are thought of as being
9
inherently more risky as the target date approaches. In addition to the categories shown in Table
2, a number of funds made sector bets (19%) or country bets (8%) or held long-short funds (4%).
What could account for these additional asset categories? One explanation is that some
TDFs were trying to differentiate themselves from others. A second explanation is that these
investment categories were identified as hot investment vehicles by the financial community in
general. A third explanation is that they added these investments with the belief that they
lowered risk through diversification.5 However, in the case of country and sector funds, this has
to be a bet on a particular small subset of assets.
The funds held by a TDF may be offered solely by the same family of funds as the TDF
or include funds from another fund family. However, 63% of TDFs only hold funds offered by
the fund family to which the TDF belongs. Most funds held outside the family are ETFs or index
funds. Only 13.7% hold any active funds outside the family, and these are almost always
specialized funds, such as commodity funds, not offered by the family.In every case, funds held
outside the family represent a very small percent of any TDFs’ total investment.
Each target date fund family chooses a glide path for each target date fund.The glide path
specifies the percentage to invest in equity and debt over time.Across target date funds with the
same target date offered by different fund families, the percentage invested in equity or debt has
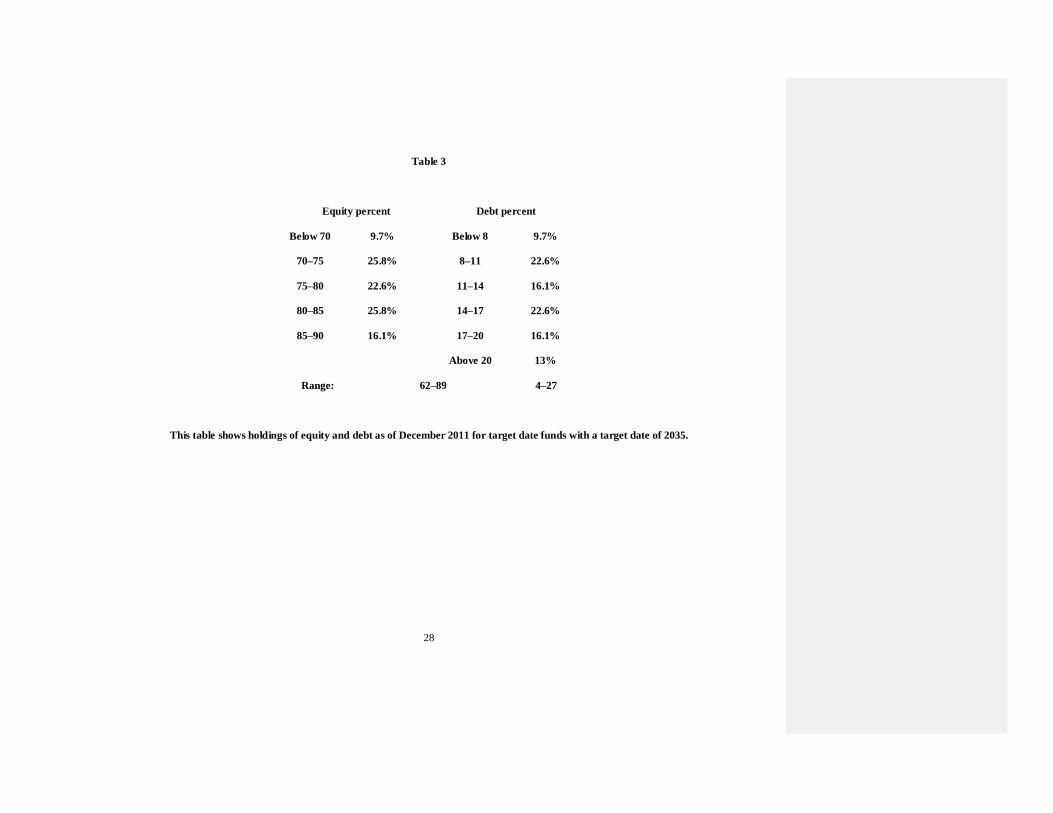
wide variation.The percent invested in debt and equity for TDFs with a target date of 2035 as of
December 2011 is presented in Table 3.The lowest percent in equity held by any fund is
62%,whereasthe highest is 89%.Most 2035 target date funds hold equity in the range of 70% to
85%.The amount invested in debt also varies with the bulk of target date funds holding between 5 Although TDFs may be adding additional asset categories in an attempt to lower risk, it doesnot seem to succeed.
Sixty percent of the TDFs have higher risk than Vanguard, which only invests in stocks and bonds. Furthermore, in
Section 4 we match the asset allocation of each target date fund with a portfolio only containing stocks and bonds,
and in 75% of the cases, the TDF has a higher standard deviation.
10
8% and 20% of their investments in the form of debt with a low 4% and a high of 27%.Thus,at a
point in time, target date funds vary widely in their debt and equity percentages, even though
they are managed to meet the needs of the same age group.6
2.2 Expenses
One of the key elements determining the performance of target date funds is the expenses
incurred by the holders of these funds. Since the individual or institutional investor can often
construct (mimic) a target date fund, aquestion remains: how much is the investor paying in total
expenses by holding a target date fund rather than holding a matched set of mutual funds?
The expenses on the target date funds consist of the expense ratio on the underlying
mutual funds held by the target date funds and the expenses added on by the target date fund
itself. This is somewhat complicated by the fact that the target date fund offers different classes
of shares to different investors. While not all target date funds offer all classes, almost all offer
more than one class. The overlay of TDF expenses differ across TDF share classes, but each
share class of TDF holds the same class of underlying funds in the same proportions and incurs
the same expense ratio on the underlying funds. For example, the no-load class of a TDF will
hold the same class of the underlying funds in the same proportions as the retirement class and
incur the same expenses on the underlying funds. The mutual funds held by any one TDF will
often be a combination of several share classes: for example, the no-load class for some of its
holdings and the investor class for others.
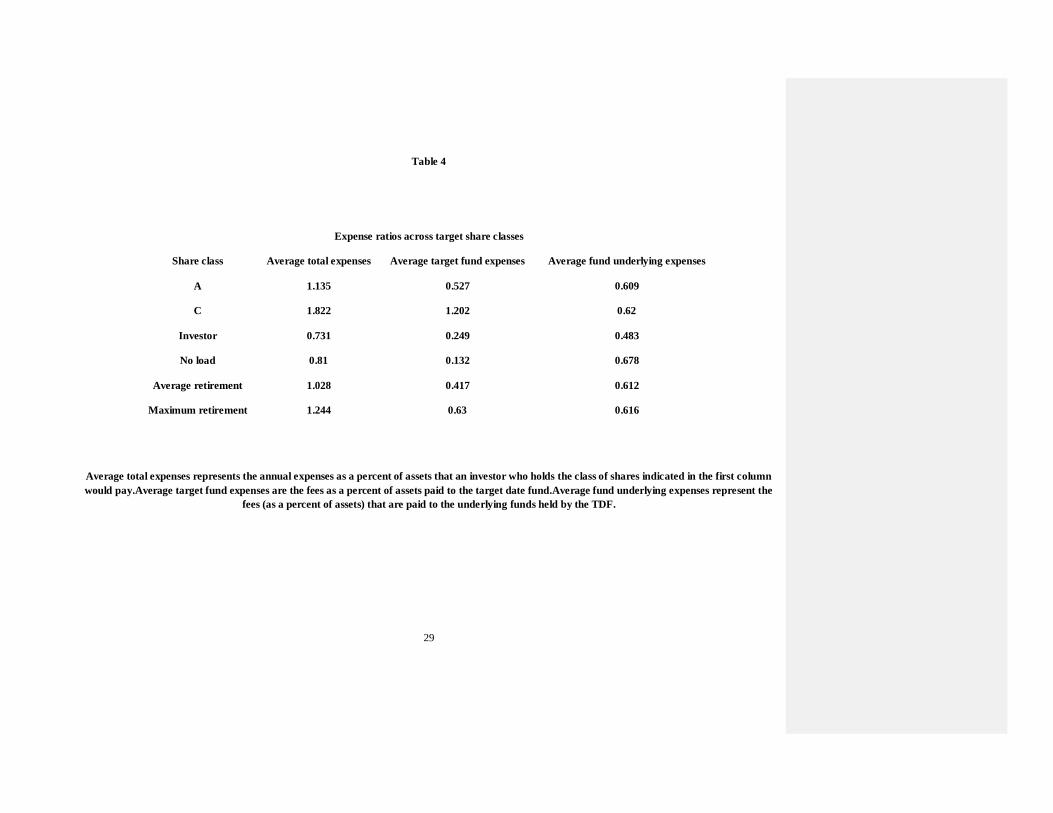
Table 4 presents the expense ratio for different classes of target date funds, as well as the
breakdown of the expenses between the fees paid directly to the TDF and the fees paid to the
6 Measuring heterogeneity of investment performance is the major thrust of the paper by Balduzzi and Reuter
(2013). Although this is not the major purpose of our paper, we find heterogeneity broadly consistent with their
findings, even though the range we find for equity is smaller than that reported in the latter years of their sample.
11
underlying funds.7 The highest total fees are charged by the C class TDF. The second highest
expenses are those on A shares.For A shares, the total expense ratio is 114 bps, made up of 61
bps of fees on the underlying funds overlaid by 53bps of fees for the target date fund.
Note that the A class shares may have loads and that the loads are not included in the expense
calculations. The size of the load is a function of the size of the purchase and is often waived for
large purchases.
Examining Table 4, we see some differences in the underlying fund expenses across
different TDF share classes. This is due to the different sample of funds thatoffer each class. The
major difference in total expenses is differences in the TDF fees paid across different TDF share
classes. The investor class and the no-load class have the lowest TDF expenses and the lowest
total expenses.
The expenses of the underlying funds are low because target date funds often holdlow
cost mutual fund classes not available to any investor or only available to some investors. For
example, 56% of the funds held by all TDFs are institutional class funds, 6.5% are retirement
class funds, and 15.93% are master trusts.
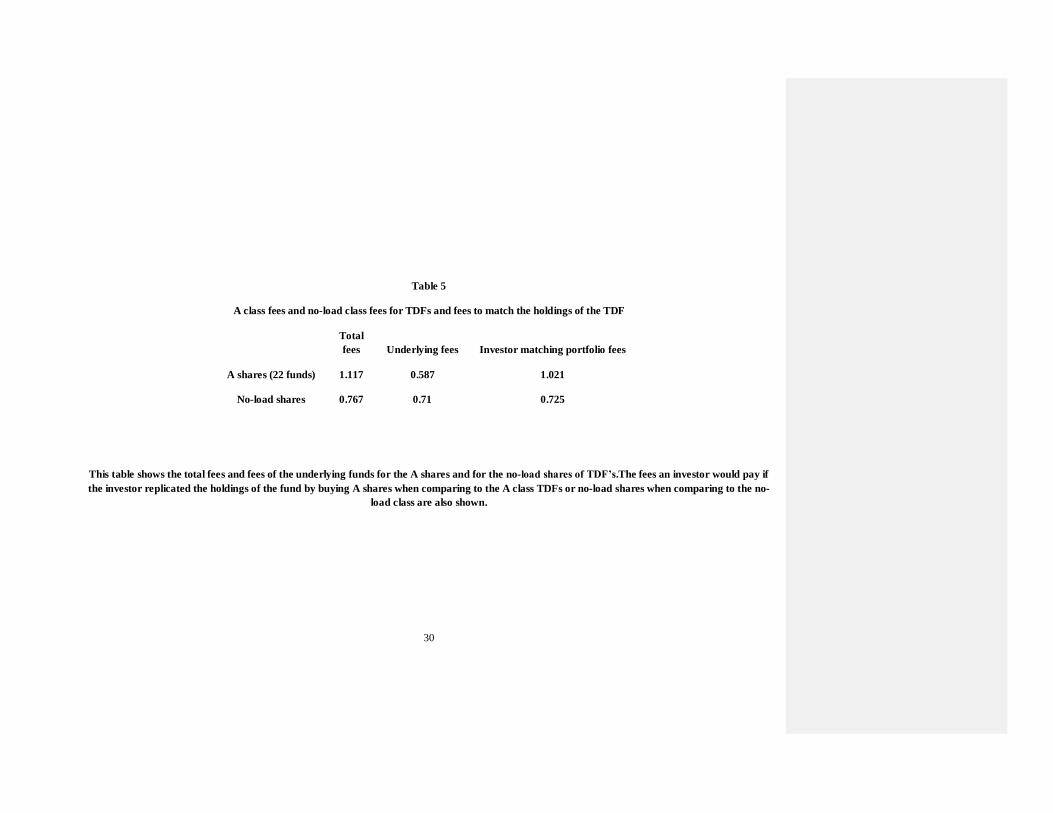
Table 5 shows for investors who qualified for A class shares (or alternativelyno load class
shares)how much the investorwould pay to hold the underlying funds directly if he or she
duplicated the TDF with A class sharesor no load class shares.8 For example, from Table 5, an
investor who only qualifies for A shares would have to duplicate the target date fund with A
shares and would incur an expense ratio of 102bpsin doing so. Thus, an investor who could only
7 We report two entries for retirement funds: the average and the maximum. Many funds offer a number of classes
of retirement funds. They differ in whether the fund or the retirement plan handles some of the administration of the
plan. Since we cannot determine how these costs are split, we report the maximum which for most funds means the
administrative costs are borne by the mutual fund family. 8 We limit this to A class and no-load class since these are the classes for which we can find underlying funds of the
same class for a meaningful number of TDFs.
12
hold A shares is only paying an additional fee of 9.6bps for the services provided by the TDF
management.9Likewise, we see that for an investor who could buy no-load shares, the additional
charge is only 4 bps. When we make this comparison, the additional charges from holding a
target date fund are small. Target date funds provide access to low-cost classes of mutual funds
and charge a fee at the TDF level to capture the advantage to investors who would have to buy a
more expensive class of the underlying fund. Since TDFs predominantly or exclusively hold
funds within the same fund family, the split of expenses depicted in Table 5 between the TDF
and the underlying funds is a matter of little consequence to the target date fund sponsors.
One other aspect of expenses is worth examining. We generally expect the TDFs
holdings to shift over time from holding funds that invest in more risky assets thathave higher
expense ratios to funds holding less risky assets thathave lower expense ratios. We examined
what happens to expenses when a retirement is planned for 2025, 2035, or 2045. The change in
overall expenses is quite small, going from 1.119 for retirement in 2025 to 1.139 for retirement
10 years later to 1.174 for retirement 20 years later. The change in total expenses and the change
in underlying expenses isconsistent with the holding of funds becomingless risky as retirement
comes closer and bond funds having lower expense ratios than stock funds.
3. Performance
Managers of TDFs can improve performance by successfully timing deviations from the
glide path, timing sector holdings, or selecting superior individual mutual funds.This section is
divided into three parts.In the first part we examine how well the fund does in timing.In the
second part we examine how well they have done in selecting assets.In the third part we examine 9 The expenses reported in Table 5 differ from those in Table 4 because not all target date funds belong to families
that offer A shares that matched the funds the TDF held. A shares have load fees. In this calculation we are
assuming that the load on the underlying funds is the same as the TDF or that the investor purchases enough so the
load fee is waived.
13
as an overall measure of performance whether a simple strategy exists thatoutperforms
TDFs.Note that in all three parts of this section weheavily rely on having composition data for
the TDFs.While holding data are important throughout this section, it is crucial in measuring
fund selection ability.Other authors have simply run time-series regressions of a TDF’s return on
a set of indexes to obtain alphas.The earlier analyses made it clear that TDFs change the weights
of different assets in their portfolio over time.By using holdings data, we can estimate betas that
change over time, and we get a more accurate estimate of performance.
3.1 Timing
Target date funds have a glide path that specifies the stock-bond split over time.
However, target date funds often deviate from the stated glide path because of beliefs about
future returns on stocks and bonds.
All target dates funds have a stated glide path. The glide path involves increasing the
amount invested in bonds and decreasing the amount invested in stocks over time. Therefore, the
manager’s bond-stock timing decision becomes how much to deviate from the glide path. For
most funds, the glide path is presented pictorially in the prospectus. Examining the picture, it is
impossible to accurately estimate the glide path numerically. Thus, we estimate the glide path
from the data. The pictures show that the glide path is linear or close to linear over the relevant
range of years included in our analysis. Thus, we assume a linear glide path. For each target date
fund, we calculate both the average proportion invested in stocks over all time periods and the
average change in this proportion over each period in our sample history. To estimate the glide
path for each fund, we use the average proportion it invested in stocks as the midpoint of
itshistory and the average change in stock investment to calculate the glide path on other dates.
To measure bond stock timing, we take the deviations from the glide pathfor stocks and bonds at
14
the beginning of each quarter and multiply each by the return on that investment class over the
quarter.In equation form, this is
annualized timing =4
𝑇 𝑘𝑡 𝑘𝑖 𝑟𝑖𝑡 (𝑤𝑖𝑡 − 𝑤𝑖𝑔𝑡 ), (1)
where𝑟𝑖𝑡 is the return of asset i (stock or bond) in quartert, 𝑤𝑖𝑡 is the actual weight of asset i at the
beginning of quartert,𝑤𝑖𝑔𝑡 is the weight that asset i would have at the beginning of quartert if the
TDF were on its glide path, and 𝑇 is the number of quarters of holding data available.
To measure timing rather than the return on the particular funds held, we use
returns on indexes to calculate returns from deviating from the glide path. For domestic stock,
we used the Fama-French Market Index plus the riskless rate (since the Fama-French market
index is return above the riskless rate). For international stock, we use the MSCI
World Index ex-US. For domestic bonds, we use the Barclay’s U.S. Aggregate Bond Index.
Finally, for foreign bonds, we use the Bank of America Global Bond Index ex US. Since a
glide path is the bond-stock split, and not how much is in domestic or international, we need a
single stock and a single bond index. In constructing a single index for any fund, for computing
stock returns, we use the weights for that fund at the beginning of each quarter in domestic
stocks, as well as in international stocks with the sum scaled to 100%.We then multiply each by
its return over the quarter. The bond return is calculated in a similar manner with cash, which is
assumed to earn the Treasury bill rate as one of the bond components. Quarterly timing returns
for each TDF are then accumulated to compute overall timing returns for the fund.Timing
represents the difference between what the TDF would have earned by duplicating the bond
stock mix of the TDF while investing in indexes and what the TDF would have earned if it
15
followed its glide path and invested in indexes.In estimating a TDF’s bond stock mix , we only
use Morningstar’s classifications divided into five categories. The average return due to timing
across all funds is -11.52 bps per year with a t value of -1.8. If we pool all observations
thatweight funds with a longer history more heavily, the result is -14.1 with a t of -2.76. Thus.
target date funds do not improve and may hurt their performance by having their stock-bond mix
deviate from the glide path.10
3.2 Measuring fund selection
The most common way to measure theasset selection ability of mutual funds is to
compute the alpha from the historic time series of a fund’s returns.Below, we describe a general
model for doing so, explain why the standard way of estimating performance from such as model
is not appropriate for target date funds, describe the method we use to estimate alpha, and present
performance results: the standard model for estimating performance is from a time-series
regression of the type.
𝑅𝑖𝑡 − 𝑅𝐹𝑡 = ∝𝑖+ 𝛴𝛽𝑖𝐼𝑅𝐼𝑡 + 𝑒𝑖𝑡 , (2)
where𝑅𝑖𝑡 is the return of fund iin period t,𝑅𝐹𝑡 is the riskless rate in period t,𝑅𝐼𝑡 is the return of
index Iin period t measured in excess return form,𝛽𝑖𝐼 is the sensitivity of fund i to index I,∝𝑖 is
the average return of fund i unexplained by the index, and𝑒𝑖𝑡 is the residual in period t for fund i.
The use of time-series estimation is inappropriate for TDFs since by design their betas are
meant to—and do—change over time due to allocation decisions across existing asset categories
and the addition of new asset categories. In the case of changing asset weights,and changes in the 10
We also examined timing with respect to domestic and international investment in both the stock and bond
investment categories. Within the equity segment switching between domestic and international investments added 8
bps per year, while within the bond segment timing costs 16 bps per year. Neither is close to statistically significant.
16
asset classes included in a portfolio, the unconditional betas from a time-series regression would
be completely misestimated and the computed alphas meaningless.To overcome this problem,
we use the bottom-up approach of Elton, Gruber, and Blake (2011), to estimate betas and alpha
for a TDF. Since a portfolio’s alphas and betas are weighted averages of the assets that comprise
it, we compute the monthly alpha on each fund the TDF holds and then use the proportions
invested in each fund at the beginning of the month to computethe TDF’s monthly alpha.The
importance of estimating time-varying betas and the effect on alphas has been established by
Ferson and Schadt (1996) and Christopherson, Ferson, and Glassman (1998).While our
methodology is different from theirs, the motivation is similar.We can directly measure changing
betas because we have monthly holdings data.
More specifically, we start with the three-year alphas computed every month using data
ending with the month for which we are computing alpha. Then we calculate the one-month
alpha for that month by taking three-year alphas and adding back the residual for the month in
question. These are then cumulated and averaged over the history of the TDF.
While we have discussed the methodology to estimate a general model like Equation (2),
we havenot clarified the indexes used on the right-hand side of Equation (2).Since target date
funds hold many different types of mutual funds with different characteristics, we need to use
indexes appropriate for the fund in question. For stock funds, we use the Fama-French three-
index model plus momentum. For bond funds we use, following Blake, Elton,and Gruber (1993),
a three-index model consisting of a general bond index, a mortgage-backed index, and a high
yield index, all in excess return form. For foreign bond funds, foreign stock funds, domestic real
estate funds, foreign real estate funds, sector funds, country funds, commodity funds, emerging
market stock funds, and emerging market bond funds, we use market indexes of the appropriate
17
market, all in excess return form. In cases of low R2 with the indexes employed, we examine the
holdings and classify the fund consistent with its holdings.In a number of cases, the funds’
holdings were not consistent with the Morningstar category.11
The average alpha over the history across all target date funds is a negative 20bps per
year and is significantly different from zero at the 1% level. This is the alpha across all the TDFs
holdings and is after all expenses on the underlying funds but before the expenses added by
theTDF.
Most studies looking at alphas on the average mutual fund find that the average fund
underperforms indexes by about 70 bps. Does this suggest that TDFs display superior selection
ability, with respect to the funds they hold? The answer is no. Examining the average expense
ratios on the funds they hold (Table 4) shows expense ratios of about 60 bps. Most mutual fund
studies examine share classes of funds with average expense ratios of 110 to 120 bps. TDFs have
better alphas on the funds they hold, primarily because they are able to hold share classes with
low-expense ratios. If one adds the difference in expense ratios, the average alpha on the funds
they hold is similar to the -70 bpsnormally found in mutual fund studies.
As stated above the average alpha on the underlying funds does not take into
consideration the expenses added by the target date fund itself. Investors in a target date fund pay
total expenses equal to the sum of expenses imposed by the TDF and the expenses on the
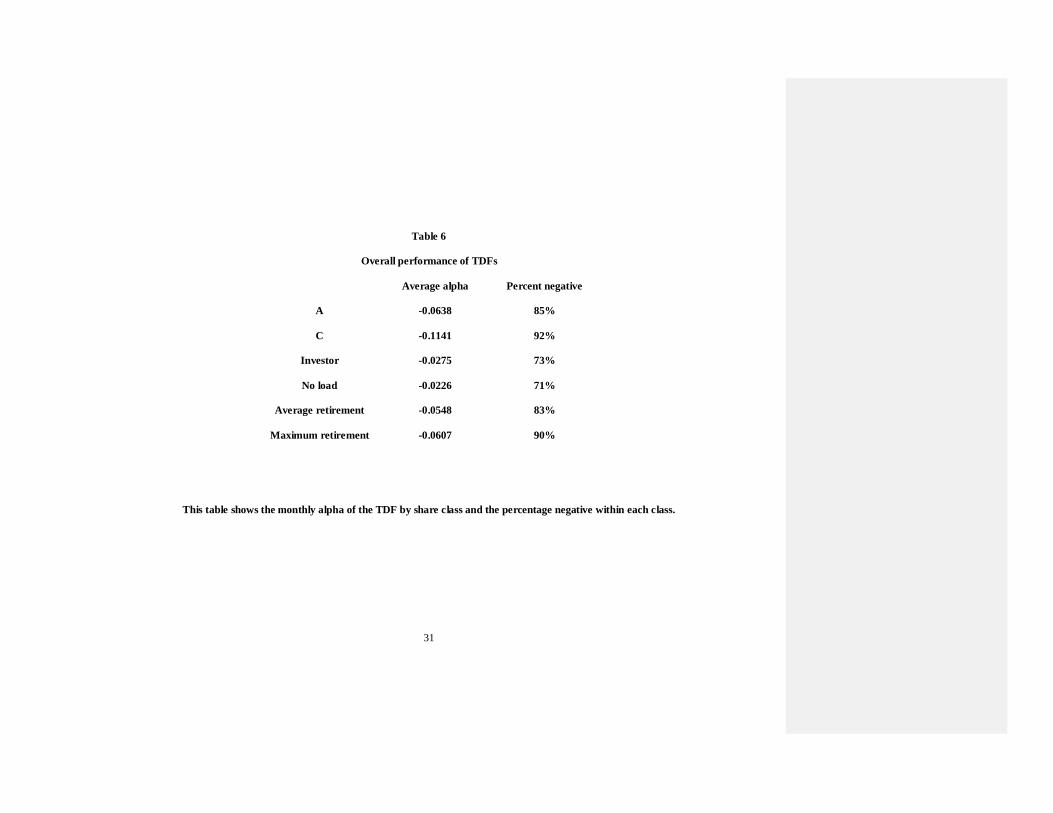
underlying funds. Table 6 shows the average alpha, including the total expensesfor each target
date share class, as well as the percentage of funds in each share class thathave negative alphas.
We see that each class has on average a negative alpha. The A class are the most commonly
11
The three years used in estimating alpha were the three years ending in the month in question. If three years of
data did not exist, we used the longest time frame we had, providing it was at least twelve months. If adequate data
did not exist, the fund held by the TDF was excluded and the weights were rescaled.
18
examined share classes. The target date funds class A shares have alphas consistent with the
alphas of A shares of mutual funds in general; about minus 77 bpsper year. The C class has more
negative alphas of about 1.37% per year. No load funds have negative alphas closer to zero
(minus 27bps per year), approximately the alphas for the lower cost index funds found in the
market. The investor classis close to that of the no-load class (33 bps per year). However,
investor class shares are usually sold through investment advisors, who add their own fees to
those charged by the target date fund.
The alpha on retirement accounts is slightly higher than the alpha on A shares. There is a
range of alphas on retirement accounts thatwe believe is a function of whether the fund company,
financial advisors, or the retirement account itself handles some of the administrative costs.
Many fund families offer several subclasses of retirement shares. For example, John Hancock
has R1, R2, R3, R4, R5, and R6 shares with slightly different expense ratios. When we compare
the expense ratio of the highest expense retirement share for each family (where the fund bears
the administrative costs) with the average retirement share class, the returns go down, but only
by 7 bps per year.There is little difference in expense ratios across different retirement share
classes.
4. An Overall Performance Measure
While there are several possible measures of performance, a very practical measure is to
see if an investor who followed a simple strategy would obtain better results byholding target
date funds.We examine the mean return, standard deviation, and Sharpe ratio for the simple
strategy and compare themto the values for TDFs.
The simple strategy assumes that an investor observes the first reported asset allocation
that occurred at least three months after the start of each TDF and holds the same proportions

19
over the life of the fund in five categories of indexes: domestic stock, international stock,
domestic bonds, international bonds, and cash.12
For cash, we use the one-month Treasury bill
rate, and for the other four categories, we use the indexes discussed earlier.
Across all share classes and all funds, we find that in 75% of the cases the standard
deviation of the returns from the naïve strategy is less than that of the TDF. Thus, the additional
types of investment used by the TDF (e.g., real estate commodities) do not seem to reduce
risk.On average, the variance of the naive strategy was 12% less than the variance of the TDF. In
addition, the mean return on the naïve strategy was also higher in 75% of the cases,with a
difference averaging 62 bps per year.
For each share class of TDFs,the Sharpe ratio is greater for the naïve strategy in the
preponderance of cases, and the difference is statistically significant at the 0.01 level for most
classes.13
Thus, an investor would be better off using a buy-and-hold strategy that invests only in
passive portfolios and using only domestic and international stocks and bonds and cash.14
1. Shareholder Objectives or Family Objectives
There are a number of articles that have found that mutual fund managers make
investment decisions that hurt individual mutual fund performance but help fund family
objectives.Cohen and Schmidt (2009) find that fund managers overweight a firm when the fund
family is a trusteeof that firm’s 401(k) plan and increase their holdings in these firms when other
12
We took our starting point three months after the TDF was started, because the first observation often contains an
allocation before the fund is fully invested, for example, a very large cash position.In addition we assumed that
investment in the ―other‖ category was allocated proportionally over the five categories named above.The ―other‖
category was generally well below 5% of assets, except in three cases not included in our sample. 13
This result holds even when we subtract 15 bps, representing fees on low-cost index funds. 14
We also compared the performance of TDFs before fees imposed by the TDFs with the performance obtained by
an investor investing in the actual funds held by the TDFs. We followed the same procedure described above. The
Sharpe ratios of the replicating portfolio are higher than the TDF Sharpe ratios in 67% of the cases, and the average
difference is highly significant.

20
mutual funds are decreasing their holdings.Davis and Kim (2007) show that mutual funds are not
acting in their shareholders’ best interest in votes they make when doing substantial pension fund
business with the firm.Sandhya (2011) shows that TDFs with the greatest potential for conflicts
of interest have the poorest performance and concludes that they are adding higher cost funds or
poor performing funds with large outflows.Bhattacharya, Lee, and Pool (2013) show that funds
of funds increase their investment in individual funds in their fund family when the individual
funds havelarge outflows.Gaspar, Massa, and Matos (2006) and Casavecchia and Tiwari (2011)
show howintrafamily trading benefits fund families at a cost to individual funds.Evans (2010)
shows how fund families pursue their own objectives in setting fees and increasing fund
offerings.
What makes our analysis unique is given that we have data on the monthly holdings of
individual TDFs, we can analyze hypotheses concerning management behavior by examining
their actions directly rather than inferring their actions from overall return results.
TDFs are particularly appropriate for studying potential agency problems between
individual funds and fund families, because they primarily hold mutual funds of the fund family
that sponsors the TDF. When a TDF invests in a fund outside the family, it does so almost
always because a similar fund does not exist within the family. Across our sample,69.9% of the
funds that were added by the TDF had at least one alternative fund in the family with the same
Morningstar classification.We refer to these funds as the alternatives. The average number of
alternatives was 3.8, and the percentage of times there was more than one was 68.1%.
21
In this section we examine four variables that might satisfy fund family objectives but are
not necessarily objectives of the target date fund shareholders:15
1. start date: the family might want to help start-up funds;
2. management fee: higher-fee funds bring in more money to the family;
3. total net assets: management might select funds to include thatare smaller than the
alternatives to help these funds reach a scale at whichthey are profitable; and
4. cash flow: the TDF might select funds thatwere losing assets or growing at a rate
slower than alternatives to help a fund reach a size that is profitable.
It would be in the interest of fund families to have TDFs invest in recently started funds
to help start-up funds boost their asset size to obtain economies of scale.We find that many target
date funds do add an abnormal number of funds thathave been in existence for a short period of
time.There were 720 cases in whicha TDF adding a fund had the option of selecting an
alternative in the same fund family with the same Morningstar objective.In 15% of these cases,
there was an opportunity to invest in a fund that had existed for three months or less.When the
TDFs had this opportunity, 72% of the time they selectedthe fund that existed for less than three
months; while if they selected randomly, they would have selected a short-lived fund 34% of the
time.In 30% of the 720 cases, there was an opportunity to invest in a fund that existed one year
or less.When a TDF had this opportunity,57% of the time it selected the fund that existed less
than one year; while if it selected randomly, a fund that existed less than one yearwould have
been selected 34% of the time.How well have the start-up funds done relative to the alternative
funds available in the same family?The funds added that were in existence for threemonths or
15
In all analyses in this section we only examine funds that were added by management that are in the TDF’s fund
family.
22
less had alphas over the next three years that were lower by 86 bps per year than the average
three-year alphas on alternative funds.This is statistically significantly different from zero (t =
2.14).Management is clearly adding a disproportionate percentage of new funds thathave three-
year performance after addition thatis inferior to the alternatives they could have added.
The next variable we examine is management fees. If a specific manager is concerned
with family objectives rather than investor objectives,she would add funds with higher
management fees than the alternative funds of the same type offered by the fund family. In
fact,the average manager does not do so.16
However, specific managers do.When aTDF manager
chooses funds that had a much higher management fee than the alternatives, we find that the
funds selected had much lower future alphas than the alternatives.For example, there were
thirteenfunds for whichthe manager selected a fund whose fees were 40 bps or more higher than
the alternativefunds’. For the following three years, these funds had alphas 256 bpsper year
lower than the alternative funds,with a t of 2.4.Examining the thirty-threeadditions for whichthe
manager selected a fundin whichfees were higher thanalternative funds by 30bps or more had
underperformance compared withthe alternatives of 115bps per year with a t of 1.43.TDF
managers on average do not seem to be adding funds that have higher management fees than
alternative funds, but when a manager adds fund with much higher management fees than
themanagement fees on alternatives in the same fund family, the funds that are added have much
lower performancethan the alternatives.Some managers seem to be maximizing family objectives
rather than shareholder objectives.
16
This differs from Sandya’s (2011) conjecture. Her conjecture is based on the difference in performance of TDFs
that invested in funds within their families compared with funds that invested outside of their families.

23
If some fund managers were selecting funds in part because of family concerns rather
than shareholder concerns, we would expect them to select more small funds than could be
justified by future alpha.Since start-up funds are generally of small size, and since we have
analyzed start-up funds earlier in this section,we eliminated all start-up funds in the first 6
months of their existence.17
We then ranked all funds by size.
When TDF management selected funds with less than 60 million dollars under
management (26 funds) they earned, over the next three years, a monthly alpha 240 bps per year
less than the alternatives (t = 2.09).We chose 60 million since the belief in the investment
community is this is the minimum size to be profitable.We chose three other breakpoints: 100
million or less resulted in underperformance of 209 bps per year (t = 2.73), 150 million or less
resulted in 144 bps underperformance (t = 2.04), and 200 million or less resulted in 116 bps
underperformance (t = 2.07).Selecting funds of small size is desirable from a family point of
view, but it has hurt TDF performance.
The last variable we examine is growth.If a fund had a large outflow, it would help the
family if the TDF invested in these funds.We find no evidence of TDFs selecting funds with
large outflows.18
We find that in pursuing a number of characteristics that serve fund family objectives,
TDFs add funds with poor subsequent alpha relative to alternatives in the same family.These
characteristics are new funds, funds with high management feesand small funds.These findings
support the previous literature that funds are managed in part to support fund family objectives
rather than to support the individual fund objectives.
17
Including these funds only strengthens the results reported below. 18
This differs from Sandya (2011) and Bhattarchaya, Lee, and Pool (2013). Although the sample in the latter article
includes many types of fund of funds rather than just TDFs.
24
7.Conclusions
Target date funds (TDFs) have become an important vehicle for retirement plans: 72% of
401(k) plans offer TDFs, and over 43% of new 401(k) moneyof young employees is invested in
them.Despite their importance for the financial health of future retirees, very little is known
about their characteristics and performance.In this paper we address this lack of knowledge.
Target date funds are usually thought of as holding a mix of debt and equity, while
following a predetermined glide path, with the equity proportion declining over time.The reality
is more complex.Currently, many target date funds hold commodity funds, domestic, and
international real estate funds and funds holding the debt or equity of emerging markets.In
addition, TDFs take active bets, deviating from their stock-bond glide path. We show that this
active timing does not add value.
Target date funds are funds of funds.As such, they add an additional fee to the fee
charged by the mutual funds they hold.This additional fee can be quite high, averaging 53bps for
A class shares.We show that this added fee is mostly offset by TDFs investing in low-expense
classes of mutual funds not available to most investors.We find that the total fee an investor pays
is not that much higher than the investor would pay for the TDF portfolio by directly purchasing
the share class available to that investor.
On average, the performance of the funds selected by target date funds is better than
those normally found in mutual fund studies.This difference is due to the lower fees on the
classes of shares TDFs hold.When the added fees of target date fundsaretaken into account, the
performance of target date funds is similar to that normally found in mutual fund studies.

25
Target date funds almost always hold funds of the fund family to which they
belong.Normally, a TDF only selects a fund outside the fund family when the family doesnot
offer a similar fund (e.g., commodity, international real estate).In the majority of cases, when the
TDF adds a fund, the target date fund has alternatives with the same objective in the fund
family.We show that some TDFs add funds that satisfy family objectives but hurt shareholder
performance.This is manifested by TDFs selecting new start-ups, some managers selecting funds
with much higher management fees than alternatives, and selecting small funds.All of these
additions have lower alphas than the alternatives in the fund family.
26
Table 1
Future allocation
Current 5 years 10 years 15 years 20 years At maturity
Total stock market index 60 55 50 44 38 29
Total international stock index 26 24 21 19 16 13
Total bond market index 14 22 29 37 40 42
Inflation-protected securities 0 0 0 0 6 14
Prime money market 0 0 0 0 0 2
This table shows the planned asset allocation for Vanguard in various asset categories over time; it is inferred from Vanguard’s 2011 prospectus using
holdings of target date funds with different maturities.
27
Table 2
TDF holdings of five types of specialized underlying funds (in percent)
2003 2004 2005 2006 2007 2008 2009 2010 2011 Add with delay
Emerging market equity 0 0.0% 0.0% 33.3% 45.8% 62.5% 52.5% 62.8% 75.6% 44.1%
Emerging market debt 0 0.0% 0.0% 0.0% 4.2% 15.6% 17.5% 16.3% 22.2% 70.0%
Domestic real estate 0 20.0% 14.3% 33.3% 25.0% 40.6% 35.0% 39.5% 53.3% 58.3%
International real estate 0 0.0% 14.3% 6.7% 29.2% 37.5% 32.5% 34.9% 35.6% 81.3%
Commodities 0 0.0% 0.0% 6.7% 12.5% 18.8% 30.0% 39.5% 40.0% 55.6%
This table shows the percentage of TDFs in our sample for each calendar year that hold each of fivetypes of mutual funds.The last column shows the
percent of TDFs that while holding each type of fund did not hold that type in the initial year for which the TDF first reports portfolio data.
28
Table 3
Equity percent Debt percent
Below 70 9.7% Below 8 9.7%
70–75 25.8% 8–11 22.6%
75–80 22.6% 11–14 16.1%
80–85 25.8% 14–17 22.6%
85–90 16.1% 17–20 16.1%
Above 20 13%
Range: 62–89 4–27
This table shows holdings of equity and debt as of December 2011 for target date funds with a target date of 2035.
29
Table 4
Expense ratios across target share classes
Share class Average total expenses Average target fund expenses Average fund underlying expenses
A 1.135 0.527 0.609
C 1.822 1.202 0.62
Investor 0.731 0.249 0.483
No load 0.81 0.132 0.678
Average retirement 1.028 0.417 0.612
Maximum retirement 1.244 0.63 0.616
Average total expenses represents the annual expenses as a percent of assets that an investor who holds the class of shares indicated in the first column
would pay.Average target fund expenses are the fees as a percent of assets paid to the target date fund.Average fund underlying expenses represent the
fees (as a percent of assets) that are paid to the underlying funds held by the TDF.
30
Table 5
A class fees and no-load class fees for TDFs and fees to match the holdings of the TDF
Total
fees Underlying fees Investor matching portfolio fees
A shares (22 funds) 1.117 0.587 1.021
No-load shares 0.767 0.71 0.725
This table shows the total fees and fees of the underlying funds for the A shares and for the no-load shares of TDF’s.The fees an investor would pay if
the investor replicated the holdings of the fund by buying A shares when comparing to the A class TDFs or no-load shares when comparing to the no-
load class are also shown.
31
Table 6
Overall performance of TDFs
Average alpha Percent negative
A -0.0638 85%
C -0.1141 92%
Investor -0.0275 73%
No load -0.0226 71%
Average retirement -0.0548 83%
Maximum retirement -0.0607 90%
This table shows the monthly alpha of the TDF by share class and the percentage negative within each class.
32
REFERENCES
Agnew, J.,P.Balduzzi, and A. Sunden. 2003. What do we do with our pension money? Recent
evidence from 401(k) plans. American Economic Review 93:193–205.
Ameriks, J.,and S. Zeldes. 2004. How do household portfolio shares vary with age? Working
Paper, Columbia University.
Balduzzi, P., and J. Reuter. 2013.Heterogeneity in target date funds. Unpublished Manuscript,
Boston College.
Barrons Target. 2014. Date funds take over. July 5.
Benartzi, S., and R. Thaler. 2001. Naïve diversification strategies in retirement saving plans.
American Economic Review 91:78–98.
Bhattacharya, U., J. Lee, and V. Pool. 2013.Conflicting family values in mutual fund
families.Journal of Finance 68:173–200.
Blake, C., E. Elton, and M. Gruber. 1993.The performance of bond mutual funds.Journal of
Business 66:371–403.
Bodie, Z., R. Merton, and W. Samuelson. 1991. Labor supply flexibility and portfolio choice in a
lifecycle model. Journal of Economic Dynamics and Control 16:427–49.
Campbell, J., J. Cocco, F. Gomez, and P. Maenhout. 2001. Investing retirement wealth: A life-
cycle model. In Risk aspects of investment-based social security reform. Eds. J. Y. Campbell,
and M. Feldstein. Chicago: University of Chicago Press.
Campbell, J., and L.Viceira. 2002. Strategic asset allocation: Portfolio choices for long-term
investors. New York: Oxford University Press.
Casavecchia, L, and A. Tiwari. 2011. Cross-trading and the cost of conflict of interest of mutual
fund advisors. Working Paper, University of Iowa.
Christopherson, J., W. Ferson, and D. Glassman. 1998.Conditional manager alphas on economic
information another look at the persistence of performance. Review of Financial Studies 11:111–
42.
Cohen, L., and B. Schmidt. 2009. Attracting flows by attracting big clients.Journal of Finance
64:2125–51.
Cocco, J., F. Gomes, and P. Maenhout. 2005. Consumption and portfolio choice over the life
cycle. Review of Financial Studies18:401–533.
33
Davis, G., and H. Kim. 2007. Business ties and proxy voting by mutual funds.Journal of
Financial Economics 85:552–70.
Elton, E., M. Gruber, and C. Blake. 2007. Participant reaction and the performance of funds
offered by 401(k) plans. Journal of Financial Intermediation 16:240–71.
———. Holdings data, security returns and the selection of superior mutual funds.Journal of
Financial and Quantitative Analysis 46:341–67.
Evans, R. 2010. Mutual fund incubation.Journal of Finance 65:1581–611.
Ferson, W., and R. Schadt. 1996. Measuring fund strategy and performance in changing
economic conditions.Journal of Finance 51:425–61.
Gaspar, J., M. Massa, and P. Matos. 2006.Favoritism in mutual fund families? Evidence on
strategic cross-fund subsidization.Journal of Finance 61:73–104.
Huberman, G., and Sengmuller. 2004. Company stock in 401(k) plans. Review of Finance
8:403–43.
Liang, N., and S. Weisbenner. 2006. Investor behavior and the purchase of company stock in
401(k) plan design. Journal of Public Economics 90:1315–46.
Madrian, B., and D. Shea. 2001. The power of suggestion: inertia in 401(k) participants’ savings.
Quarterly Journal of Economics 116:1149–87.
Merton, R. 1969. Lifetime portfolio selection under uncertainty: the continuous time case.Review
of Economics and Statistics 51:247–57
Poterba, J., J. Rauh, S. Venti, and D. Wise. 2005. Utility evaluation of risk in retirement savings
accounts. In Analyses in the economics of aging. Ed. David Wise. Chicago: University of
Chicago Press.
———. 2009. Lifecycle asset allocation strategies and the distribution of 401(k) retirement
wealth. In Developments in theeconomics of aging, 333–79. Ed. David Wise. Chicago:University
of Chicago Press.
Samuelson, P. 1963. Risk and uncertainty: The fallacy of the law of large numbers. Scientia
98:108–13.
Sandhya, V. 2011. Agency problems in target date funds. Working Paper, George State
University.
Formatted: Tab stops: Not at 1" + 1.5" + 2"+ 2.5" + 3" + 3.5" + 4" + 4.5" + 5" + 5.5"+ 6"

34
Shiller, R. 2005. Lifecycle portfolios as government policy. Economists Voice 2:1–9.
VanDerhei, J., S. Holden, L. Alonso, and S. Bass. 2012. 401(k) plan asset allocation, account
balances, and loan activity in 2011. Employee Benefit Research Institute, No. 380.
———. 2013.401(k) plan asset allocation, account balances, and loan activity in 2012.
Employee Benefit Research Institute, No. 394.