Tara B. Dale Kenneth L. Stromborg
42
I I I I Reconnaissance surveys of contaminants I potentially affecting Green Bay and Gravel Island I National Wildlife Refuges I I I Tara B. Dale I Kenneth L. Stromborg I I U.S. Fish and Wildlife Service I Green Bay Ecological ServicesField Office I 1015 Challenger Court Green Bay, WI 54311 - I . DECEMBER 1993 I I I I ! , '
Transcript of Tara B. Dale Kenneth L. Stromborg
IIII Reconnaissance surveys of contaminants
I potentially affecting Green Bay and Gravel Island
I National Wildlife Refuges
III
Tara B. DaleI Kenneth L. Stromborg
II
U.S. Fish and Wildlife Service
I Green Bay Ecological Services Field Office
I 1015 Challenger CourtGreen Bay, WI 54311
-I . DECEMBER 1993
I
I
I
I! , '
~~ ACKNOWLEDGEMENTS
~Major contributions in the field were provided by D.S. Amundson, B.R.
. Freske, J .H. Braastad, W.H. Karasov, J .M. Larson, L. Sileo, and P.J.~ Warpinski. Special thanks to A. Ross and E. Hammett for access to privately
owned islands. The manuscript was reviewed by G.H. Heinz and T. Bartish.
~
~
~
~
~
~
~
~
~
~
~
~ .
~
~ ii
~
,I I,!

-- TABLE OF CONTENTS
-List of Tables iv
~List of Figures vi
~List of Appendices vi
~Abstract vii
~Introduction 1
~Objectives 2
~Study Area 2
~~ Methods 4
~ Results 6
~ Discussion 9
- ~=~~~:~a~:ns 11
- References 12
- .
-
- iii
~
! I! '

-- List of Tables
-Table 1. Chemical concentrations (ppm, wet-weight) in soil/guano
- ~~~e:;~9Z;~.~~~~~~.~~.~.r.~~..~~.~~.~~.~~~~.i~~ 15
. Table 2. Chemical concentrations (ppm, wet-weight) in avian eggs
. collected from Kidney Island, Green Bay during 1987 16
. Table 3. Chemical concentrations (ppm, wet-weight) in miscella-
. neous biota collected from islands in Green Bay and LakeMichigan during 1987 17
~ Table 4. Metal concentrations (ppm, dry-weight) in soil/guanocollected from islands in Green Bay and Lake MichiganI during 1987 18
Table 5. Metal concentrations (ppm, dry-weight) in avian eggsI collected from Kidney Island, Green Bay during 1987 19
. Table 6. Metal concentrations (ppm, dry-weight) in miscellaneous. biota collected from islands in Green Bay and LakeMichigan during 1987 19
I Table 7. Chemical concentrations (ppm, wet-weight) in avian eggscollected from Cat Island, Green Bay during 1988 20
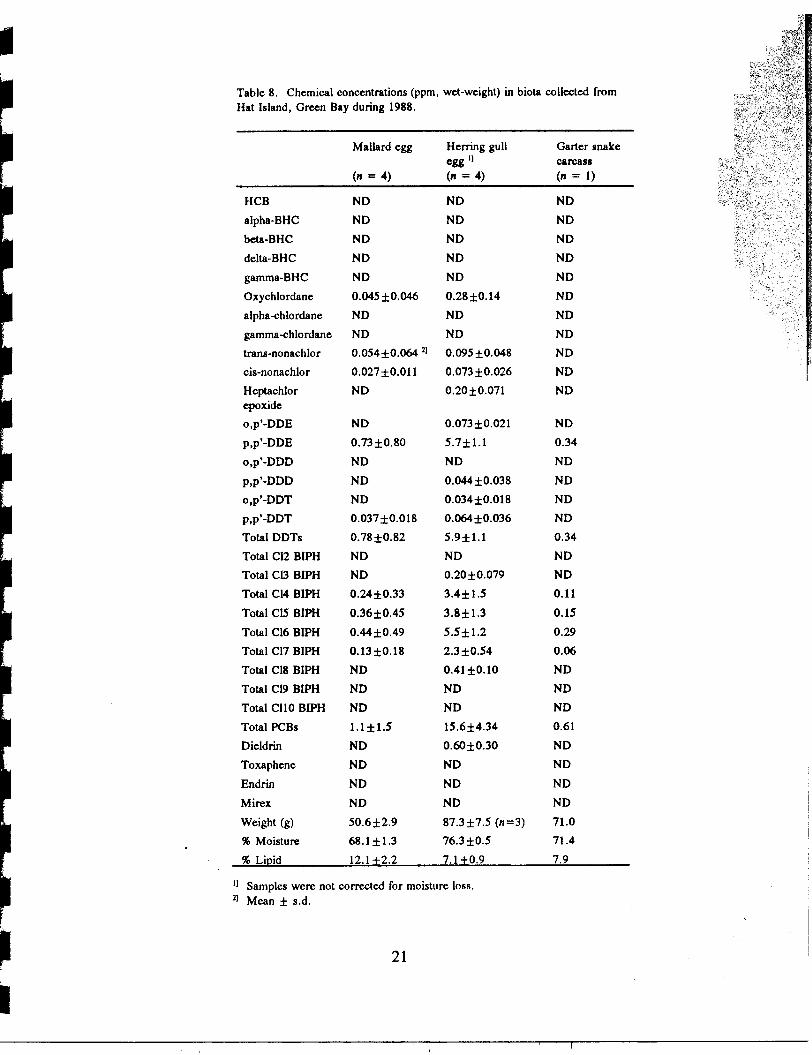
I Table 8. Chemical concentrations (ppm, wet-weight) in biotacollected from Hat Island, Green Bay during 1988 21
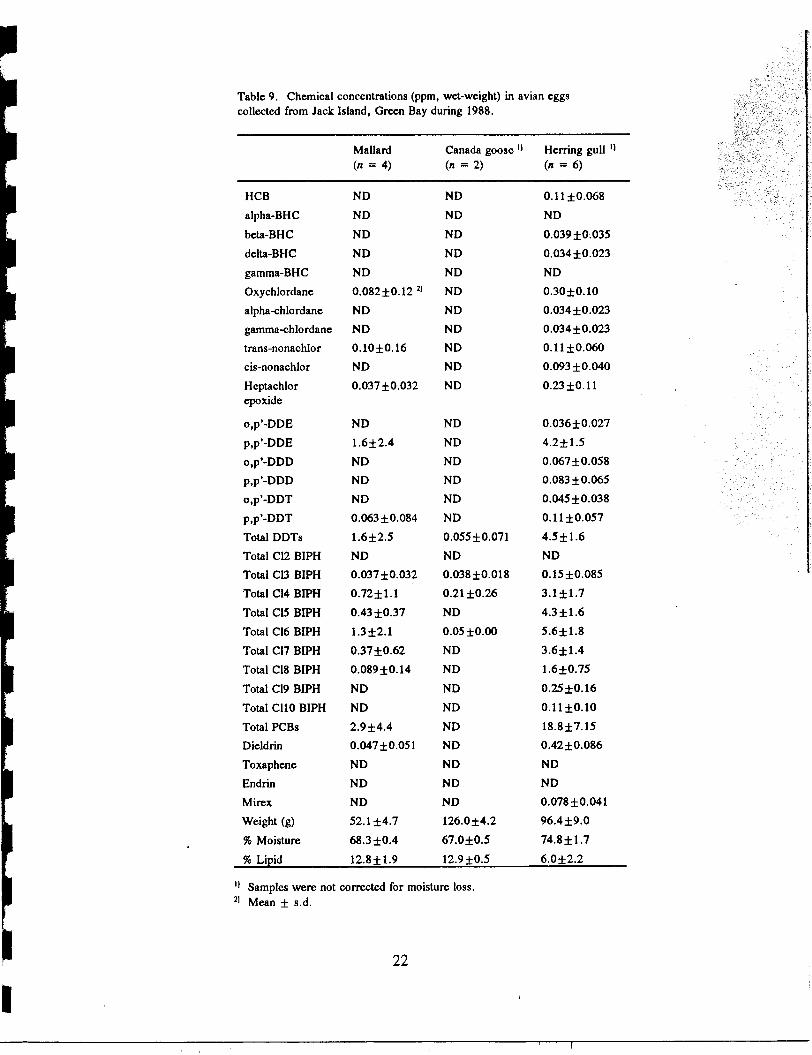
I Table 9. Chemical concentrations (ppm, wet-weight) in avian eggscollected from Jack Island, Green Bay during 1988 22
I Table 10. Chemical concentrations (ppm, wet-weight) in avian eggscollected from Spider Island, Lake Michigan during 1988 23
I Table 11. Chemical concentrations (ppm, wet-weight) in avian eggscollected from Gravel Islandt Lake Michigan during 1988 24
I Table 12. Chemical concentrations (ppm, wet-weight) in biotacollected from Pilot Island, Lake Michigan during 1988 25
I
I iv
I
I'! '

II Table 13. Chemical concentrations (ppm, wet-weight) in avian eggs
collected from Hog Island, Lake Michigan during 1988 26
I Table 14. Chemical concentrations (ppm, wet-weight) in cormoranteggs collected from Fish Island, Lake Michigan duringI 1988 .27
Table 15. Body burdens of PCBs (mg) in adult male double-crested
I ~~~~~~.t.s..~~~~.t.~.~~~~.~~~.~~~~~:.~~~~..~~.~.~~~~ 28
. Table 16. Chemical concentrations (ppm, wet-weight) in adult
. double-crested cormorants collected from Cat Island,Green Bay during 1988 29
- Table 17. Chemical concentrations (ppm, wet-weight) in gutcontents of double-crested cormorants collected fromI Cat Island, Green Bay during 1988 30
Table 18. Chemical concentrations (ppm wet- and lipid-weight) in. carcasses and livers of adult male double-crested. cormorants collected from Cat Island, Green Bay during
1988 31
- Table 19. Chemical concentrations (ppm, lipid-weight) in carcassesand yolk/whole eggs of laying double-crested cormorants
- collected from Cat Island, Green Bay during 1988 32
. Table 20. Chemical concentrations (ppm, wet-weight) in double-
. crested cormorants eggs collected from individual nestson Spider Island, Lake Michigan during 1988 33
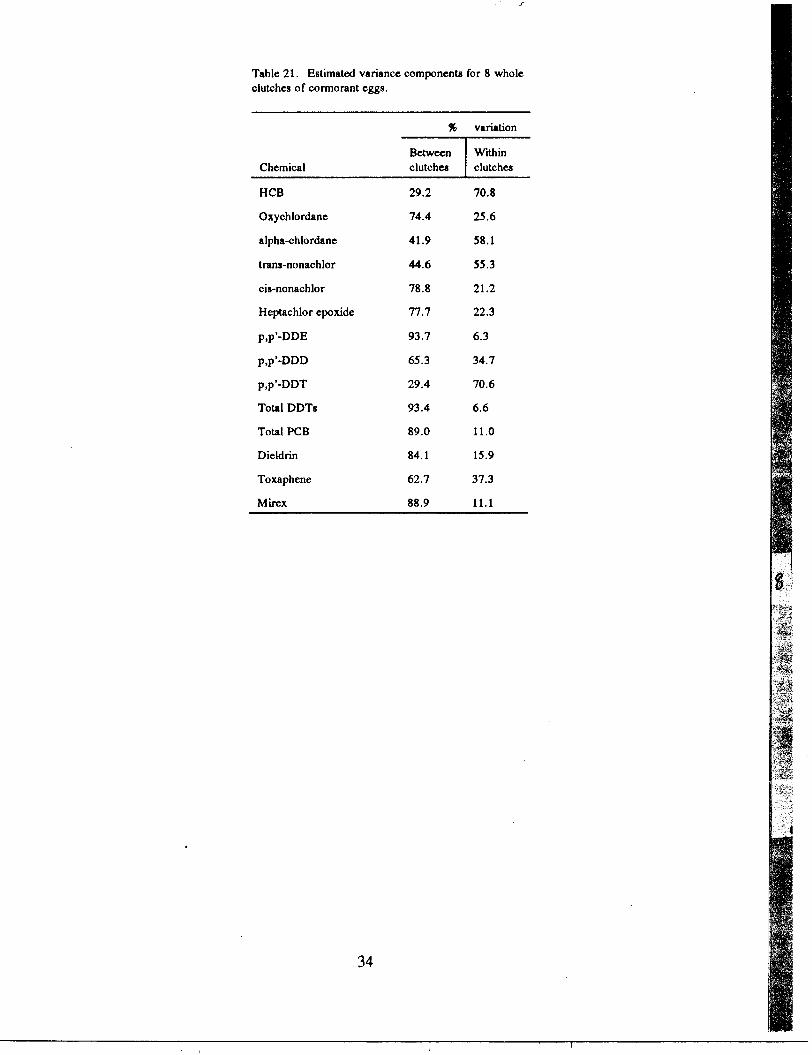
I Table 21. Estimated variance components for 8 whole clutches ofcormorant eggs 34
I
I
I
I
, v
~,! , I

I,
II List of Figures
IiFigure 1. Map of northeastern Wisconsin showing nine islands inI ' Green Bay and Lake Michigan where biota samples were
! collected during 1987 and 1988 3
_I
,, List of Appendices
I Appendix I. Estimated detection limits (ppm, dry-weight) for
metals in analyses of soil/guano, avian eggs, andI avian carcasses collected from islands in Green Bayand Lake Michigan during 1987 35
I
I
I
I
I
I
I
I
I vi
I,! '

-- ABSTRACT
-Biota samples were collected from several islands in Green Bay and Lake
. Michigan during 1987-1988 and were analyzed for various organochlorines and
. metals. PCBs and DDE were detected at all locations, and concentrationswere higher in fish-eating species such as herring gulls (Larus argenta/us) and. double-crested cormorants (Phalacrocorax auritus) than in waterfowl species.
. In addition, ox ychlordane , hexachlorobenzene (HCB), beta-BHC, delta-BHC,alpha-chlordane, gamma-chlordane, ~-nonachlor, ill-nonachlor, heptachlor. epoxide, DDD, DDT, dieldrin, and mirex were found in various samples.
. Although remaining relatively high, PCB, DDE, and dieldrin levels havedecreased in some biota during the past ten years. Local sources of PCBs. were important in cormorants, as levels in adult males increased temporally
. from 43.0 ppm during pre-nesting stage to 84.8 ppm during incubating stage.In cormorants, differences in PCB and DDE variability between clutchesI compared to variability within clutches indicates that single eggs can be usedto characterize the contaminant burdens of entire clutches.
I
I
I
I
I .
I
I
I .
I
I vii
I
I! !

-- INTRODUCTION
. The U.S. Fish and Wildlife Service (Service) is responsible for~ managing three wilderness areas in the northern Lake Michigan waters of
Wisconsin. These islands were "reserved and set apart.. .as a preserve and. breeding ground for native birds" by Executive Orders in 1912 and 1913 (Taft~ 1912, Taft 1913) and ultimately were designated as National Wildlife Refuges.
These, and similar islands in Green Bay itself, support a variety of trust. species, including colonial nesting birds such as the double-crested cormorant~ (Phalacrocorax auritus) and herring gull (Larus argentatus), as well as a
variety of waterfowl.. Previous studies by the Patuxent Wildlife Research Center established. that the biota of these islands were heavily contaminated with various
organochlorines, such as DDE, dieldrin, and polychlorinated biphenyls (PCBs)- (Haseltine et al. 1981, Heinz et al. 1983). These studies were prompted bythe results of White and Cromartie's (1977) national comparative survey oforganochJorine contamination of red-breasted merganser (Mergus serrator)- eggs which indicated that mergansers in this area of Lake Michigan were themost highly contaminated in the eastern United States. Piscivorous speciessuch as mergansers and cormorants are useful indicators of contaminant levels
- in the ecosystem because fish tend to bioaccumulate persistent chemicals likeorganochlorines. Organochlorine contamination is high in Green Bay, as wellas in the entire Lake Michigan system (Evans 1988). Because clean-up efforts- for the Lake Michigan ecosystem are at a threshold for making major progressin ecosystem rehabilitation, it is important to track progress toward theultimate goal of restoration.- A series of investigations was undertaken in the Green Bay area during1987-1988 to measure contaminant concentrations in trust resources, including. those on Service refuge islands and other islands of similar size and ecological
. character. Residue data were collected from a variety of substrates andlocations. More extensive data were gathered on double-crested cormorants,. including time-related contaminant uptake in adults and contaminant variation
. in whole clutches. These data will provide valuable background informationabout the role of contaminants in the welfare of Service trust species in this. area and serve as a reference point for tracking clean-up efforts. In addition,
. these data will assist in interpreting the results of parallel efforts at elucidatingcausal relationships between contaminants and biotic effects (Larson 1991,I Tillitt et al. 1992, Heinz et al. in prep.) that may be used to support claimsfor damages to natural resources on Service lands.
I .
I
I I
-
! ! '

II OBJECTIVFS
I 1) To provide information on the distribution of contaminants withinselected environmental compartments and to identify future sampling subjects.The survey was designed to determine whether or not the declining levels of
I contaminants in the Lake Michigan/Green Bay physical environment and foodweb have been reflected in decreases in contaminant burdens in biota, therebyproviding a historical perspective to prior studies of contaminants in the areaI avifauna.
2) To determine contaminant concentrations in whole bodies and livers ofI adult cormorants during successive stages of nesting in order to evaluate the
importance of local sources of contaminants.
I 3) To evaluate within and between clutch variation in contaminant levelsin cormorant eggs, in order to determine whether a single randomly selectedegg from a clutch can be used to characterize the contaminant burden of the
I entire clutch. This information was needed to plan future studies related toimpairment of reproduction.
ISTUDY AREA
I Samples were collected from four islands in Green Bay and five islandsin Lake Michigan (Figure 1). Green Bay islands included Kidney Island, a
8 confined disposal facility for contaminated dredge spoils (0.8 krn east of themouth of the Fox River, Green Bay, Brown Co., WI), Cat Island (2.1 krnnorth of Green Bay, Brown Co., WI), Hat Island (8.4 krn northwest of Egg
I Harbor, Door Co., WI), and Jack Island (6.8 krn northwest of Fish Creek,Door Co., WI). Lake Michigan islands (all located in Door Co., WI) included
. Spider Island (9.2 krn southeast of Ellison Bay), Gravel Island (9.1 krn east of~ Ellison Bay), Pilot Island (8.5 krn east of Gill's Rock), Hog Island (16.5 krn
northeast of Gill's Rock) and Fish Island (24.8 krn northeast of Gill's Rock).. Spider, Gravel, and Hog Islands are part of the National Wildlife Refuge~ system and are designated wilderness areas.
I
I .
I
- 2
-
I! !

IIIIII8 . Pilot
0 Gravel
I Jack,I Hat c..
IIII lakeI Michigan
II .
I Figure 1. Map of northeast em Wisconsin showing nine islands in GreenBay and Lake Michigan where biota samples were collected during 1987I and 1988.
3
I
,! !
II METHODS
I Sample collection
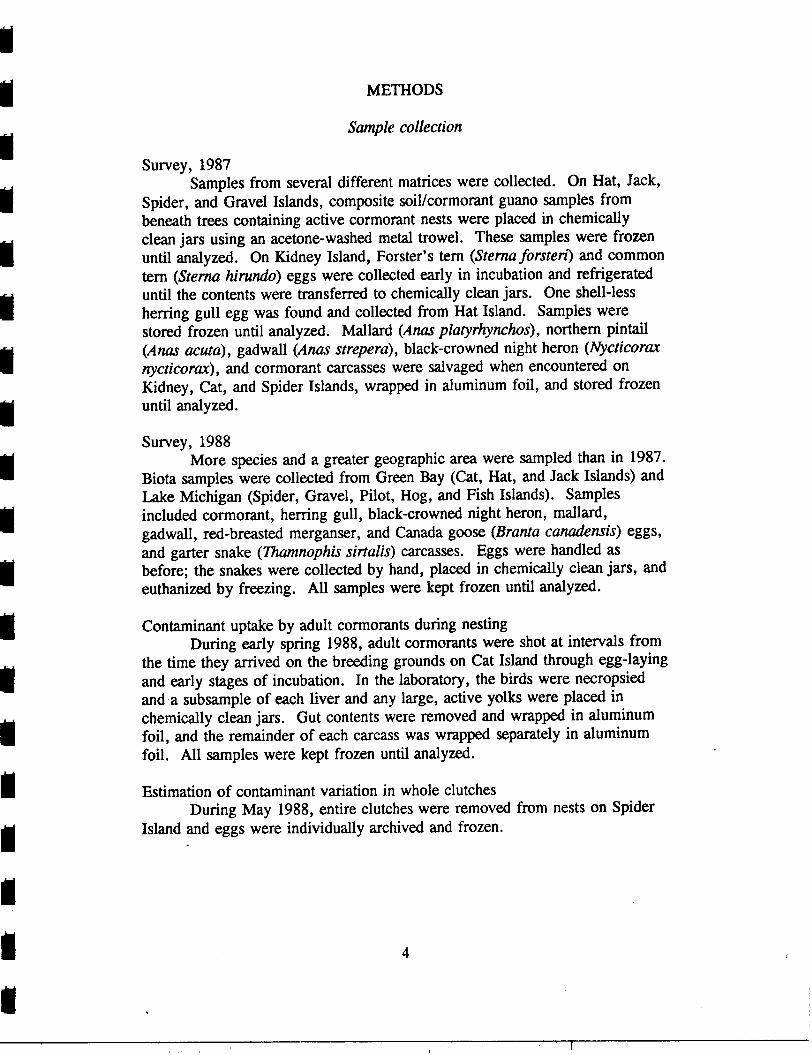
Survey, 1987I Samples from several different matrices were collected. On Hat, Jack,
Spider, and Gravel Islands, composite soil/cormorant guano samples from
beneath trees containing active cormorant nests were placed in chemicallyI clean jars using an acetone-washed metal trowel. These samples were frozen
until analyzed. On Kidney Island, Forster's tern (Sternaforsten) and commontern (Sterna hirundo) eggs were collected early in incubation and refrigerated
I until the contents were transferred to chemically clean jars. One shell-lessherring gull egg was found and collected from Hat Island. Samples werestored frozen until analyzed. Mallard (Anas platyrhynchos), northern pintail
I (Anas acuta), gadwall (Anas strepera), black-crowned night heron (Nycticoraxnycticorax), and cormorant carcasses were salvaged when encountered onKidney, Cat, and Spider Islands, wrapped in aluminum foil, and stored frozenI until analyzed.
Survey, 1988I More species and a greater geographic area were sampled than in 1987.
Biota samples were collected from Green Bay (Cat, Hat, and Jack Islands) andLake Michigan (Spider, Gravel, Pilot, Hog, and Fish Islands). SamplesI included cormorant, herring gull, black-crowned night heron, mallard,gadwall, red-breasted merganser, and Canada goose (Brama canadensis) eggs,and garter snake (Thamnophis sirtalis) carcasses. Eggs were handled asI before; the snakes were collected by hand, placed in chemically clean jars, andeuthanized by freezing. All samples were kept frozen until analyzed.
I Contaminant uptake by adult cormorants during nestingDuring early spring 1988, adult cormorants were shot at intervals from
the time they arrived on the breeding grounds on Cat Island through egg-layingI and early stages of incubation. In the laboratory, the birds were necropsied
and a sub sample of each liver and any large, active yolks were placed inI chemically clean jars. Gut contents were removed and wrapped in aluminumfoil, and the remainder of each carcass was wrapped separately in aluminumfoil. All samples were kept frozen until analyzed.
I Estimation of contaminant variation in whole clutchesDuring May 1988, entire clutches were removed from nests on SpiderI Island and eggs were individually archived and frozen.
I
I 4
I .
, if

1.. Laboratory methods. Survey, 1987Homogenization and metals analyses were performed by Environmental
Trace Substances Research Center in Columbia, Missouri. Carcasses wereI , plucked, and feet, beak, and gut contents were removed and discarded.
Mercury concentrations were determined by cold vapor atomic absorption andarsenic concentrations were determined by graphite furnace atomic absorption.
I Other metal concentrations were determined by inductively coupled plasmawith preconcentration. Metals are reported on a dry-weight basis. Detectionlimits for metals are given in the appendix.
I Analyses for organochlorine compounds were performed by gaschromatography/mass spectrometry at Mississippi State University. Resultsare reported on a wet-weight basis, with % lipid reported for reference. The
I lower level of detection for tissue and soil was 0.01 ppm.
Survey, 1988I Chemical analyses were performed at Texas A&M University inCollege Station, Texas. Tissue samples were homogenized and thequantitative analyses were performed by Sephadex chromatography (CGC)
I with a flame ionization detector for aliphatic hydrocarbons, CGC with electroncapture detector for pesticides and PCB's, and a mass spectrometer detector inthe SIM mode for aromatic hydrocarbons. Results are reported on a wet-
I weight basis. Detection limits were 0.50 ppm for total PCBs and toxapheneand 0.05 ppm for the remaining chemicals.
I Adult cormorant uptake and whole clutch varianceSamples were shipped to Mississippi State University for
organochlorine analyses by capillary column, flame ionization gasI chromatography and fluorescence HPLC in the adults and packed column,
electron capture gas chromatography in the clutches. Results are presented asI ppm, wet-weight. Detection limits were 0.05 ppm for total PCBs andtoxaphene and 0.01 ppm for the remaining chemicals.
I Statistical analyses
Chemical concentrations in eggs were corrected for moisture lossI (Stickel et al. 1973), unless otherwise noted. In these cases, egg volume data
were not available. Arithmetic means and standard deviations were calculatedfor all chemical and metal residues. When residues were not detected in anI individual sample, one half the detection limit was the value used incalculating the mean. Two-sample t-tests were used to compare Forster's ternPCB residues in 1983 and 1988, incorporating a procedure to test for unequal
I variances (Snedecor and Cochran 1980). Confidence intervals (95%) wereused to compare 1987 and 1988 PCB, DDE and dieldrin residues to historic
I 5
I
, , f

II levels in several species. The 1984 PCB levels in gulls were reported by
Bishop et at. (1992) as Aroclor 1254: 1260 1: 1 mixtures, which the authorsI report appear to be approximately twice the amount obtained when all PCB
congeners are summed. Therefore, a conversion factor of 0.46 (Turle et at.1991) was used to calculate total PCBs from the levels reported. OrthogonalI t-tests were used to compare mean values to identify spatial differences in1988 herring gull and mallard egg PCB and DDE residues (Kirk 1969). One-way analysis of variance was used to compare PCB residues relative to time
I and sex in adult cormorants (Sokal and Rohlf 1969). Birds were groupedtemporally in pre-nesting, laying, or incubating stages. Liver-to-carcass ratiosin males and egg-to-carcass correlations in females for contaminant levels were
I calculated. Body burdens of PCBs lost through laying were calculated by thefollowing formula:
I (Eg~ PCB wt X n)(Egg PCB wt X n)+(Carcass PCB wt)
I where Egg PCB wt = total PCB lipid-weight in eggn = number of eggs in clutch (3 or 4)Carcass PCB wt = total PCB lipid-weight in carcass
I 0 al . f . sed .. . h. ne-way an YSIS 0 VarIance was u to estimate VarIance components WIt In
and between cormorant clutches (Sokal and Rohlf 1969).
II RESULTS
I Survey, 1987
PCBs and DDE were found at detectable levels in all soil/guanoI samples (Table 1). PCB levels in individual samples ranged from 0.30 ppm
on Hat Island to 1.6 ppm on Jack Island. Residues of heptachlor epoxide justabove the limit of detection were found on Spider and Jack Islands, andI similarly, dieldrin was detected only on Gravel, Spider, and Jack Islands.
Avian eggs and carcasses contained detectable levels of oxychlordane,
~-nonachlor, ~-nonachlor, heptachlor epoxide, PCBs, DDD, DDE, DDT,I and dieldrin (Tables 2-3). The 6.8 ppm (C.I. 3.9-9.6) mean PCB value in1987 Forster's tern eggs from Kidney Island was similar (P > 0.50) to the 7.3ppm found by Harris et at. (1993) in 1988, but lower (P < 0.01) than the
I 19.2 ppm found in 1983 along the western shore of Green Bay (Kubiak et at.1989) and the 18.0 ppm found in 1978 on Long-tail Point (Heinz et at. 1985).The mean 1987 DDE level decreased from 2.9 ppm in 1978 to 1.2 ppm (C.I.
I 0.29-2.1). Dieldrin levels decrea~ from 0.25 ppm in 1978 to 0.09 (C.I.0.03-0.15). PCB and DDE levels In common tern eggs followed the same
I 6
I
,, ! i ,

pattern between 1977 (Lone Tree Island) and 1987. The reverse trend wastrue for dieldrin which increased from 0.06 in 1977 to 0.15 (C.I. 0.09-0.21) in1987.
The shell-less herring gull egg had exceptionally high levels of PCBs(45 ppm) and DDE (29 ppm) compared to those found in 1984 on the sameisland (16 ppm and 7.1 ppm, respectively) (Bishop et al. 1992); however,some moisture loss had occurred and inflated the wet-weight residues. On alipid-weight basis, these levels are still considerably higher than those found in
. 1988 (pCBs: 333 vs. 220 ppm, C.I. 122-317; DDE: 215 vs. 80 ppm, C.I.57.1-104) (see below).
Metal concentrations for all 1987 samples are presented in Tables 4-6.. Mean mercury levels are higher for both Forster's terns (2.5 ppm, C.I. 1.9-
3.2) and common terns (1.6 ppm, C.I. 1.1-2.1) than 1977/1978 levels (0.37ppm and 0.66 ppm, respectively) found in the lower bay (Heinz et al. 1985).. Survey, 1988. Detectable levels of oxych10rdane, PCBs, and DDE were present inavian eggs collected from all islands in 1988. In addition, hexachlorobenzene(HCB), beta-BHC, delta-BHC, alpha-chlordane, gamma-chlordane, ~-
. nonachlor, ~-nonachlor, heptachlor epoxide, DDD, DDT, dieldrin, and mirexwere found in various samples (Tables 7-14). Mean herring gull and mallardegg residues from individual islands were compared to detect any spatial. differences in PCB and DDE levels. In herring gull eggs, no difference wasindicated between Green Bay islands (Hat and Jack) and Lake Michigan islands(Spider, Gravel, and Hog) in levels of PCBs (P > 0.50) or DDE (0.10 > P. > 0.05). Similarly, no differences were found in mallard eggs values forPCBs (P > 0.50) and DDE (0.20 > P > 0.10) between bay (Hat and Jack)and lake islands (Spider, Pilot, and Hog). No differences were found in PCB. or DDE levels between 1) gulls on Hat vs. Jack Island, 2) mallards on Hat vs.Jack Island, 3) gulls on Spider vs. Gravel Island, 4) mallards on Spider vs.
I Pilot Island, and 5) mallards on Spider and Pilot vs. Hog Island (P > 0.05).There were differences in gull PCB levels (P < 0.01) and DDE levels (P <0.001) between Spider and Gravel vs. Hog Island. The low residues found in
I gull eggs from Hog Island compared to all other sites suggests a systematicanalytical error may be responsible for these differences.
Concentrations of organochlorines have decreased in some. compartments of the Lake Michigan ecosystem over the last two decades,. consistent with findings from other studies (Gilbertson 1983, Baumann and
Whittle 1988). In 1988, the overall mean PCB value for Spider, Pilot, and. Hog Island red-breasted merganser eggs of 9.6 ppm was lower (95% C.I. 7.1-. 12.3) compared to the 1977 mean of 25 ppm and the 1978 mean of 20 ppm ineggs collected from the same islands (Haseltine et al. 1981). The mean
. merganser DDE value in 1988 was 3.11 (95% C.I. 2.06-4.15) compared to. 8.3 ppm in 1977 and 8.1 ppm in 1978. Dieldrin levels were also lower in
I 7
I,,_~"~c~..i;;!,,"~~ ",_c"..., ~".";" ".,t:'"' "L.,J""W",""""""h~;C 13",1",' ."",",,,c.o.:...,,;" "",,,"-

.
. 1988, with a mean value of 0.51 ppm (95% C.I. 0.33-0.69) compared to 0.86in 1977 and 0.81 in 1978.
. Concentrations of PCBs, DDE, and dieldrin in herring gulls werecompared with 1977, 1978, and 1984 levels from Gravel Island, and 1984levels from Hat and Spider Islands (Heinz et al. 1985, Bishop et al. 1992).
. The highest single egg concentration of PCBs (61 ppm) in 1988 was found on
. Gravel Island. The mean PCB value was lower on Gravel Island in 1988 (30ppm, C.I. 6.5-53) compared to 1977 (100 ppm) and 1978 (65 ppm) values, but
. not to 1984 (20 ppm). The mean DDE value was lower on Gravel Island in. 1988 (5.0 ppm, C.I. 2.9-7.1) compared to 1977 (33 ppm), 1978 (33 ppm), and1984 (8.7 ppm). PCB and DDE levels were not different on Hat and Spider
. Islands between 1988 and 1984, and dieldrin levels in 1988 did not differ from. any year or location.Comparing contaminant levels in double-crested cormorant eggs from- Fish Island to 1977 and 1978 values, the mean DDE value of 2.7 ppm (C.I.
0.30-5.1) was lower than the 1977 value of 5.3 ppm. PCBs and dieldrinlevels did not differ between years.
I PCB, DDE, and dieldrin levels in black-crowned night heron eggs fromCat Island were all lower compared to 1978 and 1980 levels (Heinz et al.1985). PCBs decreased from 15.0 ppm in 1978 and 24.0 ppm in 1980 to 5.8
I ppm (C.I. 0-13.4). DDE decreased from 4.0 ppm in 1978 and 5.4 ppm in1980 to 0.65 ppm (C.I. 0.11-1.2). Dieldrin decreased from 0.18 ppm in 1978. and 0.15 ppm in 1980 to 0.04 ppm (C.I. 0.02-0.06). The 1.6 ppm PCB value
. found in the Spider Island egg was well below the 23 ppm found in a 1978Spider Island egg.
I Contaminant uptake by adult comwrants during nesting
I All birds in the pre-nesting stage sample were males, suggesting thatmale cormorants arrive earlier than females on the breeding grounds. Bodyburdens of male cormorants approximately doubled between pre-laying and
I incubating stages (Table 15). PCB concentrations in male cormorant carcassesdiffered relative to time, corresponding to pre-nesting, laying and incubatingstages (P < 0.01). PCB levels increased between pre-nesting and theI laying/incubating stages (Table 16). Female cormorant PCB concentrationsdid not differ between laying and incubation stages (P > 0.50). There wereno differences between sexes relative to laying, incubating, or the two stagesI combined (P > 0.10). There were no differences in DDT compounds betweentime intervals (P > 0.50). Other. contaminants were present at low levels.The mean PCB concentration was 3.3 ppm in gut contents (Table 17).I Liver concentrations of contaminants in adult cormorants generallywere lower than corresponding carcass concentrations (Table 18). Liver tocarcass ratios are higher when reported on a lipid-weight versus a wet-weight
I basis. Lipid-weight comparisons between matrices are more useful due to thelipophilic nature of PCBs. This is important in terms of reproductive success
I 8
I
,f

. -I because of the high lipid content of eggs which presumably act as sinks for
lipophilic chemicals. Correlations for carcass to yolk and whole eggI comparisons on a lipid-weight basis ranged from r = -0.14 for p,p'-DDT to r= 0.99 for oxychlordane (Table 19). Body burdens of PCBs lost through egglaying were 2.8-4.7% given three eggs per clutch and 3.7-6.2% given four
I eggs per clutch. The mean mass of PCBs lost through egg laying given afour-egg clutch compared to male body burdens were 3.1-9.8% in pre-laying,2.2-5,9% in laying, and 2.0-5.0% in incubating stages.
I Estimation of contaminant variation in whole clutches
I Contaminant levels were different between clutches for all detectablecontaminants (P < 0.04 HCB, p,p'-DDT; P < 0.01 remaining chemicals)(Table 20). The real intent of this study was to estimate relative contributions
I to variation for use in parallel studies. These estimates indicated thatgenerally, variation between clutches was greater than variation within clutches(Table 21). This is certainly true for major contaminants in the system;I between clutch variation was 93.4% for total DDTs, 89.0% for total PCBs,and 84.1 % for dieldrin.
IDISCUSSION
I 0 f th . .. 'd h. .calne purpose 0 ese Investigations was to prOVl e a IstonI perspective to prior studies of contaminants in the avifauna of this area.Contaminant levels have demonstrably decreased from earlier studies. Forexample, PCBs in Forster's tern eggs have decreased by more than 60%
I between 1983 (19.2 ppm) and 1987 (6.8 ppm), DDE in merganser eggs hasdecreased by more than 60% between 1977/78 (8.2 ppm) and 1988 (3.1 ppm),and PCBs in merganser eggs has decreased similarly by more than 55 %
I between 1977/78 (22 ppm) and 1988 (9.6 ppm). PCBs in herring gull eggshave decreased by more than 50% between 1978 (65 ppm) and 1988 (30 ppm).However, the decrease in herring gull eggs between 1984 and 1988 has been
I much less, and, in the case of PCBs and dieldrin, it was not detectable frombackground variation. The shell-less herring gull egg found on Hat Island hadhigh levels of contaminants, especially DDE (29 ppm). Further study will be
I needed to determine whether or not contaminants are indeed decreasing morein terns and mergansers than in gulls.
As expected, piscivorous birds such as herring gulls, cormorants, andI mergansers contain higher levels of organochlorines than species such as
mallards and geese, The low levels « 1.0 ppm) of PCB and DDT compoundsfound in garter snake carcasses confirms earlier observations by Heinz et al.I (1980) that this species is not a good indicator of organochlorinecontamination. Although the sedentary nature of garter snakes is valuable in
I 9
I..~~-"C""'-~"""" +_.~ "; ~,~~~~_.~i\ ""'0" ,""; c-'",

. reflecting local contamination, they do not appear to concentrate the chemicals.Mercury levels in terns may be of concern. The 1.6 and 2.5 ppm
I mean values are higher than 1970s levels, as well as the 0.86 ppm that Heinz(1979) found to impair reproduction in mallards. Analytical methods formercury determination have been somewhat controversial, and this issueI warrants further study.
The importance of local sources of contamination was clearlyestablished by the study of contaminant uptake by adult cormorants. Body
I burdens of PCBs approximately doubled after arrival on the breeding grounds,due to contamination of their food items. The 3.3 ppm PCBs found in gutcontents is considerably higher than the 0.2-0.4 ppm in forage fish suggestedI by Harris et al. (1993) as the no observable adverse effects level (NOEAL) forForster's terns. In contrast, body burdens of DDT compounds were relativelyconstant. This may reflect the importance of the Green Bay ecosystem as anI unusually high source of PCBs to migratory birds. The lack of change inDDT compounds may be a result of an equilibrium condition across a broadgeographic area whereas birds returning to Green Bay are subject to unusually
I hig~ levels of PCBs that require some time for equilibration with theirenVironment.
Combined with Custer and Bunck's (1992) results on the foragingI patterns of cormorants at Cat and Spider Islands, the present studydemonstrates that the environment near the nesting colony is vital todetermining the degree of contamination of these piscivorous birds. In
I addition, the clearance of contaminants from these birds via transfer to eggs isrelatively small. Thus, it is unlikely that renesting or later nesting birds will
I be less subject to contaminant effects than are the early arriving or nestingbirds. The differential arrival by sex was not anticipated and the similarity ofbody burdens by the beginning of the laying period may indicate an extremely
I rapid equilibration with the local environment. Alternatively, the arrival datesmay not differ by more than a few days and we were unable to detect this dueto our sampling schedule. If this is the case, then body burdens may indeed
I continue to increase throughout the summer. A fall sampling schedule wouldbe instructive.
The study on contaminant variation in eggs from the same clutch was
I conducted to determine whether a single randomly selected egg from a clutchcan be used to characterize the contaminant burden of the entire clutch. Forthe chemicals of concern, PCBs and DDTs, this certainly appeared to be true,
I with variation between clutches greater than variation within clutches.Consequently, it is possible to design retrospective studies in which nests arecharacterized by archiving single eggs with analysis of only those sample eggs
I of interest based on nest fate. This will result in precise tests of hypothesizedrelationships between contaminants and adverse reproductive effects. Thismay alleviate geographic confounding and "retroductive" inferencesI (Romesburg 1981:294) by allowing crucial experiments (Romesburg 1991:749)within contaminated colonies (a mensurative approach [Sinclair 1991:769])
I 10
I
l , .. . ~ '

instead of relying on correlations of effects between colonies (retroduction).The levels of soil/guano contamination in these colonies are disturbing.
Although there is no overall guidance on acceptable soil levels oforganochlorines like PCBs, a target level of I ppm has been established for theSuperfund cleanup of Crab Orchard National Wildlife Refuge (Leanne Moore,U.S. Fish and Wildlife Service, personal communication). Both Spider andJack Island samples approached this level and, in addition to reinforcing thecontaminated nature of these habitats, this raises interesting management
. questions concerning contaminants on Service lands. Because the source ofthe PCBs on these islands is predominately Lake Michigan and Green Bayfish, contaminants in those fish are not only affecting Service trust species, but
. also habitats on Service lands. When potential Natural Resource DamageAssessment (NRDA) activities are considered, injury to Service lands must beevaluated. Any actions the Service takes will be strengthened considerably if
. it can be demonstrated that Service lands are affected as well as trust species.The Service will also be able to claim status as a land management agencywith interests in water, air, and geological resources... CONCLUSIONS AND RECOMMENDA nONS
Despite the wilderness designation of Gravel and Green Bay National. Wildlife Refuges, these islands are affected by the by-products of industrialcivilization. The biota and habitats of these Service lands are contaminatedand degraded. Further studies should be considered in order to assess the. health of Service lands and trust species inhabiting them. Long-termmonitoring of the biota of these refuges should be continued in order to track
~ progress in ecosystem remediation. These islands are one of the few places in. Lake Michigan/Green Bay where a historic data base exists on trust species.This monitoring program should focus on both the biology and contaminant
I burdens of mergansers and cormorants. Other agencies are tracking gulls onan extensive basis and gulls can be used as needed to compare results withthose from cormorants and mergansers.
~ Equally important is the need for critical tests of the cause and effect. relationships between putative reproductive impairments and organochlorinechemicals. Evidence of these relationships are needed both for management. purposes and potential use in NRDA actions. In the absence of solid scientific. results using accepted hypothetico-deductive techniques, NRDA actions may becompromised by unnecessary litigation about causation based on inferences- from correlations.
II 11
I._"""-, _~i ~ k,t!.",," ",...c~ ,.;,,".~-~~.cJ -~ .~"."_J...
I
I REFERENC~
I Baumann, P.C. and D.M. Whittle. 1988. The status of selected organics in theLaurentian Great Lakes. An overview of DDT, PCBs, dioxins, furans, andaromatic hydrocarbons. Aquat. Toxicol. 11:241-257.
I Bishop, C.A., D. V. Weseloh, N.M. Burgess, J. Struger, R.J. Norstrom, R.Turle, and K.A. Logan. 1992. An atlas of contaminants in eggs of fish-
I eating colonial birds of the Great Lakes (1970-1988). Vol. I. Technical
Report Series No. 152, Canadian Wildlife Service, Ontario Region.
I Custer, T. W., and C. Bunck. 1992. Feeding flights of breeding double-crested cormorants at two Wisconsin Colonies. J.Field Ornithol. 63:203-211.
I Evans, M.S. ed. 1988. Toxic Contaminants and Ecosystem Health: A GreatLakes Focus, Vol. 21. Wiley Series Advances in Environmental Science andI Technology. John Wiley and Sons. New York, New York.
Gilbertson, M. 1983. Etiology of chick edema disease in herring gulls in theI lower Great Lakes. Chemosphere 12:357-370.
Harris, H.J., T.C. Erdman, G.T. Ankley, and K.B. Lodge. 1993. MeasuresI of reproductive success and polychlorinated biphenyl residues in eggs and
chicks of Forster's terns on Green Bay, Lake Michigan, Wisconsin-1988.Arch.Environ.Contam. Toxicol. 25:304-314.
I Haseltine, S.D., G.H. Heinz, W.L. Reichel, and J.F. Moore. 1981.
I Organochlorine and metal residues in eggs of waterfowl nesting on islandsin Lake Michigan off Door County, Wisconsin, 1977-1978. Pestic.Monit.J.15(2):90-97.
I Heinz, G.H. 1979. Methylmercury: reproductive and behavioral effects onthree generations of mallard ducks. J. Wildl.Manage. 43(2):394-401.
I Heinz, G.H., S.D. Haseltine, R.J. Hall, and A.J. Krynitsky. 1980.Organochlorine and mercury residues in snakes from Pilot and SpiderI Islands, Lake Michigan-1978. Bull.Environ.Contam. Toxicol. 25:738-743.
Heinz, G.H., S.D. Haseltine, W.L. Reichel, and G.L. Hensler. 1983.I Relationships of environmental contaminants to reproductive success in red-
breasted mergansers Mergus serrator from Lake Michigan. Environ.Pollut.(Ser.A) 32:211-232.
I
I 12
I, I, ! ,

II Heinz, G.H., T.C. Erdman, S.D. Haseltine, and C. Stafford. 1985.
Contaminant levels in colonial waterbirds from Green Bay and LakeI Michigan, 1975-80. Environ. Monitor. Assess. 5:223-236.
Heinz, G.H., D.S. Miller, B. Ebert, K.L. Stromborg. In prep. Declines inI organochlorines in eggs of red-breasted mergansers from Lake Michigan,1977-78 versus 1990.
I Kirk, R.E. 1969. Experimental Design: Procedures for the BehavioralSciences. Wadsworth Publishing Company, Inc. Belmont, California.
I Kubiak, T.J., H.J. Harris, L.M. Smith, T.R. Schwartz, D.L. Stalling, J.A.Trick, L. Sileo, D.E. Docherty, and T.C. Erdman. 1989.Microcontaminants and reproductive impairment of the Forster's tern onI Green Bay, Lake Michigan-1983. Arch.Environ.Contam. Toxicol. 18:706-727.
I Larson, J. 1991. Reproduction and Developmental Anomalies in Double-crested Cormorants (Phalacrocorax auritus) on Lake Michigan: AnEnvironmental Contaminants Study. Master's Thesis, University ofI Wisconsin, Madison, Wisconsin.
I Romesburg, H.C. 1981. Wildlife science: gaining reliable knowledge. J.Wildl.Manage. 45(2):293-313.
. 1991. On improving the natural resources and environmental. sciences. J. Wildl.Manage. 55(4):744-756.
I . Sinclair, A.R.E. 1991. Science and the practice of wildlife management. J.Wildl.Manage. 55(4):767-773.
I Snedecor, G.W. and W.G. Cochran. 1980. Statistical Methods. 7th ed. TheIowa State University Press. Ames, Iowa.
I Sokal, R.R. and F.J. Rohlf. 1969. Biometry - The principles and practice ofstatistics in biological research. W.H. Freeman and Company. SanFrancisco, California.
I Stickel, L.F., S.N. Wiemeyer, and L.J. Blus. 1973. Pesticide residues in eggsof wild birds: adjustment for loss of moisture and lipid. Bull. Environ.I Contam.Toxicol.9:193-196.
Taft, W.H. Executive Order No. 1487. February 21, 1912. :I Executive Order No. 1678. January 9, 1913. I
I 13
I
I, !

II Tillitt, D.E., G. T. Ankley, J.P. Giesy, J.P. Ludwig, H. Kurita-Matsuba, D. V.
Weseloh, P .S. Ross, C.A. Bishop, L. Sileo, K.L. Stromborg, J. Larson,I and T.J. Kubiak. 1992. Polychlorinated biphenyl residues and egg mortality
in double-crested cormorants from the Great Lakes. Environ. Toxicol.Chem.11:1281-1288.
I Turle, R., R.J. Norstrom, and B. Collins. 1991. Comparison of PCBquantitation methods: Re-analysis of archived specimens of herring gull eggsI from the Great Lakes. Chemosphere 22(1-2):201-213.
White, D.H. and E. Cromartie. 1977. Residues of environmental pollutantsI and shell thinning in merganser eggs. Wilson Bull. 89(4):532-542.
I
I
I
I
I
I
I
I
I
I .
I
I 14
I
I! '

II Table 1. Chemical concentrations (ppm, wet-weight) in soiVguano collected from
islands in Green Bay and Lake Michigan during 1987 (n = 1).
I Gravel Spider Hat Hat Jack Jack
HCB ND ND ND ND ND NDI alpha-BHC ND ND ND ND ND ND
beta-BHC ND ND ND ND ND ND
delta-BHC ND ND ND ND ND NDI gamma-BHC ND ND ND ND ND ND
Oxychlordane ND ND ND ND ND ND
alpha-chlordane ND ND ND ND ND ND
I gamma-chlordane ND ND ND ND ND ND
trans-nonachlor ND ND ND ND ND ND
cis-nonachlor ND ND ND ND ND ND
I Heptachlor ND 0.02 ND ND ND 0.02
epoxideTotal PCBs 0.37 0.88 0.30 0.63 0.36 1.6
I o,p'-DDE ND ND ND ND ND ND
p,p'-DDE 0.14 0.29 0.08 0.30 0.10 0.47
I o,p'-DDD ND ND ND ND ND ND
p,p'-DDD ND ND ND ND ND ND
o,p'-DDT ND ND ND ND ND ND
I p,p'-DDT ND ND ND ND ND ND
Dieldrin 0.03 0.05 ND ND ND 0.05
Toxaphene ND ND ND ND ND ND
I Endrin ND ND ND ND ND ND
Mirex ND ND ND ND ND ND
Weight (g) 840 574 896 786 784 592I % Moisture 14.6 47.4 53.8 48.0 35.8 60.0
I
I
I
I
I
I 15
I
i ! ! ,I

II Table 2. Chemical concentrations (ppm, wet-weight) in avian eggs collected from Kidney
Island, Green Bay during 1987. I)
I Forster's tern Common tern(n = 5) (n = 5)
HCB ND ND
I alpha-BHC ND ND
beta-BHC ND ND
I delta-BHC ND NDgamma-BHC . ND ND
Oxychlordane 0.032:f:0.0192J 0.038:f:0.015I alpha-chlordane ND ND
gamma-chlordane ND ND
trans-nonachlor 0.13 :f:0.069 0.036:f:0.Ol1
I cis-nonachlor 0.062:f:0.036 0.026:f:0.Oll
Heptachlor epoxide 0.046:f:0.025 0.056:f:0.031
I Total PCBs 6.8:f:2.3 10.3:f:3.70
o,p'-DDE ND ND
p,p'-DDE 1.2:f:0.74 1.7:f:0.81
o,p'-DDD ND ND
I p,p'-DDD 0.024:f:0.027 0.034:f:0.OO55
o,p'-DDT ND NDI p,p'-DDT ND ND
Dieldrin 0.090:f:0.048 0.15 :f:0.047
Toxaphene ND ND
I Endrin ND ND
Mirex ND ND
Weight (g) 19.4:f:2.3 17.0:f:l.7I % Moisture 78.1:f:l.9 78.2:f:l.8
% Lipid 8.1:f:l.6 7.6:f:2.3I 1] Samples were not corrected for moisture loss.2] Mean:f: s.d.
I
I
I
I
I 16
III !

II Table 3. Chemical concentrations (ppm, wet-weight) in miscellaneous biota collected from islands in
Green Bay and Lake Michigan during 1987 (11 = 1).
I MalIaId Pinlail Gadwall Cormol'nt Black-crow-' Black-crowned Hernn,carCUI carCUI carCUI C&/'C8I8 nilht heroo nilht heron auU CliKidney Kidney Kidney SpMler carcua C&/'C8I8 Hat IslandIsland Island Island Island Cat Island Cat Island
I HCB ND ND ND ND ND ND ND
aipha-BHC ND ND ND ND ND ND ND
beta-BHC ND ND ND ND ND ND ND
I delta-BHC ND ND ND ND ND ND ND
lamma-BHC ND ND ND ND ND ND NDI Oxychlordane ND ND ND 0.16 0.06 0.05 1.6
aipha-chlordane ND ND ND ND ND ND ND
lamma-chlordane ND ND ND ND ND ND ND
I tranI-nonachlor 0.01 0.01 0.01 0.08 0.29 0.12 0.13
cil-nonachlor ND ND ND 0.16 0.17 0.07 0.17
Heptachlor ND ND ND 0.31 0.08 0.03 0.78I cpowe
Total PCBo 2.4 0.93 1.0 10 11 8.0 45
o,p'-DDE ND ND ND ND ND ND ND
I p,p'-DDE 0.17 0.08 0.09 3.4 2.4 2.5 29
o,p'.DDD ND ND ND ND ND ND ND
p,p'.DDD ND ND ND 0.15 0.12 0.02 0.46
I o,p'.DDT ND ND ND ND ND ND 0.17
p,p'-DDT ND ND ND ND ND ND 1.5
Dieklrin ND 0.01 0.01 1.0 0.13 0.09 1.2
.I Toxaphene ND ND ND ND ND ND ND
EMrin ND ND ND ND ND ND ND
Mmx ND ND ND ND ND ND ND
I Weilht(g) 459 201 152 2170 572 365 45.8
% Moisture 67.8 71.6 70.0 66.8 65.4 72.2 63.9
.I % liDMi 1.3 1.8 1.9 7.9 9.7 1.2 13.5
I
I
I .
I
I 17
I
, ,,

Table 4. Metal concentrations (ppm, dry-weight) in Boil/guano collected from islands inGreen Bay and Lake Michigan during 1987 (n = 1).
Gravel Spider Hat Hat Jack Jack
Aluminum 583 752 3050 2790 2720 1940
Arsenic 0.57 0.48 0.59 1.2 0.83 0.93
Barium 5.9 15.9 36.1 44.4 36.4 40.1
Beryllium ND ND 0.3 0.3 0.2 0.1
Boron ND 4 5 10 5 6.7
Cadmium ND 1.0 0.4 0.95 0.70 1.1
Chromium 3 2 4.6 5.2 4.6 4.0
Copper 2.8 10 9.6 16 9.7 21
Iron 1870 1350 2650 3280 3780 4000
Lead ND 14 13 23 13 16
Magnesium 5330 6960 63200 57900 43900 13700
Manganese 33.7 72.2 88.3 224 209 217Mercury 0.069 0.27 0.19 0.27 0.12 0.31
Molybdenum ND ND ND ND ND
Nickel ND ND 2 3 3 2
Selenium ND ND ND ND ND
Silver ND ND ND ND ND ND
Strontium 32.2 76.4 36.3 35.6 23.0 86.0
Thallium ND ND ND ND ND ND
Vanadium 4.1 2.1 4.2 5.2 4.2 3.5
Zinc 89.7 306 70.4 151 113 355 i!
% Moisture 20.0 44.2 52.5 44.7 40.1 60.9 i
iIjii,
iiiI
Ii,II
I
I
18
I, !

"i,+p:,
Table 5. Metal concentrations (ppm, dry-weight) in avianeggs collected from Kidney Island, Green Bay during 1987.1)- -
Forster's tern Common tern(n = 5) (n = 5)
Aluminum 5.2:1:7.22) 2.6:1:2.5
Arsenic 0.080:1:0.067 ND
Beryllium ND ND
Cadmium ND ND
Chromium 0.70:1:1.2 0.43:1:0.54
Copper 3.6:1:0.42 3.5:1:0.34Iron 124:1:28.8 132:1:34.3
Lead 0.53 :1:0.71 ND
Manganese 1.8 :1:0.49 2.3 :1:0.72
Mercury 2.5:1:0.53 1.6:1:0.40Nickel 0.42:1:0.55 0.18:1:0.084
Thallium ND ND
Zinc 55.7:1:3.21 63.3:1:7.87
% Moisture 77.0+1.8 76.8+2.1
I) Samples were not corrected for moisture loss.2) Mean:1: s.d.
Table 6. Metal concentrations (ppm, dry-weight) in miscellaneous biota collected from islands in GreenBay and Lake Michigan during 1987 (n = 1).
Mallard Pintail Gadwall Cormorant Black- Black- Herringcarcass carcass carcass carcass crowned crowned gull eggKidney Kidney Kidney Spider night heron night heron HatIsland Island Island Island carcass carcass Island
Cat Island Cat Island~ -- Aluminum 372 330 159 20 47.3 65.3 3.4
Arsenic 0.83 ND ND ND ND ND ND
Beryllium 0.02 0.03 0.01 ND ND 0.01 ND
Cadmium 0.089 0.04 0.07 0.17 0.05 0.06 NDChromium 9.7 22.6 9.5 2.1 6.0 38.0 ND
Copper 25.9 36.4 39.9 7.64 17.9 30.3 3.49Iron 862 632 403 309 219 418 102
Lead 420 1.9 1.8 17 ND ND ND
Manganese 16.9 18.6 13.2 2.89 3.36 3.95 2.2
Mercury 1.07 1.7 2.0 2.5 1.2 0.897 0.508
Nickel 1.6 1.9 3.7 0.74 1.4 1.3 0.2
Thallium ND ND ND 0.6 ND ND ND
Zinc 150 147 157 70.1 106 177 61.5
% Moisture 68.5 70.2 72.7 66.9 70.4 71.4 63.9 .
19
I
,,
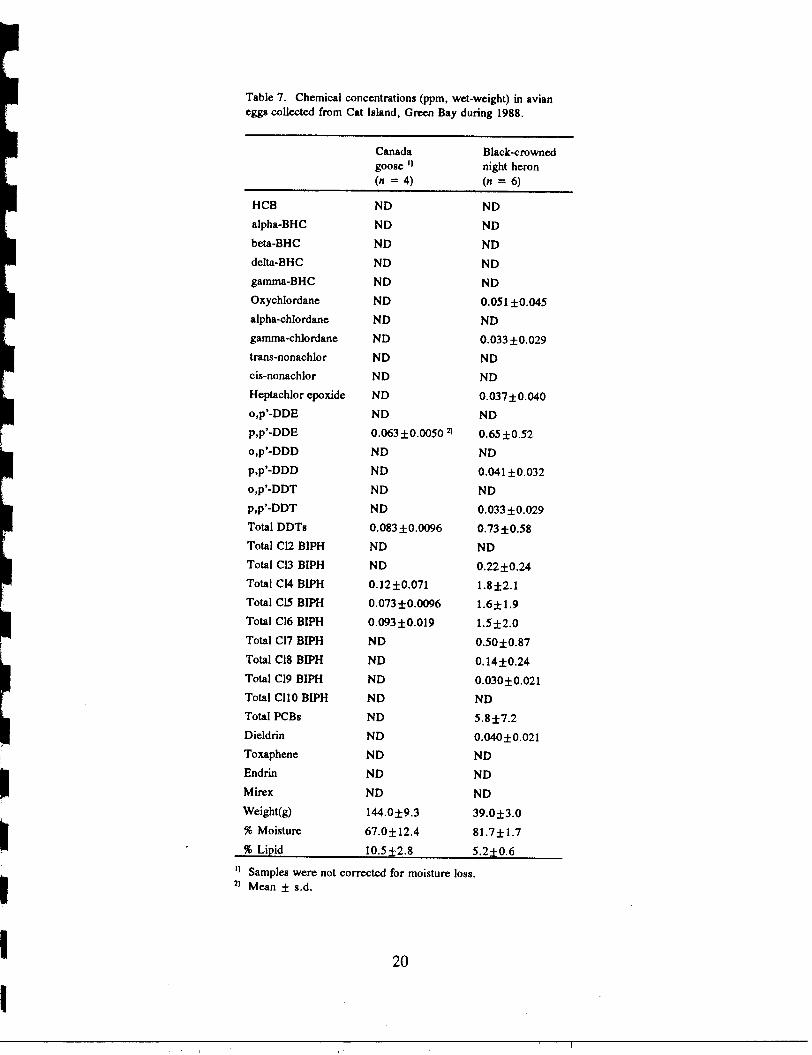
Table 7. Chemical concentrations (ppm, wet-weight) in avianeggs collected from Cat Island, Green Day during 1988.
Canada Dlack~rownedgoose I) night heron(n = 4) (n = 6)
HCD ND ND
alpha-DHC ND ND
beta-DHC ND ND
delta-DHC ND ND
gamma-DHC ND ND
Oxychlordane ND 0.051 :to.045
alpha-chlordane ND ND
gamma~hlordane ND 0.033 :to.029
trans-nonachlor ND ND
cis-nonachlor ND ND
Heptachlor epoxide ND 0.037:t0.040
o,p'-DDE ND NDp,p'-DDE 0.063 :to.OO50 2] 0.65 :to.52
o,p'-DDD ND ND
p,p'-DDD ND 0.041 :to.032
o,p'-DDT ND ND
p,p'-DDT ND 0.033 :to.029
Total DDTs 0.083:t0.0096 0.73:t0.58
Total CI2 DIPH ND ND
Total CI3 DIPH ND 0.22:t0.24
Total C14 DIPH 0.12:t0.07I 1.8:t2.1
Total ClS DIPH 0.073:t0.0096 1.6:tI.9
Total CI6 DIPH 0.093:t0.019 1.5:t2.0
Total CI7 DIPH ND 0.50:t0.87~ Total CI8 DIPH ND 0.14:t0.24
Total CI9 DIPH ND 0.030:t0.021
Total ClIO DIPH ND ND
Total PCDs ND 5.8:t7.2
Dieldrin ND 0.040:t0.O21
Toxaphene ND ND
I Endrin ND ND
Mirex ND ND~
Weight(g) I44.0:t9.3 39.0:t3.0. % Moisture 67.0:t12.4 81.7:t1.7
~ % Lipid 10.5 :t2.8 5.2:t:0.6
IJ Samples were not corrected for moisture loss.I 2) Mean:t s.d.
I 20
I
I, '
I- Table 8. Chemical concentrations (ppm, wet-weight) in biota collected from~ Hat Island, Green Bay during 1988.
Mallard egg Herring gull Garter snakeegg \) carcass
(n = 4) (n = 4) (n = 1)
HCB ND ND ND
alpha-BHC ND ND ND
beta-BHC ND ND ND
delta-BHC ND ND ND
gamma-BHC ND ND ND
Oxychlordane O.04S:f:O.046 0.28:f:0.14 ND
alpha-chlordane ND ND ND
gamma-chlordane ND ND NDtrans-nonachlor 0.OS4:f:0.064 2) 0.095:f:0.048 ND
cis-nonachlor 0.027 :f:O.Oll 0.073 :f:0.026 ND
Heptachlor ND 0.20:f:0.071 NDepoxideo,p'-DDE ND 0.073:f:0.021 ND
p,p'-DDE 0.73:f:0.80 S.7:f:l.l 0.34
o,p'-DDD ND ND ND
p,p'-DDD ND 0.044:f:0.038 ND
o,p'-DDT ND 0.034:f:0.018 ND
p,p'-DDT 0.037:f:0.018 0.064:f:0.036 ND
TotalDDTs 0.78:f:0.82 S.9:f:l.1 0.34
Total Cl2 BIPH ND ND ND
Total Cl3 BIPH ND 0.20:f:0.079 ND
Total CI4 BIPH 0.24:f:0.33 3.4:f:l.S 0.11
Total ClS BIPH 0.36:f:0.4S 3.8:f:l.3 O.lS
Total CI6 BIPH 0.44:f:0.49 S.S:f:l.2 0.29
Total CI7 BIPH 0.13:f:0.18 2.3:f:0.S4 0.06
Total Cl8 BIPH ND 0.41 :f:O.l 0 ND
Total Cl9 BIPH ND ND ND
Total ClIO BIPH ND ND ND
Total PCBs 1.1:f:l.S lS.6:f:4.34 0.61
Dieldrin ND 0.60:f:0.30 ND
Toxaphene ND ND ND
Endrin ND ND ND
Mirex ND ND ND
Weight (g) 50.6:f:2.9 87.3:f:7.5 (n=3) 71.0
. % Moisture 68.1 :f:l.3 76.3:f:0.5 71.4
% Liuid 12.1+2.2 7.1+0.9 7.9
\J Samples were not corrected for moisture loss.2J Mean:f: s.d.
,
~ 21
,
I
I, '
~Table 9. Chemical concentrations (ppm, wet-weight) in avian eggscollected from Jack Island, Green Bay during 1988.
Mallard Canada goose I] Herring gull I)(n = 4) (n = 2) (n = 6)
HCB ND ND 0.11 ;to.068
alpha-BHC ND ND ND
beta-BHC ND ND 0.039;t0.035
delta-BHC ND ND 0.034;t0.023
gamma-BHC ND ND ND
Oxychlordane 0.082;t0.122) ND 0.30;t0.lO
alpha-chlordane ND ND 0.034;t0.023
gamma-chlordane ND ND 0.034;t0.023
trans-nonachlor 0.10;t0.16 ND 0.11;t0.O6O
cis-nonachlor ND ND 0.093 ;to.040
Heptachlor 0.037 ;to.032 ND 0.23 ;to. 11
epoxide
o,p'-DDE ND ND 0.036;t0.027
p,p'-DDE 1.6;t2.4 ND 4.2;tl.5
o,p'-DDD ND ND 0.067;t0.058
p,p'-DDD ND ND 0.083;t0.065
o,p'-DDT ND ND O.045;t0.038
p,p'-DDT 0.063;t0.084 ND O.11;t0.057
Total DDTs 1.6;t2.5 0.055;t0.07l 4.5;tl.6
Total CI2 BIPH ND ND ND
Total Cl3 BIPH 0.037;t0.032 0.O38;t0.018 0.15;t0.085
Total Cl4 BIPH 0.72;tl.l 0.2l;t0.26 3.l;tl.7
Total CIS BIPH 0.43;t0.37 ND 4.3;tl.6
Total Cl6 BIPH 1.3;t2.l 0.05;t0.OO 5.6;tl.8
Total Cl7 BIPH 0.37;t0.62 ND 3.6;tl.4
Total Cl8 BIPH 0.089;t0.14 ND 1.6;t0.75
Total CI9 BIPH ND ND 0.25;t0.16
Total ClIO BIPH ND ND O.ll;tO.lO
Total PCBs 2.9;t4.4 ND l8.8;t7.l5
Dieldrin 0.047;t0.051 ND 0.42;t0.086
Toxaphene ND ND ND
Endrin ND ND ND
Mirex ND ND 0.078;t0.04l
Weight (g) 52.1 ;t4.7 l26.0;t4.2 96.4;t9.0
% Moisture 68.3;t0.4 67.0;t0.5 74.8;tl.7
% Lipid l2.8;tl.9 l2.9;t0.5 6.0;t2.2
IJ Samples were not corrected for moisture loss.2J Mean;t s.d.
22
I
I!
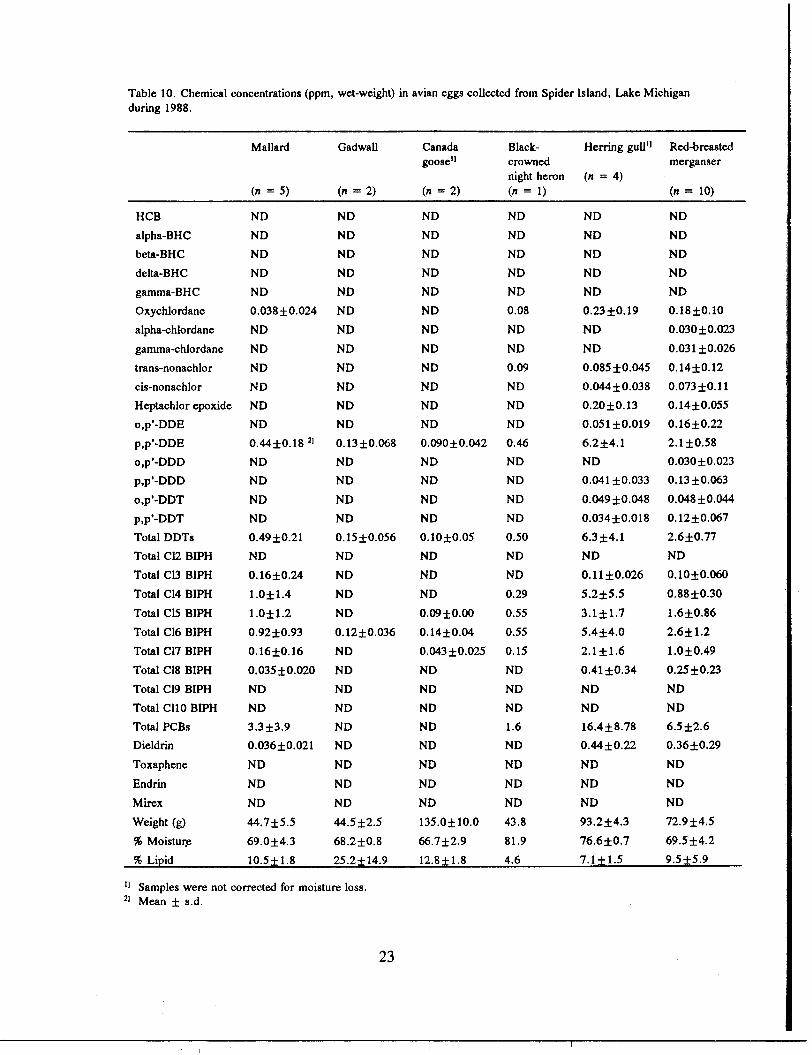
Table 10. Chemical concentrations (ppm, wet-weight) in avian eggs collected from Spider Island, Lake Michiganduring 1988.
Mallard Gadwall Canada Black- Herring gull!) Red-breastedgoosel) crowned merganser
night heron (n = 4)(n = 5) (n = 2) (n = 2) (n = 1) (n = 10)
HCB NO NO NO NO NO NO
alpha-BHC NO NO NO NO ND NO
beta-BHC NO NO NO NO NO NO
delta-BHC NO NO NO NO NO NO
gamma-BHC NO NO NO NO NO NO
Oxychlordane 0.038tO.024 NO NO 0.08 0.23:f:0.19 0.18:f:0.10
alpha-chlordane NO NO NO NO NO 0.030tO.023
gamma-chlordane NO NO NO NO NO 0.031 to.026
trans-nonachlor NO NO NO 0.09 0.085:f:0.045 0.14:f:0.12
cis-nonachlor NO NO NO NO 0.044:f:0.038 0.073:f:0.11
Heptachlor epoxide NO NO NO NO 0.20:f:0.13 0.14:f:0.055
o,p'-OOE NO NO NO NO 0.051 to.019 0.16tO.22
p,p'-OOE 0.44:f:0.182J 0.13:f:0.068 0.090:f:0.042 0.46 6.2:f:4.1 2.1:f:0.58
o,p'-OOO NO NO NO NO NO 0.030tO.023
p,p'-OOO NO NO NO NO 0.041:f:0.033 0.13:f:0.063
o,p'-OOT NO NO NO NO 0.049tO.048 0.048:f:0.044
p,p'-OOT NO NO NO NO 0.034:f:0.018 0.12:f:0.067
Total DOTs 0.49:f:0.21 0.15:f:0.056 0.10:f:0.05 0.50 6.3:f:4.1 2.6:f:0.77
Total Cl2 DIPH NO NO NO NO NO NO
Total C13 DIPH 0.16:f:0.24 NO NO NO 0.11:f:0.026 0.10:f:0.O6O
Total Cl4 DIPH 1.0:f:1.4 NO NO 0.29 5.2:f:5.5 0.88:f:0.30Total CIS DIPH 1.0:f:1.2 NO O.09:f:O.OO 0.55 3.1:f:1.7 1.6:f:0.86
Total Cl6 DIPH 0.92:f:0.93 0.12:f:0.036 0.14:f:0.04 0.55 5.4t4.0 2.6:f:1.2
Total Cl7 DIPH 0.16:f:0.16 NO 0.043:f:0.025 0.15 2.1:f:1.6 1.0:f:0.49
Total Cl8 DIPH 0.035:f:0.020 NO NO NO 0.41:f:0.34 0.25:f:0.23
Total Cl9 BIPH NO NO NO NO NO NO
Total Cl10 DIPH NO NO NO NO NO NO
Total PCBs 3.3t3.9 NO NO 1.6 16.4:f:8.78 6.5:f:2.6
Oieldrin 0.036:f:0.021 NO NO NO 0.44:f:0.22 0.36:f:0.29
Toxaphene NO NO NO NO NO NO
Endrin NO NO NO NO NO NO
Mirex NO NO NO NO NO NO
Weight (g) 44.7t5.5 44.5t2.5 135.0:f:10.0 43.8 93.2:f:4.3 72.9:f:4.5
% MoistuJ:e 69.0:f:4.3 68.2:f:0.8 66.7:f:2.9 81.9 76.6:f:0.7 69.5:f:4.2
% Lipid 10.5t1.8 25.2t14.9 12.8t1.8 4.6 7.1:f:1.5 9.5:f:5.9
IJ Samples were not corrected for moisture loss.2J Meant s.d.
23
I!

~Table 11. Chemical concentrations (ppm,wet-weight) in avian eggs collected fromGravel Island, Lake Michigan during 1988.
Herring gull I)(n = 5)
HCB 0.0941:0.0392)
alpha-BHC ND
beta-BHC 0.0301:0.011
delta-BHC 0.0321:0.016
gamma-BHC ND
Oxychlordane 0.691:0.61
alpha-chlordane 0.0511:0.045
gamma-chlordane 0.0701:0.064
trans-nonachlor 0.241:0.19
cis-nonachlor 0.171:0.13
Heptachlor epoxide 0.551:0.47
o,p'-DDE ND
p,p'-DDE 5.01:1.7
o,p'-DDD 0.131:0.049
p,p'-DDD 0.191:0.13
o,p'-DDT 0.131:0.15
p,p'-DDT 0.181:0.11
Total DDTs 5.71:1.7
Total Cl2 BIPH ND
Total CI3 BIPH 0.361:0.42
Total Cl4 BIPH 5.11:4.4
Total CIS BIPH 8.01:6.3
Total Cl6 BIPH 9.41:6.4
Total Cl7 BIPH 4.61:1.3
Total Cl8 BIPH 1.71:0.23
Total Cl9 BIPH 0.281:0.067
Total ClIO BIPH 0.0901:0.032
Total PCBs 29.51:18.6
Dieldrin 0.881:0.70
Toxaphene ND
Endrin ND
Mirex 0.0711:0.035
Weight (g) 104.21:6.9
% Moisture 76.01:1.1
% Lipid 6.71:1.2
IJ Samples were not corrected for moisture loss.2J Mean 1: s.d.
24
I, '

Table 12. Chemical concentrations (ppm, wet-weight) in biota collected from PilotIsland, Lake Michigan during 1988.
Mallard egg Red-breasted Garter snakemerganser egg carcass
(n = 1) (n = 8) (n = 2)
HCD ND ND ND
alpha-DHC ND ND ND
beta-DHC ND ND ND
delta-DHC ND ND ND
gamma-DHC ND ND NDOxychlordane ND 0.32::1:0.19 I) ND
alpha-chlordane ND 0.026::1:0.0082 ND
gamma-chlordane ND ND ND
trans-nonachlor ND 0.28::1:0.16 ND
cis-nonachlor ND 0.098 ::1:0.069 ND
Heptachlor epoxide ND 0.30::1:0.23 ND
o,p'-DDE ND 0.040::1:0.048 ND
p,p'-DDE 0.34 3.5::1:1.4 0.14::1:0.0071
o,p'-DDD ND ND ND
p,p'-DDD ND 0.21 ::1:0.092 ND
o,p'-DDT ND 0.031::1:0.022 ND
p,p'-DDT ND 0.11::1:0.12 ND
Total DDTs 0.35 3.8::1:1.5 0.15::1:0.014
Total C12 DIPH ND ND ND
Total Cl3 DIPH ND 0.17::1:0.083 ND
Total Cl4 DIPH 0.13 1.7::1:1.0 ND
Total Cl5 DIPH 0.20 2.7::1:1.7 0.038::1:0.018
Total Cl6 DIPH 0.22 5.0::1:3.1 0.080::1:0.014Total Cl7 DIPH 0.05 1.5::1:0.75 ND
Total CI8 DIPH ND 0.30::1:0.17 ND
Total CI9 DIPH ND 0.083::1:0.16 ND
Total ClIO BIPH ND ND ND
Total PCBs 0.60 11.5::1:6.28 ND
Dieldrin ND 0.59::1:0.54 ND
Toxaphene ND ND ND
Endrin ND ND ND
Mirex ND 0.026::1:0.0086 ND
Weight (g) 49.1 68.7::1:2.8 77.5::1:12.0
% Moisture 65.5 66.1::1:1.0 68.4::1:1.7
% Lipid 13.1 13.8::1:4.2 8.4::1:0.2
I) Mean ::I: s.d.
25
I! '

ITable 13. Chemical concentrations (ppm, wet-weight) in avian eggs collected from Hog Island, LakeMichigan during 1988.
Mallard I) Canada Double- Herring gull2J Red-breastedgoose 2J crested merganser
cormorant (n = 5)(n = 15) (n = 1) (n = 2) (n = 7)
HCB ND ND ND ND 0.030:f:0.019
alpha-BHC ND ND ND ND ND
beta-BHC ND ND 0.063:f:0.025 ND 0.054:f:0.059
delta-BHC ND ND 0.043:f:0.028 ND 0.030:f:0.018
gamma-BHC ND ND ND ND ND
Oxychlordane ND ND 0.096:f:0.072 0.036:f:0.025 0.32:f:0.37
alpha-chlordane ND ND 0.039:f:0.023 ND 0.089:f:0.18
gamma-chlordane ND 0.05 0.034:f:0.017 ND 0.026:f:0.0089
trans-nonachlor 0.026:f:0.013 ND 0.043:f:0.030 0.046:f:0.047 0.20:f:0.28
cis-nonachlor ND ND 0.043:f:0.030 ND 0.12:f:0.11
Heptachlor epoxide ND ND 0.11 :f:0.021 ND 0.33 :f:0.30
o,p'-DDE ND ND ND ND 0.095:f:0.19
p,p'-DDE 0.27:f:0.183] ND 3.3:f:2.3 0.52:f:0.23 4.0:f:4.5
o,p'-DDD ND ND 0.071:f:0.068 ND 0.040:f:0.030
p,p'-DDD ND ND 0.14:f:0.ll ND 0.26:f:0.22
o,p'-DDT ND ND 0.11:f:0.018 ND 0.051:f:0.039
p,p'-DDT ND ND 0.10:f:0.011 ND 0.28:f:0.36
Total DDTs 0.30:f:0.19 0.07 3.8:f:2.4 0.54:f:0.23 4.7:f:4.9
Total Cl2 BIPH ND ND ND ND ND
Total CI3 BIPH ND 1.4 0.20:f:0.029 ND 0.21 :f:0.19
Total CI4 BIPH 0.072:f:0.063 0.45 1.4:f:0.98 0.50:f:0.50 2.2:f:1.7
Total C15 BIPH 0.18:f:0.22 0.23 1.7:f:0.00 0.37:f:0.24 3.9:f:5.1
Total CI6 BIPH 0.18:f:0.11 0.06 3.3:f:0.40 0.47:f:0.29 3.9:f:2.3
Total CI7 BIPH 0.041:f:0.025 0.05 1.8:f:0.44 0.15:f:0.12 1.6:f:1.2
Total CI8 BIPH ND ND 0.88:f:0.22 0.049:f:0.033 0.31 :f:0.21
Total CI9 BIPH ND ND 0.12:f:0.0017 ND 0.038:f:0.019
Total ClIO BIPH ND ND 0.095:f:0.056 ND ND
Total PCBs 0.45:f:0.32 2.2 9.4:f:1.4 1.5:f:1.1 12.1:f:8.6
Dieldrin 0.052:f:0.058 0.07 0.24:f:0.11 ND 0.64:f:0.51
Toxaphene ND ND ND ND ND
Endrin ND ND ND ND ND
Mirex ND ND ND ND 0.026:f:0.0079
Weight (g) 45.2:f:7.5 n=14 100.0 45.5:f:1.0 95.8:f:9.0 71.1:f:3.7
% Moisture 66.9:f:1.5 64.0 85.0:f:1.0 75.9:f:0.7 68.8:f:5.4
% Lipid 15.3:1:5.6 15.2 4.6 7.4:f:0.5 10.9:f:5.9
IJ Two samples were not corrected for moisture loss.2) Samples were not corrected for moisture loss.3) Mean:f: s.d.
- 26
.-"""-,.""".C""""","",""""...""*,,,,, "'ii, ;, ;,." "'"U"'""""~~"" a4"A"'" ~.",-~,-;i;J;; "..., "

Table 14. Chemical concentrations (ppm, wet-weight)in connorant eggs collected from Fish Island, LakeMichigan during 1988.
Double-crestedconnorant I)(n = 5)
HCB ND
alpha-BHC ND
beta-BHC ND
delta-BHC ND
gamma-BHC ND
Oxychlordane 0.11:i:0.0812)
alpha-chlordane ND
gamma-chlordane ND
trans-nonachlor O.049:i:0.032
cis-nonachlor 0.062:i:O.O84
Heptachlor epoxide 0.085 :i:0.056
o,p'-DDE ND
p,p'-DDE 2.7:i:l.9
o,p'-DDD ND
p,p'-DDD 0.045 :i:0.O29
o,p'-DDT O.034:i:O.022
p,p'-DDT 0.041 :i:0.026
Total DDTs 2.8:i:2.0
Total C12 BIPH ND
Total Cl3 BIPH 0.068:i:0.054
Total CI4 BIPH 1.8:i:l.5
Total CIS BIPH 1.9:i:0.68
Total CI6 BIPH 3.6:i:2.1
Total Cl7 BIPH 1.4:i:l.0
Total Cl8 BIPH 0.31:i:0.23
Total CI9 BIPH ND
Total ClIO BIPH ND
Total PCBs 9.0:i:5.4
Dieldrin 0.30:i:0.26
Toxaphene ND
Endrin ND
Mire-x 0.O30:i:0.OI4
Weight (g) 47.5:i:5.7. % Moisture 87.4:i:4.0
% Lipid 3.8:i:0.7
IJ One sample was not corrected moisture loss.2J Mean :i: s.d.
27
f
I, '

Table 15. Body burdens of PCBs (mg) in adult male double-crestedconnorants collected from Cat Island, Green Bay during 1988.
MAL~
Sample Pre-nesting Laying Incubating
1 81.4 136.5 139.1
2 61.8 206.1 270.6
3 118.2 160.6 109.6
4 55.7 92.4 184.4
5 73.8 144.8 175.1
6 65.4 248.4 229.9
7 178.4
8 88.2
x- - 90.4 164.8 184.8
28
j.,
~ _c,. ~~'-~~'""'~'m~",".4",.", "C""""""-"'."""""""-fi""_"""""""'C.'*,",,'."'_ACW ::

ITable 16. Chemical concentrations (ppm, wet-weight) in adult double-crested connorants collected from Cat Island, Green Bayduring 1988.
Pre-nesting Laying Incubating Laying Incubating(n = 8) (n = 6) (n = 6) (n = 4) (n = 4)
HCB 0.029:1:0.023 I) 0.018:1:0.0075 0.015:1:0.0055 0.030:1:0.020 0.023:1:0.0050
alpha-BHC 0.014:1:0.0062 0.0075:1:0.0027 0.0058:1:0.0020 0.0088:1:0.0025 0.0063:1:0.0025
beta-BHC 0.028:1:0.016 0.017:1:0.0082 0.018:1:0.0088 0.023:1:0.013 0.019:1:0.013
delta-BHC ND ND ND ND ND
gamma-BHC 0.0094:1:0.0018 0.013:1:0.014 ND 0.0075:1:0.0029 0.0063:1:0.0025
Oxychlordane 0.11:1:0.030 0.14:1:0.018 0.13:1:0.041 0.15:1:0.065 0.11:1:0.039
alpha-chlordane 0.083 :1:0.0055 0.033 :1:0.0082 0.050:1:0.022 0.035 :1:0.013 0.045 :1:0.025
gamma-chlordane ND ND ND ND ND
trans-nonachlor 0.056:1:0.036 0.027 :1:0.0082 0.040:1:0.022 0.030:1:0.014 0.048 :1:0.025
cis-nonachlor 0.10:1:0.055 0.080:1:0.033 0.095 :1:0.030 0.095 :1:0.038 0.12:1:0.063
Heptachlor 0.14:1:0.056 0.12:1:0.014 0.13:1:0.041 0.16:1:0.053 0.15:1:0.070
epoxideo,p'-DDE ND ND ND ND ND
p,p'-DDE 9.6:1:4.1 10.3:1:3.05 10.1:1:2.36 8.8:1:3.2 9.8:1:4.8
o,p'-DDD ND ND ND ND ND
p,p'-DDD 0.19:1:0.19 0.055:1:0.015 0.073:1:0.057 0.068:1:0.0096 0.063:1:0.030
o,p'-DDT ND ND ND ND ND
p,p'-DDT 0.064:1:0.050 0.018:1:0.017 0.010:1:0.010 0.010:1:0.0071 0.019:1:0.010Total DDTs 2) 9.8:1:4.3 10.4:1:3.06 10.2:1:2.40 8.9:1:3.2 9.8:1:4.8
Total PCBs 43.0:1:18.6 77.3:1:26.3 84.8:1:22.9 62.5:1:20.4 68.3:1:15.8
Dieldrin 0.37:1:0.19 0.23:1:0.050 0.26:1:0.088 0.24:1:0.10 0.36:1:0.27
Toxaphene 0.25:1:0.25 ND ND ND 0.094:1:0.14
Endrin ND 3) ND ND ND ND
Mirex 0.023:1:0.0071 0.068:1:0.059 0.057:1:0.029 0.035:1:0.017 0.028:1:0.0096
Weight (g) 2101:1:164.8 2137:1:112.0 2158:1:152.5 1895:1:77.7 1930:1:101.0
% Moisture 64.9:1:3.8 70.1:1:1.8 62.1:1:16.1 69.1:1:0.6 68.4:1:2.1
% Lipid 11.5:1:4.7 4.8:1:0.4 1.0:1:2.6 6.6:1:1.4 6.6:1:3.4
1) M~n :1: s.d.2) Total DDTs calculated from detectable DDTs only i.e. p,p'-DDE, p,p'-DDD, and p,p'-DDT.3) Endrin residues (0.03) ppm were above detection limit of 0.01 ppm in one sample.
i,
I 29
I
,! I !

Table 17. Chemical concentrations (ppm, wet-weight)in gut contents of double-crested cormorants collectedfrom Cat Island, Green Bay during 1988.
Cat Island
(n = 3)
alpha-BHC ND
beta-BHC ND
delta-BHC ND
gamma-BHC ND
Oxychlordane ND
alpha-chlordane ND
gamma-chlordane ND
trans-nonachlor 0.040:t0.026
cis-nonachlor ND
Heptachlor epoxide ND
o,p'-DDE NDp,p'-DDE 0.20:t0.045 I)
o,p'-DDD ND
p,p'-DDD 0.037:t0.020
o,p'-DDT ND
p,p'-DDT ND
Total DDTs 0.25 :to.O6O
Total CI2 BIPH ND
Total C13 BIPH 0.072:t0.041
Total Cl4 BIPH 1.8:t1.2
Total Cl5 BIPH 1.1:t0.071
Total CI6 BIPH 0.25:t0.046
Total Cl7 BIPH 0.062:t0.044
Total CI8 BIPH ND
Total Cl9 BIPH ND
Total Cl10 BIPH ND
Total PCBs 3.3:t1.3
Dieldrin 0.033:t0.014
Toxaphene ND
Endrin ND
Mirex ND
Weight (g) 329.3:t281.9
% Moisture 72.21;2.1
% Lipid 1.8:t0.3
I) Mean 1; s.d.
30
~,
, '

.[
Table 18. Chemical concentrations (ppm, wet- and lipid-weight) in carcasses and livers of adult male double-crestedconnorants colIected from Cat Island, Green Bay during 1988. I)
Wet Wei ht ht
CaJt:UI Uver Uver 10 carcua C Uver Uver 10 ca..:..I(II = 8) (II - 8) ..tio (II - 8) (II - 8) ..no
HCB 0.026:1:0.01421 0.014:1:0.0052 0.58:1:0.27 0.39.t0.15 0.34:1:0.12 0.95:1:0.35
beIa-BHC 0.023.t0.013 0.014:1:0.010 0.60:1:0.21 0.37:1:0.25 0.34.t0.24 0.99.t0.29
Oxychlonlane 0.13.t0.055 0.054.t0.023 0.44.t0.16 2.0:1:0.84 1.3.t0.48 0.69:1:0.080
atpba-chlonlane 0.048:1:0.032 0.019.t0.015 0.43.t0.18 0.75:1:0.62 0.46.t0.36 0.70.t0.21
tRDa-nonachlor 0.041:1:0.024 0.016:1:0.0092 0.44.t0.15 0.63.t0.38 0.40:1:0.21 0.68:1:0.13
cil-nonachlor 0.11:1:0.048 0.036.t0.015 0.38:1:0.18 1.6.t0.60 0.89.t0.34 0.57.t0.093
Heptachlor 0.15.t0.056 0.071.t0.025 0.50.t0.16 2.3.t0.71 1.7.t0.47 0.78.t0.063epowe
p,p'.DDE 9.4.t3.8 3.9:1:2.3 0.41.t0.15 144.6.t66.9 95.1.t52.3 0.65.t0.ll
p,p'-DDD 0.086:1:0.079 0.033.t0.037 0.37.t0.16 1.4.tl.6 0.83.t0.94 0.59.t0.17
Total PCB. 64.8.t17.1 24.7.tl0.4 0.41.t0.17 1025.t414.5 587.3.t188.9 0.64.t0.16
Dieklrin 0.37:1:0.25 0.21.t0.097 0.72:1:0.40 5.1 :1:2.3 5.1.t2.3 1.07:1:0.33
~x 0.034.t0.017 0.017.t0.Oll O.52.t0.26 0.53.t0.31 0.41.t0.27 0.78.t0.16
I) Sample included four "laying" males and four "incubating" males.2) Mean:t s.d.
31
I! I

Table 19. Chemical concentrations (ppm, lipid-weight) in carcasses andyolk/whole eggs of laying double-crested connorants collected from CatIsland, Green Bay during 1988.
Lioid Weil!ht
Carcass Yolk/Whole egg Correlation(n = 5) (n = 5) r
HCB 0.40:t0.19 I) 0.34:t0.16 0.91
alpha-BHC 0.12:t0.058 0.12:t0.043 0.86
beta-BHC 0.32:t0.23 0.17:t0.15 0.96
gamma-BHC 0.11 :to.053 0.075 :to.024 0.55
Oxychlordane 2.1 :to.67 1.6:t0.55 0.99
alpha-chlordane 0.49:t0.24 0.35:t0.13 0.19
trans-nonachlor 0.43:t0.24 0.29:t0.14 0.86
cis-nonachlor 1.3:t0.38 0.92:t0.38 0.96
Heptachlor 2.2:t0.74 1.6:t0.55 0.93
epoxide
p,p'-DDE 128:t54.5 62.8:t 16.0 0.74
p,p'-DDD 1.0:t0.ll 0.69:t0.14 0.07
p,p'-DDT 0.14:t0.063 0.41 :to.081 -0.14
Total PCBs 899:t416.7 661:t291.6 0.87
Dieldrin 3.3:tl.3 4.2:t2.1 0.62
Mirex 0.49:t0.15 0.38:t0.12 0.97
1] Mean:t s.d.
32
I, '

Table 20. Chemical concentrations (ppm, wet-weight) in double-crested comlorants eggs collected from individualnests on Spider Island, Lake Michigan during 1988.
Clutch I Chrtcb 2 Clutch 3 Clutch 4 Clutch 5 Clutch 6 Clutch 7 Clutch 8(n = 5) (n = 3) (n = 3) (n - 4) (n - 4) (n = 4) (n = 4) (n - 4) II
HCD 0.02:10.0021 0.01:10.00 0.01:10.00 0.02:10.01 0.01:10.00 0.02:10.00 0.01:10.00 0.01:10.00
aipba-BHC ND ND ND ND ND ND ND ND
~-BHC ND ND ND ND ND ND ND ND
ddb-BHC ND ND ND ND ND ND ND ND
IUMU-BHC ND ND ND ND ND ND ND ND
Oxychlordane 0.12:10.03 0.09:10.01 0.08:10.01 0.10:10.00 0.06:10.01 0.08:10.01 0.05:10.02 0.04:10.00
aipba- 0.02:10.01 0.02:10.00 0.02:10.01 0.03:10.00 0.01:10.00 0.03:10.01 0.03:10.01 0.01:10.00chlordane
gUMU- ND ND ND ND ND ND ND NDchlordane
~- 0.02:10.01 0.02:10.00 0.02:10.01 0.03:10.00 0.01:10.00 0.03:10.00 0.03:10.01 0.02:10.01nonacblor
cis-nonachlor 0.06:10.02 0.09:10.01 0.04:10.01 0.10:10.00 0.04:10.01 0.08:10.01 0.05:10.02 0.04:10.01
Heptacblor 0.11:10.03 0.12:10.01 0.07:10.01 0.13:10.00 0.06:10.01 0.11:10.02 0.07:10.02 0.05:10.01epox;de
o,p'.DDE ND ND ND ND ND ND ND ND
p,p'-DDE 3.44:10.59 3.82:10.17 2.40:10.20 5.21:10.07 1.95:10.26 3.73:10.39 2.35:10.37 1.00:10.12
o,p'-DDD ND ND ND ND ND ND ND ND
p,p'-DDD 0.03:10.01 0.02:10.00 0.03:10.01 0.04:10.00 0.02:10.00 0.04:10.00 0.04:10.01 0.02:10.00
o,p'-DDT ND ND ND ND ND ND ND ND
p,p'-DDT 0.05:10.02 0.02:10.01 0.04:10.01 0.04:10.00 0.03:10.01 0.04:10.01 0.04:10.02 0.02:10.01
ToCal DDT. 51 3.52:10.61 3.86:11.80 2.47:10.22 5.29:10.07 1.99:10.26 3.80:10.39 2.43:10.40 1.04:10.12
ToCal PCBa 20.6:16.7 17.7:11.9 10.2:11.0 33.3:10.9 14.4:12.0 14.4:1:2.6 6.5:12.1 4.0:10.4
Dicklrin 0.24:10.07 0.41:10.05 0.18:10.03 0.42:10.01 0.17:10.02 0.47:10.06 0.27:10.10 0.12:10.02
Toxaphene 0.65:10.26 0.27:10.15 0.31:10.11 0.62:10.10 0.20:10.09 0.41:10.10 0.28:10.17 0.06:10.08
Emrin ND ND ND ND ND ND ND ND
Mmx 0.02:10.00 0.02:10.00 0.02:10.00 0.03:10.02 0.01:10.00 0.09:10.01 0.02:10.01 0.01:10.00
Weight:11 37.6:12.1 38.6:10.3 45.4:10.6 39.8:12.2 42.6:10.8 42.2:10.8 38.6:11.5 37.1:11.2
% Moiature 83.7:11.0 83.8:10.6 84.3:10.6 83.4:10.5 84.9:11.0 84.4:11.3 83.6:11.2 83.5:10.0
% Lipid 4.9:10.9 4.8:10.8 3.8:10.7 4.6:10.3 3.6:10.5 5.1:10.2 4.0:10.5 5.1:10.5
1] One sample in clutch 8 was not corrected for moisture loss.2] Mean::l: s.d.3] Total DDTs calculated from detectable DDTs only (p,p'-DDE, p,p'-DDD, and p,p'-DDT).
33
I! '
J'
Table 21. Estimated variance components for 8 wholeclutches of cormorant eggs.
~ variation
Between I WithinChemical clutches I clutches
HCB 29.2 70.8
Oxychlordane 74.4 25.6
alpha-chlordane 41.9 58.1
trans-nonachlor 44.6 55.3
cis-nonachlor 78.8 21.2
Heptachlor epoxide 77.7 22.3
p,p'-DDE 93.7 6.3
p,p'-DDD 65.3 34.7
p,p'-DDT 29.4 70.6
Total DDTs 93.4 6.6
Total PCB 89.0 11.0
Dieldrin 84.1 15.9
Toxaphene 62.7 37.3
Mirex 88.9 11.1
34
I, '
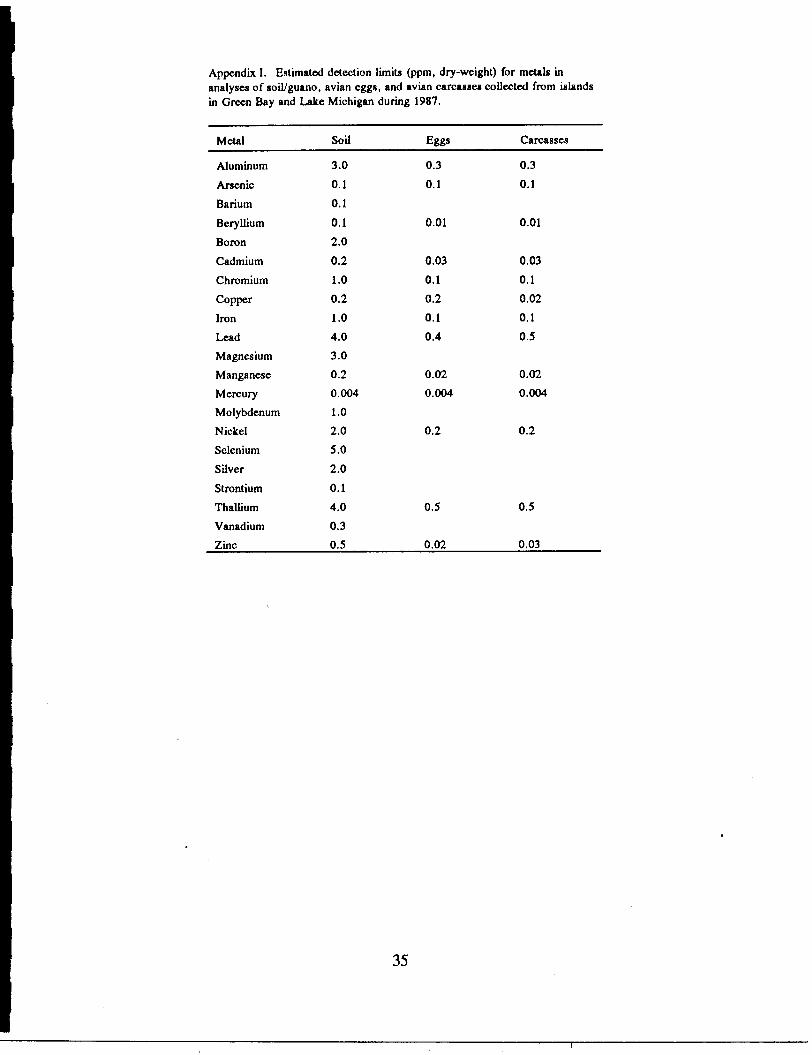
Appendix I. Estimated detection limits (ppm, dry-weight) for metals inanalyses of soil/guano, avian eggs, and avian carcassel collected from islandsin Green Bay and Lake Michigan during 1987.
Metal Soil Eggs Carcasses
Aluminum 3.0 0.3 0.3
Arsenic 0.1 0.1 0.1
Barium 0.1
Beryllium 0.1 0.01 0.01
Boron 2.0
Cadmium 0.2 0.03 0.03
Chromium 1.0 0.1 0.1
Copper 0.2 0.2 0.02
Iron 1.0 0.1 0.1
Lead 4.0 0.4 0.5
Magnesium 3.0
Manganese 0.2 0.02 0.02
Mercury 0.004 0.004 0.004
Molybdenum 1.0
Nickel 2.0 0.2 0.2
Selenium 5.0
Silver 2.0
Strontium 0.1
Thallium 4.0 0.5 0.5
Vanadium 0.3
Zinc 0.5 0.02 0.03
35
! ! I