Tapping the Potential of ommercial Prosumers -...
101
Tapping the Potential of Commercial Prosumers DRIVERS AND POLICY OPTIONS (RE-COM-PROSUMERS) March 2016
Transcript of Tapping the Potential of ommercial Prosumers -...
Tapping the Potential of Commercial Prosumers
D R I V E R S A N D P O L I C Y O P T I O N S ( R E - C O M - P R O S U M E R S )
March 2016
A B O U T I E A - R E T D
The International Energy Agency’s Implementing Agreement for Renewable Energy Technology
Deployment (IEA-RETD) provides a platform for enhancing international cooperation on policies,
measures and market instruments to accelerate the global deployment of renewable energy
technologies.
IEA-RETD aims to empower policy makers and energy market actors to make informed decisions by: (1)
providing innovative policy options; (2) disseminating best practices related to policy measures and
market instruments to increase deployment of renewable energy, and (3) increasing awareness of the
short-, medium- and long-term impacts of renewable energy action and inaction.
For further information please visit: http://iea-retd.org or contact [email protected].
Twitter: @IEA_RETD
IEA-RETD is part of the IEA Energy Technology Network.
D I S C L A I M E R
The IEA-RETD, formally known as the Implementing Agreement for Renewable Energy Technology
Deployment, functions within a Framework created by the International Energy Agency (IEA). Views,
findings and publications of IEA-RETD do not necessarily represent the views or policies of the IEA
Secretariat or of its individual Member Countries.
C O P Y R I G H T
This publication should be cited as:
IEA-RETD (2016), Commercial Prosumers – Development and Policy Options (RE-COM-PROSUMERS),
[Wilson Rickerson, Jeremy Koo, Jon Crowe (Meister Consultants Group – MCG), Toby Couture (E3
Analytics)], IEA Implementing Agreement for Renewable Energy Technology Deployment (IEA-RETD),
Utrecht, 2016.
Copyright © IEA-RETD 2016
(Stichting Foundation Renewable Energy Technology Deployment)
A C K N O W L E D G E M E N T S
The Authors would also like to thank many individuals for providing interviews and/or review over the
project:
Otto Bernsen NL Agency
Lisa Dignard Natural Resources Canada
David de Jager Operating Agent, IEA-RETD
Georgina Grenon Ministère de l'Écologie, du Développement durable et de l'Énergie, France (PSG Chair)
Gaëtan Masson IEA Photovoltaic Power Systems Programme (IEA PVPS)
Simon Müller International Energy Agency (IEA)
Michael Paunescu Natural Resources Canada
Kristian Petrick Operating Agent Team, IEA-RETD
Cédric Philibert International Energy Agency (IEA)
Andy Belden Massachusetts Clean Energy Center
L E A D A U T H O R S
Wilson Rickerson, Jeremy Koo, Jon Crowe (Meister Consultants Group – MCG); Toby Couture (E3
Analytics)
C O N T R I B U T I N G A U T H O R S
David Jacobs (IET – International Energy Transition GmbH), and Galen Barbose (Lawrence Berkeley
National Laboratory).1
The Authors would also like to thank many individuals for providing interviews and/or review over the
course of the project, including: M. Thaer Alsafar (ADEME), Emanuele Bianco (IEA) Mark Bost (IÖW),
Dick Cave (DECC), Mark Gasper (IKEA), Christian Grunder (Eclareon), Otmane Hajji (Groupe Green
Yellow), Karl Hauptmeier (IEA), Paul Kaaijk (ADEME), hMarkus Lohr (Denkzentrale Energie GmbH), David
Marchal (ADEME), Alain Mestdagh (ADEME), Marcus Meyer (BSW), and Karl-Heinz Remmers
(Solarpraxis). The authors would also like to thank Eskedar Gessesse for her review, insights, and
editorial support.
1 Participation by Lawrence Berkeley National Laboratory was funded by the Office of Energy Efficiency and Renewable Energy
(Solar Energy Technologies Office) of the U.S. Department of Energy under Contract No. DE-AC02-05CH11231
Commercial Prosumers – Development and Policy Options (RE-COM-PROSUMERS), January 2016
TA B L E O F CO N T E N TS
Executive Summary ....................................................................................................................... 1
1 Introduction ........................................................................................................................... 5
1.1. The Global PV Market ..................................................................................................... 6
1.2. Scoping Commercial Prosumers ...................................................................................... 8
1.3. Report Structure ........................................................................................................... 11
1.4. Overview of the Prosumers Framework ....................................................................... 11
1.4.1. Drivers .................................................................................................................... 11
1.4.2. Prosumer Policy Development .............................................................................. 15
2 Drivers for commercial prosumers ....................................................................................... 18
2.1. Economic Drivers........................................................................................................... 19
2.1.1. PV System Costs .................................................................................................... 20
2.1.2. Electricity Prices and Rate Structure ..................................................................... 20
2.1.3. Onside Demand and Self-use ................................................................................ 21
2.2. Technology Drivers ....................................................................................................... 22
2.3. National Conditions ...................................................................................................... 23
2.4. Behavioural Drivers ...................................................................................................... 25
2.4.1. Executive Leadership ............................................................................................. 28
2.4.2. Human Resources .................................................................................................. 29
2.4.3. Financial Resources ................................................................................................ 30
2.4.4. Projects & Performance Monitoring ...................................................................... 31
2.4.5. Public Relations ...................................................................................................... 32
2.4.6. Best Practices for Addressing Organizational and Behavioural Drivers ................. 32
2.5. Stakeholder Considerations ......................................................................................... 33
2.5.1. Prosumers and Electricity Infrastructure Owners .................................................. 33
2.6. Comparing Commercial and Residential Prosumer Drivers .......................................... 36
3 national case studies ............................................................................................................ 38
3.1. Case Study Structure ..................................................................................................... 38
3.2. Case study Methodology .............................................................................................. 39
3.3. France ............................................................................................................................ 43
3.4. Germany ........................................................................................................................ 52
3.5. United Kingdom ............................................................................................................ 60
3.6. United States: Massachusetts ....................................................................................... 67
4 Conclusions and next steps .................................................................................................. 78
4.1. Conclusions ................................................................................................................... 78
4.2. Next steps and Policy OPTIONS ..................................................................................... 79
Appendix A – Commercial Building Types and Load Profiles ....................................................... 83
Appendix B – Additional Commercial Building Analysis .............................................................. 85
Commercial Prosumers – Development and Policy Options (RE-COM-PROSUMERS), March 2016
Page 1
E X EC U T I V E S U M M A RY
The rise of solar photovoltaic (PV) “prosumers”2 has the potential to transform the centralized electric
utility model and accelerate the transition to a more decentralized and interactive electricity system.
The prospect of radical change in the electricity sector has generated significant interest among
policymakers and regulators about different strategies for engaging and managing the rise of PV
prosumers in the commercial sector, and about the implications that their rise could have for citizens,
industry, as well as the utility sector as a whole.
In 2014, the IEA-RETD RE-PROSUMERS study explored the global outlook for residential prosumers (IEA-
RETD, 2014). The study concluded that, without proactive policy support, a residential prosumer
revolution was not imminent, though policymakers should nevertheless analyse the market potential
and be prepared to adapt. This new IEA-RETD report builds on RE-PROSUMERS, and shifts the analysis
to focus on commercial prosumers and analysing the various economic, behavioural, and technological
drivers as well as national conditions that are either supporting or constraining the growth of prosumers
in the commercial building sector.3
While continually declining PV costs have driven sustained growth in the global PV market, commercial
prosumers have been slow to emerge. Similar to the residential sector, this study finds that in the
absence of supportive policies and regulations, a commercial prosumer “revolution”, where dynamic
growth occurs on a market-driven or unsubsidized way, is not yet underway.
Certain economic drivers improve the attractiveness of a PV investment for commercial prosumers
versus residential (e.g. lower PV system installed costs, higher self-use ratio), but these drivers are offset
by others (e.g. lower electricity rates and higher expectations for return on investment). Even when
favourable economic conditions are met, commercial entities encounter significant barriers related to
complex internal decision-making processes and other behavioural barriers (e.g., imperfect access to
information on technology, high levels of risk aversion regarding future changes in energy prices, and
limited strategic importance placed on energy management by executives and others).
These drivers notwithstanding, a combination of favourable market changes such as continued declines
in PV installed costs, a sustained rise in commercial electricity tariffs, or the emergence of new business
models (e.g. aggregators or third-party finance models) could rapidly transform the commercial
prosumer sector and push it into a state of self-sustaining growth. Policy makers, regulators, and
affected utilities therefore need to develop strategies to better anticipate, integrate, and plan for a
growing number of commercial prosumers.
2 The term prosumers is used to refer to energy consumers who also produce their own power with onsite generation of some
form (e.g., solar PV systems, diesel generators, combined heat-and-power systems, or wind turbines). For the purposes of this
report, it is assumed that they remain connected and consume electricity from the grid during the times they are not
producing. The business case for prosumers is, in most cases, at least partially built on the reduced electricity purchase
expenditures due to self-generation. 3 For the purpose of this report, the commercial sector includes services but excludes heavy industry. The report focuses on
commercial prosumers specifically in developed countries (i.e. countries with high electrification rates and reliable electricity
supply, rather than countries in which PV systems are deployed primarily to provide energy access).
Commercial Prosumers – Development and Policy Options (RE-COM-PROSUMERS), March 2016
Page 2
For utilities and/or grid operators, this could have a number of direct and indirect effects onto their
traditional business models: it could translate into lower revenues while simultaneously triggering a
need for additional infrastructure investments (such as substations, and improved network intelligence
or smart grid infrastructure); but it could also provide new opportunities for investments in distributed
generation capacity or deferral of infrastructure upgrades. For policy makers, it may require developing
new market structures for excess generation, as well as new regulations governing grid access and
network charges. This report explores these and other effects and attempts to provide an overview of
some of the specific measures that policy makers can take to encourage or simply better govern the
sector. It also shows where other stakeholders like utilities, grid operators, regulators and the
commercial sector itself have to stay alert and get prepared for future developments.
The report includes a number of case studies, including of France, Germany, the UK, and the U.S. These
case studies help illustrate the importance of country-specific drivers, and highlight how these various
drivers influence the business case for becoming a commercial PV prosumer at a representative
commercial facility (either a supermarket or “big box”4 retail store) in each of the four countries.
France. While the PV market in France has been adding installed capacity at an annual rate of
between 600 MW and 1,700 MW over the last 5-6 years, commercial prosumers represent a small
part of the market due to a range of economic and policy-related factors: average French commercial
electricity rates are low (25% below the EU average); the rates offered to commercial-scale systems
for exported generation under both the feed-in tariff and the auction frameworks have historically
exceeded commercial retail rates; consequently, system economics favour exporting 100% of projects’
output to the grid rather than configuring systems for self-use. As a result, outside of a number of
pilot projects, virtually all commercial rooftop PV installations in France have been developed under
either the feed-in tariff or the auction scheme. New rules for the sector are currently being debated.
Germany. Following years of record PV growth from 2010-2012, commercial prosumers were
expected to emerge in large numbers: the levelised cost of energy (LCOE) of commercial-scale solar
projects reached socket parity with commercial electricity rates, and the feed-in tariff dropped below
the retail electricity rate. However, in 2014, a major surcharge was applied to PV electricity consumed
onsite, impacting the economics of commercial PV systems and delaying the emergence of
commercial prosumers. New PV installations have declined, particularly in the commercial sector, and
future prospects for commercial prosumers are unclear.
United Kingdom. The UK led the European solar market for the first time in 2014, but the vast
majority of this growth was in residential or large ground-mounted systems. Commercial PV adoption
has been constrained by a number of factors, including a high share of leased commercial space, short
average lease duration, and insufficient project economics. Though policymakers have announced
some steps towards supporting growth in the commercial rooftop market specifically, future prospects
for commercial prosumers are unclear, especially with uncertainty around continuing government
support for solar energy more broadly.
4 ‘Big Box’ store is a retail store that occupies a large amount of floor space and has a wide variety of items for sale.
Commercial Prosumers – Development and Policy Options (RE-COM-PROSUMERS), March 2016
Page 3
United States. While the U.S. solar market has continued to experience record growth, the
commercial PV sector has stagnated or declined, eclipsed by surging residential and utility-scale
markets. The majority of U.S. commercial solar systems are installed under third-party ownership, and
the comparative ease of obtaining such power purchase agreements have deterred many companies
from owning their own systems and becoming prosumers. With the impending reduction in the 30%
investment tax credit for solar installations, the future for commercial prosumers is unclear. While
commercial prosumers are more insulated from ongoing changes in utility payment structures and net
metering policies, electricity prices and policy frameworks for solar vary widely across the country.
Commercial prosumers may begin to emerge in select state markets, but they are unlikely to break out
broadly in the near term.
As confirmed through all four case studies, the growth of commercial prosumers has been – and
remains – slow, but opportunities exist for policy makers and for other stakeholders to lend support.
Much as in the case of residential prosumers, policy makers will need to make a number of high-level
decisions: is the overall policy objective to constrain, enable, or actively encourage the rise of
commercial prosumers? Are utilities and regulators prepared to deal with a rapid growth of commercial
prosumers? Have analyses been undertaken to model their potential spatial distribution, as well as
associated impacts on utility and grid revenue schemes, on substation over-loading (e.g. back-feeding),
or on other aspects of system operation?
In addition, many of the specific policy approaches for enabling prosumers discussed in RE-
PROSUMERS, such as developing clear legal definitions of prosumers, harmonizing grid connection
procedures, introducing rules to govern the treatment of excess generation, as well as efforts to reduce
soft costs, remain relevant for encouraging commercial prosumers. However, the size and diversity of
the commercial sector suggests that focused policy interventions targeting specific barriers to PV
adoption may be more important in the commercial than in the residential sector.
Targeted interventions from policy makers and stakeholders aimed at enabling a sustainable growth
of commercial prosumers could include:
Designing clear policies for net excess generation. The absence of clear rules governing the treatment
of excess generation poses a number of problems for commercial prosumers: it incentives commercial
prosumers to limit PV system size to minimum onsite load rather than available space and financial
capacity; it fails to address the need to export excess generation during times of low demand, such as
on Sundays or during public holidays; and it ignores the potential of commercial prosumers to help
serve electricity demand in a cost-competitive and sustainable way.
For markets where commercial retail rates are below LCOE of PV, any rate offered for excess
generation would likely need to be designed as slight premium to the commercial retail rate paid in
order to drive adoption. This is one of the main policy solutions being discussed in France.
For markets where commercial retail rates are above LCOE of PV, the rate offered for excess
generation would likely need to be below the retail rate paid, in order to avoid excess compensation
and encourage efficient use. By offering a payment for excess generation that is below the retail rate
paid, policy makers could help increase the sophistication of commercial electricity users by
encouraging them to increase their level of self-use, improve their onsite energy management by
shifting loads or by actively engaging in real-time demand response.
Regardless of which approach is adopted, developing clear polices that define how net excess
generation is remunerated (or compensated) is likely to remain an important part of commercial
prosumer strategy.

Commercial Prosumers – Development and Policy Options (RE-COM-PROSUMERS), March 2016
Page 4
Facilitating improved data on national commercial building stock. Some countries conduct detailed
surveys of the number and type of commercial buildings, as well as energy usage within those
building types. Countries should research, update and share these statistics so that policymakers can
make better informed decisions on how best to target their interventions and what the outcomes may
be.
Developing programs that specifically target commercial decision making. Policymakers, local
decision-makers and business developers can assess the institutional needs of specific commercial
entities (e.g. supermarkets, shopping malls) and craft appropriate local regulation accordingly. For
commercial buildings where onsite technical know-how is a serious human resource challenge, for
example, focused training programs or on-call PV technical assistance could be provided. For
commercial entities that may have trouble securing debt, specific financing programs such as low-
interest loan facilities can be deployed. For sectors in which public image and reputational factors play
an important role, for instance municipalities may be able to accelerate market adoption by creating
competitions, recognition campaigns, and other public-private awareness raising efforts to encourage
the growth of prosumers in the commercial sector.
Conducting broad characterizations of commercial building type according to the factors that may
influence decision making. Factors such as building ownership type, ownership strategy, lease type,
lease duration, and property management strategy, among others, can each have bearing on PV
investment decisions. Studies should be conducted by e.g. project developers or industry associations
to assess whether certain property ownership types can be broadly associated with specific building
types, and whether policy interventions can be tailored accordingly. Even if broad categorizations are
not feasible, however, research should be conducted to map different building ownership
considerations and their implications for energy decision making. This research would enable more
appropriately customized policy support for the commercial sector.
Analysing commercial diffusion patterns. The dynamics of PV adoption within both the residential
and commercial markets remain relatively opaque, although there have been some studies of PV
diffusion in recent years (U.S. DOE Sunshot Initiative 2016). In order for policymakers to target future
initiatives, research should be commissioned by e.g. energy agencies or sector associations to better
understand how PV systems have diffused within the commercial sector and why commercial entities
have adopted PV (e.g. internal priorities vs. benchmarking against peers) in order to anticipate how
development might occur in specific jurisdictions in the years ahead.
Facilitate decision making within companies through tools. Tools should be developed by e.g. project
developers or sector associations to equip commercial decision makers, project managers, and
facilities staff to assess and navigate the complexities of internal decision making related to energy.
These could include, for example, guides that describe specifically how different institutional
departments (e.g. finance, facilities management, human resources, public relations, etc.) may
influence PV investment, how they can best be engaged (including the information required for
efficient engagement), and the spectrum of practices (from standard to innovative) that are utilized by
other institutions facing similar circumstances.
In conclusion, this report finds that the significant potential of commercial PV prosumers in the
markets examined remains largely untapped. As technological and market conditions for commercial
prosumers continue to improve, policy makers – and other stakeholders – will need to think more
carefully about how best to govern their rise. This may require assessing the commercial sector as a
distinct factor in the evolution of the electricity sector, one that, despite having its own unique
barriers and challenges, could play a significant role in accelerating the transition toward a more
decentralized, interactive, and highly networked system.
Commercial Prosumers – Development and Policy Options (RE-COM-PROSUMERS), March 2016
Page 5
1 I N T RO D UC TI O N
The unprecedented global growth of solar PV is creating a new class of “prosumers” – electricity
consumers who also produce their own electricity. If prosumers continue to scale up, they could disrupt
existing electricity industry structures and business models. A key question for policymakers is whether
prosumers can be controlled or whether a prosumer transition is not only inevitable, but already
underway. This report builds on a previous IEA-RETD study about residential prosumers (RE-
PROSUMERS) (IEA-RETD, 2014). RE-PROSUMERS found that despite rapid growth in decentralized
residential PV, and sharp declines in PV installation costs, a PV prosumer revolution was not imminent at
the residential level and would likely not occur in the near-term in the absence of significant, supportive
policy and regulatory conditions.
This study extends the analysis conducted on residential prosumers to the commercial sector. The
prospect of commercial prosumers could represent a significant policy challenge (and opportunity),
particularly in countries where the commercial sector comprises a significant share of national
electricity demand. There has been some evidence of unsubsidized commercial prosumer development
in countries such as Germany, Italy, and Spain (REC, 2013; Shahan, 2014). However, there has been
limited research conducted to date on the potential for the widespread emergence of commercial
prosumers, and on the potential for prosumers within specific commercial industries. Looking at OECD
countries, on the one hand, there are reasons to believe that commercial prosumers will emerge before
residential prosumers do. Compared to residential prosumers, commercial buildings have larger and
steadier loads that can more reliably absorb PV output.
Commercial Prosumers – Development and Policy Options (RE-COM-PROSUMERS), March 2016
Page 6
Commercial systems can also capture improved economies of scale by installing larger PV systems. On
the other hand, commercial buildings may face greater challenges to PV adoption than residential
consumers: commercial retail electricity rates are generally lower than residential rates, which makes PV
less competitive; commercial building owners may also require higher financial returns from PV
investments than residential customers do. This report examines the current status of the commercial
prosumer frontier in established European and North American markets: France, Germany, the United
Kingdom (UK), and the United States of America (US). Case studies of each of these countries are
included in 3.
The sections below provide a brief snapshot of the global PV market and a discussion of how the
commercial PV industry is defined for the purposes of this report. This section also reviews the
analytical framework introduced in RE-PROSUMERS and provides an overview of the report structure.
1 . 1 . T H E G L O B A L P V M A R K E T
The major trends that framed the RE-PROSUMERS report remain in place: PV continues to grow at a
rapid pace around the world and PV costs continue to decline.
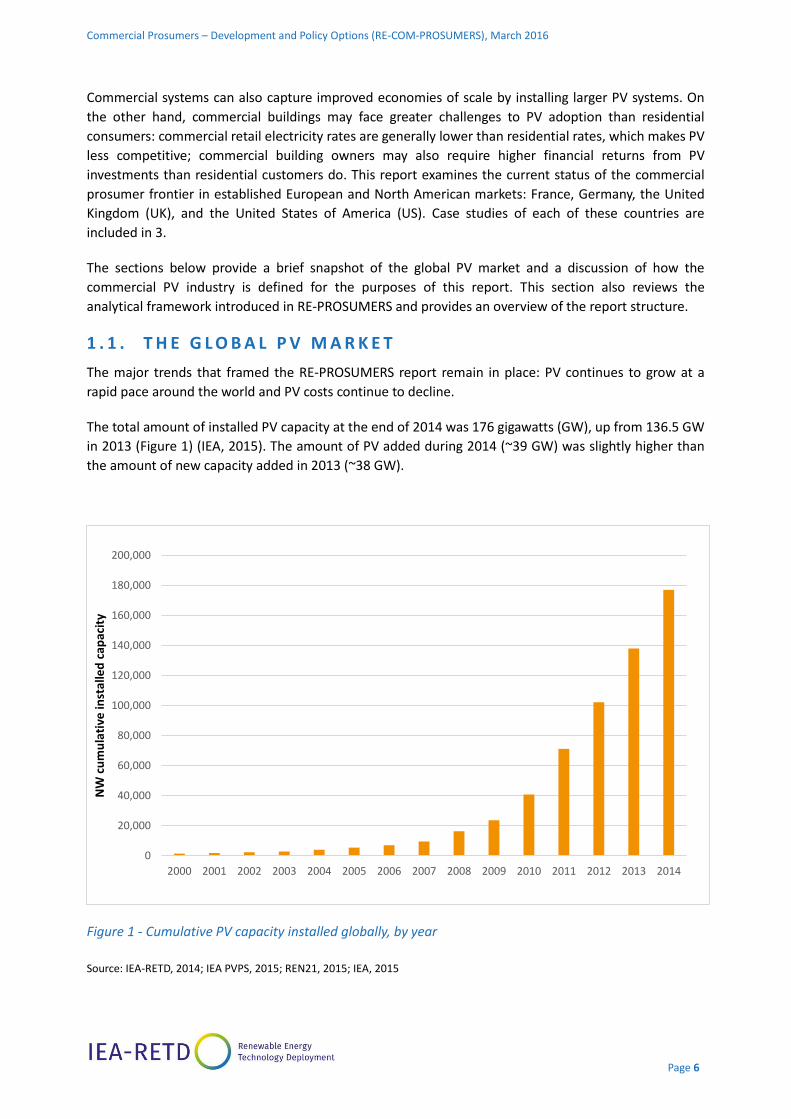
The total amount of installed PV capacity at the end of 2014 was 176 gigawatts (GW), up from 136.5 GW
in 2013 (Figure 1) (IEA, 2015). The amount of PV added during 2014 (~39 GW) was slightly higher than
the amount of new capacity added in 2013 (~38 GW).
Figure 1 - Cumulative PV capacity installed globally, by year
Source: IEA-RETD, 2014; IEA PVPS, 2015; REN21, 2015; IEA, 2015
0
20,000
40,000
60,000
80,000
100,000
120,000
140,000
160,000
180,000
200,000
2000 2001 2002 2003 2004 2005 2006 2007 2008 2009 2010 2011 2012 2013 2014
NW
cu
mu
lati
ve in
stal
led
cap
acit
y
Commercial Prosumers – Development and Policy Options (RE-COM-PROSUMERS), March 2016
Page 7
The rate of PV market expansion slowed globally in 2014, but growth was highly uneven across
countries and geographic regions (IEA, 2015; REN21, 2015).
Europe. New installations in Europe overall declined by 33% from 2013 to 2014 due to the general
tariff cuts, among other factors (Rekinger et al., 2015). Germany, the former global market leader,
installed only 1.9 GW (Section 3.4), whereas the UK became the top European market with 2.3 GW
added (Section 3.5) (IEA PVPS, 2015)
North America. PV capacity installed in North America surpassed that in Europe, with 6.5 GW installed
in the US.
Asia led the world in installations with 10.6 GW in China, 9.7 GW in Japan, and 475 megawatt (MW) in
Thailand.
In Latin America, Chile added 395 MW in 2014, and Brazil awarded contracts for 1 GW of PV capacity,
expected to be online from 2016/17 (IEA, 2015).
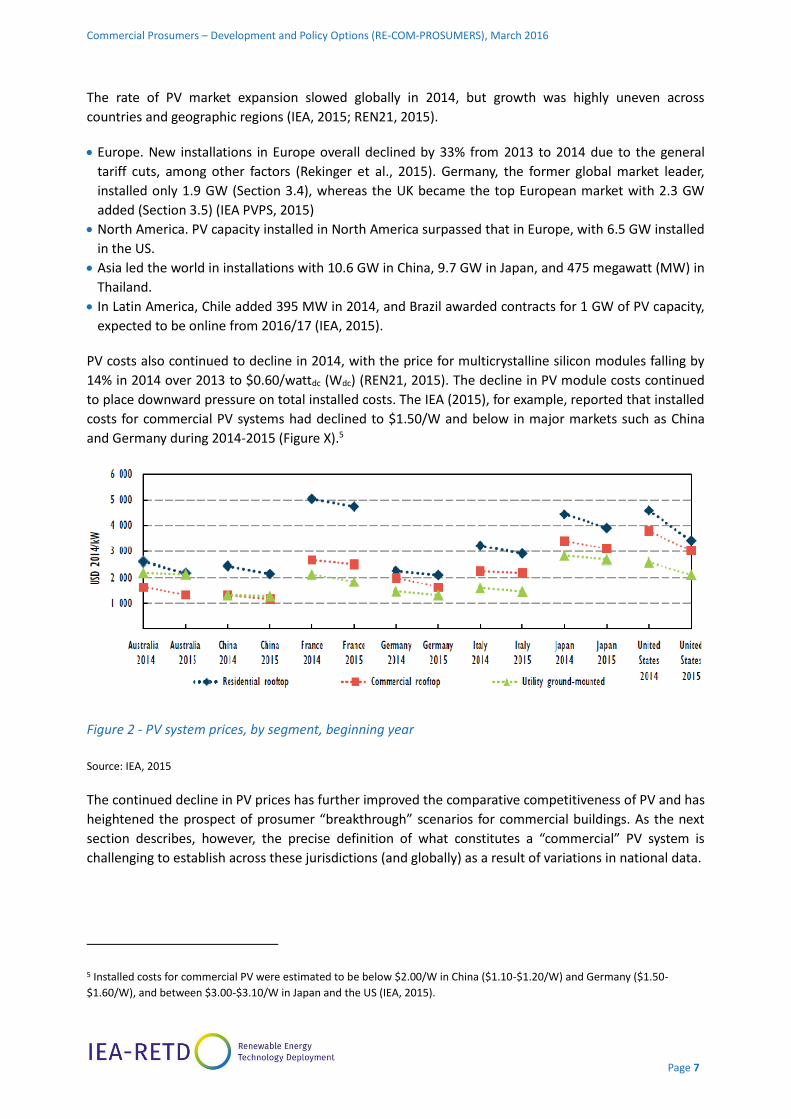
PV costs also continued to decline in 2014, with the price for multicrystalline silicon modules falling by
14% in 2014 over 2013 to $0.60/wattdc (Wdc) (REN21, 2015). The decline in PV module costs continued
to place downward pressure on total installed costs. The IEA (2015), for example, reported that installed
costs for commercial PV systems had declined to $1.50/W and below in major markets such as China
and Germany during 2014-2015 (Figure X).5
Figure 2 - PV system prices, by segment, beginning year
Source: IEA, 2015
The continued decline in PV prices has further improved the comparative competitiveness of PV and has
heightened the prospect of prosumer “breakthrough” scenarios for commercial buildings. As the next
section describes, however, the precise definition of what constitutes a “commercial” PV system is
challenging to establish across these jurisdictions (and globally) as a result of variations in national data.
5 Installed costs for commercial PV were estimated to be below $2.00/W in China ($1.10-$1.20/W) and Germany ($1.50-
$1.60/W), and between $3.00-$3.10/W in Japan and the US (IEA, 2015).
Commercial Prosumers – Development and Policy Options (RE-COM-PROSUMERS), March 2016
Page 8
1 . 2 . S C O P I N G C O M M E R C I A L P R O S U M E R S
Each country tracks PV data in different ways, which makes it difficult to draw direct comparisons. The
challenge of identifying a broadly applicable definition of commercial prosumers is compounded by the
fact that each country defines commercial buildings differently and also collects (and publishes)
commercial building energy data in different forms (Section 3.2). This section describes the
considerations that inform the scope and definition of commercial prosumers as used in this report.
System size. In Europe, PV installations are not generally tracked by building type and are instead
tracked according to the amount of capacity installed under different feed-in tariff rates. In the United
States, commercial-scale systems are tracked as “non-residential” – a category which also includes
industrial installations. For the purposes of this study, the term “commercial” is defined by capacity in
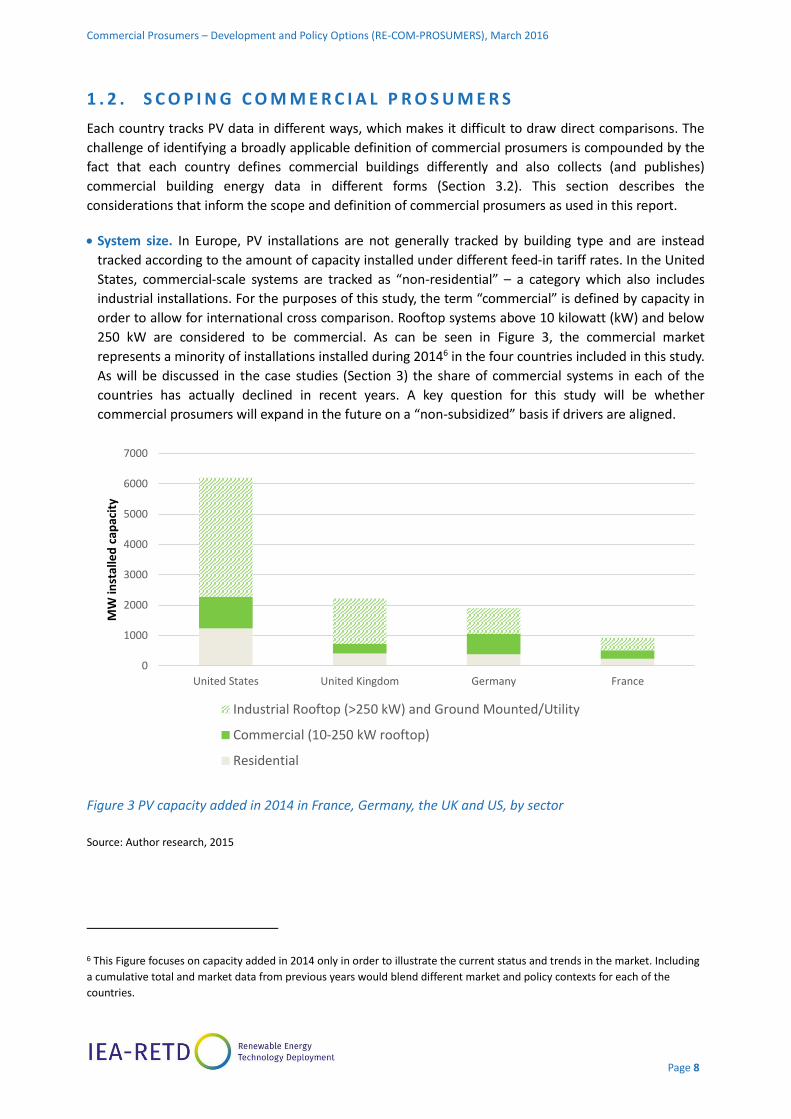
order to allow for international cross comparison. Rooftop systems above 10 kilowatt (kW) and below
250 kW are considered to be commercial. As can be seen in Figure 3, the commercial market
represents a minority of installations installed during 20146 in the four countries included in this study.
As will be discussed in the case studies (Section 3) the share of commercial systems in each of the
countries has actually declined in recent years. A key question for this study will be whether
commercial prosumers will expand in the future on a “non-subsidized” basis if drivers are aligned.
Figure 3 PV capacity added in 2014 in France, Germany, the UK and US, by sector
Source: Author research, 2015
6 This Figure focuses on capacity added in 2014 only in order to illustrate the current status and trends in the market. Including
a cumulative total and market data from previous years would blend different market and policy contexts for each of the
countries.
0
1000
2000
3000
4000
5000
6000
7000
United States United Kingdom Germany France
MW
inst
alle
d c
apac
ity
Industrial Rooftop (>250 kW) and Ground Mounted/Utility
Commercial (10-250 kW rooftop)
Residential

Commercial Prosumers – Development and Policy Options (RE-COM-PROSUMERS), March 2016
Page 9
Roof space is not one of the limiting factors behind commercial expansion. In Germany, total PV
potential across all rooftop types is conservatively7 estimated at 102 GW, of which 27 GW (26%) has
been utilized to date (BMWi, 2015b). In France, ADEME recently estimated that there is a total PV
potential across all rooftop types of roughly 120 GW, with approximately 10-15% located on commercial
buildings (ADEME 2015). In the United States, total potential rooftop PV capacity is estimated to be 661
GW for all buildings and 313 GW for non-residential buildings (Denholm & Margolis, 2008), whereas
cumulative non-residential rooftop installations only reached 5 GW at the end of 2014 (Kann et al.,
2015b).
Industrial customers. The industrial sector is not a focus of this study. Industrial self-use systems are
not yet economically viable in many OECD markets without incentives due to significantly lower retail
rates8 for the industrial sector, though some development has occurred in certain markets.9 In
Germany, industry and heavy-duty industry rates are 15% and 65% lower than commercial electricity
rates10, respectively, significantly lowering the value of PV self-use (Willborn et al., 2014); in the US,
rates are ~35% lower on average for industrial vs. commercial consumers (US EIA, 2015c).11
PV system configuration. The RE-PROSUMERS report acknowledged that prosumers could include PV
systems that are configured to supply power onsite, PV systems that are configured to export 100% of
their power to the grid, and PV systems that are configured for grid defection. This report focuses
primarily on PV systems that are configured to supply power onsite, rather than feed 100% of their
power into the grid, in order to investigate the degree to which commercial prosumers may emerge
on an “incentive free” basis.
Text Box 1 provides further detail on how onsite power production and consumption are characterized.
This report also does not focus on the potential for commercial grid defection. Commercial rooftop PV is
often insufficient to meet the electricity needs of a commercial building even during peak generation
(Section 2.1.3). It is possible that commercial buildings may defect from central grids to join stand-alone
or multi-user microgrids, but it is not anticipated that microgrids will diffuse broadly within the next
several years.12 Finally, this report focuses only on PV systems that are owned by the host site. Systems
that are owned by third parties (e.g. with electricity sold under power purchase agreement) are not
considered to meet the definition of prosumers.
7 Other technical potential studies have estimated that the total PV potential across all rooftop types is over 160 GW (Lödl et
al., 2010). 8 Throughout this report the term “retail rates” includes all imposed taxes, levies and/or surcharges that are embedded in the
rates unless otherwise noted. 9 For instance, see : http://www.sciencesetavenir.fr/nature-environnement/20151118.AFP7016/tata-steel-place-80-000-
panneaux-solaires-sur-les-toits-de-son-usine-aux-pays-bas.html
10 A large amount of this difference is attributable to the fact that industrial customers are partially or fully exempt from paying
the feed-in tariff (EEG) surcharge, which is embedded in the retail rate. 11 Industrial customers do not always pay the cheapest rates in all countries, however. In some countries, for example,
industrial customers pay higher rates in order to enable lower rates in the commercial and residential sectors through cross-
subsidy. 12 Recent studies have projected that total global microgrid capacity could grow to from between 4 and 10 GW by 2020 (Wood,
2015; Wood, 2014; Navigant, 2014). Although this would represent significant growth, this total capacity is small compared to
total projected PV capacity by 2020.
Commercial Prosumers – Development and Policy Options (RE-COM-PROSUMERS), March 2016
Page 10
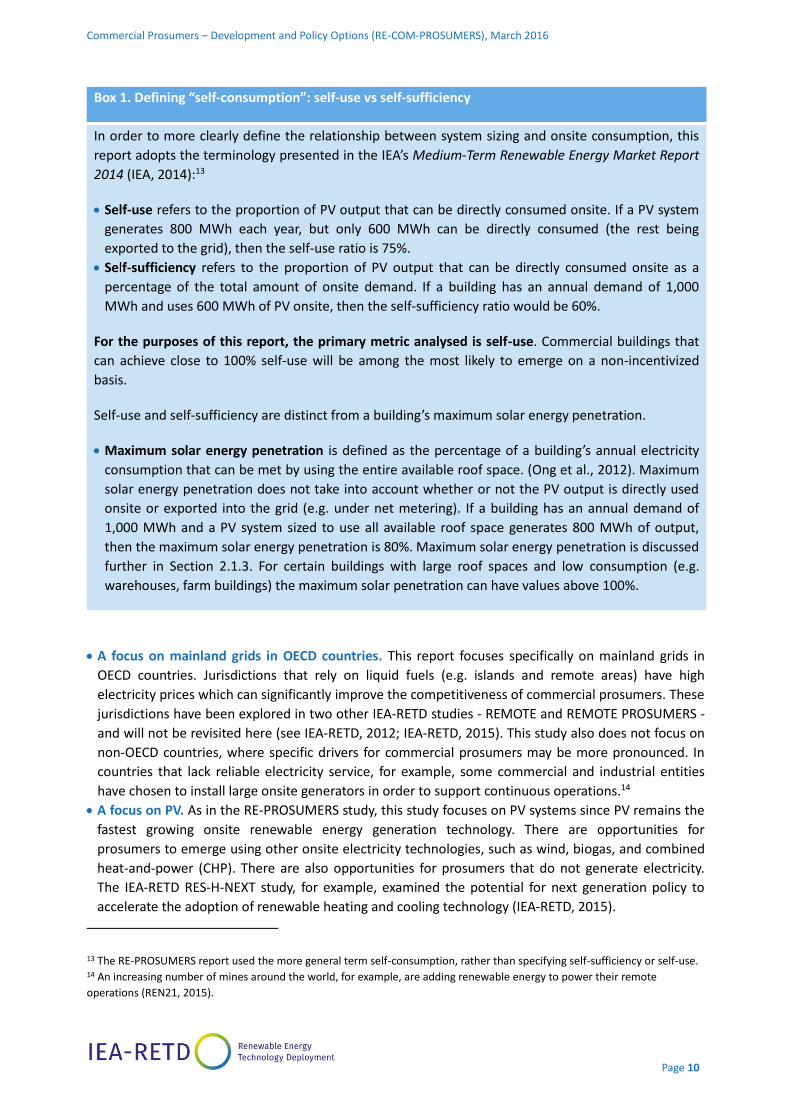
Box 1. Defining “self-consumption”: self-use vs self-sufficiency
In order to more clearly define the relationship between system sizing and onsite consumption, this
report adopts the terminology presented in the IEA’s Medium-Term Renewable Energy Market Report
2014 (IEA, 2014):13
Self-use refers to the proportion of PV output that can be directly consumed onsite. If a PV system
generates 800 MWh each year, but only 600 MWh can be directly consumed (the rest being
exported to the grid), then the self-use ratio is 75%.
Self-sufficiency refers to the proportion of PV output that can be directly consumed onsite as a
percentage of the total amount of onsite demand. If a building has an annual demand of 1,000
MWh and uses 600 MWh of PV onsite, then the self-sufficiency ratio would be 60%.
For the purposes of this report, the primary metric analysed is self-use. Commercial buildings that
can achieve close to 100% self-use will be among the most likely to emerge on a non-incentivized
basis.
Self-use and self-sufficiency are distinct from a building’s maximum solar energy penetration.
Maximum solar energy penetration is defined as the percentage of a building’s annual electricity
consumption that can be met by using the entire available roof space. (Ong et al., 2012). Maximum
solar energy penetration does not take into account whether or not the PV output is directly used
onsite or exported into the grid (e.g. under net metering). If a building has an annual demand of
1,000 MWh and a PV system sized to use all available roof space generates 800 MWh of output,
then the maximum solar energy penetration is 80%. Maximum solar energy penetration is discussed
further in Section 2.1.3. For certain buildings with large roof spaces and low consumption (e.g.
warehouses, farm buildings) the maximum solar penetration can have values above 100%.
A focus on mainland grids in OECD countries. This report focuses specifically on mainland grids in
OECD countries. Jurisdictions that rely on liquid fuels (e.g. islands and remote areas) have high
electricity prices which can significantly improve the competitiveness of commercial prosumers. These
jurisdictions have been explored in two other IEA-RETD studies - REMOTE and REMOTE PROSUMERS -
and will not be revisited here (see IEA-RETD, 2012; IEA-RETD, 2015). This study also does not focus on
non-OECD countries, where specific drivers for commercial prosumers may be more pronounced. In
countries that lack reliable electricity service, for example, some commercial and industrial entities
have chosen to install large onsite generators in order to support continuous operations.14
A focus on PV. As in the RE-PROSUMERS study, this study focuses on PV systems since PV remains the
fastest growing onsite renewable energy generation technology. There are opportunities for
prosumers to emerge using other onsite electricity technologies, such as wind, biogas, and combined
heat-and-power (CHP). There are also opportunities for prosumers that do not generate electricity.
The IEA-RETD RES-H-NEXT study, for example, examined the potential for next generation policy to
accelerate the adoption of renewable heating and cooling technology (IEA-RETD, 2015).
13 The RE-PROSUMERS report used the more general term self-consumption, rather than specifying self-sufficiency or self-use. 14 An increasing number of mines around the world, for example, are adding renewable energy to power their remote
operations (REN21, 2015).
Commercial Prosumers – Development and Policy Options (RE-COM-PROSUMERS), March 2016
Page 11
1 . 3 . R E P O R T S T R U C T U R E
This report is structured as follows:
The remainder of this Section reviews the RE-PROSUMERS framework.
Section 2 provides a high-level overview of the report’s approach to exploring commercial prosumers
and uses the RE-PROSUMERS framework to highlight where the drivers for commercial prosumers
may diverge from those for residential prosumers. Section 2 includes an in-depth discussion on the
complexities of the commercial energy investment decision making, drawing from the literature on
energy efficiency adoption.
Section 3 includes in-depth case studies of France, Germany, the UK, and the US. Each of the case
studies explores whether commercial prosumers are emerging in each country. Each case study
includes an updated overview of commercial PV development in each country, as well as a qualitative
and quantitative assessment of commercial prosumer drivers.
Section 4 draws conclusions about the status and outlook for commercial prosumers and provides
policy recommendations for decision makers to consider.
1 . 4 . O V E R V I E W O F T H E P R O S U M E R S F R A M E W O R K
This report uses the analytical framework introduced by RE-PROSUMERS to structure the discussion and
analysis of commercial prosumers. The framework consists broadly of three elements:
Drivers. The trends, drivers, and interests that shape the emergence of prosumers are complex and
vary from country to country. Economic, behavioural, and technological drivers, as well as underlying
national conditions, may each influence PV prosumers in different ways and may be aligned differently
in different jurisdictions (and from different stakeholder perspectives). Assessing these drivers is an
important first step in prosumer analysis.
Pros and cons. Once the drivers are understood, policymakers will need to weigh the opportunities
and risks of prosumer scale-up. Prosumers can help achieve national economic and environmental
objectives, but they also may create costs in the form of grid infrastructure investment and lost
revenue from incumbent market players. These pros and cons can be assessed against national
objectives.
Strategy definition. After pros and cons have been weighed, policymakers can develop forward-
looking prosumer strategies. Broadly, these strategies can be developed to constrain, enable, or
transition to PV prosumers.
Each of these three topic areas are briefly reviewed below. Readers who are familiar with the RE-
PROSUMERS framework can move directly to Section 1.3.
1.4.1. Drivers
Economic drivers for prosumers
Economic drivers help set the stage for prosumers to emerge. Some economic drivers relate directly to
the competitiveness of PV (e.g. PV system costs and electricity prices), whereas other economic drivers
derive from the impact of PV prosumers on different stakeholder groups (e.g. grid operators and other
consumers). The various types of economic drivers are summarized in Table 1.
Commercial Prosumers – Development and Policy Options (RE-COM-PROSUMERS), March 2016
Page 12
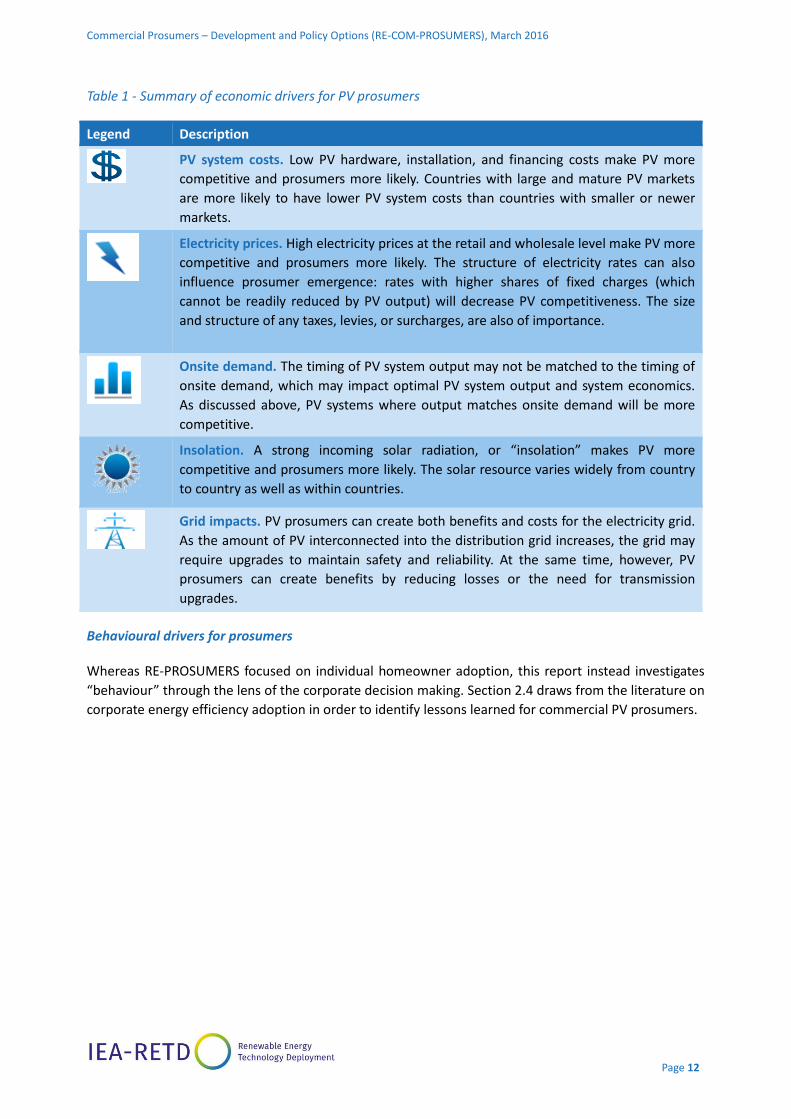
Table 1 - Summary of economic drivers for PV prosumers
Legend Description
PV system costs. Low PV hardware, installation, and financing costs make PV more
competitive and prosumers more likely. Countries with large and mature PV markets
are more likely to have lower PV system costs than countries with smaller or newer
markets.
Electricity prices. High electricity prices at the retail and wholesale level make PV more
competitive and prosumers more likely. The structure of electricity rates can also
influence prosumer emergence: rates with higher shares of fixed charges (which
cannot be readily reduced by PV output) will decrease PV competitiveness. The size
and structure of any taxes, levies, or surcharges, are also of importance.
Onsite demand. The timing of PV system output may not be matched to the timing of
onsite demand, which may impact optimal PV system output and system economics.
As discussed above, PV systems where output matches onsite demand will be more
competitive.
Insolation. A strong incoming solar radiation, or “insolation” makes PV more
competitive and prosumers more likely. The solar resource varies widely from country
to country as well as within countries.
Grid impacts. PV prosumers can create both benefits and costs for the electricity grid.
As the amount of PV interconnected into the distribution grid increases, the grid may
require upgrades to maintain safety and reliability. At the same time, however, PV
prosumers can create benefits by reducing losses or the need for transmission
upgrades.
Behavioural drivers for prosumers
Whereas RE-PROSUMERS focused on individual homeowner adoption, this report instead investigates
“behaviour” through the lens of the corporate decision making. Section 2.4 draws from the literature on
corporate energy efficiency adoption in order to identify lessons learned for commercial PV prosumers.
Commercial Prosumers – Development and Policy Options (RE-COM-PROSUMERS), March 2016
Page 13
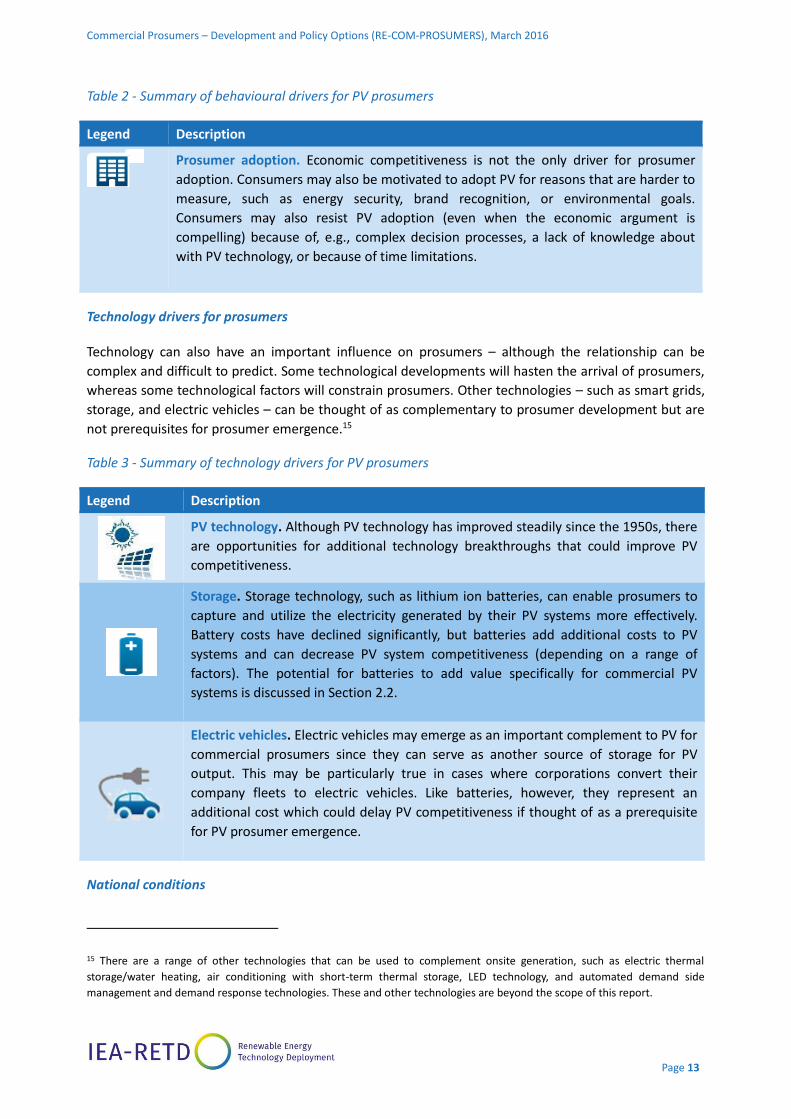
Table 2 - Summary of behavioural drivers for PV prosumers
Legend Description
Prosumer adoption. Economic competitiveness is not the only driver for prosumer
adoption. Consumers may also be motivated to adopt PV for reasons that are harder to
measure, such as energy security, brand recognition, or environmental goals.
Consumers may also resist PV adoption (even when the economic argument is
compelling) because of, e.g., complex decision processes, a lack of knowledge about
with PV technology, or because of time limitations.
Technology drivers for prosumers
Technology can also have an important influence on prosumers – although the relationship can be
complex and difficult to predict. Some technological developments will hasten the arrival of prosumers,
whereas some technological factors will constrain prosumers. Other technologies – such as smart grids,
storage, and electric vehicles – can be thought of as complementary to prosumer development but are
not prerequisites for prosumer emergence.15
Table 3 - Summary of technology drivers for PV prosumers
Legend Description
PV technology. Although PV technology has improved steadily since the 1950s, there
are opportunities for additional technology breakthroughs that could improve PV
competitiveness.
Storage. Storage technology, such as lithium ion batteries, can enable prosumers to
capture and utilize the electricity generated by their PV systems more effectively.
Battery costs have declined significantly, but batteries add additional costs to PV
systems and can decrease PV system competitiveness (depending on a range of
factors). The potential for batteries to add value specifically for commercial PV
systems is discussed in Section 2.2.
Electric vehicles. Electric vehicles may emerge as an important complement to PV for
commercial prosumers since they can serve as another source of storage for PV
output. This may be particularly true in cases where corporations convert their
company fleets to electric vehicles. Like batteries, however, they represent an
additional cost which could delay PV competitiveness if thought of as a prerequisite
for PV prosumer emergence.
National conditions
15 There are a range of other technologies that can be used to complement onsite generation, such as electric thermal
storage/water heating, air conditioning with short-term thermal storage, LED technology, and automated demand side
management and demand response technologies. These and other technologies are beyond the scope of this report.
Commercial Prosumers – Development and Policy Options (RE-COM-PROSUMERS), March 2016
Page 14
In addition to the primary drivers described in the preceding section, policymakers may also need to
take into account national conditions that could accelerate or constrain prosumer development. These
can include, for example:
Available roof space. The number of PV prosumers in may be limited by available roof tops. Not all
buildings or building types have suitable roof space as a result of roof orientation, shading, mechanical
systems on the roof, etc.
Share of rental property. Different countries have different levels of building ownership. Renters are
unlikely to become prosumers since they do not have an incentive to make long-term investments in
property improvements such as PV. Similarly, landlords renting their property do not have an incentive
to install PV because they generally do not pay electricity bills.
Existing and planned renewable energy development. Prosumer adoption typically occurs in parallel
with the development of large, central-station renewable energy plants and with small, distributed
systems that are not owned by prosumers. If non-prosumer renewable energy generation
penetrations are high, this may limit the potential of prosumer development Prosumers and non-
prosumers will compete when the amount of potential renewable energy development is limited by
policy (e.g. caps on development) or by technical considerations.
Stakeholders
As often with the introduction of any new business model, the emergence of prosumers creates
winners and losers, depending on how the incentives of different stakeholders are aligned. The RE-
PROSUMERS framework analyses prosumers from a range of stakeholder perspectives, including
transmission and distribution grid operators, incumbent generators, other consumers, and government.
Table 4 summarizes the motivations for different stakeholder groups to either encourage or resist
prosumers.
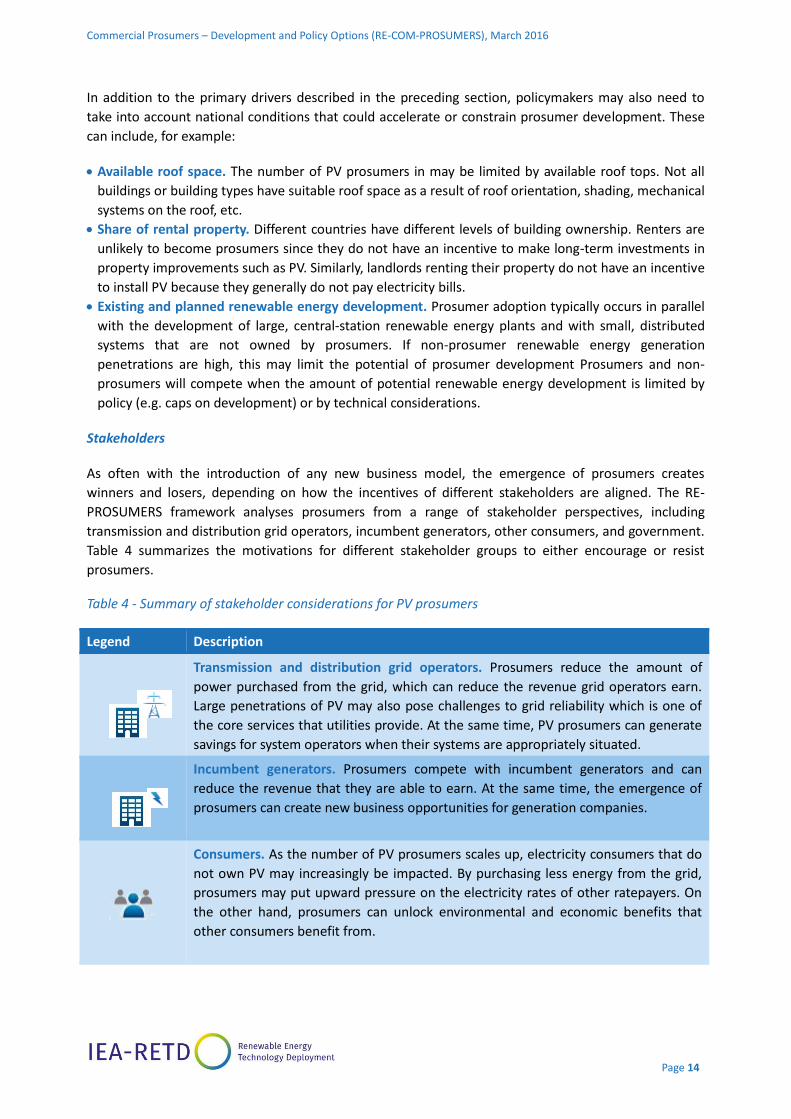
Table 4 - Summary of stakeholder considerations for PV prosumers
Legend Description
Transmission and distribution grid operators. Prosumers reduce the amount of
power purchased from the grid, which can reduce the revenue grid operators earn.
Large penetrations of PV may also pose challenges to grid reliability which is one of
the core services that utilities provide. At the same time, PV prosumers can generate
savings for system operators when their systems are appropriately situated.
Incumbent generators. Prosumers compete with incumbent generators and can
reduce the revenue that they are able to earn. At the same time, the emergence of
prosumers can create new business opportunities for generation companies.
Consumers. As the number of PV prosumers scales up, electricity consumers that do
not own PV may increasingly be impacted. By purchasing less energy from the grid,
prosumers may put upward pressure on the electricity rates of other ratepayers. On
the other hand, prosumers can unlock environmental and economic benefits that
other consumers benefit from.
Commercial Prosumers – Development and Policy Options (RE-COM-PROSUMERS), March 2016
Page 15
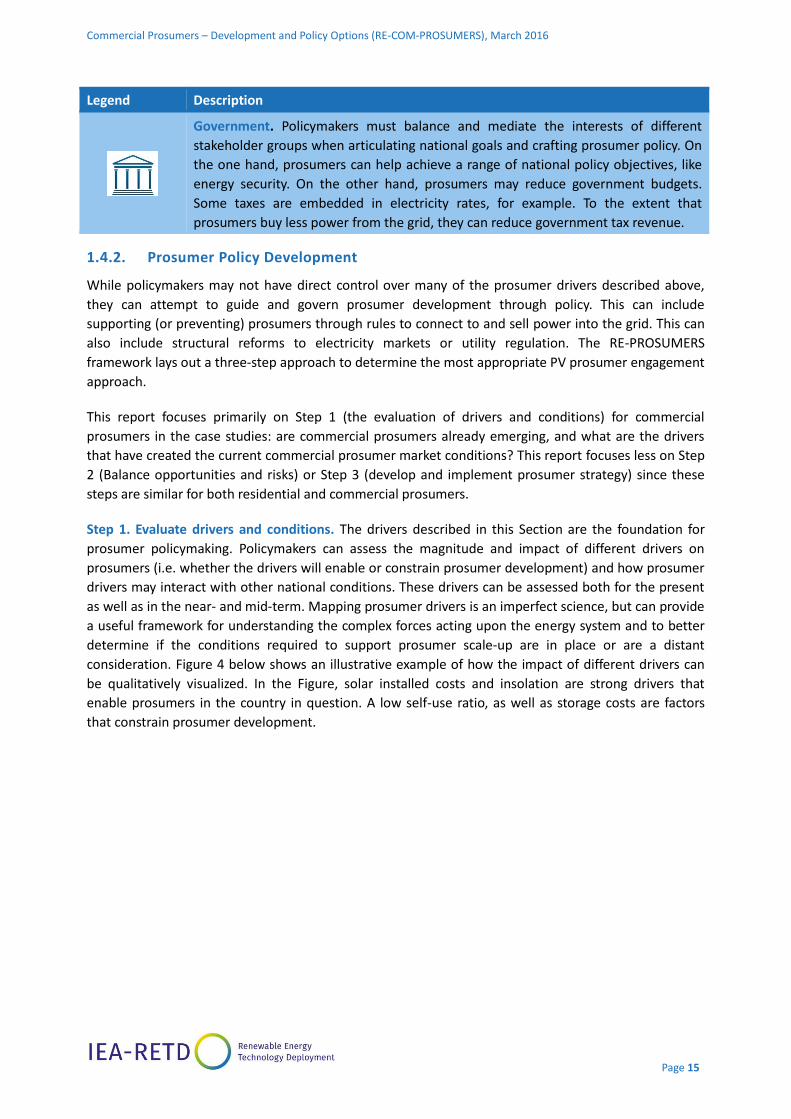
Legend Description
Government. Policymakers must balance and mediate the interests of different
stakeholder groups when articulating national goals and crafting prosumer policy. On
the one hand, prosumers can help achieve a range of national policy objectives, like
energy security. On the other hand, prosumers may reduce government budgets.
Some taxes are embedded in electricity rates, for example. To the extent that
prosumers buy less power from the grid, they can reduce government tax revenue.
1.4.2. Prosumer Policy Development
While policymakers may not have direct control over many of the prosumer drivers described above,
they can attempt to guide and govern prosumer development through policy. This can include
supporting (or preventing) prosumers through rules to connect to and sell power into the grid. This can
also include structural reforms to electricity markets or utility regulation. The RE-PROSUMERS
framework lays out a three-step approach to determine the most appropriate PV prosumer engagement
approach.
This report focuses primarily on Step 1 (the evaluation of drivers and conditions) for commercial
prosumers in the case studies: are commercial prosumers already emerging, and what are the drivers
that have created the current commercial prosumer market conditions? This report focuses less on Step
2 (Balance opportunities and risks) or Step 3 (develop and implement prosumer strategy) since these
steps are similar for both residential and commercial prosumers.
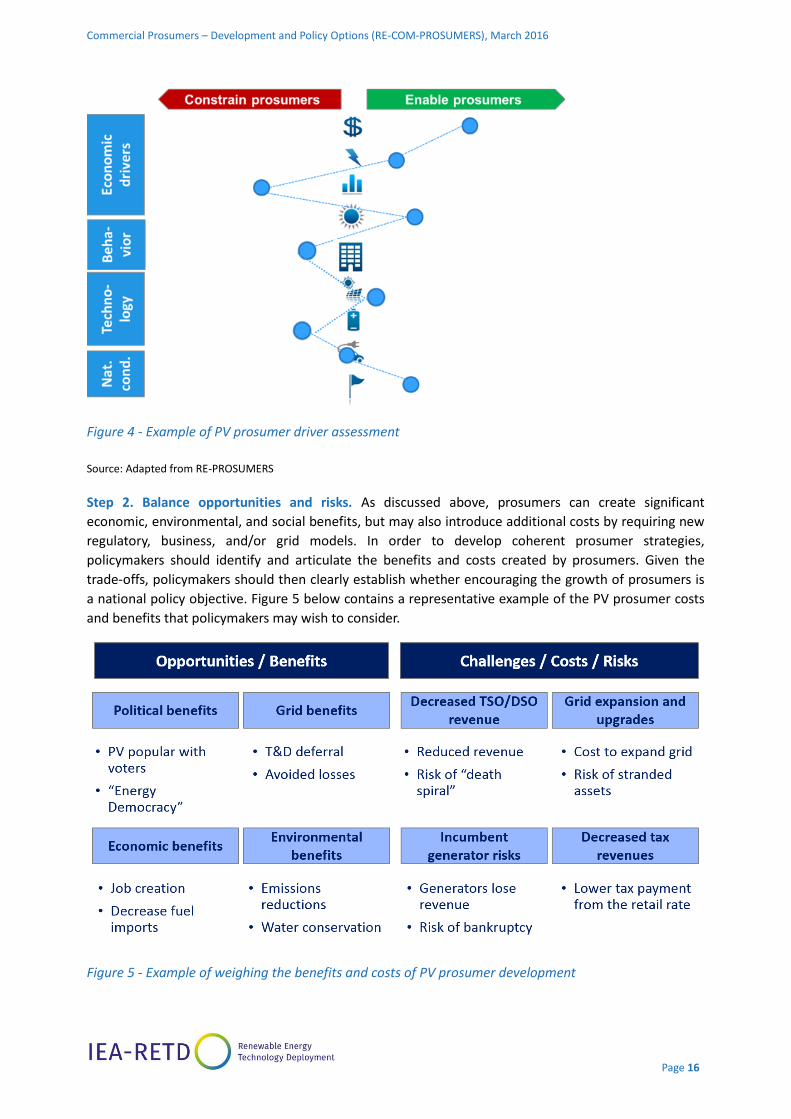
Step 1. Evaluate drivers and conditions. The drivers described in this Section are the foundation for
prosumer policymaking. Policymakers can assess the magnitude and impact of different drivers on
prosumers (i.e. whether the drivers will enable or constrain prosumer development) and how prosumer
drivers may interact with other national conditions. These drivers can be assessed both for the present
as well as in the near- and mid-term. Mapping prosumer drivers is an imperfect science, but can provide
a useful framework for understanding the complex forces acting upon the energy system and to better
determine if the conditions required to support prosumer scale-up are in place or are a distant
consideration. Figure 4 below shows an illustrative example of how the impact of different drivers can
be qualitatively visualized. In the Figure, solar installed costs and insolation are strong drivers that
enable prosumers in the country in question. A low self-use ratio, as well as storage costs are factors
that constrain prosumer development.
Commercial Prosumers – Development and Policy Options (RE-COM-PROSUMERS), March 2016
Page 16
Figure 4 - Example of PV prosumer driver assessment
Source: Adapted from RE-PROSUMERS
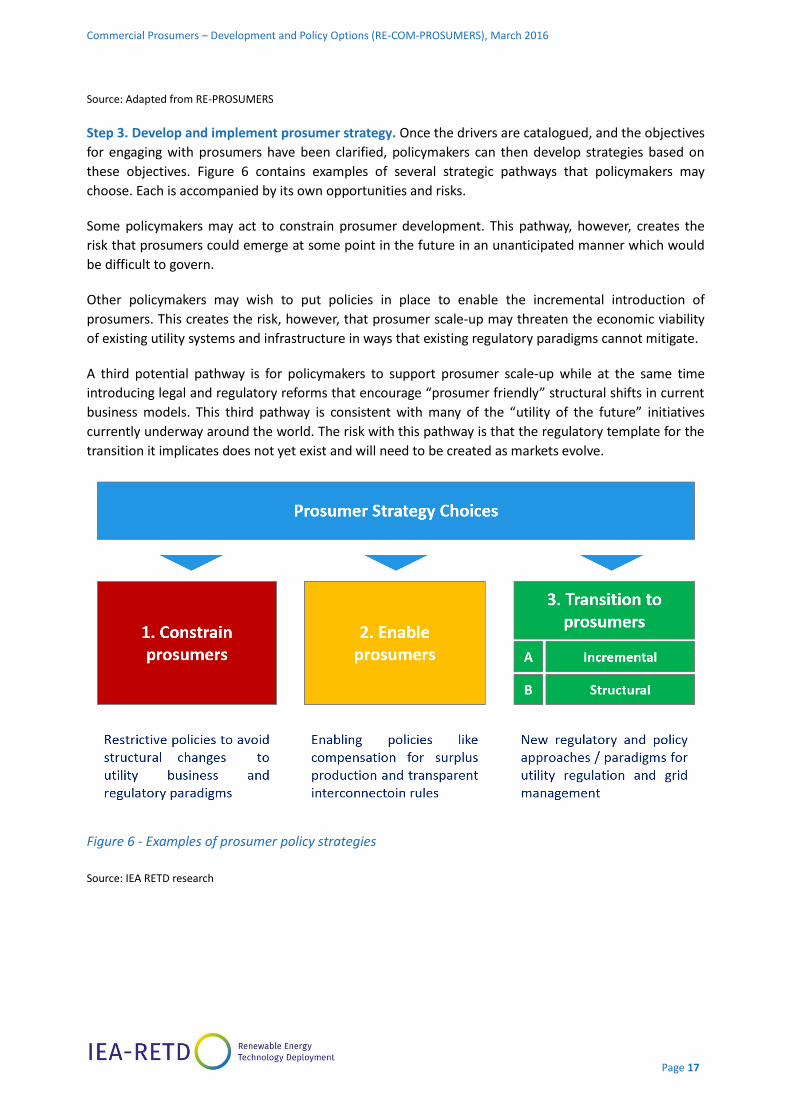
Step 2. Balance opportunities and risks. As discussed above, prosumers can create significant
economic, environmental, and social benefits, but may also introduce additional costs by requiring new
regulatory, business, and/or grid models. In order to develop coherent prosumer strategies,
policymakers should identify and articulate the benefits and costs created by prosumers. Given the
trade-offs, policymakers should then clearly establish whether encouraging the growth of prosumers is
a national policy objective. Figure 5 below contains a representative example of the PV prosumer costs
and benefits that policymakers may wish to consider.
Figure 5 - Example of weighing the benefits and costs of PV prosumer development
Commercial Prosumers – Development and Policy Options (RE-COM-PROSUMERS), March 2016
Page 17
Source: Adapted from RE-PROSUMERS
Step 3. Develop and implement prosumer strategy. Once the drivers are catalogued, and the objectives
for engaging with prosumers have been clarified, policymakers can then develop strategies based on
these objectives. Figure 6 contains examples of several strategic pathways that policymakers may
choose. Each is accompanied by its own opportunities and risks.
Some policymakers may act to constrain prosumer development. This pathway, however, creates the
risk that prosumers could emerge at some point in the future in an unanticipated manner which would
be difficult to govern.
Other policymakers may wish to put policies in place to enable the incremental introduction of
prosumers. This creates the risk, however, that prosumer scale-up may threaten the economic viability
of existing utility systems and infrastructure in ways that existing regulatory paradigms cannot mitigate.
A third potential pathway is for policymakers to support prosumer scale-up while at the same time
introducing legal and regulatory reforms that encourage “prosumer friendly” structural shifts in current
business models. This third pathway is consistent with many of the “utility of the future” initiatives
currently underway around the world. The risk with this pathway is that the regulatory template for the
transition it implicates does not yet exist and will need to be created as markets evolve.
Figure 6 - Examples of prosumer policy strategies
Source: IEA RETD research

Commercial Prosumers – Development and Policy Options (RE-COM-PROSUMERS), March 2016
Page 18
2 D R I V E RS FO R CO M M E RC I A L P RO S UM E RS
The emergence of commercial prosumers will be influenced by the same drivers that will affect
residential prosumers. Some drivers are more significant for commercial prosumers than for residential,
however. This section uses the framework from the RE-PROSUMERS report to highlight the ways in
which the drivers for commercial and residential prosumers diverge. Table 6 below summarizes which
drivers are discussed in detail and in which sections of this report. As can be seen in the Table, drivers
such as PV system cost, electricity rates, and self-use ratio are each discussed in their own sections,
whereas drivers such as insolation, grid impacts, and the impact on government and other consumers
are not discussed in detail since the differences in their impact on residential and commercial
prosumers are minimal. Significant attention is devoted to the sections on behavioural drivers and
economic impact on utilities, whereas the discussion of technical drivers is comparatively succinct.
Finally, there is significant focus on national conditions and commercial prosumers both in this section
and also in each of the case studies since different countries have different distributions of building
type, rental property, etc.
Commercial Prosumers – Development and Policy Options (RE-COM-PROSUMERS), March 2016
Page 19
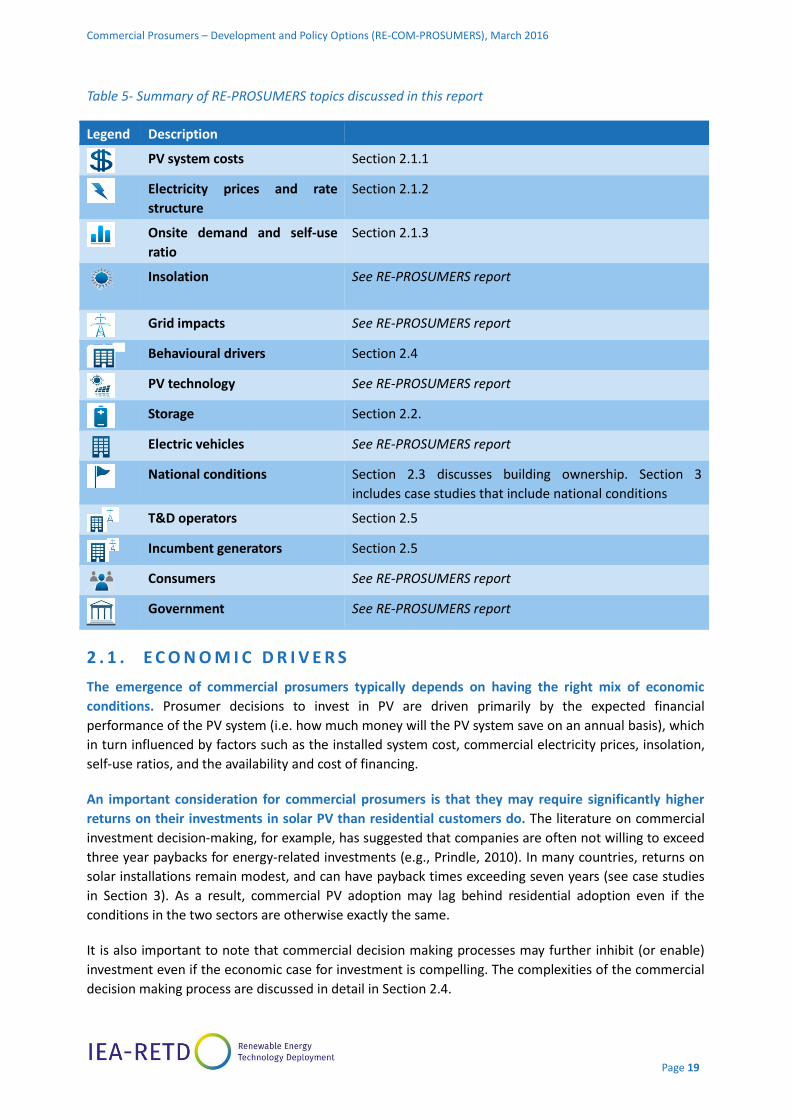
Table 5- Summary of RE-PROSUMERS topics discussed in this report
Legend Description
PV system costs Section 2.1.1
Electricity prices and rate
structure
Section 2.1.2
Onsite demand and self-use
ratio
Section 2.1.3
Insolation See RE-PROSUMERS report
Grid impacts See RE-PROSUMERS report
Behavioural drivers Section 2.4
PV technology See RE-PROSUMERS report
Storage Section 2.2.
Electric vehicles See RE-PROSUMERS report
National conditions Section 2.3 discusses building ownership. Section 3
includes case studies that include national conditions
T&D operators Section 2.5
Incumbent generators Section 2.5
Consumers See RE-PROSUMERS report
Government See RE-PROSUMERS report
2 . 1 . E C O N O M I C D R I V E R S
The emergence of commercial prosumers typically depends on having the right mix of economic
conditions. Prosumer decisions to invest in PV are driven primarily by the expected financial
performance of the PV system (i.e. how much money will the PV system save on an annual basis), which
in turn influenced by factors such as the installed system cost, commercial electricity prices, insolation,
self-use ratios, and the availability and cost of financing.
An important consideration for commercial prosumers is that they may require significantly higher
returns on their investments in solar PV than residential customers do. The literature on commercial
investment decision-making, for example, has suggested that companies are often not willing to exceed
three year paybacks for energy-related investments (e.g., Prindle, 2010). In many countries, returns on
solar installations remain modest, and can have payback times exceeding seven years (see case studies
in Section 3). As a result, commercial PV adoption may lag behind residential adoption even if the
conditions in the two sectors are otherwise exactly the same.
It is also important to note that commercial decision making processes may further inhibit (or enable)
investment even if the economic case for investment is compelling. The complexities of the commercial
decision making process are discussed in detail in Section 2.4.
Commercial Prosumers – Development and Policy Options (RE-COM-PROSUMERS), March 2016
Page 20
2.1.1. PV System Costs
Lower PV system costs improve the competitiveness of PV. Commercial installations are typically larger
than residential systems and benefit from economies of scale. In the UK, for example, average system
prices from 2013-14 for 10-50 kW systems were 33% lower per watt ($2.13/Wdc) than <4 kW systems
$3.18/Wdc) and 21% lower than 4-10 kW systems ($2.51/Wdc) (UK DECC, 2015e). Similarly, in the United
States, the average medium-scale rooftop commercial system cost 35% less per watt ($2.25/Wdc) than
the average residential system ($3.48/Wdc) in Q4 2014 (Kann et al., 2015a).
Different countries also have different tax structures for residential and commercial customers, which
can be reflected in, for example, different levels of income tax, sales and excise taxes, and value added
taxes. Different customer classes can also have different energy, carbon or other taxes built into the
electricity rates (2.1.2). The taxation scheme can be quite complex and can be difficult to generalize. In
Germany, for example, the 19% value added tax (VAT) can be deducted from the PV system sales price.
However, VAT must be paid on electricity generated by the PV system as soon as some electricity is
exported to the grid. This is the case for both (self-consumed and exported electricity). In other words,
self-generation is only VAT tax free if no excess electricity is sold to the grid (BMF, 2014). In some
countries, commercial entities can also claim substantial tax benefits. In the US, for example, PV system
investments can be depreciated on an accelerated 5-year schedule. The degree to which taxes, tax
exemptions, tax credits and tax deductions balance out varies from country to country.16
2.1.2. Electricity Prices and Rate Structure
As discussed in Section 1, industrial rates are lower than commercial rates in many countries.
Commercial rates are often likewise lower than average residential rates. Lower rates reduce the
competitiveness of commercial PV and limit prosumer emergence. At the same time, commercial rates
structures may further constrain prosumer development. In many countries, residential electricity rate
structures are composed of primarily volumetric charges i.e. on a USD/kWh basis, as in the U.S., UK,
France, and Germany), sometimes supplemented by smaller fixed charges. PV system output can thus
directly offset volumetric purchases – the largest component of residential electricity bills – from the
grid. Commercial customers, by contrast, have much more varied rate structures, which can include a
mix of volumetric charges, demand charges (i.e. USD/kW)17, and larger fixed charges (i.e. USD/year). PV
output cannot directly reduce demand or other fixed charges under normal circumstance and will
therefore be less competitive in jurisdictions with significant non-volumetric rates.
16 The authors do not render legal, investment, accounting, or tax advice, and the information contained in this communication
should not be regarded as such 17 This document uses the term “demand charge” to refer to charges assessed on a per kilowatt basis. In Europe, demand
charges are also referred to as “capacity-based tariffs” (e.g. European Commission, 2015).
Commercial Prosumers – Development and Policy Options (RE-COM-PROSUMERS), March 2016
Page 21
It is challenging to draw broad generalizations about commercial rate structures, however. The structure
of commercial rates varies widely, and this variation can significantly impact PV system economics. In
the United States, for example, there are over 4,600 utilities and over 13,000 different commercial rate
structures. Commercial PV system economics for the same building type vary significantly across the
states, with the most attractive states having high electricity prices and favourable rate structures (Ong
et al., 2012).18 An equally heterogeneous picture can be found in Europe, with electricity prices for
commercial consumers varying widely (European Commission, 2014). Whereas commercial rates in
Germany are highly variable, commercial rate structures in France were until recently closely regulated
by the government. With the requirement to move to market-based rates as of January 1, 2016,
France’s commercial rates will no longer be regulated, potentially making commercial self-use more
attractive for certain customers. Finally, different countries embed different energy, carbon, and other
taxes in the retail rate structures in different ways. The importance of rate structures in the economic
attractiveness of PV in different jurisdictions is further explored in the case studies in Section 3.
2.1.3. Onside Demand and Self-use
Residential prosumers in many countries have historically exported a significant amount of electricity to
the grid under policies such as feed-in tariffs and net metering. Without such policies, however, the
match between residential PV system output and residential demand is uneven. It is estimated that
residential systems in Europe can achieve self-use ratios of 29-42%, depending on the country (Latour,
2013). By contrast, commercial and manufacturing buildings in Germany and Spain can achieve self-
use ratios of 75 to 100% (REC, 2013; Willborn et al., 2014). The alignment of peak PV generation with
peak commercial electricity demand in certain commercial industries, combined with careful sizing of
PV systems, is primarily responsible for the higher self-use ratios. These higher self-use ratios improve
the competitiveness of commercial PV.
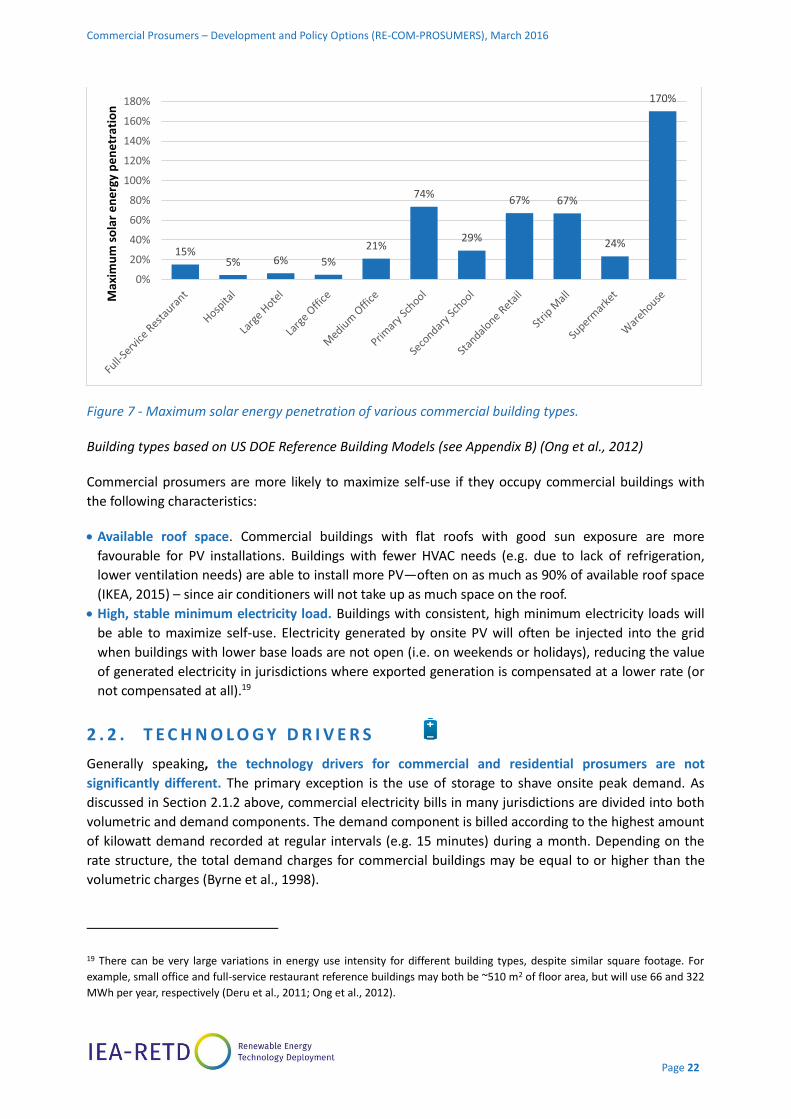
Although it is comparatively easy for commercial buildings to size their PV systems to achieve high self-
use ratios, many commercial buildings have low maximum solar energy penetration potential. Figure 9
below provides estimates for the percentage of electricity demand that can be met by PV by building
type, assuming that the entire rooftop is used and all the output can be either utilized onsite or
exported.
As can be seen in Figure 7, buildings with significant rooftop equipment (e.g. hospitals) or that have
small roof area compared to building height (e.g. large hotels and office buildings) are likely to have low
maximum solar energy penetrations of between 4-7%. Rooftop solar PV systems on these building types
are likely to have high self-use ratios since their output will likely be below the buildings’ minimum
baseload. Put another way, it is unlikely that PV systems on these buildings will export power to the grid
even if the entire roof is utilized for the installation. Appendix B presents examples of PV systems on
hotels, hospitals, and large office buildings and demonstrates that they can achieve 92%-100% self-use.
At the other end of the spectrum, warehouses have large rooftops and low onsite load. As result,
warehouses can achieve more than 100% maximum solar energy penetration. As shown in Appendix B,
the warehouse system can be downsized significantly to raise the self-use ratio, but the potential
rooftop space goes largely underutilized as a result.
18 PV system economics in the cited study are compared using “net solar value” metric, which compares a building’s lowest cost
electricity rate option prior to PV installation with the bill post PV installation.
Commercial Prosumers – Development and Policy Options (RE-COM-PROSUMERS), March 2016
Page 22
Figure 7 - Maximum solar energy penetration of various commercial building types.
Building types based on US DOE Reference Building Models (see Appendix B) (Ong et al., 2012)
Commercial prosumers are more likely to maximize self-use if they occupy commercial buildings with
the following characteristics:
Available roof space. Commercial buildings with flat roofs with good sun exposure are more
favourable for PV installations. Buildings with fewer HVAC needs (e.g. due to lack of refrigeration,
lower ventilation needs) are able to install more PV—often on as much as 90% of available roof space
(IKEA, 2015) – since air conditioners will not take up as much space on the roof.
High, stable minimum electricity load. Buildings with consistent, high minimum electricity loads will
be able to maximize self-use. Electricity generated by onsite PV will often be injected into the grid
when buildings with lower base loads are not open (i.e. on weekends or holidays), reducing the value
of generated electricity in jurisdictions where exported generation is compensated at a lower rate (or
not compensated at all).19
2 . 2 . T E C H N O L O G Y D R I V E R S
Generally speaking, the technology drivers for commercial and residential prosumers are not
significantly different. The primary exception is the use of storage to shave onsite peak demand. As
discussed in Section 2.1.2 above, commercial electricity bills in many jurisdictions are divided into both
volumetric and demand components. The demand component is billed according to the highest amount
of kilowatt demand recorded at regular intervals (e.g. 15 minutes) during a month. Depending on the
rate structure, the total demand charges for commercial buildings may be equal to or higher than the
volumetric charges (Byrne et al., 1998).
19 There can be very large variations in energy use intensity for different building types, despite similar square footage. For
example, small office and full-service restaurant reference buildings may both be ~510 m2 of floor area, but will use 66 and 322
MWh per year, respectively (Deru et al., 2011; Ong et al., 2012).
15%5% 6% 5%
21%
74%
29%
67% 67%
24%
170%
0%
20%
40%
60%
80%
100%
120%
140%
160%
180%M
axim
um
so
lar
en
erg
y p
en
etr
atio
n
Commercial Prosumers – Development and Policy Options (RE-COM-PROSUMERS), March 2016
Page 23
Although a PV system may match periods of peak demand for most of the month, the demand charge
could still be set during a fifteen minute window (e.g. when clouds pass over head) that demand spikes
while PV output is low. As a result, PV cannot reliably reduce peak demand charges.
As discussed in RE-PROSUMERS, battery technology remains expensive and it is unlikely that residential
PV prosumers will be able to cost-effectively defect from the grid in the near term. As discussed in
Section 1.2, it is also unlikely that commercial prosumers will use batteries to defect from the grid since
PV and battery combinations will not be sufficient to reach 100% self-sufficiency either daily or
seasonally. Battery storage, however, can be used to shave peak demand by storing PV electricity
generated during off-peak hours and then discharging, or dispatching, during the building’s peak
demand periods. Depending on the building load profile and the rate structure, the value of this peak
shaving capability may outweigh the additional cost of battery storage.
In some jurisdictions, recent modelling has concluded that PV and storage at current prices could
generate attractive economic returns for commercial buildings by delivering demand charge reductions
similar in magnitude to the volumetric (i.e. kWh) savings (Manghani, 2014). Buildings that experience
sharp peaks (e.g. as a result of variable loads such as large HVAC systems, motors, etc.) stand to benefit
most from PV and storage (PV/storage) systems that are configured to shave peak. Hotels experience
large peaks in the mornings and the evenings when guests are most active, and PV/storage can be used
to create demand-related savings. As discussed in Section 3.2, this report focuses primarily on building
types with comparatively flat load profiles and does not analyse the economics of PV/battery systems
configured to shave peak.
It is also important to note, however, that the use of PV and storage to shave peak has not yet been
widely demonstrated. The perceived business model and technology risks inherent in dispatchable peak
shaving PV systems could increase the cost of capital and reduce the competitiveness of PV/storage
(Manghani, 2014).
2 . 3 . N AT I O N A L C O N D I T I O N S
As discussed in Section 1.3.1 above, a range of national conditions can enable or constrain prosumer
development. This section highlights building ownership and occupancy since they are particularly
relevant to commercial buildings. Other national conditions, such as available commercial roof space,
are not near-term constraints on commercial prosumer emergence (Section 1.2).
Building ownership and occupancy models can significantly impact the potential for PV technology
adoption (Schick, 2002). PV financial analysis and decision-making typically considers a time horizon
of 20-years or more, making the organization’s expectations of long-term ownership and/or
occupancy a major factor. Ownership also implicates roof access and right to install equipment,
whereas tenants may have an added layer of decision-making to navigate before installation of a PV
system may be approved.
Owners are better positioned than tenants to invest in PV. Where would-be prosumers do not own
the buildings in which they operate, the structures and terms of their lease play critical roles in the
feasibility of the project and the ability to reap the benefits of their investment. Commercial spaces
can be governed by a variety of different lease structures.
Commercial Prosumers – Development and Policy Options (RE-COM-PROSUMERS), March 2016
Page 24
Two of the major types of leases are triple net leases and gross leases. In a triple net lease, tenants
pay for rent, property taxes, insurance and building operating expenses and are typically charged on a
square meter basis. In gross leases, landlords assume responsibility for building operating expenses. In
some modified gross leases, tenants may pay for a proportional share of utility bills. In the case of
unmodified gross leases and net leases, the impacts of energy investments (i.e. PV) are not directly
accessible by the investors. In a net lease, landlords are disincentivized from making energy
investments since they do not pay for monthly utility bills. In a gross lease, tenants are dis-incentivized
from making energy investments in their spaces if the savings are not directly reflected in monthly
utility bills. This disconnect is known as a split incentive. Increasingly, a variety of “green leasing”
provisions are beginning to be incorporated into leases, typically when a highly environmentally
motivated tenant is committing to a long-term lease (MCG, 2014). While investments in energy
efficiency is the more common driver of green leases, increased use of various green lease mechanism
could help enable more rapid uptake of PV among prosumers that do not own a large portion of their
facilities. Whereas a majority of residential consumers own their own homes in the EU, the share of
commercial building ownership is lower. In the UK, approximately two-thirds of all commercial floor
space is leased and not owned (AREF, 2013). In the US, by contrast, 36% of commercial buildings are
leased, and 7% are a mix of owner-occupied and leased (US EIA, 2015a). Low percentages of
commercial building ownership may serve to slow or delay commercial prosumers.
Term of occupancy impact on PV ownership decisions. Some building types (e.g. institutional
buildings) may be more willing than commercial entities to invest in PV systems because they have
greater tolerance for longer-term investments. Some commercial real estate buildings, by contrast,
may be less inclined to invest because they have shorter-term investment horizons as a result of their
corporate strategy (e.g. to purchase and resell buildings in the short term). It is necessary to take
factors such as these into account when attempting to draw broad conclusions about the emergence
of commercial PV prosumers.
Although it is important to take ownership and occupancy considerations into account when
contemplating prosumer strategy, it is also difficult to broadly characterize (and target policy to) specific
classes of commercial building types. Different building ownership and occupancy models can be found
to different extents in different commercial building industries:
Commercial real estate can be divided into buildings that are leased and managed by the owner,
buildings that are leased but managed by a property management company, and buildings that are
owner-occupied. Owners can be further subdivided into those whose strategy is to buy, renovate, and
resell buildings, and owners who buy and hold them over the long term. Finally, tenants can be
differentiated by their lease terms, with long term (e.g. ground) leases providing greater incentive to
make PV investments that most short-term tenants would not have. Each of these categories has
different implications for potential PV investment.
Chains and franchises include supermarkets, general retail (e.g. department stores), specialty retail,
restaurants (which are split between chain/franchises and independent), and hotels (which are highly
complex and fragmented). Each of these industries has different property investment strategies, which
can impact PV adoption and diffusion.
Institutional buildings can include state buildings, universities, primary and secondary schools, and
hospitals. Although these institutions tend to occupy their buildings for a long period of time, they
also vary in terms of whether they own or lease their space, and the extent to which their decision
making is constrained or enabled by government policy.
Commercial Prosumers – Development and Policy Options (RE-COM-PROSUMERS), March 2016
Page 25
2 . 4 . B E H AV I O U R A L D R I V E R S
The factors discussed above under economic drivers and national conditions play a significant role in PV
adoption. However, even in a well-functioning market with widespread awareness of PV, uninhibited
access to information, and rational decision-making, numerous other variables impact firms’ decisions
(or non-decisions) to pursue energy management generally, and PV adoption specifically. A well-
documented “gap” between profitable energy measures and those actually implemented raises
question of why profitable opportunities for energy conservation and self-generation are not pursued
(see e.g., Decanio, 1993; de Groot et al., 2001; Hirst & Brown, 1990; Jaffea & Stavins, 1993)
This section explores behavioural drivers which help explain the lost opportunities for profitable energy
investments, which include a range of non-financial motivations and barriers in large organizations to
pursue (or not pursue) PV. Some drivers of commercial prosumer behaviour overlap with those
applicable to the residential sector discussed in RE-PROSUMERS (for example, awareness, attitudes,
values, and beliefs of individuals). However there are significant differences between the two sectors, as
discussed in Box 2.
Box 2. Differences between residential & commercial prosumers: behavioural drivers
Decision-making centralization. Organizations face more barriers of coordination, diffuse decision-
making, and sometimes onerous approval processes. Residential prosumers may not always be able to
make decisions unilaterally; for example, they may have to contend with other stakeholders such as
condominium or homeowner association members whose support or approval may be needed.
However, decision-makers in the residential sector are likely to be more consolidated than the
commercial or institutional sectors. The reduced/eliminated internal coordination and communication
for residential prosumers likely means lower transaction costs.
Split incentives and principal-agent challenges. Split incentives and principal-agent challenges occur
when the benefits of an energy project accrue to one entity and the costs and decision-making
authority are held by another. While these challenges do apply in the residential sector (e.g. renters
face a landlord-tenant split incentive), more complex split incentive and agency problems can emerge
in large organizations due to business unit structures, budgets and energy accounting practices. For
example, up-front costs may be paid out of a capital improvements budget but benefits accrue to an
operations and maintenance account.
Technical and informational barriers. Commercial prosumers are more likely to have a stronger base
of knowledge about PV investments and energy investments generally. A medium-sized or large firm is
more likely to have dedicated to building management or energy investments whose knowledge allows
them to make more informed decisions but may also create a heightened sense of risk or uncertainty
about future changes in technology, energy prices, and other conditions which might delay action. In
comparison, residential prosumers often have varying motivations for adopting solar PV based on their
environmental and personal preferences rather than strictly on the basis of economics.

Commercial Prosumers – Development and Policy Options (RE-COM-PROSUMERS), March 2016
Page 26
While there is comparatively little literature specifically discussing commercial decision-making
related to PV adoption, analysis of the literature on energy efficiency and energy management more
generally suggests a high degree of relevance to PV prosumer behaviour. The discussion of behavioural
drivers below thus draws on the literature about energy efficiency investment decisions as a proxy,
recognizing the similar role both energy efficiency and PV play in reducing or offsetting electricity
purchases (Bazerman, 2008; Cagno & Trianni, 2014; CSE and ESI, 2012; de Groot et al., 2001; Koetse et
al., 2003; Kulakowski, 1999; Moezzi et al., 2014; Prindle, 2010; Reddy & Painuly, 2004; Reinaud &
Goldberg, 2011; Rudberg et al., 2013). Unless otherwise noted, the research referenced below refers to
these sources.
A number of these and other studies have argued in favour of a comprehensive approach to energy
management (Janda, 2013; Linnenluecke et al., 2009; Lutzenhiser et al., 2001). The behavioural drivers
influencing commercial prosumer decision-making are grouped into five sections, following the
"virtuous cycle" framework developed by Hiller et al. (2012).
The authors argue that the executive, financial, human resources, performance management, and
public relations functions of an entity must be aligned to overcome various barriers and create a cycle of
continuous improvement of energy management and that meaningful interventions to support onsite
energy adoption must take these factors into account. Barriers in one functional can prevent PV
adoption even if the rest of the corporate functions are aligned. If each department is equipped with
the right information, resources, and authority, however, then targets set by executive leadership will be
followed by successful implementation and positive public relations, which will reinforce the executive
targets in a cyclical manner. The virtuous cycle framework for energy management is illustrated in
Figure 8 and the five categories form the basis for subsequent discussion of specific factors influencing
firms’ decision-making. The policy implications of the virtuous cycle framework are discussed in Section
4.
In general, behavioural drivers are highly organization-specific and do not strongly correlate by
industry. However, two notable exceptions prevalent in the energy management literature are
discussed in Box 3.
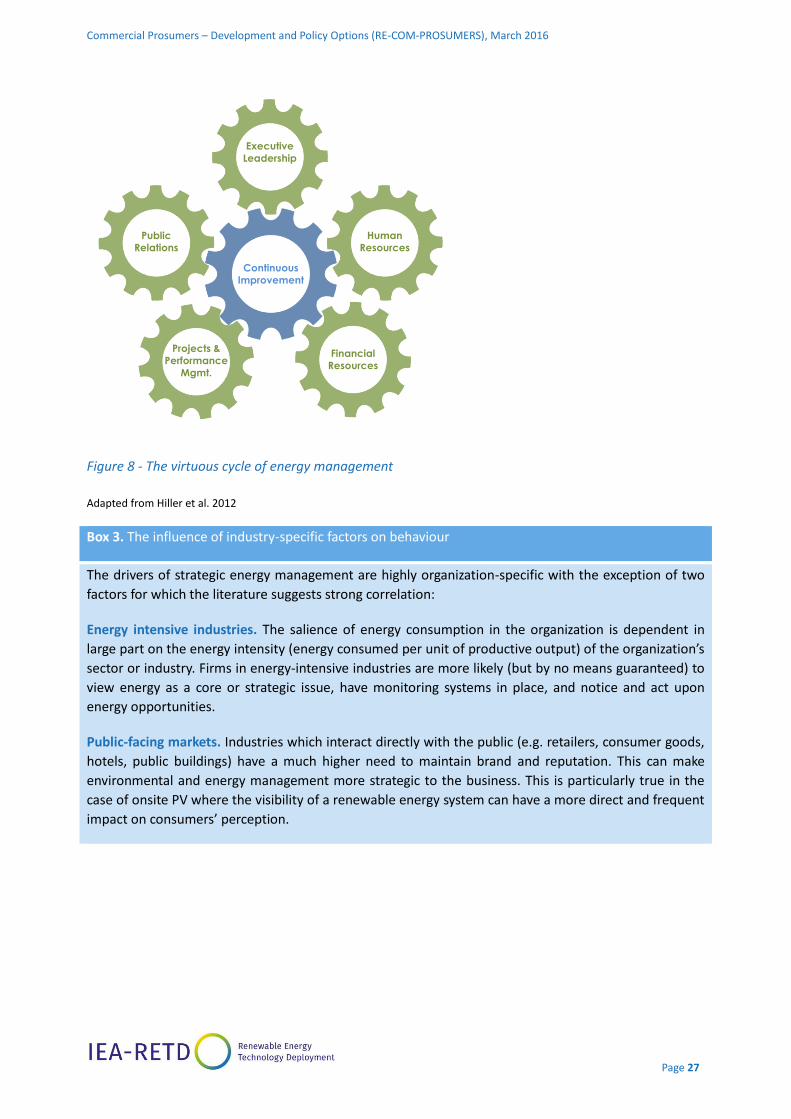
Commercial Prosumers – Development and Policy Options (RE-COM-PROSUMERS), March 2016
Page 27
Figure 8 - The virtuous cycle of energy management
Adapted from Hiller et al. 2012
Box 3. The influence of industry-specific factors on behaviour
The drivers of strategic energy management are highly organization-specific with the exception of two
factors for which the literature suggests strong correlation:
Energy intensive industries. The salience of energy consumption in the organization is dependent in
large part on the energy intensity (energy consumed per unit of productive output) of the organization’s
sector or industry. Firms in energy-intensive industries are more likely (but by no means guaranteed) to
view energy as a core or strategic issue, have monitoring systems in place, and notice and act upon
energy opportunities.
Public-facing markets. Industries which interact directly with the public (e.g. retailers, consumer goods,
hotels, public buildings) have a much higher need to maintain brand and reputation. This can make
environmental and energy management more strategic to the business. This is particularly true in the
case of onsite PV where the visibility of a renewable energy system can have a more direct and frequent
impact on consumers’ perception.
Executive
Leadership
Human
Resources
Financial
Resources
Projects &
Performance
Mgmt.
Public
Relations
Continuous
Improvement

Commercial Prosumers – Development and Policy Options (RE-COM-PROSUMERS), March 2016
Page 28
2.4.1. Executive Leadership
Corporate behaviour is often assumed to be rational, with leaders objectively evaluating opportunities
and risks in order to maximize the firm’s profitability. However, corporate behaviour is influenced by
persistent beliefs about technology, risks, costs, benefits, etc. which may or may not reflect actual
conditions. Decision-makers may not subject those beliefs to periodic review, allowing lingering
misconceptions to perpetuate the status quo. Decision-making is thus heavily influenced by imperfect
access to information, as well as the values, beliefs, and heuristics of individual decision-makers
(Rosner, 1995). For example, individuals vary in the degree to which they discount the future, hold
optimistic perceptions on the future, or are otherwise consciously or subconsciously influenced by self-
serving biases (“egocentrism”).
These tendencies can be exacerbated by uncertainty and complexity, for example if uncertainty
regarding future market conditions, energy prices, or the availability of new and improved technologies
is used to rationalize and perpetuate inaction.20 In particular, the rapidly falling cost of PV in recent years
(e.g. 52% decline in the U.S. between 2009 and 2014) (Barbose et al., 2014) could be a driver or a
barrier to PV adoption: while price declines help draw attention to PV as a compelling option and an
emerging strategic opportunity, some may view the instability the market as a reason to hold out for
even better opportunities in the near future. Uncertainty regarding future energy prices, on the other
hand, is more likely to be a driver of PV and other energy investments.
While the finances of a project are the largest factor in most customer decisions on renewable energy
investments, hedging against electricity price volatility is playing an increasingly important role.
Risk (real or perceived) can also deter investment. The field of building management is heavily oriented
around occupant comfort, complaint avoidance, and avoidance of energy supply disruptions, and
building managers are incentivized to be highly risk-averse. However, unlike energy efficiency,
installation of PV is unlikely to have any impact on building occupant experience or to disrupt normal
operations. This eliminates some of the perceived or actual implementation risks associated with
energy conservation projects.
Perhaps one of the most significant challenges in making onsite renewable energy investments a
priority is the perception of energy management as a non-core or non-strategic issue. At the executive
level, energy use in many industries is viewed by management as a single, narrow set of technical issues
and not a “core” or strategic issue. A variety of studies have documented how firms fail to prioritize
energy management, treat energy as a fixed cost, and/or fail to recognize the potential for contributing
to the bottom line. Management attention to energy is often short-lived and arises only in response to
external influences such as energy price shocks, regulation (or threat of regulation), or pressure from
customers or consumers (e.g., Lutzenhiser et al., 2002). Partly in order to overcome this barrier, some
large supermarket groups in France have created a subsidiary company that is responsible for focusing
on energy initiatives at the company called “Green Yellow”. The creation of a separate entity with a
clear mandate to examine, and act on, attractive energy saving, revenue generating, or bill-reducing
activities has helped improve the visibility of opportunities like customer-sited PV at the company,
turning them from a non-core issue to an important part of the company’s overall brand (see France
case study in Section 3.3.).
20 However, the influence of expectations on future energy prices on decision-making may depend on firm size (Koetse et al.,
2003).

Commercial Prosumers – Development and Policy Options (RE-COM-PROSUMERS), March 2016
Page 29
Making the case for renewable energy investment as a strategic issue that confers competitive
advantage may help generate momentum for ongoing attention from management. A number of
leading companies have demonstrated how effective company-wide energy management initiatives can
succeed when the issue is clearly identified as a strategic priority. For example, IKEA’s commitment to a
100% renewable energy target led to rapid adoption of PV in the past five years in the U.S., where 90%
of IKEA stores now have onsite solar generation installed. Indeed this type of company-wide initiative
may be easier to implement for PV than energy efficiency because sites can be selected based on
relatively simple and readily identifiable characteristics (e.g. location, roof size and orientation, building
ownership) whereas efficiency upgrades may require a more nuanced understanding of existing
conditions and technical building characteristics.
In contrast, bottom-up energy initiatives or one-off projects can suffer from the “invisibility” of energy
where gains in energy efficiency and the associated savings can go unnoticed in the wider organization.
In the case of PV, the projects themselves are less likely to be overlooked due to the highly visible
nature of onsite PV installations. However, more important is the visibility of the associated energy
reductions and cost savings. Demonstrating success to management after a project can maintain focus
and momentum for further investment.
In the case of energy efficiency, reductions can be difficult to measure and communicate due to their
complexity, the lag effect associated with monitoring results and the fact that overall energy
consumption in a given time period is subject to other factors (e.g. weather, building use, occupant
behaviour, etc.) and does not correlate with energy investments alone. Here again, PV has an advantage
because impacts are comparatively easy to measure and communicate and they can be determined
quickly after a project is completed. While not guaranteed to match predicted output, PV production is
subject to fewer of the above-mentioned variables which could negate or obfuscate actual savings than
energy efficiency projects.
PV prosumers are most likely to emerge in firms that focus and sustain executive attention and
commitment, view renewable energy as a strategic opportunity, recognize the price hedging value of
PV, set an explicit PV target, identify a portfolio of company-wide project opportunities, and monitor
and report quantifiable results following implementation.
2.4.2. Human Resources
Even where executive attention is successfully focused on creating a mandate for strategic energy
management, initiatives can falter when responsibilities for implementation are not clearly
articulated or incentivized. In many firms, responsibility for energy management is diffuse across the
organization. For example, control over energy use may be spread across a variety of positions and
departments including building managers, IT, maintenance staff, etc., and levels of coordination may be
low. In contrast, responsibility for investigating renewable energy opportunities are less likely to be
diffuse; rather they are more likely to be unassigned altogether.
Even where energy management responsibilities are clearly articulated, there may not always be an
adequate level of expertise or capacity. Unlike energy efficiency, installing PV is relatively maintenance-
free and requires little training of building managers for ongoing operation of new equipment (an often
overlooked or inadequately implemented part of energy project planning processes). However,
development of renewable energy projects may be outside the experience, expertise, or job
responsibilities of building managers.
Commercial Prosumers – Development and Policy Options (RE-COM-PROSUMERS), March 2016
Page 30
Lack of capacity or competing demands on staff time are also frequently-cited barriers to action in the
energy efficiency literature that applies to the PV context as well.21
In addition to the predominantly risk averse nature of the building management field discussed earlier,
a number of studies have highlighted the low visibility and status of building managers more generally.
Building managers are unlikely to have input into strategic decisions and in larger firms are likely to sit
some distance form senior management in the organization’s hierarchy. In firms that rely on a bottom-
up approach to energy management, proactive identification of energy reduction or clean energy
opportunities is often dependent on the personal commitment and values of building managers and
their ability to get management’s attention.
PV is more likely to be pursued by firms that have explicitly designated staff responsibility for
investigating renewable energy opportunities, allocated sufficient human resources, invested in staff
training or provided access to external expertise, and/or created channels for building-level personnel
to propose project opportunities to relevant decision-makers.
2.4.3. Financial Resources
Energy investments are capital-intensive, with first costs typically making up the majority of total life
cycle costs for both energy efficiency and renewable energy investments. Lack of access to capital, high
up-front costs, high transaction costs, and various principle-agent problems are thus major factors
influencing investments in energy management.
Like managerial and staff time and attention, access to financial resources is a significant driver of
effective energy management. Where energy competes with other priorities for capital investment, low
or modest expected returns may deprioritize investment. In general, energy investments are subject to
very high rate of return requirements, often higher than other investments with comparable risks.
Some studies have found expected rates of return for energy efficiency projects in the commercial
sector of between 18-30%, with expected paybacks often in the 2-4 year range. Some studies have also
shown that even where comparably sophisticated financial analyses are conducted, decision-makers
ultimately rely on simplistic metrics such as payback period to make decisions. Anecdotal evidence
suggests that investments in PV are subjects to similar return expect actions and decision-making
processes. PV uptake is thus likely to be accelerated in firms that establish lower financial performance
thresholds for renewable energy projects than other investments, employ more complex financial
analysis tools (e.g. that recognize the electricity price hedging value of PV), or take a portfolio approach
to project development that uses the average of a group of projects to meet financial performance
thresholds.
In other cases, high financial performance thresholds may not be a barrier so much as a lack of access
to capital. This barrier can be particularly potent for SMEs which are more likely to seek external
sources of financing for capital-intensive investments such as energy efficiency. Access to external
sources of capital (e.g. bank loans) may be challenging where companies have already taken on debt or
where lenders lack capacity for evaluating energy investments. Assessing energy investments may
require quantifying revenue streams and assessing risks, which in turn demands at least a rudimentary
level of understanding of technological and energy market conditions.
21 See, e.g., literature review of empirical studies in Cagno and Trianni 2014.

Commercial Prosumers – Development and Policy Options (RE-COM-PROSUMERS), March 2016
Page 31
Energy projects may also not conform to standard evaluation metrics: for example, energy equipment
provides little collateral due to its limited resale value. PV is no exception: used panels may have limited
resale value and a significant portion of total project costs are non-hardware (i.e. soft costs including
project management, permitting, installation, etc.). Larger firms can overcome these challenges by
creating dedicated funding pools (e.g. revolving energy funds) and transparent processes for obtaining
funding while smaller firms may rely on energy service companies (ESCOs) for energy efficiency and
power purchase agreements (PPAs) for PV projects to avoid the up-front costs.
These solutions, however, may run up against structural challenges and principle-agent problems, for
example when the benefits of energy projects accrue to a different department than the costs. For
example, up-front costs may be paid out of a capital improvements budget but benefits accrue to an
operations and maintenance account. Such “split incentives” can fail to create adequate motivations for
the individuals with decision-making authority or access to financial resources.
The ability in some jurisdictions of PV projects to generate a revenue stream may make these
challenges easier to overcome. Some state policies allow the sale of all or some of the power generated
by renewable energy installations, for example, states with net metering or FIT policies allow sale of
electricity into grid or to other local consumers. This is rarely the case for efficiency projects, except for
some co-generation and CHP projects where there may be local buyers for steam.
Firms are more likely to become significant PV prosumers if renewable energy projects (or portfolios
of projects) meet the firm’s financial performance thresholds; decision-makers rely on sophisticated
financial indicators that consider the full range of PV’s benefits; dedicated internal funding
mechanisms and/or external financing is available; and split incentive problems are overcome or
avoided in project accounting.
2.4.4. Projects & Performance Monitoring
The availability of energy project opportunities is a self-evident prerequisite for implementation.
However, an often overlooked challenge is creating communication channels, incentive structures, and
decision-making processes that lead to deliberate and coordinated monitoring of PV investment
opportunities and collection of the data needed to assess their value. This stage of the process has
historically received less attention in the energy management literature than later stages of options
analysis and financial evaluation.
Compared to energy efficiency technologies, PV technology is relatively homogenous and awareness of
the technology is more widespread. However, as discussed in Section 2.4.1, decision-makers may hold
incorrect or outdated perceptions of cost or feasibility of projects and may be unaware of some of the
market drivers that would make it a viable option. In the absence of an explicit target, incentive
program, or clear directive from management to investigate and pursue renewable energy
opportunities, firms may simply overlook PV opportunities unless key staff take it upon themselves to
identify opportunities (or work with third party vendors) and recommend projects for implementation.

Commercial Prosumers – Development and Policy Options (RE-COM-PROSUMERS), March 2016
Page 32
Company-wide targets, renewable energy programs, or the creation of special subsidiaries, are
among the remedies to problems of opportunity identification. As discussed earlier, suitable sites for
PV can be selected based on relatively simple and readily identifiable characteristics (e.g. location, roof
size and orientation, building ownership) in contrast to efficiency upgrades. Facilities can be screened
and prioritized based on key criteria by staff with responsibility for company-wide energy management
or external service providers, reducing transaction costs and making efficient use of resources to
support the most promising projects first.
Firms are more likely to adopt PV if they take a company-wide approach to project opportunity
identification and analysis in order to generate a pipeline of prioritized projects.
2.4.5. Public Relations
Internal and external recognition can be a significant motivator for organizations to invest in energy
management. External drivers can include pressure from activists, consumers, customers, NGOs,
competitors, and regulators. Triggering events may increase the impetus for action such as during the
energy crisis in 1999 when California businesses and residents made significant investments in energy
efficiency in response to high prices.
Under business-as-usual circumstances the incentives are often to pursue short term, predictable,
conservative measures, if any. However, the strength of reputational drivers depends in large part to
the organization’s position in the value chain (Box 3), with consumer-facing firms (e.g. retailers, brands)
typically having the strongest incentives for action. The innate visibility of onsite PV may also make it
more appealing to decision-makers seeing a public relations benefit as compared to energy efficiency
improvements, which are more likely to be invisible within (and outside) an organization unless they are
effectively communicated.
Internally-focused drivers for energy management can also be significant, again depending in part on
the organization and its sector or industry. These include improved engagement, environmental
awareness, comfort, morale, and productivity of employees.
Identifying and articulating these internal and external engagement drivers can be critical to raising the
strategic value of energy efficiency and renewables, especially in offices and other less energy-intensive
industries where cost savings may not make a significant enough difference to the organization’s bottom
line.
Public and stakeholder engagement considerations are most likely to drive investment in PV among
firms that are in a public-facing industries, environmentally intensive industries, and/or place a high
value on staff engagement and morale. PV adoption is more likely in periods when external factors
have made energy consumption a more high-profile or closely scrutinized aspect of the business.
2.4.6. Best Practices for Addressing Organizational and Behavioural Drivers
Figure 9 below again shows the virtuous cycle framework, but incorporates specific practices (by
corporate function) that could enable onsite energy adoption. Detailed discussion of these practices is
outside the scope of this report. However, it is worth noting that many of these activities are
interdependent and mutually reinforcing; investment in one area can improve an organization’s
effectiveness in others.

Commercial Prosumers – Development and Policy Options (RE-COM-PROSUMERS), March 2016
Page 33
Figure 9 – Best practices for addressing organizational and behavioural drivers
2 . 5 . S TA K E H O L D E R C O N S I D E R AT I O N S
As discussed in Section 1.3.1, another important factor for prosumer emergence is the influence of
other stakeholders. Economic drivers, national conditions, and behavioural drivers will each shape
commercial prosumer decision making. At the same time, however, the perspectives and opinions of
other impacted stakeholder groups will help shape the policy environment in which prosumers operate
by creating either supportive or countervailing political pressure. The impacted stakeholders are similar
to those discussed in RE-PROSUMERS and were previously summarized in Figure 5. Rather than repeat
each of the stakeholder perspectives, this section focuses primarily on the owners of electric system
infrastructure. 22 Specifically, T&D operators and incumbent generators may be most significantly
impacted by widespread prosumer emergence given the larger and more rapid potential scale-up of PV
deployment by commercial prosumers as compared to residential.
2.5.1. Prosumers and Electricity Infrastructure Owners
The regulatory environment for commercial prosumers in many markets may evolve in response to
issues or concerns related to how they impact T&D operators and incumbent electric generators. As
described in RE-PROSUMERS, these challenges are both financial and technical in nature. The financial
concerns include the following:
22 In order to remain terminologically neutral, the RE-PROSUMERS report generically refers to “owners of electric system
infrastructure”, with the understanding that this term refers to owners of generation, transmission, and/or distribution
systems, and includes both regulated and unregulated entities, unless otherwise specified. As shorthand, the term “utilities” is
sometimes used instead.
Commercial Prosumers – Development and Policy Options (RE-COM-PROSUMERS), March 2016
Page 34
Revenue erosion. PV used to serve onsite load reduces retail electricity sales and revenues for the
utility or other retail electricity providers, potentially eroding its profitability. Under cost-of-service
regulation, such revenue erosion may put upward pressure on retail electricity prices as fixed costs are
spread among fewer units of electricity sales, raising concerns about cost-shifting or cross-
subsidization among customer classes.
Wholesale market price suppression. High penetration of renewable electricity can depress electricity
prices in the bulk power market, undermining the financial viability of other generators and
potentially raising longer term concerns about resource adequacy and reliability.
Reduced earnings opportunities. Distributed PV may defer or avoid capital investments in new
generation, transmission, and distribution system infrastructure, eliminating earnings opportunities
for developers and owners of those assets.
The extent and severity of these issues varies between commercial and residential prosumers, reflecting
some of the key differences highlighted earlier in Section 2.1. For example, many commercial customers
take service under retail electricity tariffs with significant demand-based charges. Onsite PV is generally
less effective at reducing demand charges than volumetric charges, and in some utility systems, utility
revenue erosion may be less significant for commercial prosumers, depending on the relative level of
PV penetration and the proportion of demand charges in the consumer’s overall bill. In rate structures
with large demand charges, there is often more alignment between utility revenue and cost impacts,
reducing revenue losses relative to rates with predominately volumetric charges, potentially easing
concerns about impacts to utility-shareholder returns and about upward pressure on retail electricity
prices. Concerns about cost-shifting may therefore be less acute in the case of commercial prosumers,
and also potentially less politically charged, as unlike residential PV, no wealth disparity is presumed to
exist between commercial customers with solar and those without.
In addition, commercial customer load profiles often coincide better with PV generation profiles than do
residential load profiles. To the extent that commercial customers tend to be co-located on common
distribution feeders, commercial customer PV may therefore be more effective at reducing peak
demand growth on the circuit and deferring distribution system upgrades driven by load growth. On
the one hand, this would tend to further enhance the value of commercial PV from the perspective of
other users of the electricity network, offsetting any adverse impacts associated with revenue erosion
and fixed cost recovery. On the other hand, it may further exacerbate utility shareholders concerns
about reduced earnings opportunities associated with deferred distribution system investments. T&D
operator incumbents in liberalized markets, which generate earnings primarily through investments in
the distribution network, may therefore be particularly sensitive to high rates of commercial prosumer
growth.
A further factor that has raised particular concern in markets such as France is the impact on the grid of
a sudden emergence of commercial prosumers. Some stakeholders in France, for example, expressed
concerns over the potential negative impacts of sudden peaks of injection or of withdrawal from the
network, particularly due to shifting patterns of cloud cover that the utility may not be able to model or
predict effectively.
Among other implications, this has generated concerns about policies that encourage prosumers to
export to the grid, partly on the grounds that such polices do not stimulate prosumers to mitigate peaks
of injection and withdrawal. In response, France has begun to develop new incentive systems tailored
specifically to PV prosumers to encourage them to better manage their overall electricity generation
and consumption onsite (see Section 3.3).
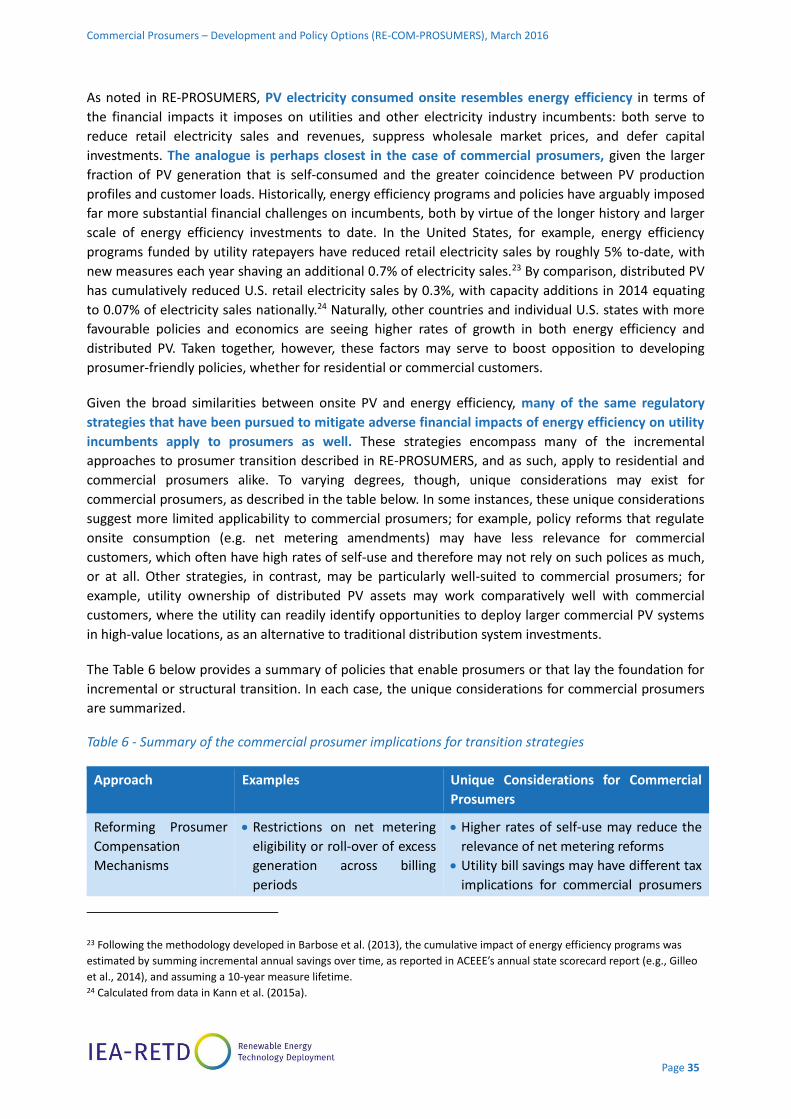
Commercial Prosumers – Development and Policy Options (RE-COM-PROSUMERS), March 2016
Page 35
As noted in RE-PROSUMERS, PV electricity consumed onsite resembles energy efficiency in terms of
the financial impacts it imposes on utilities and other electricity industry incumbents: both serve to
reduce retail electricity sales and revenues, suppress wholesale market prices, and defer capital
investments. The analogue is perhaps closest in the case of commercial prosumers, given the larger
fraction of PV generation that is self-consumed and the greater coincidence between PV production
profiles and customer loads. Historically, energy efficiency programs and policies have arguably imposed
far more substantial financial challenges on incumbents, both by virtue of the longer history and larger
scale of energy efficiency investments to date. In the United States, for example, energy efficiency
programs funded by utility ratepayers have reduced retail electricity sales by roughly 5% to-date, with
new measures each year shaving an additional 0.7% of electricity sales.23 By comparison, distributed PV
has cumulatively reduced U.S. retail electricity sales by 0.3%, with capacity additions in 2014 equating
to 0.07% of electricity sales nationally.24 Naturally, other countries and individual U.S. states with more
favourable policies and economics are seeing higher rates of growth in both energy efficiency and
distributed PV. Taken together, however, these factors may serve to boost opposition to developing
prosumer-friendly policies, whether for residential or commercial customers.
Given the broad similarities between onsite PV and energy efficiency, many of the same regulatory
strategies that have been pursued to mitigate adverse financial impacts of energy efficiency on utility
incumbents apply to prosumers as well. These strategies encompass many of the incremental
approaches to prosumer transition described in RE-PROSUMERS, and as such, apply to residential and
commercial prosumers alike. To varying degrees, though, unique considerations may exist for
commercial prosumers, as described in the table below. In some instances, these unique considerations
suggest more limited applicability to commercial prosumers; for example, policy reforms that regulate
onsite consumption (e.g. net metering amendments) may have less relevance for commercial
customers, which often have high rates of self-use and therefore may not rely on such polices as much,
or at all. Other strategies, in contrast, may be particularly well-suited to commercial prosumers; for
example, utility ownership of distributed PV assets may work comparatively well with commercial
customers, where the utility can readily identify opportunities to deploy larger commercial PV systems
in high-value locations, as an alternative to traditional distribution system investments.
The Table 6 below provides a summary of policies that enable prosumers or that lay the foundation for
incremental or structural transition. In each case, the unique considerations for commercial prosumers
are summarized.
Table 6 - Summary of the commercial prosumer implications for transition strategies
Approach Examples Unique Considerations for Commercial
Prosumers
Reforming Prosumer
Compensation
Mechanisms
Restrictions on net metering
eligibility or roll-over of excess
generation across billing
periods
Higher rates of self-use may reduce the
relevance of net metering reforms
Utility bill savings may have different tax
implications for commercial prosumers
23 Following the methodology developed in Barbose et al. (2013), the cumulative impact of energy efficiency programs was
estimated by summing incremental annual savings over time, as reported in ACEEE’s annual state scorecard report (e.g., Gilleo
et al., 2014), and assuming a 10-year measure lifetime. 24 Calculated from data in Kann et al. (2015a).
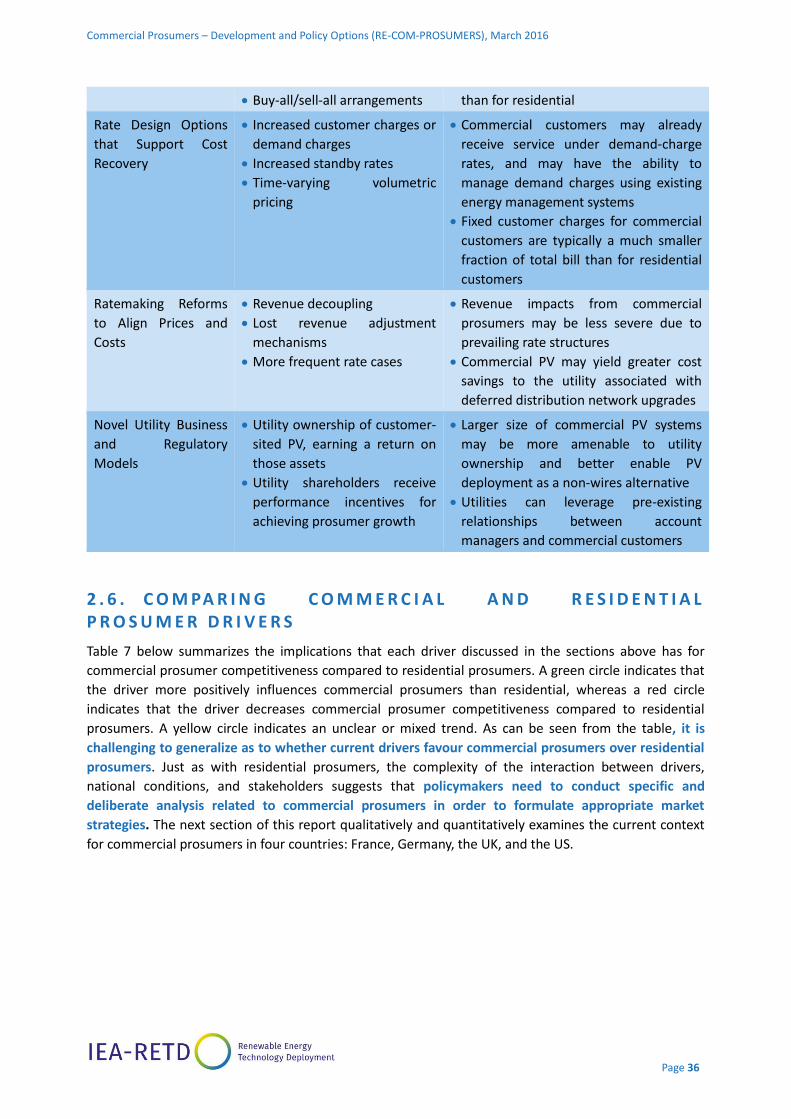
Commercial Prosumers – Development and Policy Options (RE-COM-PROSUMERS), March 2016
Page 36
Buy-all/sell-all arrangements than for residential
Rate Design Options
that Support Cost
Recovery
Increased customer charges or
demand charges
Increased standby rates
Time-varying volumetric
pricing
Commercial customers may already
receive service under demand-charge
rates, and may have the ability to
manage demand charges using existing
energy management systems
Fixed customer charges for commercial
customers are typically a much smaller
fraction of total bill than for residential
customers
Ratemaking Reforms
to Align Prices and
Costs
Revenue decoupling
Lost revenue adjustment
mechanisms
More frequent rate cases
Revenue impacts from commercial
prosumers may be less severe due to
prevailing rate structures
Commercial PV may yield greater cost
savings to the utility associated with
deferred distribution network upgrades
Novel Utility Business
and Regulatory
Models
Utility ownership of customer-
sited PV, earning a return on
those assets
Utility shareholders receive
performance incentives for
achieving prosumer growth
Larger size of commercial PV systems
may be more amenable to utility
ownership and better enable PV
deployment as a non-wires alternative
Utilities can leverage pre-existing
relationships between account
managers and commercial customers
2 . 6 . C O M PA R I N G C O M M E R C I A L A N D R E S I D E N T I A L P R O S U M E R D R I V E R S
Table 7 below summarizes the implications that each driver discussed in the sections above has for
commercial prosumer competitiveness compared to residential prosumers. A green circle indicates that
the driver more positively influences commercial prosumers than residential, whereas a red circle
indicates that the driver decreases commercial prosumer competitiveness compared to residential
prosumers. A yellow circle indicates an unclear or mixed trend. As can be seen from the table, it is
challenging to generalize as to whether current drivers favour commercial prosumers over residential
prosumers. Just as with residential prosumers, the complexity of the interaction between drivers,
national conditions, and stakeholders suggests that policymakers need to conduct specific and
deliberate analysis related to commercial prosumers in order to formulate appropriate market
strategies. The next section of this report qualitatively and quantitatively examines the current context
for commercial prosumers in four countries: France, Germany, the UK, and the US.

Commercial Prosumers – Development and Policy Options (RE-COM-PROSUMERS), March 2016
Page 37
Table 7 - Summary of commercial vs. residential prosumer competitiveness
Legend Description Comparison of Commercial Prosumer Competitiveness to Residential
PV system costs
PV installed costs are lower
Electricity prices and rate structure
Retail electricity rates tend to be lower (in OECD countries)
Rate structures have a higher percentage of fixed charges (e.g. demand charges)
Onsite demand and self-use ratio
Commercial buildings are able to achieve higher self-use ratios because their available rooftop area is small compared to their overall load and/or because they can optimize their systems size downward to serve their minimum daylight demand without a significant economy of scale penalty.
In many cases, peak demand of commercial buildings matches peak PV production time, which contributes to the higher self-use ratio compared to residential prosumers
Behavioural drivers
Commercial return on investment requirements are higher than residential
Commercial decision making processes are complex and may either enable or constrain PV adoption
Technology drivers
In jurisdictions with high demand charges, PV and battery systems configured to shave peak can improve the economic case for commercial prosumers.
National conditions
There is significant commercial roof space available for PV development
The share of owner-occupied space in the commercial sector is lower than in the residential sector
T&D operators
Both residential and commercial prosumers may pose challenges to incumbent owners of electricity infrastructure, although commercial PV may have a lower negative impact while at the same time creating new opportunities for utility business models.
Incumbent generators
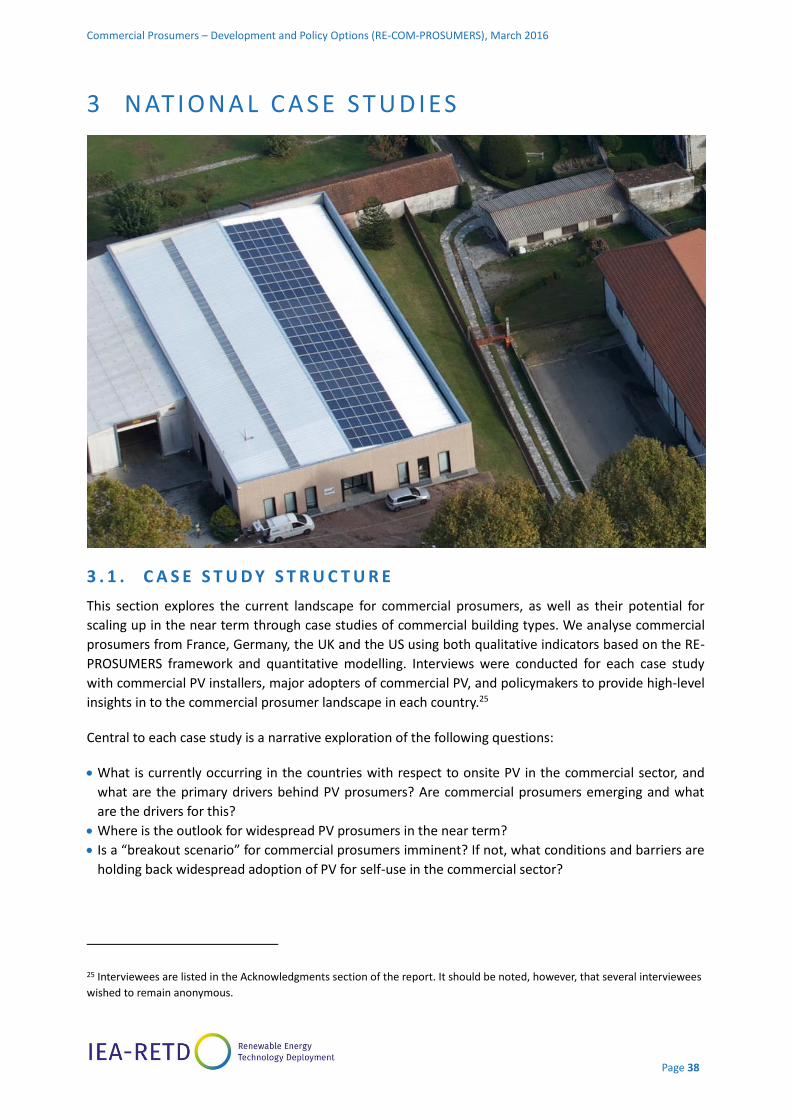
Commercial Prosumers – Development and Policy Options (RE-COM-PROSUMERS), March 2016
Page 38
3 N AT I O N A L C A S E S T U D IES
3 . 1 . C A S E S T U D Y S T R U C T U R E
This section explores the current landscape for commercial prosumers, as well as their potential for
scaling up in the near term through case studies of commercial building types. We analyse commercial
prosumers from France, Germany, the UK and the US using both qualitative indicators based on the RE-
PROSUMERS framework and quantitative modelling. Interviews were conducted for each case study
with commercial PV installers, major adopters of commercial PV, and policymakers to provide high-level
insights in to the commercial prosumer landscape in each country.25
Central to each case study is a narrative exploration of the following questions:
What is currently occurring in the countries with respect to onsite PV in the commercial sector, and
what are the primary drivers behind PV prosumers? Are commercial prosumers emerging and what
are the drivers for this?
Where is the outlook for widespread PV prosumers in the near term?
Is a “breakout scenario” for commercial prosumers imminent? If not, what conditions and barriers are
holding back widespread adoption of PV for self-use in the commercial sector?
25 Interviewees are listed in the Acknowledgments section of the report. It should be noted, however, that several interviewees
wished to remain anonymous.
Commercial Prosumers – Development and Policy Options (RE-COM-PROSUMERS), March 2016
Page 39
The case studies are structured in two parts:
The first part of the case study contains an overall snapshot of PV and commercial prosumer market in
the country as a whole. The snapshot includes general information on, e.g., economic drivers, national
conditions, and enabling policies at the national level.
The second part of the case study contains an analysis of a specific commercial building type, focusing
on whether that building is likely to become a prosumer under a range of different scenarios. The
methodology for how the building types for each country were selected is described in the next
section.
3 . 2 . C A S E S T U D Y M E T H O D O L O G Y
The case studies contained in this section are designed to determine whether or not commercial
prosumers are emerging in specific countries. In order to do this, building types were screened to
determine which ones had strong potential to emerge as prosumers. The criteria utilized included, for
example:
Good available roof space, i.e. roofs that are flat with minimal mechanical systems, and that are large
enough so that PV system size can be reduced downward (if necessary) to better match minimum
daily demand without encountering significant diseconomies of scale.
Relatively steady and large daily load profiles throughout the week and year
Common building type within the country
Available data from either public or private sources
As discussed in Section 2, commercial buildings types can be characterized by, e.g., physical qualities of
the building (e.g. available roof space), building energy use profile, building ownership strategies, and
occupancy patterns. Appendix B contains quantitative examples of how PV output matches the generic
load profiles of different building types. The primary goal of this study, however, is not to analyse which
building types would emerge as prosumers under which conditions. The main body of this study
focuses intentionally on building types that would be most likely to emerge as prosumers. If these
buildings are not likely to emerge as prosumers, then it can be concluded that building types with less
ideal conditions will also not emerge as prosumers. In other words, if the economics do not work for a
building that is open seven days a week, they will also likely not work for a building that is only open five
days per week.
In each country, retail buildings (i.e. “big box stores”) or supermarkets were selected for analysis
because of their load shapes that align well with PV generation, consistent weekly demand year-
round, and likelihood that the building is owned or has a long lease.26 These types of buildings are also
prevalent in each of the countries surveyed. In the EU, for example, roughly 28% of all floor space is
retail or wholesale space (Economidou et al., 2011).
26 Based on interviews with solar installation companies and policymakers and additional research (AREF, 2014; Callanan &
Thesing, 2014; Melville, 2015).
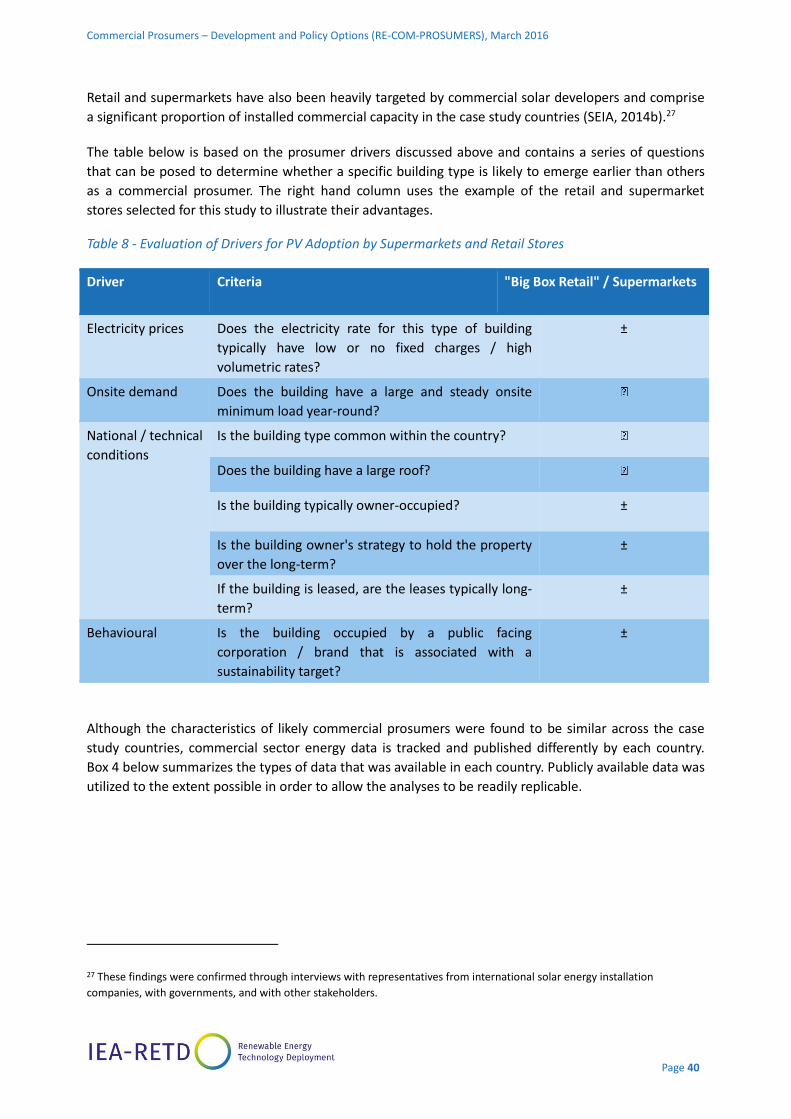
Commercial Prosumers – Development and Policy Options (RE-COM-PROSUMERS), March 2016
Page 40
Retail and supermarkets have also been heavily targeted by commercial solar developers and comprise
a significant proportion of installed commercial capacity in the case study countries (SEIA, 2014b).27
The table below is based on the prosumer drivers discussed above and contains a series of questions
that can be posed to determine whether a specific building type is likely to emerge earlier than others
as a commercial prosumer. The right hand column uses the example of the retail and supermarket
stores selected for this study to illustrate their advantages.
Table 8 - Evaluation of Drivers for PV Adoption by Supermarkets and Retail Stores
Driver Criteria "Big Box Retail" / Supermarkets
Electricity prices Does the electricity rate for this type of building
typically have low or no fixed charges / high
volumetric rates?
±
Onsite demand Does the building have a large and steady onsite
minimum load year-round?
National / technical
conditions
Is the building type common within the country?
Does the building have a large roof?
Is the building typically owner-occupied? ±
Is the building owner's strategy to hold the property
over the long-term?
±
If the building is leased, are the leases typically long-
term?
±
Behavioural Is the building occupied by a public facing
corporation / brand that is associated with a
sustainability target?
±
Although the characteristics of likely commercial prosumers were found to be similar across the case
study countries, commercial sector energy data is tracked and published differently by each country.
Box 4 below summarizes the types of data that was available in each country. Publicly available data was
utilized to the extent possible in order to allow the analyses to be readily replicable.
27 These findings were confirmed through interviews with representatives from international solar energy installation
companies, with governments, and with other stakeholders.
Commercial Prosumers – Development and Policy Options (RE-COM-PROSUMERS), March 2016
Page 41
28 Debate is ongoing in Germany regarding the adjustment of these Standard Load Profiles, as demand patterns have changed
since the creation of these load profiles before the Energiewende. Actors like the Bundesnetzagentur (Federal Network Agency)
also suggest making these load profiles more flexible with greater ranges of daily variation in load profile in order to account
for the increasing shares of variable wind and solar PV and the changing consumption patterns of the growing number of
prosumers (Stratmann, 2015).
Box 4. Commercial building types and load profiles
The definition of “commercial” building differs from country to country, as does the categorization of
specific types of commercial buildings (Economidou et al., 2011). Some countries may gather data on
specific types of retail buildings depending on their primary activity, whereas other countries will track
data at a less granular level (e.g. grouping buildings under the common heading of “retail”). This
variation extends to how countries track and publish energy data. Some countries publish generic load
profile data according to building activity, whereas other countries publish only generic building energy
consumption and usage patterns that are not linked to specific building types. This Box summarizes the
energy data available for the case study countries.
France. Generic building load profiles are not publicly available in France. Actual annual energy usage
data from a supermarket was used for the French case study (Section 3.3).
Germany. Eight standard load profiles are publicly available.28 These generic load profiles provide 15-
minute energy usage data for each building class for typical weekdays, Saturdays, and Sundays in each
of three seasons (listed in Appendix A – Commercial Building Types). The German case study (Section
3.4) uses the G4 load profile.
United Kingdom. Building types in the UK are categorized by their activities as defined in the Standard
Industrial Classification (SIC) of Economic Activities, most recently revised in 2007 (UK ONS, 2009). The
definition of commercial buildings used by the Department of Energy & Climate Change (DECC) in the
annual Digest of United Kingdom Energy Statistics (DUKES) is based on the SIC categorizations (UK
DECC, 2015a). Similar to Germany, Ofgem uses eight different Profile Classes in electricity market
settlement, defined loosely by industry (also including domestic buildings), as well as by peak load
factor. These generic building load profiles provide half-hourly energy usage data for each Profile Class
for a typical weekday, Saturday, and Sunday in each of five seasons (listed in Appendix A – Commercial
Building Types). The UK case study (Section 3.5) uses load Profile Class 7.
United States. The U.S. Energy Information Administration conducts the Commercial Buildings Energy
Consumption Survey (CBECS), a national sample survey that collects information on the U.S.
commercial building stock, including energy-related physical characteristics and usage data, as well as
other physical and non-physical characteristics. The 14 building types are categorized by principal
activity rather than by any physical or energy-related characteristics (US EIA, 2015a). The U.S.
Department of Energy has created a set of commercial reference building models. The 16 building
types are categorized by physical characteristics and represent 70% of the commercial buildings in the
U.S. (Deru et al., 2011). Theoretical hourly load profiles for each building model for an entire year are
available for hundreds of locations across the U.S. The differences in building type categorization
between the CBECS and DOE Reference Models are significant (e.g. multifamily buildings are
considered commercial buildings in DOE and not in CBECS, CBECs building types include public
buildings) and are detailed in Appendix A – Commercial Building Types . The U.S. case study (Section
3.6) uses the DOE Reference Model for “stand-alone retail.”
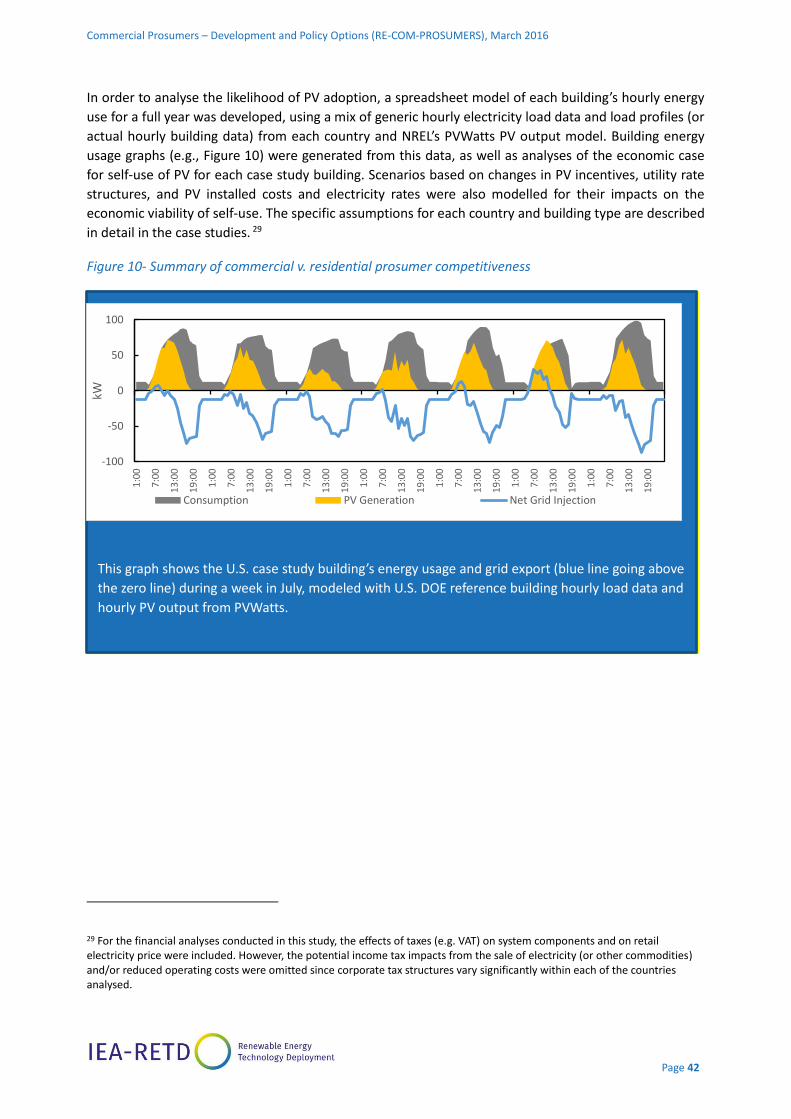
Commercial Prosumers – Development and Policy Options (RE-COM-PROSUMERS), March 2016
Page 42
In order to analyse the likelihood of PV adoption, a spreadsheet model of each building’s hourly energy
use for a full year was developed, using a mix of generic hourly electricity load data and load profiles (or
actual hourly building data) from each country and NREL’s PVWatts PV output model. Building energy
usage graphs (e.g., Figure 10) were generated from this data, as well as analyses of the economic case
for self-use of PV for each case study building. Scenarios based on changes in PV incentives, utility rate
structures, and PV installed costs and electricity rates were also modelled for their impacts on the
economic viability of self-use. The specific assumptions for each country and building type are described
in detail in the case studies. 29
Figure 10- Summary of commercial v. residential prosumer competitiveness
29 For the financial analyses conducted in this study, the effects of taxes (e.g. VAT) on system components and on retail electricity price were included. However, the potential income tax impacts from the sale of electricity (or other commodities) and/or reduced operating costs were omitted since corporate tax structures vary significantly within each of the countries analysed.
This graph shows the U.S. case study building’s energy usage and grid export (blue line going above
the zero line) during a week in July, modeled with U.S. DOE reference building hourly load data and
hourly PV output from PVWatts.
-100
-50
0
50
100
1:0
0
7:0
0
13
:00
19
:00
1:0
0
7:0
0
13
:00
19
:00
1:0
0
7:0
0
13
:00
19
:00
1:0
0
7:0
0
13
:00
19
:00
1:0
0
7:0
0
13
:00
19
:00
1:0
0
7:0
0
13
:00
19
:00
1:0
0
7:0
0
13
:00
19
:00
kW
Consumption PV Generation Net Grid Injection

Commercial Prosumers – Development and Policy Options (RE-COM-PROSUMERS), March 2016
Page 43
3 . 3 . F R A N C E
National Snapshot
5.6 GW of total capacity was installed in France as of end-2014, of which roughly 29% (1.6 GW) was
installed within the commercial size bracket 100 – 250kW (MEDDE, 2015a).
The PV market in France is growing rapidly, with 927 MW installed in 2014, an increase of 45% from
2013 (MEDDE, 2015a).
5.9 TWh was generated by all PV in 2014 (27% increase from 2013), accounting for 1.3% of total
electricity consumed in France in 2014 (RTE, 2015b).
Due to low commercial electricity rates, the commercial solar PV market is primarily driven by the
feed-in tariff offered for systems sized from 36 kW-100 kW or the simplified auction process for
systems from 100 kW-250kW rather than by self-use.
France’s solar PV market lagged behind those of
neighbouring Germany in previous years. After a
couple years of declining growth, the market
accelerated again in 2014, registering 927 MW of
new PV capacity.
3.3.1. Economic Drivers
PV System Costs. The average installed cost of a 100 kW-250 kW system ranged from €1.80 –
€2.00/Wdc in 2013, while ground mounted systems of 2 MW or larger were as low as €1.40/Wdc
(ADEME, 2014).
Retail electricity rates. Commercial retail electricity rates are relatively low in France relative to other
countries in the EU with average rates ranging from €0.10/kWh to €0.11/kWh in 2014 with taxes—
25% lower than the EU average (MEDDE, 2014a). This notwithstanding, commercial electricity rates
have increased at a rate of between 2% and 6% per year since 2008 (CRE, 2014) and are projected to
rise further starting January 2016, as commercial tariffs will no longer be strictly regulated as they
have been in the past (see below).
Figure 11. Installed capacity (MW) by project size
(MEDDE, 2015a)
1,323
1,588
2,381
PV ProjectsConnected<36kVA
PV ProjectsConnected 36 -250kVA
PV ProjectsConnected>250kVA
Commercial Prosumers – Development and Policy Options (RE-COM-PROSUMERS), March 2016
Page 44
France’s electricity system is dominated by EDF which owns and operates over 90% of total generation
in continental France. EDF Énergies Nouvelles, which is responsible for the group’s activities in the
renewable energy industry (MEDDE, 2015b). RTE operates the high voltage transmission system, while
ERDF operates the low and medium voltage system. However, legislation at the European level has
sought to increase competition within Member States’ electricity markets in recent years, which has led
to a series of moves to further open the market to new actors (Directive 2009/72/EC).
Insolation. Average daily insolation (GHI) ranges from 4.82 kWh/m2/day in the southern part of the
country to 3.22 kWh/m2/day in the north (CESC, 2015). Capacity factors average 14% across the
country (RTE, 2015b).
3.3.2. National Conditions
Roof space. The total rooftop space suitable for PV in France is estimated at 300 km2 (ADEME, 2011).
Based on this available rooftop potential, ADEME has estimated the total technical rooftop PV
potential at 120 GW (ADEME 2015), of which approximately 10-15% would represent commercial
rooftop space.
National electricity demand. Annual electricity demand is projected in the national transmission
operator’s reference scenario to grow by 0.3% annually from 2013-2019. Annual growth in winter
peak demand is projected to also grow by 0.3% annually from 2013-2019 (RTE, 2015a).
3.3.3. Enabling and constraining policies
National incentives. France has different feed-in policies based on the PV system size. Systems under
100 kW can access a feed-in tariff, which in Q2 2015 paid 13,95 € cents/kWh for roof-mounted
systems up to 36 kW and 13,25 € cents/kWh for systems between 36 kW and 100 kW. For systems
between 100 and 500 kW, France has developed a competitive tendering system.
Consequently, commercial-scale rooftop systems between 100 kW and 250 kW can participate in a
simplified auction scheme. This procurement mechanism consists of a call for tenders put out by the
government three times per year with a clearly defined set of pre-qualification requirements. The
average price of the winning bid in this size category was just over 15 € cents/kWh in late 2014
(MEDDE, 2015c).
Weak economies on self-use. The economic case for self-use remains weak, as the simplified auction
scheme and feed-in incentive have historically provided higher payments per kWh than the avoided
commercial tariffs. As a result, commercial customers wishing to consume their own power onsite
have opted to remain behind the meter and to size their systems to ensure that all PV output can be
consumed directly onsite.
Regulated electricity tariffs. Until recently, all commercial tariffs have been regulated by the
government on an annual basis. As of 1 January 2016, all commercial customers (defined as electricity
customers who are connected at a voltage level between 36kVA and 250kVA) will be required to move
to a new market-based tariff.
Calls for Proposals for pilot projects. Various regional offices of ADEME have begun to issue calls for
proposals to solicit bids for commercial-scale PV projects configured for self-use, while offering
winning projects with limited subsidies. One such offer for Poitou-Charentes, a region in western
France, issued a tender in late 2014 that provided a subsidy of up to €0.40/Wdc of installed capacity,
up to a total amount of €50,000 (or a project size of 125kW).
Commercial Prosumers – Development and Policy Options (RE-COM-PROSUMERS), March 2016
Page 45
Winning proponents were able to benefit from support for feasibility studies of up to 70% of feasibility
costs, capped at €7,000 per project. The criteria for participating in the bid included that projects had
to be between 10kW and 250kW in size, they had to consume more than 50% of the PV system’s total
output (minimum self-use ratio), and the system’s output had to represent 10% or more of the
company’s total electricity consumption in a given year (minimum self-coverage ratio) (ADEME Poitou-
Charentes, 2015). A number of other regions of France have launched similar calls for tender, mostly
across southern France, in order to develop a set of commercial prosumer pilot projects.
Recognizing the need for adjustments to the current policy and regulatory framework for prosumers,
the Direction générale de l’énergie et du climat (DGEC), has established a Working Group and launched
a series of stakeholder discussions in an attempt to develop a suitable framework for self-use that
would encompass both residential and commercial prosumers. Despite publishing a landmark report on
the topic of prosumers in December 2014 (MEDDE, 2014b), it remains unclear what the final framework
for prosumers will be as the rules that will eventually apply to the sector are still being actively debated.
The continued availability and commercial attractiveness of both the FIT and the simplified auction for
PV development, both of which provide for a higher return on investment than self-use under current
market conditions, means that commercial customers are likely to continue to choose the full export
option for now.
Under current market conditions, one or a combination of the following factors is likely to be required
before France sees a substantial scale-up in commercial-scale, prosumer-driven PV: 1) further decline
in solar PV prices and installed costs (e.g. via soft cost reduction), 2) significant improvements in
demand side management, including demand response, 3) a considerable drop in battery prices to
improve energy management and reduce reliance on the grid, 4) a sustained increase in commercial
electricity tariffs, or 5) the introduction of new rules to encourage and better govern the emergence of
prosumers, such as a premium tariff for excess electricity exported to the grid. For the time being, a
significant scale-up of commercial prosumers appears to be a few years off.
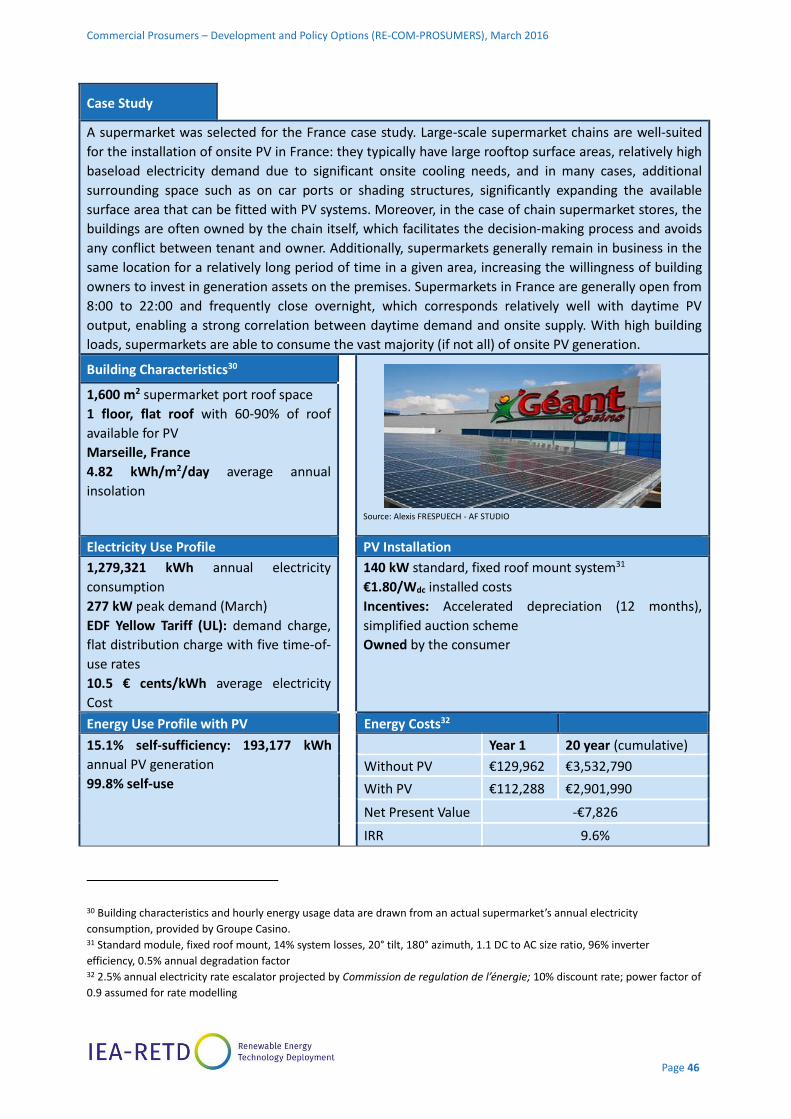
Commercial Prosumers – Development and Policy Options (RE-COM-PROSUMERS), March 2016
Page 46
30 Building characteristics and hourly energy usage data are drawn from an actual supermarket’s annual electricity
consumption, provided by Groupe Casino. 31 Standard module, fixed roof mount, 14% system losses, 20° tilt, 180° azimuth, 1.1 DC to AC size ratio, 96% inverter
efficiency, 0.5% annual degradation factor 32 2.5% annual electricity rate escalator projected by Commission de regulation de l’énergie; 10% discount rate; power factor of
0.9 assumed for rate modelling
Case Study
A supermarket was selected for the France case study. Large-scale supermarket chains are well-suited
for the installation of onsite PV in France: they typically have large rooftop surface areas, relatively high
baseload electricity demand due to significant onsite cooling needs, and in many cases, additional
surrounding space such as on car ports or shading structures, significantly expanding the available
surface area that can be fitted with PV systems. Moreover, in the case of chain supermarket stores, the
buildings are often owned by the chain itself, which facilitates the decision-making process and avoids
any conflict between tenant and owner. Additionally, supermarkets generally remain in business in the
same location for a relatively long period of time in a given area, increasing the willingness of building
owners to invest in generation assets on the premises. Supermarkets in France are generally open from
8:00 to 22:00 and frequently close overnight, which corresponds relatively well with daytime PV
output, enabling a strong correlation between daytime demand and onsite supply. With high building
loads, supermarkets are able to consume the vast majority (if not all) of onsite PV generation.
Building Characteristics30
Source: Alexis FRESPUECH - AF STUDIO
1,600 m2 supermarket port roof space
1 floor, flat roof with 60-90% of roof
available for PV
Marseille, France
4.82 kWh/m2/day average annual
insolation
Electricity Use Profile PV Installation
1,279,321 kWh annual electricity
consumption
277 kW peak demand (March)
EDF Yellow Tariff (UL): demand charge,
flat distribution charge with five time-of-
use rates
10.5 € cents/kWh average electricity
Cost
140 kW standard, fixed roof mount system31
€1.80/Wdc installed costs
Incentives: Accelerated depreciation (12 months),
simplified auction scheme
Owned by the consumer
Energy Use Profile with PV Energy Costs32
15.1% self-sufficiency: 193,177 kWh
annual PV generation
99.8% self-use
Year 1 20 year (cumulative)
Without PV €129,962 €3,532,790
With PV €112,288 €2,901,990
Net Present Value -€7,826
IRR 9.6%

Commercial Prosumers – Development and Policy Options (RE-COM-PROSUMERS), March 2016
Page 47
3.3.4. Economic Drivers
PV System Costs. PV system costs are estimated at the lower end of the average price range for 100
kW-250 kW systems from 2013 (i.e. €1.80/Wdc) (ADEME, 2014).
Retail electricity rates. In addition to the fixed connection charge (€/kVA), taxes and fees are also
included in the fixed commercial rate components such as the contribution to distribution charge
(CTA) and VAT (TVA). Reducing per-kWh consumption will not reduce the fees included in these fixed
components of the commercial rate. As of 2015, commercial electricity customers located in mainland
France with a grid tie between 42kVA and 240kVA have two options: the base tariff (the ‘yellow tariff’,
see Table 9) and a new option (which is currently being phased in) that will be based on market prices
(Pinon, 2015). The supermarket selected for the case study operates in EDF’s territory where it uses
the “Utilisation Longues” version of the Yellow Tariff.
Table 9 - EDF Commercial Rate Structures until end of 2015
Source: Tarifs réglementés 2015, http://www.tarifsreglementes.com/tarifs-reglementes/electricite/jaune
The costs of commercial electricity supply in France are broken down into roughly 37% generation costs
(representing the tariff above), 33% distribution costs, and 30% taxes and fees.A new market-based rate
has replaced the above tariff at the end of 2015, though it is currently unclear how generation charges
will change in a deregulated market.
The latest forecast from the national regulator (CRE) anticipates rate increases of 2.5% per year for
commercial customers.
EDF Commercial Rate Structures until end of 2015
Rate Type Description
Tariff Structure and Pricing
Fixed
Componen
t
(€/kVA)
Winter Summer
Peak
(€ ¢/kWh)
Full
(€ ¢/kWh)
Off-Peak
(€ ¢/kWh)
Peak
(€ ¢/kWh)
Off-Peak (€
¢/kWh)
Base Tariff
(‘Yellow
Tariff’)
Utilisations
Longues
(UL)
Includes both
generation and
distribution charges in
a bundled tariff order,
regulated by the
government
UL intended for
customers using >2000
hours/year at
subscribed max power
38.64 9.295 9.295 6.692 4.871 3.365
Utilisations
Moyennes
(UM)
35.28 9.696 6.956 6.956 4.883 3.378
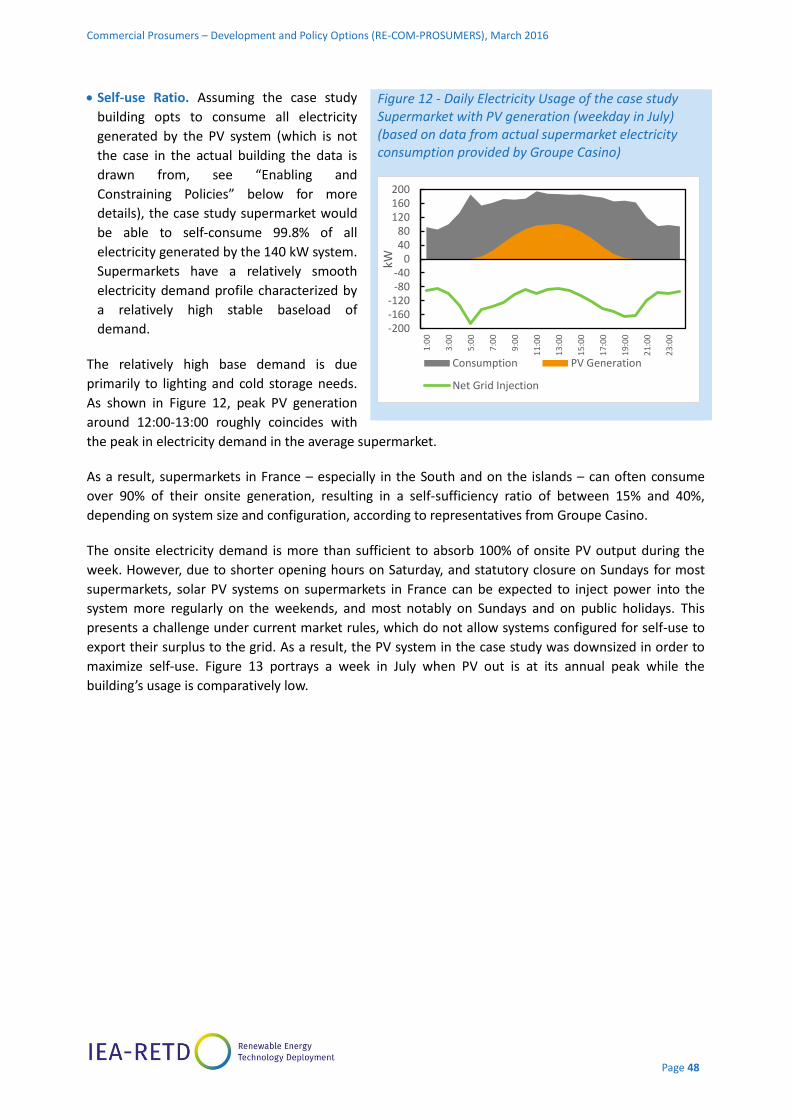
Commercial Prosumers – Development and Policy Options (RE-COM-PROSUMERS), March 2016
Page 48
Self-use Ratio. Assuming the case study
building opts to consume all electricity
generated by the PV system (which is not
the case in the actual building the data is
drawn from, see “Enabling and
Constraining Policies” below for more
details), the case study supermarket would
be able to self-consume 99.8% of all
electricity generated by the 140 kW system.
Supermarkets have a relatively smooth
electricity demand profile characterized by
a relatively high stable baseload of
demand.
The relatively high base demand is due
primarily to lighting and cold storage needs.
As shown in Figure 12, peak PV generation
around 12:00-13:00 roughly coincides with
the peak in electricity demand in the average supermarket.
As a result, supermarkets in France – especially in the South and on the islands – can often consume
over 90% of their onsite generation, resulting in a self-sufficiency ratio of between 15% and 40%,
depending on system size and configuration, according to representatives from Groupe Casino.
The onsite electricity demand is more than sufficient to absorb 100% of onsite PV output during the
week. However, due to shorter opening hours on Saturday, and statutory closure on Sundays for most
supermarkets, solar PV systems on supermarkets in France can be expected to inject power into the
system more regularly on the weekends, and most notably on Sundays and on public holidays. This
presents a challenge under current market rules, which do not allow systems configured for self-use to
export their surplus to the grid. As a result, the PV system in the case study was downsized in order to
maximize self-use. Figure 13 portrays a week in July when PV out is at its annual peak while the
building’s usage is comparatively low.
Figure 12 - Daily Electricity Usage of the case study Supermarket with PV generation (weekday in July) (based on data from actual supermarket electricity consumption provided by Groupe Casino)
-200-160-120
-80-40
04080
120160200
1:0
0
3:0
0
5:0
0
7:0
0
9:0
0
11
:00
13
:00
15
:00
17
:00
19
:00
21
:00
23
:00
kW
Consumption PV Generation
Net Grid Injection
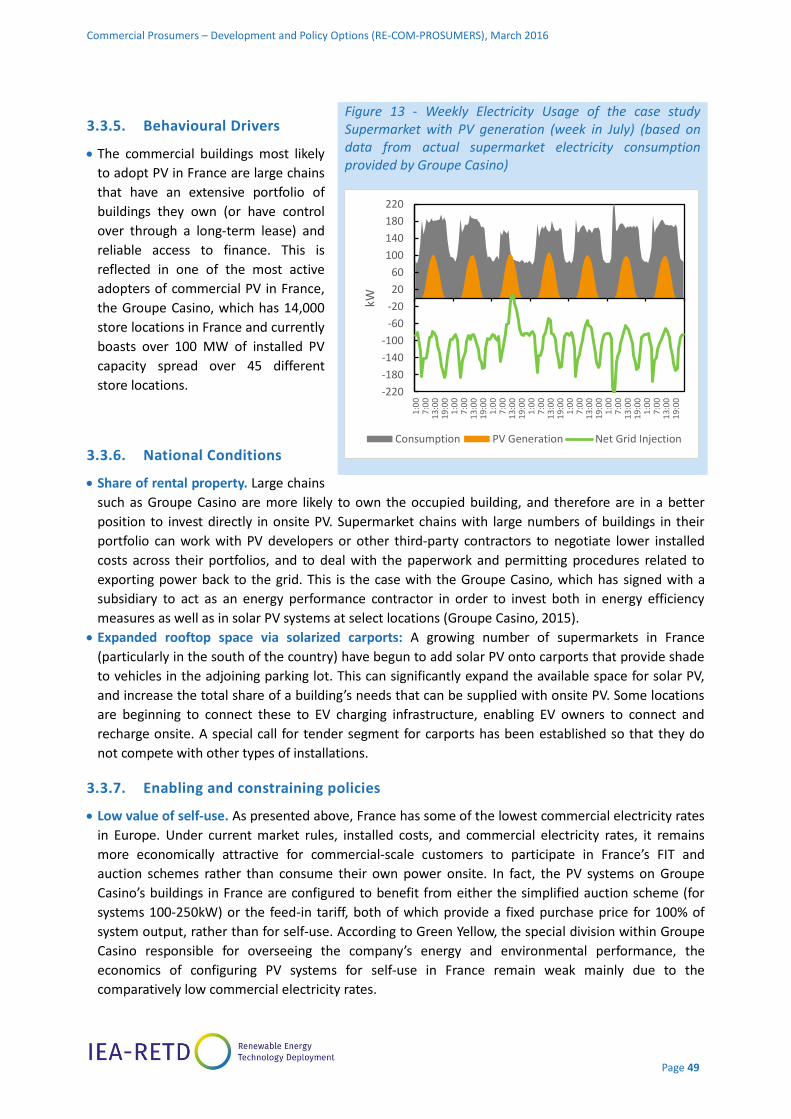
Commercial Prosumers – Development and Policy Options (RE-COM-PROSUMERS), March 2016
Page 49
3.3.5. Behavioural Drivers
The commercial buildings most likely
to adopt PV in France are large chains
that have an extensive portfolio of
buildings they own (or have control
over through a long-term lease) and
reliable access to finance. This is
reflected in one of the most active
adopters of commercial PV in France,
the Groupe Casino, which has 14,000
store locations in France and currently
boasts over 100 MW of installed PV
capacity spread over 45 different
store locations.
3.3.6. National Conditions
Share of rental property. Large chains
such as Groupe Casino are more likely to own the occupied building, and therefore are in a better
position to invest directly in onsite PV. Supermarket chains with large numbers of buildings in their
portfolio can work with PV developers or other third-party contractors to negotiate lower installed
costs across their portfolios, and to deal with the paperwork and permitting procedures related to
exporting power back to the grid. This is the case with the Groupe Casino, which has signed with a
subsidiary to act as an energy performance contractor in order to invest both in energy efficiency
measures as well as in solar PV systems at select locations (Groupe Casino, 2015).
Expanded rooftop space via solarized carports: A growing number of supermarkets in France
(particularly in the south of the country) have begun to add solar PV onto carports that provide shade
to vehicles in the adjoining parking lot. This can significantly expand the available space for solar PV,
and increase the total share of a building’s needs that can be supplied with onsite PV. Some locations
are beginning to connect these to EV charging infrastructure, enabling EV owners to connect and
recharge onsite. A special call for tender segment for carports has been established so that they do
not compete with other types of installations.
3.3.7. Enabling and constraining policies
Low value of self-use. As presented above, France has some of the lowest commercial electricity rates
in Europe. Under current market rules, installed costs, and commercial electricity rates, it remains
more economically attractive for commercial-scale customers to participate in France’s FIT and
auction schemes rather than consume their own power onsite. In fact, the PV systems on Groupe
Casino’s buildings in France are configured to benefit from either the simplified auction scheme (for
systems 100-250kW) or the feed-in tariff, both of which provide a fixed purchase price for 100% of
system output, rather than for self-use. According to Green Yellow, the special division within Groupe
Casino responsible for overseeing the company’s energy and environmental performance, the
economics of configuring PV systems for self-use in France remain weak mainly due to the
comparatively low commercial electricity rates.
Figure 13 - Weekly Electricity Usage of the case study Supermarket with PV generation (week in July) (based on data from actual supermarket electricity consumption provided by Groupe Casino)
-220
-180
-140
-100
-60
-20
20
60
100
140
180
220
1:0
07
:00
13
:00
19
:00
1:0
07
:00
13
:00
19
:00
1:0
07
:00
13
:00
19
:00
1:0
07
:00
13
:00
19
:00
1:0
07
:00
13
:00
19
:00
1:0
07
:00
13
:00
19
:00
1:0
07
:00
13
:00
19
:00
kW
Consumption PV Generation Net Grid Injection
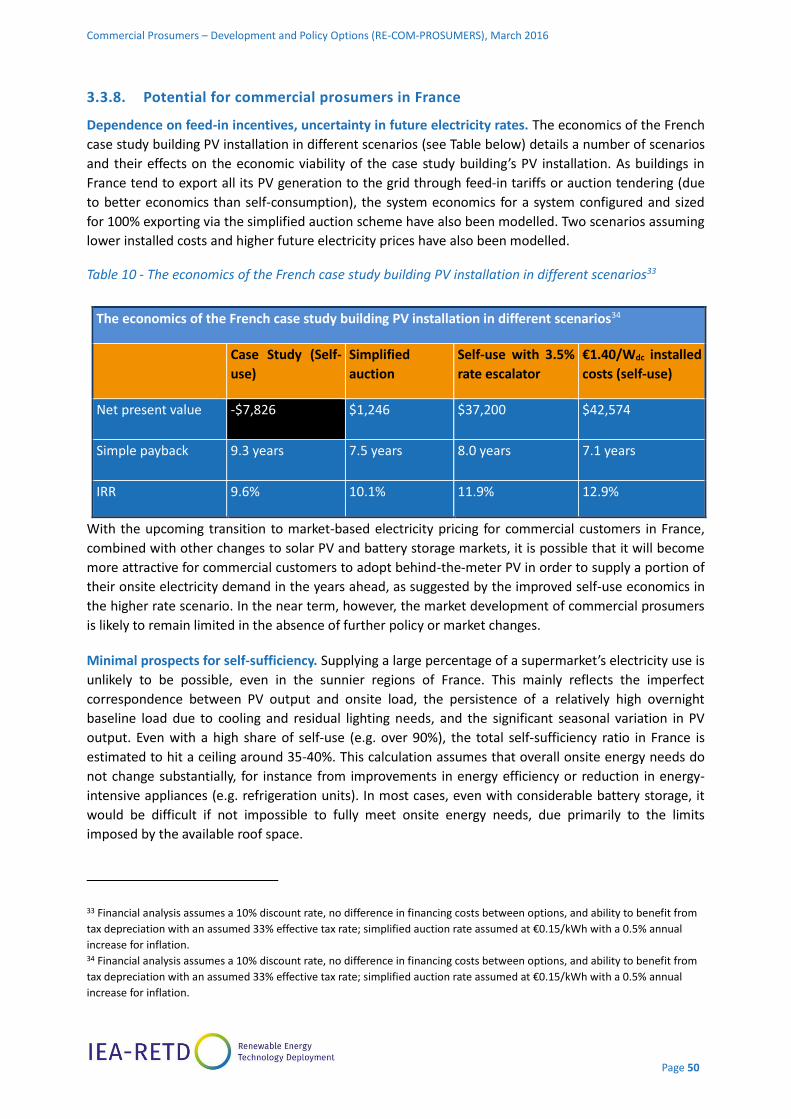
Commercial Prosumers – Development and Policy Options (RE-COM-PROSUMERS), March 2016
Page 50
3.3.8. Potential for commercial prosumers in France
Dependence on feed-in incentives, uncertainty in future electricity rates. The economics of the French
case study building PV installation in different scenarios (see Table below) details a number of scenarios
and their effects on the economic viability of the case study building’s PV installation. As buildings in
France tend to export all its PV generation to the grid through feed-in tariffs or auction tendering (due
to better economics than self-consumption), the system economics for a system configured and sized
for 100% exporting via the simplified auction scheme have also been modelled. Two scenarios assuming
lower installed costs and higher future electricity prices have also been modelled.
Table 10 - The economics of the French case study building PV installation in different scenarios33
With the upcoming transition to market-based electricity pricing for commercial customers in France,
combined with other changes to solar PV and battery storage markets, it is possible that it will become
more attractive for commercial customers to adopt behind-the-meter PV in order to supply a portion of
their onsite electricity demand in the years ahead, as suggested by the improved self-use economics in
the higher rate scenario. In the near term, however, the market development of commercial prosumers
is likely to remain limited in the absence of further policy or market changes.
Minimal prospects for self-sufficiency. Supplying a large percentage of a supermarket’s electricity use is
unlikely to be possible, even in the sunnier regions of France. This mainly reflects the imperfect
correspondence between PV output and onsite load, the persistence of a relatively high overnight
baseline load due to cooling and residual lighting needs, and the significant seasonal variation in PV
output. Even with a high share of self-use (e.g. over 90%), the total self-sufficiency ratio in France is
estimated to hit a ceiling around 35-40%. This calculation assumes that overall onsite energy needs do
not change substantially, for instance from improvements in energy efficiency or reduction in energy-
intensive appliances (e.g. refrigeration units). In most cases, even with considerable battery storage, it
would be difficult if not impossible to fully meet onsite energy needs, due primarily to the limits
imposed by the available roof space.
33 Financial analysis assumes a 10% discount rate, no difference in financing costs between options, and ability to benefit from
tax depreciation with an assumed 33% effective tax rate; simplified auction rate assumed at €0.15/kWh with a 0.5% annual
increase for inflation. 34 Financial analysis assumes a 10% discount rate, no difference in financing costs between options, and ability to benefit from
tax depreciation with an assumed 33% effective tax rate; simplified auction rate assumed at €0.15/kWh with a 0.5% annual
increase for inflation.
The economics of the French case study building PV installation in different scenarios34
Case Study (Self-
use)
Simplified
auction
Self-use with 3.5%
rate escalator
€1.40/Wdc installed
costs (self-use)
Net present value -$7,826 $1,246 $37,200 $42,574
Simple payback 9.3 years 7.5 years 8.0 years 7.1 years
IRR 9.6% 10.1% 11.9% 12.9%
Commercial Prosumers – Development and Policy Options (RE-COM-PROSUMERS), March 2016
Page 51
In the sunnier regions of the country, systems that make use of solarized car ports or shading structures
in the parking area and combine their systems with onsite storage capacity and better load-
management practices may be able to come closer to self-sufficiency, at least during the spring and
summer months when insolation levels are higher. In order for this to be a viable solution for a wide
portfolio of supermarkets, however, the economics will have to further improve as battery costs decline,
commercial electricity tariffs increase, onsite energy efficiency improves, and energy management
systems better coordinate between onsite loads and the available solar PV supply.

Commercial Prosumers – Development and Policy Options (RE-COM-PROSUMERS), March 2016
Page 52
3 . 4 . G E R M A N Y
National Snapshot
Up to 27.1 GW of commercial PV was installed as of end of 2014, accounting for up to 70% of total
cumulative installed capacity (38.5 GW) (BNetzA, 2014).
35.2 TWh was generated by PV in 2014, accounting for 6.9% of total electricity generated in the country
(Wirth, 2015). PV generation can now provide up to 35% of demand during peak hours.
Due to the reduction in feed-in tariff rates and imposition of new taxes, new PV installations declined by
40% from 2013 to 2014 (Clover, 2015a), with most of the decline occurring in the commercial-scale
rooftop industry (Körnig, 2015).
After years of record growth, new installations in
the world’s largest solar market are expected to
continue to decline. After installing more than 7 GW
annually from 2010-12, Germany installed 3.14 GW
in 2013 and only 1.89 GW in 2014 (Clover, 2015a).
Growth rates have declined by over 46% in the
10kW-100kW size range (Körnig, 2015). The
Transmission System Operators are estimating that
1.7 to 2 GW of new capacity will be installed
annually from 2015-2019 (Gerke, 2014).
Policymakers are now targeting short term annual
market growth of 2.5 GW per year, including 2.1 GW
of roof-mounted PV (BMWi, 2014).
3.4.1. Economic Drivers
PV System Costs. The average commercial installed costs in Germany was approximately €1.20/Wdc in
2014 (Willborn et al., 2014), with some developers quoting prices around €1.00/Wdc in 2015.
Retail electricity rates. Rate structures have a major impact on the economic viability of PV in
Germany. The average commercial electricity rate in Germany was 15,37 € cents/kWh in 2014 (BDEW,
2014). Electricity prices paid by German industrial consumers, however, vary considerably.35 Large-
scale consumers, for example, are exempt from paying the EEG surcharge36, which was 6.17 €
cent/kWh in 2015. The level of EEG surcharge reduction or exemption depends on amount of
electricity consumed. In addition, electricity costs have to make up a certain share of the company’s
gross value added and be subject to international competition. Exemptions start at an annual
consumption of 1 GWh and electricity costs amounting to at least 14% of the gross value added (10%
of EEG surcharge). Consumers with an electricity consumption ranging from 10 to 100 GWh only have
to pay 1% of the EEG surcharge.
35 Germany’s electricity supply market is liberalized and transmission is unbundled from generation. Consumers can select
between more than 9000 retail suppliers. However, 67% of power generation was delivered by the “Big Four” (RWE, EnBW,
E.ON, and Vattenfall), although they have very limited shares in the solar PV market (Appunn & Russell, 2015). 36 Passed in 2000, the Erneuerbare Energien Gesetz (EEG, or Renewable Energy Act) levies a surcharge on most electricity
consumers to support the feed-in tariff for renewable energy.
Figure 14. Decline in new installed PV capacity in
Germany from 2013-2014 (Körnig, 2015)

Commercial Prosumers – Development and Policy Options (RE-COM-PROSUMERS), March 2016
Page 53
Companies with annual electricity demand exceeding 100 GWh per annum only have to pay 0.05 €
cent/kWh. In 2014, 106 TWh, or 20% of total electricity consumption, was exempted from the full EEG
surcharge (approx. 2000 companies) (Graichen, 2014). Given these exemptions, the strongest
potential for commercial prosumers is among entities that have to pay the full EEG surcharge (as well
as other taxes and surcharges).
Insolation. Average daily insolation ranges from 3.42 kWh/m2/day in Munich to 2.91 kWh/m2/day in
Hamburg (CESC, 2015).
3.4.2. National Conditions
Roof space. The estimated PV technical potential of all remaining rooftops in Germany is 75 GW
(BMWi, 2015b).
National electricity demand. Annual electricity demand declined by 4% from 2013 to 2014 (BDEW,
2014). Electricity demand is expected to continue to decline if Germany complies with its energy
efficiency targets.
History of self-use. Germany has a long history of self-use of fossil-fuel based electricity generation.
About 10% of total electricity demand is met by industrial self-use, primarily derived from combined
heat-and-power plants (CHP).
3.4.3. Enabling and constraining policies
National incentives. Germany’s feed-in tariff is the primary solar PV incentive, providing fixed
payments for electricity exported to the grid until the national target of 52 GW of installed capacity is
attained. The tariff payments are set to decline automatically on a monthly basis. However, the tariff
degression was faster than the actual decline in system costs in past years, in part because of an
import tax on Chinese PV modules and in part because the rate of degression was too high. As a
result, the FIT payments are now below the levelised cost of electricity from solar and below the retail
electricity price in Germany (BMWi, 2015b), driving PV producers to rely on self-use for PV system
economics.
The end of full EEG exemption. Until 2014, prosumers were able to avoid the EEG surcharge entirely
on all self-consumed renewable energy, adding a significant financial incentive to self-use and solar
uptake in this market. However, the government passed new regulations in 2014 forcing prosumers to
pay 30% of the EEG surcharge, rising to 35% in 2016 and 40% in 2017.37 As a result, system payback
periods for commercial and industrial consumers increased significantly, in some cases to 15 years or
more (Körnig, 2015).
Germany has the highest installed PV capacity in the world, which has significant impacts on
conventional utilities. However, with high expectations for returns on investment (e.g. high IRR and
short payback periods), regulatory risk from potential future changes in treatment of self-use, and
considerations related to building ownership, commercial prosumers still face important barriers
despite having achieved socket parity.
37 Small-scale residential systems (up to 10kW) are exempt from this regulation.

Commercial Prosumers – Development and Policy Options (RE-COM-PROSUMERS), March 2016
Page 54
Case Study
Supermarkets owned by major national chains are good candidates for commercial solar, with large and
almost flat roofs that enable large installations. Due to steady refrigeration needs, the energy use
profiles enable the majority of generation to be consumed onsite. In this case study, an average size
supermarket has been selected. While hypermarket-sized grocery stores exist in Germany, the majority
of stores are smaller supermarkets or discounters (Herrmann et al., 2009), which are typically around
1000 m2 or less (KPMG, 2011).
Building Characteristics
Photo: © ALDI SÜD
1000 m2 supermarket
1 floor, flat roof with 60-80% of roof
available for PV (estimate)
Munich, Germany
3.42 kWh/m2/day average annual
insolation
Energy Use Profile38 PV Installation
254,000 kWh annual energy consumption
59.7 kW peak demand
18.1 cents/kWh average retail electricity
cost (incl. VAT)
95kW standard, fixed roof mount system39
€1.20/Wdc installed costs
Incentives: Feed-in tariff
Owned by the consumer
Energy Use Profile with PV Energy Costs40
32.3% self-sufficiency: 82,042 kWh annual
PV generation
87.1% self-use: 82,168 kWh consumed
onsite, 12,131 kWh fed into grid
Year 1 20 year (cumulative)
Without PV $45,958 $1,223,054
With PV $30,395 $832,957
Net Present
Value $11,368
IRR 11.2%
38 Energy load profile derived from a national BDEW commercial standard load profile; energy usage and building type derived
from Willborn et al. (2014) supermarket case study 39 Standard module, fixed roof mount, 14% system losses, 20° tilt, 180° azimuth, 1.1 DC to AC size ratio, 96% inverter
Efficiency, 0.5% annual degradation factor 40 2.3% annual electricity rate escalator (ZSW 2014), 10% discount rate
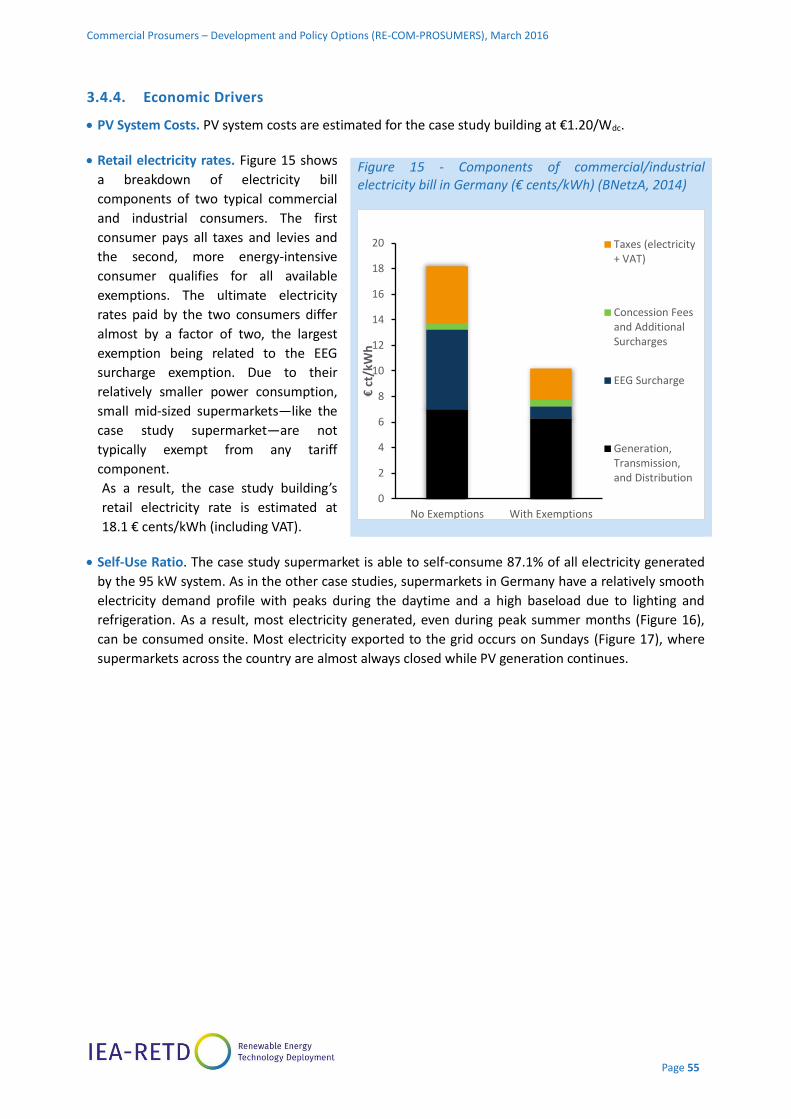
Commercial Prosumers – Development and Policy Options (RE-COM-PROSUMERS), March 2016
Page 55
3.4.4. Economic Drivers
PV System Costs. PV system costs are estimated for the case study building at €1.20/Wdc.
Retail electricity rates. Figure 15 shows
a breakdown of electricity bill
components of two typical commercial
and industrial consumers. The first
consumer pays all taxes and levies and
the second, more energy-intensive
consumer qualifies for all available
exemptions. The ultimate electricity
rates paid by the two consumers differ
almost by a factor of two, the largest
exemption being related to the EEG
surcharge exemption. Due to their
relatively smaller power consumption,
small mid-sized supermarkets—like the
case study supermarket—are not
typically exempt from any tariff
component.
As a result, the case study building’s
retail electricity rate is estimated at
18.1 € cents/kWh (including VAT).
Self-Use Ratio. The case study supermarket is able to self-consume 87.1% of all electricity generated
by the 95 kW system. As in the other case studies, supermarkets in Germany have a relatively smooth
electricity demand profile with peaks during the daytime and a high baseload due to lighting and
refrigeration. As a result, most electricity generated, even during peak summer months (Figure 16),
can be consumed onsite. Most electricity exported to the grid occurs on Sundays (Figure 17), where
supermarkets across the country are almost always closed while PV generation continues.
Figure 15 - Components of commercial/industrial electricity bill in Germany (€ cents/kWh) (BNetzA, 2014)
0
2
4
6
8
10
12
14
16
18
20
No Exemptions With Exemptions
€ct
/kW
h
Taxes (electricity+ VAT)
Concession Feesand AdditionalSurcharges
EEG Surcharge
Generation,Transmission,and Distribution

Commercial Prosumers – Development and Policy Options (RE-COM-PROSUMERS), March 2016
Page 56
Access to finance. Most PV systems in Germany are still financed via standard project finance. Due to
a very stable regulatory framework
based on feed-in tariffs for all project
sizes, finance was relatively easy and
straightforward for the past two decades.
The share of debt depends on the project
size (Table 11). New business and finance
models are only currently being
developed in Germany, based on self-
use, direct delivery of solar PV without
using the public grid, and regional
electricity sales (Grundner et al., 2014).
3.4.5. Behavioural Drivers
As in other countries, business leaders in Germany need to justify investments in distributed
generation and not the core business. As such, energy investments typically need to have high IRRs
and shorter payback periods in order to be justifiable from an economic standpoint.
Figure 16 - Daily Electricity Usage of the case study Supermarket with PV generation (weekday in July)
Figure 17 - Weekly Electricity Usage of the case study Supermarket with PV generation (week in July)
Table 11 - Typical financing terms for solar installations in
Germany (ZSW, 2014)
-80
-40
0
40
80
1:0
0
3:0
0
5:0
0
7:0
0
9:0
0
11
:00
13
:00
15
:00
17
:00
19
:00
21
:00
23
:00
kW
Consumption PV Generation
-80
-40
0
40
80
1:0
07
:00
13
:00
19
:00
1:0
07
:00
13
:00
19
:00
1:0
07
:00
13
:00
19
:00
1:0
07
:00
13
:00
19
:00
1:0
07
:00
13
:00
19
:00
1:0
07
:00
13
:00
19
:00
1:0
07
:00
13
:00
19
:00
kW
Consumption PV Generation
Net Grid Injection
Commercial Prosumers – Development and Policy Options (RE-COM-PROSUMERS), March 2016
Page 57
3.4.6. National Conditions
Share of rental property. There are no readily available statistics regarding the ownership of
supermarkets in Germany. Leased properties attempting to engage in PV self-use may be
disadvantaged under the 2014 EEG surcharge amendments. As discussed above, the EEG surcharge is
now applied to a portion of onsite consumption. This partial application of the surcharge, however,
applies only to circumstances under which the prosumer owns the PV system. If a third-party owner
sells power to a building occupant for the purposes of self-use (e.g. a landlord who owns PV on the
rooftop selling power to the tenant) then the EEG surcharge is assessed on all of the PV generation
consumed onsite.41
3.4.7. Enabling and Constraining Policies
Reduced value of self-use and policy uncertainty. As discussed above, the removal of the full EEG
exemption for self-consumed renewable energy has significantly reduced the economic viability of
self-use. Self-consumed electricity is still exempt from other retail price components (e.g. parts of
network tariffs, electricity tax, surcharge for CHP support, concessional fee, and the surcharge for
offshore wind liability). Uncertainty regarding how self-consumed electricity will be treated in the
future with regards to issues such as surcharges, the development of new network tariff
methodologies, and the design of future electricity markets (i.e. “European electricity market” versus
“decentrally organized markets based on distributed generation”) have made some businesses
hesitant to invest in PV.
3.4.8. Potential for commercial prosumers in Germany
In 2012, the LCOE of commercial-scale solar PV projects in Germany reached socket parity with the
commercial electricity prices (Fraunhofer ISE, 2015; Wirth, 2015) (Figure 18).
41 There is anecdotal evidence that Aldi – one of the largest low-budget supermarket chains in Germany – owns most of the
buildings in Germany where as in the northern part of the country the buildings are owned by third parties. This would partially
explain why most solar PV systems are installed on Aldi rooftops in the southern part of the country.
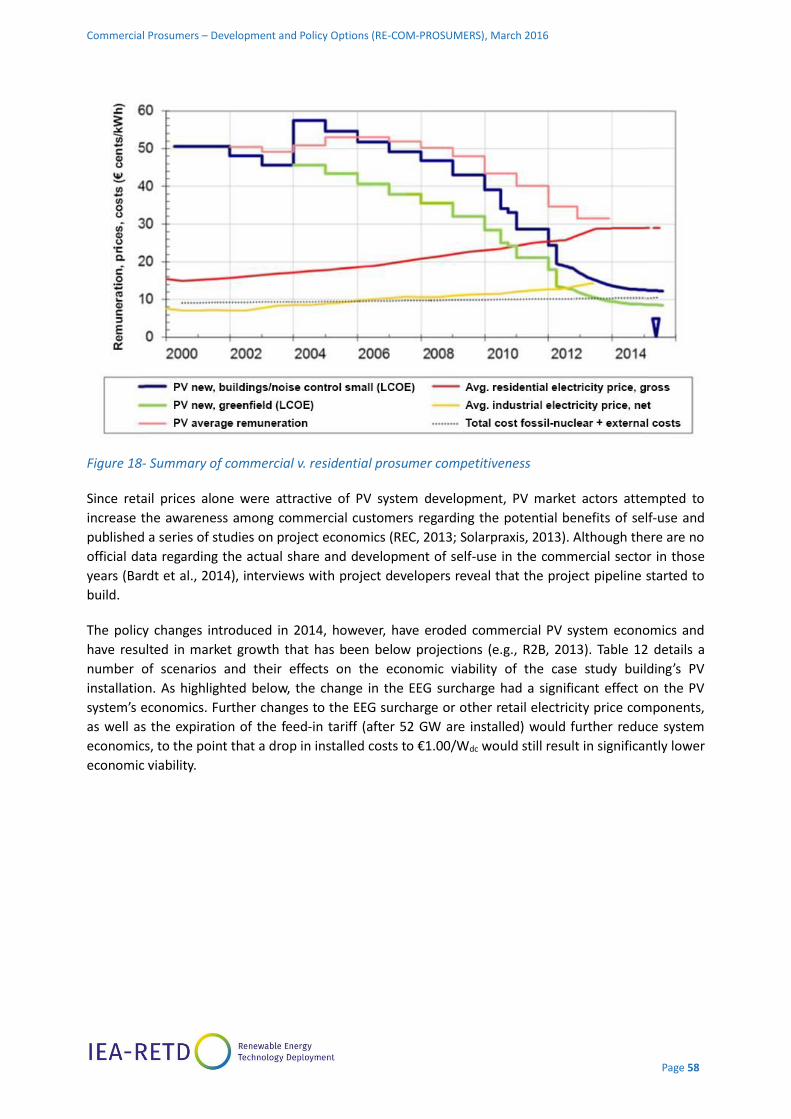
Commercial Prosumers – Development and Policy Options (RE-COM-PROSUMERS), March 2016
Page 58
Figure 18- Summary of commercial v. residential prosumer competitiveness
Since retail prices alone were attractive of PV system development, PV market actors attempted to
increase the awareness among commercial customers regarding the potential benefits of self-use and
published a series of studies on project economics (REC, 2013; Solarpraxis, 2013). Although there are no
official data regarding the actual share and development of self-use in the commercial sector in those
years (Bardt et al., 2014), interviews with project developers reveal that the project pipeline started to
build.
The policy changes introduced in 2014, however, have eroded commercial PV system economics and
have resulted in market growth that has been below projections (e.g., R2B, 2013). Table 12 details a
number of scenarios and their effects on the economic viability of the case study building’s PV
installation. As highlighted below, the change in the EEG surcharge had a significant effect on the PV
system’s economics. Further changes to the EEG surcharge or other retail electricity price components,
as well as the expiration of the feed-in tariff (after 52 GW are installed) would further reduce system
economics, to the point that a drop in installed costs to €1.00/Wdc would still result in significantly lower
economic viability.

Commercial Prosumers – Development and Policy Options (RE-COM-PROSUMERS), March 2016
Page 59
Table 12 - The economics of the German case study building PV installation in different scenarios42
It is projected that the number of commercial PV systems designed for self-use will actually decrease
through 2019 as Germany focuses on auctions for free-standing systems (Leipziger Institut für Energie,
2014). Without the 2014 policy amendments, the number of commercial prosumer projects might have
increased considerably. Commercial PV prosumers could revive again in the future, assuming that the
LCOE of solar PV will decrease further.
However, investors are increasingly sensitive to regulatory risk. In 2015, the discussion on changing the
methodology for network tariffs (e.g., BMWi, 2015a) is making it difficult to forecast long-term revenue
streams from self-use because certain price components of the retail electricity price might change
again. In addition, strong lobby organizations in the German electricity industry, such as the BDEW, had
previously argued that prosumers should pay 100% of the EEG surcharge – and not only 30-40%, as
implemented in 2014. Therefore, this regulation could also change in the future.
The latest German progress report for PV, commissioned by the Ministry of Economic Affairs and Energy,
depicts three different scenarios for the evolution of self-use of electricity in the commercial sector43,
highlighting the importance of policy frameworks. In Scenario 3, without any direct or indirect support
via exemption from certain surcharges and taxes, self-use of solar PV (and CHP) is not economically
viable in Germany in the coming years (Bardt et al., 2014; ZSW, 2014).
42 Financial analysis assumes a 10% discount rate, no difference in financing costs between options, and ability to benefit from
tax depreciation with an assumed 33% effective tax rate; simplified auction rate assumed at €0.15/kWh with a 0.5% annual
increase for inflation. 43 The analysis also included other power generation technologies next to solar PV, such as distributed CHP plants, thermal
storage.
Case Study (40% EEG Surcharge)
No EEG Surcharge 100% EEG Surcharge
Full EEG Surcharge, No Feed-in tariff €1.00/Wdc installed
Net present value €11,368 €37,949 -€28,502 -€15,662
Simple payback 7.7 years 6.7 years 12.0 years 11.4 years
IRR 11.2% 13.8% 6.9% 8.0
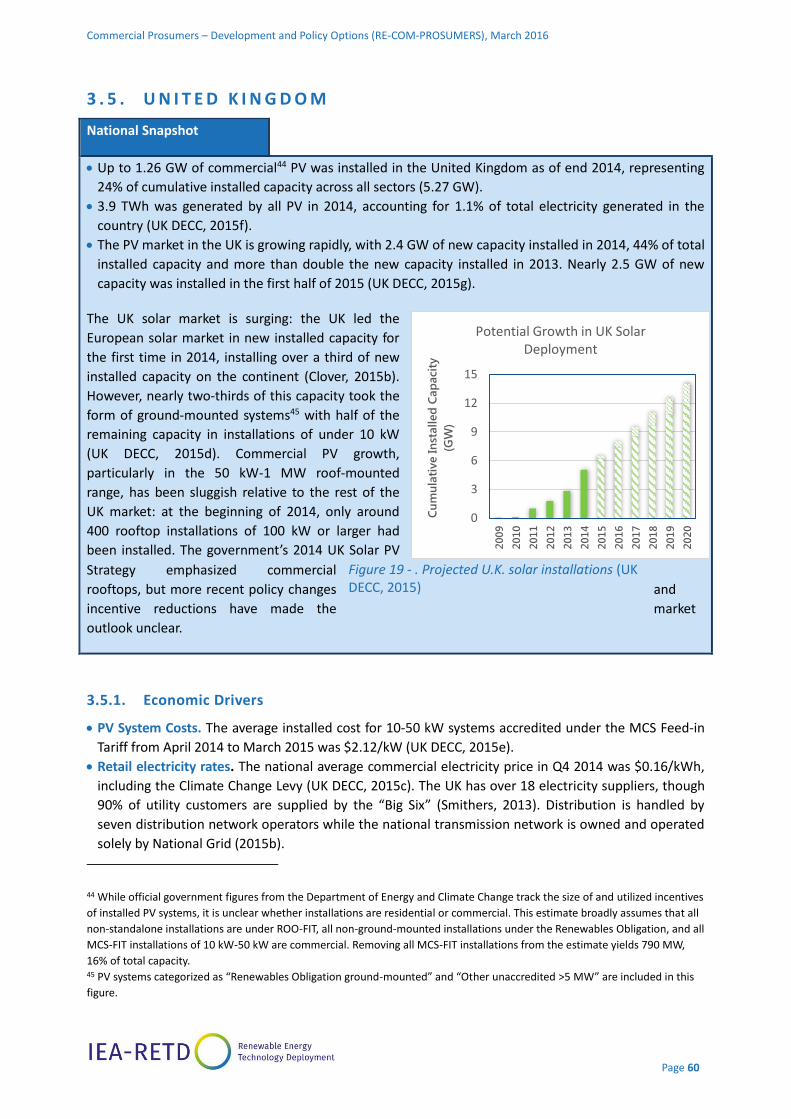
Commercial Prosumers – Development and Policy Options (RE-COM-PROSUMERS), March 2016
Page 60
3 . 5 . U N I T E D K I N G D O M
3.5.1. Economic Drivers
PV System Costs. The average installed cost for 10-50 kW systems accredited under the MCS Feed-in
Tariff from April 2014 to March 2015 was $2.12/kW (UK DECC, 2015e).
Retail electricity rates. The national average commercial electricity price in Q4 2014 was $0.16/kWh,
including the Climate Change Levy (UK DECC, 2015c). The UK has over 18 electricity suppliers, though
90% of utility customers are supplied by the “Big Six” (Smithers, 2013). Distribution is handled by
seven distribution network operators while the national transmission network is owned and operated
solely by National Grid (2015b).
44 While official government figures from the Department of Energy and Climate Change track the size of and utilized incentives
of installed PV systems, it is unclear whether installations are residential or commercial. This estimate broadly assumes that all
non-standalone installations are under ROO-FIT, all non-ground-mounted installations under the Renewables Obligation, and all
MCS-FIT installations of 10 kW-50 kW are commercial. Removing all MCS-FIT installations from the estimate yields 790 MW,
16% of total capacity. 45 PV systems categorized as “Renewables Obligation ground-mounted” and “Other unaccredited >5 MW” are included in this
figure.
National Snapshot
Up to 1.26 GW of commercial44 PV was installed in the United Kingdom as of end 2014, representing
24% of cumulative installed capacity across all sectors (5.27 GW).
3.9 TWh was generated by all PV in 2014, accounting for 1.1% of total electricity generated in the
country (UK DECC, 2015f).
The PV market in the UK is growing rapidly, with 2.4 GW of new capacity installed in 2014, 44% of total
installed capacity and more than double the new capacity installed in 2013. Nearly 2.5 GW of new
capacity was installed in the first half of 2015 (UK DECC, 2015g).
The UK solar market is surging: the UK led the
European solar market in new installed capacity for
the first time in 2014, installing over a third of new
installed capacity on the continent (Clover, 2015b).
However, nearly two-thirds of this capacity took the
form of ground-mounted systems45 with half of the
remaining capacity in installations of under 10 kW
(UK DECC, 2015d). Commercial PV growth,
particularly in the 50 kW-1 MW roof-mounted
range, has been sluggish relative to the rest of the
UK market: at the beginning of 2014, only around
400 rooftop installations of 100 kW or larger had
been installed. The government’s 2014 UK Solar PV
Strategy emphasized commercial
rooftops, but more recent policy changes and
incentive reductions have made the market
outlook unclear.
Figure 19 - . Projected U.K. solar installations (UK DECC, 2015)
0
3
6
9
12
15
20
09
20
10
20
11
20
12
20
13
20
14
20
15
20
16
20
17
20
18
20
19
20
20
Cu
mu
lati
ve In
stalled
Cap
aci
ty
(GW
)
Potential Growth in UK Solar Deployment

Commercial Prosumers – Development and Policy Options (RE-COM-PROSUMERS), March 2016
Page 61
Insolation. Average daily insolation (GHI) ranges from 3.1 kWh/m2/day in southwest England to 2.3
kWh/m2/day in northern Scotland (UK DECC, 2014a).
3.5.2. National Conditions
Roof space. An estimated 222.5 million m2 of commercial roof space could be suitable for PV, equating
to a total PV technical potential of 32 GW.46
Share of rental property. In 2011, the share of commercial property that is rented was estimated at
66% (AREF, 2013). The average new lease length in mid-2013 was 4.5 years (AREF, 2014). With such a
high share of leased commercial space and short lease duration, a long-term investment like solar PV
may not be appealing to many commercial entities.
National electricity demand. Annual electricity demand is projected to decline by 1% annually from
2015-2022, followed by 1.7% projected annual growth from 2022-2035 (UK DECC, 2014b). Summer
peak grid demand is expected to decline by 2.5% from 2014-2015 (Ambrose, 2015).
Building type. It is unclear whether the commercial market is dominated by a single type of building
or commercial entity. The commercial PV market as a whole is expanding relatively slowly, and it is
likely that factors not primarily related to building type are driving commercial entities to adopt PV.
Large companies, particularly those with retail stores, distribution centres, and manufacturing
centres—as well as sustainability targets—have deployed large quantities of solar: the British retailer
Sainsbury leads the UK in terms of commercial deployment with 40 MW installed across over 200 of
its 1200+ locations (Clover, 2014); Marks & Spencer, another retailer, recently installed 6.1 MW of PV
across a 900,000 square foot distribution centre, beating out Jaguar Land Rover’s 5.8 MW system atop
a manufacturing centre for the title of largest rooftop installation in the UK.
3.5.3. National enabling and constraining policies
National incentives. The UK has used three primary incentive schemes for solar PV. The UK Feed-in
Tariff, open to all PV systems under 5 MW differs from other feed-in tariffs: rather than providing
payments only for electricity exported to the grid, the UK Feed-in Tariff provides payments to system
owners for all electricity generated (even if self-consumed) with an additional export tariff for
generation exported to the grid. In Q3 2015, the generation tariff rates ranged from $0.09/kWh to
$0.20/kWh for rooftop systems and $0.07/kWh for ground-mounted systems while the export tariff
for all systems was $0.07/kWh (Ofgem, 2015b).
The Renewables Obligation, similar to Renewables Portfolio Standards in the United States, was
designed to incentivize utility-scale PV by requiring electricity suppliers to source an annually-increasing
share of electricity from renewable sources. While the Renewables Obligation was initially scheduled
to be closed to new generating capacity at the end of March 2017, the government unexpectedly
announced in November 2014 that the program would be closed to new solar installations above 5
MW two years ahead of schedule following faster-than-expected growth in new installations of
ground-mounted solar farms (Ofgem, 2015a; Shankleman and Murray, 2014).
46 While DECC routinely estimates that 2.5 billion m2 of south-facing commercial roof space is available in the UK, this estimate
is not supported by estimates of commercial floor space in the UK. An estimate of 679 million m2 of non-governmental
commercial and industrial floor space (assuming roof space matches floor space and office buildings have three floors) and the
DECC methodology for rooftop suitability for PV were used to estimate technical potential (143.5 W/m2 assumed) (Mitchell,
2014).
Commercial Prosumers – Development and Policy Options (RE-COM-PROSUMERS), March 2016
Page 62
Large systems will now be procured through contracts for difference (CfD) auction mechanism. Under
CfD, the generator receives payments equal to the difference between the auctioned strike price and
the wholesale electricity price in order to provide a minimum level of compensation.
New policy directions: “Rocket boosters” vs. feed-in tariff cuts. As previously mentioned, the UK
commercial rooftop solar market has grown slowly in comparison to the rapid growth in large ground-
mounted and residential systems. In accordance with its pledge to put “rocket-boosters” under the
commercial PV market (Bennett, 2014), the UK government has announced two major policy changes in
2014 to remove barriers to commercial PV uptake. First, new regulations as of March 2015 allow for
rooftop installations of up to 1 MW to waive planning permissions.47 The streamlining of this regulation
may help reduce soft costs and drive commercial deployment. In March 2015, the government also
announced that after summer of 2019, rooftop PV installations of 50 kW or larger will be able to be
moved between buildings while still retaining Feed-in Tariff accreditation. The government aims to
make investing in PV more attractive to landlords and tenants who may not have guaranteed long-term
ownership or leases of their buildings (UK DECC, 2015b). This regulatory change would support
commercial market given the large share of leased space. More recently, however, DECC introduced
proposals to significantly reduce the FIT rates, with some FIT rates phasing out completely by 2019
(Clover, 2015e).
The future of the UK solar market remains uncertain. The early expiration of the Renewables Obligation
for certain PV systems at the end of Q1 2015 disrupted the market (Appleyard, 2014), driving many of
the largest installers to refocus on commercial rooftop PV (Clover, 2015c). The Renewables Obligation
replacement scheme, CfD, is considered to be currently insufficient to continue driving the rapid growth
of large solar farms (Clover, 2015d).
The proposed cuts to the FIT could further decrease market momentum. At the same time, however,
there is little evidence that commercial prosumers are able to develop on an incentive-free basis.
47 See 2015 No. 596, The Town and Country Planning (General Permitted Development) (England) Order 2015, available at
http://www.legislation.gov.uk/uksi/2015/596/pdfs/uksi_20150596_en.pdf
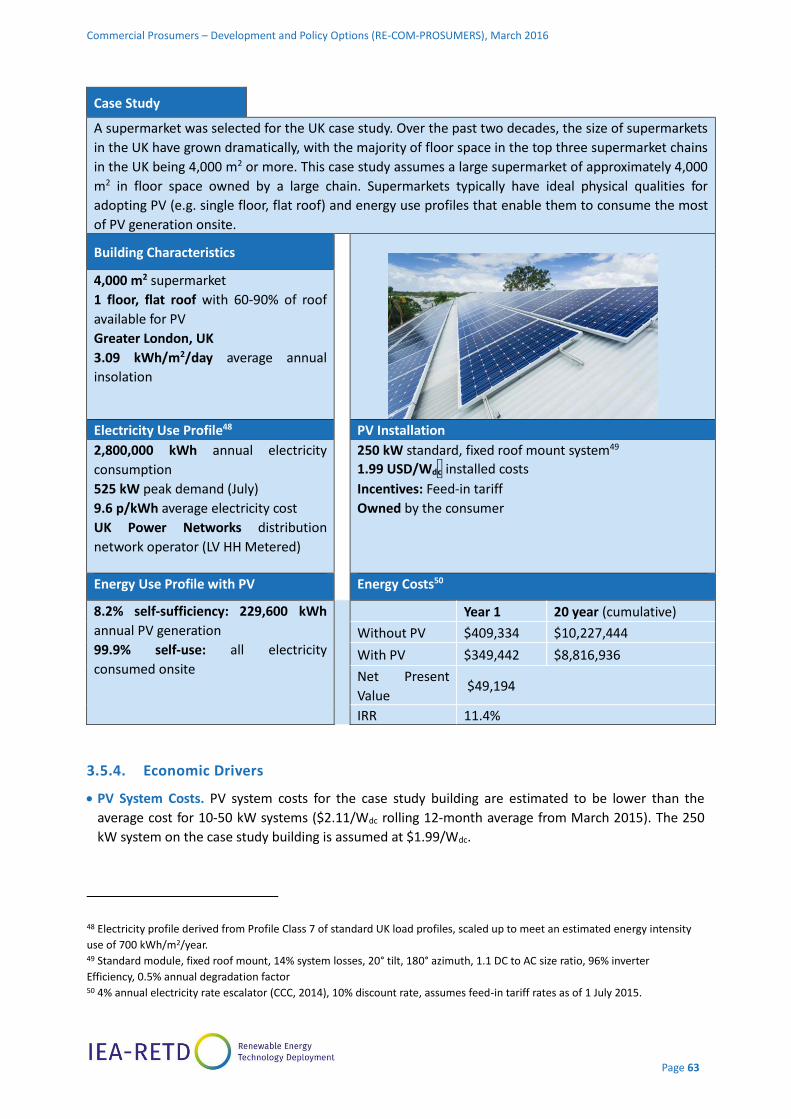
Commercial Prosumers – Development and Policy Options (RE-COM-PROSUMERS), March 2016
Page 63
Case Study
A supermarket was selected for the UK case study. Over the past two decades, the size of supermarkets
in the UK have grown dramatically, with the majority of floor space in the top three supermarket chains
in the UK being 4,000 m2 or more. This case study assumes a large supermarket of approximately 4,000
m2 in floor space owned by a large chain. Supermarkets typically have ideal physical qualities for
adopting PV (e.g. single floor, flat roof) and energy use profiles that enable them to consume the most
of PV generation onsite.
Building Characteristics
4,000 m2 supermarket
1 floor, flat roof with 60-90% of roof
available for PV
Greater London, UK
3.09 kWh/m2/day average annual
insolation
Electricity Use Profile48 PV Installation
2,800,000 kWh annual electricity
consumption
525 kW peak demand (July)
9.6 p/kWh average electricity cost
UK Power Networks distribution
network operator (LV HH Metered)
250 kW standard, fixed roof mount system49
1.99 USD/Wdc installed costs
Incentives: Feed-in tariff
Owned by the consumer
Energy Use Profile with PV Energy Costs50
8.2% self-sufficiency: 229,600 kWh
annual PV generation
99.9% self-use: all electricity
consumed onsite
Year 1 20 year (cumulative)
Without PV $409,334 $10,227,444
With PV $349,442 $8,816,936
Net Present
Value $49,194
IRR 11.4%
3.5.4. Economic Drivers
PV System Costs. PV system costs for the case study building are estimated to be lower than the
average cost for 10-50 kW systems ($2.11/Wdc rolling 12-month average from March 2015). The 250
kW system on the case study building is assumed at $1.99/Wdc.
48 Electricity profile derived from Profile Class 7 of standard UK load profiles, scaled up to meet an estimated energy intensity
use of 700 kWh/m2/year. 49 Standard module, fixed roof mount, 14% system losses, 20° tilt, 180° azimuth, 1.1 DC to AC size ratio, 96% inverter
Efficiency, 0.5% annual degradation factor 50 4% annual electricity rate escalator (CCC, 2014), 10% discount rate, assumes feed-in tariff rates as of 1 July 2015.
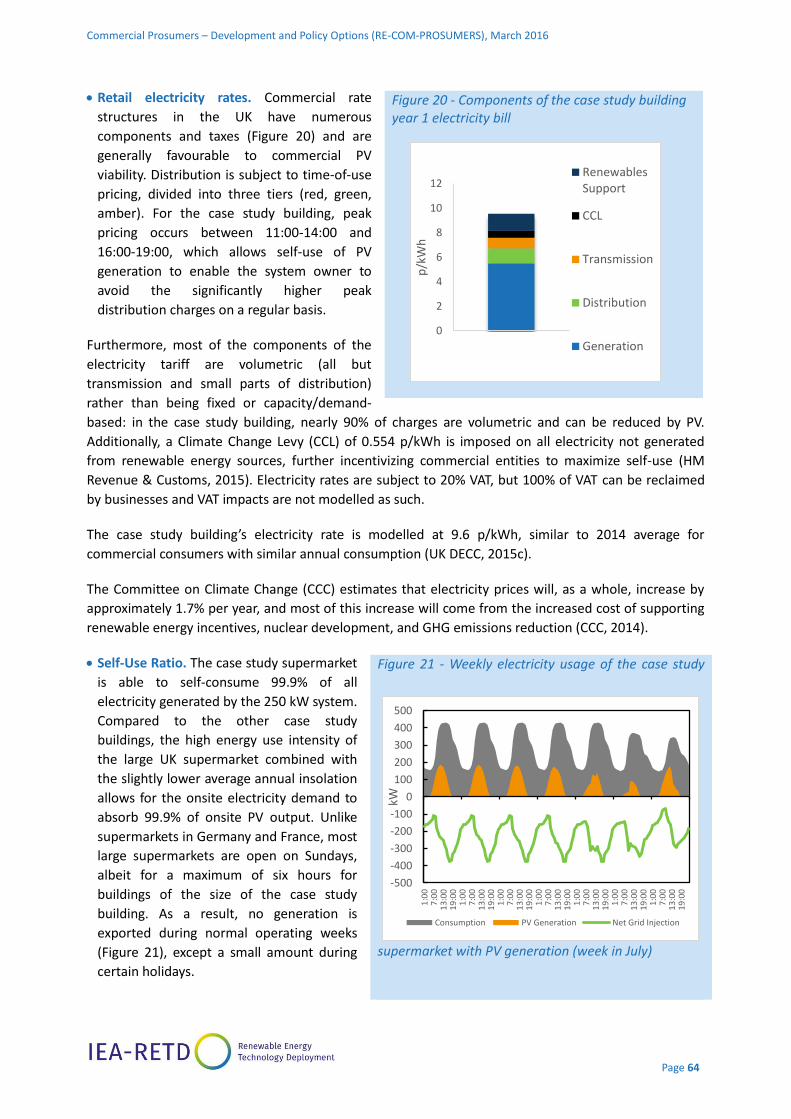
Commercial Prosumers – Development and Policy Options (RE-COM-PROSUMERS), March 2016
Page 64
Retail electricity rates. Commercial rate
structures in the UK have numerous
components and taxes (Figure 20) and are
generally favourable to commercial PV
viability. Distribution is subject to time-of-use
pricing, divided into three tiers (red, green,
amber). For the case study building, peak
pricing occurs between 11:00-14:00 and
16:00-19:00, which allows self-use of PV
generation to enable the system owner to
avoid the significantly higher peak
distribution charges on a regular basis.
Furthermore, most of the components of the
electricity tariff are volumetric (all but
transmission and small parts of distribution)
rather than being fixed or capacity/demand-
based: in the case study building, nearly 90% of charges are volumetric and can be reduced by PV.
Additionally, a Climate Change Levy (CCL) of 0.554 p/kWh is imposed on all electricity not generated
from renewable energy sources, further incentivizing commercial entities to maximize self-use (HM
Revenue & Customs, 2015). Electricity rates are subject to 20% VAT, but 100% of VAT can be reclaimed
by businesses and VAT impacts are not modelled as such.
The case study building’s electricity rate is modelled at 9.6 p/kWh, similar to 2014 average for
commercial consumers with similar annual consumption (UK DECC, 2015c).
The Committee on Climate Change (CCC) estimates that electricity prices will, as a whole, increase by
approximately 1.7% per year, and most of this increase will come from the increased cost of supporting
renewable energy incentives, nuclear development, and GHG emissions reduction (CCC, 2014).
Self-Use Ratio. The case study supermarket
is able to self-consume 99.9% of all
electricity generated by the 250 kW system.
Compared to the other case study
buildings, the high energy use intensity of
the large UK supermarket combined with
the slightly lower average annual insolation
allows for the onsite electricity demand to
absorb 99.9% of onsite PV output. Unlike
supermarkets in Germany and France, most
large supermarkets are open on Sundays,
albeit for a maximum of six hours for
buildings of the size of the case study
building. As a result, no generation is
exported during normal operating weeks
(Figure 21), except a small amount during
certain holidays.
Figure 20 - Components of the case study building year 1 electricity bill
Figure 21 - Weekly electricity usage of the case study
supermarket with PV generation (week in July)
0
2
4
6
8
10
12
p/k
Wh
RenewablesSupport
CCL
Transmission
Distribution
Generation
-500
-400
-300
-200
-100
0
100
200
300
400
500
1:0
07
:00
13:
001
9:00
1:0
07
:00
13:
001
9:00
1:0
07
:00
13:
001
9:00
1:0
07
:00
13:
001
9:00
1:0
07
:00
13:
001
9:00
1:0
07
:00
13:
001
9:00
1:0
07
:00
13:
001
9:00
kW
Consumption PV Generation Net Grid Injection
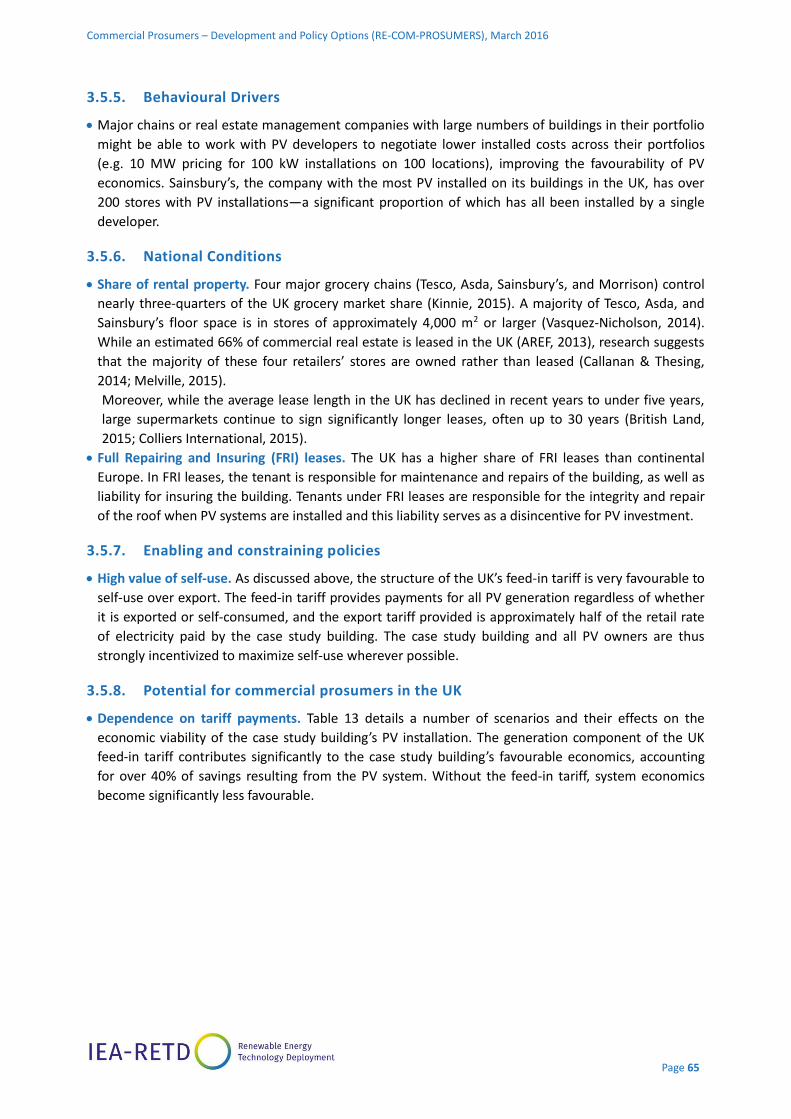
Commercial Prosumers – Development and Policy Options (RE-COM-PROSUMERS), March 2016
Page 65
3.5.5. Behavioural Drivers
Major chains or real estate management companies with large numbers of buildings in their portfolio
might be able to work with PV developers to negotiate lower installed costs across their portfolios
(e.g. 10 MW pricing for 100 kW installations on 100 locations), improving the favourability of PV
economics. Sainsbury’s, the company with the most PV installed on its buildings in the UK, has over
200 stores with PV installations—a significant proportion of which has all been installed by a single
developer.
3.5.6. National Conditions
Share of rental property. Four major grocery chains (Tesco, Asda, Sainsbury’s, and Morrison) control
nearly three-quarters of the UK grocery market share (Kinnie, 2015). A majority of Tesco, Asda, and
Sainsbury’s floor space is in stores of approximately 4,000 m2 or larger (Vasquez-Nicholson, 2014).
While an estimated 66% of commercial real estate is leased in the UK (AREF, 2013), research suggests
that the majority of these four retailers’ stores are owned rather than leased (Callanan & Thesing,
2014; Melville, 2015).
Moreover, while the average lease length in the UK has declined in recent years to under five years,
large supermarkets continue to sign significantly longer leases, often up to 30 years (British Land,
2015; Colliers International, 2015).
Full Repairing and Insuring (FRI) leases. The UK has a higher share of FRI leases than continental
Europe. In FRI leases, the tenant is responsible for maintenance and repairs of the building, as well as
liability for insuring the building. Tenants under FRI leases are responsible for the integrity and repair
of the roof when PV systems are installed and this liability serves as a disincentive for PV investment.
3.5.7. Enabling and constraining policies
High value of self-use. As discussed above, the structure of the UK’s feed-in tariff is very favourable to
self-use over export. The feed-in tariff provides payments for all PV generation regardless of whether
it is exported or self-consumed, and the export tariff provided is approximately half of the retail rate
of electricity paid by the case study building. The case study building and all PV owners are thus
strongly incentivized to maximize self-use wherever possible.
3.5.8. Potential for commercial prosumers in the UK
Dependence on tariff payments. Table 13 details a number of scenarios and their effects on the
economic viability of the case study building’s PV installation. The generation component of the UK
feed-in tariff contributes significantly to the case study building’s favourable economics, accounting
for over 40% of savings resulting from the PV system. Without the feed-in tariff, system economics
become significantly less favourable.
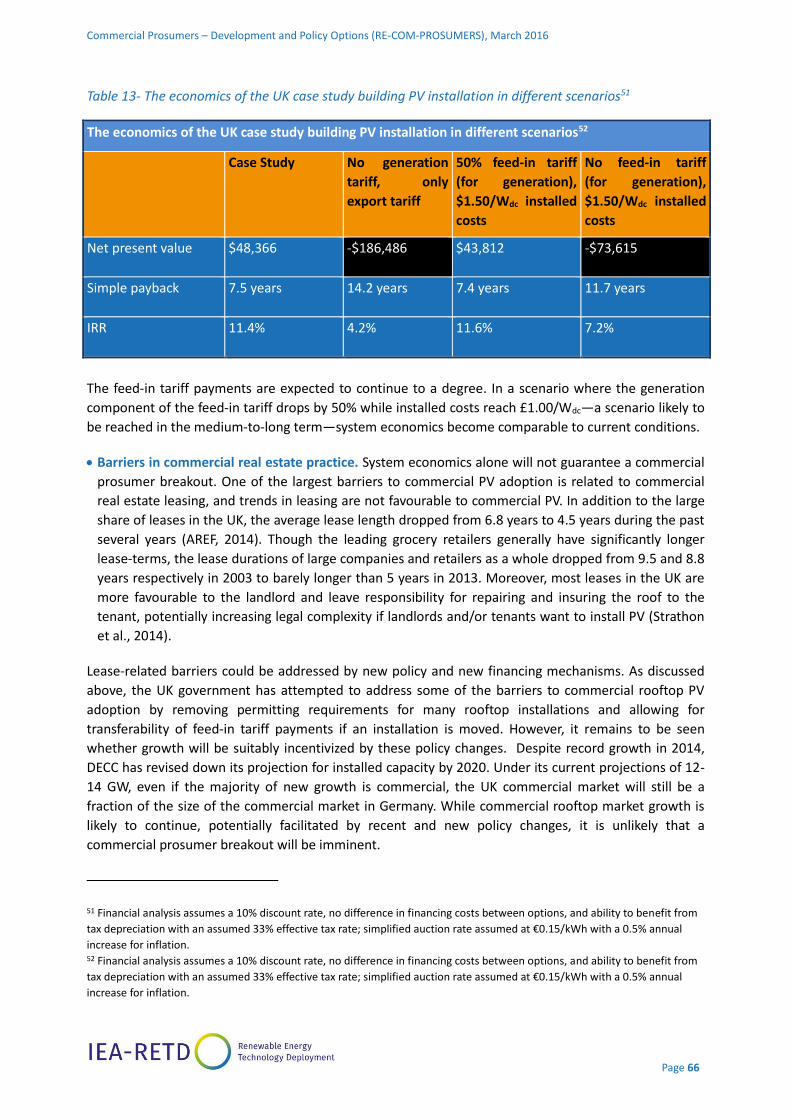
Commercial Prosumers – Development and Policy Options (RE-COM-PROSUMERS), March 2016
Page 66
Table 13- The economics of the UK case study building PV installation in different scenarios51
The feed-in tariff payments are expected to continue to a degree. In a scenario where the generation
component of the feed-in tariff drops by 50% while installed costs reach £1.00/Wdc—a scenario likely to
be reached in the medium-to-long term—system economics become comparable to current conditions.
Barriers in commercial real estate practice. System economics alone will not guarantee a commercial
prosumer breakout. One of the largest barriers to commercial PV adoption is related to commercial
real estate leasing, and trends in leasing are not favourable to commercial PV. In addition to the large
share of leases in the UK, the average lease length dropped from 6.8 years to 4.5 years during the past
several years (AREF, 2014). Though the leading grocery retailers generally have significantly longer
lease-terms, the lease durations of large companies and retailers as a whole dropped from 9.5 and 8.8
years respectively in 2003 to barely longer than 5 years in 2013. Moreover, most leases in the UK are
more favourable to the landlord and leave responsibility for repairing and insuring the roof to the
tenant, potentially increasing legal complexity if landlords and/or tenants want to install PV (Strathon
et al., 2014).
Lease-related barriers could be addressed by new policy and new financing mechanisms. As discussed
above, the UK government has attempted to address some of the barriers to commercial rooftop PV
adoption by removing permitting requirements for many rooftop installations and allowing for
transferability of feed-in tariff payments if an installation is moved. However, it remains to be seen
whether growth will be suitably incentivized by these policy changes. Despite record growth in 2014,
DECC has revised down its projection for installed capacity by 2020. Under its current projections of 12-
14 GW, even if the majority of new growth is commercial, the UK commercial market will still be a
fraction of the size of the commercial market in Germany. While commercial rooftop market growth is
likely to continue, potentially facilitated by recent and new policy changes, it is unlikely that a
commercial prosumer breakout will be imminent.
51 Financial analysis assumes a 10% discount rate, no difference in financing costs between options, and ability to benefit from
tax depreciation with an assumed 33% effective tax rate; simplified auction rate assumed at €0.15/kWh with a 0.5% annual
increase for inflation. 52 Financial analysis assumes a 10% discount rate, no difference in financing costs between options, and ability to benefit from
tax depreciation with an assumed 33% effective tax rate; simplified auction rate assumed at €0.15/kWh with a 0.5% annual
increase for inflation.
The economics of the UK case study building PV installation in different scenarios52
Case Study No generation
tariff, only
export tariff
50% feed-in tariff
(for generation),
$1.50/Wdc installed
costs
No feed-in tariff
(for generation),
$1.50/Wdc installed
costs
Net present value $48,366 -$186,486 $43,812 -$73,615
Simple payback 7.5 years 14.2 years 7.4 years 11.7 years
IRR 11.4% 4.2% 11.6% 7.2%
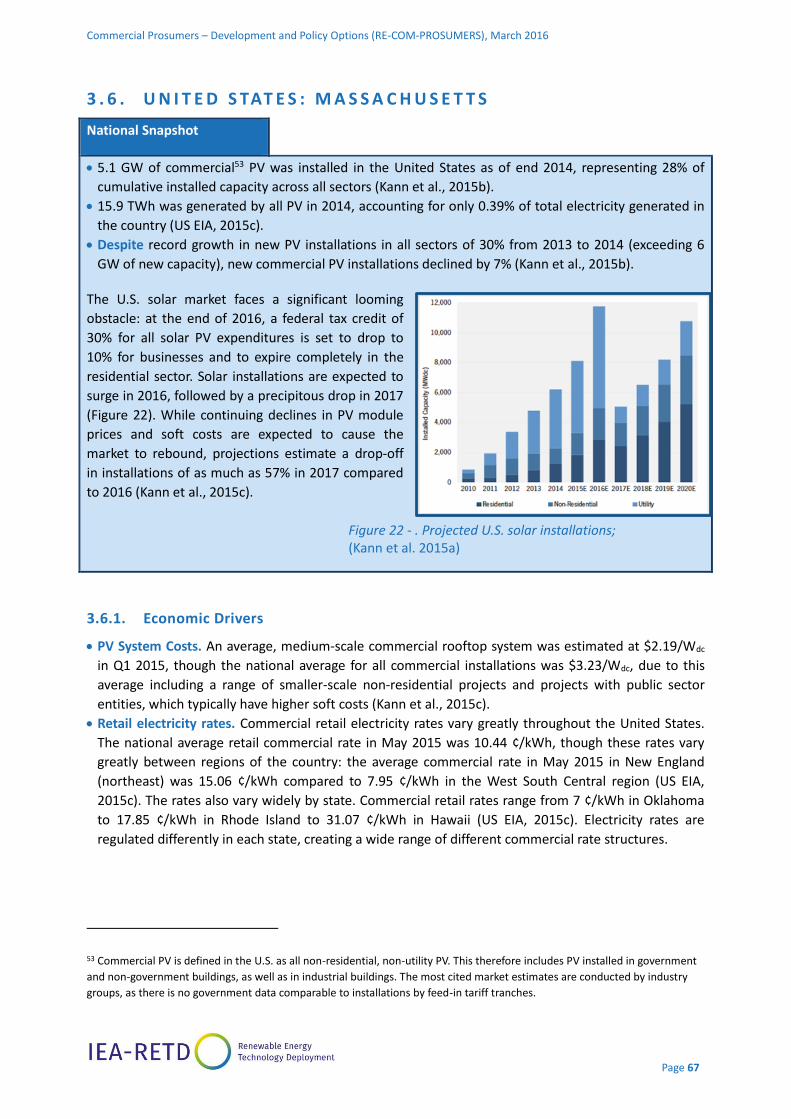
Commercial Prosumers – Development and Policy Options (RE-COM-PROSUMERS), March 2016
Page 67
3 . 6 . U N I T E D S TAT E S : M A S S A C H U S E T T S
National Snapshot
5.1 GW of commercial53 PV was installed in the United States as of end 2014, representing 28% of
cumulative installed capacity across all sectors (Kann et al., 2015b).
15.9 TWh was generated by all PV in 2014, accounting for only 0.39% of total electricity generated in
the country (US EIA, 2015c).
Despite record growth in new PV installations in all sectors of 30% from 2013 to 2014 (exceeding 6
GW of new capacity), new commercial PV installations declined by 7% (Kann et al., 2015b).
The U.S. solar market faces a significant looming
obstacle: at the end of 2016, a federal tax credit of
30% for all solar PV expenditures is set to drop to
10% for businesses and to expire completely in the
residential sector. Solar installations are expected to
surge in 2016, followed by a precipitous drop in 2017
(Figure 22). While continuing declines in PV module
prices and soft costs are expected to cause the
market to rebound, projections estimate a drop-off
in installations of as much as 57% in 2017 compared
to 2016 (Kann et al., 2015c).
3.6.1. Economic Drivers
PV System Costs. An average, medium-scale commercial rooftop system was estimated at $2.19/Wdc
in Q1 2015, though the national average for all commercial installations was $3.23/Wdc, due to this
average including a range of smaller-scale non-residential projects and projects with public sector
entities, which typically have higher soft costs (Kann et al., 2015c).
Retail electricity rates. Commercial retail electricity rates vary greatly throughout the United States.
The national average retail commercial rate in May 2015 was 10.44 ¢/kWh, though these rates vary
greatly between regions of the country: the average commercial rate in May 2015 in New England
(northeast) was 15.06 ¢/kWh compared to 7.95 ¢/kWh in the West South Central region (US EIA,
2015c). The rates also vary widely by state. Commercial retail rates range from 7 ¢/kWh in Oklahoma
to 17.85 ¢/kWh in Rhode Island to 31.07 ¢/kWh in Hawaii (US EIA, 2015c). Electricity rates are
regulated differently in each state, creating a wide range of different commercial rate structures.
53 Commercial PV is defined in the U.S. as all non-residential, non-utility PV. This therefore includes PV installed in government
and non-government buildings, as well as in industrial buildings. The most cited market estimates are conducted by industry
groups, as there is no government data comparable to installations by feed-in tariff tranches.
Figure 22 - . Projected U.S. solar installations; (Kann et al. 2015a)

Commercial Prosumers – Development and Policy Options (RE-COM-PROSUMERS), March 2016
Page 68
The U.S. Energy Information Administration estimates that there are over 3,700 electric utilities with
over 13,000 commercial rate structures (EIA, 2015). As can be seen in Table 14, a survey of 207 rate
structures from 52 major utility companies found the following numbers of rates that included specific
rate elements. The elements below54 are not mutually exclusive. In other words, some rates could
include a flat charge component, a tiered component, and/or a demand charge component.
Table 14 - Rate structure elements in US electricity rates
(Ong et al. 2012)
Insolation. Average daily insolation (GHI) ranges from 5.64 kWh/m2/day in Arizona to 3.6 kWh/m2/day
in Pennsylvania (NREL, 2015).
3.6.2. National Conditions
Roof space. An estimated 2.95 billion m2 of commercial roof space (65% of all commercial roof space)
could be suitable for PV (Chaudhari et al., 2005). Total PV technical potential has been estimated to be
424 GW, with a potential annual output of 542 TWh (Paidipati et al., 2008).55
Share of rental property. The 2012 Commercial Buildings Energy Consumption Survey estimates
approximately 6.27 million m2 of non-governmental commercial buildings in the US. 36% of the 4.6
million m2 of non-governmental commercial buildings are leased as opposed to 52% that are owner-
occupied and 7% that have space that is both owner-occupied and leased (5% unoccupied). Building
owners are at least partially responsible for building energy system O&M in 85% of buildings and
provide direct input on energy-related equipment purchases in 88% of buildings (US EIA, 2015a).
National electricity demand. Annual electricity demand is projected to grow by 0.9% annually from
2012-2040 (US EIA, 2015b). Annual growth in on-peak summer grid demand is projected to grow by
1.23% annually from 2014-2023 (NERC, 2013).
Building types. The commercial solar market is dominated by larger companies, with the top 25 users
accounting for more than 569 MW, or 11% of all commercial capacity installed as of mid-2014 (SEIA,
2014b). Large “big-box” retailers comprise the majority of these companies, as such companies
typically have large portfolios of flat-roof buildings with suitable building loads in which they have
control of the rooftops, as well as more reliable access to finance.56
54 Tiered rates refer to rates that increase (or decrease) as the amount of electricity consumed increases. 55 Assumes 18% average module efficiency. 56 Based on interviews with US solar installation companies.
Commercial Prosumers – Development and Policy Options (RE-COM-PROSUMERS), March 2016
Page 69
3.6.3. National enabling and constraining policies
National incentives. In addition to the renewable energy investment tax credit discussed above,
under the Modified Accelerated Cost Recovery System (MACRS), companies are able to depreciate the
taxable value of their solar equipment over the course of five years rather than over the lifetime of the
system. Unlike the tax credit, which is set to drop from 30% to 10% at the end of 2016, MACRS has
been in place since 1986 and is likely to remain in place as a reliable measure to enable commercial
prosumers for the foreseeable future (SEIA, 2014a).
A diverse landscape of state policies. Analysing the commercial prosumer landscape in the United
States can be difficult. Despite national policies in place, solar and electricity markets in the U.S. are
more strongly driven at the state level: each of the 50 states are responsible for overseeing utility and
energy policy within their borders. As a result, a mosaic of different energy policies and programs and
electricity markets around the country have resulted in considerably different enabling environments
for commercial prosumers from state-to-state. Forty six states have established net metering
incentives, though eligibility and installation caps vary from state to state (Inskeep et al., 2015).
Twenty-nine states have established mandated renewable portfolio standards (RPS) with a wide range
of targets (e.g. 10% by 2015 in Michigan, 33% by 2020 in California) (DSIRE, 2015). The top 10 states
installed approximately 90% of all new capacity between 2012 and 2014. California alone accounted
for 57% of new capacity installed in 2014 and 48% of all total installed capacity as of end of 2014
(Kann et al., 2015b).
Utilities constraining prosumers. As major stakeholders in the ongoing growth of the solar industry,
many utilities are pushing back against the growth of the solar market around the country. Thirty-four
states lack decoupling policies, which provide utilities with stable revenue regardless of volume of
electricity sales; as utility revenue in these states is tied directly to total sales, utilities are incentivized
to constrain prosumer growth in order to maintain revenue (IEI, 2014). While most states have
established net metering policies, in Q4 2014 alone, 10 states proposed or adopted fixed charge
increases, and 6 states proposed or adopted fixed charges for only net metering customers (Inskeep et
al., 2015).
With the expiration of the investment tax credit, the future of the U.S. commercial solar market is
unclear. The solar industry anticipates that the commercial solar market will rebound after 2017 with a
lingering 10% tax credit and continuing declines in PV module prices. While growth in the commercial
market is likely to continue, led by a number of strong corporate actors, a nationwide commercial
prosumer breakout is not imminent across the U.S. as a whole. Emerging prosumers will continue to be
constrained by economics related to electricity rates, enabling policies, and geography.
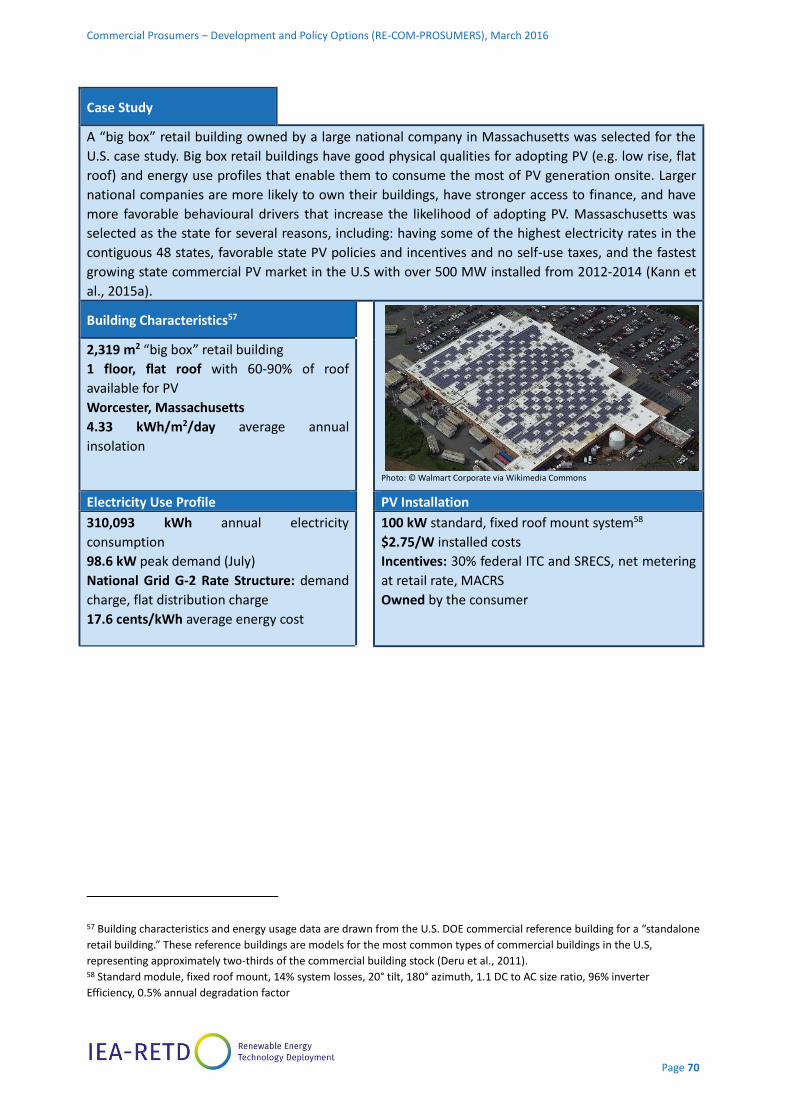
Commercial Prosumers – Development and Policy Options (RE-COM-PROSUMERS), March 2016
Page 70
Case Study
A “big box” retail building owned by a large national company in Massachusetts was selected for the
U.S. case study. Big box retail buildings have good physical qualities for adopting PV (e.g. low rise, flat
roof) and energy use profiles that enable them to consume the most of PV generation onsite. Larger
national companies are more likely to own their buildings, have stronger access to finance, and have
more favorable behavioural drivers that increase the likelihood of adopting PV. Massaschusetts was
selected as the state for several reasons, including: having some of the highest electricity rates in the
contiguous 48 states, favorable state PV policies and incentives and no self-use taxes, and the fastest
growing state commercial PV market in the U.S with over 500 MW installed from 2012-2014 (Kann et
al., 2015a).
Building Characteristics57
Photo: © Walmart Corporate via Wikimedia Commons
2,319 m2 “big box” retail building
1 floor, flat roof with 60-90% of roof
available for PV
Worcester, Massachusetts
4.33 kWh/m2/day average annual
insolation
Electricity Use Profile PV Installation
310,093 kWh annual electricity
consumption
98.6 kW peak demand (July)
National Grid G-2 Rate Structure: demand
charge, flat distribution charge
17.6 cents/kWh average energy cost
100 kW standard, fixed roof mount system58
$2.75/W installed costs
Incentives: 30% federal ITC and SRECS, net metering
at retail rate, MACRS
Owned by the consumer
57 Building characteristics and energy usage data are drawn from the U.S. DOE commercial reference building for a “standalone
retail building.” These reference buildings are models for the most common types of commercial buildings in the U.S,
representing approximately two-thirds of the commercial building stock (Deru et al., 2011). 58 Standard module, fixed roof mount, 14% system losses, 20° tilt, 180° azimuth, 1.1 DC to AC size ratio, 96% inverter
Efficiency, 0.5% annual degradation factor
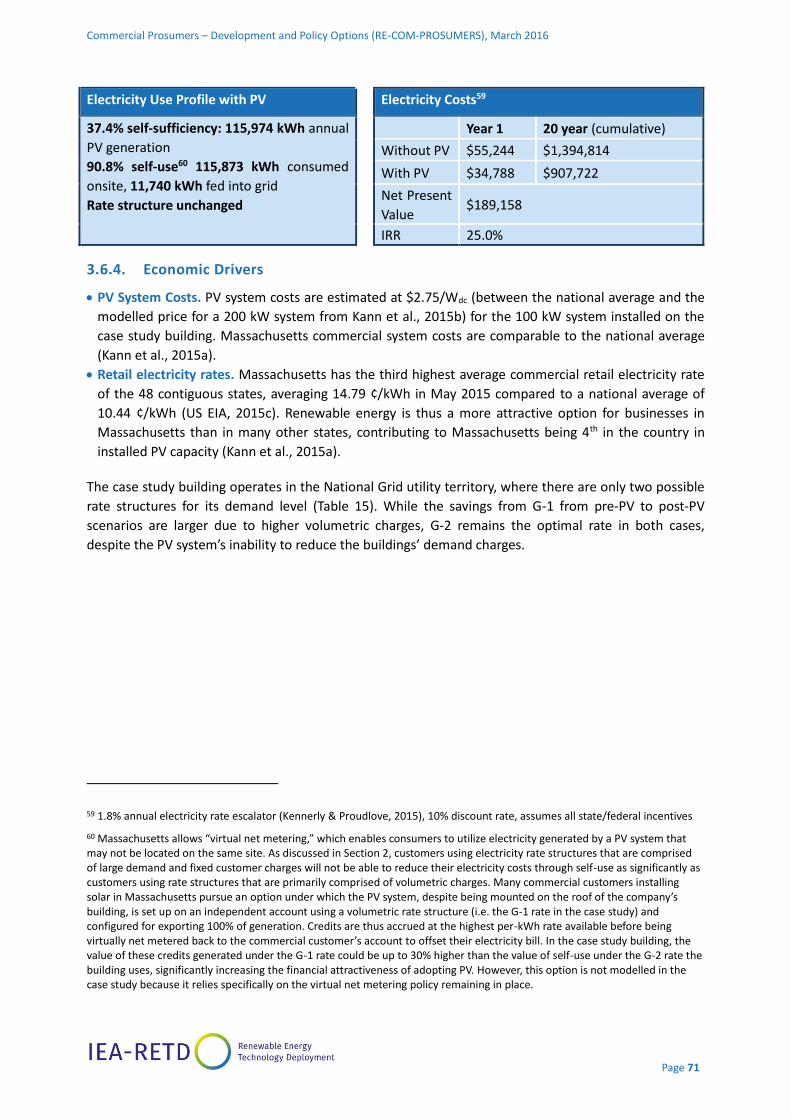
Commercial Prosumers – Development and Policy Options (RE-COM-PROSUMERS), March 2016
Page 71
Electricity Use Profile with PV Electricity Costs59
37.4% self-sufficiency: 115,974 kWh annual
PV generation
90.8% self-use60 115,873 kWh consumed
onsite, 11,740 kWh fed into grid
Rate structure unchanged
Year 1 20 year (cumulative)
Without PV $55,244 $1,394,814
With PV $34,788 $907,722
Net Present
Value $189,158
IRR 25.0%
3.6.4. Economic Drivers
PV System Costs. PV system costs are estimated at $2.75/Wdc (between the national average and the
modelled price for a 200 kW system from Kann et al., 2015b) for the 100 kW system installed on the
case study building. Massachusetts commercial system costs are comparable to the national average
(Kann et al., 2015a).
Retail electricity rates. Massachusetts has the third highest average commercial retail electricity rate
of the 48 contiguous states, averaging 14.79 ¢/kWh in May 2015 compared to a national average of
10.44 ¢/kWh (US EIA, 2015c). Renewable energy is thus a more attractive option for businesses in
Massachusetts than in many other states, contributing to Massachusetts being 4th in the country in
installed PV capacity (Kann et al., 2015a).
The case study building operates in the National Grid utility territory, where there are only two possible
rate structures for its demand level (Table 15). While the savings from G-1 from pre-PV to post-PV
scenarios are larger due to higher volumetric charges, G-2 remains the optimal rate in both cases,
despite the PV system’s inability to reduce the buildings’ demand charges.
59 1.8% annual electricity rate escalator (Kennerly & Proudlove, 2015), 10% discount rate, assumes all state/federal incentives
60 Massachusetts allows “virtual net metering,” which enables consumers to utilize electricity generated by a PV system that may not be located on the same site. As discussed in Section 2, customers using electricity rate structures that are comprised of large demand and fixed customer charges will not be able to reduce their electricity costs through self-use as significantly as customers using rate structures that are primarily comprised of volumetric charges. Many commercial customers installing solar in Massachusetts pursue an option under which the PV system, despite being mounted on the roof of the company’s building, is set up on an independent account using a volumetric rate structure (i.e. the G-1 rate in the case study) and configured for exporting 100% of generation. Credits are thus accrued at the highest per-kWh rate available before being virtually net metered back to the commercial customer’s account to offset their electricity bill. In the case study building, the value of these credits generated under the G-1 rate could be up to 30% higher than the value of self-use under the G-2 rate the building uses, significantly increasing the financial attractiveness of adopting PV. However, this option is not modelled in the case study because it relies specifically on the virtual net metering policy remaining in place.
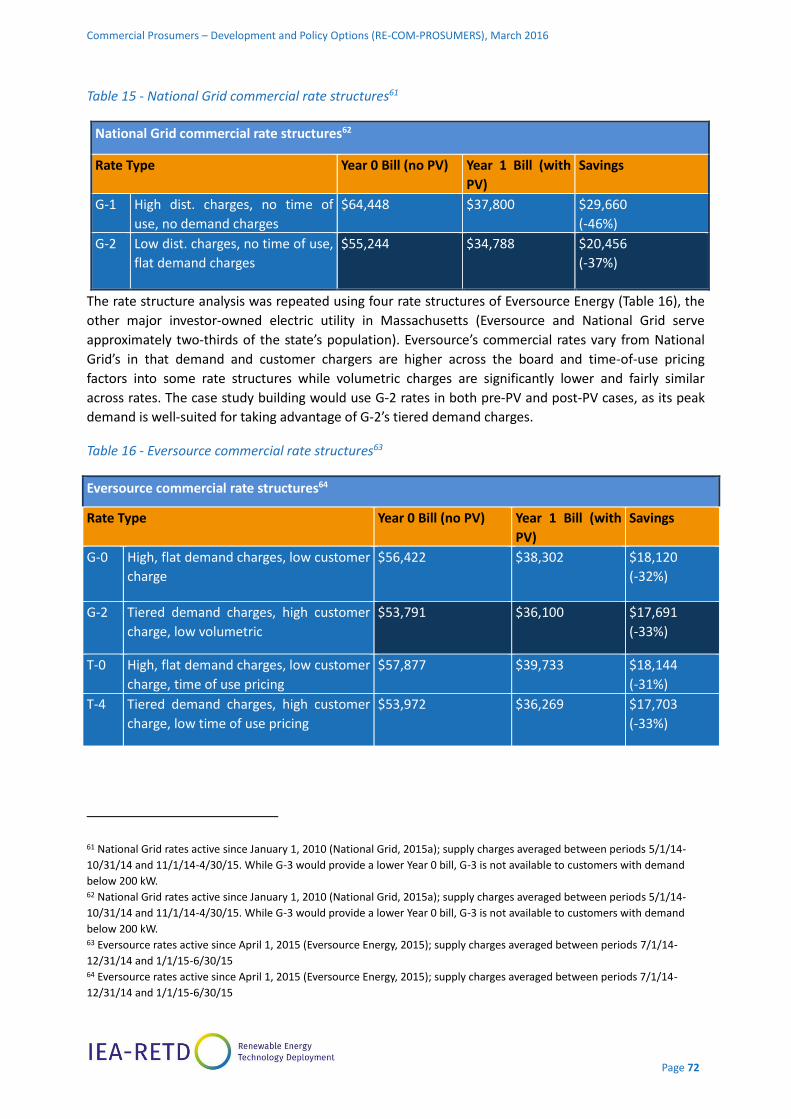
Commercial Prosumers – Development and Policy Options (RE-COM-PROSUMERS), March 2016
Page 72
Table 15 - National Grid commercial rate structures61
National Grid commercial rate structures62
Rate Type Year 0 Bill (no PV) Year 1 Bill (with
PV)
Savings
G-1 High dist. charges, no time of
use, no demand charges
$64,448 $37,800 $29,660
(-46%)
G-2 Low dist. charges, no time of use,
flat demand charges
$55,244 $34,788 $20,456
(-37%)
The rate structure analysis was repeated using four rate structures of Eversource Energy (Table 16), the
other major investor-owned electric utility in Massachusetts (Eversource and National Grid serve
approximately two-thirds of the state’s population). Eversource’s commercial rates vary from National
Grid’s in that demand and customer chargers are higher across the board and time-of-use pricing
factors into some rate structures while volumetric charges are significantly lower and fairly similar
across rates. The case study building would use G-2 rates in both pre-PV and post-PV cases, as its peak
demand is well-suited for taking advantage of G-2’s tiered demand charges.
Table 16 - Eversource commercial rate structures63
Eversource commercial rate structures64
Rate Type Year 0 Bill (no PV) Year 1 Bill (with
PV)
Savings
G-0 High, flat demand charges, low customer
charge
$56,422 $38,302 $18,120
(-32%)
G-2 Tiered demand charges, high customer
charge, low volumetric
$53,791 $36,100 $17,691
(-33%)
T-0 High, flat demand charges, low customer
charge, time of use pricing
$57,877 $39,733 $18,144
(-31%)
T-4 Tiered demand charges, high customer
charge, low time of use pricing
$53,972 $36,269 $17,703
(-33%)
61 National Grid rates active since January 1, 2010 (National Grid, 2015a); supply charges averaged between periods 5/1/14-
10/31/14 and 11/1/14-4/30/15. While G-3 would provide a lower Year 0 bill, G-3 is not available to customers with demand
below 200 kW. 62 National Grid rates active since January 1, 2010 (National Grid, 2015a); supply charges averaged between periods 5/1/14-
10/31/14 and 11/1/14-4/30/15. While G-3 would provide a lower Year 0 bill, G-3 is not available to customers with demand
below 200 kW. 63 Eversource rates active since April 1, 2015 (Eversource Energy, 2015); supply charges averaged between periods 7/1/14-
12/31/14 and 1/1/15-6/30/15 64 Eversource rates active since April 1, 2015 (Eversource Energy, 2015); supply charges averaged between periods 7/1/14-
12/31/14 and 1/1/15-6/30/15
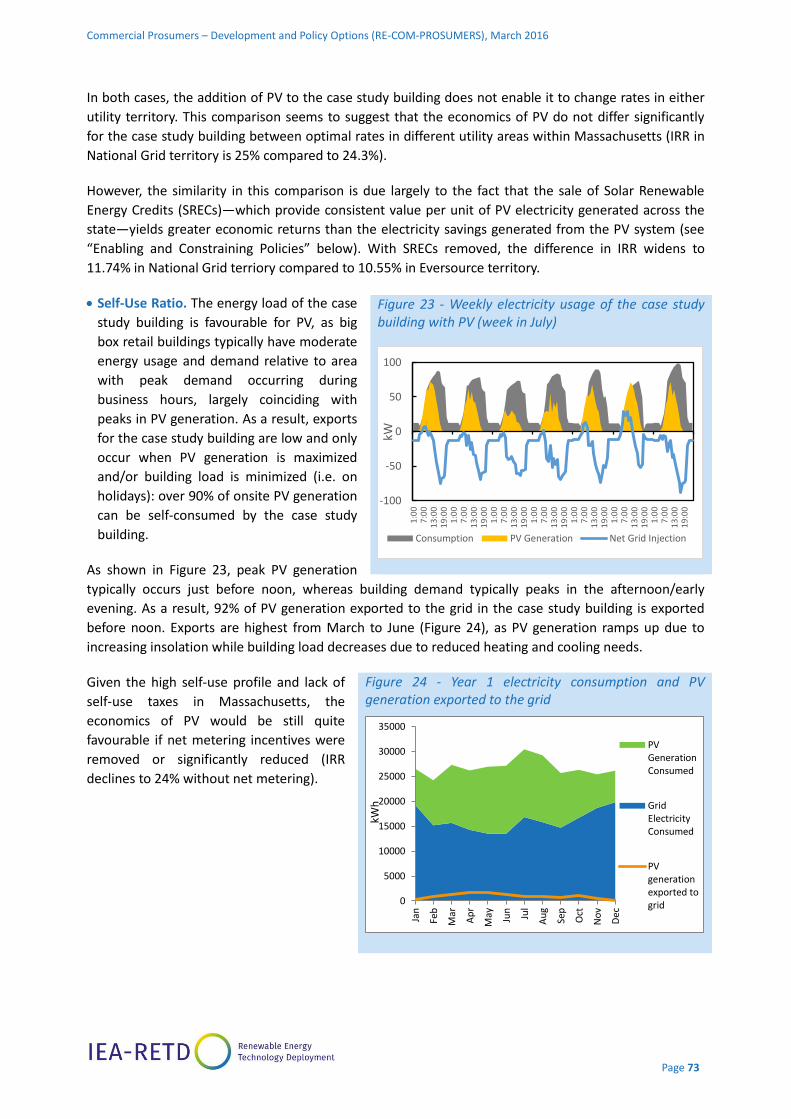
Commercial Prosumers – Development and Policy Options (RE-COM-PROSUMERS), March 2016
Page 73
In both cases, the addition of PV to the case study building does not enable it to change rates in either
utility territory. This comparison seems to suggest that the economics of PV do not differ significantly
for the case study building between optimal rates in different utility areas within Massachusetts (IRR in
National Grid territory is 25% compared to 24.3%).
However, the similarity in this comparison is due largely to the fact that the sale of Solar Renewable
Energy Credits (SRECs)—which provide consistent value per unit of PV electricity generated across the
state—yields greater economic returns than the electricity savings generated from the PV system (see
“Enabling and Constraining Policies” below). With SRECs removed, the difference in IRR widens to
11.74% in National Grid terriory compared to 10.55% in Eversource territory.
Self-Use Ratio. The energy load of the case
study building is favourable for PV, as big
box retail buildings typically have moderate
energy usage and demand relative to area
with peak demand occurring during
business hours, largely coinciding with
peaks in PV generation. As a result, exports
for the case study building are low and only
occur when PV generation is maximized
and/or building load is minimized (i.e. on
holidays): over 90% of onsite PV generation
can be self-consumed by the case study
building.
As shown in Figure 23, peak PV generation
typically occurs just before noon, whereas building demand typically peaks in the afternoon/early
evening. As a result, 92% of PV generation exported to the grid in the case study building is exported
before noon. Exports are highest from March to June (Figure 24), as PV generation ramps up due to
increasing insolation while building load decreases due to reduced heating and cooling needs.
Given the high self-use profile and lack of
self-use taxes in Massachusetts, the
economics of PV would be still quite
favourable if net metering incentives were
removed or significantly reduced (IRR
declines to 24% without net metering).
Figure 23 - Weekly electricity usage of the case study building with PV (week in July)
Figure 24 - Year 1 electricity consumption and PV generation exported to the grid
-100
-50
0
50
100
1:0
07
:00
13:
001
9:00
1:0
07
:00
13:
001
9:00
1:0
07
:00
13:
001
9:00
1:0
07
:00
13:
001
9:00
1:0
07
:00
13:
001
9:00
1:0
07
:00
13:
001
9:00
1:0
07
:00
13:
001
9:00
kW
Consumption PV Generation Net Grid Injection
0
5000
10000
15000
20000
25000
30000
35000
Jan
Feb
Mar
Ap
r
May Jun
Jul
Au
g
Sep
Oct
No
v
Dec
kWh
PVGenerationConsumed
GridElectricityConsumed
PVgenerationexported togrid
Commercial Prosumers – Development and Policy Options (RE-COM-PROSUMERS), March 2016
Page 74
Access to finance. Access to finance and creditworthiness is a significant barrier to adoption of
commercial PV, regardless of whether the company seeks to own the system or pursue a third-party
ownership option like a PPA. Small businesses can have difficulties in obtaining solar financing due to
difficulties in assessing their creditworthiness (Penn, 2015). Large national retail chains have
comparably better access to credit than small businesses or franchises.
3.6.5. Behavioural Drivers
The retail buildings most likely to adopt PV are large national chains with an extensive portfolio of
buildings they own (or have control over through a long-term lease) and strong access to finance. This
is reflected at the national level, where 7 of the top 10 companies in installed capacity are large chain
retailers (i.e. Walmart, Kohl’s, Costco, IKEA, Macy’s, Target, and Staples), who alone account for nearly
300 MW in cumulative installed capacity (SEIA, 2014b).
Large national chains are also likely to have corporate sustainability plans than smaller similar
companies (KPMG, 2011). Thus such companies may be willing to accept lower economic returns when
investing in renewable energy.
3.6.6. National Conditions
Roof space. Big-box retail buildings typically have flat rooftops with a majority of roof space available
for PV. Retail buildings without significant refrigeration needs (i.e. less roof space needed for HVAC
equipment) can install PV on close to 90% of available roof space (IKEA, 2015).
The technical potential of all commercial rooftop PV in Massachusetts was estimated at 3.1 GW in
2008 (Navigant Consulting, 2008).
Share of rental property. Large national chains that often own big-box retail buildings are more likely
to own the occupied building and are also more likely to be anchor tenants in retail malls with longer
leases of 20 years or more. Chain retailers or real estate management companies with large numbers
of buildings in their portfolios might be able to work with PV developers to negotiate lower installed
costs across their portfolios (e.g. 10 MW pricing for 100 kW installations on 100 locations), improving
the favourability of PV economics.
Existing and planned RE development. Massachusetts is one of the strongest solar markets in the
country, ranking sixth in overall installed capacity and fourth in new installed capacity in 2014 (Kann et
al., 2015b). Despite the decline in commercial PV growth nationally from 2013 to 2014, the
Massachusetts commercial market grew by 26% between 2013 and 2014.
3.6.7. Enabling and constraining policies
Favourable policy landscape. In 2007, the Commonwealth of Massachusetts set a goal of installing
250 MW of PV throughout the state by 2017. After this goal and a 400 MW cap on the state’s PV
incentive program were both passed in 2013, the state set a more ambitious goal of 1,600 MW by
2020 (von Kreutzbruck, 2013).

Commercial Prosumers – Development and Policy Options (RE-COM-PROSUMERS), March 2016
Page 75
Strong solar PV incentives. Massachusetts has a robust net metering policy that allows PV systems of
up to 2 MW to receive close to the retail rate for generation exported to the grid. Unlike most states,
Massachusetts also permits virtual net metering, which allows PV systems to generate net metering
credits even when the electricity is generated off-site (EOEEA, 2015c). However, the overall statewide
net metering capacity cap for systems over 60 kW as well as many smaller systems65 was set at 1 GW
across for each major utility territory. Caps in many utility territories, including the largest investor-
owned utility territory in the state, have been reached or are close to being reached, and prolonged
political debate over the future of this program has created uncertainty for commercial entities
interested in pursuing solar.
In addition to net metering, the Solar Carve-Out program within the state’s Renewable Portfolio
Standard (RPS), now in its second phase, awards one SREC to system owners for every 1 MWh produced
by systems under 25 kW, solar canopy systems, emergency power systems, community solar, and PV
installed on low income housing (EOEEA, 2015a). Other system types are awarded less than one SREC
for each MWh, depending on factors such as system size and location. These SRECs can be sold to retail
electricity suppliers to meet their RPS compliance obligations (EOEEA, 2015b).
3.6.8. Potential for commercial prosumers in Massachusetts
Technical potential for deployment. As discussed above, the technical potential of all commercial
rooftop PV in Massachusetts was estimated at 3.1 GW in 2008. This estimate is unlikely to be achieved
due to limiting factors related to building suitability and ownership profile: less than half of non-
governmental building floor space in the northeast is solely owner occupied (US EIA, 2015a). It is
estimated that roughly 1.1 GW of rooftop commercial PV could be achieved in Massachusetts.66 Current
commercial PV growth rates in Massachusetts are the highest in the nation, and this potential may be
approached under current incentives and policies. However, given the popularity of the PPA among
commercial entities, only a minority of this capacity will be installed by commercial prosumers.
Reliance on incentives for system economics. Massachusetts’ favourability for investments in PV is
primarily due to the generous incentives it offers for PV through its SREC and net metering policies.
While many commercial buildings are able to self-consume the vast majority of PV generation (which
reduces the reliance on net metering), the value of SRECs is significant: in the case study building, SRECs
alone paid back the full, unincentivized cost of the system within 9 years.
65 Systems under 10 kW on a single-phase circuit and systems under 25 kW on a three-phase circuit are exempt from the net metering caps altogether. All other PV systems are subject to the net metering cap and must reserve cap allocation in order to guarantee net metering eligibility.
66 We acknowledge that this estimate ignores a number of factors for which solid data for the entire state is unavailable,
including, but not limited to: proportion of creditworthy building owners, proportion of roofs suitable for PV installation,
proportion of tenant-occupied buildings that would still opt to install PV, proportion of commercial PV installed under PPA, etc.
We focus on owner occupancy as a key statistic, given the factors described earlier in this case study.
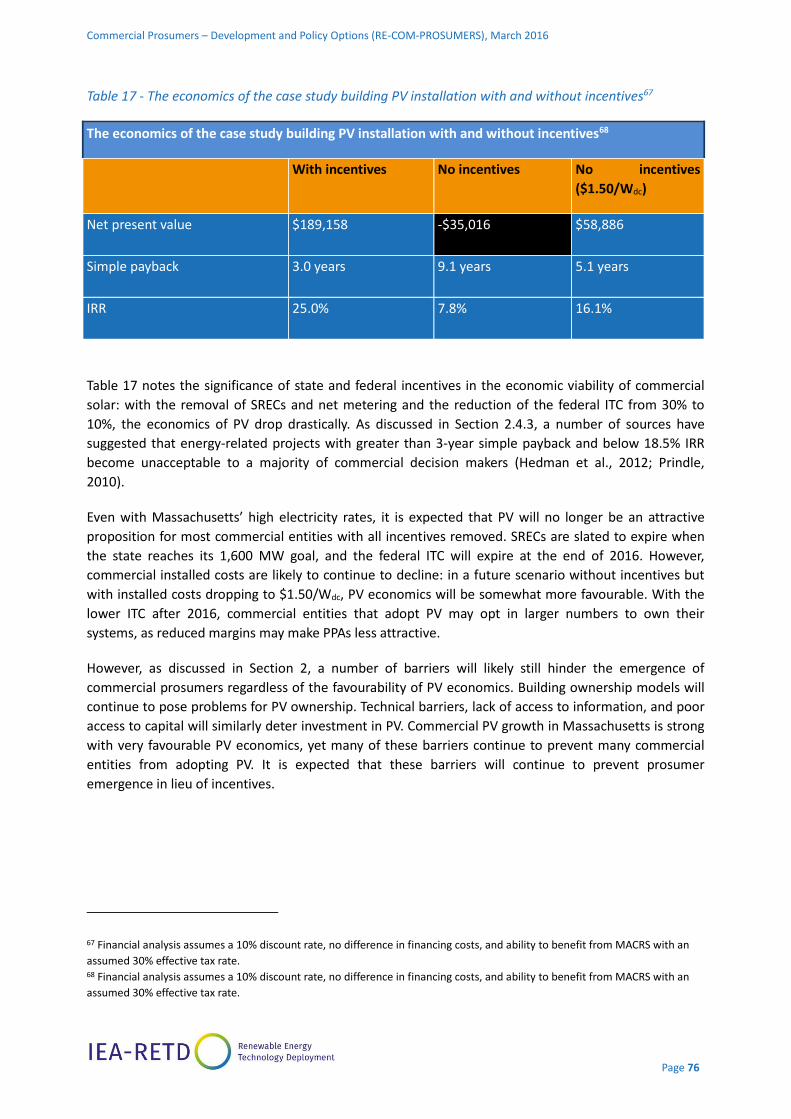
Commercial Prosumers – Development and Policy Options (RE-COM-PROSUMERS), March 2016
Page 76
Table 17 - The economics of the case study building PV installation with and without incentives67
The economics of the case study building PV installation with and without incentives68
With incentives No incentives No incentives
($1.50/Wdc)
Net present value $189,158 -$35,016 $58,886
Simple payback 3.0 years 9.1 years 5.1 years
IRR 25.0% 7.8% 16.1%
Table 17 notes the significance of state and federal incentives in the economic viability of commercial
solar: with the removal of SRECs and net metering and the reduction of the federal ITC from 30% to
10%, the economics of PV drop drastically. As discussed in Section 2.4.3, a number of sources have
suggested that energy-related projects with greater than 3-year simple payback and below 18.5% IRR
become unacceptable to a majority of commercial decision makers (Hedman et al., 2012; Prindle,
2010).
Even with Massachusetts’ high electricity rates, it is expected that PV will no longer be an attractive
proposition for most commercial entities with all incentives removed. SRECs are slated to expire when
the state reaches its 1,600 MW goal, and the federal ITC will expire at the end of 2016. However,
commercial installed costs are likely to continue to decline: in a future scenario without incentives but
with installed costs dropping to $1.50/Wdc, PV economics will be somewhat more favourable. With the
lower ITC after 2016, commercial entities that adopt PV may opt in larger numbers to own their
systems, as reduced margins may make PPAs less attractive.
However, as discussed in Section 2, a number of barriers will likely still hinder the emergence of
commercial prosumers regardless of the favourability of PV economics. Building ownership models will
continue to pose problems for PV ownership. Technical barriers, lack of access to information, and poor
access to capital will similarly deter investment in PV. Commercial PV growth in Massachusetts is strong
with very favourable PV economics, yet many of these barriers continue to prevent many commercial
entities from adopting PV. It is expected that these barriers will continue to prevent prosumer
emergence in lieu of incentives.
67 Financial analysis assumes a 10% discount rate, no difference in financing costs, and ability to benefit from MACRS with an
assumed 30% effective tax rate. 68 Financial analysis assumes a 10% discount rate, no difference in financing costs, and ability to benefit from MACRS with an
assumed 30% effective tax rate.
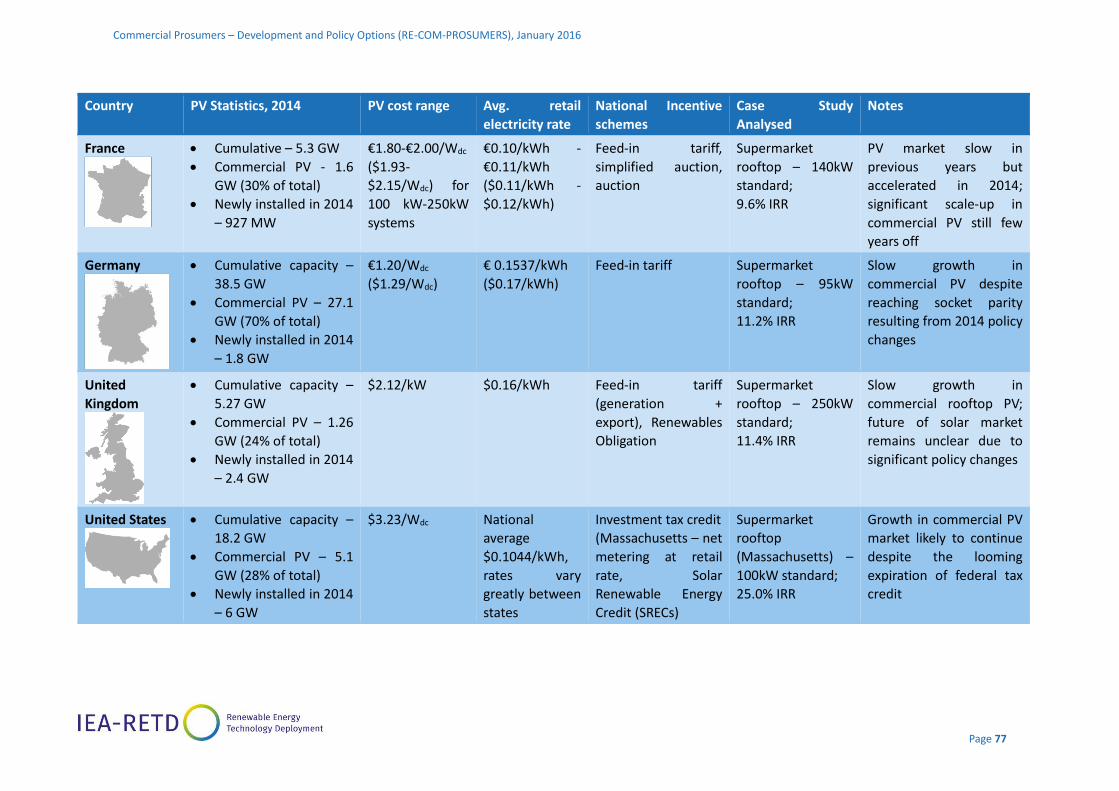
Commercial Prosumers – Development and Policy Options (RE-COM-PROSUMERS), January 2016
Page 77
Country PV Statistics, 2014 PV cost range Avg. retail
electricity rate
National Incentive
schemes
Case Study
Analysed
Notes
France
Cumulative – 5.3 GW
Commercial PV - 1.6
GW (30% of total)
Newly installed in 2014
– 927 MW
€1.80-€2.00/Wdc
($1.93-
$2.15/Wdc) for
100 kW-250kW
systems
€0.10/kWh -
€0.11/kWh
($0.11/kWh -
$0.12/kWh)
Feed-in tariff,
simplified auction,
auction
Supermarket
rooftop – 140kW
standard;
9.6% IRR
PV market slow in
previous years but
accelerated in 2014;
significant scale-up in
commercial PV still few
years off
Germany
Cumulative capacity –
38.5 GW
Commercial PV – 27.1
GW (70% of total)
Newly installed in 2014
– 1.8 GW
€1.20/Wdc
($1.29/Wdc)
€ 0.1537/kWh
($0.17/kWh)
Feed-in tariff Supermarket
rooftop – 95kW
standard;
11.2% IRR
Slow growth in
commercial PV despite
reaching socket parity
resulting from 2014 policy
changes
United
Kingdom
Cumulative capacity –
5.27 GW
Commercial PV – 1.26
GW (24% of total)
Newly installed in 2014
– 2.4 GW
$2.12/kW $0.16/kWh Feed-in tariff
(generation +
export), Renewables
Obligation
Supermarket
rooftop – 250kW
standard;
11.4% IRR
Slow growth in
commercial rooftop PV;
future of solar market
remains unclear due to
significant policy changes
United States
Cumulative capacity –
18.2 GW
Commercial PV – 5.1
GW (28% of total)
Newly installed in 2014
– 6 GW
$3.23/Wdc National
average
$0.1044/kWh,
rates vary
greatly between
states
Investment tax credit
(Massachusetts – net
metering at retail
rate, Solar
Renewable Energy
Credit (SRECs)
Supermarket
rooftop
(Massachusetts) –
100kW standard;
25.0% IRR
Growth in commercial PV
market likely to continue
despite the looming
expiration of federal tax
credit
Commercial Prosumers – Development and Policy Options (RE-COM-PROSUMERS), January 2016
Page 78
4 CO N C LU S I O N S A ND NE X T S TE P S
4 . 1 . C O N C L U S I O N S
The RE-PROSUMERS study concluded that a residential prosumer revolution is not yet here. The same
conclusion can be reached for commercial prosumers, although the drivers for residential and commercial
prosumers in many countries are different. In many OECD countries, for example, the drivers that would
support commercial prosumer emergence (e.g. lower installed cost and higher self-use) are offset by drivers
that decrease PV competitiveness in the commercial sector (e.g. lower electricity rates and higher return
expectations for investment). The constraining drivers are further compounded by complex decision making
processes in the commercial sector. Lessons from the energy efficiency industry demonstrate that highly
attractive investments in onsite energy can be challenging for many institutions to effectively identify,
prioritize, and pursue. Corporate values can drive investment in PV (e.g. IKEA’s program to install rooftop
solar), but examples of such behaviour remain the exception.
Overall, commercial prosumers have been slow to emerge on an “incentive free” basis in the markets
analysed in this study. There is anecdotal evidence of some commercial prosumers installing systems
without incentives, but this practice is not widespread: reported installations in the countries analysed in
this study are almost all installed through national incentive programs. In the case study countries,
commercial PV systems in general are a smaller share of the PV market than residential and utility-scale
systems, and in some cases their market share is declining. In the UK, over 80% of new installations in 2014
were ground-mounted or below 10 kW as opposed to commercial-scale systems. Germany’s PV market has
declined since peaking in 2012, with much of the drop off decrease in commercial-scale installations. In the
U.S., the commercial PV market has been overtaken by the residential market in recent years. In France, a
number of pilot commercial prosumer projects are being developed in different regions of the country.
The slow emergence of commercial prosumers can be attributed to unattractive economics and/or the
presence of more attractive alternatives to onsite consumption (e.g. feed-in tariff payments set above the
retail rate). In the UK and the US, the financial case for commercial PV has been driven by incentives (e.g.
the investment tax credit in the U.S. and feed-in tariffs in the UK). Without these policies, it remains difficult
for commercial PV systems to meet typical commercial return expectations. In France, electricity prices for
the commercial sector have historically been below the generation cost of PV, with the result that most
commercial PV systems developed thus far have opted to sell all their generation under the feed-in tariff or
auction policies rather than consuming onsite.
Commercial prosumers may be less sensitive to export policies than residential customers. Commercial
electricity consumers have higher minimum and steadier onsite demand than residential consumers do. As
a result, it is easier to match PV system output with onsite demand. Commercial prosumers may therefore
be better positioned than residential customers are to emerge in environments where electricity export
policies are not in place (or where electricity export policies have been reduced or curtailed).

Commercial Prosumers – Development and Policy Options (RE-COM-PROSUMERS), January 2016
Page 79
Some jurisdictions have introduced new taxes or charges that have constrained commercial prosumers. In
Germany, PV for self-use is economically attractive due to high electricity prices, especially as feed-in tariff
rates for exported power continue to fall. Commercial prosumers were projected to emerge in Germany
based on the alignment of market drivers there in 2012-2014. However, the German case study reveals the
important role of policymakers in incentivizing or dis-incentivizing self-use of solar PV in the commercial
sector. Even though the policy changes introduced in 2014 – i.e. making prosumers pay 30-40% of the EEG
surcharge on self-consumed electricity – seem to be marginal, they severely impacted the economics of
prosumers in the commercial sector and have delayed prosumer emergence.69 Policies can modify the cost
competitiveness benchmark for self-consumed PV electricity by making prosumers pay (or not) for certain
surcharges and taxes which are part of the retail electricity price.
Countries do not yet have clear commercial prosumer strategies in place, even though some countries are
requiring significant onsite energy reductions through policy. None of the countries profiled in this report
have yet developed a clear commercial prosumer strategy, which may complicate the achievement of
parallel policies that require significant building energy reductions. In EU, for example, the 2010 Energy
Performance of Buildings Directive requires member states to pass legislation that require all new buildings
to be zero energy buildings by 2021. For instance In Germany, the requirements for more energy efficient
buildings are already regulated by the Energy Saving Ordinance (Energieeinsparverordnung, (EnEV)). The
next EnEV amendment will take place in 2016 and will implement the nearly-zero energy building standard
in order to meet the EU requirements. In order to reach these ambitious building codes, distributed
renewable energy technologies (and likely self-consumption) will be required. At present, however, there
appears to be either a lack of targeted commercial prosumer policy making in most countries or policies
that are instead constraining commercial prosumer development.
4 . 2 . N E X T S T E P S A N D P O L I C Y O P T I O N S
As discussed in the section above, commercial prosumer markets are not yet growing at a sufficient pace to
keep up with growth in the residential sector and there are only a few examples of jurisdictions that have
articulated specific policy strategies to support commercial prosumers (e.g. Singapore). At the same time,
there are strong arguments for targeted commercial sector support in order to respond to low- or zero-net
energy building codes and requirements, for example, to reduce carbon emissions from buildings in a
rapidly urbanizing world, to mitigate the strain on distribution networks by directly serving commercial
loads with onsite generation, or to better position the commercial sector to capture economic benefit from
onsite PV should the trend toward distributed system architecture continue.
69 The impact on the residential prosumers was much smaller, since small-scale system (up to 10 kW) are exempt and because the
cost difference is larger between retail residential prices (about 30 € cent/kWh) and the LCOE of small-scale PV system (less than 15
€ cent/kWh).

Commercial Prosumers – Development and Policy Options (RE-COM-PROSUMERS), January 2016
Page 80
As described in Section 2.4, the commercial uptake of onsite sustainable energy may be slow even when the
economic case is compelling. If policymakers – and other stakeholders such as project developers or
industry associations – are seeking to enable (rather than constrain) commercial prosumers going forward,
then more targeted efforts may be useful in order to position building owners to adopt PV both under
current incentive regimes and on an “incentive free” basis in the future. These efforts could include, for
example:
Develop new policies to remunerate excess generation for commercial, customer-sited PV projects. Since
some commercial buildings currently opt not to export electricity to the grid, or size their systems to
minimum load to avoid having to export power to the grid, export polices may not be as important as they
are for many residential prosumers. However, policy makers can significantly impact the growth and
development of the commercial prosumer sector by introducing (or simply improving) the rules governing
the treatment of net excess generation.
For countries that wish to maximize the amount of commercial roof-space developed for PV, export policies
will likely need to be revised. In jurisdictions with comparatively high commercial retail prices, such as
Germany or Italy, export compensation could be below the full retail rate and would therefore differ from
traditional net metering; it could also involve actual remuneration for project output, rather than simply a
bill credit, though set at a rate that is below the commercial retail rate paid. In jurisdictions with
comparatively low commercial retail rates, such as France, traditional net metering may be sufficient to
create a viable on-ramp for commercial customers, particularly if PV prices continue to drop, and retail
prices continue to rise. Further policy options can be seen in the value of solar tariffs being introduced in
part of the U.S., new net billing arrangements emerging in certain island regions, as well as other innovative
mechanisms for compensating net excess generation.
Beyond variations on traditional export policies, governments could also explore new policy frameworks for
commercial customers to participate in the electricity market, such as allowing commercial prosumers to
transfer excess electricity to other commercial accounts (e.g. via virtual net metering or retail wheeling), by
allowing commercial solar PV systems to aggregate and participate in the wholesale market, and/or
enabling adjacent commercial entities to create their own microgrids.
Deploy instruments that specifically support commercial systems or that mitigate barriers that are
particularly prevalent among commercial buildings. Models under which commercial prosumer self-use
occurs without incentives have not yet emerged widely; as a result, there is not yet a wide spectrum of
experience on how to best support their development. As a result, pilots such as the self-use auction
conducted in Poitou-Charentes in France could be helpful for government, industry, and commercial sector
stakeholders to build a track record of experience. In order to address ownership split incentive issues,
policymakers could consider the development of policies or programs to allow for the transfer of PV
systems (e.g. UK) or the creation of green leases (e.g. in the U.S. state of California). In order to address the
difficulty of small- to medium-sized enterprises to secure financing, targeted loan or credit support
programs (e.g. loan loss reserves) can be deployed to help jumpstart the flow of capital.
Commercial Prosumers – Development and Policy Options (RE-COM-PROSUMERS), January 2016
Page 81
Invest in improved data on available national commercial building stock. Some countries conduct detailed
surveys of the number and type of commercial buildings, as well as energy usage within those building
types. If jurisdictions do not keep or frequently update such statistics, it can be difficult for policymakers to
make informed decisions on how best to target their interventions and what the outcomes may be. In
parallel, technical rooftop potential studies specifically aimed at the commercial sector, and broken out by
building type, could be conducted.
Define broad characterizations of commercial building type according to the factors that may influence
decision making. As discussed in Section 2.3, factors such as building ownership type, ownership strategy,
lease type, lease duration, and property management strategy, among others, can each have bearing on PV
investment decisions. To the extent that certain property ownership types can be broadly associated with
specific building types, policy interventions can be tailored accordingly. As discussed in Section 2.3, it may
difficult in some countries to identify any correlation between building type and ownership. Even if broad
categorizations are not feasible, however, the development of a basic map of different building ownership
considerations and their implications for energy decision making can be useful for understanding how to
appropriately customize policy support.
Analyse commercial diffusion patterns and behavioural drivers. The dynamics of PV adoption within both
the residential and commercial markets remain relatively opaque, although there have been some studies
of PV diffusion in recent years, such as by the U.S. Sunshot Initiative.70 In order for policymakers and other
stakeholders to target future initiatives, it would be useful to better understand how PV systems have
diffused within the commercial sector and why commercial entities have adopted PV (e.g. internal priorities
vs. benchmarking against peers).
Develop tools for decision makers. Project developers can equip commercial decision makers, project
managers, and facilities staff with the tools to assess and navigate the complexities of internal decision
making related to energy. These could include, for example, guides that describe specifically how different
institutional departments (e.g. finance, public relations, etc.) may influence PV investment, how they can
best be engaged (including the information required for efficient engagement), and the spectrum of
practices (from standard to innovative) that are utilized by other institutions facing similar circumstances.
Such guides and catalogues of peer practice can be organized according to frameworks such as the virtuous
cycle (Section 2.4.6).
Develop programs that specifically target areas of commercial decision making. Policymakers and local
decision-makers can assess the institutional needs of specific commercial entities (e.g. supermarkets) and
craft appropriate local regulation. For commercial buildings where onsite technical know-how is a serious
human resource challenge, for example, focused training programs or on-call PV technical assistance can be
provided. In industries where the institutions have trouble securing debt, specific financing programs can be
deployed. For institutions that heavily value their public image, policymakers can create public relations
opportunities around competitions, recognition campaigns, and other public-private awareness raising
efforts.
70 See : http://energy.gov/eere/sunshot/solar-energy-evolution-and-diffusion-studies
Commercial Prosumers – Development and Policy Options (RE-COM-PROSUMERS), January 2016
Page 82
These types of targeted initiatives for commercial adoption represent a different approach than standard
incentive programs and would require resources to be focused intensively in specific sectors. Given the size
and diversity of the commercial sector, project developers and other stakeholders considering such
approaches could initially target commercial entities with high potential for PV adoption in order to pilot
these approaches and create the potential for them to lead by example.
Maintain policy stability for the commercial prosumer sector. The policy landscape for PV around the
world has remained dynamic as PV costs have continued to fall. Many countries have decreased, phased
out, or otherwise adjusted their PV support policies in response to (or in anticipation of) rapid PV market
growth. Policymakers may wish to maintain stable policy conditions for commercial prosumers in order
avoid the dramatic commercial slowdown observed in some countries.
Examine commercial rate structures to assess to what extent the fixed, non-volumetric elements of rates
restrict the attractiveness of customer-sited PV. As highlighted in RE-PROSUMERS, excessive fixed charges
can significantly restrict the economic attractiveness of PV. This is arguably even more important in the case
of commercial prosumers, as excessive fixed charges may incentivize grid defection if storage, microgrids,
and other technology costs continue to decline rapidly, or if innovative business models enable new ways of
securing flexible and reliable power supply without relying on traditional utilities.
At the heart of the debate around the rise of prosumers are a host of questions about what the role of
electricity consumers should be in the future evolution of the electricity system. As the cost of onsite
generation comes to undercut the cost of grid-based supply in a growing number of markets, a new
policy approach for the electricity sector is needed, one that recognizes the tremendous potential of
prosumers to meet electricity demand cost-competitively while simultaneously fueling the rise of a more
distributed and lower-carbon power system.
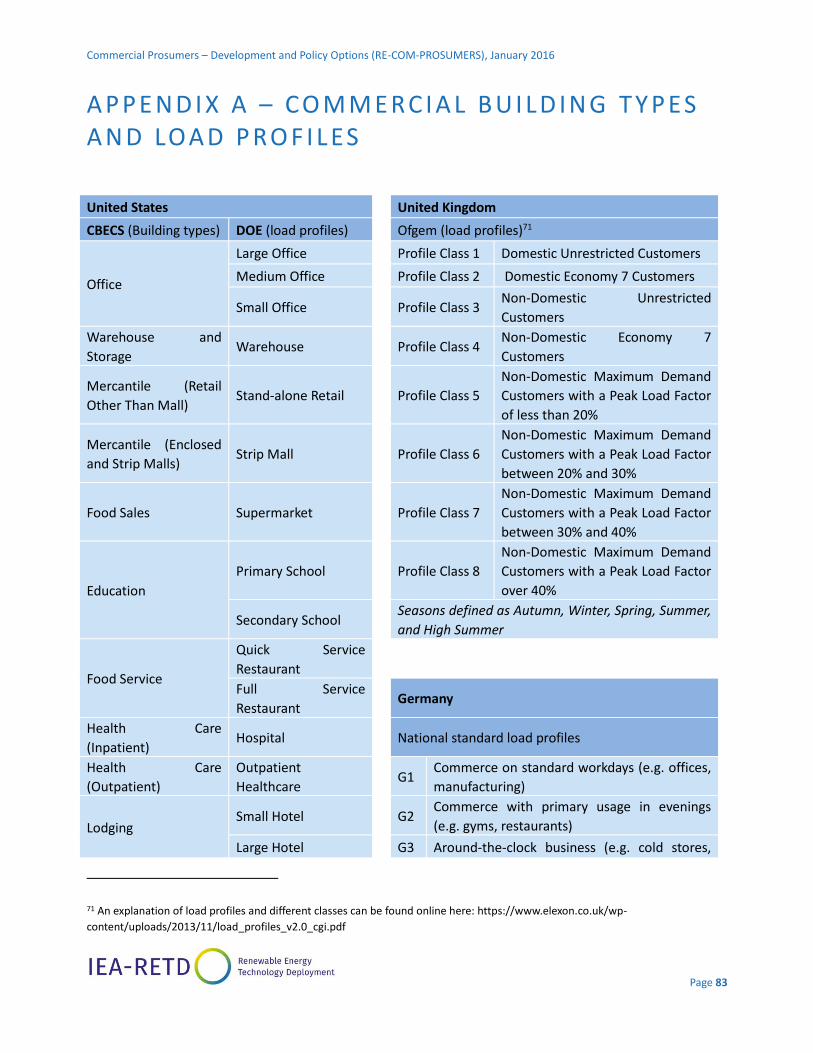
Commercial Prosumers – Development and Policy Options (RE-COM-PROSUMERS), January 2016
Page 83
A P P E ND I X A – CO M M E RC I A L B U I LD IN G T Y P ES A N D LOA D P RO F I L ES
71 An explanation of load profiles and different classes can be found online here: https://www.elexon.co.uk/wp-
content/uploads/2013/11/load_profiles_v2.0_cgi.pdf
United States United Kingdom
CBECS (Building types) DOE (load profiles) Ofgem (load profiles)71
Office
Large Office Profile Class 1 Domestic Unrestricted Customers
Medium Office Profile Class 2 Domestic Economy 7 Customers
Small Office Profile Class 3 Non-Domestic Unrestricted
Customers
Warehouse and
Storage Warehouse Profile Class 4
Non-Domestic Economy 7
Customers
Mercantile (Retail
Other Than Mall) Stand-alone Retail Profile Class 5
Non-Domestic Maximum Demand
Customers with a Peak Load Factor
of less than 20%
Mercantile (Enclosed
and Strip Malls) Strip Mall Profile Class 6
Non-Domestic Maximum Demand
Customers with a Peak Load Factor
between 20% and 30%
Food Sales Supermarket Profile Class 7
Non-Domestic Maximum Demand
Customers with a Peak Load Factor
between 30% and 40%
Education
Primary School Profile Class 8
Non-Domestic Maximum Demand
Customers with a Peak Load Factor
over 40%
Secondary School Seasons defined as Autumn, Winter, Spring, Summer,
and High Summer
Food Service
Quick Service
Restaurant
Full Service
Restaurant Germany
Health Care
(Inpatient) Hospital National standard load profiles
Health Care
(Outpatient)
Outpatient
Healthcare G1
Commerce on standard workdays (e.g. offices,
manufacturing)
Lodging Small Hotel G2
Commerce with primary usage in evenings
(e.g. gyms, restaurants)
Large Hotel G3 Around-the-clock business (e.g. cold stores,

Commercial Prosumers – Development and Policy Options (RE-COM-PROSUMERS), January 2016
Page 84
The load profile used in each country is indicated in the tables
elow.
sewage)
Midrise Apartment G4 Shops (e.g. supermarkets, wholesale)
Public Assembly G5 Bakeries
Public Order and
Safety G6 Weekend Business (e.g. cinemas, tourist sites)
Religious Worship L1 Farms with dairy
Service L2 All other farms (e.g. agriculture)
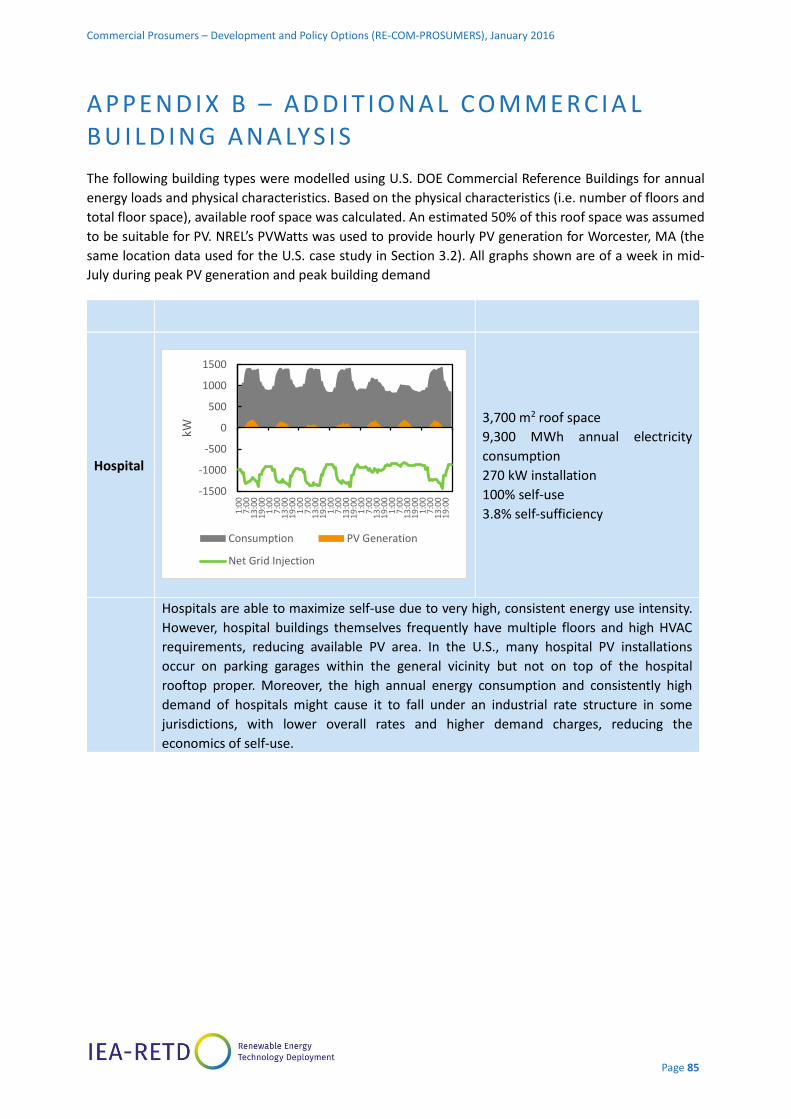
Commercial Prosumers – Development and Policy Options (RE-COM-PROSUMERS), January 2016
Page 85
A P P E ND I X B – A D D I T IO N A L CO M M E R C I A L B U I L D I N G A N A LYS I S
The following building types were modelled using U.S. DOE Commercial Reference Buildings for annual
energy loads and physical characteristics. Based on the physical characteristics (i.e. number of floors and
total floor space), available roof space was calculated. An estimated 50% of this roof space was assumed
to be suitable for PV. NREL’s PVWatts was used to provide hourly PV generation for Worcester, MA (the
same location data used for the U.S. case study in Section 3.2). All graphs shown are of a week in mid-
July during peak PV generation and peak building demand
Hospital
3,700 m2 roof space
9,300 MWh annual electricity
consumption
270 kW installation
100% self-use
3.8% self-sufficiency
Hospitals are able to maximize self-use due to very high, consistent energy use intensity.
However, hospital buildings themselves frequently have multiple floors and high HVAC
requirements, reducing available PV area. In the U.S., many hospital PV installations
occur on parking garages within the general vicinity but not on top of the hospital
rooftop proper. Moreover, the high annual energy consumption and consistently high
demand of hospitals might cause it to fall under an industrial rate structure in some
jurisdictions, with lower overall rates and higher demand charges, reducing the
economics of self-use.
-1500
-1000
-500
0
500
1000
1500
1:0
07
:00
13:
001
9:00
1:0
07
:00
13:
001
9:00
1:0
07
:00
13:
001
9:00
1:0
07
:00
13:
001
9:00
1:0
07
:00
13:
001
9:00
1:0
07
:00
13:
001
9:00
1:0
07
:00
13:
001
9:00
kW
Consumption PV Generation
Net Grid Injection
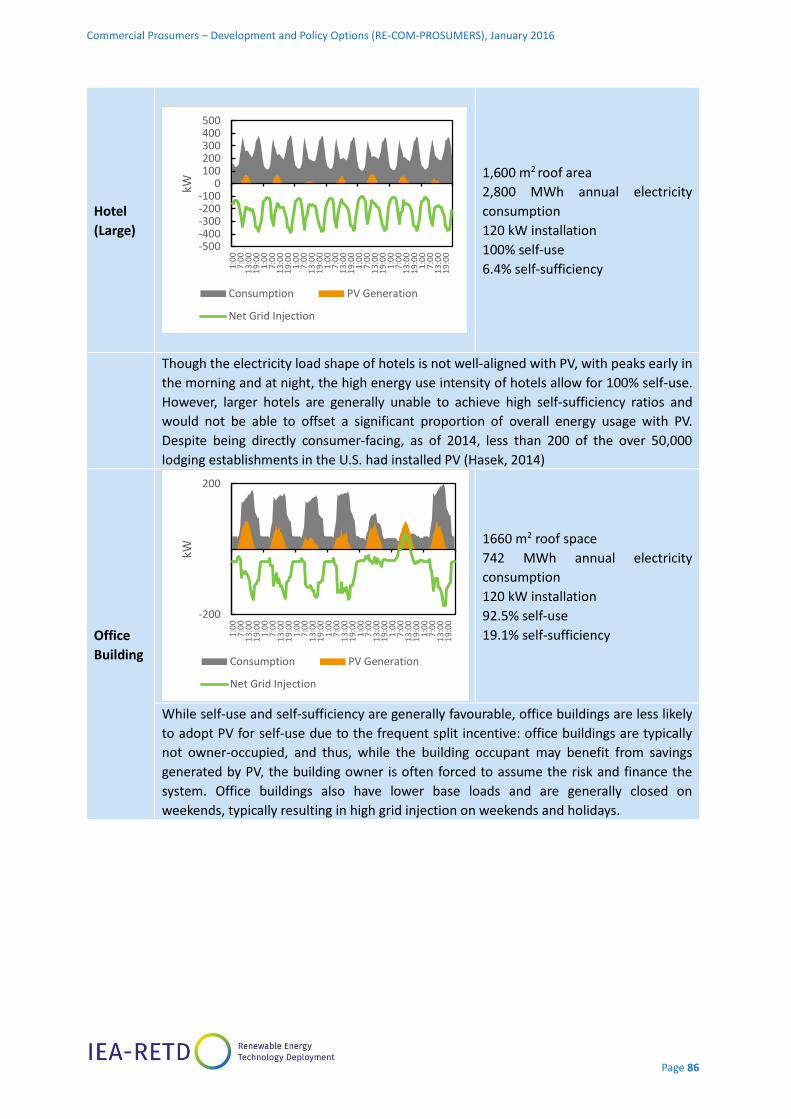
Commercial Prosumers – Development and Policy Options (RE-COM-PROSUMERS), January 2016
Page 86
Hotel
(Large)
1,600 m2 roof area
2,800 MWh annual electricity
consumption
120 kW installation
100% self-use
6.4% self-sufficiency
Though the electricity load shape of hotels is not well-aligned with PV, with peaks early in
the morning and at night, the high energy use intensity of hotels allow for 100% self-use.
However, larger hotels are generally unable to achieve high self-sufficiency ratios and
would not be able to offset a significant proportion of overall energy usage with PV.
Despite being directly consumer-facing, as of 2014, less than 200 of the over 50,000
lodging establishments in the U.S. had installed PV (Hasek, 2014)
Office
Building
1660 m2 roof space
742 MWh annual electricity
consumption
120 kW installation
92.5% self-use
19.1% self-sufficiency
While self-use and self-sufficiency are generally favourable, office buildings are less likely
to adopt PV for self-use due to the frequent split incentive: office buildings are typically
not owner-occupied, and thus, while the building occupant may benefit from savings
generated by PV, the building owner is often forced to assume the risk and finance the
system. Office buildings also have lower base loads and are generally closed on
weekends, typically resulting in high grid injection on weekends and holidays.
-500-400-300-200-100
0100200300400500
1:0
07
:00
13
:00
19
:00
1:0
07
:00
13
:00
19
:00
1:0
07
:00
13
:00
19
:00
1:0
07
:00
13
:00
19
:00
1:0
07
:00
13
:00
19
:00
1:0
07
:00
13
:00
19
:00
1:0
07
:00
13
:00
19
:00
kW
Consumption PV Generation
Net Grid Injection
-200
200
1:0
07
:00
13:
001
9:00
1:0
07
:00
13:
001
9:00
1:0
07
:00
13:
001
9:00
1:0
07
:00
13:
001
9:00
1:0
07
:00
13:
001
9:00
1:0
07
:00
13:
001
9:00
1:0
07
:00
13:
001
9:00
kW
Consumption PV Generation
Net Grid Injection
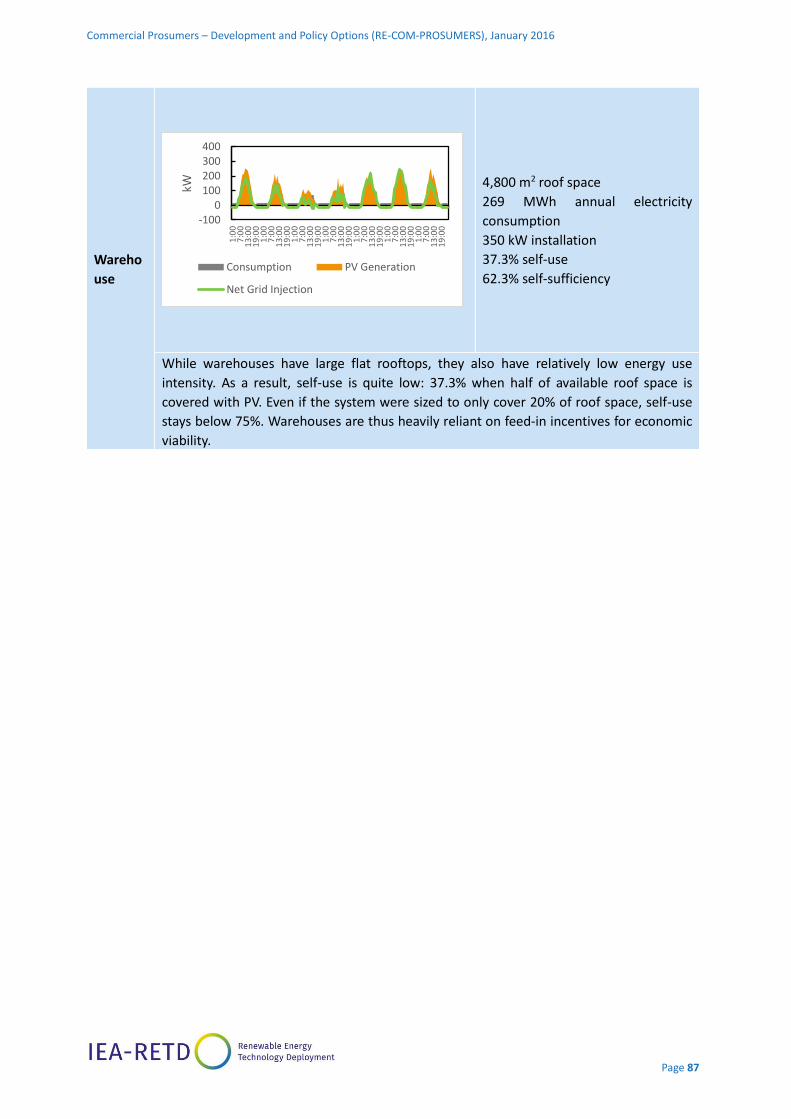
Commercial Prosumers – Development and Policy Options (RE-COM-PROSUMERS), January 2016
Page 87
Wareho
use
4,800 m2 roof space
269 MWh annual electricity
consumption
350 kW installation
37.3% self-use
62.3% self-sufficiency
While warehouses have large flat rooftops, they also have relatively low energy use
intensity. As a result, self-use is quite low: 37.3% when half of available roof space is
covered with PV. Even if the system were sized to only cover 20% of roof space, self-use
stays below 75%. Warehouses are thus heavily reliant on feed-in incentives for economic
viability.
-1000
100200300400
1:0
07
:00
13
:00
19
:00
1:0
07
:00
13
:00
19
:00
1:0
07
:00
13
:00
19
:00
1:0
07
:00
13
:00
19
:00
1:0
07
:00
13
:00
19
:00
1:0
07
:00
13
:00
19
:00
1:0
07
:00
13
:00
19
:00
kW
Consumption PV Generation
Net Grid Injection
Commercial Prosumers – Development and Policy Options (RE-COM-PROSUMERS), January 2016
Page 88
R E F E R E N C ES
Agence de l’Environnement et de la Maîtrise de l’Energie (ADEME). (2011). Feuille de route sur
l’électricité photovoltaïque. Angers, France.
Agence de l’Environnement et de la Maîtrise de l’Energie (ADEME). (2014). Le photovoltaïque en
France en 2013. Angers, France.
Agence de l’Environnement et de la Maîtrise de l’Energie (ADEME) Poitou-Charentes. (2015). Appel à
projets à destination des entreprises développement d’installations photovoltaïques en
autoconsommation. Poitiers, France.
Agence de l’Environnement et de la Maîtrise de l’Energie (ADEME), (2015). Un mix électrique 100%
renouvelables ? Analyses et optimisations. Octobre 2015.
http://www.ademe.fr/sites/default/files/assets/documents/rapport_final.pdf
Ambrose, J. (2015, September 4). Summer’s peak power demand will be lowest ever, says National
Grid. UtilityWeek. Retrieved from http://utilityweek.co.uk/news/summer%E2%80%99s-peak-power-
demand-will-be-lowest-ever-says-national-grid/1120142#.Vd4euvlVhBe
Appleyard, D. (2014, May 16). UK moves to cut support for large scale solar PV.
RenewableEnergyWorld.com. Retrieved from
http://www.renewableenergyworld.com/articles/2014/05/uk-moves-to-cut-support-for-large-scale-
solar-pv.html
Appunn, K., & Russell, R. (2015). German utilities and the Energiewende. Berlin, Germany: Clean
Energy Wire (CLEW).
Association of Real Estate Funds. (2013). Property data report 2013. London, UK.
Association of Real Estate Funds. (2014). Property data report 2014. London, UK
Barbose, G., Goldman, C., Hoffman, I., & Billingsley, M. (2013). The future of utility customer-funded
energy efficiency programs in the United States: Projected spending and savings to 2025 (LBNL-
5803E). Berkeley, CA: Ernest Orlando Lawrence Berkeley National Laboratory.
Barbose, G., Weaver, S., & Darghouth, N. (2014). Tracking the sun VII: The installed cost of
photovoltaics in the US from 1998-2013 (LBNL-6858E). Berkeley, CA: Lawrence Berkeley National
Laboratory.
Bardt, H., Chrischilles, E., Growitsch, C., Hagspiel, S., & Schaupp, L. (2014). Eigenerzeugung und
Selbstverbrauch von Strom: Stand, Potentiale und Trends. Cologne, Germany: Institut der deutschen
Wirtschaft Köln.
Bazerman, M. (2008). Barriers to acting in time on energy and strategies for overcoming them
(Working paper 09-063). Cambridge, MA: Harvard Business School.
Bennett, P. (2014, July 1). Barker promises to put “rocket-boosters” under commercial-scale solar.
Solar Power Portal UK. Retrieved from
http://www.solarpowerportal.co.uk/news/barker_promises_to_put_rocket_boosters_under_commer
cial_and_industrial_3367
British Land. (2015). British Land exchanges £733 million of joint venture properties with Tesco.
London, UK.
Bundesminiterium der Finanzen (BMF). (2014). Umsatzsteuerrechtliche Behandlung von Photovoltaik-
und KWK-Anlagen Abschaffung des Eigenverbrauchsbonus nach § 33 Abs. 2 EEG durch die EEG-Novelle
zur Photovoltaik 2012; BFH-Urteil vom 12. Dezember 2012, XI R 3/10, 1. Berlin, Germany
Bundesministerium für Wirtschaft und Energie (BMWi). (2014). Die Energie der Zukunft, Erster
Fortschrittsbericht zur Energiewende. Berlin, Germany.
Commercial Prosumers – Development and Policy Options (RE-COM-PROSUMERS), January 2016
Page 89
Bundesministerium für Wirtschaft und Energie (BMWi). (2015a). Ein Strommarkt für die Energiewende
- Ergebnispapier des Bundesministeriums für Wirtschaft und Energie. Berlin, Germany.
Bundesministerium für Wirtschaft und Energie (BMWi). (2015b). Marktanalyse Photovoltaik-
Dachanlagen. Berlin, Germany.
Bundesnetzagentur (BNetzA). (2014). Monitoringbericht 2014. Berlin, Germany.
Bundesverband der Energie- und Wasserwirtschaft (BDEW). (2014, June). Strompreisanalyse Juni
2014: Haushalte und Industrie. Berlin, Germany.
Byrne, J., Agbemabiese, L., Bouton, D., Kliesch, J., & Letendre, S. (1998). Photovoltaics as an energy
services technology: A case study of PV sited at the Union of Concerned Scientists headquarters (pp.
131–136). Proceedings of the American Solar Energy Society Conference, Albuquerque, NM.
Cagno, E., & Trianni, A. (2014). Evaluating the barriers to specific industrial energy efficiency
measures: An exploratory study in small and medium-sized enterprises. Journal of Cleaner Production,
(82), 70–83.
Callanan, N., & Thesing, G. (2014, February 24). British grocer land spinoffs seen fraught with risk: Real
estate. BloombergBusiness. Retrieved from http://www.bloomberg.com/news/articles/2014-02-
25/british-grocer-land-spinoffs-seen-fraught-with-risk-real-estate
Centre for Sustainable Energy (CSE), & University of Oxford Environmental Change Institute (ECI).
(2012). What are the factors influencing energy behaviours and decision-making in the non-domestic
sector? A Rapid Evidence Assessment. UK: Department of Energy and Climate Change.
Chaudhari, M., Frantzis, L., & Hoff, T. E. (2005). PV grid connected market potential under a cost
breakthrough scenario. Burlington, MA: Navigant Consulting.
Clean Energy Solutions Center (CESC). (2015). Global RE Opportunity Tool (Beta Version): A tool for
policymakers and energy analysts. Retrieved September 12, 2015, from
https://cleanenergysolutions.org/tools/solar
Clover, I. (2014, October 23). Solarcentury report lifts lid on UK commercial solar potential. PV
Magazine.
Clover, I. (2015a, February 3). Germany added 1.89 GW of PV in 2014, stats show. PV Magazine.
Clover, I. (2015b, March 26). Europe’s solar market declined 36% in 2014, says EPIA. PV Magazine.
Clover, I. (2015c, April 1). Leading UK solar developers adjust to new market conditions. PV Magazine.
Clover, I. (2015d, April 7). UK: No CfD-backed large-scale solar for next fiscal year. PV Magazine.
Clover, I. (2015e, August 27). UK to propose drastic FIT cuts starting 2016. PV Magazine.
Colliers International. (2015). Retail investment deals. Retrieved September 12, 2015, from
http://www.colliers.com/en-gb/uk/services/retail/investment-deals
Colthorpe, A. (2015, February 19). Developers attempt head-start in UK commercial rooftop solar
market. PV-Tech.
Commission de régulation de l’énergie (CRE). (2014). Marché de l’électricité. Paris, France.
Committee on Climate Change. (2014). Energy prices and bills - impacts of meeting carbon budgets.
London, UK.
Couture, T., Jacobs, D., Rickerson, W., & Healey, V. (2015). The next generation of renewable electricity
Policy: How rapid change is breaking down conventional policy categories (NREL/TP-7A40-63149).
Golden, CO: Clean Energy Solutions Center.
Database of State Incentives for Renewables and Efficiency (DSIRE). (2015, June). Renewable portfolio
standard policies. Retrieved September 12, 2015, from http://ncsolarcen-
prod.s3.amazonaws.com/wp-content/uploads/2014/11/Renewable-Portfolio-Standards.pdf
Decanio, S. (1993). Barriers within firms to energy-efficient investments. Energy Policy, 21(9), 906–
914.
Commercial Prosumers – Development and Policy Options (RE-COM-PROSUMERS), January 2016
Page 90
De Groot, H., Verhoef, E., & Nijkamp, P. (2001). Energy saving by firms: decision-making, barriers and
policies. Energy Economics, 23(6), 717–740.
Denholm, P., & Margolis, R. (2008). Supply curves for rooftop solar PV-generated electricity for the
United States (NREL/TP-6A0-44073). Golden, CO: National Renewable Energy Laboratory (NREL).
Department of Energy & Climate Change (DECC). (2014a). UK solar PV strategy part 2: Delivering a
brighter future. London, UK.
Department of Energy & Climate Change (DECC). (2014b). Updated energy and emissions projections
2014. London, UK.
Department of Energy & Climate Change (DECC). (2015a). Digest of United Kingdom energy statistics
2015 (DUKES). London, UK.
Department of Energy & Climate Change (DECC). (2015b). Move your solar panels and keep your tariff.
London, UK.
Department of Energy & Climate Change (DECC). (2015c). Quarterly energy prices: March 2015.
London, UK.
Department of Energy & Climate Change (DECC). (2015d). Solar photovoltaics deployment. Retrieved
September 12, 2015, from https://www.gov.uk/government/statistics/solar-photovoltaics-deployment
Department of Energy & Climate Change (DECC). (2015e). Solar PV cost data. UK. Retrieved
September 12, 2015, from https://www.gov.uk/government/statistics/solar-pv-cost-data.
Department of Energy & Climate Change (DECC). (2015f). UK energy statistics, 2014 & Q4 2014.
London, UK.
Department of Energy & Climate Change (DECC). (2015g, February 17). Feed-in tariff statistics.
Retrieved September 12, 2015, from https://www.gov.uk/government/collections/feed-in-tariff-
statistics
Deru, M., Field, K., Studer, D., Benne, K., Griffith, B., Torcellini, P., et al. (2011). U.S. Department of
Energy commercial reference building models of the national building stock (NREL/TP-5500-46861).
Golden, CO: National Renewable Energy Laboratory.
Economidou, M., Atanasiu, B., Despret, C., Maio, J., Nolte, I., Rapf, O., et al. (2011). Europe’s buildings
under the microscope: A country-by-country review of the energy performance of buildings. Brussels,
Belgium: Buildings Performance Institute Europe (BPIE).
Électricité de France (EDF). (2014). Fin des tariffs réglementés de vente d’électricité - Entreprises. Paris,
France. Retrieved September 12, 2015 from http://entreprises.edf.com/le-mag-de-l-
energie/actualites-du-marche-de-l-energie/marche-de-l-energie-en-france/fin-des-tarifs-reglementes-
de-vente-electricite-et-gaz-290272.html
European Commission. (2014). Quarterly report on European electricity markets (Volume 7, Issues 3).
Directorate-General for Energy, Market Observatory for Energy.
European Commission. (2015). Best practices on renewable energy self-consumption - Accompanying
the document Communication from the Commission to the European Parliament, the Council, the
European Economic and Social Committee and the Committee of the Regions: Delivering a new deal
for energy consumers (Commission Staff Working Document). Brussels, Belgium
Eversource Energy. (2015). Summary of electric delivery service rates. Westwood, MA. Retrieved
September 12, 2015, from https://www.eversource.com/Content/docs/default-source/rates-
tariffs/1052.pdf?sfvrsn=6
Executive Office of Energy and Environmental Affairs (EOEEA). (2015a). About the Solar Carve-Out II
Program. Massachusetts. Retrieved September 12, 2015 from http://www.mass.gov/eea/energy-
utilities-clean-tech/renewable-energy/solar/rps-solar-carve-out-2/about-solar-carve-out-ii.html
Executive Office of Energy and Environmental Affairs (EOEEA). (2015b). Current status of the Solar
Carve-Out II Program. Massachusetts. Retrieved September 12, 2015 from

Commercial Prosumers – Development and Policy Options (RE-COM-PROSUMERS), January 2016
Page 91
http://www.mass.gov/eea/energy-utilities-clean-tech/renewable-energy/solar/rps-solar-carve-out-
2/current-statis-solar-carve-out-ii.html
Executive Office of Energy and Environmental Affairs (EOEEA). (2015c). Net metering frequently asked
questions and answers. Massachusetts. Retrieved September 12, 2015 from
http://www.mass.gov/eea/grants-and-tech-assistance/guidance-technical-assistance/agencies-and-
divisions/dpu/net-metering-faqs.html
Fraunhofer Institute for Solar Energy (ISE). (2015). Photovoltaics report. Freiburg, Germany.
Gerke, T. (2014, November 26). German renewable electricity generation forecast for 2015-2019.
Renewables International.
Gilleo, A., Chittum, A., Farley, K., Neubauer, M., Nowak, S., Ribeiro, D., & Vaidyanathan, S. (2014). The
2014 state energy efficiency scorecard (Research Report U1408). Washington, D.C.: The American
Council for an Energy-Efficient Economy (ACEEE).
Graichen, P. (2014). Proposal for a revision of the industry exemption rules under the German EEG.
Berlin, Germany: Agora Energiewende.
Groupe Casino. (2015). GreenYellow. Retrieved September 12, 2015, from http://www.groupe-
casino.fr/en/activities/greenyellow/
Grundner, C., Urbschat, C., Rieseberg, S., Wörlen, C. (2014). Investorenleitfaden Photovoltaik:
Marktübersicht und Praxishilfe zu PV-Geschäftsmodellen in Deutschland. Berlin, Germany:
Bundesverband Solarwirtschaft (BSW).
Hasek, G. (2014). Solar installations becoming larger, more frequent in U.S. lodging industry. Hotel
Business Review.
Hedman, B., Wong, E., Darrow, K., & Hampson, A. (2012). Combined heat and power: Policy analysis
and 2011 – 2030 market assessment (CEC-200-2012-002). Sacramento, CA: ICF International, Inc.
Prepared for the California Energy Commission.
Herrmann, R., Möser, A., & Weber, S. (2009). Grocery retailing in Germany: Situation, development
and pricing strategies (No. 41). Giessen, Germany: Zentrum für internationale Entwicklungs- und
Umweltforschung der Justus-Liebig-Universität Gießen.
Hiller, J., Reyna, E., Riso, C., & Jay, J. (2012). The virtuous cycle of organization energy efficiency: A
fresh approach to dismantling barriers. Proceedings of the ACEEE Summer Study on Energy Efficiency
in Buildings, Pacific Grove, CA.
Hirst, E., & Brown, M. (1990). Closing the efficiency gap: Barriers to the efficient use of energy. Energy
Policy, 22(10), 804–810.
IEA-RETD, Petrick, K., Couture, T., & Rickerson, W. (2015). Remote Prosumers – Preparing for
deployment: Roof-top solar PV prosumers in remote areas and islands. Utrecht, the Netherlands: IEA
Implementing Agreement for Renewable Energy Technology Deployment.
IEA-RETD, Rickerson, W., Couture, T., Barbose, G., Jacobs, D., Parkinson, G., et al. (2014). Residential
prosumers: Drivers and policy options (RE-PROSUMERS). Paris, France: International Energy Agency
Renewable Energy Technology Deployment (IEA-RETD).
IEA-RETD, Rickerson, W., Uppal, J., Glassmire, J., Lilienthal, P., Colson, C., Couture, T., et al. (2012).
Renewable Energies for Remote Areas and Islands (REMOTE). Paris, France: International Energy
Agency Renewable Energy Technology Deployment (IEA-RETD).
IEA-RETD, Veilleux, N., Rickerson, W., Belden, A., Hintler, G., Laurent, C., et al. (2015). Waking the
sleeping giant: Next generation policy instruments for renewable heating & cooling in commercial
buildings (RES-H-NEXT). Utrecht, the Netherlands: IEA Implementing Agreement for Renewable Energy
Technology Deployment.
IKEA. (2015). IKEA plugs-in expanded solar panel array at Boston-area store in Stoughton, MA,
contributing to company’s renewable energy goal. Conshohocken, PA.
Commercial Prosumers – Development and Policy Options (RE-COM-PROSUMERS), January 2016
Page 92
Inskeep, B., Kennerly, J., & Proudlove, A. (2015). The 50 states of solar (Q4 2014). Raleigh, NC: NC
Clean Energy Technology Center, North Carolina State University.
Institute for Electric Innovation (IEI). (2014). State electric efficiency regulatory frameworks.
Washington, DC: The Edison Foundation
International Energy Agency. (2014). Renewable energy medium-term market report 2014: Market
analysis and forecasts to 2020. Paris, France.
International Energy Agency. (2015). Renewable energy medium-term market report 2015: Market
analysis and forecasts to 2020. Paris, France.
International Energy Agency Photovoltaic Power Systems Programme (IEA PVPS). (2015). Snapshot of
global PV markets (IEA PVPS T1-26:2015). St. Ursen, Switzerland.
Jaffea, A., & Stavins, R. (1993). The energy-efficiency gap: what does it mean? Energy Policy, 22(10),
804–810.
Janda, K. B. (2013). Building communities and social potential: Between and beyond organizations and
individuals in commercial properties. Energy Policy, 67, 48–55.
Kann, S., Shiao, M., Honeyman, C., Litvak, N., Jones, J., Cooper, L., et al. (2015a). Solar market insight
report 2014 Q4. Washington, D.C.: Solar Energy Industries Association (SEIA).
Kann, S., Shiao, M. J., Honeyman, C., Litvak, N., Jones, J., Cooper, L., et al. (2015b). U.S. solar market
insight report: 2014 year in review. Washington, D.C.: Solar Energy Industries Association.
Kann, S., Shiao, M. J., Honeyman, C., Litvak, N., Jones, J., Cooper, L., et al. (2015c). U.S. solar market
insight report: 2015 Q1. Washington, D.C.: Solar Energy Industries Association.
Kennerly, J., & Proudlove, A. (2015). Going solar in America: Ranking solar’s value to consumers in
America’s largest cities. Raleigh, NC: NC Clean Energy Technology Center.
Kinnie, S. (2015). Real Estate Insight: UK supermarkets – Is the pessimism overdone? Edinburgh,
Scotland.
Koetse, M., van der Vlist, A. J., & de Groot, H. (2003). Investment, expectations, and uncertainty
(Tinbergen Institute Discussion Paper, TI 2003-025/3). Amsterdam, the Netherlands: Tinbergen
Institute.
Körnig, C. (2015). Marktanalyse Photovoltaik-Dachanlagen. Presented at the BMWi Stakeholder
Workshop, Berlin, Germany.
KPMG. (2011). German retail property market analysis. Frankfurt, Germany.
Kulakowski, S. (1999). Large organizations’ investments in energy-efficient building retrofits (LBNL-
40895). Berkeley, CA: Lawrence Berkeley National Laboratory.
Latour, M. (2013, September). Net metering and self-consumption schemes in Europe. Presented at
the IEA PVPS Task 1 & EPIA Workshop, Paris, France.
Leipziger Institut für Energie. (2014). Mittelfristprognose zur EEG-Stromeinspeisung bis 2019. Leipzig,
Germany.
Le réseau de l’intelligence électrique (RTE). (2015a). Bilan prévisionnel de l’équilibre offre-demande
d’électricité en France – Édition 2014. Paris, France.
Le réseau de l’intelligence électrique (RTE). (2015b). Panorama de l’électricité renouvelable 2014.
Paris, France.
Linnenluecke, M. K., Russel, S. V., & Griffiths, A. (2009). Subcultures and sustainability practices: The
impact on understanding corporate sustainability. Business Strategy and the Environment, 18(7), 432–
452.
Lödl, M., Kerber, G., Witzmann, R., Hoffmann, C., & Metzger, M. (2010). Abschätzung des
Photovoltaik-Potentials auf Dachflächen in Deutschland. Presented at the 11. Symposium
Energieinnovation, Graz, Austria.

Commercial Prosumers – Development and Policy Options (RE-COM-PROSUMERS), January 2016
Page 93
Lutzenhiser, L., Biggart, N., Kunkle, R., Beamish, T., & Burr, T. (2001). Market structure and energy
efficiency: The case of new commercial buildings. Sacramento, CA: California Energy Commission.
Lutzenhiser, L., Janda, K., Kunkle, R., & Payne, C. (2002). Understanding the response of commercial
and institutional organizations to the California energy crisis (400-02-0018C). Sacramento, CA:
California Energy Commission.
Manghani, R. (2014). The future of solar-plus-storage in the U.S. Boston, MA: GTM Research.
Meister Consultants Group (MCG). (2014). Green leasing: An effective tenant/landlord strategy for
energy efficiency. Boston, MA: A Better City.
Melville, T. (2015, March 20). Tesco regains ownership of 21 UK stores in British Land swap deal.
Reuters.
Ministère de l’Écologie, de l’Énergie, du Développement durable et de la Mer (MEEDDM). (2009).
National action plan for the promotion of renewable energies 2009-2020. Paris, France.
Ministère de l’écologie, du développement durable et de l’énergie (MEDDE). (2015a). Tableau de bord
éolien photovoltaïque, Quatrième trimestre 2014. http://www.developpement-
durable.gouv.fr/IMG/pdf/CS611-2.pdf
Ministère de l'écologie, du développement durable et de l'énergie (MEDDE). (2015b). La structure et
le fonctionnement du marché de l’électricité en France. Paris, France.
Ministère de l'écologie, du Développement durable et de l'énergie (MEDDE). (2015c). Quels sont les
tarifs d’achats applicables? Paris, France.
Ministère de l’Écologie, du Développement durable et de l’Énergie (MEDDE). (2014a). Panorama
énergies-climat: Edition 2014. Paris, France.
Ministère de l’Écologie, du Développement durable et de l’Énergie (MEDDE). (2014b).
Rapport sur l’autoconsommation et l’autoproduction de l’électricité renouvelable. Paris, France.
Mitchell, P. (2014). The size and structure of the UK property market 2013: A decade of change.
London, UK: Investment Property Forum Research Programme.
Moezzi, M., Hammer, C., Goins, J., & Meier, A. (2014). Behavioural strategies to reduce the gap
between potential and actual savings in commercial buildings (Contract Number: 09-327).
Sacramento, CA: Air Resources Board.
National Grid. (2015a). Billing and rates. Retrieved September 12, 2015, from
https://www.nationalgridus.com/masselectric/business/rates/rates.asp
National Grid. (2015b). What we do in the Electricity Industry. Retrieved September 12, 2015, from
http://www2.nationalgrid.com/UK/Our-company/Electricity/
National Renewable Energy Laboratory (NREL). (2015). Dynamic maps, GIS data, & analysis tools.
Retrieved September 10, 2015, from http://www.nrel.gov/gis/data_solar.html
Navigant Consulting. (2008). Massachusetts renewable energy potential. Burlington, MA:
Massachusetts Department of Energy Resources (DOER) and Massachusetts Technology Collaborative
(MTC).
Navigant Research (2014). Annual microgrid capacity installations will increase nearly fivefold by 2020.
Boulder, CO. Retrieved from: http://www.navigantresearch.com/research/microgrids
North American Electric Reliability Corporation (NERC). (2013). Long-term reliability assessment.
Atlanta, GA.
Office for National Statistics (ONS). (2009). UK standard industrial classification of economic activities
2007 (SIC 2007): Structure and explanatory notes. London, UK: Palgrave Macmillan.
Office of Gas and Electricity Markets (Ofgem). (2015a). Closure of the Renewables Obligation.
Retrieved from https://www.ofgem.gov.uk/environmental-programmes/renewables-obligation-
ro/information-generators/closure-renewables-obligation-ro
Commercial Prosumers – Development and Policy Options (RE-COM-PROSUMERS), January 2016
Page 94
Office of Gas and Electricity Markets (Ofgem). (2015b). Tariff tables. Retrieved from
https://www.ofgem.gov.uk/environmental-programmes/feed-tariff-fit-scheme/tariff-tables
Ong, S., Campbell, C., & Clark, N. (2012). Impacts of regional electricity prices and building type on the
economics of commercial photovoltaic systems (NREL/TP-6A20-56461). Golden, CO: National
Renewable Energy Laboratory.
Paidipati, J., Frantzis, L., Sawyer, H., & Kurrasch, A. (2008). Rooftop photovoltaics market penetration
scenarios (NREL/SR-581-42306). Golden, CO: National Renewable Energy Laboratory (NREL).
Penn, I. (2015, July 28). SolarCity launches plan to bring solar power to small and midsize firms. Los
Angeles Times. Los Angeles, CA.
Photovoltaique.info. (2015a, August 25). Procédures d’appels d’offres. Retrieved September 12, 2015,
from http://www.photovoltaique.info/Procedures-d-appels-d-offres.html
Photovoltaique.info. (2015b, August 31). Chiffres clés. Retrieved September 12, 2015, from
http://www.photovoltaique.info/Chiffres-cles.html#PuissancesinstalleskW
Pinon, X. (2015, June 5). Tarif Jaune d’EDF. Retrieved September 12, 2015, from
http://www.fournisseurs-electricite.com/tarif-jaune
Prindle, W. R. (2010). From shop floor to top floor: Best business practices in energy efficiency.
Arlington, VA: Pew Center on Global Climate Change.
R2B Energy Consulting GmbH. (2013). Jahresprognose 2014 und Mittelfristprognose bis 2018 zur
deutschlandweiten Stromerzeugung aus EEG geförderten Kraftwerken. Cologne, Germany.
REC. (2013). Solar for self consumption: Financial gains and energy independence. Sandvika, Norway.
Reddy, S., & Painuly, J. P. (2004). Diffusion of renewable energy technologies: Barriers and
stakeholders’ perspectives. Renewable Energy, 29(9), 1431–1447.
Reinaud, J., & Goldberg, A. (2011). The boardroom perspective: How does energy efficiency policy
influence decision making in industry? Paris, France and Washington, DC: International Energy Agency
Working Group for Energy Efficiency and Institute for Industrial Productivity.
Rekinger, M., Thies, F., Masson, G., & Orlandi, S. (2015). Global market outlook for solar power 2015-
2019. Brussel, Belgium: SolarPower Europe.
REN21. (2015). Renewables 2015 Global Status Report. Paris, France: REN21 Secretariat.
Rosner, W. J. (1995). Mental models for sustainability. Journal of Cleaner Production, 3(1), 107–121.
Rudberg, M., Waldemarsson, M., & Lidestam, H. (2013). Strategic perspectives on energy
management: A case study in the process industry. Applied Energy, 104, 487–496.
Schick, S. (2002). Target market strategy for transforming business practices. Presented at the
American Council for an Energy-Efficiency Economy Decision-Making in Existing Commercial Building
Workshop, Washington, D.C.
Shahan, Z. (2014, May 21). IKEA gets unsubsidized rooftop solar power plant in Italy. CleanTechnica.
Shankleman, J. and Murray, J. (2014). Breaking: DECC unveils shock changes to solar farm subsidies.
businessGreen. Retrieved from http://www.businessgreen.com/bg/news/2344434/breaking-decc-
unveils-shock-changes-to-solar-farm-subsidies
Smithers, R. (2013, July 23). Five of “big six” energy companies drop green tariffs. The Guardian.
London, UK.
Solar Energy Industries Association (SEIA). (2014a). Depreciation of Solar Energy Property in MACRS.
Washington, D.C.
Solar Energy Industries Association (SEIA). (2014b). Solar means business report: Top U.S. Commercial
Solar Users. Washington, D.C.
Solarpraxis. (2013). Leitfaden Eigenverbrauch - Industrie und Gewerbe. Berlin.
Strathon, C., Readhead, R., Hirst, P., Wood, S., & Lashford, S. (2014). Solar PV: Shedding light on the
opportunities. London, UK: Jones Lang LaSalle IP, Inc.
Commercial Prosumers – Development and Policy Options (RE-COM-PROSUMERS), January 2016
Page 95
Stratmann, P. (2015, May). Eigenverbrauch als Herausforderung in der Bilanzierung und Prognose.
Presented at the BMWi-Fachgespräch, Lösungsansatz der Bundesnetzagentur, Berlin, Germany.
Tarifs réglementés (2015). Qu’est-ce que le tarif jaune? http://www.tarifsreglementes.com/tarifs-
reglementes/electricite/jaune
Taylor, M., Daniel, K., Ilas, A., & So, E. Y. (2015). Renewable power generation costs in 2014. Abu Dhabi,
UAE: International Renewable Energy Agency (IRENA).
U.S. Energy Information Administration (EIA). (2015a). 2012 Commercial Buildings Energy
Consumption Survey (CBECS). Washington, D.C.
U.S. Energy Information Administration (EIA). (2015b). Annual energy outlook 2015 with projections to
2040. Washington, D.C.
U.S. Energy Information Administration (EIA). (2015c). Electric power monthly with data for June 2015.
Washington, D.C.
U.S. Department of Energy (DOE) Sunshot Initiative (2016). Solar Energy Evolution and Diffusion
Studies. Available at: http://energy.gov/eere/sunshot/solar-energy-evolution-and-diffusion-studies
Vasquez-Nicholson, J. (2014). UK supermarket chain profiles 2014. London, UK: United States
Department of Agriculture.
von Kreutzbruck, V. (2013). Massachusetts surpasses 250 MW goal, aspires to reach 1.6 GW. PV
Magazine.
Willborn, S., Hesse, A., Balser, A., & Luh, A. (2014). Study on the profitability of commercial self-
consumption solar installations in Germany. Munich, Germany: REC Solar Germany GmbH.
Wirth, H. (2015). Recent facts about photovoltaics in Germany. Freiburg, Germany: Fraunhofer
Institute for Solar Energy Systems ISE.
Wood, E. (2014, November 30). Microgrid market growth on pace for tripling of capacity by 2020.
MicrogridKnowledge.com. Retrieved from http://microgridknowledge.com/microgrid-market-growth-
pace-tripling-capacity-2020/
Wood, E. (2015, August 31). How fast is the microgrid market growing, really?
MicrogridKnowledge.com.
Retreived from http://microgridknowledge.com/how-fast-is-the-microgrid-market-growing-really/
Zentrum für Sonnenenergie- und Wasserstoff-Forschung (ZSW). (2014). Vorbereitung und Begleitung
der Erstellung des Erfahrungsberichts 2014 gemäß § 65 EEG, im Auftrag des Bundesministeriums für
Wirtschaft und Energie, Vorhaben IIc Solare Strahlungsenergie, Wissenschaftlicher Bericht. Stuttgart,
Germany.
M E M B E R CO U N T R IES O F IEA - R E TD

The International Energy Agency’s Implementing Agreement for Renewable Energy Technology
Deployment (IEA-RETD) provides a platform for enhancing international cooperation on policies,
measures and market instruments to accelerate the global deployment of renewable energy
technologies.
IEA-RETD aims to empower policy makers and energy market actors to make informed decisions by: (1)
providing innovative policy options; (2) disseminating best practices related to policy measures and
market instruments to increase deployment of renewable energy, and (3) increasing awareness of the
short-, medium- and long-term impacts of renewable energy action and inaction.
Current member countries of the IEA-RETD Implementing Agreement are Canada, Denmark, European
Commission, France, Germany, Ireland, Japan, Norway, and United Kingdom.
More information on the IEA-RETD can be found at
www.iea-retd.org