TANF Benefits Still Too Low to Help Families, Especially ...
21
1 Updated December 2, 2021 States Must Continue Recent Momentum to Further Improve TANF Benefit Levels Benefit Increases Can Promote Racial Equity and Child Well-Being By Ali Safawi and Cindy Reyes 1 Temporary Assistance for Needy Families (TANF), the primary cash assistance program for families with children when they face a crisis or have very low incomes, can play a key role in ensuring that these families struggling to make ends meet have income for their basic needs. Research shows that cash assistance to families experiencing poverty can improve children’s health and academic achievement, which in turn can lead to better health and higher earnings in adulthood. Recognizing the importance of income for children’s long-term growth and development — and the inadequacy of their existing TANF benefits — 20 states and the District of Columbia have increased benefits since July 2020. However, more must be done to improve TANF benefit levels to better meet families’ needs. TANF benefits in most states are still at their lowest value since the program was created in 1996. States have total flexibility to set benefit levels and have kept them too small to meet families’ basic needs and maintain their financial stability. Despite recent increases, benefits are at or below 60 percent of the poverty line in every state and are below 20 percent in 16, mostly Southern, states. (See Figure 1.) In all but six states, benefit levels have declined in inflation-adjusted value since 1996. TANF benefits in all states also leave families unable to afford modest housing. With TANF providing such inadequate resources, families face tough choices, such as whether to pay bills or buy diapers and other necessities. 1 Cindy Reyes is an intern with CBPP. 1275 First Street NE, Suite 1200 Washington, DC 20002 Tel: 202-408-1080 Fax: 202-408-1056 [email protected] www.cbpp.org
Transcript of TANF Benefits Still Too Low to Help Families, Especially ...
1
Updated December 2, 2021
States Must Continue Recent Momentum to Further Improve TANF Benefit Levels
Benefit Increases Can Promote Racial Equity and Child Well-Being By Ali Safawi and Cindy Reyes1
Temporary Assistance for Needy Families (TANF), the primary cash assistance program for
families with children when they face a crisis or have very low incomes, can play a key role in ensuring that these families struggling to make ends meet have income for their basic needs. Research shows that cash assistance to families experiencing poverty can improve children’s health and academic achievement, which in turn can lead to better health and higher earnings in adulthood. Recognizing the importance of income for children’s long-term growth and development — and the inadequacy of their existing TANF benefits — 20 states and the District of Columbia have increased benefits since July 2020. However, more must be done to improve TANF benefit levels to better meet families’ needs.
TANF benefits in most states are still at their lowest value since the program was created in 1996.
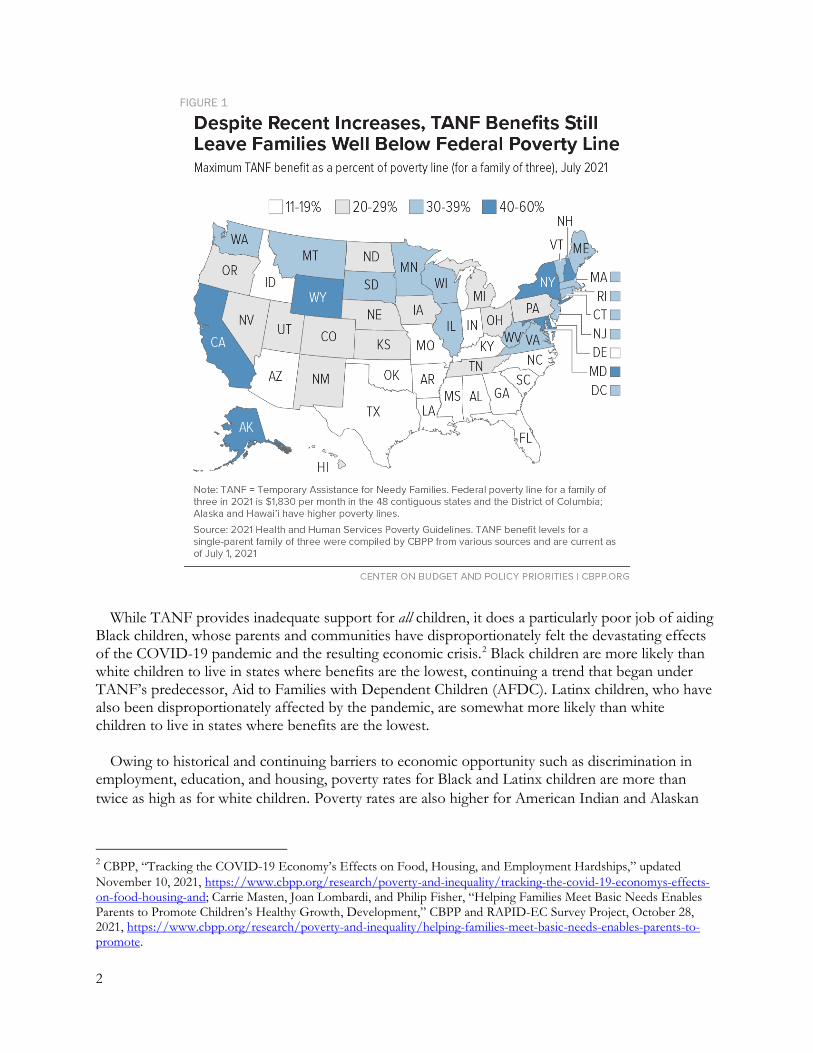
States have total flexibility to set benefit levels and have kept them too small to meet families’ basic needs and maintain their financial stability. Despite recent increases, benefits are at or below 60 percent of the poverty line in every state and are below 20 percent in 16, mostly Southern, states. (See Figure 1.) In all but six states, benefit levels have declined in inflation-adjusted value since 1996. TANF benefits in all states also leave families unable to afford modest housing. With TANF providing such inadequate resources, families face tough choices, such as whether to pay bills or buy diapers and other necessities.
1 Cindy Reyes is an intern with CBPP.
1275 First Street NE, Suite 1200
Washington, DC 20002
Tel: 202-408-1080 Fax: 202-408-1056
[email protected] www.cbpp.org
2
FIGURE 1
While TANF provides inadequate support for all children, it does a particularly poor job of aiding
Black children, whose parents and communities have disproportionately felt the devastating effects of the COVID-19 pandemic and the resulting economic crisis.2 Black children are more likely than white children to live in states where benefits are the lowest, continuing a trend that began under TANF’s predecessor, Aid to Families with Dependent Children (AFDC). Latinx children, who have also been disproportionately affected by the pandemic, are somewhat more likely than white children to live in states where benefits are the lowest.
Owing to historical and continuing barriers to economic opportunity such as discrimination in
employment, education, and housing, poverty rates for Black and Latinx children are more than twice as high as for white children. Poverty rates are also higher for American Indian and Alaskan
2 CBPP, “Tracking the COVID-19 Economy’s Effects on Food, Housing, and Employment Hardships,” updated November 10, 2021, https://www.cbpp.org/research/poverty-and-inequality/tracking-the-covid-19-economys-effects-on-food-housing-and; Carrie Masten, Joan Lombardi, and Philip Fisher, “Helping Families Meet Basic Needs Enables Parents to Promote Children’s Healthy Growth, Development,” CBPP and RAPID-EC Survey Project, October 28, 2021, https://www.cbpp.org/research/poverty-and-inequality/helping-families-meet-basic-needs-enables-parents-to-promote.
3
Native and Asian children than they are for white children.3 Even before the pandemic, 1 in 2 Black and Latinx families with children were either food insecure or unable to pay their housing or utility costs, as were 1 in 4 white families with children.4 Black and Latina women, who disproportionately work in the most tenuous and low-wage jobs due to occupational segregation, have experienced significant job losses since the crisis began and have recovered fewer jobs than white women and men.5 And with TANF benefits as low as they are, these families have few resources to support themselves as the economic recovery leaves mothers behind and many pandemic-related economic supports have expired.
States’ long-standing and unfettered flexibility to set benefit levels has perpetuated policies that,
while rooted in historical racism, do not just affect Black families. Inadequate and shrinking benefits affect all families facing a crisis or struggling to pay for the basics. States can reverse course by increasing benefit levels, establishing mechanisms to prevent benefits from eroding in the future, providing housing supplements and other additional payments, and ending policies that attempt to control behavior by reducing or taking away benefits. While states have the flexibility to act now, a federally mandated minimum benefit and changes to TANF’s funding structure are also needed to ensure that all children receive adequate benefits, regardless of the state in which they live.
20 States and D.C. Raised Benefit Levels Since July 2020
This report, an annual update of state TANF benefit levels, covers benefit changes that took effect in the 50 states and D.C. between July 1, 2020, and July 1, 2021. The benefit levels cited reflect the maximum monthly benefit for a family of one parent and two children with no other income as of July 1, 2021. However, families often do not receive the maximum TANF benefit; therefore, the benefits cited may exceed what many families actually receive. Three states and D.C. increased benefit levels after July 1, 2021; these increases are mentioned below but are not included in this report’s analysis. Benefit levels in seven states (California, Connecticut, Kansas, New York, Pennsylvania, Vermont, and Virginia) vary by geographic region. For more details on the benefit levels reported, see the footnotes in Appendix Table 1.
3 Arloc Sherman et al., “Recovery Proposals Adopt Proven Approaches to Reducing Poverty, Increasing Social Mobility,” CBPP, August 5, 2021, https://www.cbpp.org/research/poverty-and-inequality/recovery-proposals-adopt-proven-approaches-to-reducing-poverty. 4 Arloc Sherman et al., “Widespread Economic Insecurity Pre-Pandemic Shows Need for Strong Recovery Package,” CBPP, July 14, 2021, https://www.cbpp.org/research/poverty-and-inequality/widespread-economic-insecurity-pre-pandemic-shows-need-for-strong. 5 Valerie Wilson, “Black women face a persistent pay gap, including in essential occupations during the pandemic,” Economic Policy Institute, August 2, 2021, https://www.epi.org/blog/black-women-face-a-persistent-pay-gap-including-in-essential-occupations-during-the-pandemic/; Jocelyn Frye, “On the Frontlines at Work and at Home: The Disproportionate Economic Effects of the Coronavirus Pandemic on Women of Color,” Center for American Progress, (CAP), April 23, 2020, https://www.americanprogress.org/issues/women/reports/2020/04/23/483846/frontlines-work-home/.

4
Benefit Increases Taking Effect Through July 1, 2021 Seventeen states increased benefit levels between July 2020 and July 2021. (See Table 1.) Some of
the increases represent historic changes and continue the positive trend of states increasing benefit levels in recent years. Since 2015, 26 states and D.C. have raised their benefit levels at least one time, after a period when most states either cut or did not increase benefits in the aftermath of the Great Recession of 2007-09. Between 2015 and 2021, the benefit level (in nominal dollars) in the median state has increased from $429 to $498. (See Appendix Table 1).
TABLE 1
States Raising TANF Benefits between July 2020 and July 2021 Monthly maximum benefit for a single-parent family of three
State July 2021 Benefit Increase Since
July 2020 Percent Change Recurring
Adjustment? Connecticut $709 $11 2% X Illinois $543 $10 2% X Maine $620 $9 1% X Massachusetts $712 $119 20% Mississippi $260 $90 53% Nebraska $485 $17 4% X New Hampshire $1,098 $12 1% X Ohio $512 $7 1% X Rhode Island $712 $158 29% South Carolina $305 $6 2% X South Dakota $630 $15 2% Tennessee $387 $110 40% Texas $308 $5 2% X Virginia $559 $51 10% Washington $654 $85 15% West Virginia $542 $202 59% Wyoming $726 $14 2% X Note: TANF = Temporary Assistance for Needy Families. Source: CBPP-compiled 2021 state benefit levels
Seven states took specific legislative or administrative actions to increase grants by at least 10
percent. In four of these states, these increases were the first changes to TANF benefit levels in more than two decades:
• Massachusetts increased its benefit level from $593 to $712, its first increase since 2000.6
6 In 2018, Massachusetts ended its practice of providing different benefit levels to families depending on whether they were exempt from work requirements; families who were not exempt saw a small benefit increase. In 2021, all families received a benefit increase. The state also provides a $40 housing supplement to families living in private unsubsidized housing.
5
• Mississippi increased its benefit level from $170 to $260, its first increase since 1999.
• Rhode Island increased its benefit level from $554 to $712, its first increase since TANF’s creation.
• West Virginia increased its benefit level from $340 to $542, its first increase since 2000.
Another three states that have increased benefits in recent years did so again between July 2020
and July 2021: • Tennessee increased its benefit level from $277 to $387, following a large benefit increase in
2018.
• Virginia increased its benefit level from $508 to $559,7 its fourth benefit increase since 2016.
• Washington increased its benefit level from $569 to $654, following benefit increases in 2015 and 2018.
The recent benefit increases in Southern states are especially noteworthy given that the region has
lower TANF benefit levels, higher rates of poverty and food insecurity, and larger shares of Black residents.8 The Virginia budget legislation that included the benefit level increase also set a goal of gradually increasing TANF benefit levels to 50 percent of the poverty line,9 and it would be the first Southern state to do so since TANF’s creation.
Ten states made smaller increases, all under $20, to their TANF benefit levels. In all but South
Dakota, these increases were due to a recurring adjustment. (See box, “Recurring Adjustments Can Preserve Purchasing Power of TANF Benefits.”)
Benefit Increases Taking Effect After July 1, 2021
Three states and D.C. scheduled increases to take effect after July 1, 2021. In August, Vermont increased TANF benefits for most of the state from $699 to $811. In October, California increased benefits in its most populous counties to 51 percent of the poverty line, from $878 to $925. Also in October, D.C. increased benefits from $658 to $665 and Minnesota increased benefits from $632 to $641 due to a statutory cost-of-living adjustment (COLA) enacted earlier in the year.
7 Benefit levels for localities in Group III. See Appendix Table 1. 8 Alexandra Cawthorne Gaines, Bradley Hardy, and Justin Schweitzer, “How Weak Safety Net Policies Exacerbate Regional and Racial Inequality,” CAP, September 22, 2021, https://www.americanprogress.org/issues/poverty/reports/2021/09/22/503274/weak-safety-net-policies-exacerbate-regional-racial-inequality/. 9 Item 350.O.2. in 2021 Special Session I Budget Bill, H.B. 1800 (Chapter 552), https://budget.lis.virginia.gov/item/2021/2/HB1800/Chapter/1/350/.
6
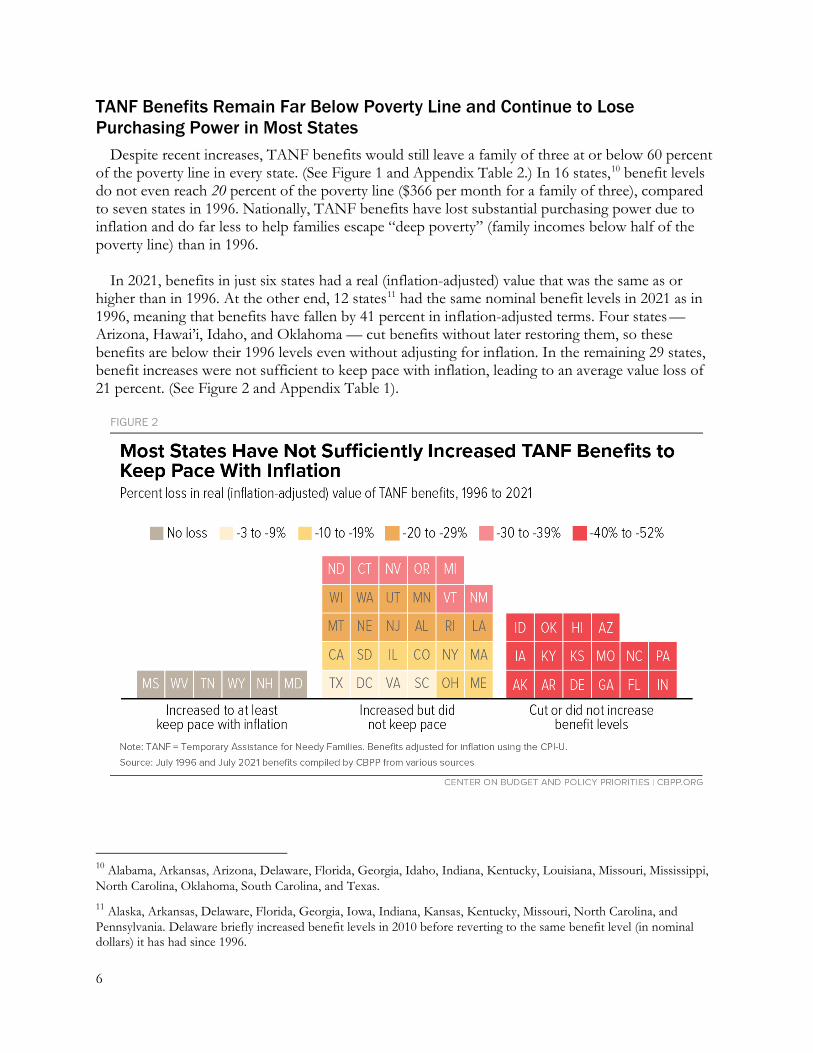
TANF Benefits Remain Far Below Poverty Line and Continue to Lose Purchasing Power in Most States
Despite recent increases, TANF benefits would still leave a family of three at or below 60 percent of the poverty line in every state. (See Figure 1 and Appendix Table 2.) In 16 states,10 benefit levels do not even reach 20 percent of the poverty line ($366 per month for a family of three), compared to seven states in 1996. Nationally, TANF benefits have lost substantial purchasing power due to inflation and do far less to help families escape “deep poverty” (family incomes below half of the poverty line) than in 1996.
In 2021, benefits in just six states had a real (inflation-adjusted) value that was the same as or
higher than in 1996. At the other end, 12 states11 had the same nominal benefit levels in 2021 as in 1996, meaning that benefits have fallen by 41 percent in inflation-adjusted terms. Four states — Arizona, Hawai’i, Idaho, and Oklahoma — cut benefits without later restoring them, so these benefits are below their 1996 levels even without adjusting for inflation. In the remaining 29 states, benefit increases were not sufficient to keep pace with inflation, leading to an average value loss of 21 percent. (See Figure 2 and Appendix Table 1).
FIGURE 2
10 Alabama, Arkansas, Arizona, Delaware, Florida, Georgia, Idaho, Indiana, Kentucky, Louisiana, Missouri, Mississippi, North Carolina, Oklahoma, South Carolina, and Texas. 11 Alaska, Arkansas, Delaware, Florida, Georgia, Iowa, Indiana, Kansas, Kentucky, Missouri, North Carolina, and Pennsylvania. Delaware briefly increased benefit levels in 2010 before reverting to the same benefit level (in nominal dollars) it has had since 1996.

7
This decline follows a quarter-century of major declines in the real value of benefits provided through AFDC. In 1970, the maximum AFDC benefit in the median state lifted a family to 71 percent of the poverty line and in eight states, mostly in the Northeast, the maximum AFDC benefit lifted families above the poverty line.12 Since then, every state has let the purchasing power of its benefits decline. Benefits quickly lost value during the 1970s due to high inflation13 and while inflation later moderated, most states have not increased benefit levels enough to offset the decline. Between 1970 and 1996, maximum AFDC benefit levels lost more than 30 percent of their value in nearly every state.14
Recurring Adjustments Can Preserve Purchasing Power of TANF Benefits Making recurring adjustments to TANF benefit levels to keep pace with inflation, such as through a statutory cost-of-living adjustment (COLA),a maintains families’ purchasing power and helps them meet basic needs. Between July 2020 and July 2021, nine states — Connecticut, Illinois, Maine, Nebraska, New Hampshire, Ohio, South Carolina, Texas, and Wyoming — made such adjustments. California,b Minnesota, and Tennessee have also recently adopted measures to prevent the future erosion of benefits but no such adjustments took place by July 2021.
States take different approaches to adjusting their benefits to account for changes in living costs, depending on whether they directly or indirectly index benefits to a measurement of inflation. States can index their TANF benefit levels directly to changes in living costs due to inflation. Connecticut, Maine, and Ohio do this by mirroring the federal Social Security and Supplemental Security Income (SSI) COLA, which is based on changes in the federal Consumer Price Index (CPI). Wyoming indexes its TANF benefit level to changes in a state-specific cost-of-living index.
States can also index their TANF benefits indirectly by tying them to a separate standard that is adjusted for inflation. For example, Illinois and New Hampshire tie their benefit levels to 30 and 60 percent of the federal poverty line, respectively, which is indexed to the CPI. Nebraska ties its benefit level to its Standard of Need, which is increased biannually based on changes in the CPI. While indexing benefits to a standard that adjusts to inflation can be an effective strategy, states can also choose a standard that is too low. For example, South Carolina and Texas make small adjustments to their benefit levels so that they remain around 17 percent of the poverty line, leaving families with far too few resources even though benefits have nearly kept pace with inflation.
a “Cost-of-living adjustment” can also be used to describe one-time benefit increases that are not set to repeat in subsequent years. Used here, the term describes only recurring adjustments to TANF benefit indexes to some measure of living costs. b California previously had a statutory COLA that was repealed in 2010.
Families Cannot Afford Modest Rent with TANF Benefits
12 CBPP calculation based on Table 5.9 in Office of the Assistant Secretary for Planning and Evaluation (ASPE), Department of Health and Human Services (HHS), “Eligibility, Benefits and Disposable Income,” Aid to Families with Dependent Families: The Baseline, 1998, https://aspe.hhs.gov/system/files/pdf/167036/5benefits.pdf. 13 National Research Council, “The Poverty Measure and AFDC,” from Measuring Poverty: A New Approach, 1995, p. 339, https://www.census.gov/content/dam/Census/library/publications/1995/demo/afdc.pdf. 14 Table 5.6 in ASPE, op. cit.

8
For families with children, housing is often the largest expense,15 and housing costs have risen at a faster pace than inflation.16 For TANF families, modest rental housing is unaffordable. In 2021, a family of three receiving the maximum TANF benefit in the median state could only afford a rent that is far below the estimated cost of a modest two-bedroom apartment in that state, based on the Department of Housing and Urban Development’s (HUD) Fair Market Rents (FMRs).17 (See Figure 3 and Appendix Table 3.)
FIGURE 3
Federal standards define rent (including utilities) as affordable when it takes up no more than 30
percent of a household’s income. For families whose only source of income is TANF, FMRs are well over 30 percent of the monthly maximum TANF benefit in every state. (See Appendix Table 3.)
15 Table 6 in U.S. Bureau of Labor Statistics, “Consumer expenditures report 2019,” December 2020, https://www.bls.gov/opub/reports/consumer-expenditures/2019/pdf/home.pdf/. 16 Joint Center for Housing Studies at Harvard University, “America’s Rental Housing 2020,” 2020, https://www.jchs.harvard.edu/americas-rental-housing-2020. 17 HUD’s FMRs are gross rent estimates that include the shelter rent plus the cost of all utilities except phone and internet. For more on FMRs, see Andrew Aurand et al., “Out of Reach 2021,” National Low Income Housing Coalition (NLIHC), 2021, https://nlihc.org/sites/default/files/oor/2021/Out-of-Reach_2021.pdf.

9
This is particularly concerning for Black and Latinx children, whose families face higher rates of housing insecurity and eviction filing, both before and during the pandemic.18
Comparing FMRs with the rent affordable to TANF families allows us to assess the adequacy of
TANF benefits in the context of variations in living costs across states. For example: • Florida has an average FMR of $1,290 while its TANF benefit level is just $303. The rent
TANF families can afford ($91) is just 7 percent of FMR, the smallest share in the country.
• New Hampshire has a similar average FMR ($1,286) but a much higher benefit level ($1,098). The rent TANF families can afford ($329) is 26 percent of FMR.
• Arkansas has the lowest average FMR ($759) but also the lowest benefit level ($204). TANF families can afford just $61 in rent, 8 percent of FMR.
• California has a relatively high benefit level, but high housing costs mean that TANF families can afford just 13 percent of FMR in Los Angeles County. Similarly, New York families receiving TANF can afford just 12 percent of FMR in New York City. These shares are much lower than for states with much lower benefits but lower housing costs.
Only a small fraction of TANF families receive federal rental assistance through HUD.19 A few
states provide a housing supplement in addition to the base TANF benefit for families who do not receive HUD or other rental assistance. For example, Maine provides a housing supplement of up to $300 per month to households whose housing costs exceed 50 percent of their countable income. In Minnesota, TANF families who do not receive rental assistance are eligible for a flat housing supplement of $110 per month. Housing supplements help narrow the gap between what TANF families can afford and FMRs. When TANF families must spend more of their grant on their rent, they are left with less flexible income to spend on other needs. More states should provide housing supplements to lessen the burden of high housing costs on TANF families.
State Benefit Decisions Rooted in Historical Racism Have Disparate Impacts
Low TANF benefits, which disproportionately affect the benefits available to Black children, are rooted in a long history of racist ideas and policies. Fifty-two percent of all Black children in the United States live in states with benefit levels below 20 percent of the poverty line, compared to 41 percent of Latinx children and 37 percent of white children.20 (See Figure 4.)
18 Sherman, “Widespread Economic Insecurity Pre-Pandemic Shows Need for Strong Recovery Package,” op. cit.; CBPP, op. cit.; Emily Lemmerman et al., “Preliminary Analysis: Who is being filed against during the pandemic?” The Eviction Lab, December 21, 2020, https://evictionlab.org/pandemic-filing-demographics/. 19 CBPP analysis of HUD administrative data and TANF caseload data collected from states. 20 CBPP analysis of 2020 U.S. Census population estimates collected from Kids Count Data Center, “Child Population by race in the United States,” Annie E. Casey Foundation, September 2021, https://datacenter.kidscount.org/data/tables/103-child-population-by-race?loc=1&loct=2#detailed/2/2-52/false/574/68,69,67,12,70,66,71,72/423.

10
FIGURE 4
TANF benefit levels tend to be lower in states where Black residents make up a greater share of
the population, when controlling for other factors, recent research finds.21 This is consistent with earlier literature that documented lower AFDC benefit levels among states with greater shares of Black residents or Black AFDC recipients.22 This trend of low benefits was predominant in, but not exclusive to, the South. One study found that between 1982 and 1996, a state’s Black population was a strong predictor of the state’s AFDC benefit levels, even when controlling for a state’s ideological leanings: conservative and liberal states with higher Black populations had lower average benefits than their peer states with lower Black populations.23
States’ unfettered ability to set inadequate benefit levels set the course for these racial disparities.
As Congress debated the Social Security Act of 1935, which created AFDC (originally Aid to Dependent Children or ADC), initial proposals by federal policymakers to ensure adequate benefits were undermined by a then-powerful Southern congressional bloc, which insisted on state and local control over the program. Later attempts to establish a minimum federal benefit for AFDC were
21 Heather Hahn et al., “Why Does Cash Welfare Depend on Where You Live?” Urban Institute, June 5, 2017, https://www.urban.org/research/publication/why-does-cash-welfare-depend-where-you-live. 22 For more on the racist history of AFDC and TANF benefit levels, see Ife Floyd et al., “TANF Policies Reflect Racist Legacy of Cash Assistance,” CBPP, August 4, 2021, https://www.cbpp.org/research/family-income-support/tanf-policies-reflect-racist-legacy-of-cash-assistance. 23 Ben Lennox Kail and Marc Dixon, “The Uneven Patterning of Welfare Benefits at the Twilight of AFDC: Accessing the Influence of Institutions, Race, and Citizen Preferences,” Sociological Quarterly, Vol. 52, 2011, pp. 376-399, https://www.jstor.org/stable/23027542.

11
similarly rejected by Congress. By defeating these proposals and others that would have made cash assistance more adequate and accessible to Black women and their families, policymakers preserved racial discrimination and segregation in the economy by ensuring that AFDC did not compete with the low wages paid to Black workers, who often were segregated into agricultural and domestic roles.24
In addition to keeping benefit levels low, states with higher shares of Black residents are likelier to
adopt punitive TANF policies that reduce or take away families’ benefits. These policies continue a history of policies attempting to exert economic, reproductive, and behavioral control over Black women. For example, federal law requires states to reduce benefits (known as a “sanction”) for families who do not meet work or other requirements, but it is up to states to decide when they impose sanctions and how much benefits are reduced. Nearly all states use full-family sanctions that take away the entire benefit, and states with greater shares of Black residents tend to have harsher sanction policies.25
State decisions to impose family cap policies, which deny families a higher benefit if they have
another child while on TANF, are also tied to race, research shows.26 So are state decisions whether to partially or fully lift the federal drug felony ban, which denies families benefits appropriate for their family size by making parents with drug felony convictions ineligible for assistance.27 Policies that keep TANF benefits low and reduce or take away those benefits are based on racist ideas about Black women that paint them as lazy, negligent, and devious. But these ideas and the policies they intend to justify do not exclusively harm Black families: all families who do not meet onerous requirements, who have another baby while on TANF, or who have a member with a drug felony conviction, are harmed by these policies.
To reimagine TANF to better serve all families in need, we must consider how a history of racism
affects the program today. The “Black Women Best” framework developed by Janelle Jones, chief economist at the U.S. Department of Labor, “argues if Black women — who, since our nation’s founding, have been among the most excluded and exploited by the rules that structure our society — can one day thrive in the economy, then it must finally be working for everyone.”28 Consistent with Jones’ framework, redesigning TANF so that it centers the needs of Black women and families and adequately helps families struggling to afford basic necessities would better serve families of all races and ethnicities. Such a redesigned TANF program would benefit not only the approximately 5
24 Floyd et al., op. cit. 25 Ali Safawi, “Maine Joins Growing List of States Repealing TANF Full-Family Sanctions,” CBPP, June 17, 2021, https://www.cbpp.org/blog/maine-joins-growing-list-of-states-repealing-tanf-full-family-sanctions. 26 Joe Soss et al., “Setting the Terms of Relief: Explaining State Policy Choices in the Devolution Revolution,” American Journal of Political Science, Vol. 45, No. 2, April 2001, http://urban.hunter.cuny.edu/~schram/ssvosettingthetermsofrelief.pdf. 27 Ali Safawi, “Remaining States Should Lift Racist TANF Drug Felony Bans; Congress Should Lift It Nationwide,” CBPP, June 30, 2021, https://www.cbpp.org/blog/remaining-states-should-lift-racist-tanf-drug-felony-bans-congress-should-lift-it-nationwide. 28 Kendra Bozarth, Grace Western, and Janelle Jones, “Black Women Best: The Framework We Need for An Equitable Economy,” Roosevelt Institute and Groundwork Collaborative, September 2020, https://rooseveltinstitute.org/wp-content/uploads/2020/09/RI_Black-Women-Best_IssueBrief-202009.pdf.

12
million Black children living in the states with the lowest TANF benefits, but also the approximately 7 million Latinx children, and 13 million white children who live in these states.29
TANF Benefit Increases Needed to Promote Racial Equity and Child Well-Being
While hardship rates have fallen in 2021, financial insecurity remains widespread.30 Even pre-pandemic, one-third of households with children experienced a major form of hardship.31 Black and Latina mothers and their children have been hit particularly hard by the pandemic’s economic effects. These disparities were driven by structural racism in the economy, which denies women of color equal access to well-paying jobs and critical work supports such as paid leave. While TANF cannot ameliorate all of the barriers that families face, it can provide adequate benefits to help them meet their basic needs in times of crisis.
A large and growing body of research shows that experiencing poverty and hardship, even briefly,
can have detrimental, life-long impacts on children. Researchers have linked stress caused by a scarcity of resources to long-lasting negative consequences for children’s brain development and physical health.32 Income support programs can improve children’s academic, health, and economic outcomes, the National Academies of Sciences, Engineering, and Medicine’s report on reducing child poverty finds.33 Even relatively small infusions of cash, like those from TANF, can make a difference. Researchers at Columbia University estimate that providing an extra $1,000 per year (just over $83 per month) to low-income families could yield over $11,000 in societal benefits annually, primarily driven by increased earnings and better health among children.34
TANF provides a vital support to families with the lowest incomes: cash assistance. Other anti-
poverty programs, such as SNAP and refundable tax credits, have grown significantly and have had a tremendous impact on reducing hardship, especially in Black and Latinx communities. Yet families with little or no cash income still need monthly cash assistance to be more economically secure. They have needs that may vary month to month and that only cash can cover. Cash assistance is also crucial for stabilizing families during crises and, if reimagined using a Black Women Best framework, can promote racial equity and child well-being. (See Figure 5.) Providing adequate, unconditional cash assistance also affirms the dignity of parents and caregivers and presumes they know how to best care for their children.
29 CBPP analysis of 2020 U.S. Census population estimates, op. cit. 30 CBPP, op. cit. 31 Sherman et al., “Widespread Economic Insecurity Pre-Pandemic Shows Need for Strong Recovery Package,” op. cit. 32 Masten, Lombardi, and Fisher, op. cit. 33 National Academies of Science, Engineering, and Medicine, “The Consequences of Child Poverty,” A Roadmap to Reducing Child Poverty, 2019, https://www.ncbi.nlm.nih.gov/books/NBK547371/. 34 Irwin Garfinkel et al., “The Costs and Benefits of a Child Allowance,” Center on Poverty and Social Policy (CSSP) at Columbia University, Poverty & Social Policy Brief, Vol. 5, No. 1, February 18, 2021, https://static1.squarespace.com/static/5743308460b5e922a25a6dc7/t/602ec9c7ddddd01cd29430e1/1613679049611/Child-Allowance-CBA-brief-CPSP-2021.pdf.

13
FIGURE 5
Given the history of cash assistance programs in the United States and what research tells us
about child development, states and federal policymakers need to improve the adequacy of TANF benefits. Steps states can take now include:
• Reinvest TANF dollars to provide higher benefit levels for participating families. In
fiscal year 2020, states spent just 22 percent of their TANF funds on providing basic cash assistance to families, down from 71 percent in 1997.35 States with greater shares of Black residents tend to spend smaller shares of their TANF funds on basic assistance.36 At a minimum, states should raise their benefit levels to restore value lost to inflation since 1996. Higher benefits for all families in poverty would meaningfully impact children’s futures.
35 Office of Family Assistance, Administration for Children and Families, HHS, “TANF and MOE Spending and Transfers by Activity, FY 2020: United States,” updated September 22, 2021, https://www.acf.hhs.gov/sites/default/files/documents/ofa/fy2020_tanf_moe_national_data_pie_chart.pdf; Ali Safawi and Liz Schott, “To Lessen Hardship, States Should Invest More TANF Dollars in Basic Assistance for Families,” CBPP, updated January 12, 2021, https://www.cbpp.org/research/family-income-support/to-lessen-hardship-states-should-invest-more-tanf-dollars-in-basic. 36 Zachary Parolin, “Temporary Assistance for Needy Families and the Black-White child poverty gap in the United States,” Socio-Economic Review, May 14, 2019, https://doi.org/10.1093/ser/mwz025.

14
• Establish mechanisms to prevent benefits from eroding in the future. Adjusting TANF benefits yearly in step with inflation, such as through a statutory COLA, would maintain families’ purchasing power and help them meet basic needs.
• Provide additional monthly or short-term payments to families. States can provide monthly housing supplements, similar to those in Maine and Minnesota, for families who do not receive rental assistance or other supplements, such as California’s $30 per month diaper benefit.37 States can also use their allocation of the Pandemic Emergency Assistance Fund to provide additional short-term payments to TANF families.38
• End policies that reduce or take away families’ benefits. Maximum TANF benefit levels are too low, and families often get less than that amount because of punitive policies that reduce or take away benefits. States should eliminate full-family sanctions, which take away a family’s entire benefit. States that have not done so already should also fully lift the drug felony ban and eliminate family caps, which deny critical benefits to families because of racist assumptions about people with low incomes. In 2021, Maine passed legislation to end full- family sanctions; Connecticut repealed its family cap law; and Illinois, Kentucky, and Nevada each fully lifted the TANF drug felony ban.
While states have the flexibility to ensure families have enough to afford basic necessities, they
have a long history of providing inadequate assistance — especially states with higher shares of Black residents. To ensure that no family falls below a certain income level, Congress needs to establish a federal minimum benefit. Congress also needs to make significant changes to TANF’s funding structure to retarget its resources to provide cash assistance, address funding inequities, and prevent the erosion of benefits over time.
37 CBPP and National Diaper Bank Network, “End Diaper Need and Period Poverty: Families Need Cash Assistance to Meet Basic Needs,” September 27, 2021, https://www.cbpp.org/research/family-income-support/end-diaper-need-and-period-poverty-families-need-cash-assistance-to. 38 For more, see LaDonna Pavetti, “Rescue Act’s Pandemic Emergency Assistance Will Help Families With Lowest Incomes,” CBPP, March 11, 2021, https://www.cbpp.org/blog/rescue-acts-pandemic-emergency-assistance-will-help-families-with-lowest-incomes.

15
APPENDIX TABLE 1
Monthly Maximum TANF Benefit Levels* (Single-parent family of three)
State July
1996 July
2000 July
2005 July
2010 July
2015 July
2020 July
2021
1996-2021 Change,
Adjusted for Inflation
Alabama $164 $164 $215 $215 $215 $215 $215 -22% Alaska 923 923 923 923 923 923 923 -41% Arizona 347 347 347 278 278 278 278 -52% Arkansas 204 204 204 204 204 204 204 -41% California1 596 626 723 694 704 878 878 -12% Colorado 356 356 356 462 462 508 508 -15% Connecticut2 636 636 636 674 698 698 709 -34% Delaware 338 338 338 416 338 338 338 -41% District of Columbia3 415 379 379 428 434 658 658 -6%
Florida 303 303 303 303 303 303 303 -41% Georgia 280 280 280 280 280 280 280 -41% Hawai’i4 712 570 570 610 610 610 610 -49% Idaho 317 293 309 309 309 309 309 -42% Illinois5 377 377 396 432 432 533 543 -14% Indiana 288 288 288 288 288 288 288 -41% Iowa 426 426 426 426 426 426 426 -41% Kansas6 429 429 429 429 429 429 429 -41% Kentucky 262 262 262 262 262 262 262 -41% Louisiana7 190 190 240 240 240 240 240 -25% Maine8 418 461 485 485 485 610 620 -12% Maryland9 373 417 482 574 636 727 727 16% Massachusetts10 525 525 578 578 578 593 712 -19% Michigan 459 459 459 492 492 492 492 -36% Minnesota11 532 532 532 532 532 632 632 -29% Mississippi 120 170 170 170 170 170 260 29% Missouri 292 292 292 292 292 292 292 -41% Montana 438 469 405 504 586 588 588 -20% Nebraska12 364 364 364 364 364 468 485 -21% Nevada 348 348 348 383 383 386 386 -34% New Hampshire13 550 575 625 675 675 1086 1098 19% New Jersey 424 424 424 424 424 559 559 -22% New Mexico 389 439 389 447 380 447 447 -32% New York14 577 577 691 753 789 789 789 -19% North Carolina 272 272 272 272 272 272 272 -41% North Dakota15 431 457 477 477 486 486 486 -33% Ohio16 341 373 373 434 473 505 512 -11% Oklahoma 307 292 292 292 292 292 292 -43%

16
APPENDIX TABLE 1
Monthly Maximum TANF Benefit Levels* (Single-parent family of three)
State July
1996 July
2000 July
2005 July
2010 July
2015 July
2020 July
2021
1996-2021 Change,
Adjusted for Inflation
Oregon 460 460 460 485 506 506 506 -35% Pennsylvania17 403 403 403 403 403 403 403 -41% Rhode Island18 554 554 554 554 554 554 712 -24% South Carolina19 200 204 205 270 277 299 305 -9% South Dakota 430 430 501 555 599 615 630 -13% Tennessee20 185 185 185 185 185 277 387 24% Texas21 188 201 223 260 281 303 308 -3% Utah 416 451 474 498 498 498 498 -29% Vermont22 597 622 640 640 640 699 699 -30% Virginia23 354 354 389 389 389 508 559 -6% Washington 546 546 546 562 521 569 654 -29% West Virginia 253 328 340 340 340 340 542 27% Wisconsin24 517 673 673 673 653 653 653 -25% Wyoming25 360 340 340 561 652 712 726 20% Median state26 377 379 389 429 429 492 498 -21%
*Benefit levels are listed in nominal dollars.
Note: TANF = Temporary Assistance for Needy Families. 1 California has different benefit levels based on geographic location (Region 1 or Region 2) and whether families are exempted from work requirements. The benefit levels reported here are for a family in Region 1, which includes the most populous counties, who are non-exempt. In October 2021, this benefit level increased to $925. 2 Connecticut has different benefit levels based on geographic location (Regions A, B, and C). The benefit listed here is for Region A, which covers the state’s highest-cost area. The state has a COLA based on the Social Security and SSI COLA. In 2021, this COLA was funded for the first time in several years. 3 In October 2021, D.C. increased its benefit level to $665. 4 Hawai’i has a smaller benefit for families who must participate in work activities and a higher benefit for families who are exempt. Benefits for a family of three are $610 and $763, respectively. 5 Illinois began tying benefit levels to 30 percent of the federal poverty line in 2019. Prior to 2018, Illinois had different benefit levels based on geographic location. 6 Kansas has different benefit levels based on geographic location. The benefit levels reported here are those that apply to most of the state. 7 Louisiana has a different benefit structure for its TANF program for children who are not living with their parent, called the Kinship Care Subsidy Program. The benefit under that program is $222 per child. 8 Maine indexed its benefit levels to the Social Security and SSI COLA. Families whose housing cost exceed 50 percent of their countable income are eligible for a housing supplement of up to $300 per month. 9 Maryland adjusts its TANF benefit levels so that TANF and SNAP benefits combined equal at least 61 percent of the state’s Minimum Living Level, which is indexed the CPI-U. Benefit levels did not increase between July 2020 and July 2021, although the state is providing $100 in additional payments per person between January and December 2021; therefore, a family of three with no other income would have received $1,027 in July 2021 ($727 plus $300 in additional payments.) 10 Benefit levels were increased twice in 2021, first in January to $652 and again in July to $712. Massachusetts provides a flat $40 per month housing supplement for families paying rent for private unsubsidized housing. The benefit levels reported here are only the base grant. In previous years, the benefit levels that CBPP reported for Massachusetts included both the base grant and the housing supplement. CBPP collected the information for benefit levels for 2021 onward; benefit levels for prior years are from the Massachusetts Law Reform Institute. 11 In 2021, Minnesota enacted a COLA based on the CPI-U. In October 2021, benefits increased to $641. Families are eligible for a flat $110 per month housing supplement if they are not receiving subsidized housing. Families where only the children are receiving TANF are not eligible for the housing supplement.

17
APPENDIX TABLE 1
Monthly Maximum TANF Benefit Levels* (Single-parent family of three)
State July
1996 July
2000 July
2005 July
2010 July
2015 July
2020 July
2021
1996-2021 Change,
Adjusted for Inflation
12 Nebraska’s benefit level is tied to 55 percent of the state’s Standard of Need, which is adjusted biannually using the CPI-U. 13 New Hampshire’s TANF benefit levels are tied to 60 percent of the federal poverty line and are adjusted each year. 14 New York has different benefit levels based on geographic location. The benefit listed here is for New York City. New York State’s benefit has several components, including a statewide monthly basic allowance (for recurring needs), a statewide home energy allowance, a statewide supplemental home energy allowance, and a county-specific rental allowance, which varies from $259 to $447. The rental allowance in New York City is $400. 15 North Dakota’s benefit of $486 includes a flat $50 per month housing supplement for families who are solely responsible for their shelter costs. The base benefit ($436 in 2021) is not shown so that the benefit level CBPP reports aligns with the reporting methodology of the Urban Institute Welfare Rules Database, where 1996-2005 North Dakota benefit level data are sourced. 16 Ohio raises its TANF benefit levels each January based on the Social Security and SSI COLA. 17 Pennsylvania has different benefit levels based on geographic location (Groups 1-5). The benefit levels listed here are for Group 2, which includes Philadelphia County, the county with the most TANF recipients. In previous years, the benefit levels that CBPP reported for Pennsylvania were for Group 1 ($421). Current benefit levels for all groups have been effective since January 1, 1990, according to the state TANF manual. 18 Rhode Island began providing families with the increased benefit in September 2021, with retroactive payments for July and August. 19 South Carolina’s benefit level is set at 33.7 percent of its Standard of Need (50 percent of the federal poverty level), which in turn equals about 17 percent of the federal poverty level. 20 In 2021, Tennessee enacted legislation stating that the benefit level cannot go below 25 percent of the state’s Standard of Need, which is updated every year. 21 Texas increases its benefit level in step with 17 percent of the federal poverty level. 22 Vermont has different benefit levels based on geographic location. The benefit levels listed here are for families living outside of Chittenden County. It also provides a housing supplement of up to $45 per month for families whose housing costs exceed $400 (for outside Chittenden County). CBPP collected the information for benefit levels for 2010-2021; benefit levels for prior years are from the Urban Institute Welfare Rules Database. In August 2021, the benefit level outside Chittenden County increased to $811. 23 Virginia has different benefit levels based on geographic location (Groups II and III). The benefit levels listed here are for Group III, which includes the most populous counties. In 2021, Virginia passed budget legislation that set a goal to gradually raise benefit levels to 50 percent of the poverty line. 24 In Wisconsin, benefits have remained at $673 since 2011 for some categories of Wisconsin Works (W-2) recipients (caretakers of newborns and pregnant women with at-risk pregnancies and no other children in their care). The benefit level for W-2 Transition placement is $608 per month.
25 Wyoming adjusts its benefit levels based on changes in the state’s cost-of-living index for the previous year, as determined by the Division of Economic Analysis. 26 The median state is not the same state every year; it has shifted as states have changed their benefit levels. Source: TANF benefit levels for a single-parent family of three were compiled by CBPP from various sources and are current as of July 1, 2021. Inflation-adjusted, percent change uses the CPI-U.

18
APPENDIX TABLE 2
TANF Benefit Levels as Percentage of Federal Poverty Level
State 1996 2021 Rank (2021)
Alabama 15.2% 11.7% 50 Alaska 68.3% 40.3% 4 Arizona 32.1% 15.2% 45 Arkansas 18.9% 11.1% 51 California 55.1% 48.0% 2 Colorado 32.9% 27.8% 24 Connecticut 58.8% 38.7% 9 Delaware 31.2% 18.5% 36 District of Columbia 38.4% 36.0% 11 Florida 28.0% 16.6% 40 Georgia 25.9% 15.3% 44 Hawai’i 57.2% 29.0% 22 Idaho 29.3% 16.9% 37 Illinois 34.9% 29.7% 20 Indiana 26.6% 15.7% 43 Iowa 39.4% 23.3% 32 Kansas 39.7% 23.4% 31 Kentucky 24.2% 14.3% 47 Louisiana 17.6% 13.1% 49 Maine 38.6% 33.9% 16 Maryland 34.5% 39.7% 5 Massachusetts 52.2% 38.9% 7 Michigan 42.4% 26.9% 27 Minnesota 49.2% 34.5% 14 Mississippi 11.1% 14.2% 48 Missouri 27.0% 16.0% 41 Montana 40.5% 32.1% 17 Nebraska 33.7% 26.5% 29 Nevada 32.2% 21.1% 35 New Hampshire 50.8% 60.0% 1 New Jersey 39.2% 30.5% 18 New Mexico 36.0% 24.4% 30 New York 53.3% 43.1% 3 North Carolina 25.1% 14.9% 46 North Dakota 39.8% 26.6% 28 Ohio 31.5% 28.0% 23 Oklahoma 28.4% 16.0% 41 Oregon 42.5% 27.7% 25 Pennsylvania 38.9% 22.0% 33

19
APPENDIX TABLE 2
TANF Benefit Levels as Percentage of Federal Poverty Level
State 1996 2021 Rank (2021)
Rhode Island 51.2% 38.9% 7 South Carolina 18.5% 16.7% 39 South Dakota 39.8% 34.4% 15 Tennessee 17.1% 21.1% 34 Texas 17.4% 16.8% 38 Utah 38.5% 27.2% 26 Vermont 58.5% 38.2% 10 Virginia 32.7% 30.5% 18 Washington 50.5% 35.7% 12 West Virginia 23.4% 29.6% 21 Wisconsin 47.8% 35.7% 13 Wyoming 33.3% 39.7% 6 Median state 34.9% 27.2% --
Note: TANF = Temporary Assistance for Needy Families. Source: Calculated from figures in Appendix Table 1 and Health and Human Services poverty guidelines for a single-parent family of three for 1996 (https://aspe.hhs.gov/1996-hhs-poverty-guidelines) and 2021 (https://aspe.hhs.gov/topics/poverty-economic-mobility/poverty-guidelines)

20
APPENDIX TABLE 3
Rent Affordable to Family With Maximum TANF Benefit Compared to Fair Market Rent for Two-Bedroom Apartment
State Rent Affordable to TANF Family*
Fair Market Rent (FMR)**
Rent Affordable to TANF Family as
Share of FMR Housing
Supplement?
Alabama $65 $822 8% Alaska $277 $1,235 22% Arizona $83 $1,160 7% Arkansas $61 $759 8% California (Los Angeles Co.) $263 $2,058 13%
Colorado $152 $1,430 11% Connecticut (City of Stamford) $213 $1,958 11%
Delaware $101 $1,171 9% District of Columbia $197 $1,765 11% Florida $91 $1,290 7% Georgia $84 $1,010 8% Hawai’i $183 $1,960 9% Idaho $93 $903 10% Illinois $163 $1,150 14% Indiana $86 $862 10% Iowa $128 $831 15% Kansas $129 $874 15% Kentucky $79 $821 10% Louisiana $72 $927 8% Maine1 $486 $1,112 44% X Maryland $218 $1,487 15% Massachusetts2 $254 $1,885 13% X Michigan $148 $964 15% Minnesota3 $300 $1,133 26% X Mississippi $78 $791 10% Missouri $88 $867 10% Montana $176 $923 19% Nebraska $146 $879 17% Nevada $116 $1,135 10% New Hampshire $329 $1,286 26% New Jersey $168 $1,662 10% New Mexico $134 $895 15% New York (New York City) $237 $2,053 12%
North Carolina $82 $960 9% North Dakota4 $181 $864 21% X

21
APPENDIX TABLE 3
Rent Affordable to Family With Maximum TANF Benefit Compared to Fair Market Rent for Two-Bedroom Apartment
State Rent Affordable to TANF Family*
Fair Market Rent (FMR)**
Rent Affordable to TANF Family as
Share of FMR Housing
Supplement?
Ohio $154 $865 18% Oklahoma $88 $847 10% Oregon $152 $1,307 12% Pennsylvania (Philadelphia Co.) $121 $1,260 10%
Rhode Island $214 $1,172 18% South Carolina $92 $940 10% South Dakota $189 $804 24% Tennessee $116 $915 13% Texas $92 $1,143 8% Utah $149 $1,051 14% Vermont (Rutland Co.)5 $255 $918 28% X Virginia (Fairfax Co.) $168 $1,765 10% Washington $196 $1,524 13% West Virginia $163 $771 21% Wisconsin $196 $930 21% Wyoming $218 $876 25% Median state $149 $1,051 14%
Note: TANF = Temporary Assistance for Needy Families; Fair Market Rent = U.S. Department of Housing and Urban Development’s estimate of rent and utility costs for modest housing unit in local area; HMFA = HUD Metropolitan FMR Area. All dollar figures are monthly amounts. *Figures shown represent 30 percent of the maximum TANF benefit unless the state has a housing supplement, in which case 100 percent of the maximum available housing supplement plus 30 percent of the base grant is considered affordable rent. Federal standards define rent (including utilities) as affordable when it takes up no more than 30 percent of a household’s income and hypothetical families are assumed to have TANF as their sole source of income. Though housing supplements are given to families as cash, it is reasonable to assume that families spend it on rent. **Unless otherwise noted, the FMR presented is a weighted statewide average FMR based on HUD FMRs for various sub-regions in the state. In states where maximum benefit levels listed in Appendix Table 1 do not apply to the majority of the state, the FMR for the most populous county or city (in Connecticut and New York) in the region whose benefit is reported in Appendix Table 1 is used. These figures do not represent the housing burden on actual TANF families, which depends on the amount of TANF cash assistance, their housing costs, and the amount of any other income or assistance. 1 Maine provides a housing supplement of up to $300 per month. Without this supplement, the affordable rent for a family with the maximum TANF benefit ($620) would cover 17 percent of FMR. 2 Massachusetts provides a flat $40-per-month housing supplement. Without this supplement, the affordable rent for a family with the maximum TANF benefit ($712) would cover 11 percent of FMR. 3 Minnesota provides a flat $110-per-month housing supplement. Without this supplement, the affordable rent for a family with the maximum TANF benefit ($532) would cover 17 percent of FMR. 4 North Dakota provides a flat $50-per-month housing supplement. Without this supplement, the affordable rent for a family with the base grant ($436; not shown in Appendix Table 1) would cover 15 percent of FMR. 5 Vermont provides a housing supplement of up to $45 per month. Without this supplement, the affordable rent for a family with the base grant ($699) would cover 23 percent of FMR. Calculations are for families living outside of Chittenden County. Source: FMR data from Aurand et al., op. cit. TANF benefit levels for single-parent families of three were compiled by CBPP from various state sources and are current as of July 1, 2021