Tamworth: Locality Profiledemocracy.tamworth.gov.uk/documents/s15689/Appendix 3 State of...
31
i Insight, Planning & Performance Team Tamworth: Locality Profile October 2016 Considerations for commissioning
Transcript of Tamworth: Locality Profiledemocracy.tamworth.gov.uk/documents/s15689/Appendix 3 State of...
i
Insight, Planning & Performance Team
Tamworth: Locality Profile
October
2016
Considerations for
commissioning
i
Document details
Title Tamworth: Locality Profile
Date created October 2016
Description The purpose of the profile is to provide commissioners and practitioners with an evidence base to help understand residents’ needs at a local level. It provides detail behind ‘The Story of Staffordshire’, links with the Community Safety Assessments and contributes to the Joint Strategic Needs Assessment.
Produced by Insight, Planning & Performance Team Staffordshire County Council
Contact Tel: 01785 276529 Email: [email protected] Insight, Planning and Performance Staffordshire County Council
Geographical coverage
Tamworth
Copyright and disclaimer
This product is the property of Staffordshire County Council. If you wish to reproduce this document either in whole, or in part, please acknowledge the source and the author(s). Staffordshire County Council, while believing the information in this publication to be correct, does not guarantee its accuracy nor does the County Council accept any liability for any direct or indirect loss or damage or other consequences, however arising from the use of such information supplied.
Contents
1 Introduction 3
2 Out of 100 people in Tamworth 5
3 Key messages 6
4 Brexit and Tamworth 7
5 Key considerations for commissioning 9
5.1 The population of Tamworth 9
5.2 Be able to access more good jobs and feel the benefits of economic growth 9
5.3 Be healthier and more independent 10
5.4 Feel safer, happier and more supported 11
6 Tamworth ward level ‘risk’ index – to identify areas with the poorest outcomes 13
7 Tamworth district level indicator matrix 16
8 How do we perform compared to our statistical neighbours? 24
9 Tamworth ward level indicator matrix 26
Insight, Planning and Performance Page 3
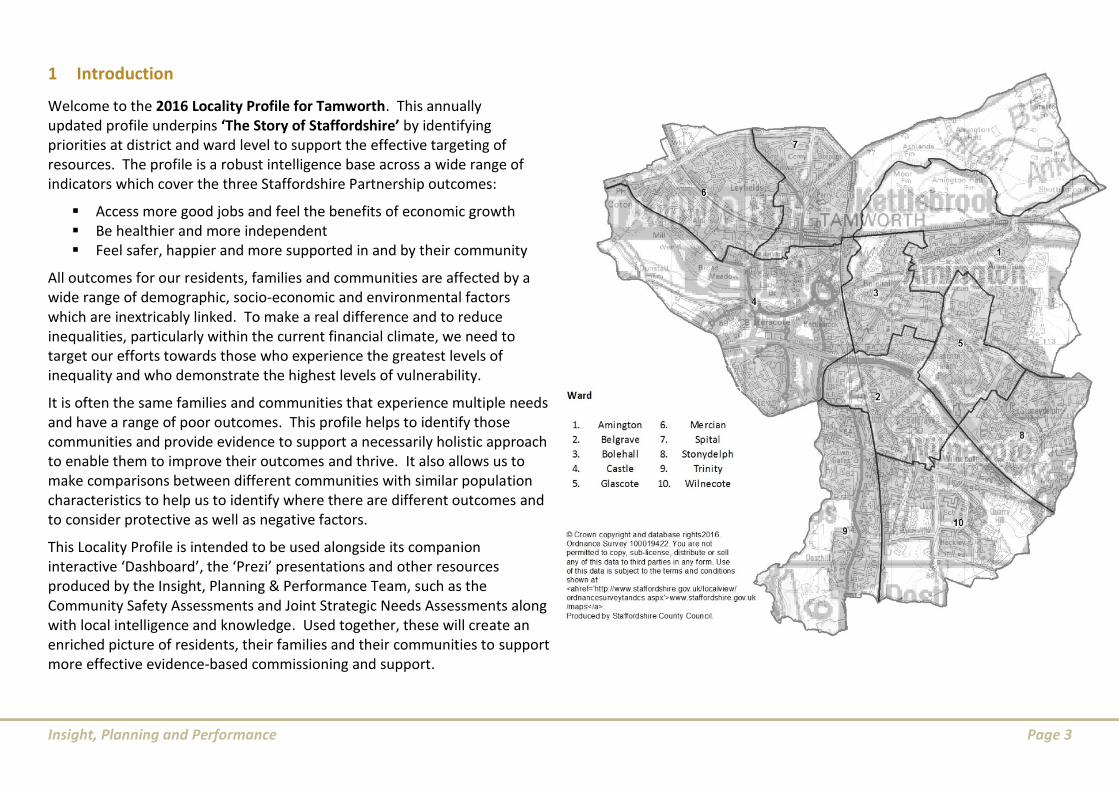
1 Introduction
Welcome to the 2016 Locality Profile for Tamworth. This annually updated profile underpins ‘The Story of Staffordshire’ by identifying priorities at district and ward level to support the effective targeting of resources. The profile is a robust intelligence base across a wide range of indicators which cover the three Staffordshire Partnership outcomes:
Access more good jobs and feel the benefits of economic growth Be healthier and more independent Feel safer, happier and more supported in and by their community
All outcomes for our residents, families and communities are affected by a wide range of demographic, socio-economic and environmental factors which are inextricably linked. To make a real difference and to reduce inequalities, particularly within the current financial climate, we need to target our efforts towards those who experience the greatest levels of inequality and who demonstrate the highest levels of vulnerability.
It is often the same families and communities that experience multiple needs and have a range of poor outcomes. This profile helps to identify those communities and provide evidence to support a necessarily holistic approach to enable them to improve their outcomes and thrive. It also allows us to make comparisons between different communities with similar population characteristics to help us to identify where there are different outcomes and to consider protective as well as negative factors.
This Locality Profile is intended to be used alongside its companion interactive ‘Dashboard’, the ‘Prezi’ presentations and other resources produced by the Insight, Planning & Performance Team, such as the Community Safety Assessments and Joint Strategic Needs Assessments along with local intelligence and knowledge. Used together, these will create an enriched picture of residents, their families and their communities to support more effective evidence-based commissioning and support.

Insight, Planning and Performance Page 4
What’s new?
Based on your feedback these profiles are always evolving and improving. The new elements that have been included this year are:
Brexit: There are a lot of unknowns but we give consideration to the possible impact of the country’s exit from the European Union.
Changes to the Indicator Matrices: The matrices remain very
popular but have this year been improved to include actual numbers as well as proportions and rates.
Interactive dashboard: Dashboards allow users to have more immediate and flexible access to the latest available information for a selection of our key indicators. This will keep the profiles ‘alive’ and we will continue to develop these dashboards throughout the year. The dashboards can be found on the Staffordshire Observatory Website: http://www.staffordshireobservatory.org.uk/homepage.aspx
Improved benchmarking: We have always recognised the importance of benchmarking so that users can see at a glance where there are significant or meaningful differences. Mostly we use England as the comparator and we have done so this time but we have also compared a selected number of indicators with Tamworth’s ‘statistical neighbours’ - a group of 16 districts that the Chartered Institute of Public Finance and Accountancy (CIPFA) assessed as being similar based on a range of population characteristics (Tamworth’s ‘statistical’ or ‘nearest neighbours’ are listed in Section 8). Comparing with similar districts gives us more information about our residents and helps to identify potential areas of improvement which could be missed when comparing only with the national average.
Key messages: We always provide a list of key messages to draw attention to important issues and these are largely based on where an indicator is higher or lower than England or as is the case this time is in the upper or lower quartile when compared to the statistical neighbour group. But this time we have also summarised these key messages under the headings used in The Story of Staffordshire to make sure that the key messages described are translated as far as possible at district level and below.
Layout of this profile
The profile presents the main messages which were highlighted in the ‘Story of Staffordshire’, from a district perspective before listing the key messages about Tamworth from the indicator matrices. There is then a section on priorities at a district level before presenting information about the wards with the highest needs. The final three sections comprise of Indicator Matrices at district level, selected indicators compared with CIPFA nearest neighbour and finally the ward-level indicator matrix.
Feedback
As always we would welcome your feedback on these profiles so please contact:
Phil Steventon [email protected] or [email protected]

Insight, Planning and Performance Page 5
2 Out of 100 people in Tamworth
Compiled by Insight, Planning and Performance Team, Staffordshire County Council
Insight, Planning and Performance Page 6
3 Key messages Population: Around 77,100 people live in Tamworth. There are
relatively more children aged under 16 compared to England and less people aged 65 many of whom are income deprived. The population is projected to have a small increase overall by 2025 but a much larger growth in people aged 65 and over. There are also more single-parent households than average.
Community resilience: The demand on public sector funded services
has increased considerably over the last decade and a higher than average proportion of adults in Tamworth use health and social care services. An ageing population means that these demands are likely to increase further and services in their present forms are set to become unsustainable. In addition, there is a high number of people providing unpaid care who are often older, in poor health and isolated themselves. Therefore we need to continue to think differently about the community and partnership relationship.
Reducing inequalities: There are a number of wards in Tamworth
where families and communities face multiple issues such as unemployment or low incomes, low qualifications, poor housing, social isolation, ill-health (physical and/or mental) and poor quality of life. These wards are: Glascote, Belgrave, Castle, Stonlydelph, Bolehall and Mercian. These areas require particular focus and an integrated partnership response.
The impact of Brexit: The current position shows that the local
economy has not been significantly affected by Brexit and we are largely seeing ‘business as usual’ in Staffordshire post-EU referendum. This may change once Article 50 is triggered, although given the timescales required to negotiate exit arrangements, we are unlikely to see any significant impact until at least 2020.
Be able to access more good jobs and feel the benefits of economic
growth: Education and employment rates have improved in Tamworth but this has not been universal - especially amongst some our most vulnerable communities. There are also gaps in levels of adult skills and qualifications with a high proportion of Tamworth adults having no qualifications, more households with children where there are no adults in employment and high levels of financial stress.
Be healthier and more independent: Life expectancy has increased but the number of years spent in good health has not. Older people than average have a limiting long term illness and therefore the number of years people spend in poor health towards the end of life in Tamworth is high. Men and women spend 17 and 20 years in poor health respectively. In addition, teenage pregnancy rates are high in Tamworth and too many residents have excess weight, eat unhealthily and are inactive - we need to turn this around to improve quality of life and reduce demand for services.
Feel safer, happier and more supported: Most Tamworth residents
are satisfied with the area they live in. Tamworth has higher than average levels of violent crime and anti-social behaviour and perception of crime is also high. Housing affordability is an issue for low earners in Tamworth and more people live in socially rented housing than average.
Insight, Planning and Performance Page 7
4 Brexit and Tamworth
On 23rd June 2016 the United Kingdom electorate voted in favour of ending its membership of the European Union (EU). Tamworth residents also voted in favour of leaving the EU. Of the 74% turnout, 67% voted leave and 33% voted to remain. While the UK saw a short-term impact on the national economy in the immediate wake of the EU referendum, this calmed fairly quickly, and we are largely seeing ‘business as usual’ locally. Given the Government’s signalled intention to trigger Article 501 by March 2017, we are unlikely to see the impact of any major changes until 2020, though there remains a risk of market volatility during this time (“Brexit turbulence”). While it might be possible to estimate what some of the impact of Brexit might look like, it is important to remember that this is entirely new territory. The UK will be the first country to leave the EU and there will be many unknowns ahead.
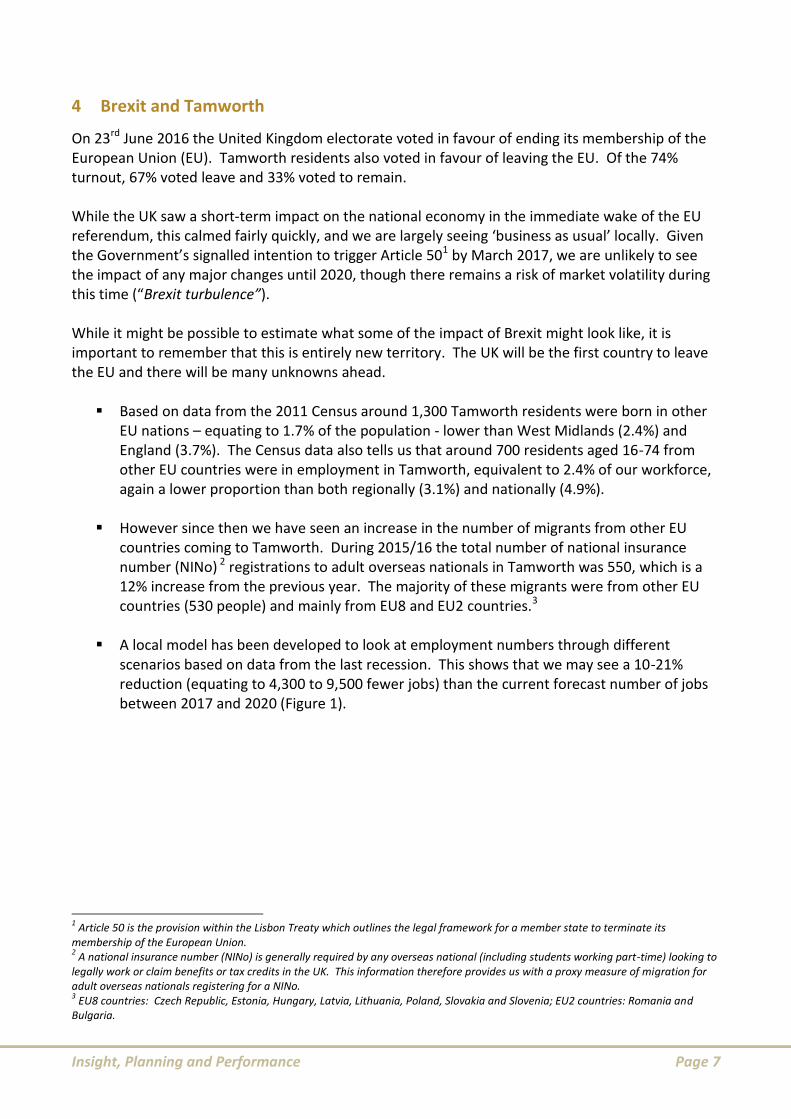
Based on data from the 2011 Census around 1,300 Tamworth residents were born in other EU nations – equating to 1.7% of the population - lower than West Midlands (2.4%) and England (3.7%). The Census data also tells us that around 700 residents aged 16-74 from other EU countries were in employment in Tamworth, equivalent to 2.4% of our workforce, again a lower proportion than both regionally (3.1%) and nationally (4.9%).
However since then we have seen an increase in the number of migrants from other EU
countries coming to Tamworth. During 2015/16 the total number of national insurance number (NINo) 2 registrations to adult overseas nationals in Tamworth was 550, which is a 12% increase from the previous year. The majority of these migrants were from other EU countries (530 people) and mainly from EU8 and EU2 countries.3
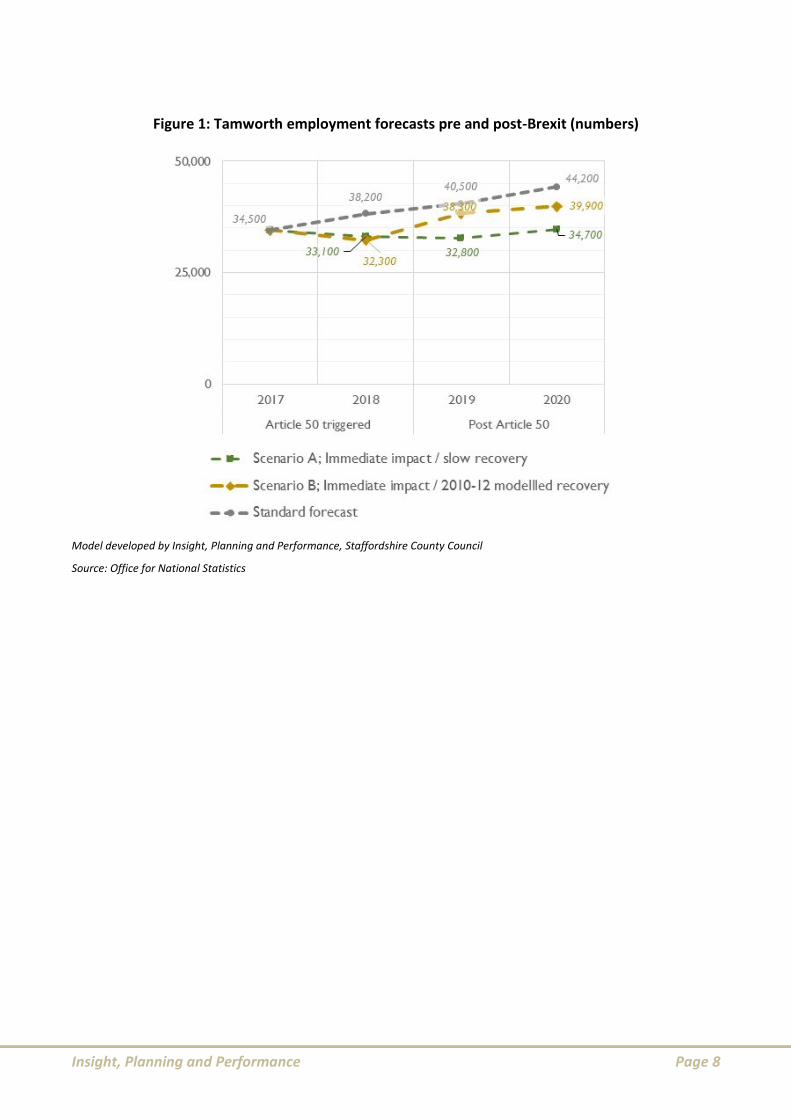
A local model has been developed to look at employment numbers through different
scenarios based on data from the last recession. This shows that we may see a 10-21% reduction (equating to 4,300 to 9,500 fewer jobs) than the current forecast number of jobs between 2017 and 2020 (Figure 1).
1 Article 50 is the provision within the Lisbon Treaty which outlines the legal framework for a member state to terminate its
membership of the European Union. 2 A national insurance number (NINo) is generally required by any overseas national (including students working part-time) looking to
legally work or claim benefits or tax credits in the UK. This information therefore provides us with a proxy measure of migration for adult overseas nationals registering for a NINo. 3 EU8 countries: Czech Republic, Estonia, Hungary, Latvia, Lithuania, Poland, Slovakia and Slovenia; EU2 countries: Romania and
Bulgaria.
Insight, Planning and Performance Page 8
Figure 1: Tamworth employment forecasts pre and post-Brexit (numbers)
Model developed by Insight, Planning and Performance, Staffordshire County Council
Source: Office for National Statistics

Insight, Planning and Performance Page 9
5 Key considerations for commissioning
5.1 The population of Tamworth
Tamworth is resident to 77,100 people. The population has a higher proportion of children aged under 16 compared to England. There are fewer people aged 65 and over in Tamworth compared to average.
At ward level, Belgrave, Glascote, Stonydelph and Wilnecote wards have high proportions of
children under 16 compared with England whilst Castle, Mercian, Spital and Trinity have high proportions of older people aged 65 and over.
The overall population for Tamworth is projected to increase between 2015 and 2025 by 2%
with significant growth in people aged 65 and over (27%) and aged 85 and over (59%). The rate of increase in the number of older people aged 85 and over in Tamworth is faster than the England average equating to 800 additional residents aged 85 and over by 2025.
There are nine lower super output areas (LSOAs) that fall within the most deprived national
quintile in Tamworth, making up around 18% of the total population (13,500 people). These areas fall within Amington, Belgrave, Castle, Glascote and Stonydelph.
The dependency ratio for older people in Tamworth is 27 older people for every 100 people
of working age which is lower than England. Of the 10 wards in Tamworth, four have a higher than average dependency ratio for older people.
Aspiring homemakers is the most common Mosaic4 group across Tamworth and makes up
23% (18,100) of the population. Some wards have high proportions of their populations in a single segmentation group, for example, nearly one in two residents who live in Glascote are in the “Family Basics” group.
5.2 Be able to access more good jobs and feel the benefits of economic growth
The proportion of children in Tamworth who had reached a good level of development at the age of five (69%) is similar to the national average (66%).
KS2 results for Tamworth pupils are also similar to the England average.
GCSE attainment for Tamworth pupils is similar to the England average. There are however
inequalities within the district with attainment ranging from 36% in Wilnecote ward to 66% in Castle ward.
The percentage of adults aged 16-64 with NVQ level 25 or above is better than the national
average. However, Tamworth has a high number of adults with no qualifications and is in the worst 5% nationally. This may hinder economic growth in Tamworth.
4 Mosaic Public Sector by Experian classifies all households by allocating them to one of 15 summary groups and 66 detailed types.
These paint a rich picture of residents in terms of their socio-economic and socio-cultural behaviour. 5 NVQ 2 = four or five GCSEs at grades A*–C, BTEC first diploma.
Insight, Planning and Performance Page 10
Unemployment and youth unemployment rates in Tamworth (as at June 2016) were lower
than the national average; both performed well compared to CIPFA district comparators. The proportion of people claiming out-of-work benefits is better than average (8.3% compared to 8.6%).
The gap in the employment rate between those with a long term health condition and the
general population is 44%. Other vulnerable groups (for example those with mental health conditions or who have a learning disability) also have relatively low employment rates.
There is a high proportion of households with children where there are no adults in
employment (4.7%) compared with England (4.2%).
Using the Mosaic variable “Financial Stress”, 30% (23,200) of the population in Tamworth find it difficult or very difficult to cope on current income. This is higher than the national average (28%). There is variation across the district with financial stress ranging from 22% in Trinity ward to 39% in Glascote ward. Six of the 10 wards in Tamworth are higher than the national average.
The proportion of Tamworth residents aged 60 and over living in income deprived
households is significantly worse than the national average.
5.3 Be healthier and more independent
Overall life expectancy at birth in Tamworth is 79 years for men and 83 years for women, both similar to the national averages. However men and women living in the most deprived areas of Tamworth live five and seven years less than those living in less deprived areas respectively.
Healthy life expectancy in Tamworth is 63 years for both men and women which is shorter
than average. Women in Tamworth spend more of their lives in poor health than men (20 years compared to 17). In addition, healthy life expectancy remains below retirement age which has significant long-term implications, for example, while people are expected to work later into their 60s many will not be healthy enough to do so.
Breastfeeding initiation and prevalence rates at six to eight weeks in Tamworth remain
lower than the England rate.
Around 23% of children aged four to five in Tamworth have excess weight (overweight or obese) with rates being similar to average. There are no wards where the prevalence of children who are either overweight or obese in Reception is higher than average. Around 31% of children aged 10-11 (Year 6) have excess weight with rates being similar to average. When compared to CIPFA district comparators, Tamworth has one of the lowest rates. However, prevalence is particularly high in Belgrave ward.
Teenage pregnancy rates in Tamworth are the third highest in England. Rates are
particularly high in Amington, Belgrave, Glascote, Stonydelph and Wilnecote wards.
Insight, Planning and Performance Page 11
Smoking prevalence for adults in Tamworth is lower than the national average whilst smoking-attributable mortality is similar to the average. Both perform well compared to CIPFA district comparators. Alcohol-attributable mortality in males is similar to the national average but performs poorly compared to CIPFA district comparators.
More than seven in ten adults have excess weight (either obese or overweight) which is
higher than the national average and performs poorly compared to CIPFA district comparators. The proportion of people who are obese in Tamworth is higher than the England average (more than one in three) and also performs poorly compared to CIPFA district comparators.
Just over half of Tamworth adults meet the recommended levels of physical activity; this is
similar to the national average. Less than one in four Tamworth adults are physically inactive, lower than both the England average (equating to around 14,600 people) and CIPFA statistical neighbours.
There is a higher proportion of residents in Tamworth aged 65 and over with a limiting long-
term illness compared to the national average.
The number of people on depression and diabetes registers in Tamworth is higher than the national average. The number of people on hypertension registers in Tamworth is similar to the national average
The proportion of older people in Tamworth who take up their offer of a seasonal flu
vaccine is similar to the national average; for the pneumococcal vaccine it is lower than average.
5.4 Feel safer, happier and more supported
‘Feeling the Difference’ is a long-standing, bi-annual, public opinion survey giving our local residents an opportunity to give their views on their area as a place to live, their safety and wellbeing and local public services. The latest round of results reveals that 89% of Tamworth respondents were satisfied with the area as a place to live.
Tamworth has a lower proportion of lone pensioner households compared to the national
average and CIPFA district comparators. Three wards have higher proportions of households with lone pensioners; Castle, Mercian and Spital.
Based on data from the 2011 Census, overall more residents in Tamworth provide unpaid
care compared to the England average. This equates to around 8,100 people. Around 15% (1,600 people) of residents aged 65 and over provide unpaid care which is also higher than the England average of 14%.
About one in ten Tamworth households are living in fuel poverty, lower than the national
average.
A higher proportion of households in Tamworth live in socially rented houses compared to the national average.
Insight, Planning and Performance Page 12
Housing affordability is an issue for low earners in Tamworth: The lowest quartile house
price in Tamworth was 6.8 times the lowest quartile income and higher than the England average of 6.5.
During 2015/16 there were 70 homelessness acceptances in Tamworth, the rate is similar to
the national average.
Based on Feeling the Difference Survey, almost twice as many people are fearful of being a victim of crime (19%) compared with those who have actually experienced crime (11%) in Tamworth.
Actual rates of crime in Tamworth are lower than the national average. However Castle
ward has a significantly high rate of crime. Levels of anti-social behaviour are higher than the national average particularly in Amington, Belgrave, Bolehall, Castle, Glascote and Stonydelph. Levels of violent crime in Tamworth are also higher than the England average: Amington, Belgrave, Castle and Glascote have particularly high rates.
Insight, Planning and Performance Page 13
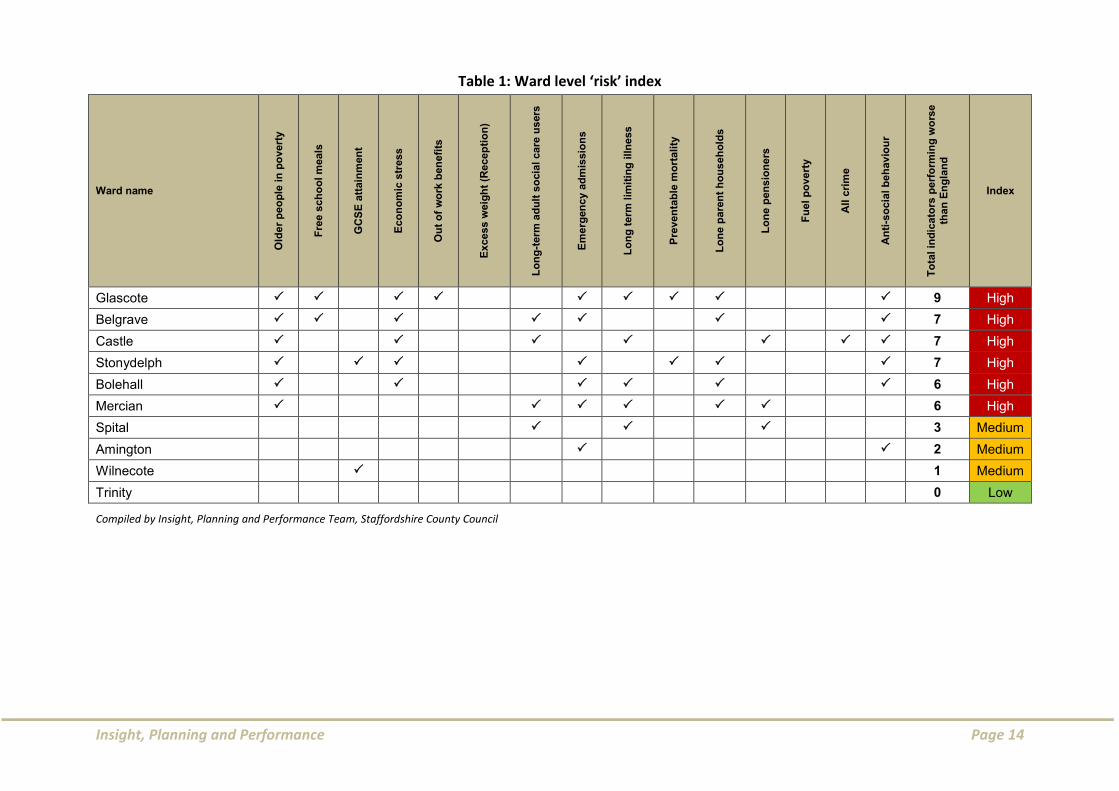
6 Tamworth ward level ‘risk’ index – to identify areas with the poorest outcomes
Throughout the report we have highlighted examples of the inequalities in quality of life across Tamworth, with those in more deprived areas consistently experiencing poorer outcomes. For us to achieve our vision for Tamworth, particularly within the current financial climate, we need to target our efforts towards those who experience the greatest levels of inequality and who demonstrate the highest levels of vulnerability. A number of indicators have been selected across a range of themes to identify wards with higher levels of need so that resources can be targeted more effectively. The indicators used are:
Income deprivation affecting older people index, 2015 Eligibility for Free School Meals, 2016 Key Stage 4 (5 A*-C incl. English & Maths), 2014/15 Economic stress (Prevalence) [MOSAIC], 2016 Out of work benefits, 2015 Child excess weight (Reception age), 2014/15 Long-term adult social care users, 2015/16 Emergency admissions (all ages), 2015/16 Long term limiting illness (all ages), 2011 Preventable mortality, 2012-2014 Lone parent households, 2011 Lone pensioners, 2011 Households affected by fuel poverty, 2014 Rate of total recorded crime, 2015/16 Anti-social behaviour, 2015/16
Wards were assessed based on how they compared with England for each of the indicators. Wards that performed worse than the England average:
for none of the indicators (low need) for one to three of the indicators (medium need) for four or more indicators (high need)
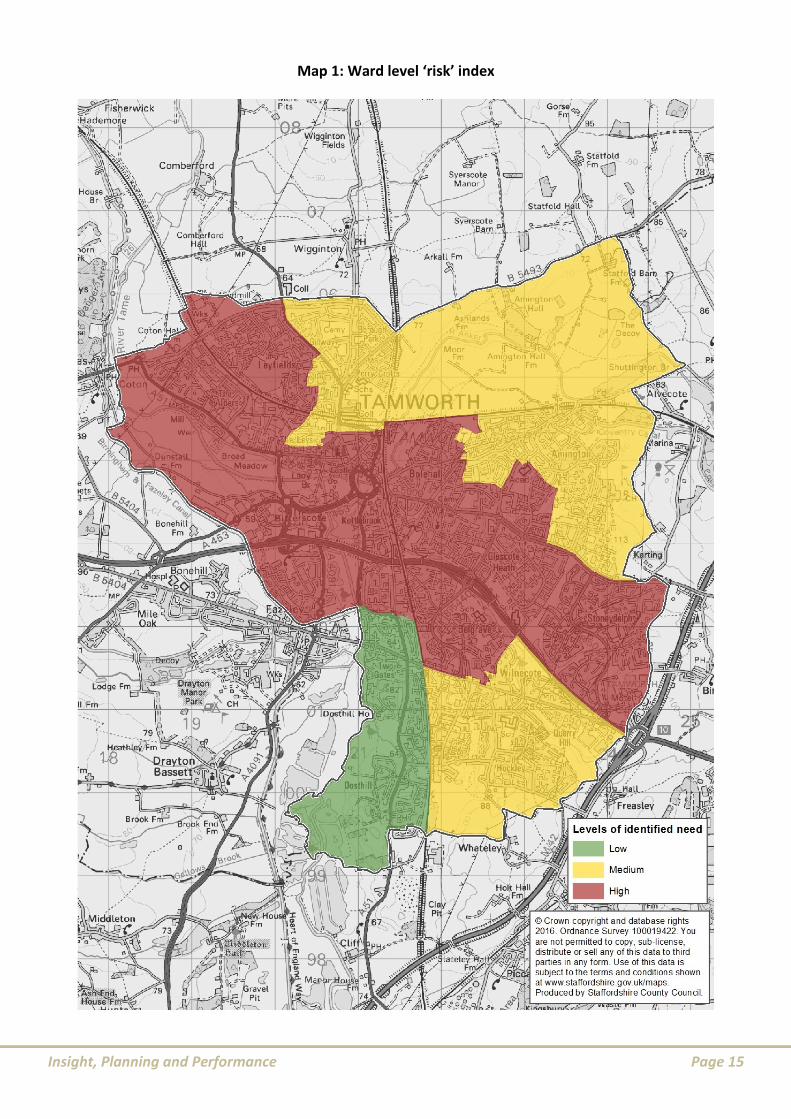
The results are shown in Table 1 and Map 1 shows the location of wards on a map.
Insight, Planning and Performance Page 14
Table 1: Ward level ‘risk’ index
Ward name
Old
er
pe
op
le in
po
vert
y
Fre
e s
ch
oo
l m
eals
GC
SE
att
ain
men
t
Eco
no
mic
str
ess
Ou
t o
f w
ork
ben
efi
ts
Excess w
eig
ht
(Recep
tio
n)
Lo
ng
-term
ad
ult
so
cia
l care
us
ers
Em
erg
en
cy a
dm
issio
ns
Lo
ng
term
lim
itin
g illn
ess
Pre
ven
tab
le m
ort
ali
ty
Lo
ne
pa
ren
t h
ou
seh
old
s
Lo
ne
pen
sio
ne
rs
Fu
el p
ov
ert
y
All
cri
me
An
ti-s
oc
ial b
eh
avio
ur
To
tal
ind
icato
rs p
erf
orm
ing
wo
rse
tha
n E
ng
lan
d
Index
Glascote
9 High
Belgrave
7 High
Castle
7 High
Stonydelph
7 High
Bolehall
6 High
Mercian
6 High
Spital
3 Medium
Amington
2 Medium
Wilnecote
1 Medium
Trinity 0 Low
Compiled by Insight, Planning and Performance Team, Staffordshire County Council
Insight, Planning and Performance Page 15
Map 1: Ward level ‘risk’ index
Insight, Planning and Performance Page 16
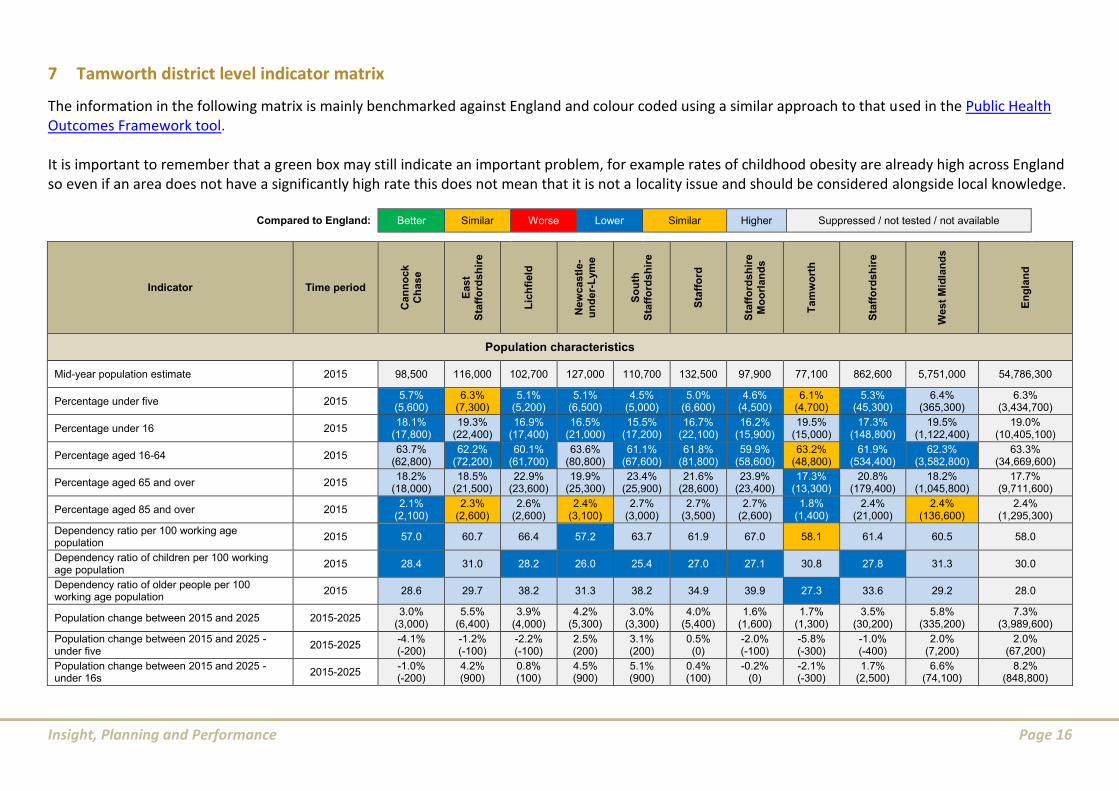
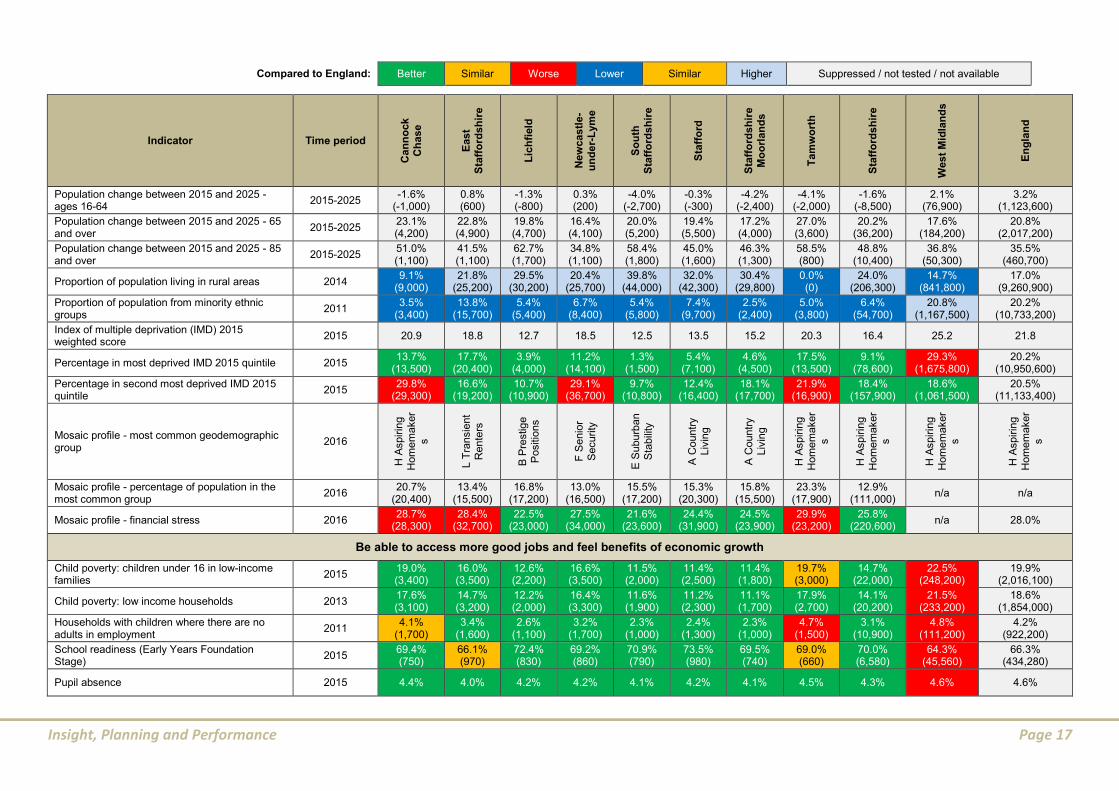
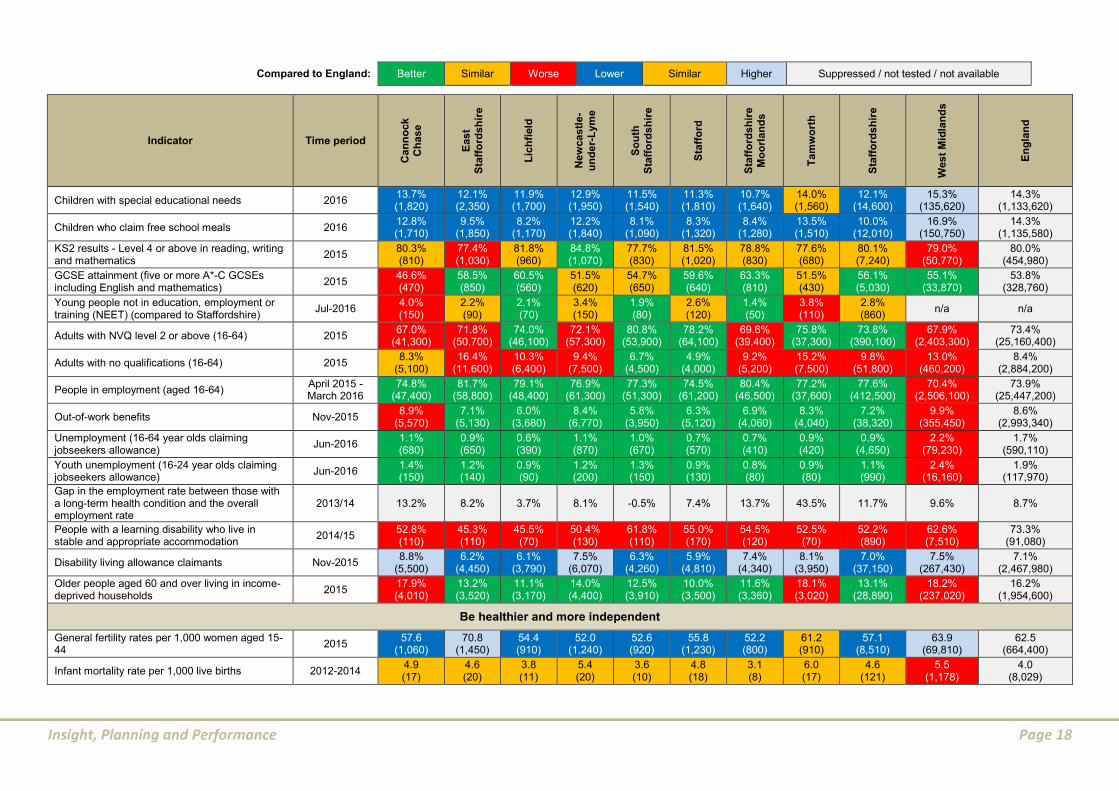
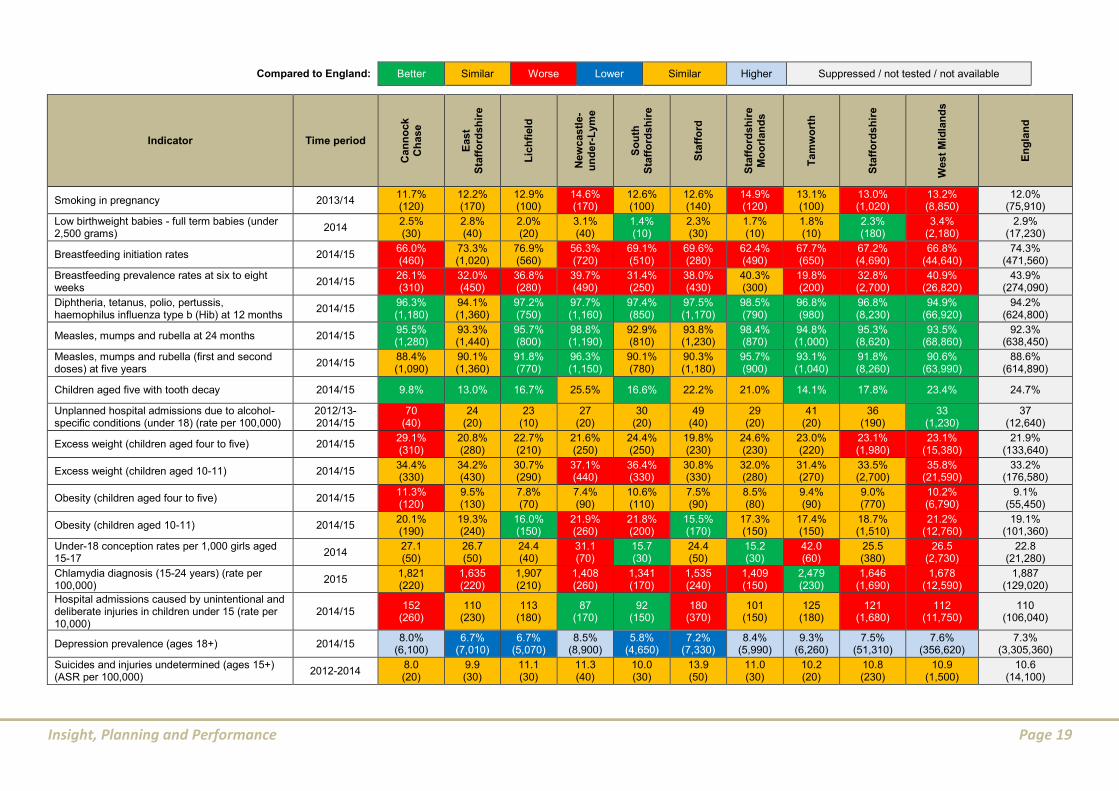
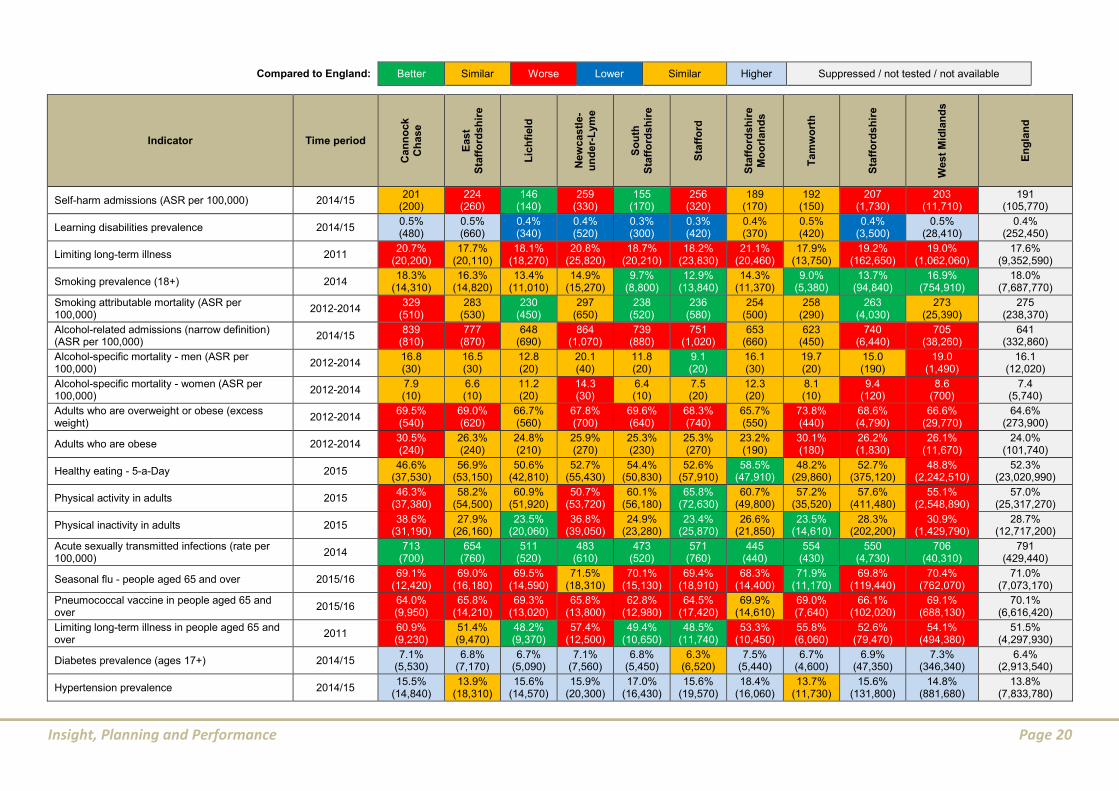
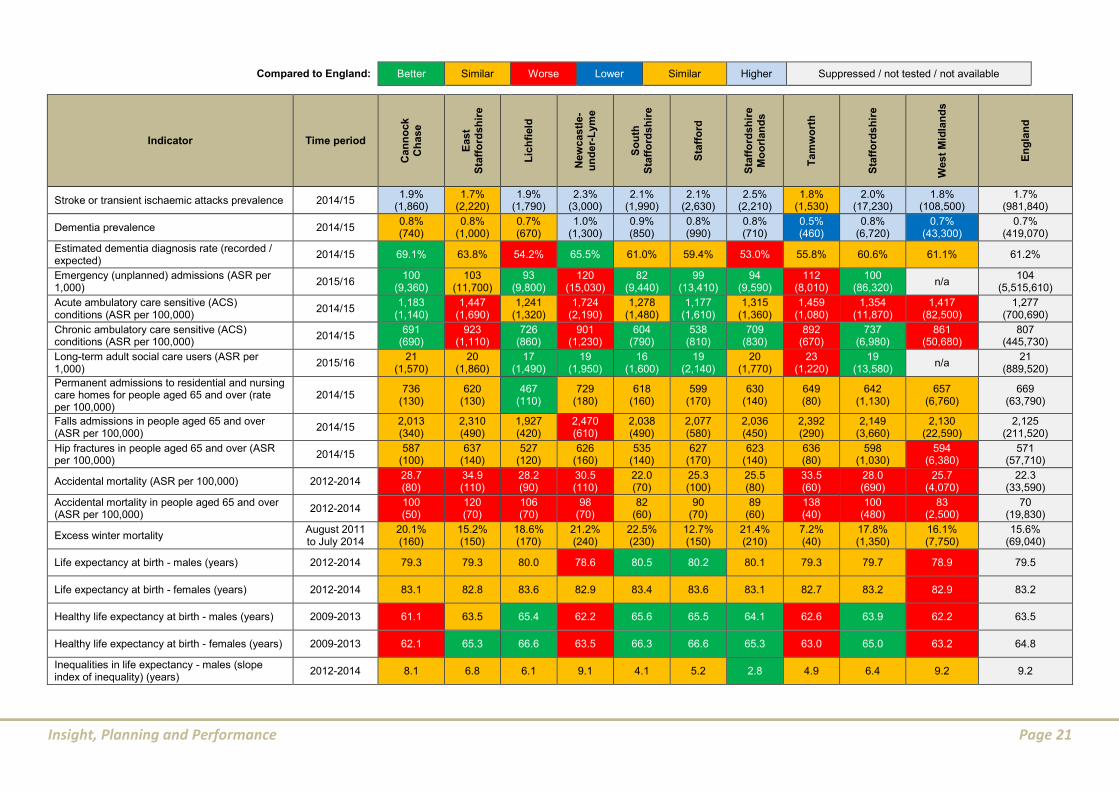
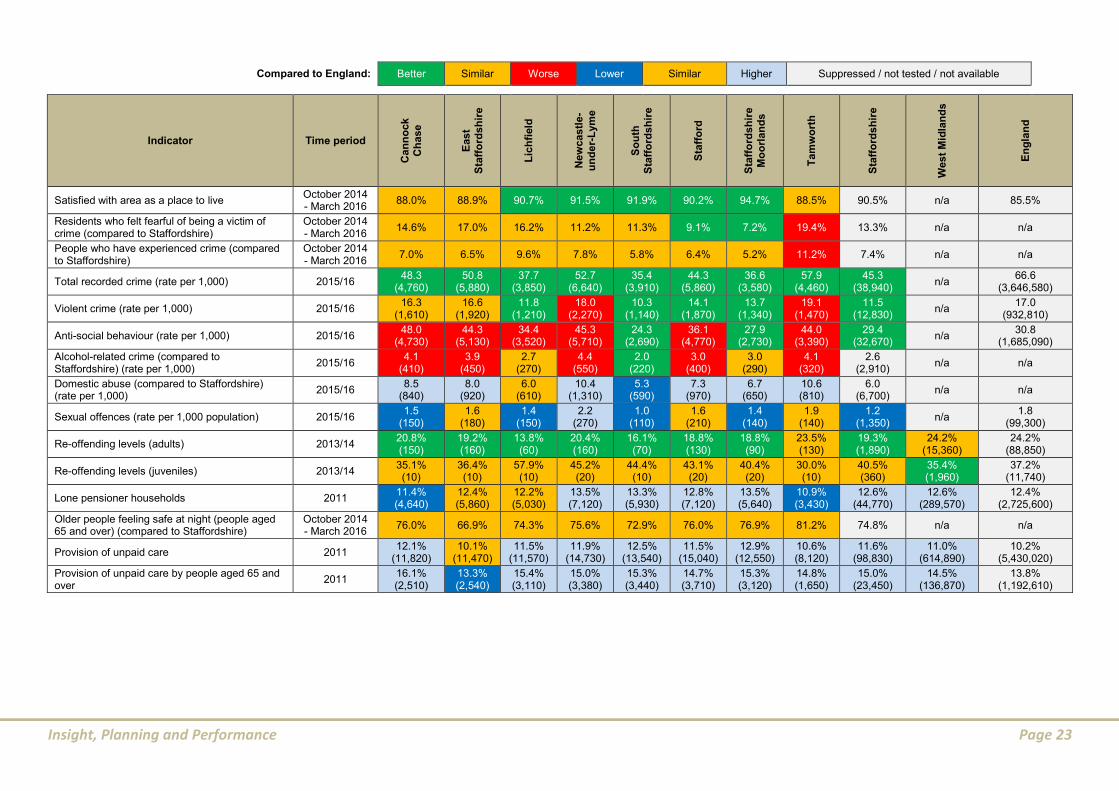
7 Tamworth district level indicator matrix
The information in the following matrix is mainly benchmarked against England and colour coded using a similar approach to that used in the Public Health Outcomes Framework tool. It is important to remember that a green box may still indicate an important problem, for example rates of childhood obesity are already high across England so even if an area does not have a significantly high rate this does not mean that it is not a locality issue and should be considered alongside local knowledge.
Compared to England: Better Similar Worse Lower Similar Higher Suppressed / not tested / not available
Indicator Time period
Can
no
ck
Ch
ase
East
Sta
ffo
rds
hir
e
Lic
hfi
eld
New
castl
e-
un
de
r-L
ym
e
So
uth
Sta
ffo
rds
hir
e
Sta
ffo
rd
Sta
ffo
rds
hir
e
Mo
orl
an
ds
Ta
mw
ort
h
Sta
ffo
rds
hir
e
West
Mid
lan
ds
En
gla
nd
Population characteristics
Mid-year population estimate 2015 98,500 116,000 102,700 127,000 110,700 132,500 97,900 77,100 862,600 5,751,000 54,786,300
Percentage under five 2015 5.7%
(5,600) 6.3%
(7,300) 5.1%
(5,200) 5.1%
(6,500) 4.5%
(5,000) 5.0%
(6,600) 4.6%
(4,500) 6.1%
(4,700) 5.3%
(45,300) 6.4%
(365,300) 6.3%
(3,434,700)
Percentage under 16 2015 18.1%
(17,800) 19.3%
(22,400) 16.9%
(17,400) 16.5%
(21,000) 15.5%
(17,200) 16.7%
(22,100) 16.2%
(15,900) 19.5%
(15,000) 17.3%
(148,800) 19.5%
(1,122,400) 19.0%
(10,405,100)
Percentage aged 16-64 2015 63.7%
(62,800) 62.2%
(72,200) 60.1%
(61,700) 63.6%
(80,800) 61.1%
(67,600) 61.8%
(81,800) 59.9%
(58,600) 63.2%
(48,800) 61.9%
(534,400) 62.3%
(3,582,800) 63.3%
(34,669,600)
Percentage aged 65 and over 2015 18.2%
(18,000) 18.5%
(21,500) 22.9%
(23,600) 19.9%
(25,300) 23.4%
(25,900) 21.6%
(28,600) 23.9%
(23,400) 17.3%
(13,300) 20.8%
(179,400) 18.2%
(1,045,800) 17.7%
(9,711,600)
Percentage aged 85 and over 2015 2.1%
(2,100) 2.3%
(2,600) 2.6%
(2,600) 2.4%
(3,100) 2.7%
(3,000) 2.7%
(3,500) 2.7%
(2,600) 1.8%
(1,400) 2.4%
(21,000) 2.4%
(136,600) 2.4%
(1,295,300)
Dependency ratio per 100 working age population
2015 57.0 60.7 66.4 57.2 63.7 61.9 67.0 58.1 61.4 60.5 58.0
Dependency ratio of children per 100 working age population
2015 28.4 31.0 28.2 26.0 25.4 27.0 27.1 30.8 27.8 31.3 30.0
Dependency ratio of older people per 100 working age population
2015 28.6 29.7 38.2 31.3 38.2 34.9 39.9 27.3 33.6 29.2 28.0
Population change between 2015 and 2025 2015-2025 3.0%
(3,000) 5.5%
(6,400) 3.9%
(4,000) 4.2%
(5,300) 3.0%
(3,300) 4.0%
(5,400) 1.6%
(1,600) 1.7%
(1,300) 3.5%
(30,200) 5.8%
(335,200) 7.3%
(3,989,600)
Population change between 2015 and 2025 - under five
2015-2025 -4.1% (-200)
-1.2% (-100)
-2.2% (-100)
2.5% (200)
3.1% (200)
0.5% (0)
-2.0% (-100)
-5.8% (-300)
-1.0% (-400)
2.0% (7,200)
2.0% (67,200)
Population change between 2015 and 2025 - under 16s
2015-2025 -1.0% (-200)
4.2% (900)
0.8% (100)
4.5% (900)
5.1% (900)
0.4% (100)
-0.2% (0)
-2.1% (-300)
1.7% (2,500)
6.6% (74,100)
8.2% (848,800)
Insight, Planning and Performance Page 17
Compared to England: Better Similar Worse Lower Similar Higher Suppressed / not tested / not available
Indicator Time period
Can
no
ck
Ch
ase
East
Sta
ffo
rds
hir
e
Lic
hfi
eld
New
castl
e-
un
de
r-L
ym
e
So
uth
Sta
ffo
rds
hir
e
Sta
ffo
rd
Sta
ffo
rds
hir
e
Mo
orl
an
ds
Ta
mw
ort
h
Sta
ffo
rds
hir
e
West
Mid
lan
ds
En
gla
nd
Population change between 2015 and 2025 - ages 16-64
2015-2025 -1.6%
(-1,000) 0.8% (600)
-1.3% (-800)
0.3% (200)
-4.0% (-2,700)
-0.3% (-300)
-4.2% (-2,400)
-4.1% (-2,000)
-1.6% (-8,500)
2.1% (76,900)
3.2% (1,123,600)
Population change between 2015 and 2025 - 65 and over
2015-2025 23.1% (4,200)
22.8% (4,900)
19.8% (4,700)
16.4% (4,100)
20.0% (5,200)
19.4% (5,500)
17.2% (4,000)
27.0% (3,600)
20.2% (36,200)
17.6% (184,200)
20.8% (2,017,200)
Population change between 2015 and 2025 - 85 and over
2015-2025 51.0% (1,100)
41.5% (1,100)
62.7% (1,700)
34.8% (1,100)
58.4% (1,800)
45.0% (1,600)
46.3% (1,300)
58.5% (800)
48.8% (10,400)
36.8% (50,300)
35.5% (460,700)
Proportion of population living in rural areas 2014 9.1%
(9,000) 21.8%
(25,200) 29.5%
(30,200) 20.4%
(25,700) 39.8%
(44,000) 32.0%
(42,300) 30.4%
(29,800) 0.0% (0)
24.0% (206,300)
14.7% (841,800)
17.0% (9,260,900)
Proportion of population from minority ethnic groups
2011 3.5%
(3,400) 13.8%
(15,700) 5.4%
(5,400) 6.7%
(8,400) 5.4%
(5,800) 7.4%
(9,700) 2.5%
(2,400) 5.0%
(3,800) 6.4%
(54,700) 20.8%
(1,167,500) 20.2%
(10,733,200)
Index of multiple deprivation (IMD) 2015 weighted score
2015 20.9 18.8 12.7 18.5 12.5 13.5 15.2 20.3 16.4 25.2 21.8
Percentage in most deprived IMD 2015 quintile 2015 13.7%
(13,500) 17.7%
(20,400) 3.9%
(4,000) 11.2%
(14,100) 1.3%
(1,500) 5.4%
(7,100) 4.6%
(4,500) 17.5%
(13,500) 9.1%
(78,600) 29.3%
(1,675,800) 20.2%
(10,950,600)
Percentage in second most deprived IMD 2015 quintile
2015 29.8%
(29,300) 16.6%
(19,200) 10.7%
(10,900) 29.1%
(36,700) 9.7%
(10,800) 12.4%
(16,400) 18.1%
(17,700) 21.9%
(16,900) 18.4%
(157,900) 18.6%
(1,061,500) 20.5%
(11,133,400)
Mosaic profile - most common geodemographic group
2016
H A
spirin
g
Hom
em
aker
s
L T
ransie
nt
Rente
rs
B P
restig
e
Positio
ns
F S
enio
r
Security
E S
uburb
an
Sta
bili
ty
A C
ountr
y
Liv
ing
A C
ountr
y
Liv
ing
H A
spirin
g
Hom
em
aker
s
H A
spirin
g
Hom
em
aker
s
H A
spirin
g
Hom
em
aker
s
H A
spir
ing
Hom
em
aker
s
Mosaic profile - percentage of population in the most common group
2016 20.7%
(20,400) 13.4%
(15,500) 16.8%
(17,200) 13.0%
(16,500) 15.5%
(17,200) 15.3%
(20,300) 15.8%
(15,500) 23.3%
(17,900) 12.9%
(111,000) n/a n/a
Mosaic profile - financial stress 2016 28.7%
(28,300) 28.4%
(32,700) 22.5%
(23,000) 27.5%
(34,000) 21.6%
(23,600) 24.4%
(31,900) 24.5%
(23,900) 29.9%
(23,200) 25.8%
(220,600) n/a 28.0%
Be able to access more good jobs and feel benefits of economic growth
Child poverty: children under 16 in low-income families
2015 19.0% (3,400)
16.0% (3,500)
12.6% (2,200)
16.6% (3,500)
11.5% (2,000)
11.4% (2,500)
11.4% (1,800)
19.7% (3,000)
14.7% (22,000)
22.5% (248,200)
19.9% (2,016,100)
Child poverty: low income households 2013 17.6% (3,100)
14.7% (3,200)
12.2% (2,000)
16.4% (3,300)
11.6% (1,900)
11.2% (2,300)
11.1% (1,700)
17.9% (2,700)
14.1% (20,200)
21.5% (233,200)
18.6% (1,854,000)
Households with children where there are no adults in employment
2011 4.1%
(1,700) 3.4%
(1,600) 2.6%
(1,100) 3.2%
(1,700) 2.3%
(1,000) 2.4%
(1,300) 2.3%
(1,000) 4.7%
(1,500) 3.1%
(10,900) 4.8%
(111,200) 4.2%
(922,200)
School readiness (Early Years Foundation Stage)
2015 69.4% (750)
66.1% (970)
72.4% (830)
69.2% (860)
70.9% (790)
73.5% (980)
69.5% (740)
69.0% (660)
70.0% (6,580)
64.3% (45,560)
66.3% (434,280)
Pupil absence 2015 4.4% 4.0% 4.2% 4.2% 4.1% 4.2% 4.1% 4.5% 4.3% 4.6% 4.6%
Insight, Planning and Performance Page 18
Compared to England: Better Similar Worse Lower Similar Higher Suppressed / not tested / not available
Indicator Time period
Can
no
ck
Ch
ase
East
Sta
ffo
rds
hir
e
Lic
hfi
eld
New
castl
e-
un
de
r-L
ym
e
So
uth
Sta
ffo
rds
hir
e
Sta
ffo
rd
Sta
ffo
rds
hir
e
Mo
orl
an
ds
Ta
mw
ort
h
Sta
ffo
rds
hir
e
West
Mid
lan
ds
En
gla
nd
Children with special educational needs 2016 13.7% (1,820)
12.1% (2,350)
11.9% (1,700)
12.9% (1,950)
11.5% (1,540)
11.3% (1,810)
10.7% (1,640)
14.0% (1,560)
12.1% (14,600)
15.3% (135,620)
14.3% (1,133,620)
Children who claim free school meals 2016 12.8% (1,710)
9.5% (1,850)
8.2% (1,170)
12.2% (1,840)
8.1% (1,090)
8.3% (1,320)
8.4% (1,280)
13.5% (1,510)
10.0% (12,010)
16.9% (150,750)
14.3% (1,135,580)
KS2 results - Level 4 or above in reading, writing and mathematics
2015 80.3% (810)
77.4% (1,030)
81.8% (960)
84.8% (1,070)
77.7% (830)
81.5% (1,020)
78.8% (830)
77.6% (680)
80.1% (7,240)
79.0% (50,770)
80.0% (454,980)
GCSE attainment (five or more A*-C GCSEs including English and mathematics)
2015 46.6% (470)
58.5% (850)
60.5% (560)
51.5% (620)
54.7% (650)
59.6% (640)
63.3% (810)
51.5% (430)
56.1% (5,030)
55.1% (33,870)
53.8% (328,760)
Young people not in education, employment or training (NEET) (compared to Staffordshire)
Jul-2016 4.0% (150)
2.2% (90)
2.1% (70)
3.4% (150)
1.9% (80)
2.6% (120)
1.4% (50)
3.8% (110)
2.8% (860)
n/a n/a
Adults with NVQ level 2 or above (16-64) 2015 67.0%
(41,300) 71.8%
(50,700) 74.0%
(46,100) 72.1%
(57,300) 80.8%
(53,900) 78.2%
(64,100) 69.6%
(39,400) 75.8%
(37,300) 73.8%
(390,100) 67.9%
(2,403,300) 73.4%
(25,160,400)
Adults with no qualifications (16-64) 2015 8.3%
(5,100) 16.4%
(11,600) 10.3% (6,400)
9.4% (7,500)
6.7% (4,500)
4.9% (4,000)
9.2% (5,200)
15.2% (7,500)
9.8% (51,800)
13.0% (460,200)
8.4% (2,884,200)
People in employment (aged 16-64) April 2015 - March 2016
74.8% (47,400)
81.7% (58,800)
79.1% (48,400)
76.9% (61,300)
77.3% (51,300)
74.5% (61,200)
80.4% (46,500)
77.2% (37,600)
77.6% (412,500)
70.4% (2,506,100)
73.9% (25,447,200)
Out-of-work benefits Nov-2015 8.9%
(5,570) 7.1%
(5,130) 6.0%
(3,680) 8.4%
(6,770) 5.8%
(3,950) 6.3%
(5,120) 6.9%
(4,060) 8.3%
(4,040) 7.2%
(38,320) 9.9%
(355,450) 8.6%
(2,993,340)
Unemployment (16-64 year olds claiming jobseekers allowance)
Jun-2016 1.1% (680)
0.9% (650)
0.6% (390)
1.1% (870)
1.0% (670)
0.7% (570)
0.7% (410)
0.9% (420)
0.9% (4,650)
2.2% (79,230)
1.7% (590,110)
Youth unemployment (16-24 year olds claiming jobseekers allowance)
Jun-2016 1.4% (150)
1.2% (140)
0.9% (90)
1.2% (200)
1.3% (150)
0.9% (130)
0.8% (80)
0.9% (80)
1.1% (990)
2.4% (16,160)
1.9% (117,970)
Gap in the employment rate between those with a long-term health condition and the overall employment rate
2013/14 13.2% 8.2% 3.7% 8.1% -0.5% 7.4% 13.7% 43.5% 11.7% 9.6% 8.7%
People with a learning disability who live in stable and appropriate accommodation
2014/15 52.8% (110)
45.3% (110)
45.5% (70)
50.4% (130)
61.8% (110)
55.0% (170)
54.5% (120)
52.5% (70)
52.2% (890)
62.6% (7,510)
73.3% (91,080)
Disability living allowance claimants Nov-2015 8.8%
(5,500) 6.2%
(4,450) 6.1%
(3,790) 7.5%
(6,070) 6.3%
(4,260) 5.9%
(4,810) 7.4%
(4,340) 8.1%
(3,950) 7.0%
(37,150) 7.5%
(267,430) 7.1%
(2,467,980)
Older people aged 60 and over living in income-deprived households
2015 17.9% (4,010)
13.2% (3,520)
11.1% (3,170)
14.0% (4,400)
12.5% (3,910)
10.0% (3,500)
11.6% (3,360)
18.1% (3,020)
13.1% (28,890)
18.2% (237,020)
16.2% (1,954,600)
Be healthier and more independent
General fertility rates per 1,000 women aged 15-44
2015 57.6
(1,060) 70.8
(1,450) 54.4 (910)
52.0 (1,240)
52.6 (920)
55.8 (1,230)
52.2 (800)
61.2 (910)
57.1 (8,510)
63.9 (69,810)
62.5 (664,400)
Infant mortality rate per 1,000 live births 2012-2014 4.9 (17)
4.6 (20)
3.8 (11)
5.4 (20)
3.6 (10)
4.8 (18)
3.1 (8)
6.0 (17)
4.6 (121)
5.5 (1,178)
4.0 (8,029)
Insight, Planning and Performance Page 19
Compared to England: Better Similar Worse Lower Similar Higher Suppressed / not tested / not available
Indicator Time period
Can
no
ck
Ch
ase
East
Sta
ffo
rds
hir
e
Lic
hfi
eld
New
castl
e-
un
de
r-L
ym
e
So
uth
Sta
ffo
rds
hir
e
Sta
ffo
rd
Sta
ffo
rds
hir
e
Mo
orl
an
ds
Ta
mw
ort
h
Sta
ffo
rds
hir
e
West
Mid
lan
ds
En
gla
nd
Smoking in pregnancy 2013/14 11.7% (120)
12.2% (170)
12.9% (100)
14.6% (170)
12.6% (100)
12.6% (140)
14.9% (120)
13.1% (100)
13.0% (1,020)
13.2% (8,850)
12.0% (75,910)
Low birthweight babies - full term babies (under 2,500 grams)
2014 2.5% (30)
2.8% (40)
2.0% (20)
3.1% (40)
1.4% (10)
2.3% (30)
1.7% (10)
1.8% (10)
2.3% (180)
3.4% (2,180)
2.9% (17,230)
Breastfeeding initiation rates 2014/15 66.0% (460)
73.3% (1,020)
76.9% (560)
56.3% (720)
69.1% (510)
69.6% (280)
62.4% (490)
67.7% (650)
67.2% (4,690)
66.8% (44,640)
74.3% (471,560)
Breastfeeding prevalence rates at six to eight weeks
2014/15 26.1% (310)
32.0% (450)
36.8% (280)
39.7% (490)
31.4% (250)
38.0% (430)
40.3% (300)
19.8% (200)
32.8% (2,700)
40.9% (26,820)
43.9% (274,090)
Diphtheria, tetanus, polio, pertussis, haemophilus influenza type b (Hib) at 12 months
2014/15 96.3% (1,180)
94.1% (1,360)
97.2% (750)
97.7% (1,160)
97.4% (850)
97.5% (1,170)
98.5% (790)
96.8% (980)
96.8% (8,230)
94.9% (66,920)
94.2% (624,800)
Measles, mumps and rubella at 24 months 2014/15 95.5% (1,280)
93.3% (1,440)
95.7% (800)
98.8% (1,190)
92.9% (810)
93.8% (1,230)
98.4% (870)
94.8% (1,000)
95.3% (8,620)
93.5% (68,860)
92.3% (638,450)
Measles, mumps and rubella (first and second doses) at five years
2014/15 88.4% (1,090)
90.1% (1,360)
91.8% (770)
96.3% (1,150)
90.1% (780)
90.3% (1,180)
95.7% (900)
93.1% (1,040)
91.8% (8,260)
90.6% (63,990)
88.6% (614,890)
Children aged five with tooth decay 2014/15 9.8% 13.0% 16.7% 25.5% 16.6% 22.2% 21.0% 14.1% 17.8% 23.4% 24.7%
Unplanned hospital admissions due to alcohol-specific conditions (under 18) (rate per 100,000)
2012/13-2014/15
70 (40)
24 (20)
23 (10)
27 (20)
30 (20)
49 (40)
29 (20)
41 (20)
36 (190)
33 (1,230)
37 (12,640)
Excess weight (children aged four to five) 2014/15 29.1% (310)
20.8% (280)
22.7% (210)
21.6% (250)
24.4% (250)
19.8% (230)
24.6% (230)
23.0% (220)
23.1% (1,980)
23.1% (15,380)
21.9% (133,640)
Excess weight (children aged 10-11) 2014/15 34.4% (330)
34.2% (430)
30.7% (290)
37.1% (440)
36.4% (330)
30.8% (330)
32.0% (280)
31.4% (270)
33.5% (2,700)
35.8% (21,590)
33.2% (176,580)
Obesity (children aged four to five) 2014/15 11.3% (120)
9.5% (130)
7.8% (70)
7.4% (90)
10.6% (110)
7.5% (90)
8.5% (80)
9.4% (90)
9.0% (770)
10.2% (6,790)
9.1% (55,450)
Obesity (children aged 10-11) 2014/15 20.1% (190)
19.3% (240)
16.0% (150)
21.9% (260)
21.8% (200)
15.5% (170)
17.3% (150)
17.4% (150)
18.7% (1,510)
21.2% (12,760)
19.1% (101,360)
Under-18 conception rates per 1,000 girls aged 15-17
2014 27.1 (50)
26.7 (50)
24.4 (40)
31.1 (70)
15.7 (30)
24.4 (50)
15.2 (30)
42.0 (60)
25.5 (380)
26.5 (2,730)
22.8 (21,280)
Chlamydia diagnosis (15-24 years) (rate per 100,000)
2015 1,821 (220)
1,635 (220)
1,907 (210)
1,408 (260)
1,341 (170)
1,535 (240)
1,409 (150)
2,479 (230)
1,646 (1,690)
1,678 (12,590)
1,887 (129,020)
Hospital admissions caused by unintentional and deliberate injuries in children under 15 (rate per 10,000)
2014/15 152
(260) 110
(230) 113
(180) 87
(170) 92
(150) 180
(370) 101
(150) 125
(180) 121
(1,680) 112
(11,750) 110
(106,040)
Depression prevalence (ages 18+) 2014/15 8.0%
(6,100) 6.7%
(7,010) 6.7%
(5,070) 8.5%
(8,900) 5.8%
(4,650) 7.2%
(7,330) 8.4%
(5,990) 9.3%
(6,260) 7.5%
(51,310) 7.6%
(356,620) 7.3%
(3,305,360)
Suicides and injuries undetermined (ages 15+) (ASR per 100,000)
2012-2014 8.0 (20)
9.9 (30)
11.1 (30)
11.3 (40)
10.0 (30)
13.9 (50)
11.0 (30)
10.2 (20)
10.8 (230)
10.9 (1,500)
10.6 (14,100)
Insight, Planning and Performance Page 20
Compared to England: Better Similar Worse Lower Similar Higher Suppressed / not tested / not available
Indicator Time period
Can
no
ck
Ch
ase
East
Sta
ffo
rds
hir
e
Lic
hfi
eld
New
castl
e-
un
de
r-L
ym
e
So
uth
Sta
ffo
rds
hir
e
Sta
ffo
rd
Sta
ffo
rds
hir
e
Mo
orl
an
ds
Ta
mw
ort
h
Sta
ffo
rds
hir
e
West
Mid
lan
ds
En
gla
nd
Self-harm admissions (ASR per 100,000) 2014/15 201
(200) 224
(260) 146
(140) 259
(330) 155
(170) 256
(320) 189
(170) 192
(150) 207
(1,730) 203
(11,710) 191
(105,770)
Learning disabilities prevalence 2014/15 0.5% (480)
0.5% (660)
0.4% (340)
0.4% (520)
0.3% (300)
0.3% (420)
0.4% (370)
0.5% (420)
0.4% (3,500)
0.5% (28,410)
0.4% (252,450)
Limiting long-term illness 2011 20.7%
(20,200) 17.7%
(20,110) 18.1%
(18,270) 20.8%
(25,820) 18.7%
(20,210) 18.2%
(23,830) 21.1%
(20,460) 17.9%
(13,750) 19.2%
(162,650) 19.0%
(1,062,060) 17.6%
(9,352,590)
Smoking prevalence (18+) 2014 18.3%
(14,310) 16.3%
(14,820) 13.4%
(11,010) 14.9%
(15,270) 9.7%
(8,800) 12.9%
(13,840) 14.3%
(11,370) 9.0%
(5,380) 13.7%
(94,840) 16.9%
(754,910) 18.0%
(7,687,770)
Smoking attributable mortality (ASR per 100,000)
2012-2014 329
(510) 283
(530) 230
(450) 297
(650) 238
(520) 236
(580) 254
(500) 258
(290) 263
(4,030) 273
(25,390) 275
(238,370)
Alcohol-related admissions (narrow definition) (ASR per 100,000)
2014/15 839
(810) 777
(870) 648
(690) 864
(1,070) 739
(880) 751
(1,020) 653
(660) 623
(450) 740
(6,440) 705
(38,260) 641
(332,860)
Alcohol-specific mortality - men (ASR per 100,000)
2012-2014 16.8 (30)
16.5 (30)
12.8 (20)
20.1 (40)
11.8 (20)
9.1 (20)
16.1 (30)
19.7 (20)
15.0 (190)
19.0 (1,490)
16.1 (12,020)
Alcohol-specific mortality - women (ASR per 100,000)
2012-2014 7.9 (10)
6.6 (10)
11.2 (20)
14.3 (30)
6.4 (10)
7.5 (20)
12.3 (20)
8.1 (10)
9.4 (120)
8.6 (700)
7.4 (5,740)
Adults who are overweight or obese (excess weight)
2012-2014 69.5% (540)
69.0% (620)
66.7% (560)
67.8% (700)
69.6% (640)
68.3% (740)
65.7% (550)
73.8% (440)
68.6% (4,790)
66.6% (29,770)
64.6% (273,900)
Adults who are obese 2012-2014 30.5% (240)
26.3% (240)
24.8% (210)
25.9% (270)
25.3% (230)
25.3% (270)
23.2% (190)
30.1% (180)
26.2% (1,830)
26.1% (11,670)
24.0% (101,740)
Healthy eating - 5-a-Day 2015 46.6%
(37,530) 56.9%
(53,150) 50.6%
(42,810) 52.7%
(55,430) 54.4%
(50,830) 52.6%
(57,910) 58.5%
(47,910) 48.2%
(29,860) 52.7%
(375,120) 48.8%
(2,242,510) 52.3%
(23,020,990)
Physical activity in adults 2015 46.3%
(37,380) 58.2%
(54,500) 60.9%
(51,920) 50.7%
(53,720) 60.1%
(56,180) 65.8%
(72,630) 60.7%
(49,800) 57.2%
(35,520) 57.6%
(411,480) 55.1%
(2,548,890) 57.0%
(25,317,270)
Physical inactivity in adults 2015 38.6%
(31,190) 27.9%
(26,160) 23.5%
(20,060) 36.8%
(39,050) 24.9%
(23,280) 23.4%
(25,870) 26.6%
(21,850) 23.5%
(14,610) 28.3%
(202,200) 30.9%
(1,429,790) 28.7%
(12,717,200)
Acute sexually transmitted infections (rate per 100,000)
2014 713
(700) 654
(760) 511
(520) 483
(610) 473
(520) 571
(760) 445
(440) 554
(430) 550
(4,730) 706
(40,310) 791
(429,440)
Seasonal flu - people aged 65 and over 2015/16 69.1%
(12,420) 69.0%
(16,180) 69.5%
(14,590) 71.5%
(18,310) 70.1%
(15,130) 69.4%
(18,910) 68.3%
(14,400) 71.9%
(11,170) 69.8%
(119,440) 70.4%
(762,070) 71.0%
(7,073,170)
Pneumococcal vaccine in people aged 65 and over
2015/16 64.0% (9,950)
65.8% (14,210)
69.3% (13,020)
65.8% (13,800)
62.8% (12,980)
64.5% (17,420)
69.9% (14,610)
69.0% (7,640)
66.1% (102,020)
69.1% (688,130)
70.1% (6,616,420)
Limiting long-term illness in people aged 65 and over
2011 60.9% (9,230)
51.4% (9,470)
48.2% (9,370)
57.4% (12,500)
49.4% (10,650)
48.5% (11,740)
53.3% (10,450)
55.8% (6,060)
52.6% (79,470)
54.1% (494,380)
51.5% (4,297,930)
Diabetes prevalence (ages 17+) 2014/15 7.1%
(5,530) 6.8%
(7,170) 6.7%
(5,090) 7.1%
(7,560) 6.8%
(5,450) 6.3%
(6,520) 7.5%
(5,440) 6.7%
(4,600) 6.9%
(47,350) 7.3%
(346,340) 6.4%
(2,913,540)
Hypertension prevalence 2014/15 15.5%
(14,840) 13.9%
(18,310) 15.6%
(14,570) 15.9%
(20,300) 17.0%
(16,430) 15.6%
(19,570) 18.4%
(16,060) 13.7%
(11,730) 15.6%
(131,800) 14.8%
(881,680) 13.8%
(7,833,780)
Insight, Planning and Performance Page 21
Compared to England: Better Similar Worse Lower Similar Higher Suppressed / not tested / not available
Indicator Time period
Can
no
ck
Ch
ase
East
Sta
ffo
rds
hir
e
Lic
hfi
eld
New
castl
e-
un
de
r-L
ym
e
So
uth
Sta
ffo
rds
hir
e
Sta
ffo
rd
Sta
ffo
rds
hir
e
Mo
orl
an
ds
Ta
mw
ort
h
Sta
ffo
rds
hir
e
West
Mid
lan
ds
En
gla
nd
Stroke or transient ischaemic attacks prevalence 2014/15 1.9%
(1,860) 1.7%
(2,220) 1.9%
(1,790) 2.3%
(3,000) 2.1%
(1,990) 2.1%
(2,630) 2.5%
(2,210) 1.8%
(1,530) 2.0%
(17,230) 1.8%
(108,500) 1.7%
(981,840)
Dementia prevalence 2014/15 0.8% (740)
0.8% (1,000)
0.7% (670)
1.0% (1,300)
0.9% (850)
0.8% (990)
0.8% (710)
0.5% (460)
0.8% (6,720)
0.7% (43,300)
0.7% (419,070)
Estimated dementia diagnosis rate (recorded / expected)
2014/15 69.1% 63.8% 54.2% 65.5% 61.0% 59.4% 53.0% 55.8% 60.6% 61.1% 61.2%
Emergency (unplanned) admissions (ASR per 1,000)
2015/16 100
(9,360) 103
(11,700) 93
(9,800) 120
(15,030) 82
(9,440) 99
(13,410) 94
(9,590) 112
(8,010) 100
(86,320) n/a
104 (5,515,610)
Acute ambulatory care sensitive (ACS) conditions (ASR per 100,000)
2014/15 1,183
(1,140) 1,447
(1,690) 1,241
(1,320) 1,724
(2,190) 1,278
(1,480) 1,177
(1,610) 1,315
(1,360) 1,459
(1,080) 1,354
(11,870) 1,417
(82,500) 1,277
(700,690)
Chronic ambulatory care sensitive (ACS) conditions (ASR per 100,000)
2014/15 691
(690) 923
(1,110) 726
(860) 901
(1,230) 604
(790) 538
(810) 709
(830) 892
(670) 737
(6,980) 861
(50,680) 807
(445,730)
Long-term adult social care users (ASR per 1,000)
2015/16 21
(1,570) 20
(1,860) 17
(1,490) 19
(1,950) 16
(1,600) 19
(2,140) 20
(1,770) 23
(1,220) 19
(13,580) n/a
21 (889,520)
Permanent admissions to residential and nursing care homes for people aged 65 and over (rate per 100,000)
2014/15 736
(130) 620
(130) 467
(110) 729
(180) 618
(160) 599
(170) 630
(140) 649 (80)
642 (1,130)
657 (6,760)
669 (63,790)
Falls admissions in people aged 65 and over (ASR per 100,000)
2014/15 2,013 (340)
2,310 (490)
1,927 (420)
2,470 (610)
2,038 (490)
2,077 (580)
2,036 (450)
2,392 (290)
2,149 (3,660)
2,130 (22,590)
2,125 (211,520)
Hip fractures in people aged 65 and over (ASR per 100,000)
2014/15 587
(100) 637
(140) 527
(120) 626
(160) 535
(140) 627
(170) 623
(140) 636 (80)
598 (1,030)
594 (6,380)
571 (57,710)
Accidental mortality (ASR per 100,000) 2012-2014 28.7 (80)
34.9 (110)
28.2 (90)
30.5 (110)
22.0 (70)
25.3 (100)
25.5 (80)
33.5 (60)
28.0 (690)
25.7 (4,070)
22.3 (33,590)
Accidental mortality in people aged 65 and over (ASR per 100,000)
2012-2014 100 (50)
120 (70)
106 (70)
98 (70)
82 (60)
90 (70)
89 (60)
138 (40)
100 (480)
83 (2,500)
70 (19,830)
Excess winter mortality August 2011 to July 2014
20.1% (160)
15.2% (150)
18.6% (170)
21.2% (240)
22.5% (230)
12.7% (150)
21.4% (210)
7.2% (40)
17.8% (1,350)
16.1% (7,750)
15.6% (69,040)
Life expectancy at birth - males (years) 2012-2014 79.3 79.3 80.0 78.6 80.5 80.2 80.1 79.3 79.7 78.9 79.5
Life expectancy at birth - females (years) 2012-2014 83.1 82.8 83.6 82.9 83.4 83.6 83.1 82.7 83.2 82.9 83.2
Healthy life expectancy at birth - males (years) 2009-2013 61.1 63.5 65.4 62.2 65.6 65.5 64.1 62.6 63.9 62.2 63.5
Healthy life expectancy at birth - females (years) 2009-2013 62.1 65.3 66.6 63.5 66.3 66.6 65.3 63.0 65.0 63.2 64.8
Inequalities in life expectancy - males (slope index of inequality) (years)
2012-2014 8.1 6.8 6.1 9.1 4.1 5.2 2.8 4.9 6.4 9.2 9.2

Insight, Planning and Performance Page 22
Compared to England: Better Similar Worse Lower Similar Higher Suppressed / not tested / not available
Indicator Time period
Can
no
ck
Ch
ase
East
Sta
ffo
rds
hir
e
Lic
hfi
eld
New
castl
e-
un
de
r-L
ym
e
So
uth
Sta
ffo
rds
hir
e
Sta
ffo
rd
Sta
ffo
rds
hir
e
Mo
orl
an
ds
Ta
mw
ort
h
Sta
ffo
rds
hir
e
West
Mid
lan
ds
En
gla
nd
Inequalities in life expectancy - females (slope index of inequality) (years)
2012-2014 3.1 7.1 8.8 8.6 6.2 7.9 3.7 7.4 6.4 6.9 7.0
Mortality from causes considered preventable (various ages) (ASR per 100,000)
2012-2014 195
(540) 191
(620) 165
(560) 200
(740) 158
(580) 159
(660) 163
(540) 195
(410) 176
(4,640) 193
(30,190) 183
(267,250)
Under 75 mortality rate from cancer (ASR per 100,000)
2012-2014 140
(360) 146
(440) 118
(380) 136
(460) 138
(470) 125
(470) 127
(390) 145
(280) 133
(3,250) 146
(20,690) 142
(186,420)
Under 75 mortality rate from all cardiovascular diseases (ASR per 100,000)
2012-2014 96
(240) 71
(210) 66
(210) 80
(270) 59
(200) 65
(240) 65
(200) 75
(150) 71
(1,710) 80
(11,220) 76
(99,240)
Under 75 mortality rate from respiratory disease (ASR per 100,000)
2012-2014 29.8 (80)
26.7 (80)
22.8 (70)
39.1 (130)
22.5 (80)
23.6 (90)
30.3 (90)
28.3 (50)
27.7 (670)
34.0 (4,760)
32.6 (42,180)
Under 75 mortality rate from liver disease (ASR per 100,000)
2012-2014 16.9 (40)
14.1 (40)
15.4 (50)
19.7 (70)
15.9 (50)
12.4 (50)
16.7 (50)
18.0 (40)
16.0 (390)
19.2 (2,770)
17.8 (24,190)
Mortality from communicable diseases (ASR per 100,000)
2012-2014 54.7 (130)
55.7 (170)
54.8 (170)
79.0 (270)
51.6 (180)
61.4 (250)
71.4 (220)
64.1 (100)
61.9 (1,500)
62.6 (9,630)
63.2 (91,400)
End of life: proportion dying at home or usual place of residence
2014/15 45.7% (390)
46.4% (470)
46.0% (450)
36.8% (430)
41.8% (450)
45.9% (600)
43.0% (450)
39.3% (240)
43.2% (3,480)
43.3% (22,190)
45.6% (214,410)
Feel safer, happier and more supported
Lone parent households 2011 10.1% (4,100)
9.7% (4,600)
8.2% (3,400)
9.6% (5,000)
8.3% (3,700)
8.4% (4,700)
8.4% (3,500)
11.6% (3,700)
9.2% (32,600)
11.3% (258,700)
10.6% (2,339,800)
Owner occupied households 2011 69.7%
(28,350) 70.1%
(33,140) 76.2%
(31,400) 69.5%
(36,560) 76.3%
(33,920) 72.1%
(40,160) 80.0%
(33,420) 68.7%
(21,730) 72.8%
(258,670) 65.6%
(1,504,320) 64.1%
(14,148,780)
Privately rented households 2011 12.1% (4,940)
15.1% (7,150)
9.5% (3,930)
10.5% (5,510)
8.5% (3,770)
12.9% (7,210)
9.8% (4,100)
11.0% (3,480)
11.3% (40,090)
14.0% (321,670)
16.8% (3,715,920)
Socially rented households 2011 16.9% (6,880)
13.5% (6,370)
13.2% (5,450)
18.7% (9,840)
13.9% (6,190)
13.7% (7,620)
8.9% (3,700)
19.3% (6,110)
14.7% (52,150)
19.0% (435,170)
17.7% (3,903,550)
Households with no central heating 2011 1.6% (650)
3.9% (1,860)
1.6% (670)
1.8% (960)
1.9% (820)
1.9% (1,060)
2.4% (990)
1.9% (590)
2.1% (7,600)
2.9% (67,170)
2.7% (594,560)
Overcrowded households 2011 3.0%
(1,220) 3.1%
(1,480) 2.4% (980)
2.7% (1,390)
2.2% (960)
1.9% (1,080)
1.9% (800)
2.7% (850)
2.5% (8,750)
4.5% (102,550)
4.6% (1,024,470)
Fuel poverty 2014 9.1%
(3,730) 12.3% (5,880)
9.5% (3,940)
11.3% (5,990)
9.2% (4,150)
11.0% (6,210)
11.5% (4,860)
9.3% (2,970)
10.5% (37,730)
12.1% (279,670)
10.6% (2,379,360)
Housing affordability ratio (ratio of lower quartile house price to lower quartile earnings)
2015 5.6 5.7 7.1 5.2 6.5 6.7 5.5 6.8 6.1 n/a 6.5
Statutory homelessness - homelessness acceptances per 1,000 households
2015/16 0.5 (20)
2.3 (120)
1.6 (70)
0.2 (10)
1.1 (50)
0.9 (50)
1.7 (70)
2.1 (70)
1.2 (450)
3.5 (8,190)
2.5 (57,750)
Access to private transport - households with no cars or vans
2011 20.2% (8,210)
21.4% (10,120)
13.6% (5,590)
22.1% (11,630)
13.2% (5,880)
17.5% (9,740)
14.8% (6,200)
20.6% (6,510)
18.0% (63,890)
24.7% (566,620)
25.8% (5,691,250)
Insight, Planning and Performance Page 23
Compared to England: Better Similar Worse Lower Similar Higher Suppressed / not tested / not available
Indicator Time period
Can
no
ck
Ch
ase
East
Sta
ffo
rds
hir
e
Lic
hfi
eld
New
castl
e-
un
de
r-L
ym
e
So
uth
Sta
ffo
rds
hir
e
Sta
ffo
rd
Sta
ffo
rds
hir
e
Mo
orl
an
ds
Ta
mw
ort
h
Sta
ffo
rds
hir
e
West
Mid
lan
ds
En
gla
nd
Satisfied with area as a place to live October 2014 - March 2016
88.0% 88.9% 90.7% 91.5% 91.9% 90.2% 94.7% 88.5% 90.5% n/a 85.5%
Residents who felt fearful of being a victim of crime (compared to Staffordshire)
October 2014 - March 2016
14.6% 17.0% 16.2% 11.2% 11.3% 9.1% 7.2% 19.4% 13.3% n/a n/a
People who have experienced crime (compared to Staffordshire)
October 2014 - March 2016
7.0% 6.5% 9.6% 7.8% 5.8% 6.4% 5.2% 11.2% 7.4% n/a n/a
Total recorded crime (rate per 1,000) 2015/16 48.3
(4,760) 50.8
(5,880) 37.7
(3,850) 52.7
(6,640) 35.4
(3,910) 44.3
(5,860) 36.6
(3,580) 57.9
(4,460) 45.3
(38,940) n/a
66.6 (3,646,580)
Violent crime (rate per 1,000) 2015/16 16.3
(1,610) 16.6
(1,920) 11.8
(1,210) 18.0
(2,270) 10.3
(1,140) 14.1
(1,870) 13.7
(1,340) 19.1
(1,470) 11.5
(12,830) n/a
17.0 (932,810)
Anti-social behaviour (rate per 1,000) 2015/16 48.0
(4,730) 44.3
(5,130) 34.4
(3,520) 45.3
(5,710) 24.3
(2,690) 36.1
(4,770) 27.9
(2,730) 44.0
(3,390) 29.4
(32,670) n/a
30.8 (1,685,090)
Alcohol-related crime (compared to Staffordshire) (rate per 1,000)
2015/16 4.1
(410) 3.9
(450) 2.7
(270) 4.4
(550) 2.0
(220) 3.0
(400) 3.0
(290) 4.1
(320) 2.6
(2,910) n/a n/a
Domestic abuse (compared to Staffordshire) (rate per 1,000)
2015/16 8.5
(840) 8.0
(920) 6.0
(610) 10.4
(1,310) 5.3
(590) 7.3
(970) 6.7
(650) 10.6 (810)
6.0 (6,700)
n/a n/a
Sexual offences (rate per 1,000 population) 2015/16 1.5
(150) 1.6
(180) 1.4
(150) 2.2
(270) 1.0
(110) 1.6
(210) 1.4
(140) 1.9
(140) 1.2
(1,350) n/a
1.8 (99,300)
Re-offending levels (adults) 2013/14 20.8% (150)
19.2% (160)
13.8% (60)
20.4% (160)
16.1% (70)
18.8% (130)
18.8% (90)
23.5% (130)
19.3% (1,890)
24.2% (15,360)
24.2% (88,850)
Re-offending levels (juveniles) 2013/14 35.1% (10)
36.4% (10)
57.9% (10)
45.2% (20)
44.4% (10)
43.1% (20)
40.4% (20)
30.0% (10)
40.5% (360)
35.4% (1,960)
37.2% (11,740)
Lone pensioner households 2011 11.4% (4,640)
12.4% (5,860)
12.2% (5,030)
13.5% (7,120)
13.3% (5,930)
12.8% (7,120)
13.5% (5,640)
10.9% (3,430)
12.6% (44,770)
12.6% (289,570)
12.4% (2,725,600)
Older people feeling safe at night (people aged 65 and over) (compared to Staffordshire)
October 2014 - March 2016
76.0% 66.9% 74.3% 75.6% 72.9% 76.0% 76.9% 81.2% 74.8% n/a n/a
Provision of unpaid care 2011 12.1%
(11,820) 10.1%
(11,470) 11.5%
(11,570) 11.9%
(14,730) 12.5%
(13,540) 11.5%
(15,040) 12.9%
(12,550) 10.6% (8,120)
11.6% (98,830)
11.0% (614,890)
10.2% (5,430,020)
Provision of unpaid care by people aged 65 and over
2011 16.1% (2,510)
13.3% (2,540)
15.4% (3,110)
15.0% (3,380)
15.3% (3,440)
14.7% (3,710)
15.3% (3,120)
14.8% (1,650)
15.0% (23,450)
14.5% (136,870)
13.8% (1,192,610)
Insight, Planning and Performance Page 24
8 How do we perform compared to our statistical neighbours?
Making comparisons with areas that have similar characteristics is a helpful way to understand our population better and helps identify potential areas of improvement for our residents. The Chartered Institute of Public Finance and Accountancy (CIPFA) Nearest Neighbours Model assesses the similarity between authorities, taking a number of variables into account. We have compared key measures against the CIPFA neighbours in this section to give us better information about how we compare and where we need to improve. As well as making a statistical comparison with the CIPFA Neighbour group we also look at how we also look at how we rank within the group. The following is a list of the other districts in Tamworth’s CIPFA Neighbour group.
1. Ashfield
2. Cannock Chase
3. Chesterfield
4. East Staffordshire
5. Erewash
6. Gloucester
7. Gravesham
8. Kettering
9. Mansfield
10. Newcastle-under-Lyme
11. Nuneaton and Bedworth
12. Redditch
13. Rossendale
14. Wellingborough
15. Worcester
Insight, Planning and Performance Page 25
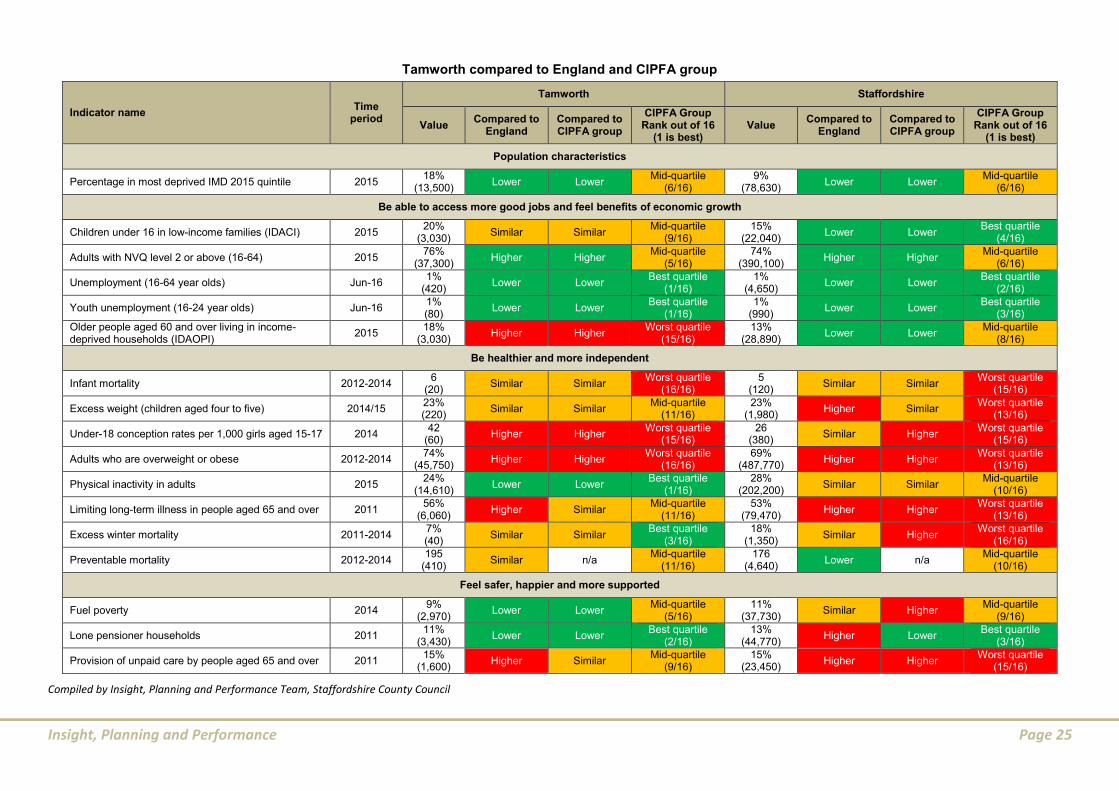
Tamworth compared to England and CIPFA group
Indicator name Time
period
Tamworth Staffordshire
Value Compared to
England Compared to CIPFA group
CIPFA Group Rank out of 16
(1 is best) Value
Compared to England
Compared to CIPFA group
CIPFA Group Rank out of 16
(1 is best)
Population characteristics
Percentage in most deprived IMD 2015 quintile 2015 18%
(13,500) Lower Lower
Mid-quartile (6/16)
9% (78,630)
Lower Lower Mid-quartile
(6/16)
Be able to access more good jobs and feel benefits of economic growth
Children under 16 in low-income families (IDACI) 2015 20%
(3,030) Similar Similar
Mid-quartile (9/16)
15% (22,040)
Lower Lower Best quartile
(4/16)
Adults with NVQ level 2 or above (16-64) 2015 76%
(37,300) Higher Higher
Mid-quartile (5/16)
74% (390,100)
Higher Higher Mid-quartile
(6/16)
Unemployment (16-64 year olds) Jun-16 1%
(420) Lower Lower
Best quartile (1/16)
1% (4,650)
Lower Lower Best quartile
(2/16)
Youth unemployment (16-24 year olds) Jun-16 1% (80)
Lower Lower Best quartile
(1/16) 1%
(990) Lower Lower
Best quartile (3/16)
Older people aged 60 and over living in income-deprived households (IDAOPI)
2015 18%
(3,030) Higher Higher
Worst quartile (15/16)
13% (28,890)
Lower Lower Mid-quartile
(8/16)
Be healthier and more independent
Infant mortality 2012-2014 6
(20) Similar Similar
Worst quartile (16/16)
5 (120)
Similar Similar Worst quartile
(15/16)
Excess weight (children aged four to five) 2014/15 23% (220)
Similar Similar Mid-quartile
(11/16) 23%
(1,980) Higher Similar
Worst quartile (13/16)
Under-18 conception rates per 1,000 girls aged 15-17 2014 42
(60) Higher Higher
Worst quartile (15/16)
26 (380)
Similar Higher Worst quartile
(15/16)
Adults who are overweight or obese 2012-2014 74%
(45,750) Higher Higher
Worst quartile (16/16)
69% (487,770)
Higher Higher Worst quartile
(13/16)
Physical inactivity in adults 2015 24%
(14,610) Lower Lower
Best quartile (1/16)
28% (202,200)
Similar Similar Mid-quartile
(10/16)
Limiting long-term illness in people aged 65 and over 2011 56%
(6,060) Higher Similar
Mid-quartile (11/16)
53% (79,470)
Higher Higher Worst quartile
(13/16)
Excess winter mortality 2011-2014 7% (40)
Similar Similar Best quartile
(3/16) 18%
(1,350) Similar Higher
Worst quartile (16/16)
Preventable mortality 2012-2014 195
(410) Similar n/a
Mid-quartile (11/16)
176 (4,640)
Lower n/a Mid-quartile
(10/16)
Feel safer, happier and more supported
Fuel poverty 2014 9%
(2,970) Lower Lower
Mid-quartile (5/16)
11% (37,730)
Similar Higher Mid-quartile
(9/16)
Lone pensioner households 2011 11%
(3,430) Lower Lower
Best quartile (2/16)
13% (44,770)
Higher Lower Best quartile
(3/16)
Provision of unpaid care by people aged 65 and over 2011 15%
(1,600) Higher Similar
Mid-quartile (9/16)
15% (23,450)
Higher Higher Worst quartile
(15/16)
Compiled by Insight, Planning and Performance Team, Staffordshire County Council
Insight, Planning and Performance Page 26
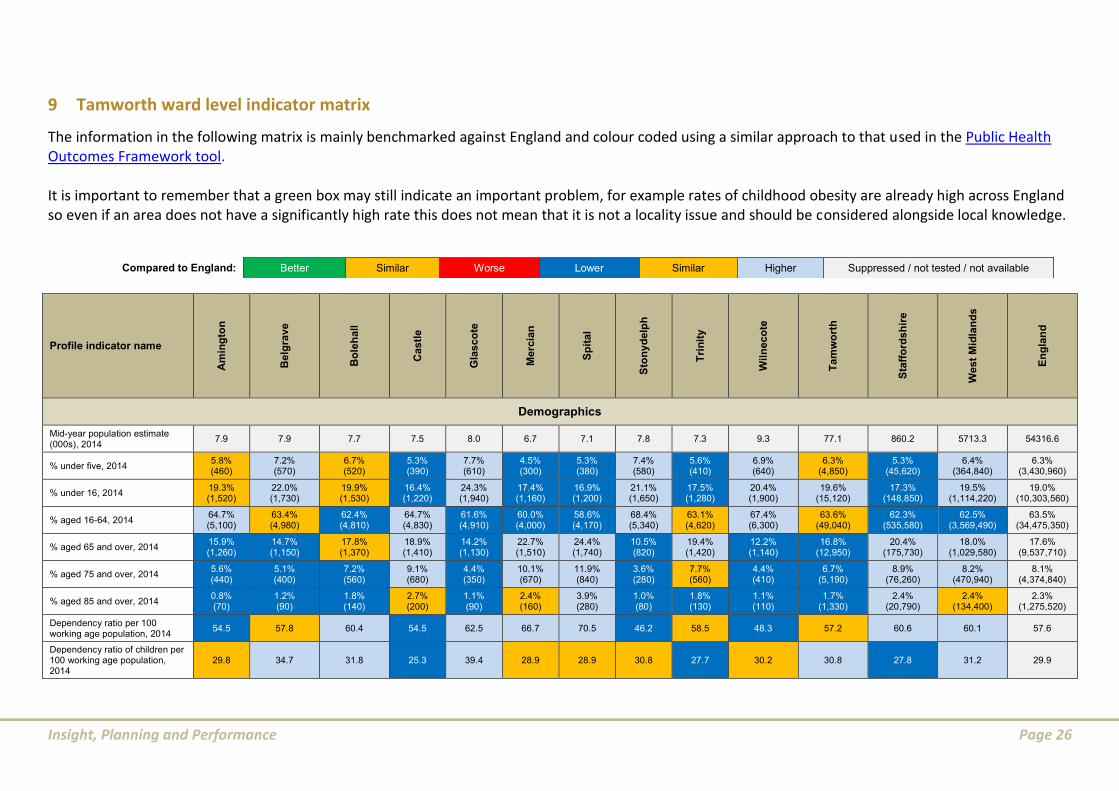
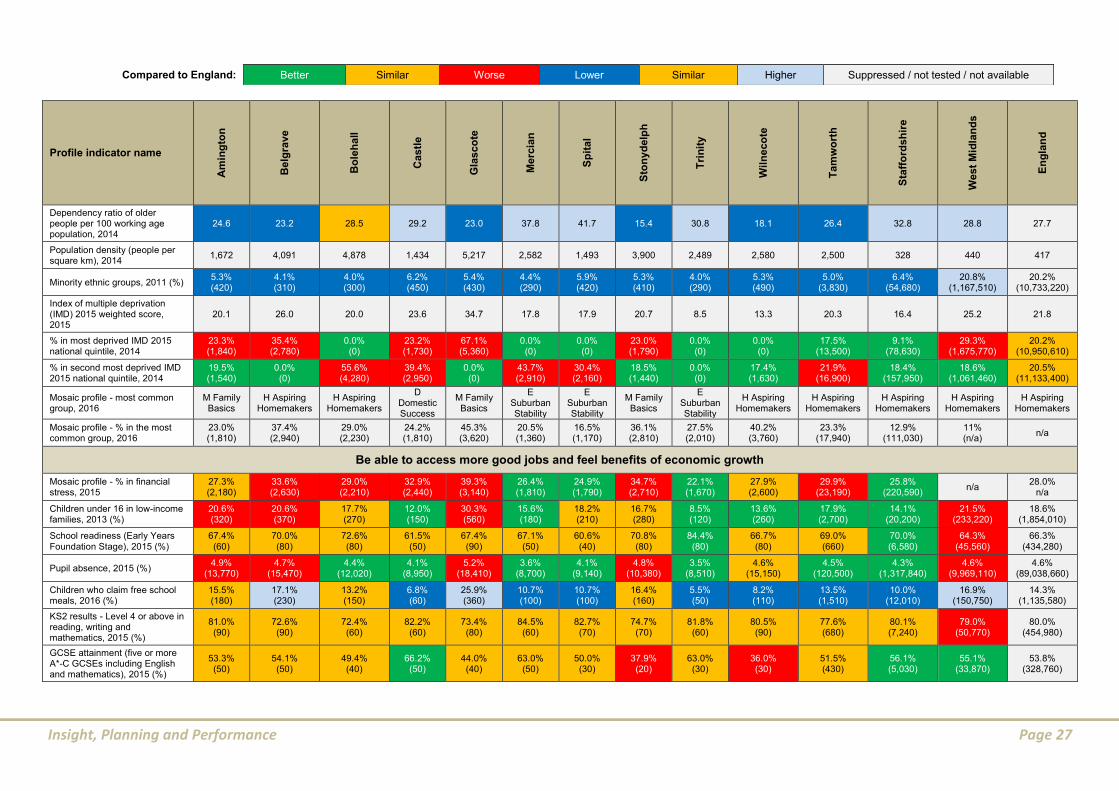
9 Tamworth ward level indicator matrix
The information in the following matrix is mainly benchmarked against England and colour coded using a similar approach to that used in the Public Health Outcomes Framework tool. It is important to remember that a green box may still indicate an important problem, for example rates of childhood obesity are already high across England so even if an area does not have a significantly high rate this does not mean that it is not a locality issue and should be considered alongside local knowledge.
Compared to England: Better Similar Worse Lower Similar Higher Suppressed / not tested / not available
Profile indicator name
Am
ing
ton
Belg
rave
Bo
leh
all
Castl
e
Gla
sco
te
Me
rcia
n
Sp
ital
Sto
ny
delp
h
Tri
nit
y
Wil
ne
co
te
Ta
mw
ort
h
Sta
ffo
rds
hir
e
West
Mid
lan
ds
En
gla
nd
Demographics
Mid-year population estimate (000s), 2014
7.9 7.9 7.7 7.5 8.0 6.7 7.1 7.8 7.3 9.3 77.1 860.2 5713.3 54316.6
% under five, 2014 5.8% (460)
7.2% (570)
6.7% (520)
5.3% (390)
7.7% (610)
4.5% (300)
5.3% (380)
7.4% (580)
5.6% (410)
6.9% (640)
6.3% (4,850)
5.3% (45,620)
6.4% (364,840)
6.3% (3,430,960)
% under 16, 2014 19.3% (1,520)
22.0% (1,730)
19.9% (1,530)
16.4% (1,220)
24.3% (1,940)
17.4% (1,160)
16.9% (1,200)
21.1% (1,650)
17.5% (1,280)
20.4% (1,900)
19.6% (15,120)
17.3% (148,850)
19.5% (1,114,220)
19.0% (10,303,560)
% aged 16-64, 2014 64.7% (5,100)
63.4% (4,980)
62.4% (4,810)
64.7% (4,830)
61.6% (4,910)
60.0% (4,000)
58.6% (4,170)
68.4% (5,340)
63.1% (4,620)
67.4% (6,300)
63.6% (49,040)
62.3% (535,580)
62.5% (3,569,490)
63.5% (34,475,350)
% aged 65 and over, 2014 15.9% (1,260)
14.7% (1,150)
17.8% (1,370)
18.9% (1,410)
14.2% (1,130)
22.7% (1,510)
24.4% (1,740)
10.5% (820)
19.4% (1,420)
12.2% (1,140)
16.8% (12,950)
20.4% (175,730)
18.0% (1,029,580)
17.6% (9,537,710)
% aged 75 and over, 2014 5.6% (440)
5.1% (400)
7.2% (560)
9.1% (680)
4.4% (350)
10.1% (670)
11.9% (840)
3.6% (280)
7.7% (560)
4.4% (410)
6.7% (5,190)
8.9% (76,260)
8.2% (470,940)
8.1% (4,374,840)
% aged 85 and over, 2014 0.8% (70)
1.2% (90)
1.8% (140)
2.7% (200)
1.1% (90)
2.4% (160)
3.9% (280)
1.0% (80)
1.8% (130)
1.1% (110)
1.7% (1,330)
2.4% (20,790)
2.4% (134,400)
2.3% (1,275,520)
Dependency ratio per 100 working age population, 2014
54.5 57.8 60.4 54.5 62.5 66.7 70.5 46.2 58.5 48.3 57.2 60.6 60.1 57.6
Dependency ratio of children per 100 working age population, 2014
29.8 34.7 31.8 25.3 39.4 28.9 28.9 30.8 27.7 30.2 30.8 27.8 31.2 29.9
Insight, Planning and Performance Page 27
Compared to England: Better Similar Worse Lower Similar Higher Suppressed / not tested / not available
Profile indicator name
Am
ing
ton
Belg
rave
Bo
leh
all
Castl
e
Gla
sco
te
Me
rcia
n
Sp
ital
Sto
ny
delp
h
Tri
nit
y
Wil
ne
co
te
Ta
mw
ort
h
Sta
ffo
rds
hir
e
West
Mid
lan
ds
En
gla
nd
Dependency ratio of older people per 100 working age population, 2014
24.6 23.2 28.5 29.2 23.0 37.8 41.7 15.4 30.8 18.1 26.4 32.8 28.8 27.7
Population density (people per square km), 2014
1,672 4,091 4,878 1,434 5,217 2,582 1,493 3,900 2,489 2,580 2,500 328 440 417
Minority ethnic groups, 2011 (%) 5.3% (420)
4.1% (310)
4.0% (300)
6.2% (450)
5.4% (430)
4.4% (290)
5.9% (420)
5.3% (410)
4.0% (290)
5.3% (490)
5.0% (3,830)
6.4% (54,680)
20.8% (1,167,510)
20.2% (10,733,220)
Index of multiple deprivation (IMD) 2015 weighted score, 2015
20.1 26.0 20.0 23.6 34.7 17.8 17.9 20.7 8.5 13.3 20.3 16.4 25.2 21.8
% in most deprived IMD 2015 national quintile, 2014
23.3% (1,840)
35.4% (2,780)
0.0% (0)
23.2% (1,730)
67.1% (5,360)
0.0% (0)
0.0% (0)
23.0% (1,790)
0.0% (0)
0.0% (0)
17.5% (13,500)
9.1% (78,630)
29.3% (1,675,770)
20.2% (10,950,610)
% in second most deprived IMD 2015 national quintile, 2014
19.5% (1,540)
0.0% (0)
55.6% (4,280)
39.4% (2,950)
0.0% (0)
43.7% (2,910)
30.4% (2,160)
18.5% (1,440)
0.0% (0)
17.4% (1,630)
21.9% (16,900)
18.4% (157,950)
18.6% (1,061,460)
20.5% (11,133,400)
Mosaic profile - most common group, 2016
M Family Basics
H Aspiring Homemakers
H Aspiring Homemakers
D Domestic Success
M Family Basics
E Suburban Stability
E Suburban Stability
M Family Basics
E Suburban Stability
H Aspiring Homemakers
H Aspiring Homemakers
H Aspiring Homemakers
H Aspiring Homemakers
H Aspiring Homemakers
Mosaic profile - % in the most common group, 2016
23.0% (1,810)
37.4% (2,940)
29.0% (2,230)
24.2% (1,810)
45.3% (3,620)
20.5% (1,360)
16.5% (1,170)
36.1% (2,810)
27.5% (2,010)
40.2% (3,760)
23.3% (17,940)
12.9% (111,030)
11% (n/a)
n/a
Be able to access more good jobs and feel benefits of economic growth
Mosaic profile - % in financial stress, 2015
27.3% (2,180)
33.6% (2,630)
29.0% (2,210)
32.9% (2,440)
39.3% (3,140)
26.4% (1,810)
24.9% (1,790)
34.7% (2,710)
22.1% (1,670)
27.9% (2,600)
29.9% (23,190)
25.8% (220,590)
n/a 28.0%
n/a
Children under 16 in low-income families, 2013 (%)
20.6% (320)
20.6% (370)
17.7% (270)
12.0% (150)
30.3% (560)
15.6% (180)
18.2% (210)
16.7% (280)
8.5% (120)
13.6% (260)
17.9% (2,700)
14.1% (20,200)
21.5% (233,220)
18.6% (1,854,010)
School readiness (Early Years Foundation Stage), 2015 (%)
67.4% (60)
70.0% (80)
72.6% (80)
61.5% (50)
67.4% (90)
67.1% (50)
60.6% (40)
70.8% (80)
84.4% (80)
66.7% (80)
69.0% (660)
70.0% (6,580)
64.3% (45,560)
66.3% (434,280)
Pupil absence, 2015 (%) 4.9%
(13,770) 4.7%
(15,470) 4.4%
(12,020) 4.1%
(8,950) 5.2%
(18,410) 3.6%
(8,700) 4.1%
(9,140) 4.8%
(10,380) 3.5%
(8,510) 4.6%
(15,150) 4.5%
(120,500) 4.3%
(1,317,840) 4.6%
(9,969,110) 4.6%
(89,038,660)
Children who claim free school meals, 2016 (%)
15.5% (180)
17.1% (230)
13.2% (150)
6.8% (60)
25.9% (360)
10.7% (100)
10.7% (100)
16.4% (160)
5.5% (50)
8.2% (110)
13.5% (1,510)
10.0% (12,010)
16.9% (150,750)
14.3% (1,135,580)
KS2 results - Level 4 or above in reading, writing and mathematics, 2015 (%)
81.0% (90)
72.6% (90)
72.4% (60)
82.2% (60)
73.4% (80)
84.5% (60)
82.7% (70)
74.7% (70)
81.8% (60)
80.5% (90)
77.6% (680)
80.1% (7,240)
79.0% (50,770)
80.0% (454,980)
GCSE attainment (five or more A*-C GCSEs including English and mathematics), 2015 (%)
53.3% (50)
54.1% (50)
49.4% (40)
66.2% (50)
44.0% (40)
63.0% (50)
50.0% (30)
37.9% (20)
63.0% (30)
36.0% (30)
51.5% (430)
56.1% (5,030)
55.1% (33,870)
53.8% (328,760)
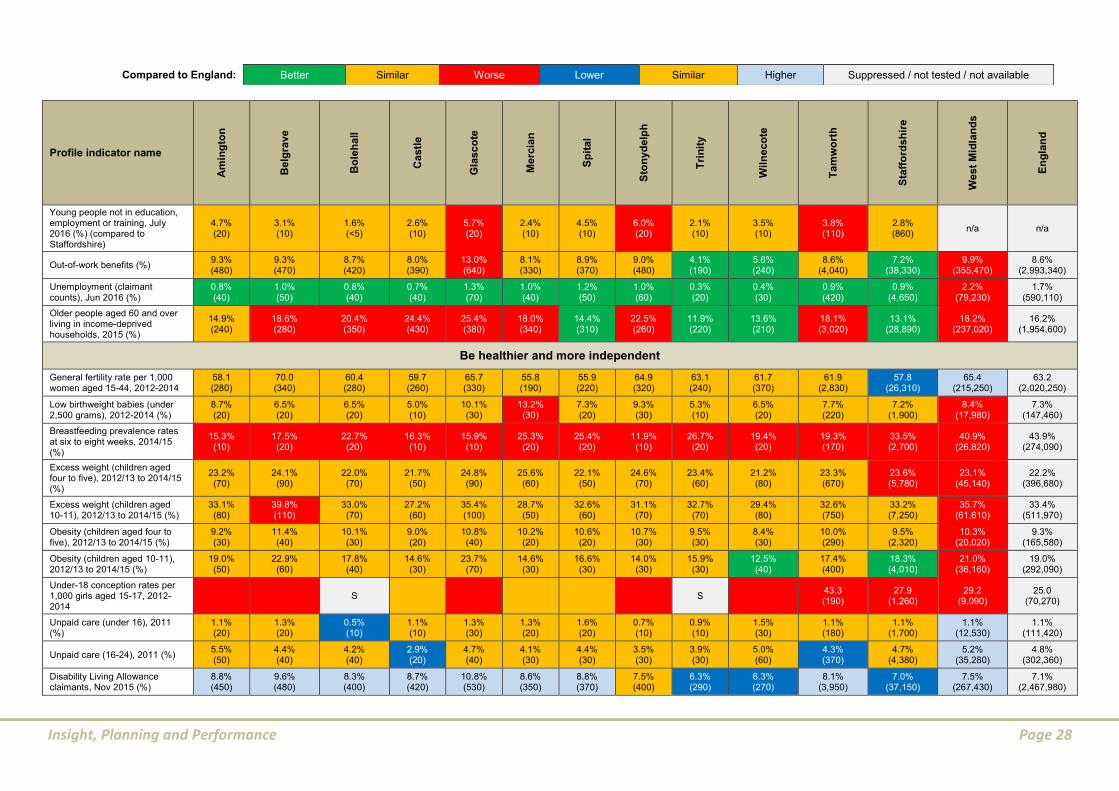
Insight, Planning and Performance Page 28
Compared to England: Better Similar Worse Lower Similar Higher Suppressed / not tested / not available
Profile indicator name
Am
ing
ton
Belg
rave
Bo
leh
all
Castl
e
Gla
sco
te
Me
rcia
n
Sp
ital
Sto
ny
delp
h
Tri
nit
y
Wil
ne
co
te
Ta
mw
ort
h
Sta
ffo
rds
hir
e
West
Mid
lan
ds
En
gla
nd
Young people not in education, employment or training, July 2016 (%) (compared to Staffordshire)
4.7% (20)
3.1% (10)
1.6% (<5)
2.6% (10)
5.7% (20)
2.4% (10)
4.5% (10)
6.0% (20)
2.1% (10)
3.5% (10)
3.8% (110)
2.8% (860)
n/a n/a
Out-of-work benefits (%) 9.3% (480)
9.3% (470)
8.7% (420)
8.0% (390)
13.0% (640)
8.1% (330)
8.9% (370)
9.0% (480)
4.1% (190)
5.6% (240)
8.6% (4,040)
7.2% (38,330)
9.9% (355,470)
8.6% (2,993,340)
Unemployment (claimant counts), Jun 2016 (%)
0.8% (40)
1.0% (50)
0.8% (40)
0.7% (40)
1.3% (70)
1.0% (40)
1.2% (50)
1.0% (60)
0.3% (20)
0.4% (30)
0.9% (420)
0.9% (4,650)
2.2% (79,230)
1.7% (590,110)
Older people aged 60 and over living in income-deprived households, 2015 (%)
14.9% (240)
18.6% (280)
20.4% (350)
24.4% (430)
25.4% (380)
18.0% (340)
14.4% (310)
22.5% (260)
11.9% (220)
13.6% (210)
18.1% (3,020)
13.1% (28,890)
18.2% (237,020)
16.2% (1,954,600)
Be healthier and more independent
General fertility rate per 1,000 women aged 15-44, 2012-2014
58.1 (280)
70.0 (340)
60.4 (280)
59.7 (260)
65.7 (330)
55.8 (190)
55.9 (220)
64.9 (320)
63.1 (240)
61.7 (370)
61.9 (2,830)
57.8 (26,310)
65.4 (215,250)
63.2 (2,020,250)
Low birthweight babies (under 2,500 grams), 2012-2014 (%)
8.7% (20)
6.5% (20)
6.5% (20)
5.0% (10)
10.1% (30)
13.2% (30)
7.3% (20)
9.3% (30)
5.3% (10)
6.5% (20)
7.7% (220)
7.2% (1,900)
8.4% (17,980)
7.3% (147,460)
Breastfeeding prevalence rates at six to eight weeks, 2014/15 (%)
15.3% (10)
17.5% (20)
22.7% (20)
16.3% (10)
15.9% (10)
25.3% (20)
25.4% (20)
11.9% (10)
26.7% (20)
19.4% (20)
19.3% (170)
33.5% (2,700)
40.9% (26,820)
43.9% (274,090)
Excess weight (children aged four to five), 2012/13 to 2014/15 (%)
23.2% (70)
24.1% (90)
22.0% (70)
21.7% (50)
24.8% (90)
25.6% (60)
22.1% (50)
24.6% (70)
23.4% (60)
21.2% (80)
23.3% (670)
23.6% (5,780)
23.1% (45,140)
22.2% (396,680)
Excess weight (children aged 10-11), 2012/13 to 2014/15 (%)
33.1% (80)
39.8% (110)
33.0% (70)
27.2% (60)
35.4% (100)
28.7% (50)
32.6% (60)
31.1% (70)
32.7% (70)
29.4% (80)
32.6% (750)
33.2% (7,250)
35.7% (61,610)
33.4% (511,970)
Obesity (children aged four to five), 2012/13 to 2014/15 (%)
9.2% (30)
11.4% (40)
10.1% (30)
9.0% (20)
10.8% (40)
10.2% (20)
10.6% (20)
10.7% (30)
9.5% (30)
8.4% (30)
10.0% (290)
9.5% (2,320)
10.3% (20,020)
9.3% (165,580)
Obesity (children aged 10-11), 2012/13 to 2014/15 (%)
19.0% (50)
22.9% (60)
17.8% (40)
14.6% (30)
23.7% (70)
14.6% (30)
16.6% (30)
14.0% (30)
15.9% (30)
12.5% (40)
17.4% (400)
18.3% (4,010)
21.0% (36,160)
19.0% (292,090)
Under-18 conception rates per 1,000 girls aged 15-17, 2012-2014
S S
43.3 (190)
27.9 (1,260)
29.2 (9,090)
25.0 (70,270)
Unpaid care (under 16), 2011 (%)
1.1% (20)
1.3% (20)
0.5% (10)
1.1% (10)
1.3% (30)
1.3% (20)
1.6% (20)
0.7% (10)
0.9% (10)
1.5% (30)
1.1% (180)
1.1% (1,700)
1.1% (12,530)
1.1% (111,420)
Unpaid care (16-24), 2011 (%) 5.5% (50)
4.4% (40)
4.2% (40)
2.9% (20)
4.7% (40)
4.1% (30)
4.4% (30)
3.5% (30)
3.9% (30)
5.0% (60)
4.3% (370)
4.7% (4,380)
5.2% (35,280)
4.8% (302,360)
Disability Living Allowance claimants, Nov 2015 (%)
8.8% (450)
9.6% (480)
8.3% (400)
8.7% (420)
10.8% (530)
8.6% (350)
8.8% (370)
7.5% (400)
6.3% (290)
6.3% (270)
8.1% (3,950)
7.0% (37,150)
7.5% (267,430)
7.1% (2,467,980)

Insight, Planning and Performance Page 29
Compared to England: Better Similar Worse Lower Similar Higher Suppressed / not tested / not available
Profile indicator name
Am
ing
ton
Belg
rave
Bo
leh
all
Castl
e
Gla
sco
te
Me
rcia
n
Sp
ital
Sto
ny
delp
h
Tri
nit
y
Wil
ne
co
te
Ta
mw
ort
h
Sta
ffo
rds
hir
e
West
Mid
lan
ds
En
gla
nd
Limiting long-term illness, 2011 (%)
17.6% (1,390)
17.5% (1,340)
18.9% (1,420)
19.5% (1,430)
19.0% (1,520)
21.6% (1,430)
22.1% (1,570)
14.8% (1,160)
15.6% (1,150)
14.1% (1,320)
17.9% (13,750)
19.2% (162,650)
19.0% (1,062,060)
17.6% (9,352,590)
Fuel poverty, 2014 (%) 8.6% (270)
11.3% (340)
10.0% (330)
9.1% (320)
11.6% (360)
9.1% (260)
11.1% (350)
7.4% (230)
7.0% (210)
7.9% (290)
9.3% (2,970)
10.5% (37,730)
12.1% (279,670)
10.6% (2,379,360)
Limiting long-term illness in people aged 65 and over, 2011 (%)
51.9% (540)
56.2% (490)
55.8% (690)
61.7% (780)
55.0% (480)
57.0% (750)
53.2% (800)
58.9% (370)
51.6% (610)
57.9% (550)
55.8% (6,060)
52.6% (79,470)
54.1% (494,380)
51.5% (4,297,930)
Excess winter mortality, Aug 2010-July 2015 (%)
7.6% (10)
0% (0)
0% (0)
0% (0)
8.8% (10)
3.6% (<5)
10.1% (20)
39.5% (20)
23.5% (20)
33.8% (20)
6.7% (60)
18.7% (2,380)
18.7% (15,070)
18.3% (134,460)
Life expectancy at birth - males (years), 2010-2014
80.7 78.8 78.4 78.2 80.0 79.1 78.6 78.2 81.5 80.8 79.3 79.6 78.8 79.4
Life expectancy at birth - females (years), 2010-2014
83.8 79.9 85.9 84.6 84.6 82.7 79.6 82.7 87.3 83.6 82.8 83.1 82.8 83.1
Mortality from causes considered preventable (various ages) (ASR per 100,000), 2010-2014
185 (70)
135 (40)
205 (70)
227 (80)
257 (80)
200 (70)
168 (60)
265 (70)
154 (60)
178 (60)
193 (660)
176 (7,600)
193 (30,190)
183 (267,250)
Under 75 mortality rate from cancer (ASR per 100,000), 2010-2014
144 (50)
134 (40)
124 (40)
183 (60)
172 (50)
140 (50)
134 (50)
184 (50)
131 (50)
154 (50)
147 (470)
137 (5,470)
148 (34,320)
144 (310,350)
Under 75 mortality rate from all cardiovascular diseases (ASR per 100,000), 2010-2014
62 (20)
84 (30)
75 (20)
76 (20)
98 (30)
49 (20)
79 (30)
92 (30)
68 (20)
61 (20)
74 (240)
73 (2,880)
83 (19,250)
79 (170,500)
Under 75 mortality rate from respiratory disease (ASR per 100,000), 2010-2014
33.3 (10)
18.8 (10)
35.2 (10)
26.6 (10)
46.3 (10)
31.8 (10)
23.6 (10)
41.9 (10)
20.5 (10)
15.4 (10)
28.8 (90)
27.7 (1,100)
34.3 (7,890)
33.0 (69,950)
Under 75 mortality rate from liver disease (ASR per 100,000), 2010-2014
27.4 (10)
20.5 (10)
18.2 (10)
8.7 (<5)
19.3 (10)
20.3 (10)
30.7 (10)
30.2 (10)
3.1 (<5)
4.7 (<5)
17.7 (60)
16.2 (640)
19.2 (2,770)
17.8 (24,190)
Mortality from communicable diseases (ASR per 100,000), 2010-2014
59.5 (10)
75.6 (20)
50.2 (20)
68.7 (20)
37.2 (10)
61.7 (20)
67.1 (30)
36.0 (10)
44.2 (10)
44.8 (10)
56.0 (150)
56.0 (2,270)
58.6 (15,080)
59.7 (144,520)
Emergency (unplanned) admissions (ASR per 1,000), 2015/16
120 (800)
124 (830)
114 (840)
108 (830)
129 (890)
119 (830)
102 (820)
127 (790)
88 (620)
99 (760)
112 (8,010)
100 (86,320)
n/a 104
(5,515,610)
Adult social care - long term care (ASR per 1,000), 2015/16
22 (100)
32 (140)
21 (110)
25 (160)
20 (90)
27 (150)
29 (210)
24 (90)
15 (80)
17 (80)
23 (1,220)
19 (13,580)
n/a (88,860)
21 (889,520)
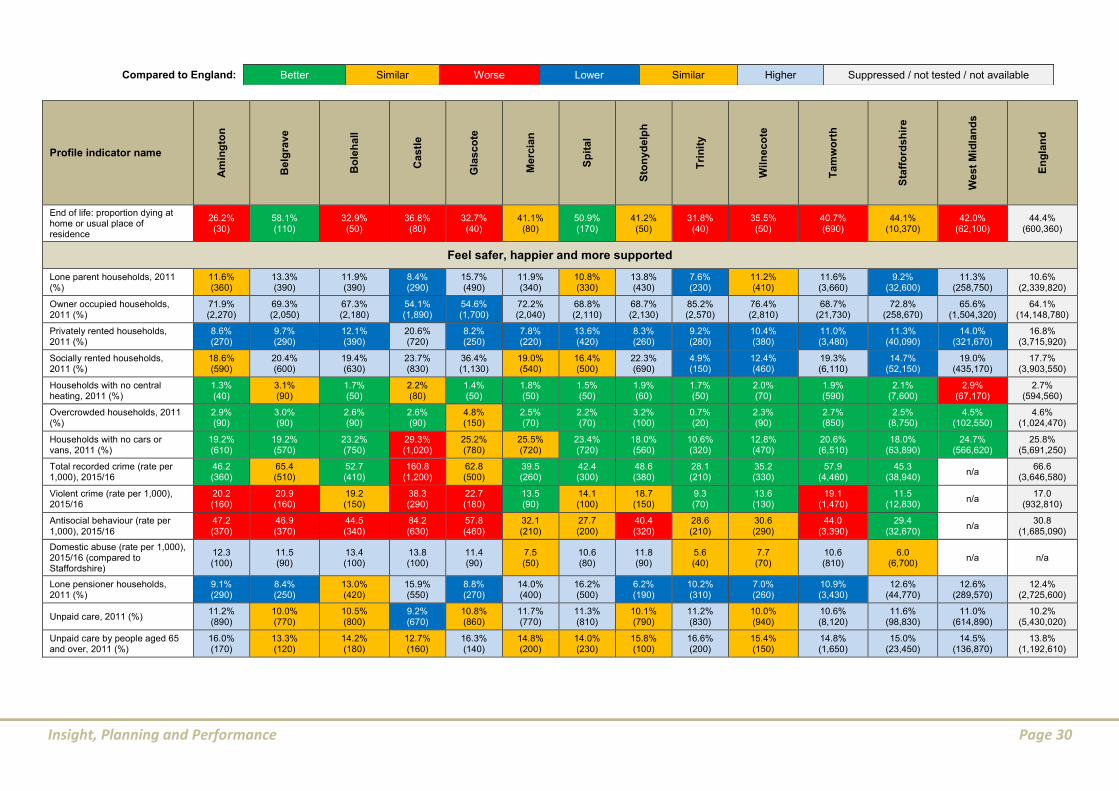
Insight, Planning and Performance Page 30
Compared to England: Better Similar Worse Lower Similar Higher Suppressed / not tested / not available
Profile indicator name
Am
ing
ton
Belg
rave
Bo
leh
all
Castl
e
Gla
sco
te
Me
rcia
n
Sp
ital
Sto
ny
delp
h
Tri
nit
y
Wil
ne
co
te
Ta
mw
ort
h
Sta
ffo
rds
hir
e
West
Mid
lan
ds
En
gla
nd
End of life: proportion dying at home or usual place of residence
26.2% (30)
58.1% (110)
32.9% (50)
36.8% (80)
32.7% (40)
41.1% (80)
50.9% (170)
41.2% (50)
31.8% (40)
35.5% (50)
40.7% (690)
44.1% (10,370)
42.0% (62,100)
44.4% (600,360)
Feel safer, happier and more supported
Lone parent households, 2011 (%)
11.6% (360)
13.3% (390)
11.9% (390)
8.4% (290)
15.7% (490)
11.9% (340)
10.8% (330)
13.8% (430)
7.6% (230)
11.2% (410)
11.6% (3,660)
9.2% (32,600)
11.3% (258,750)
10.6% (2,339,820)
Owner occupied households, 2011 (%)
71.9% (2,270)
69.3% (2,050)
67.3% (2,180)
54.1% (1,890)
54.6% (1,700)
72.2% (2,040)
68.8% (2,110)
68.7% (2,130)
85.2% (2,570)
76.4% (2,810)
68.7% (21,730)
72.8% (258,670)
65.6% (1,504,320)
64.1% (14,148,780)
Privately rented households, 2011 (%)
8.6% (270)
9.7% (290)
12.1% (390)
20.6% (720)
8.2% (250)
7.8% (220)
13.6% (420)
8.3% (260)
9.2% (280)
10.4% (380)
11.0% (3,480)
11.3% (40,090)
14.0% (321,670)
16.8% (3,715,920)
Socially rented households, 2011 (%)
18.6% (590)
20.4% (600)
19.4% (630)
23.7% (830)
36.4% (1,130)
19.0% (540)
16.4% (500)
22.3% (690)
4.9% (150)
12.4% (460)
19.3% (6,110)
14.7% (52,150)
19.0% (435,170)
17.7% (3,903,550)
Households with no central heating, 2011 (%)
1.3% (40)
3.1% (90)
1.7% (50)
2.2% (80)
1.4% (50)
1.8% (50)
1.5% (50)
1.9% (60)
1.7% (50)
2.0% (70)
1.9% (590)
2.1% (7,600)
2.9% (67,170)
2.7% (594,560)
Overcrowded households, 2011 (%)
2.9% (90)
3.0% (90)
2.6% (90)
2.6% (90)
4.8% (150)
2.5% (70)
2.2% (70)
3.2% (100)
0.7% (20)
2.3% (90)
2.7% (850)
2.5% (8,750)
4.5% (102,550)
4.6% (1,024,470)
Households with no cars or vans, 2011 (%)
19.2% (610)
19.2% (570)
23.2% (750)
29.3% (1,020)
25.2% (780)
25.5% (720)
23.4% (720)
18.0% (560)
10.6% (320)
12.8% (470)
20.6% (6,510)
18.0% (63,890)
24.7% (566,620)
25.8% (5,691,250)
Total recorded crime (rate per 1,000), 2015/16
46.2 (360)
65.4 (510)
52.7 (410)
160.8 (1,200)
62.8 (500)
39.5 (260)
42.4 (300)
48.6 (380)
28.1 (210)
35.2 (330)
57.9 (4,460)
45.3 (38,940)
n/a 66.6
(3,646,580)
Violent crime (rate per 1,000), 2015/16
20.2 (160)
20.9 (160)
19.2 (150)
38.3 (290)
22.7 (180)
13.5 (90)
14.1 (100)
18.7 (150)
9.3 (70)
13.6 (130)
19.1 (1,470)
11.5 (12,830)
n/a 17.0
(932,810)
Antisocial behaviour (rate per 1,000), 2015/16
47.2 (370)
46.9 (370)
44.5 (340)
84.2 (630)
57.8 (460)
32.1 (210)
27.7 (200)
40.4 (320)
28.6 (210)
30.6 (290)
44.0 (3,390)
29.4 (32,670)
n/a 30.8
(1,685,090)
Domestic abuse (rate per 1,000), 2015/16 (compared to Staffordshire)
12.3 (100)
11.5 (90)
13.4 (100)
13.8 (100)
11.4 (90)
7.5 (50)
10.6 (80)
11.8 (90)
5.6 (40)
7.7 (70)
10.6 (810)
6.0 (6,700)
n/a n/a
Lone pensioner households, 2011 (%)
9.1% (290)
8.4% (250)
13.0% (420)
15.9% (550)
8.8% (270)
14.0% (400)
16.2% (500)
6.2% (190)
10.2% (310)
7.0% (260)
10.9% (3,430)
12.6% (44,770)
12.6% (289,570)
12.4% (2,725,600)
Unpaid care, 2011 (%) 11.2% (890)
10.0% (770)
10.5% (800)
9.2% (670)
10.8% (860)
11.7% (770)
11.3% (810)
10.1% (790)
11.2% (830)
10.0% (940)
10.6% (8,120)
11.6% (98,830)
11.0% (614,890)
10.2% (5,430,020)
Unpaid care by people aged 65 and over, 2011 (%)
16.0% (170)
13.3% (120)
14.2% (180)
12.7% (160)
16.3% (140)
14.8% (200)
14.0% (230)
15.8% (100)
16.6% (200)
15.4% (150)
14.8% (1,650)
15.0% (23,450)
14.5% (136,870)
13.8% (1,192,610)