TAMÁS NOVÁK International Economics II. Trade indicators and specialisation.
42
TAMÁS NOVÁK International Economics II. Trade indicators and specialisation
-
Upload
amberlynn-bates -
Category
Documents
-
view
226 -
download
9
Transcript of TAMÁS NOVÁK International Economics II. Trade indicators and specialisation.

TAMÁS NOVÁK International Economics II.
Trade indicators and specialisation

Readings
– GÁBOR OBLATH - LILLA JUTKUSZ: Terms of Hungarian Foreign Trade in the Long Run and in the 1990s.. Development and Finance 2003/3. www.ffdf.mfb.hu
– PAUL KRUGMAN – MAURICE OBSFELD: International Economics. Theory and Practice. Chapter 3.

International negotiations and trade policy I.
Levels of regional integrations
1. Preferential trade agreements2. Free trade agreement3. Customs union4. Common market (free movement of good, services,
labour, capital)5. Single market 6. Economic union (Fiscal, monetary union)7. Political union

– Free trade can be established among several WTO members as follows:
A free trade area allows free-trade among members, but each member can have its own trade policy towards non-member countries.
– Example: The North American Free Trade Agreement (NAFTA) creates a free trade area.
A customs union allows free trade among members and requires a common external trade policy towards non-member countries.
– Example: The European Union (EU) is a full customs union.
A common market is a customs union with free factor movements (especially labor) among members.
International negotiations and trade policy II.

Are preferential trading agreements good?– It depends on whether it leads to trade creation or
trade diversion. Trade creation
– Occurs when the formation of a preferential trading agreement leads to replacement of high-cost domestic production by low-cost imports from other members.
Trade diversion – Occurs when the formation of a preferential trading
agreement leads to the replacement of low-cost imports from non members with higher-cost imports from member nations.
International negotiations and trade policy III.

Indicators of international trade I.
– Export ratio;– Import ratio;– Openness to trade;– Openness to world economy;– Commodity pattern (structure) of trade;– Geographical pattern of trade;– Terms of trade is the relative prices of a
country's export to import

Indicators of international trade II.
– Price elasticity of supply is defined as a numerical measure of the responsiveness of the quantity supplied of product (A) to a change in price of product (A) alone. It is the measure of the way quantity supplied reacts to a change in price.
– Income elasticity of demand: responsiveness of the demand of a good to the change in the income of the people demanding the good.
– Price elasticity of demand is defined as the responsiveness of the quantity demanded of a good or service to a change in its price.
– Cross elasticity of demand and cross price elasticity of demand measures the responsiveness of the demand of a good to a change in the price of another good.

Some facts on development of trade I.
1. Size Matters: The Gravity Model
In fact, the size of an economy is directly related to the volume of imports and exports.– Larger economies produce more goods and
services, so they have more to sell in the export market.
– Larger economies generate more income from the goods and services sold, so people are able to buy more imports.

Some facts on development of trade II.
Other things besides size matter for trade: – Distance between markets influences
transportation costs and therefore the cost of imports and exports.
– Distance may also influence personal contact and communication, which may influence trade.
– Cultural affinity: if two countries have cultural ties, it is likely that they also have strong economic ties.
– Geography: ocean harbors and a lack of mountain barriers make transportation and trade easier.
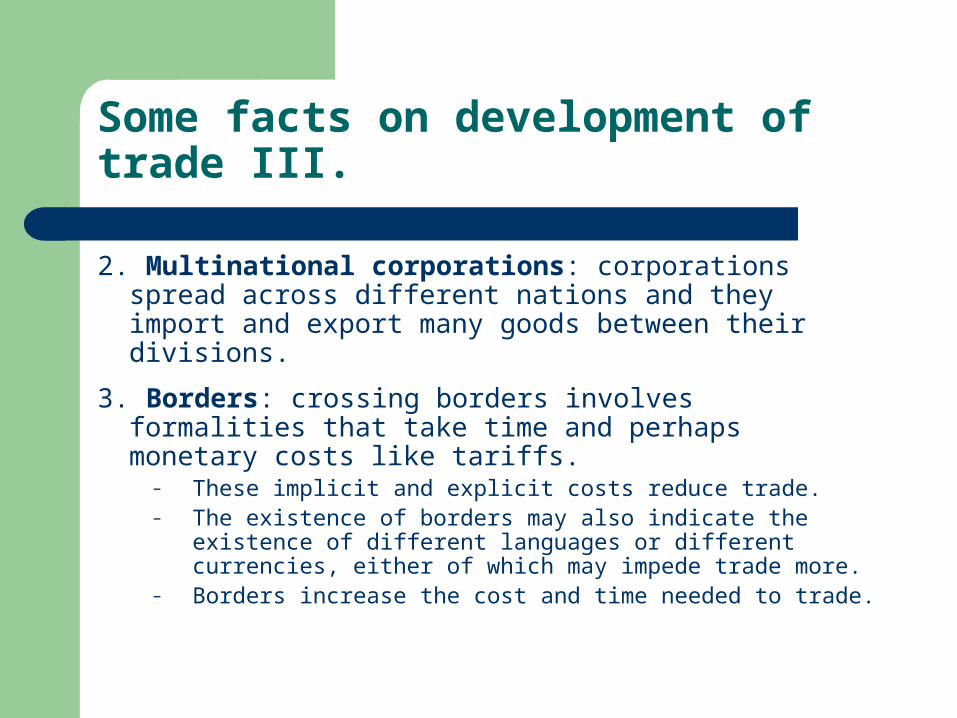
Some facts on development of trade III.
2. Multinational corporations: corporations spread across different nations and they import and export many goods between their divisions.
3. Borders: crossing borders involves formalities that take time and perhaps monetary costs like tariffs.
– These implicit and explicit costs reduce trade. – The existence of borders may also indicate the existence
of different languages or different currencies, either of which may impede trade more.
– Borders increase the cost and time needed to trade.

Some facts on development of trade IV.
4. Trade agreements: between countries are intended to reduce the formalities and tariffs needed to cross borders, and therefore to increase trade.
5. Estimates of the effect of distance from the gravity model predict that a 1% increase in the distance between countries is associated with a decrease in the volume of trade of 0.7% to 1%.

Some facts on development of trade V.
6. Has the World Become “Smaller”?
– The negative effect of distance on trade according
to the gravity models is significant, but it has grown smaller over time due to modern transportation and communication.
– But history has shown that political factors, such as wars, can change trade patterns much more than innovations in transportation and communication.

Some facts on development of trade VI.
– There were two waves of globalization.1840–1914: economies relied on steam power,
railroads, telegraph, telephones. Globalization was interrupted and reversed by wars and depression.
1945–present: economies rely on telephones, airplanes, computers, internet, fiber optics,…
Important question: the international monetary system
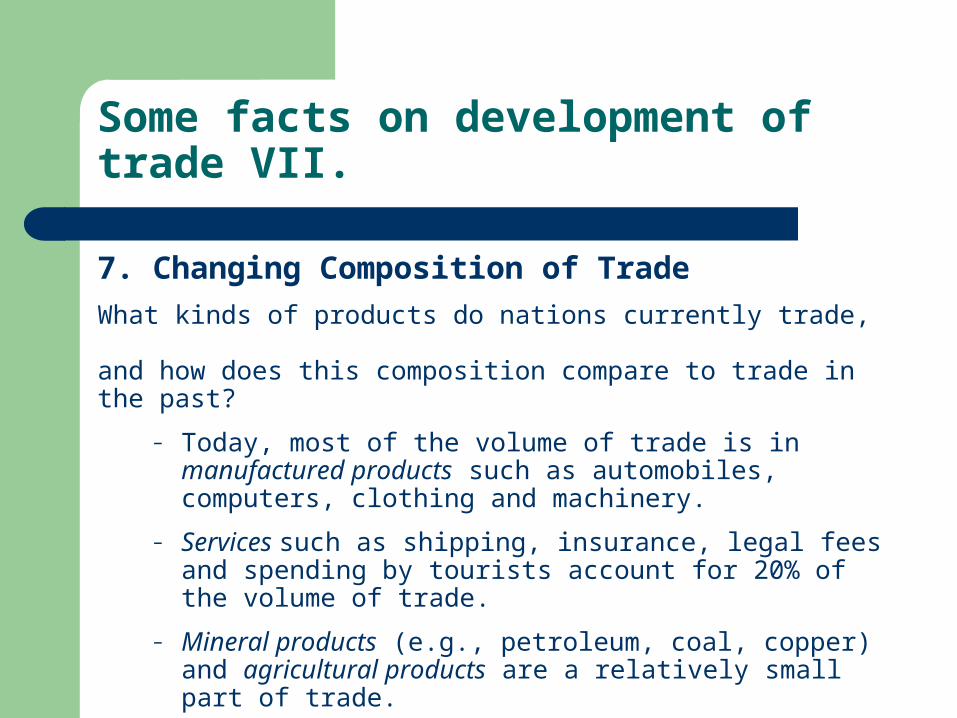
Some facts on development of trade VII.
7. Changing Composition of Trade
What kinds of products do nations currently trade, and how does this composition compare to trade in the past?
– Today, most of the volume of trade is in manufactured products such as automobiles, computers, clothing and machinery.
– Services such as shipping, insurance, legal fees and spending by tourists account for 20% of the volume of trade.
– Mineral products (e.g., petroleum, coal, copper) and agricultural products are a relatively small part of trade.

Changing Composition of Trade (cont.)
In the past, a large fraction of the volume of trade came from agricultural and mineral products.
– In 1910, Britain mainly imported agricultural and mineral products, although manufactured products still represented most of the volume of exports.
– In 1910, the US mainly imported and exported agricultural products and mineral products.
– In 2002, manufactured products made up most of the volume of imports and exports for both countries.

Changing Composition of Trade (cont.)
Developing countries, or low and middle-income countries, have also changed the composition of their trade.
– In 2001, about 65% of exports from developing countries were manufactured products, and only 10% of exports were agricultural products.
– In 1960, about 58% of exports from developing countries were agricultural products and only 12% of exports were manufactured products.

Multinational Corporations and Outsourcing
Before 1945, multinational corporations played a small role in world trade.
But today about one third of all US exports and 42% of all US imports are sales from one division of a multinational corporation to another.

Multinational Corporations and Outsourcing (cont.)
Outsourcing occurs when a firm moves business operations out of the domestic country.
– The operations could be run by a subsidiary of a multinational corporation.
– Or they could be subcontracted to a foreign firm.
Outsourcing of either type increases the amount of trade.
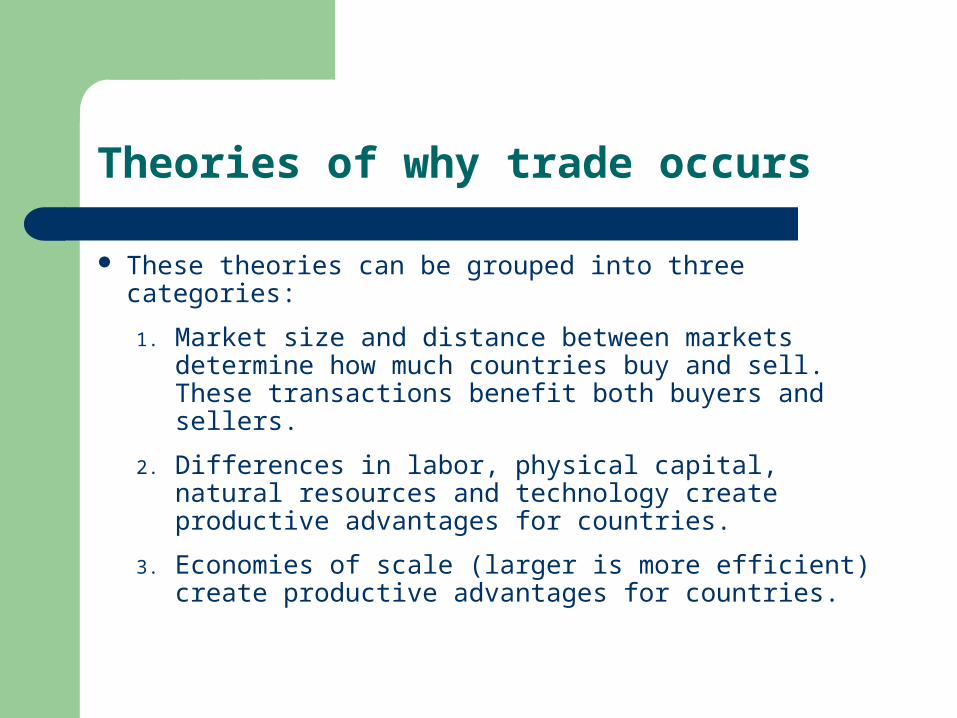
Theories of why trade occurs
These theories can be grouped into three categories:
1. Market size and distance between markets determine how much countries buy and sell. These transactions benefit both buyers and sellers.
2. Differences in labor, physical capital, natural resources and technology create productive advantages for countries.
3. Economies of scale (larger is more efficient) create productive advantages for countries.

Absolute Advantage
Export those goods and services for which a country is more productive than other countries
Import those goods and services for which other countries are more productive than it is

The Theory of Absolute Advantage: An Example
Wine 2 1
Computers 3 5
France Japan
OUTPUT PER HOUR OF LABOR

Absolute Advantage’s Flaw
What happens to trade if one country has an absolute advantage in both products?
No trade would occur

The Ricardian Model
The Ricardian model says differences in productivity of labor between countries cause productive differences, leading to gains from trade.
– Differences in productivity are usually explained by differences in technology.
The Heckscher-Ohlin model says differences in labor, labor skills, physical capital and land between countries cause productive differences, leading to gains from trade.

Comparative Advantage and Opportunity Cost
The Ricardian model uses the concepts of opportunity cost and comparative advantage.
The opportunity cost of producing something measures the cost of not being able to produce something else.

Comparative Advantage and Opportunity Cost (cont.)
A country faces opportunity costs when it employs resources to produce goods and services.
For example, a limited number of workers could be employed to produce either roses or computers.
– The opportunity cost of producing computers is the amount of roses not produced.
– The opportunity cost of producing roses is the amount of computers not produced.
– A country faces a trade off: how many computers or roses should it produce with the limited resources that it has?

Comparative Advantage and Opportunity Cost (cont.)
Suppose that in the US 10 million roses can be produced with the same resources that could produce 100,000 computers.
Suppose that in Ecuador 10 million roses can be produced with the same resources that could produce 30,000 computers.
Workers in Ecuador would be less productive than those in the US in manufacturing computers.

Comparative Advantage and Opportunity Cost (cont.)
Ecuador has a lower opportunity cost of producing roses.
– Ecuador can produce 10 million roses, compared to 30,000 computers that it could otherwise produce.
– The US can produce 10 million roses, compared to 100,000 computers that it could otherwise produce.

Comparative Advantage and Opportunity Cost (cont.)
The US has a lower opportunity cost in producing computers.
– Ecuador can produce 30,000 computers, compared to 10 million roses that it could otherwise produce.
– The US can produce 100,000 computers, compared to 10 million roses that it could otherwise produce.
– The US can produce 30,000 computers, compared to 3.3 million roses that it could otherwise produce.
Comparative Advantage and Opportunity Cost (cont.)
A country has a comparative advantage in producing a good if the opportunity cost of producing that good is lower in the country than it is in other countries.
A country with a comparative advantage in producing a good uses its resources most efficiently when it produces that good compared to producing other goods.

Comparative Advantage and Opportunity Cost (cont.)
The US has a comparative advantage in computer production: it uses its resources more efficiently in producing computers compared to other uses.
Ecuador has a comparative advantage in rose production: it uses its resources more efficiently in producing roses compared to other uses.
Suppose initially that Ecuador produces computers and the US produces roses, and that both countries want to consume computers and roses.
Can both countries be made better off?

Comparative Advantage and Trade
Millions of
Roses
Thousands of
Computers
U.S. -10 +100
Ecuador +10 -30
Total 0 +70
Comparative Advantage and Trade (cont.)
In this simple example, we see that when countries specialize in production in which they have a comparative advantage, more goods and services can be produced and consumed.
– Initially both countries could only consume 10 million roses and 30 thousand computers.
– When they produced goods in which they had a comparative advantage, they could still consume 10 million roses, but could consume 100,000 – 30,000 = 70,000 more computers.

Gains from Trade
Gains from trade come from specializing in production that use resources most efficiently, and using the income generated from that production to buy the goods and services that countries desire.
– where “using resources most efficiently” means producing a good in which a country has a comparative advantage.
Domestic workers earn a higher income from export production because the relative price of exportable good increases with trade.
Foreign workers earn a higher income from their export production because the relative price of import decreases with trade (making imported good cheaper)

Gains from Trade (cont.)
We show how consumption possibilities expand beyond the production possibility frontier when trade is allowed.
Without trade, consumption is restricted to what is produced.
With trade, consumption in each country is expanded because world production is expanded when each country specializes in producing the good in which it has a comparative advantage.

Misconceptions About Comparative Advantage
1. Free trade is beneficial only if a country is more productive than foreign countries.
– But even an unproductive country benefits from free trade by avoiding the high costs for goods that it would otherwise have to produce domestically.
– High costs derive from inefficient use of resources.
– The benefits of free trade do not depend on absolute advantage, rather they depend on comparative advantage: specializing in industries that use resources most efficiently.

Misconceptions About Comparative Advantage (cont.)
2. Free trade with countries that pay low wages hurts high wage countries.
– While trade may reduce wages for some workers, thereby affecting the distribution of income within a country, trade benefits consumers and other workers.
– Consumers benefit because they can purchase goods more cheaply (more computers in exchange for roses).
– Producers/workers benefit by earning a higher income (by using resources more efficiently and through higher prices/wages).

Misconceptions About Comparative Advantage (cont.)
3. Free trade exploits less productive countries.
– While labor standards in some countries are less than exemplary compared to Western standards, they are so with or without trade.
– Are high wages and safe labor practices alternatives to trade? Deeper poverty and exploitation (e.g., involuntary prostitution) may result without export production.
– Consumers benefit from free trade by having access to cheaply (efficiently) produced goods.
– Producers/workers benefit from having higher profits/wages—higher compared to the alternative.

Transportation Costs and Non-traded Goods
The Ricardian model predicts that countries should completely specialize in production.
But this rarely happens for primarily 3 reasons:
1. At least one factor of production reduces the tendency of specialization
2. Protectionism 3. Transportation costs reduce or prevent trade,
which may cause each country to produce the same good or service
Transportation Costs and Non-traded Goods (cont.)
Non-traded goods and services (e.g., haircuts and auto repairs) exist due to high transportation costs.
– Countries tend to spend a large fraction of national income on non-traded goods and services.
– This fact has implications for the gravity model and for models that consider how income transfers across countries affect trade.

Summary
1. A country has a comparative advantage in producing a good if the opportunity cost of producing that good is lower in the country than it is in other countries.
– A country with a comparative advantage in producing a good uses its resources most efficiently when it produces that good compared to producing other goods.
2. The Ricardian model focuses only on differences in the productivity of labor across countries, and it explains gains from trade using the concept of comparative advantage.

Summary (cont.)
3. When countries specialize and trade according to the Ricardian model; the relative price of the produced good rises, income for workers rises and imported goods are less expensive for consumers.
4. Trade is predicted to benefit both high productivity and low productivity countries, although trade may change the distribution of income within countries.
5. High productivity or low wages give countries a cost advantage that allow them to produce efficiently.

Summary (cont.)
7. Although empirical evidence supports trade based on comparative advantage, transportation costs and other factors prevent complete specialization in production.