Taleb Probability
11
Statistical and applied probabilistic knowledge is the core of knowledge; statistics is what tells you if something is true, false, or merely anecdotal; it is the "logic of science"; it is the instrument of risk-taking; it is the applied tools of epistemology; you can't be a modern intellectual and not think probabilistically —but... let's not be suckers. The problem is much more complicated than it seems to the casual, mechanistic user who picked it up in graduate school. Statistics can fool you. In fact it is fooling your government right now. It can even bankrupt the system (let's face it: use of probabilistic methods for the estimation of risks did just blow up the banking system). THE FOURTH QUADRANT: A MAP OF THE LIMITS OF STATISTICS [9.15.08] By Nassim Nicholas Taleb An Edge Original Essay Introduction When Nassim Taleb talks about the limits of statistics, he becomes outraged. "My outrage," he says, "is aimed at the scientist-charlatan putting society at risk using statistical methods. This is similar to iatrogenics, the study of the doctor putting the patient at risk." As a researcher in probability, he has some credibility. In 2006, using FNMA and bank risk managers as his prime perpetrators, he wrote the following: The government-sponsored institution Fannie Mae, when I look at its risks, seems to be sitting on a barrel of dynamite, vulnerable to the slightest hiccup. But not to worry: their large staff of scientists deemed these events "unlikely." In the following Edge original essay, Taleb continues his examination of Black Swans, the highly improbable and unpredictable events that have massive impact. He claims that those who are putting society at risk are "no true statisticians", merely people using statistics either without understanding them, or in a self-serving manner. "The current subprime crisis did wonders to help me drill my
Transcript of Taleb Probability
5/16/2018 Taleb Probability - slidepdf.com
http://slidepdf.com/reader/full/taleb-probability 1/11
Statistical and applied probabilistic knowledge is the core of knowledge;statistics is what tells you if something is true, false, or merely anecdotal;it is the "logic of science"; it is the instrument of risk-taking; it is theapplied tools of epistemology; you can't be a modern intellectual and not think probabilistically —but... let's not be suckers. The problem is muchmore complicated than it seems to the casual, mechanistic user who picked it up in graduate school. Statistics can fool you. In fact it is fooling your government right now. It can even bankrupt the system (let's face it: useof probabilistic methods for the estimation of risks did just blow up thebanking system).
THE FOURTH QUADRANT: A MAP OF THE LIMITS OF STATISTICS[9.15.08] By Nassim Nicholas Taleb An Edge Original Essay
Introduction
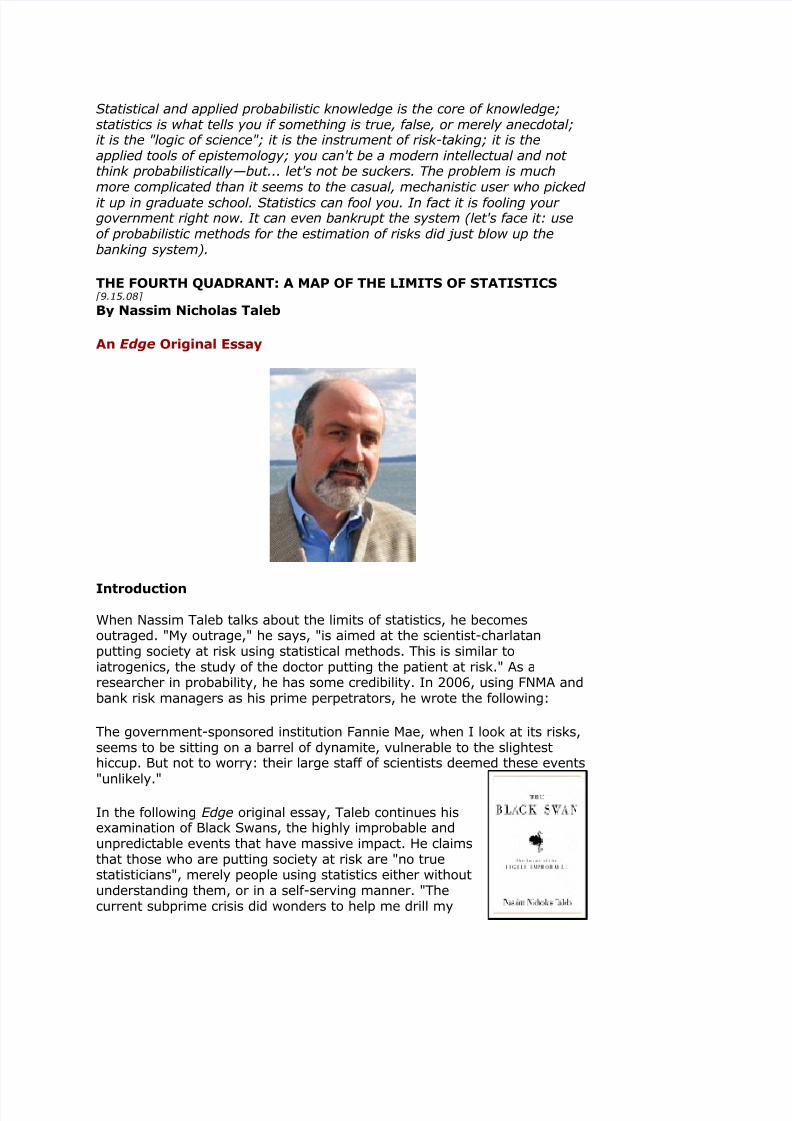
When Nassim Taleb talks about the limits of statistics, he becomesoutraged. "My outrage," he says, "is aimed at the scientist-charlatanputting society at risk using statistical methods. This is similar toiatrogenics, the study of the doctor putting the patient at risk." As aresearcher in probability, he has some credibility. In 2006, using FNMA andbank risk managers as his prime perpetrators, he wrote the following: The government-sponsored institution Fannie Mae, when I look at its risks,seems to be sitting on a barrel of dynamite, vulnerable to the slightesthiccup. But not to worry: their large staff of scientists deemed these events
"unlikely."
In the following Edge original essay, Taleb continues hisexamination of Black Swans, the highly improbable andunpredictable events that have massive impact. He claimsthat those who are putting society at risk are "no truestatisticians", merely people using statistics either withoutunderstanding them, or in a self-serving manner. "Thecurrent subprime crisis did wonders to help me drill my
5/16/2018 Taleb Probability - slidepdf.com
http://slidepdf.com/reader/full/taleb-probability 2/11
point about the limits of statistically driven claims," he says. Taleb, looking at the cataclysmic situation facing financial institutionstoday, points out that "the banking system, betting against Black Swans,has lost over 1 Trillion dollars (so far), more than was ever made in thehistory of banking". But, as he points out, there is also good news.
We can identify where the danger zone is located , which I call "the fourthquadrant", and show it on a map with more or less clear boundaries. A mapis a useful thing because you know where you are safe and where yourknowledge is questionable. So I drew for the Edge readers a tableaushowing the boundaries where statistics works well and where it isquestionable or unreliable. Now once you identify where the danger zoneis, where your knowledge is no longer valid, you can easily make somepolicy rules: how to conduct yourself in that fourth quadrant; what toavoid.
— John Brockman NASSIM NICHOLAS TALEB, essayist and former mathematical trader, isDistinguished Professor of Risk Engineering at New York University’sPolytechnic Institute. He is the author of Fooled by Randomness and theinternational bestseller The Black Swan. Nassim Taleb's Edge Bio Page REALITY CLUB: Jaron Lanier, George Dyson BLOGWATCH
THE FOURTH QUADRANT: A MAP OF THE LIMITS OF STATISTICS Statistical and applied probabilistic knowledge is the core of knowledge;statistics is what tells you if something is true, false, or merely anecdotal; itis the "logic of science"; it is the instrument of risk-taking; it is the appliedtools of epistemology; you can't be a modern intellectual and not thinkprobabilistically—but... let's not be suckers. The problem is much morecomplicated than it seems to the casual, mechanistic user who picked it up ingraduate school. Statistics can fool you. In fact it is fooling your government
right now. It can even bankrupt the system (let's face it: use of probabilisticmethods for the estimation of risks did just blow up the banking system). The current subprime crisis has been doing wonders for the reception of anyideas about probability-driven claims in science, particularly in social science,economics, and "econometrics" (quantitative economics). Clearly, withcurrent International Monetary Fund estimates of the costs of the 2007-2008subprime crisis, the banking system seems to have lost more on risk taking
5/16/2018 Taleb Probability - slidepdf.com
http://slidepdf.com/reader/full/taleb-probability 3/11
(from the failures of quantitative risk management) than every penny banksever earned taking risks. But it was easy to see from the past that the pilotdid not have the qualifications to fly the plane and was using the wrongnavigation tools: The same happened in 1983 with money center bankslosing cumulatively every penny ever made, and in 1991-1992 when theSavings and Loans industry became history.
It appears that financial institutions earn money on transactions (say fees onyour mother-in-law's checking account) and lose everything taking risks theydon't understand. I want this to stop, and stop now— the current patchingby the banking establishment worldwide is akin to using the same doctor tocure the patient when the doctor has a track record of systematically killingthem. And this is not limited to banking—I generalize to an entire class of random variables that do not have the structure we thing they have, inwhich we can be suckers.
And we are beyond suckers: not only, for socio-economic and othernonlinear, complicated variables, we are riding in a bus driven a blindfolded
driver, but we refuse to acknowledge it in spite of the evidence, which to meis a pathological problem with academia. After 1998, when a "Nobel-crowned" collection of people (and the crème de la crème of the financialeconomics establishment) blew up Long Term Capital Management, a hedgefund, because the "scientific" methods they used misestimated the role of the rare event, such methodologies and such claims on understanding risksof rare events should have been discredited. Yet the Fed helped their bailoutand exposure to rare events (and model error) patently increasedexponentially (as we can see from banks' swelling portfolios of derivativesthat we do not understand).
Are we using models of uncertainty to produce certainties?
This masquerade does not seem to come from statisticians—but from thecommoditized, "me-too" users of the products. Professional statisticians canbe remarkably introspective and self-critical. Recently, the AmericanStatistical Association had a special panel session on the "black swan"concept at the annual Joint Statistical Meeting in Denver last August. Theyinsistently made a distinction between the "statisticians" (those who dealwith the subject itself and design the tools and methods) and those in otherfields who pick up statistical tools from textbooks without reallyunderstanding them. For them it is a problem with statistical education andhalf-baked expertise. Alas, this category of blind users includes regulatorsand risk managers, whom I accuse of creating more risk than they reduce.
So the good news is that we can identify where the danger zone is located ,which I call "the fourth quadrant", and show it on a map with more or lessclear boundaries. A map is a useful thing because you know where you aresafe and where your knowledge is questionable. So I drew for the Edge readers a tableau showing the boundaries where statistics works well andwhere it is questionable or unreliable. Now once you identify where thedanger zone is, where your knowledge is no longer valid, you can easilymake some policy rules: how to conduct yourself in that fourth quadrant;
5/16/2018 Taleb Probability - slidepdf.com
http://slidepdf.com/reader/full/taleb-probability 4/11
what to avoid. So the principal value of the map is that it allows for policy making. Indeed, Iam moving on: my new project is about methods on how to domesticate theunknown, exploit randomness, figure out how to live in a world we don't understand very well . While most human thought (particularly since theenlightenment) has focused us on how to turn knowledge into decisions, mynew mission is to build methods to turn lack of information, lack of understanding, and lack of "knowledge" into decisions—how, as we will see,not to be a "turkey". This piece has a technical appendix that presents mathematical points andempirical evidence. (See link below.) It includes a battery of tests showingthat no known conventional tool can allow us to make precise statisticalclaims in the Fourth Quadrant. While in the past I limited myself to citingresearch papers, and evidence compiled by others (a less risky trade), hereI got hold of more than 20 million pieces of data (includes 98% of thecorresponding macroeconomics values of transacted daily, weekly, and
monthly variables for the last 40 years) and redid a systematic analysis thatincludes recent years.
What Is Fundamentally Different About Real Life My anger with "empirical" claims in risk management does not come fromresearch. It comes from spending twenty tense (but entertaining) yearstaking risky decisions in the real world managing portfolios of complexderivatives, with payoffs that depend on higher order statistical properties —and you quickly realize that a certain class of relationships that "look good"in research papers almost never replicate in real life (in spite of the papers
making some claims with a "p" close to infallible). But that is not the mainproblem with research.
For us the world is vastly simpler in some sense than the academy, vastlymore complicated in another. So the central lesson from decision-making (asopposed to working with data on a computer or bickering about logicalconstructions) is the following: it is the exposure (or payoff) that creates thecomplexity —and the opportunities and dangers— not so much theknowledge ( i.e., statistical distribution, model representation, etc.). In somesituations, you can be extremely wrong and be fine, in others you can beslightly wrong and explode. If you are leveraged, errors blow you up; if youare not, you can enjoy life.
So knowledge (i.e., if some statement is "true" or "false") matters little, verylittle in many situations. In the real world, there are very few situationswhere what you do and your belief if some statement is true or false naivelymap into each other. Some decisions require vastly more caution thanothers—or highly more drastic confidence intervals. For instance you do not"need evidence" that the water is poisonous to not drink from it. You do notneed "evidence" that a gun is loaded to avoid playing Russian roulette, orevidence that a thief a on the lookout to lock your door. You need evidence
5/16/2018 Taleb Probability - slidepdf.com
http://slidepdf.com/reader/full/taleb-probability 5/11
of safety—not evidence of lack of safety— a central asymmetry that affectsus with rare events. This asymmetry in skepticism makes it easy to draw amap of danger spots.
The Dangers Of Bogus Math I start with my old crusade against "quants" (people like me who domathematical work in finance), economists, and bank risk managers, myprime perpetrators of iatrogenic risks (the healer killing the patient). Whyiatrogenic risks? Because, not only have economists been unable to provethat their models work, but no one managed to prove that the use of amodel that does not work is neutral , that it does not increase blind risktaking, hence the accumulation of hidden risks.
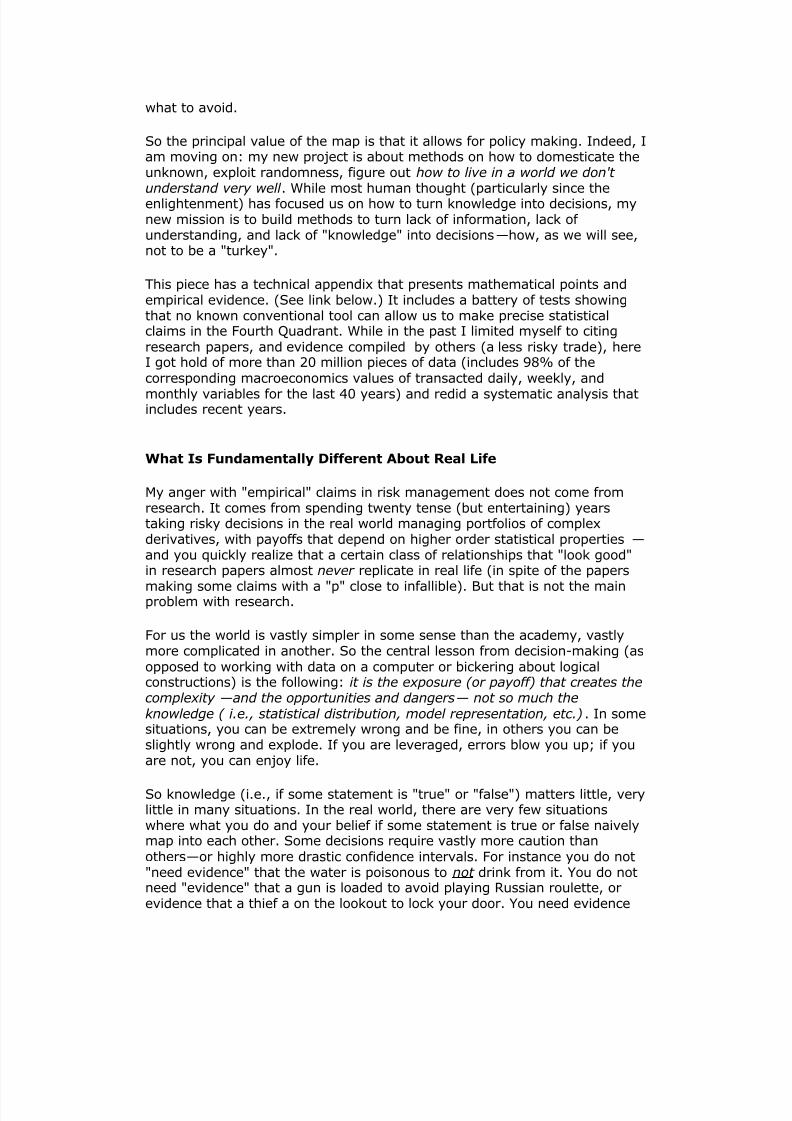
Figure 1 My classical metaphor: A Turkey is fed for a 1000 days—every days confirms to its statistical department that the human race cares about
its welfare "with increased statistical significance". On the 1001st
day, theturkey has a surprise.
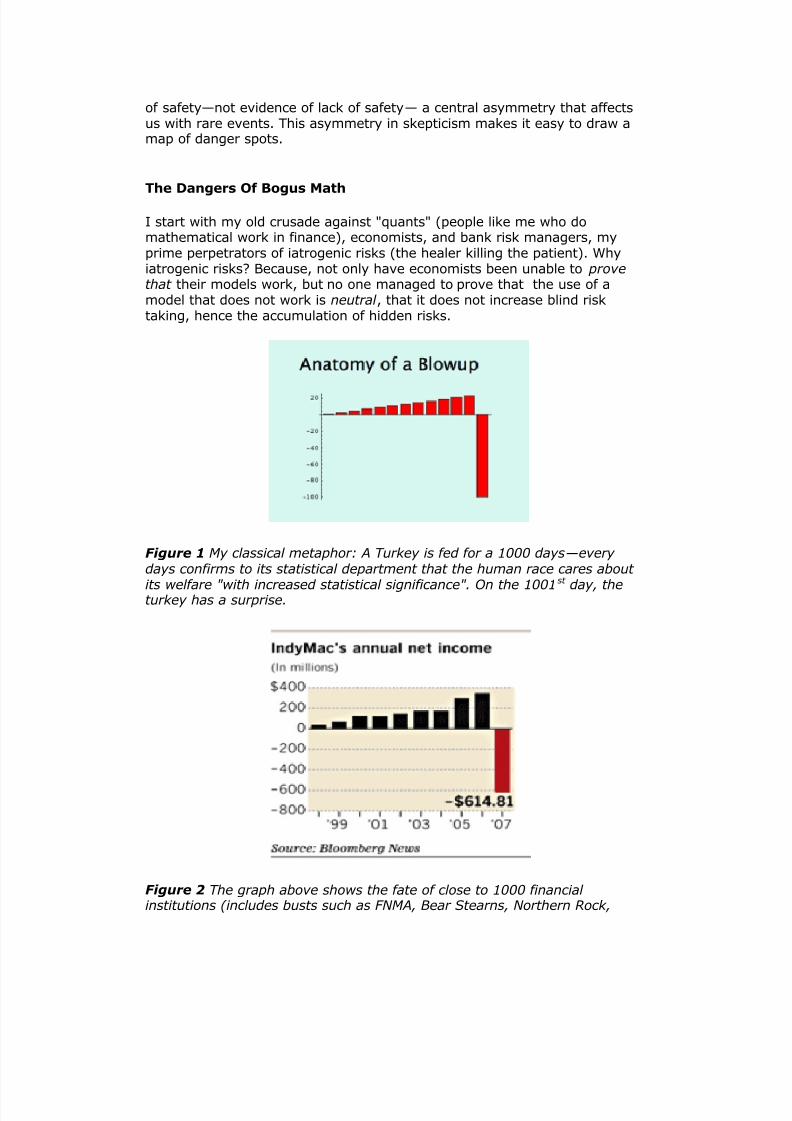
Figure 2 The graph above shows the fate of close to 1000 financial institutions (includes busts such as FNMA, Bear Stearns, Northern Rock,
5/16/2018 Taleb Probability - slidepdf.com
http://slidepdf.com/reader/full/taleb-probability 6/11
Lehman Brothers, etc.). The banking system (betting AGAINST rare events) just lost > 1 Trillion dollars (so far) on a single error, more than was ever earned in the history of banking. Yet bankers kept their previous bonusesand it looks like citizens have to foot the bills. And one Professor BenBernanke pronounced right before the blowup that we live in an era of stability and "great moderation" (he is now piloting a plane and we all are passengers on it).
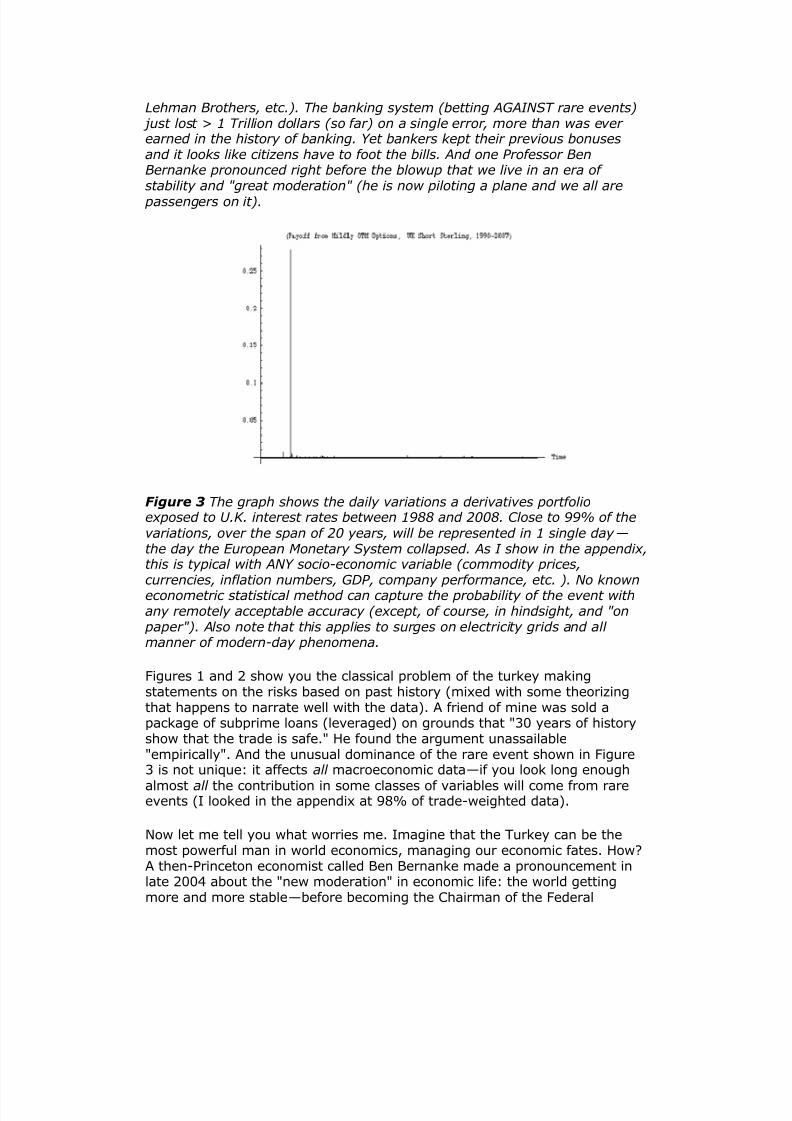
Figure 3 The graph shows the daily variations a derivatives portfolioexposed to U.K. interest rates between 1988 and 2008. Close to 99% of thevariations, over the span of 20 years, will be represented in 1 single day —the day the European Monetary System collapsed. As I show in the appendix,this is typical with ANY socio-economic variable (commodity prices,currencies, inflation numbers, GDP, company performance, etc. ). No knowneconometric statistical method can capture the probability of the event withany remotely acceptable accuracy (except, of course, in hindsight, and "on paper"). Also note that this applies to surges on electricity grids and all manner of modern-day phenomena. Figures 1 and 2 show you the classical problem of the turkey makingstatements on the risks based on past history (mixed with some theorizingthat happens to narrate well with the data). A friend of mine was sold apackage of subprime loans (leveraged) on grounds that "30 years of historyshow that the trade is safe." He found the argument unassailable"empirically". And the unusual dominance of the rare event shown in Figure3 is not unique: it affects all macroeconomic data—if you look long enough
almost all the contribution in some classes of variables will come from rareevents (I looked in the appendix at 98% of trade-weighted data).
Now let me tell you what worries me. Imagine that the Turkey can be themost powerful man in world economics, managing our economic fates. How?A then-Princeton economist called Ben Bernanke made a pronouncement inlate 2004 about the "new moderation" in economic life: the world gettingmore and more stable—before becoming the Chairman of the Federal
5/16/2018 Taleb Probability - slidepdf.com
http://slidepdf.com/reader/full/taleb-probability 7/11
Reserve. Yet the system was getting riskier and riskier as we were turkey-style sitting on more and more barrels of dynamite—and Prof. Bernanke'spredecessor the former Federal Reserve Chairman Alan Greenspan wassystematically increasing the hidden risks in the system, making us all morevulnerable to blowups.
By the "narrative fallacy" the turkey economics department will alwaysmanage to state, before thanksgivings that "we are in a new era of safety",and back-it up with thorough and "rigorous" analysis. And ProfessorBernanke indeed found plenty of economic explanations—what I call thenarrative fallacy—with graphs, jargon, curves, the kind of facade-of-knowledge that you find in economics textbooks. (This is the find of glib,snake-oil facade of knowledge—even more dangerous because of themathematics—that made me, before accepting the new position in NYU'sengineering department, verify that there was not a single economist in thebuilding. I have nothing against economists: you should let them entertaineach others with their theories and elegant mathematics, and help keepcollege students inside buildings. But beware: they can be plain wrong, yet
frame things in a way to make you feel stupid arguing with them. So makesure you do not give any of them risk-management responsibilities.) Bottom Line: The Map Things are made simple by the following. There are two distinct types of decisions, and two distinct classes of randomness.
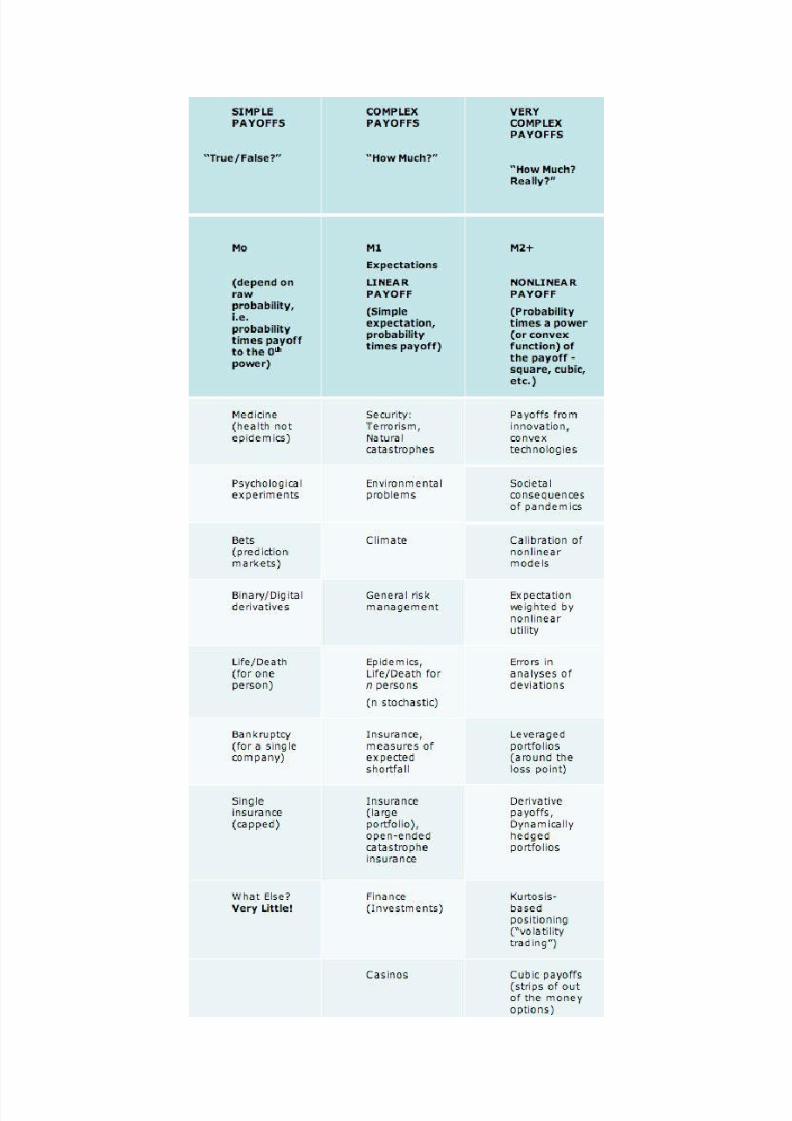
Decisions: The first type of decisions is simple, "binary", i.e. you just careif something is true or false. Very true or very false does not matter.Someone is either pregnant or not pregnant. A statement is "true" or "false"
with some confidence interval. (I call these M0 as, more technically, theydepend on the zeroth moment, namely just on probability of events, and nottheir magnitude —you just care about "raw" probability). A biologicalexperiment in the laboratory or a bet with a friend about the outcome of asoccer game belong to this category. The second type of decisions is more complex. You do not just care of thefrequency—but of the impact as well, or, even more complex, some functionof the impact. So there is another layer of uncertainty of impact. (I call theseM1+, as they depend on higher moments of the distribution). When youinvest you do not care how many times you make or lose, you care aboutthe expectation: how many times you make or lose times the amount madeor lost.
Probability structures: There are two classes of probability domains—verydistinct qualitatively and quantitatively. The first, thin-tailed: Mediocristan",the second, thick tailed Extremistan. Before I get into the details, take theliterary distinction as follows:
In Mediocristan, exceptions occur but don't carry large consequences. Add the heaviest person on the planet to a sample of 1000. The total weight
5/16/2018 Taleb Probability - slidepdf.com
http://slidepdf.com/reader/full/taleb-probability 8/11
would barely change. In Extremistan, exceptions can be everything (they will eventually, in time, represent everything). Add Bill Gates to your sample: the wealth will jump by a factor of >100,000. So, in Mediocristan,large deviations occur but they are not consequential—unlike Extremistan. Mediocristan corresponds to "random walk" style randomness that you tendto find in regular textbooks (and in popular books on randomness).Extremistan corresponds to a "random jump" one. The first kind I can call"Gaussian-Poisson", the second "fractal" or Mandelbrotian (after the worksof the great Benoit Mandelbrot linking it to the geometry of nature). Butnote here an epistemological question: there is a category of "I don't know"that I also bundle in Extremistan for the sake of decision making—simplybecause I don't know much about the probabilistic structure or the role of large events.
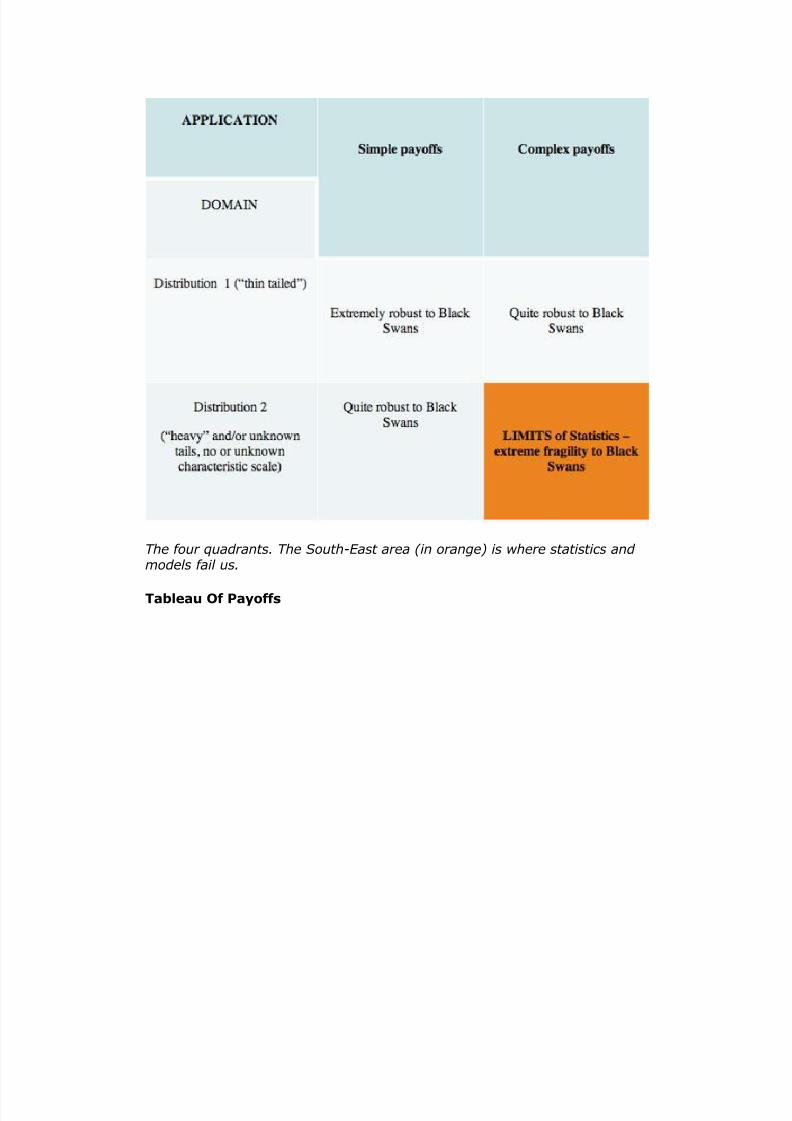
The Map Now it lets see where the traps are: First Quadrant: Simple binary decisions, in Mediocristan: Statistics doeswonders. These situations are, unfortunately, more common in academia,laboratories, and games than real life—what I call the "ludic fallacy". In otherwords, these are the situations in casinos, games, dice, and we tend to studythem because we are successful in modeling them.
Second Quadrant: Simple decisions, in Extremistan: some well knownproblem studied in the literature. Except of course that there are not manysimple decisions in Extremistan. Third Quadrant: Complex decisions in Mediocristan: Statistical methods worksurprisingly well. Fourth Quadrant: Complex decisions in Extremistan: Welcome to the BlackSwan domain. Here is where your limits are. Do not base your decisions onstatistically based claims. Or, alternatively, try to move your exposure typeto make it third-quadrant style ("clipping tails").
5/16/2018 Taleb Probability - slidepdf.com
http://slidepdf.com/reader/full/taleb-probability 9/11
The four quadrants. The South-East area (in orange) is where statistics and models fail us.
Tableau Of Payoffs
5/16/2018 Taleb Probability - slidepdf.com
http://slidepdf.com/reader/full/taleb-probability 10/11

5/16/2018 Taleb Probability - slidepdf.com
http://slidepdf.com/reader/full/taleb-probability 11/11