Taking to Scale Tree-Based Systems that Enhance Food … · TAKING TO SCALE TREE-BASED SYSTEMS THAT...
56
TAKING TO SCALE TREE-BASED SYSTEMS THAT ENHANCE FOOD SECURITY, IMPROVE RESILIENCE TO CLIMATE CHANGE, AND SEQUESTER CARBON IN MALAWI A Taking to Scale Tree-Based Systems that Enhance Food Security, Improve Resilience to Climate Change, and Sequester Carbon in Malawi Godfrey Kundhlande Robert Winterbottom Betserai I. Nyoka Katie Reytar Kim Ha Diji Chandrasekharan Behr JANUARY 2017
Transcript of Taking to Scale Tree-Based Systems that Enhance Food … · TAKING TO SCALE TREE-BASED SYSTEMS THAT...

TAKING TO SCALE TREE-BASED SYSTEMS THAT ENHANCE FOOD SECURITY, IMPROVE RESILIENCE TO CLIMATE CHANGE, AND SEQUESTER CARBON IN MALAWI A
Taking to Scale Tree-Based Systems that Enhance Food Security, Improve Resilience to Climate Change, and Sequester Carbon in Malawi
Godfrey KundhlandeRobert WinterbottomBetserai I. NyokaKatie ReytarKim HaDiji Chandrasekharan Behr
JANUARY 2017

B TAKING TO SCALE TREE-BASED SYSTEMS THAT ENHANCE FOOD SECURITY, IMPROVE RESILIENCE TO CLIMATE CHANGE, AND SEQUESTER CARBON IN MALAWI
Kundhlande, Godfrey, Robert Winterbottom, Betserai I. Nyoka, Katie Reytar, Kim Ha, and Diji Chandrasekharan Behr. 2017. Taking to Scale Tree-Based Systems that Enhance Food Security, Improve Resilience to Climate Change, and Sequester Carbon in Malawi. PROFOR, Washington D.C.
DisclaimerAll omissions and inaccuracies in this document are the responsibility of the authors. The views expressed in this guide do not necessarily represent those of the institutions involved, nor do they necessarily represent official policies of these institutions. Cover and back cover photo credit:World Agroforestry Center
Taking to Scale Tree-Based Systems that Enhance Food Security, Improve Resilience to Climate Change, and Sequester Carbon in Malawi
Godfrey KundhlandeRobert WinterbottomBetserai I. NyokaKatie ReytarKim HaDiji Chandrasekharan Behr
JANUARY 2017

II TAKING TO SCALE TREE-BASED SYSTEMS THAT ENHANCE FOOD SECURITY, IMPROVE RESILIENCE TO CLIMATE CHANGE, AND SEQUESTER CARBON IN MALAWI
ACKNOWLEDGEMENTSThis country case study is one of multiple outputs associated with a larger project designed and led by Diji Chandrasekharan Behr (Sr. Natural Resources Economist, World Bank) on taking to scale tree-based systems of agriculture (http://profor.info/knowledge/taking-tree-based-ecosystem-approaches-scale). The overall project aims, first, to create awareness and support for using ecosystem approaches to increase food security, promote resilience to climate change, and contribute to carbon sequestration and, second, to present a framework for promoting TBS at scale that should influence design of programs and investments that seek to scale up proven TBS. The report presents case information of the adoption of TBS “at scale.”
This case study report was conducted in Malawi and done in collaboration with the World Agroforestry Center (ICRAF) and World Resources Institute (WRI). Isaac Nyoka (Nodal representative, ICRAF Southern Africa Node) and Godfrey Kundhlande (Agricultural/Natural Resources Economist) from ICRAF provided technical inputs to this report and conducted the household surveys, expert interviews, and workshops that were the basis of the findings. Robert Winterbottom (Senior Fellow) and Katie Reytar (Research Associate) from WRI made technical contributions to the final country report and prepared a report on the extent of tree-based systems in five districts of Malawi. All interpretations and findings set forth in this report are those of the authors and do not necessarily reflect the views of the World Resources Institute. Kim Ha (Agricultural Economist) conducted the analysis on fertilizer subsidies. This country report draws heavily on the reports produced by the abovementioned colleagues.
The team is thankful for the financial support provided for this work by the Program on Forest (PROFOR) and the Bank Netherlands Partnership Program (BNPP). A multidonor partnership housed at the World Bank, PROFOR finances forest-related analysis and processes that support improving people’s livelihoods through better management of forests and trees, enhancing forest law enforcement and governance, financing sustainable forest management, and coordinating forest policy across sectors. In 2012, PROFOR’s donors included the European Union, Finland, Germany, Italy, Japan, the Netherlands, Switzerland, the United Kingdom, and the World Bank. Learn more at www.profor.info.
Disclaimer: The findings, interpretations, and conclusions expressed in this paper do not necessarily reflect the views of the Executive Directors of the World Bank or the governments they represent or the donors of PROFOR and BNPP. The World Bank does not guarantee the accuracy of the data included in this work. The boundaries, colors, denominations, and other information shown on any map in this work do not imply any judgment on the part of the World Bank concerning the legal status of any territory or the endorsement or acceptance of such boundaries.
TAKING TO SCALE TREE-BASED SYSTEMS THAT ENHANCE FOOD SECURITY, IMPROVE RESILIENCE TO CLIMATE CHANGE, AND SEQUESTER CARBON IN MALAWI 1
TABLE OF CONTENTS
Acknowledgements . . . . . . . . . . . . . . . . . . . . . . . . . . . . . . . . . . . . . . . . . . . . . . . . . . . . . . . . . iiAcronyms . . . . . . . . . . . . . . . . . . . . . . . . . . . . . . . . . . . . . . . . . . . . . . . . . . . . . . . . . . . . . . . . 2Executive Summary . . . . . . . . . . . . . . . . . . . . . . . . . . . . . . . . . . . . . . . . . . . . . . . . . . . . . . . . . 3 Approach used . . . . . . . . . . . . . . . . . . . . . . . . . . . . . . . . . . . . . . . . . . . . . . . . . . . . . . . . . 3 Extent of tree based systems in five districts . . . . . . . . . . . . . . . . . . . . . . . . . . . . . . . . . . . . . . . 4 Why are tree based systems being adopted at scale? . . . . . . . . . . . . . . . . . . . . . . . . . . . . . . . . 4 What is hindering further adoption of trees I agriculture landscapes? . . . . . . . . . . . . . . . . . . . . . . 5 Why continue to promote tree based systems in Malawi? . . . . . . . . . . . . . . . . . . . . . . . . . . . . . 5Introduction . . . . . . . . . . . . . . . . . . . . . . . . . . . . . . . . . . . . . . . . . . . . . . . . . . . . . . . . . . . . . . . 6Background . . . . . . . . . . . . . . . . . . . . . . . . . . . . . . . . . . . . . . . . . . . . . . . . . . . . . . . . . . . . . . 7 Farmer-Managed Natural Regeneration . . . . . . . . . . . . . . . . . . . . . . . . . . . . . . . . . . . . . . . . . 8 Community Benefits of FMNR . . . . . . . . . . . . . . . . . . . . . . . . . . . . . . . . . . . . . . . . . . . . . . . 11Justification for the Study and Hypothesis . . . . . . . . . . . . . . . . . . . . . . . . . . . . . . . . . . . . . . . . . . 15Methodology . . . . . . . . . . . . . . . . . . . . . . . . . . . . . . . . . . . . . . . . . . . . . . . . . . . . . . . . . . . . . 16Findings and Results . . . . . . . . . . . . . . . . . . . . . . . . . . . . . . . . . . . . . . . . . . . . . . . . . . . . . . . . 18 Importance of TBS in Malawi . . . . . . . . . . . . . . . . . . . . . . . . . . . . . . . . . . . . . . . . . . . . . . . 18 Mapping the Extent of On-farm Tree Cover Density . . . . . . . . . . . . . . . . . . . . . . . . . . . . . . . . . 19 Analysis of Historical Imagery . . . . . . . . . . . . . . . . . . . . . . . . . . . . . . . . . . . . . . . . . . . . . . . 22 Benefits from FMNR . . . . . . . . . . . . . . . . . . . . . . . . . . . . . . . . . . . . . . . . . . . . . . . . . . . . . 23 Current Status of Soil Fertility and Management . . . . . . . . . . . . . . . . . . . . . . . . . . . . . . . . . . . 25 Trend in Availability of Tree Resources and Products over the Last 10 Years . . . . . . . . . . . . . . . . . 26 Public Benefits from TBS: Carbon Sequestration . . . . . . . . . . . . . . . . . . . . . . . . . . . . . . . . . . . 26 Evidence of Key Factors Driving Adoption of FMNR . . . . . . . . . . . . . . . . . . . . . . . . . . . . . . . . 28 Farmers’ Awareness of Laws, Rules, and Regulations on Natural Resource Management . . . . . . . . 29 Sources of Information on TBS . . . . . . . . . . . . . . . . . . . . . . . . . . . . . . . . . . . . . . . . . . . . . . . 30 Factors Considered by Farmers in Deciding on Soil Fertility Management Practices . . . . . . . . . . . . 30 Challenges to Widespread Adoption and Further Scaling Up of FMNR . . . . . . . . . . . . . . . . . . . 31 Some of the Key Challenges in Managing Crop-Tree Intercrop . . . . . . . . . . . . . . . . . . . . . . . . . 32 Availability of Incentives to Support Adoption of TBS . . . . . . . . . . . . . . . . . . . . . . . . . . . . . . . . 33 Institutions and Bylaws on Adoption and Management of Trees on Farmers’ Fields . . . . . . . . . . . . 33 Determinants of Household Adoption of FMNR . . . . . . . . . . . . . . . . . . . . . . . . . . . . . . . . . . . 34 Model . . . . . . . . . . . . . . . . . . . . . . . . . . . . . . . . . . . . . . . . . . . . . . . . . . . . . . . . . . . . . . 34 Results . . . . . . . . . . . . . . . . . . . . . . . . . . . . . . . . . . . . . . . . . . . . . . . . . . . . . . . . . . . . . . 35Conclusions and Recommendations . . . . . . . . . . . . . . . . . . . . . . . . . . . . . . . . . . . . . . . . . . . . . . 37Annex 1: Detailed Description of Tree Cover Density Mapping Tool. . . . . . . . . . . . . . . . . . . . . . . . . 39Annex 2: Potential Savings in Subsidized Fertilizer Program in Malawi . . . . . . . . . . . . . . . . . . . . . . 41 Cost of Maize Fertilizer Subsidy Program . . . . . . . . . . . . . . . . . . . . . . . . . . . . . . . . . . . . . . . 41 Nutrient Application and Maize Yields—Subsidized Fertilizer . . . . . . . . . . . . . . . . . . . . . . . . . . 44 Nutrient Application and Maize Yields—Fertilizer Trees . . . . . . . . . . . . . . . . . . . . . . . . . . . . . . 45 Estimates for Substituting Fertilizer Trees for Subsidized Maize Fertilizer . . . . . . . . . . . . . . . . . . . . 46 Potential Savings per Farmer. . . . . . . . . . . . . . . . . . . . . . . . . . . . . . . . . . . . . . . . . . . . . 46 Land Area under Fertilizer Tree Cover Needed to Replace All Maize Fertilizer Subsidies . . . . . 46 Potential Total Savings . . . . . . . . . . . . . . . . . . . . . . . . . . . . . . . . . . . . . . . . . . . . . . . . . 47 Household Characteristics of Subsidized Fertilizer Beneficiaries and Fertilizer Tree Adopters . . . . . . 48References . . . . . . . . . . . . . . . . . . . . . . . . . . . . . . . . . . . . . . . . . . . . . . . . . . . . . . . . . . . . . . 49

2 TAKING TO SCALE TREE-BASED SYSTEMS THAT ENHANCE FOOD SECURITY, IMPROVE RESILIENCE TO CLIMATE CHANGE, AND SEQUESTER CARBON IN MALAWI
ACRONYMSEPA extension planning areaFAO Food and Agriculture OrganizationFISP Farm Input Subsidy ProgramFMNR farmer-managed natural regenerationGDP gross domestic productLRCD Land Resources Conservation DepartmentNGO nongovernmental organizationNRM natural resource managementTBS tree-based systemsTCDM Tree Cover Density MappingTLC Total Land CareVNRMC Village Natural Resources Management Committee
TAKING TO SCALE TREE-BASED SYSTEMS THAT ENHANCE FOOD SECURITY, IMPROVE RESILIENCE TO CLIMATE CHANGE, AND SEQUESTER CARBON IN MALAWI 3
EXECUTIVE SUMMARY
There is evidence from different agroecological systems that trees on farms are beneficial to households and communities. They contribute to improved soil fertility, higher crop yields, and increased agricultural production by helping control soil erosion and replenishing soil organic matter and nutrients. Tree-based systems (TBS) of agriculture help diversify the sources of income and they assist in building household resilience to shocks (whether weather-related or otherwise). When planted at a certain scale, trees can also help reduce runoff and flooding and help recharge groundwater and maintain stream flow. However, agricultural practices seldom consider the inclusion of trees.
In 2012, there was anecdotal evidence from international nongovernmental organization (NGO) partners, extension agents, and others that farmers had introduced trees into their agricultural lands in many areas of Malawi, primarily through the practice of farmer-managed natural regeneration (FMNR). The area of agricultural lands with trees was increasing while national forest cover has been decreasing at an alarming rate. It was estimated that there are more than 155,000 hectares of crop fields under Faidherbia parklands (which is 20 percent of the total arable land). When sampling 9,242 square kilometers (924,200 hectares) of cropland area in five targeted districts of Malawi for on-farm tree cover density, it was found that only 3 percent had no tree cover.
The increased numbers of trees in agricultural landscapes raised interest because it gave the government the opportunity to increase food security and reduce the number of people living in absolute poverty. Second, it was also of interest because of the potential of these tree-based systems to help government reduce its spending on the Farmer Input Subsidy Program (FISP), which in 2014/15 accounted for 10 percent of all expenditures under the national budget and 70 percent of the Ministry of Agriculture’s expenditures. Third, the adoption of TBS was of interest for the contribution these systems could make to building resilience of rural households and reducing the annual 1.7 percent of gross domestic product that is lost to droughts and floods; in addition, about 265,000 people fall into poverty because of the fragile natural resource base for their livelihoods. Fourth, understanding what is enabling greater adoption of TBS in Malawi could offer insights into the question of how to promote adoption at scale of systems that contribute to food security, resilience to climate change, and mitigation of carbon emissions.
Malawi has a population of 14.9 million that is landlocked and vulnerable to natural shocks. The majority of the poor population live in rural areas. Agriculture is the backbone of the economy, with 85 percent of employment and 80 percent
of foreign exchange from this sector, and smallholders are responsible for more than 80 percent of Malawi’s agricultural production, although production systems are predominantly subsistence farming. Agricultural crops and maize are critically important to the Malawian economy and to the livelihoods of most people. Low agricultural and maize productivity, however, leads to the high incidence of poverty and to national and household food insecurity.
The scope of this study is to improve understanding of the key factors that drive the adoption of TBS at an increasing scale in Malawi in order to increase the effectiveness of interventions designed to help poor rural farmers with food and energy security. The study aims to inform efforts to extend and accelerate the adoption of TBS across the landscapes of Malawi where erosion is a severe challenge, especially in the Shire River Basin.
Approach Used
The methods used focused on generating information on the benefits of tree-based systems, the extent of adoption of FMNR, and the institutional, policy, household, and biophysical factors that have influenced the successful adoption at scale of FMNR on agricultural lands. The instruments included surveys, spatial imagery, consultation with technical specialists, and field visits. The data and information that form the basis for this work include both primary and secondary sources.
The data collection and analysis were conducted in five selected districts in Malawi (Balaka, Blantrye, Dowa, Salima, and South Mzimba) and focus primarily on TBS established through FMNR. The selection of sites was done following consultations
Farmer-Managed Natural Regeneration
FMNR is a rapid, low-cost, easily replicated approach to restoring and improving agricultural, forested, and pasture lands. In Malawi, Rhoades (1995) found increases of 4–53 percent in maize yields under Faidherbia compared with systems without Faidherbia that have no tree cover.
4 TAKING TO SCALE TREE-BASED SYSTEMS THAT ENHANCE FOOD SECURITY, IMPROVE RESILIENCE TO CLIMATE CHANGE, AND SEQUESTER CARBON IN MALAWI
with partners and stakeholders to identify the target areas for more in-depth analysis of the adoption of TBS. The districts were selected to provide information from different parts of the Shire river catchment and also districts with different environmental and farm size conditions. The selection of target districts for the mapping component and a more in-depth analysis of the adoption of TBS and carbon stocks were informed by the Food and Agriculture Organization data on land cover, which provided the context for the distribution of cropland in Malawi. Household data, due to logistical constraints, were collected only for Balaka, Blantyre, and Dowa.
Extent of Tree-based Systems in Five Districts
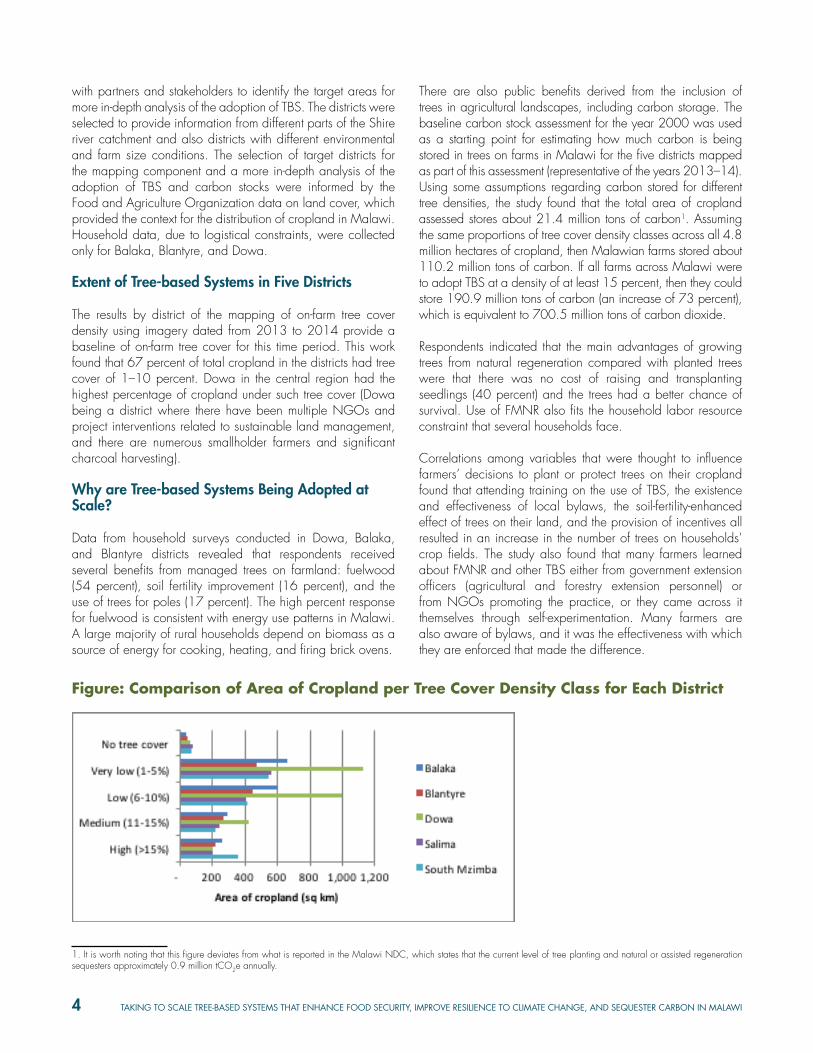
The results by district of the mapping of on-farm tree cover density using imagery dated from 2013 to 2014 provide a baseline of on-farm tree cover for this time period. This work found that 67 percent of total cropland in the districts had tree cover of 1–10 percent. Dowa in the central region had the highest percentage of cropland under such tree cover (Dowa being a district where there have been multiple NGOs and project interventions related to sustainable land management, and there are numerous smallholder farmers and significant charcoal harvesting).
Why are Tree-based Systems Being Adopted at Scale?
Data from household surveys conducted in Dowa, Balaka, and Blantyre districts revealed that respondents received several benefits from managed trees on farmland: fuelwood (54 percent), soil fertility improvement (16 percent), and the use of trees for poles (17 percent). The high percent response for fuelwood is consistent with energy use patterns in Malawi. A large majority of rural households depend on biomass as a source of energy for cooking, heating, and firing brick ovens.
1. It is worth noting that this figure deviates from what is reported in the Malawi NDC, which states that the current level of tree planting and natural or assisted regeneration sequesters approximately 0.9 million tCO2e annually.
There are also public benefits derived from the inclusion of trees in agricultural landscapes, including carbon storage. The baseline carbon stock assessment for the year 2000 was used as a starting point for estimating how much carbon is being stored in trees on farms in Malawi for the five districts mapped as part of this assessment (representative of the years 2013–14). Using some assumptions regarding carbon stored for different tree densities, the study found that the total area of cropland assessed stores about 21.4 million tons of carbon1. Assuming the same proportions of tree cover density classes across all 4.8 million hectares of cropland, then Malawian farms stored about 110.2 million tons of carbon. If all farms across Malawi were to adopt TBS at a density of at least 15 percent, then they could store 190.9 million tons of carbon (an increase of 73 percent), which is equivalent to 700.5 million tons of carbon dioxide.
Respondents indicated that the main advantages of growing trees from natural regeneration compared with planted trees were that there was no cost of raising and transplanting seedlings (40 percent) and the trees had a better chance of survival. Use of FMNR also fits the household labor resource constraint that several households face.
Correlations among variables that were thought to influence farmers’ decisions to plant or protect trees on their cropland found that attending training on the use of TBS, the existence and effectiveness of local bylaws, the soil-fertility-enhanced effect of trees on their land, and the provision of incentives all resulted in an increase in the number of trees on households’ crop fields. The study also found that many farmers learned about FMNR and other TBS either from government extension officers (agricultural and forestry extension personnel) or from NGOs promoting the practice, or they came across it themselves through self-experimentation. Many farmers are also aware of bylaws, and it was the effectiveness with which they are enforced that made the difference.
Figure: Comparison of Area of Cropland per Tree Cover Density Class for Each District
TAKING TO SCALE TREE-BASED SYSTEMS THAT ENHANCE FOOD SECURITY, IMPROVE RESILIENCE TO CLIMATE CHANGE, AND SEQUESTER CARBON IN MALAWI 5
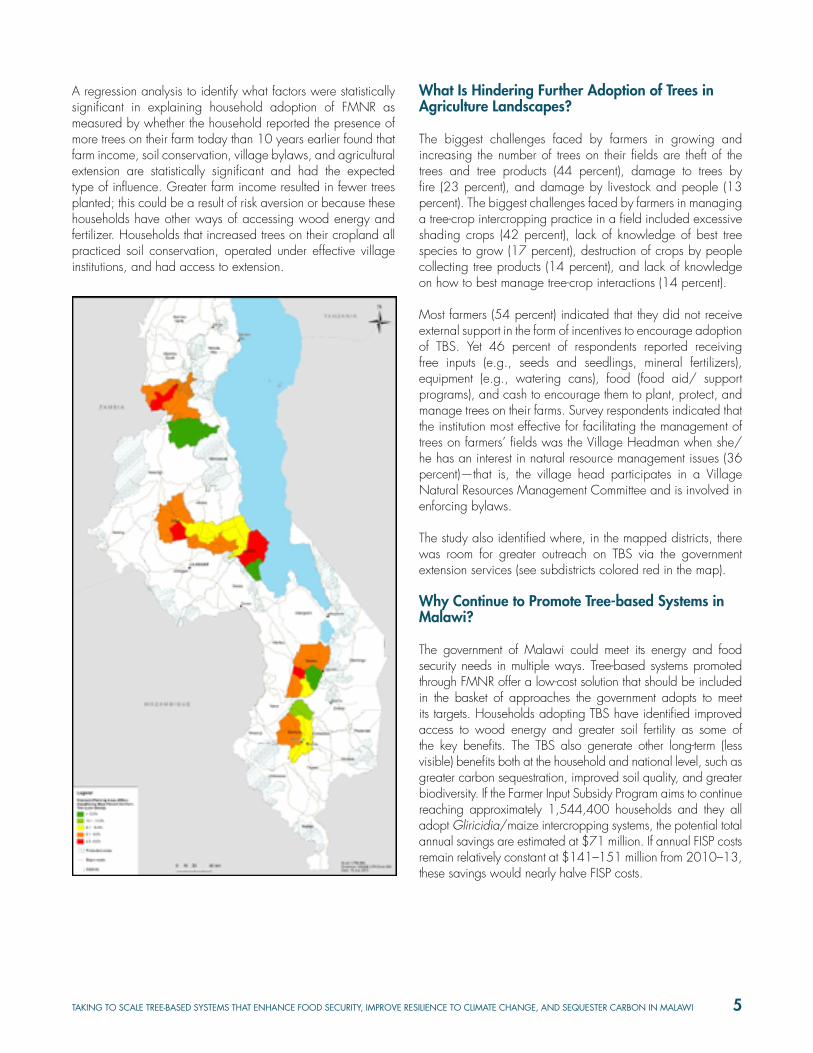
A regression analysis to identify what factors were statistically significant in explaining household adoption of FMNR as measured by whether the household reported the presence of more trees on their farm today than 10 years earlier found that farm income, soil conservation, village bylaws, and agricultural extension are statistically significant and had the expected type of influence. Greater farm income resulted in fewer trees planted; this could be a result of risk aversion or because these households have other ways of accessing wood energy and fertilizer. Households that increased trees on their cropland all practiced soil conservation, operated under effective village institutions, and had access to extension.
What Is Hindering Further Adoption of Trees in Agriculture Landscapes?
The biggest challenges faced by farmers in growing and increasing the number of trees on their fields are theft of the trees and tree products (44 percent), damage to trees by fire (23 percent), and damage by livestock and people (13 percent). The biggest challenges faced by farmers in managing a tree-crop intercropping practice in a field included excessive shading crops (42 percent), lack of knowledge of best tree species to grow (17 percent), destruction of crops by people collecting tree products (14 percent), and lack of knowledge on how to best manage tree-crop interactions (14 percent).
Most farmers (54 percent) indicated that they did not receive external support in the form of incentives to encourage adoption of TBS. Yet 46 percent of respondents reported receiving free inputs (e.g., seeds and seedlings, mineral fertilizers), equipment (e.g., watering cans), food (food aid/ support programs), and cash to encourage them to plant, protect, and manage trees on their farms. Survey respondents indicated that the institution most effective for facilitating the management of trees on farmers’ fields was the Village Headman when she/he has an interest in natural resource management issues (36 percent)—that is, the village head participates in a Village Natural Resources Management Committee and is involved in enforcing bylaws.
The study also identified where, in the mapped districts, there was room for greater outreach on TBS via the government extension services (see subdistricts colored red in the map).
Why Continue to Promote Tree-based Systems in Malawi?
The government of Malawi could meet its energy and food security needs in multiple ways. Tree-based systems promoted through FMNR offer a low-cost solution that should be included in the basket of approaches the government adopts to meet its targets. Households adopting TBS have identified improved access to wood energy and greater soil fertility as some of the key benefits. The TBS also generate other long-term (less visible) benefits both at the household and national level, such as greater carbon sequestration, improved soil quality, and greater biodiversity. If the Farmer Input Subsidy Program aims to continue reaching approximately 1,544,400 households and they all adopt Gliricidia/maize intercropping systems, the potential total annual savings are estimated at $71 million. If annual FISP costs remain relatively constant at $141–151 million from 2010–13, these savings would nearly halve FISP costs.
6 TAKING TO SCALE TREE-BASED SYSTEMS THAT ENHANCE FOOD SECURITY, IMPROVE RESILIENCE TO CLIMATE CHANGE, AND SEQUESTER CARBON IN MALAWI
INTRODUCTION
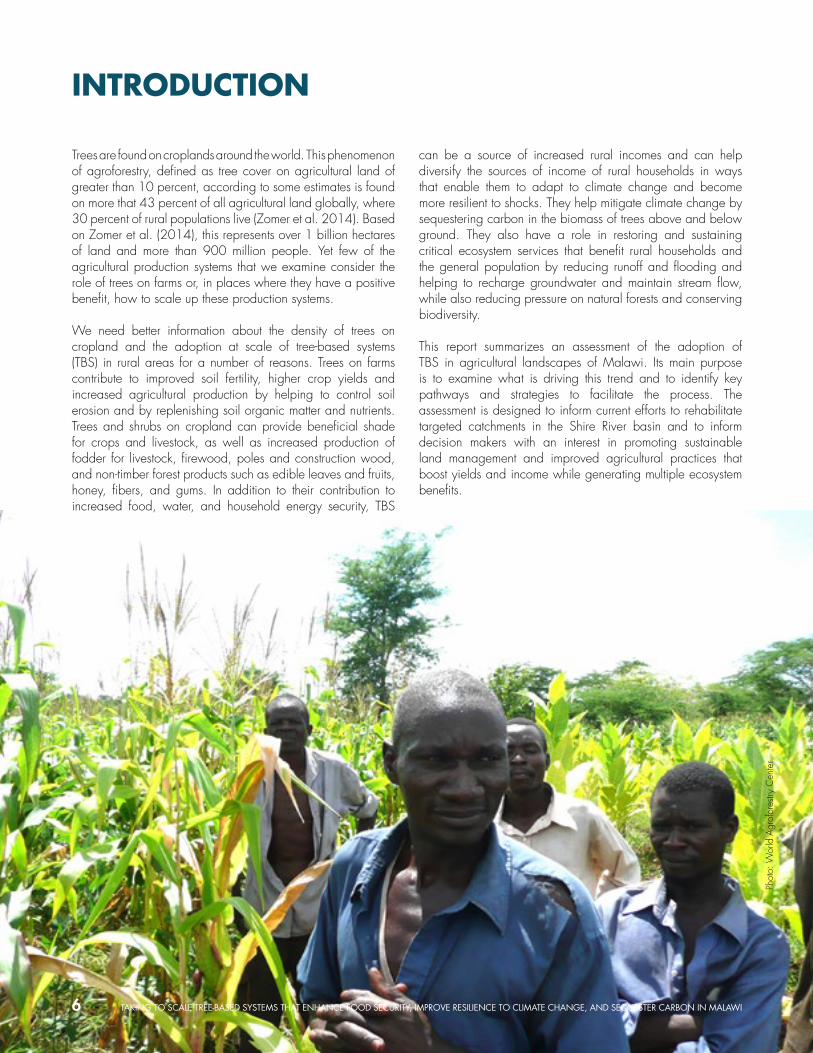
Trees are found on croplands around the world. This phenomenon of agroforestry, defined as tree cover on agricultural land of greater than 10 percent, according to some estimates is found on more that 43 percent of all agricultural land globally, where 30 percent of rural populations live (Zomer et al. 2014). Based on Zomer et al. (2014), this represents over 1 billion hectares of land and more than 900 million people. Yet few of the agricultural production systems that we examine consider the role of trees on farms or, in places where they have a positive benefit, how to scale up these production systems.
We need better information about the density of trees on cropland and the adoption at scale of tree-based systems (TBS) in rural areas for a number of reasons. Trees on farms contribute to improved soil fertility, higher crop yields and increased agricultural production by helping to control soil erosion and by replenishing soil organic matter and nutrients. Trees and shrubs on cropland can provide beneficial shade for crops and livestock, as well as increased production of fodder for livestock, firewood, poles and construction wood, and non-timber forest products such as edible leaves and fruits, honey, fibers, and gums. In addition to their contribution to increased food, water, and household energy security, TBS
can be a source of increased rural incomes and can help diversify the sources of income of rural households in ways that enable them to adapt to climate change and become more resilient to shocks. They help mitigate climate change by sequestering carbon in the biomass of trees above and below ground. They also have a role in restoring and sustaining critical ecosystem services that benefit rural households and the general population by reducing runoff and flooding and helping to recharge groundwater and maintain stream flow, while also reducing pressure on natural forests and conserving biodiversity.
This report summarizes an assessment of the adoption of TBS in agricultural landscapes of Malawi. Its main purpose is to examine what is driving this trend and to identify key pathways and strategies to facilitate the process. The assessment is designed to inform current efforts to rehabilitate targeted catchments in the Shire River basin and to inform decision makers with an interest in promoting sustainable land management and improved agricultural practices that boost yields and income while generating multiple ecosystem benefits.
Phot
o: W
orld
Agr
ofor
estry
Cen
ter

TAKING TO SCALE TREE-BASED SYSTEMS THAT ENHANCE FOOD SECURITY, IMPROVE RESILIENCE TO CLIMATE CHANGE, AND SEQUESTER CARBON IN MALAWI 7
BACKGROUND
Malawi is a small country with one of the lowest per capita incomes in the world. It has been characterized by alternating periods of good policy and policy reversal. The economy is only starting to be stabilized after reforms in 2012. The population was 16.4 million in 2013 (WDI 2015), making it one of the world’s most densely populated countries. Malawi is landlocked, has unexploited natural resources, and is highly vulnerable to natural shocks, being regularly subject to droughts and floods.
The majority of the poor in Malawi living in rural areas, making rural growth through agricultural transformation critical as Malawi strives to reduce the number of people who live in absolute poverty. Agriculture is the backbone of Malawi’s economy, accounting for about 85 percent of employment and about 80 percent of foreign exchange, about 60 percent of which comes from tobacco alone (World Bank 2012 – CAS). Smallholders are responsible for more than 80 percent of Malawi’s agricultural production, but production systems are predominantly subsistence farming. Investment in productivity enhancements is minimal.
Agriculture and maize are critically important to the Malawian economy and to the livelihoods of most people. Low agricultural and maize productivity, however, leads to the high incidence of poverty and to national and household food insecurity. A large number of poor people plant very small areas of land without using organic or inorganic fertilizers. This results in low yields, which in turn further reduces households’ abilities to buy inputs. Most farmers are also not able to buy inputs on credit because of the poorly developed credit market (Dorward and Chirwa 2011).
Increased use of inorganic fertilizers and of hybrid and open pollinated maize varieties are options for increasing maize productivity. However, farmers’ financial constraints have limited widespread use of fertilizer on maize (Dorward and Chirwa 2011). Malawi has a Farm Input Subsidy Program (FISP) that aims to reach 1.5 million beneficiaries. FISP has been credited with improving food security in Malawi. The scheme, however, is widely considered to be inefficient and a heavy burden on the national budget. It has had repeated expenditure overruns and poor value for money. In 2014/15, expenditure on FISP accounted for 10 percent of all expenditures under the national budget and 70 percent of the Ministry of Agriculture’s expenditures, exceeding initial budget allocations by 26 percent. Even with these investments in FISP, in 2015 Malawi recorded one of the worst harvests on record due to erratic rainfall. Reforms of the FISP have improved its effectiveness. Nevertheless, recent evidence indicates that the scheme has effectively served as an extremely expensive and inefficient
cash transfer program, and the poorest households—such as those with insufficient land or labor to use fertilizer effectively—would be best served through alternative social safety programs specifically tailored to meet their needs effectively.
Most rural households depend on rain-fed subsistence agriculture for their livelihood. The impacts of climate change and high population growth, as a result, have a high probability of making them more vulnerable. On average, each year 1.7 percent of gross domestic product is lost to droughts and floods and about 265,000 people fall into poverty (World Bank 2012). Resilience to disaster and climate risks is particularly important for the rural households who depend on the fragile natural resource base for their livelihoods (World Bank 2012). Climate shocks have direct impacts on agricultural productivity and rural vulnerability and wear away the productive assets of the poor (World Bank 2012).
Rural households also face challenges with access to energy. The national electrical energy system is accessible to less than 1 percent of the rural population and is considered to be unreliable. From 2008 statistics (cited in Gamula, Hui, and Peng 2013), about 90 percent of Malawi’s population uses wood for fuel and charcoal production, meeting 88.5 percent of the country’s energy needs. Despite biomass being the major energy source in the country, very little is being done to improve its supply and the efficiency of its use (Gamula, Hui, and Peng 2013).
At the same time, Malawi’s forest cover has been decreasing at an alarming rate. The growing population expands the land area under cultivation and exploits forests and woodlands for firewood and charcoal production. Deforestation, soil erosion, and sedimentation form the most serious threats to the environment and natural resource base in parts of the country like the Shire River Basin, which has seen an increased incidence of erosion, runoff, and flash floods. The high loads of sediment deposited in river beds, reservoirs, and floodplain wetlands are affecting irrigation canals, fisheries, and hydropower. Silt loads, sedimentation, eutrophication, biological contamination, and effluents are increasingly degrading water resources.
A recent study in Malawi by Johnson, Jacob, and Brown (2013) showed that net forest cover loss over time was associated with reduced dietary diversity and a lower consumption of vitamin A-rich foods among children. This point was reinforced by other scholars who similarly concluded that tree cover was more important than forest cover, as trees on farms are an important source of food, fiber, energy, and income, even to individuals who had access to a communal forest. The need

8 TAKING TO SCALE TREE-BASED SYSTEMS THAT ENHANCE FOOD SECURITY, IMPROVE RESILIENCE TO CLIMATE CHANGE, AND SEQUESTER CARBON IN MALAWI
for biomass (for energy and organic fertilizer) and for better management of watersheds points to the importance of tree based systems in Malawi to address agricultural and energy constraints in the short and medium term. TBS can also lower the cost of subsidy programs such as FISP and improve their reach. In Malawi, if FISP continues to reach approximately 1,544,400 households and they all adopt Gliricidia/maize intercropping systems, the potential total annual savings are estimated at $71 million. If annual FISP costs remain relatively constant at $141–151 million from 2010–13, these savings would nearly halve FISP costs.
Farmer-Managed Natural Regeneration
Tree-based systems will need to be an important part of any solution being considered to improve both food and energy security in Malawi. TBS are not new in Malawi or elsewhere. Little attention is paid to the growing trend of more farmers and communities choosing to increase the stock of trees on their farmlands and elsewhere. In Malawi, farmers receive support from a network of partners, many of whom were tapped for this study. The network includes institutions whose focus includes sustainable intensification of agricultural production for increased food security, erosion control and watershed
Box 1: Farmer-Managed Natural Regeneration
FMNR is a rapid, low-cost, easily replicated approach to restoring and improving agricultural, forested, and pasture lands. In Africa, some of the species that farmers grow and manage on their farms are a source of high-quality fodder (leaf and pods) for livestock (e.g., Faidherbia albida, Piliostigma thonningii, and Leucaena spp.). Trees on range or grazing lands provide shade for animals and reduce heat stress, thereby contributing to increased animal productivity. It has been shown that maize yields increase by up to 200% when grown on fields with trees, including Faidherbia (Garrity et al. 2010). Long-term studies have also shown that growing maize in landscapes with trees helps to stabilize yields (Sileshi, Debusho, and Akinnifesi 2012). Such systems help build resilience to the negative impacts of climate change and variability. Mature Faidherbia trees can sustain unfertilized maize yields of 2.5–4 metric tons per hectare, which is 200–400 percent more than the national average (see Figure) (Shitumbanuma 2012).
Mean yields of maize under and outside canopies of Faidherbia albida over four seasons in Zambia
(Source: Shitumbanuma 2012)
TAKING TO SCALE TREE-BASED SYSTEMS THAT ENHANCE FOOD SECURITY, IMPROVE RESILIENCE TO CLIMATE CHANGE, AND SEQUESTER CARBON IN MALAWI 9
management to stabilize hydropower production in the Shire River Basin, and sustainable landscape management for climate change adaptation and resilience. Partners and stakeholders include the Department of Forestry and the Department of Land Resources Conservation of the Government of Malawi, Total Land Care, and the United States Agency for International Development, as well as the Shire River Basin Management Program supported by the World Bank and others.Farmer-Managed Natural Regeneration
Growing and managing trees from natural regeneration—farmer-managed natural regeneration (FMNR)—is a viable and relatively inexpensive option for reforestation and for increasing the number of trees available in various landscapes compared with planting trees, especially in challenging environments such as drylands (see Box 1).
Farmers in Malawi have a long history of leaving desired trees on farmland and actively managing them (Dewees 1995). In Malawi, Rhoades (1995) found increases of 4–53 percent in maize yields under Faidherbia compared with systems without Faidherbia that have no tree cover. Another commonly found species in such systems is Gliricidia sepium. Gliricidia is an exotic nitrogen-fixing tree species that is recommended for intercropping with maize and managed as a coppice. Maize yields are consistently higher in years of normal, drought, and excessive rainfall in Gliricidia-maize intercrops with or without mineral fertilizers (Makumba et al. 2006). Soil moisture content in tree-based systems such as Gliricidia–maize intercropping
system has been shown to be higher compared with a sole maize cropping system (Makumba et al. 2006). Studies in Zambia and Malawi indicate that intercropping maize with trees can increase rainwater use efficiency and ensure stable yields over a longer period (Sileshi et al. 2011, 2012).
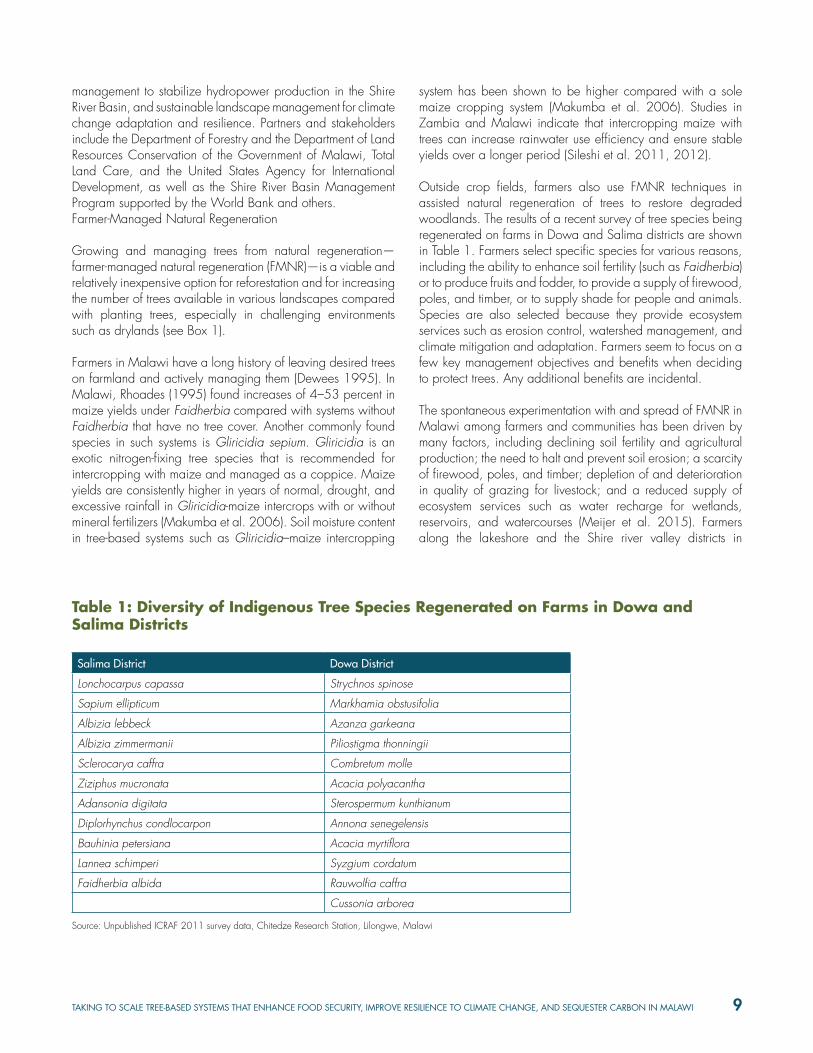
Outside crop fields, farmers also use FMNR techniques in assisted natural regeneration of trees to restore degraded woodlands. The results of a recent survey of tree species being regenerated on farms in Dowa and Salima districts are shown in Table 1. Farmers select specific species for various reasons, including the ability to enhance soil fertility (such as Faidherbia) or to produce fruits and fodder, to provide a supply of firewood, poles, and timber, or to supply shade for people and animals. Species are also selected because they provide ecosystem services such as erosion control, watershed management, and climate mitigation and adaptation. Farmers seem to focus on a few key management objectives and benefits when deciding to protect trees. Any additional benefits are incidental.
The spontaneous experimentation with and spread of FMNR in Malawi among farmers and communities has been driven by many factors, including declining soil fertility and agricultural production; the need to halt and prevent soil erosion; a scarcity of firewood, poles, and timber; depletion of and deterioration in quality of grazing for livestock; and a reduced supply of ecosystem services such as water recharge for wetlands, reservoirs, and watercourses (Meijer et al. 2015). Farmers along the lakeshore and the Shire river valley districts in
Table 1: Diversity of Indigenous Tree Species Regenerated on Farms in Dowa and Salima Districts
Salima District Dowa District
Lonchocarpus capassa Strychnos spinose
Sapium ellipticum Markhamia obstusifolia
Albizia lebbeck Azanza garkeana
Albizia zimmermanii Piliostigma thonningii
Sclerocarya caffra Combretum molle
Ziziphus mucronata Acacia polyacantha
Adansonia digitata Sterospermum kunthianum
Diplorhynchus condlocarpon Annona senegelensis
Bauhinia petersiana Acacia myrtiflora
Lannea schimperi Syzgium cordatum
Faidherbia albida Rauwolfia caffra
Cussonia arborea
Source: Unpublished ICRAF 2011 survey data, Chitedze Research Station, Lilongwe, Malawi
10 TAKING TO SCALE TREE-BASED SYSTEMS THAT ENHANCE FOOD SECURITY, IMPROVE RESILIENCE TO CLIMATE CHANGE, AND SEQUESTER CARBON IN MALAWI
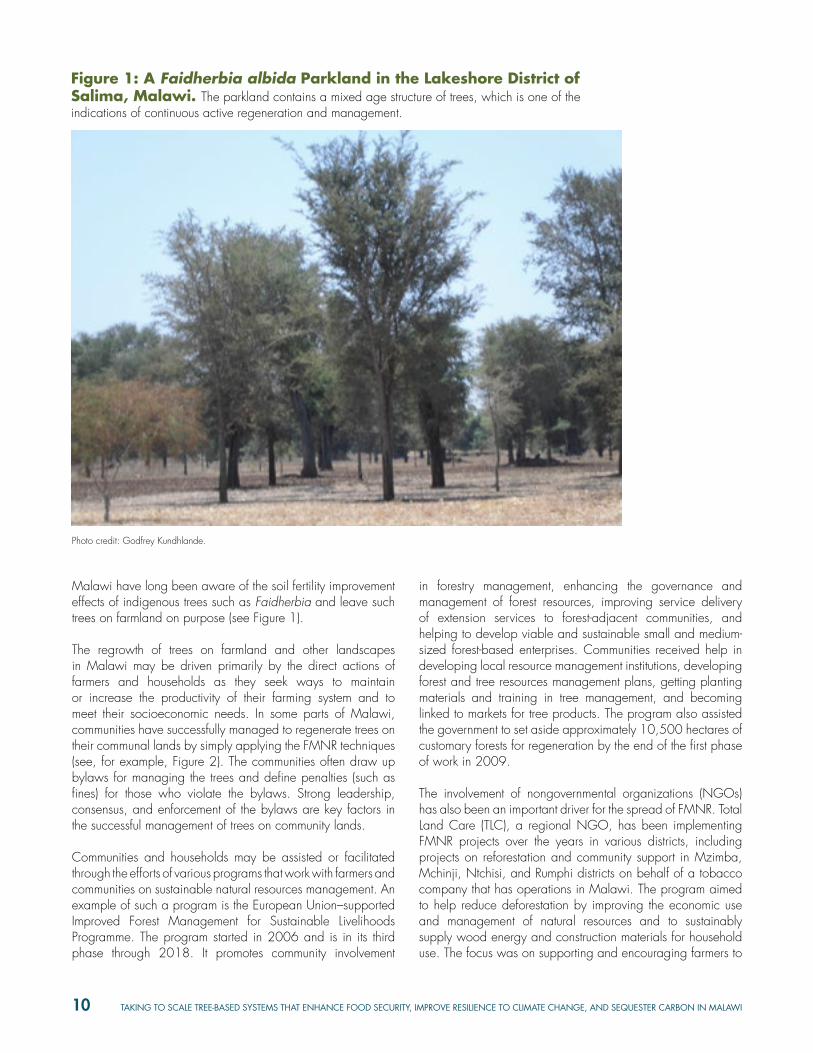
Malawi have long been aware of the soil fertility improvement effects of indigenous trees such as Faidherbia and leave such trees on farmland on purpose (see Figure 1).
The regrowth of trees on farmland and other landscapes in Malawi may be driven primarily by the direct actions of farmers and households as they seek ways to maintain or increase the productivity of their farming system and to meet their socioeconomic needs. In some parts of Malawi, communities have successfully managed to regenerate trees on their communal lands by simply applying the FMNR techniques (see, for example, Figure 2). The communities often draw up bylaws for managing the trees and define penalties (such as fines) for those who violate the bylaws. Strong leadership, consensus, and enforcement of the bylaws are key factors in the successful management of trees on community lands.
Communities and households may be assisted or facilitated through the efforts of various programs that work with farmers and communities on sustainable natural resources management. An example of such a program is the European Union–supported Improved Forest Management for Sustainable Livelihoods Programme. The program started in 2006 and is in its third phase through 2018. It promotes community involvement
in forestry management, enhancing the governance and management of forest resources, improving service delivery of extension services to forest-adjacent communities, and helping to develop viable and sustainable small and medium-sized forest-based enterprises. Communities received help in developing local resource management institutions, developing forest and tree resources management plans, getting planting materials and training in tree management, and becoming linked to markets for tree products. The program also assisted the government to set aside approximately 10,500 hectares of customary forests for regeneration by the end of the first phase of work in 2009.
The involvement of nongovernmental organizations (NGOs) has also been an important driver for the spread of FMNR. Total Land Care (TLC), a regional NGO, has been implementing FMNR projects over the years in various districts, including projects on reforestation and community support in Mzimba, Mchinji, Ntchisi, and Rumphi districts on behalf of a tobacco company that has operations in Malawi. The program aimed to help reduce deforestation by improving the economic use and management of natural resources and to sustainably supply wood energy and construction materials for household use. The focus was on supporting and encouraging farmers to
Figure 1: A Faidherbia albida Parkland in the Lakeshore District of Salima, Malawi. The parkland contains a mixed age structure of trees, which is one of the indications of continuous active regeneration and management.
Photo credit: Godfrey Kundhlande.
TAKING TO SCALE TREE-BASED SYSTEMS THAT ENHANCE FOOD SECURITY, IMPROVE RESILIENCE TO CLIMATE CHANGE, AND SEQUESTER CARBON IN MALAWI 11
regrow trees on farms and other landscapes. TLC continues to include FMNR in its sustainable natural resources management initiatives in areas where it works in Malawi. World Vision Malawi has also been an active promoter of FMNR. World Vision has conducted trainings for farmers on how to manage regrowth of natural trees on farms and on community land.
Community Benefits of FMNR
While the motivation for protecting trees on community lands is the need to increase the supply of wood for firewood, poles, and timber, communities often realize later that a number of other benefits are associated with the increase in the number of trees on their lands. For example, the trees provide an environment for growing mushrooms and wild vegetables, products that contribute to improving the diversity of local diets and can also be sold to earn extra income. The supply of indigenous fruits such as Uapaca kirkiana also increases, contributing to improving nutrition, as such fruits are very high in vitamins and often form the main source for micronutrients among rural dwellers. Uapaca kirkiana also contributes to household income, as this is one of the most commonly marketed indigenous fruit in Malawi when in season.
FMNR on farmland has the potential to supply wood energy and charcoal sustainably, thereby reducing pressure on forests and woodlands through increased wood supply on farms (De Leeuw et al. 2014). The increasing scarcity of fuelwood over time is generating incentives for farmers to plant and protect trees on farms. Today, most farmers across the country are managing tree regrowth on their farms, which provide a source of wood fuel, poles, and timber (see Figures 3, 4, and 5). Farmers use the firewood harvested from their fields to meet their household’s energy demands, to sell for cash income, or sometimes to exchange for other goods and services. This is a major benefit in a country where women spend nearly 2.5 hours per week looking for firewood and, in some cases, risk being abused by forest guards (The World’s Women 2010).
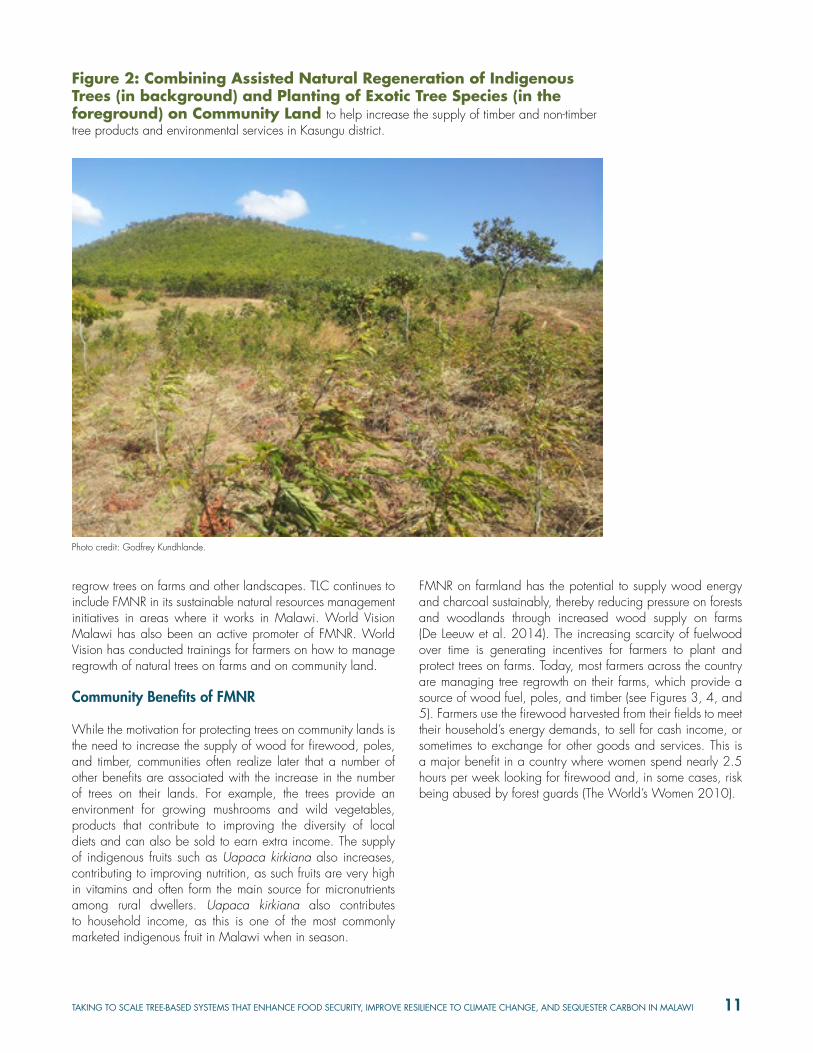
Figure 2: Combining Assisted Natural Regeneration of Indigenous Trees (in background) and Planting of Exotic Tree Species (in the foreground) on Community Land to help increase the supply of timber and non-timber tree products and environmental services in Kasungu district.
Photo credit: Godfrey Kundhlande.
12 TAKING TO SCALE TREE-BASED SYSTEMS THAT ENHANCE FOOD SECURITY, IMPROVE RESILIENCE TO CLIMATE CHANGE, AND SEQUESTER CARBON IN MALAWI
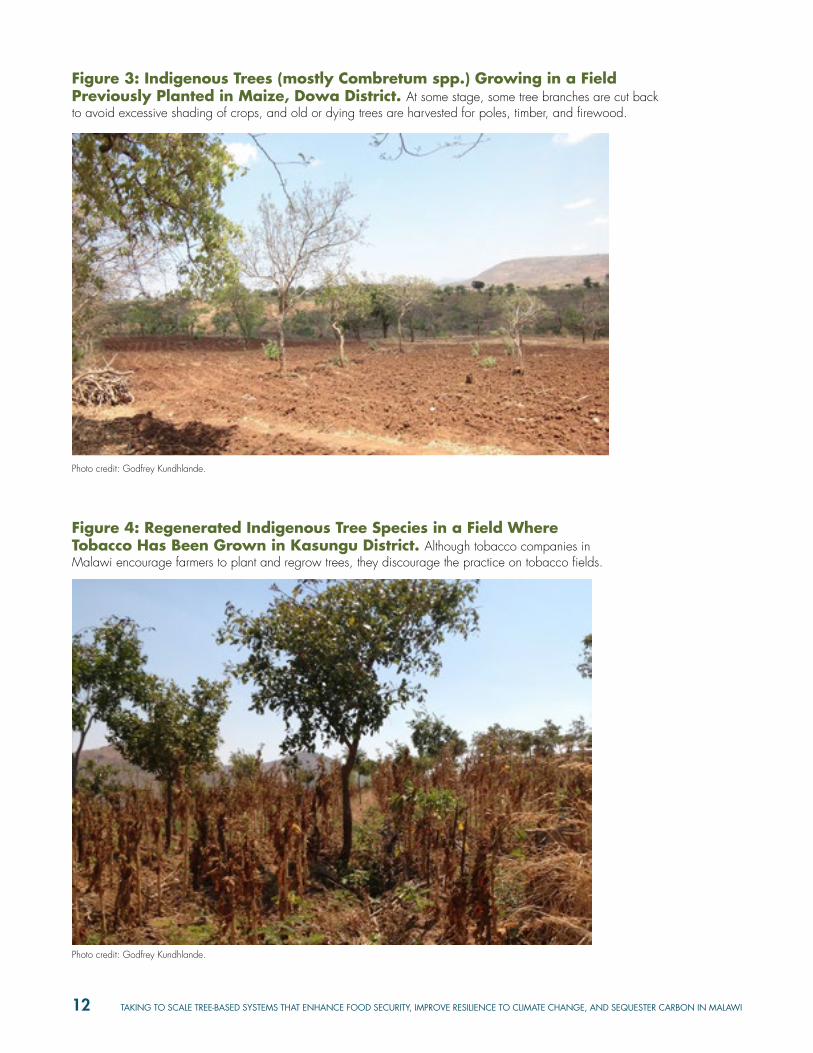
Figure 3: Indigenous Trees (mostly Combretum spp.) Growing in a Field Previously Planted in Maize, Dowa District. At some stage, some tree branches are cut back to avoid excessive shading of crops, and old or dying trees are harvested for poles, timber, and firewood.
Figure 4: Regenerated Indigenous Tree Species in a Field Where Tobacco Has Been Grown in Kasungu District. Although tobacco companies in Malawi encourage farmers to plant and regrow trees, they discourage the practice on tobacco fields.
Photo credit: Godfrey Kundhlande.
Photo credit: Godfrey Kundhlande.
TAKING TO SCALE TREE-BASED SYSTEMS THAT ENHANCE FOOD SECURITY, IMPROVE RESILIENCE TO CLIMATE CHANGE, AND SEQUESTER CARBON IN MALAWI 13
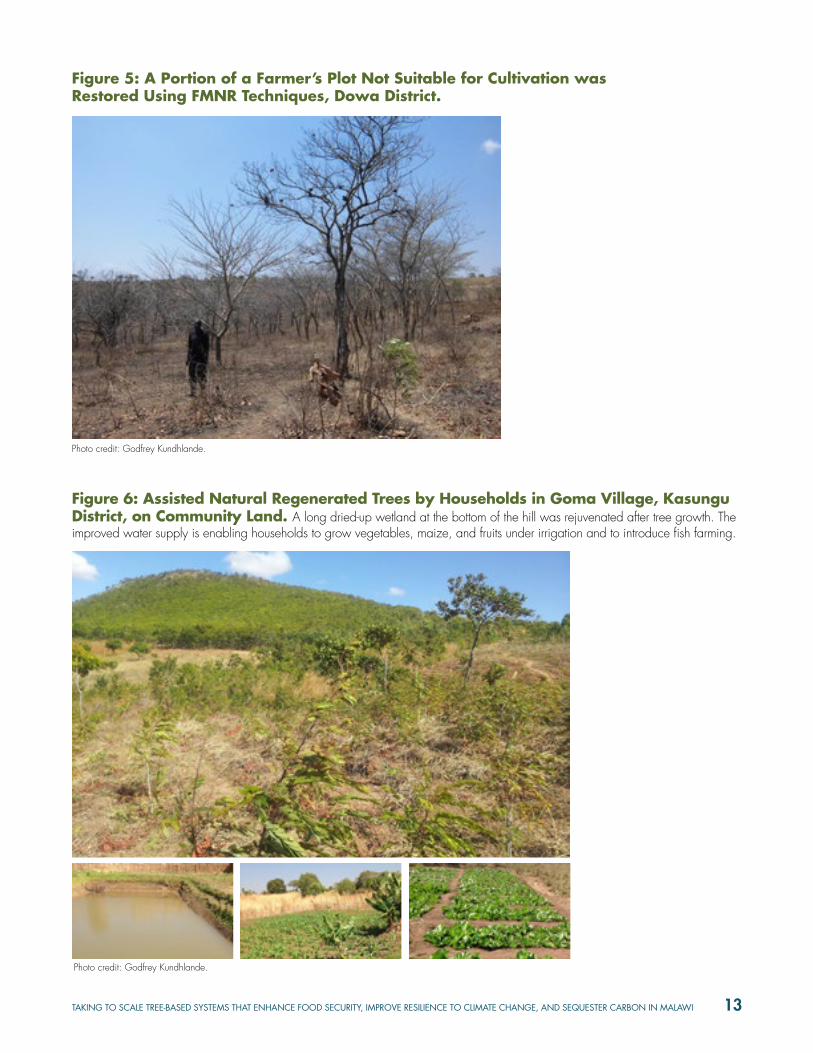
Figure 5: A Portion of a Farmer’s Plot Not Suitable for Cultivation was Restored Using FMNR Techniques, Dowa District.
Figure 6: Assisted Natural Regenerated Trees by Households in Goma Village, Kasungu District, on Community Land. A long dried-up wetland at the bottom of the hill was rejuvenated after tree growth. The improved water supply is enabling households to grow vegetables, maize, and fruits under irrigation and to introduce fish farming.
Photo credit: Godfrey Kundhlande.
Photo credit: Godfrey Kundhlande.
14 TAKING TO SCALE TREE-BASED SYSTEMS THAT ENHANCE FOOD SECURITY, IMPROVE RESILIENCE TO CLIMATE CHANGE, AND SEQUESTER CARBON IN MALAWI
Visual evidence (see Figure 6) reinforces commonly cited evidence from the literature that where communities protect trees in watershed areas, this helps to increase water infiltration and reduce erosion, leading to the rejuvenation of watercourses, reservoirs, and wetlands, and to raise the water table. This increases water supply for household use and for use in other productive activities such as micro-irrigation schemes and gardening. The improved water availability enables production of food crops, allowing for a variety of vegetables and fruits to be grown. In some areas, communities take advantage of the availability of year-round water to engage in fish farming, which provides both an important source of protein and a non-traditional source of income, especially for communities that are far from a lake.
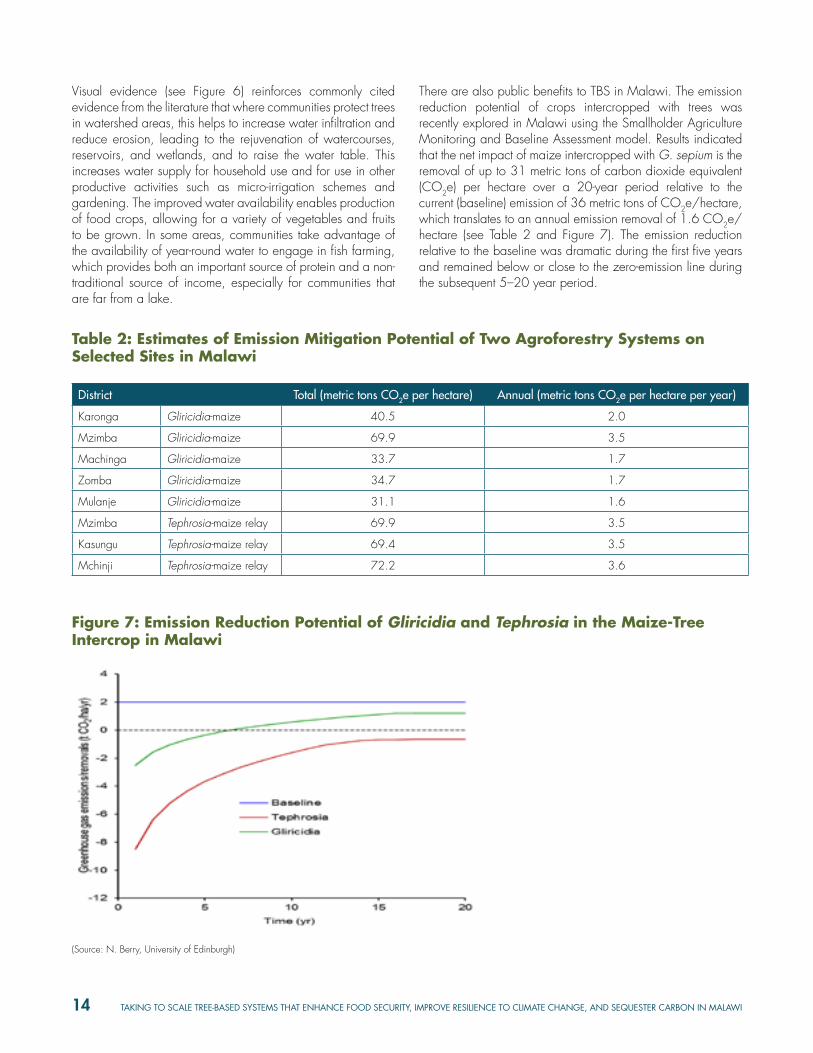
There are also public benefits to TBS in Malawi. The emission reduction potential of crops intercropped with trees was recently explored in Malawi using the Smallholder Agriculture Monitoring and Baseline Assessment model. Results indicated that the net impact of maize intercropped with G. sepium is the removal of up to 31 metric tons of carbon dioxide equivalent (CO2e) per hectare over a 20-year period relative to the current (baseline) emission of 36 metric tons of CO2e/hectare, which translates to an annual emission removal of 1.6 CO2e/hectare (see Table 2 and Figure 7). The emission reduction relative to the baseline was dramatic during the first five years and remained below or close to the zero-emission line during the subsequent 5–20 year period.
Table 2: Estimates of Emission Mitigation Potential of Two Agroforestry Systems on Selected Sites in Malawi
District Total (metric tons CO2e per hectare) Annual (metric tons CO2e per hectare per year)
Karonga Gliricidia-maize 40.5 2.0
Mzimba Gliricidia-maize 69.9 3.5
Machinga Gliricidia-maize 33.7 1.7
Zomba Gliricidia-maize 34.7 1.7
Mulanje Gliricidia-maize 31.1 1.6
Mzimba Tephrosia-maize relay 69.9 3.5
Kasungu Tephrosia-maize relay 69.4 3.5
Mchinji Tephrosia-maize relay 72.2 3.6
Figure 7: Emission Reduction Potential of Gliricidia and Tephrosia in the Maize-Tree Intercrop in Malawi
(Source: N. Berry, University of Edinburgh)

TAKING TO SCALE TREE-BASED SYSTEMS THAT ENHANCE FOOD SECURITY, IMPROVE RESILIENCE TO CLIMATE CHANGE, AND SEQUESTER CARBON IN MALAWI 15
JUSTIFICATION FOR THE STUDY AND HYPOTHESIS
The uptake of FMNR across Malawi varies from place to place. Anecdotal evidence from local NGOs, extension agents, and others indicates that farmers have adopted TBS in many areas of Malawi, primarily through the practice of FMNR; however, no organization has systematically documented the extent of adoption or closely examined what is driving the change. No systematic study has mapped the area of Malawi covered by TBS. The area of cropland with regenerated trees as a result of management actions of farmers (FMNR) in Malawi is also not known, as records of this approach to land management have not been systematically collected.
It is important to improve understanding of the key factors that drive the adoption of TBS at scale in Malawi in order to increase the effectiveness of interventions designed to help poor rural farmers with food and energy security. The benefits of extending and accelerating the adoption of TBS across the landscapes of Malawi, especially in the Shire River Basin, can also be positive for the country more broadly. By knowing more about the current extent of TBS, areas with relatively low
tree cover on farms can be targeted in order to extend the benefits of TBS to additional households. With an improved understanding of the key benefits associated with tree cover on farms, interventions can be designed to leverage interest in the types of benefits that motivate the increased adoption of TBS. Interventions can also provide support in critical areas to overcome observed barriers to the further adoption of TBS, including improved delivery of extension services and training, increased access to markets for TBS products, clarification of the rights to trees, increased security of land tenure, and strengthened local bylaws or other institutional support for decentralized natural resource management.
Drawing on existing studies and frameworks on adoption at scale, it is hypothesized that the major factors affecting the adoption of TBS at scale include the role of strong local bylaws governing the protection and use of trees across the landscape, energy demand, and access to extension services and other support.
Photo: World Agroforestry Center
16 TAKING TO SCALE TREE-BASED SYSTEMS THAT ENHANCE FOOD SECURITY, IMPROVE RESILIENCE TO CLIMATE CHANGE, AND SEQUESTER CARBON IN MALAWI
METHODOLOGY
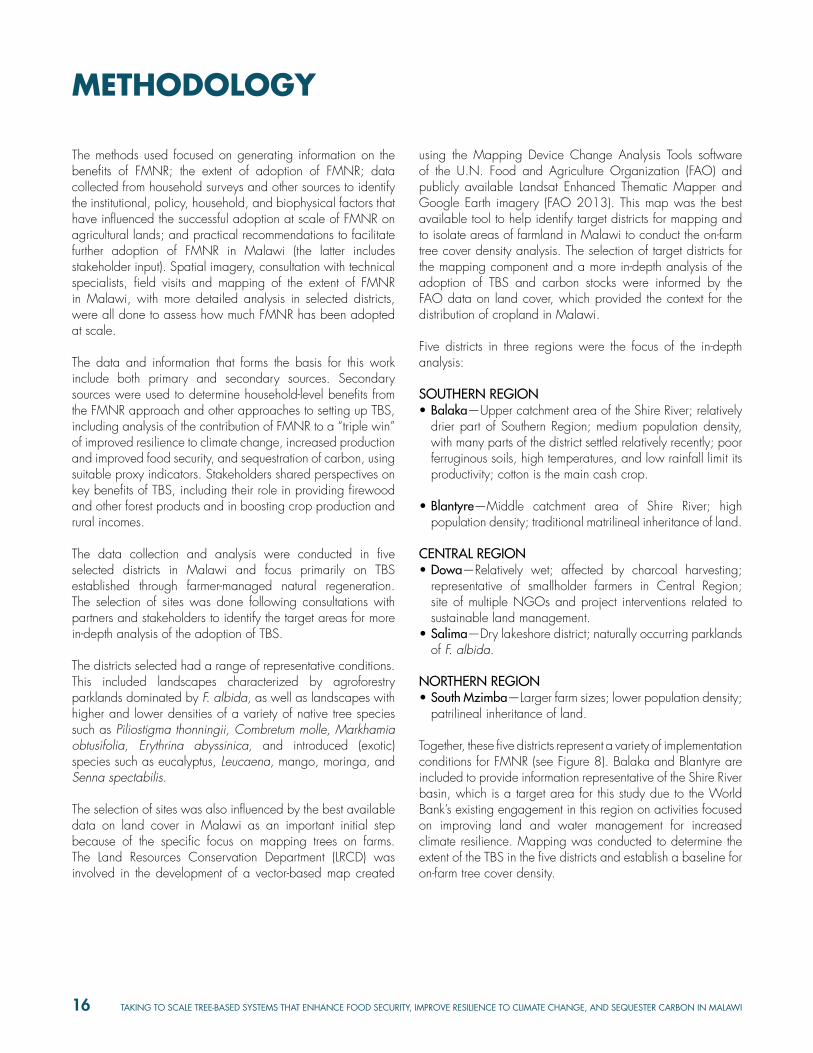
The methods used focused on generating information on the benefits of FMNR; the extent of adoption of FMNR; data collected from household surveys and other sources to identify the institutional, policy, household, and biophysical factors that have influenced the successful adoption at scale of FMNR on agricultural lands; and practical recommendations to facilitate further adoption of FMNR in Malawi (the latter includes stakeholder input). Spatial imagery, consultation with technical specialists, field visits and mapping of the extent of FMNR in Malawi, with more detailed analysis in selected districts, were all done to assess how much FMNR has been adopted at scale.
The data and information that forms the basis for this work include both primary and secondary sources. Secondary sources were used to determine household-level benefits from the FMNR approach and other approaches to setting up TBS, including analysis of the contribution of FMNR to a “triple win” of improved resilience to climate change, increased production and improved food security, and sequestration of carbon, using suitable proxy indicators. Stakeholders shared perspectives on key benefits of TBS, including their role in providing firewood and other forest products and in boosting crop production and rural incomes.
The data collection and analysis were conducted in five selected districts in Malawi and focus primarily on TBS established through farmer-managed natural regeneration. The selection of sites was done following consultations with partners and stakeholders to identify the target areas for more in-depth analysis of the adoption of TBS.
The districts selected had a range of representative conditions. This included landscapes characterized by agroforestry parklands dominated by F. albida, as well as landscapes with higher and lower densities of a variety of native tree species such as Piliostigma thonningii, Combretum molle, Markhamia obtusifolia, Erythrina abyssinica, and introduced (exotic) species such as eucalyptus, Leucaena, mango, moringa, and Senna spectabilis.
The selection of sites was also influenced by the best available data on land cover in Malawi as an important initial step because of the specific focus on mapping trees on farms. The Land Resources Conservation Department (LRCD) was involved in the development of a vector-based map created
using the Mapping Device Change Analysis Tools software of the U.N. Food and Agriculture Organization (FAO) and publicly available Landsat Enhanced Thematic Mapper and Google Earth imagery (FAO 2013). This map was the best available tool to help identify target districts for mapping and to isolate areas of farmland in Malawi to conduct the on-farm tree cover density analysis. The selection of target districts for the mapping component and a more in-depth analysis of the adoption of TBS and carbon stocks were informed by the FAO data on land cover, which provided the context for the distribution of cropland in Malawi.
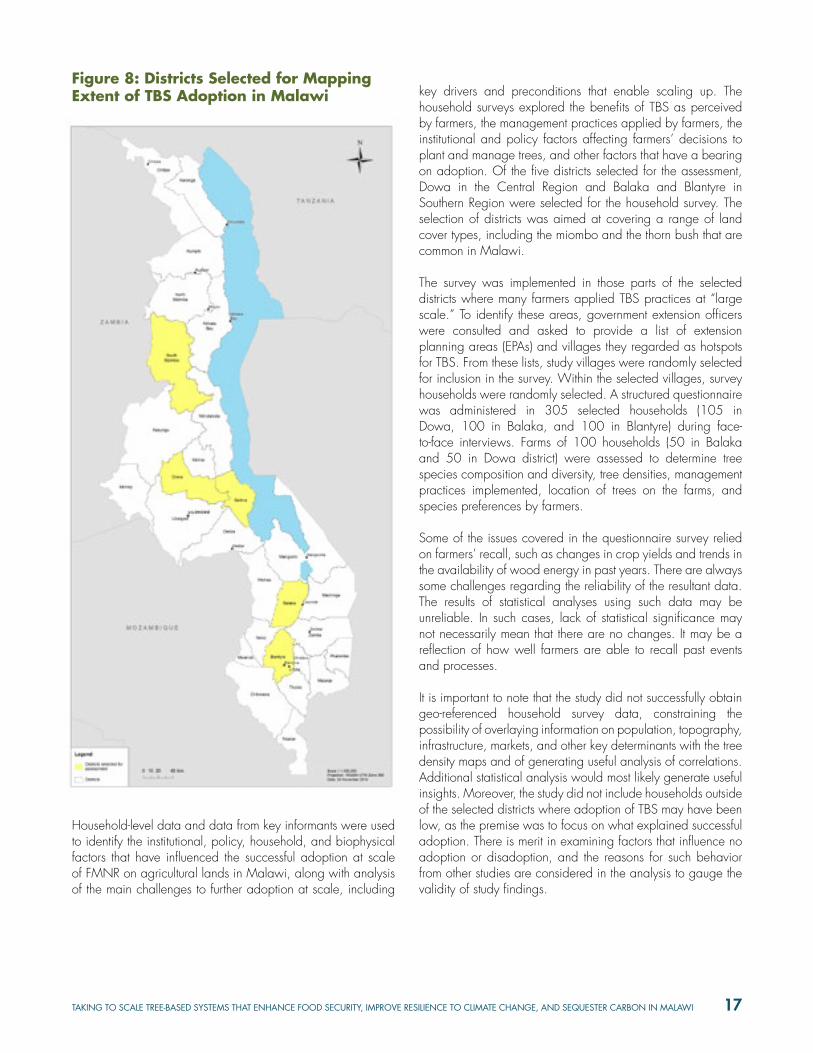
Five districts in three regions were the focus of the in-depth analysis:
SOUTHERN REGION• Balaka—Upper catchment area of the Shire River; relatively
drier part of Southern Region; medium population density, with many parts of the district settled relatively recently; poor ferruginous soils, high temperatures, and low rainfall limit its productivity; cotton is the main cash crop.
• Blantyre—Middle catchment area of Shire River; high population density; traditional matrilineal inheritance of land.
CENTRAL REGION• Dowa—Relatively wet; affected by charcoal harvesting;
representative of smallholder farmers in Central Region; site of multiple NGOs and project interventions related to sustainable land management.
• Salima—Dry lakeshore district; naturally occurring parklands of F. albida.
NORTHERN REGION• South Mzimba—Larger farm sizes; lower population density;
patrilineal inheritance of land.
Together, these five districts represent a variety of implementation conditions for FMNR (see Figure 8). Balaka and Blantyre are included to provide information representative of the Shire River basin, which is a target area for this study due to the World Bank’s existing engagement in this region on activities focused on improving land and water management for increased climate resilience. Mapping was conducted to determine the extent of the TBS in the five districts and establish a baseline for on-farm tree cover density.
TAKING TO SCALE TREE-BASED SYSTEMS THAT ENHANCE FOOD SECURITY, IMPROVE RESILIENCE TO CLIMATE CHANGE, AND SEQUESTER CARBON IN MALAWI 17
Figure 8: Districts Selected for Mapping Extent of TBS Adoption in Malawi
Household-level data and data from key informants were used to identify the institutional, policy, household, and biophysical factors that have influenced the successful adoption at scale of FMNR on agricultural lands in Malawi, along with analysis of the main challenges to further adoption at scale, including
key drivers and preconditions that enable scaling up. The household surveys explored the benefits of TBS as perceived by farmers, the management practices applied by farmers, the institutional and policy factors affecting farmers’ decisions to plant and manage trees, and other factors that have a bearing on adoption. Of the five districts selected for the assessment, Dowa in the Central Region and Balaka and Blantyre in Southern Region were selected for the household survey. The selection of districts was aimed at covering a range of land cover types, including the miombo and the thorn bush that are common in Malawi.
The survey was implemented in those parts of the selected districts where many farmers applied TBS practices at “large scale.” To identify these areas, government extension officers were consulted and asked to provide a list of extension planning areas (EPAs) and villages they regarded as hotspots for TBS. From these lists, study villages were randomly selected for inclusion in the survey. Within the selected villages, survey households were randomly selected. A structured questionnaire was administered in 305 selected households (105 in Dowa, 100 in Balaka, and 100 in Blantyre) during face-to-face interviews. Farms of 100 households (50 in Balaka and 50 in Dowa district) were assessed to determine tree species composition and diversity, tree densities, management practices implemented, location of trees on the farms, and species preferences by farmers.
Some of the issues covered in the questionnaire survey relied on farmers’ recall, such as changes in crop yields and trends in the availability of wood energy in past years. There are always some challenges regarding the reliability of the resultant data. The results of statistical analyses using such data may be unreliable. In such cases, lack of statistical significance may not necessarily mean that there are no changes. It may be a reflection of how well farmers are able to recall past events and processes.
It is important to note that the study did not successfully obtain geo-referenced household survey data, constraining the possibility of overlaying information on population, topography, infrastructure, markets, and other key determinants with the tree density maps and of generating useful analysis of correlations. Additional statistical analysis would most likely generate useful insights. Moreover, the study did not include households outside of the selected districts where adoption of TBS may have been low, as the premise was to focus on what explained successful adoption. There is merit in examining factors that influence no adoption or disadoption, and the reasons for such behavior from other studies are considered in the analysis to gauge the validity of study findings.
18 TAKING TO SCALE TREE-BASED SYSTEMS THAT ENHANCE FOOD SECURITY, IMPROVE RESILIENCE TO CLIMATE CHANGE, AND SEQUESTER CARBON IN MALAWI
FINDINGS AND RESULTS
2. Estimated as 20 percent of the total arable land. Lakeshore and upper Shire constitute 8 percent of the total land area. 3. Forestry Research Institute of Malawi, P. O. Box 270, Zomba, Malawi.
Importance of TBS in Malawi
TBS in Malawi include one or more of the following: farm woodlots, farmer-managed natural regeneration, planted agroforests (G. sepium, F. albida, Acacia angustissima, Leucaena spp.), and improved short-rotation tree fallows. The Faidherbia belt, an FMNR agroforestry systems centered on F. albida, covers the lakeshore belt, upper Shire Valley, and the Bolero area in Rumphi district in northern Malawi. It is estimated that there are more than 155,000 hectares of crop fields under Faidherbia parklands2 in Malawi in these three areas. Outside crop fields, there are 31,784 hectares of village forestry areas (out of the 891,300 hectares total customary land) that have been registered and are at various stages of assisted natural regeneration (Dr. Tembo Chanyenga,3 personal communication).
Trees on crop fields including nitrogen-fixing trees have been shown to offer yield increases of between 50 and 300 percent in associated cereal crops (Sileshi et al. 2010), providing increased food security and helping build resilience to climate change through improvement of soil fertility and moisture retention and moderation of temperature. Trees used for soil fertility improvement in Malawi are divided into three categories (full canopy, coppicing, and non-coppicing) having different growing duration and potential for biomass production. Full canopy tree species, such as F. albida, are managed at 10–15 percent crown cover, and these trees survive for many years. Coppicing trees, such as G. sepium, A. angustissima, Leucaena spp., S. spectabilis, and Senna siamea are used in permanent intercrops and are repeatedly cut back to avoid or minimize competition with the main crop, and their nitrogen-rich leaves are incorporated in the soil as green manure. Non-
coppicing trees/ shrubs are used in improved fallow rotations, and these include Sesbania sesban, Tephrosia vogelli, and Tephrosia candida, which are managed in a two-year cycle.
In addition to soil fertility enhancement and resilience building, trees on farms have gained attention in recent years because they can store significant quantities of carbon simultaneously in both aboveground and belowground biomass, thus contributing to climate mitigation (Oeba et al 2012). Faidherbia can provide several metric tons per hectare per year of CO2 storage, as well as providing other valued environmental services. Coppicing trees also provide large amounts of carbon storage in the soil, while the coppiced wood is used for cooking and heating, thus contributing to reduced deforestation. Non-coppicing trees, although managed in one- or two-year cycles, also give significant carbon storage and reduced deforestation benefits as they contribute to soil organic carbon buildup through leaf litter that is incorporated into the soil and dead roots.
Tree-based ecosystem approaches have been widely promoted in Malawi as an option to help increase agricultural production among smallholder farmers who cannot afford to buy chemical fertilizers. Maize yields under Faidherbia have been shown to be up to three times higher than yields without the trees or external inputs ((Sileshi et al. 2010). With the current size of the Faidherbia belt in Malawi, it can be inferred that their contribution to food security is significant. With maize yields in the smallholder sector without external inputs averaging 1 metric ton per hectare, nationally Faidherbia parklands enable an additional 150,000–300,000 metric tons of maize to be produced, thereby improving the food security of families farming under the systems and generating surpluses for sale. For farmers using Faidherbia systems and other dispersed systematic
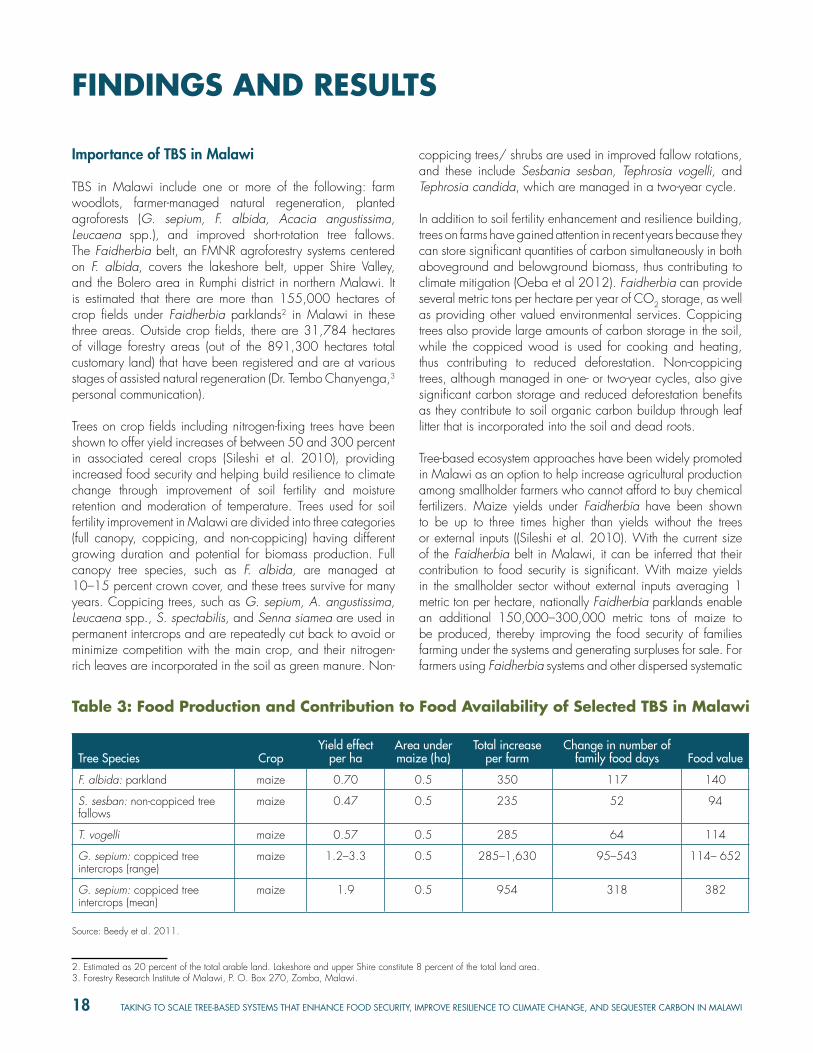
Table 3: Food Production and Contribution to Food Availability of Selected TBS in Malawi
Tree Species CropYield effect
per haArea under maize (ha)
Total increase per farm
Change in number of family food days Food value
F. albida: parkland maize 0.70 0.5 350 117 140
S. sesban: non-coppiced tree fallows
maize 0.47 0.5 235 52 94
T. vogelli maize 0.57 0.5 285 64 114
G. sepium: coppiced tree intercrops (range)
maize 1.2–3.3 0.5 285–1,630 95–543 114– 652
G. sepium: coppiced tree intercrops (mean)
maize 1.9 0.5 954 318 382
Source: Beedy et al. 2011.
TAKING TO SCALE TREE-BASED SYSTEMS THAT ENHANCE FOOD SECURITY, IMPROVE RESILIENCE TO CLIMATE CHANGE, AND SEQUESTER CARBON IN MALAWI 19
interplanting of trees (coppiced and non-coppiced) on their fields, the increased maize production per hectare due to soil fertility and increased moisture availability translates to between 50 and 540 days of maize food for an average household of six (see Table 3) (Beedy et al. 2011). A study using actual farmer data in Zambia for agroforestry systems similar to those used in Malawi found that with an average agroforestry plot of 0.20 hectares, improved tree-based fallows, for example, could generate between 57 and 114 extra person-days of maize consumption per year (Ajayi 2007).
Mapping the Extent of On-farm Tree Cover Density
The extent of adoption of FMNR practices in the targeted districts was assessed by using a Tree Cover Density Mapping Tool developed by the U.S. Geological Survey as an add-on to ArcGIS software. (See Annex 1.) By applying a grid-based sampling of tree density visible on high-resolution imagery, it was possible to count the number of the trees touching the calibrating grid for each sample plot of 1 hectare. Satellite imagery from Google Earth and Bing from 2013 and 2014 was used in the analysis. The following forest categorization was used to classify tree cover density:
0% no tree cover 1–5% very low density 6–10% low density 11–15% medium density >15% high density
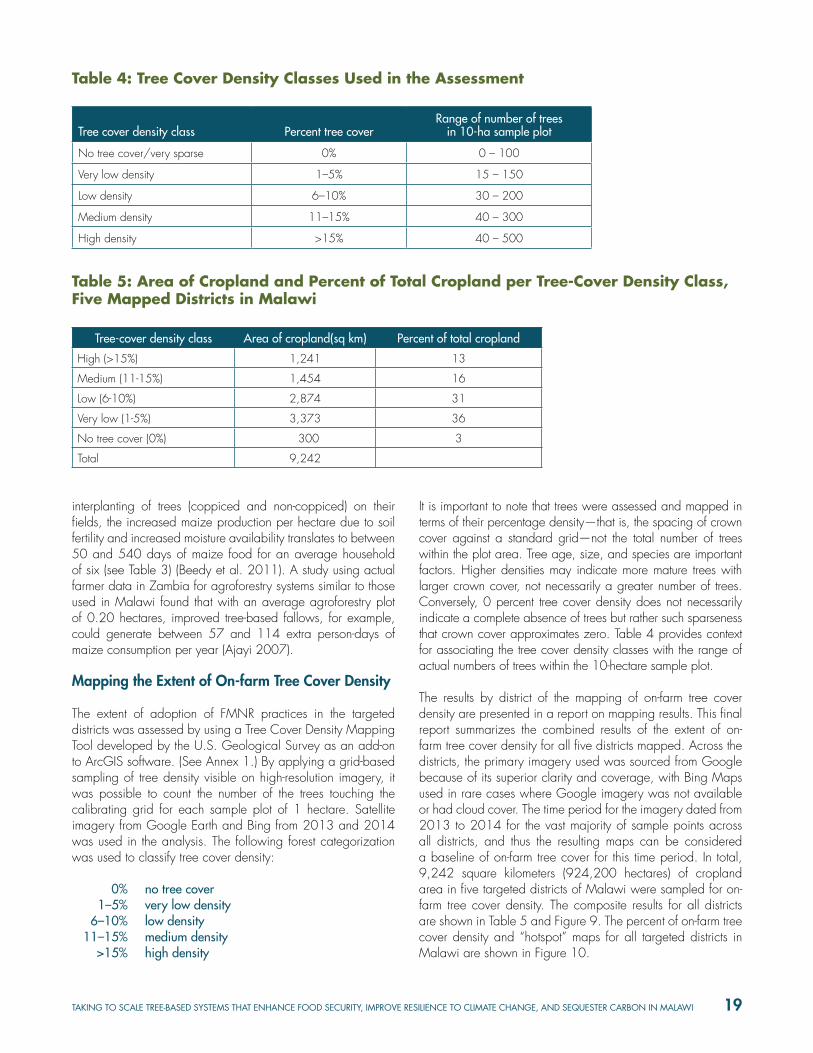
It is important to note that trees were assessed and mapped in terms of their percentage density—that is, the spacing of crown cover against a standard grid—not the total number of trees within the plot area. Tree age, size, and species are important factors. Higher densities may indicate more mature trees with larger crown cover, not necessarily a greater number of trees. Conversely, 0 percent tree cover density does not necessarily indicate a complete absence of trees but rather such sparseness that crown cover approximates zero. Table 4 provides context for associating the tree cover density classes with the range of actual numbers of trees within the 10-hectare sample plot.
The results by district of the mapping of on-farm tree cover density are presented in a report on mapping results. This final report summarizes the combined results of the extent of on-farm tree cover density for all five districts mapped. Across the districts, the primary imagery used was sourced from Google because of its superior clarity and coverage, with Bing Maps used in rare cases where Google imagery was not available or had cloud cover. The time period for the imagery dated from 2013 to 2014 for the vast majority of sample points across all districts, and thus the resulting maps can be considered a baseline of on-farm tree cover for this time period. In total, 9,242 square kilometers (924,200 hectares) of cropland area in five targeted districts of Malawi were sampled for on-farm tree cover density. The composite results for all districts are shown in Table 5 and Figure 9. The percent of on-farm tree cover density and “hotspot” maps for all targeted districts in Malawi are shown in Figure 10.
Table 4: Tree Cover Density Classes Used in the Assessment
Tree cover density class Percent tree coverRange of number of trees
in 10-ha sample plot
No tree cover/very sparse 0% 0 – 100
Very low density 1–5% 15 – 150
Low density 6–10% 30 – 200
Medium density 11–15% 40 – 300
High density >15% 40 – 500
Table 5: Area of Cropland and Percent of Total Cropland per Tree-Cover Density Class, Five Mapped Districts in Malawi
Tree-cover density class Area of cropland(sq km) Percent of total cropland
High (>15%) 1,241 13
Medium (11-15%) 1,454 16
Low (6-10%) 2,874 31
Very low (1-5%) 3,373 36
No tree cover (0%) 300 3
Total 9,242
20 TAKING TO SCALE TREE-BASED SYSTEMS THAT ENHANCE FOOD SECURITY, IMPROVE RESILIENCE TO CLIMATE CHANGE, AND SEQUESTER CARBON IN MALAWI
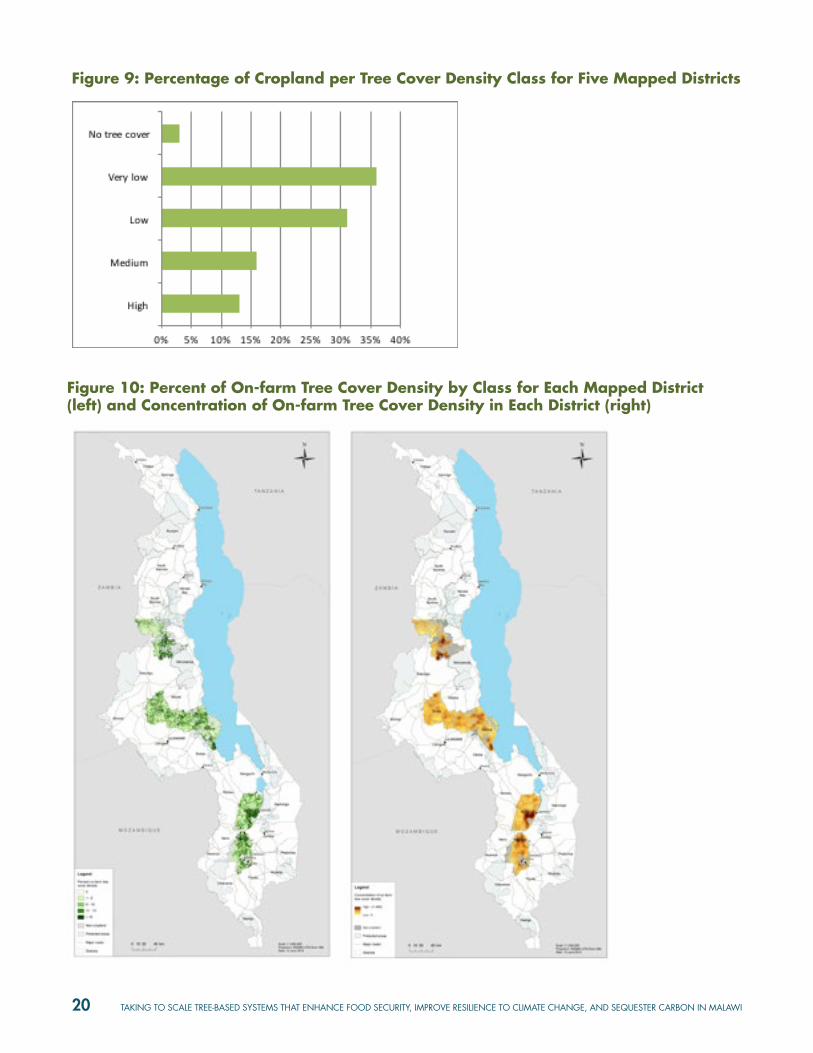
Figure 9: Percentage of Cropland per Tree Cover Density Class for Five Mapped Districts
Figure 10: Percent of On-farm Tree Cover Density by Class for Each Mapped District (left) and Concentration of On-farm Tree Cover Density in Each District (right)
TAKING TO SCALE TREE-BASED SYSTEMS THAT ENHANCE FOOD SECURITY, IMPROVE RESILIENCE TO CLIMATE CHANGE, AND SEQUESTER CARBON IN MALAWI 21
Across all mapped districts, 97 percent of the cropland area sampled showed that farmers were managing at least a few trees on their farms, ranging from very low (1–5 percent) to high (over 15 percent) densities of tree cover on cropland. An estimated 29 percent of cropland in the five districts (amounting to 2,695 square kilometers or 269,500 hectares) have greater than 10 percent tree cover or medium-to-high on-farm tree cover densities. The majority of the sampled cropland area (67 percent amounting to 6,247 square kilometers or 624,700 hectares) has very low and low density of tree cover (between 1 and 10 percent).
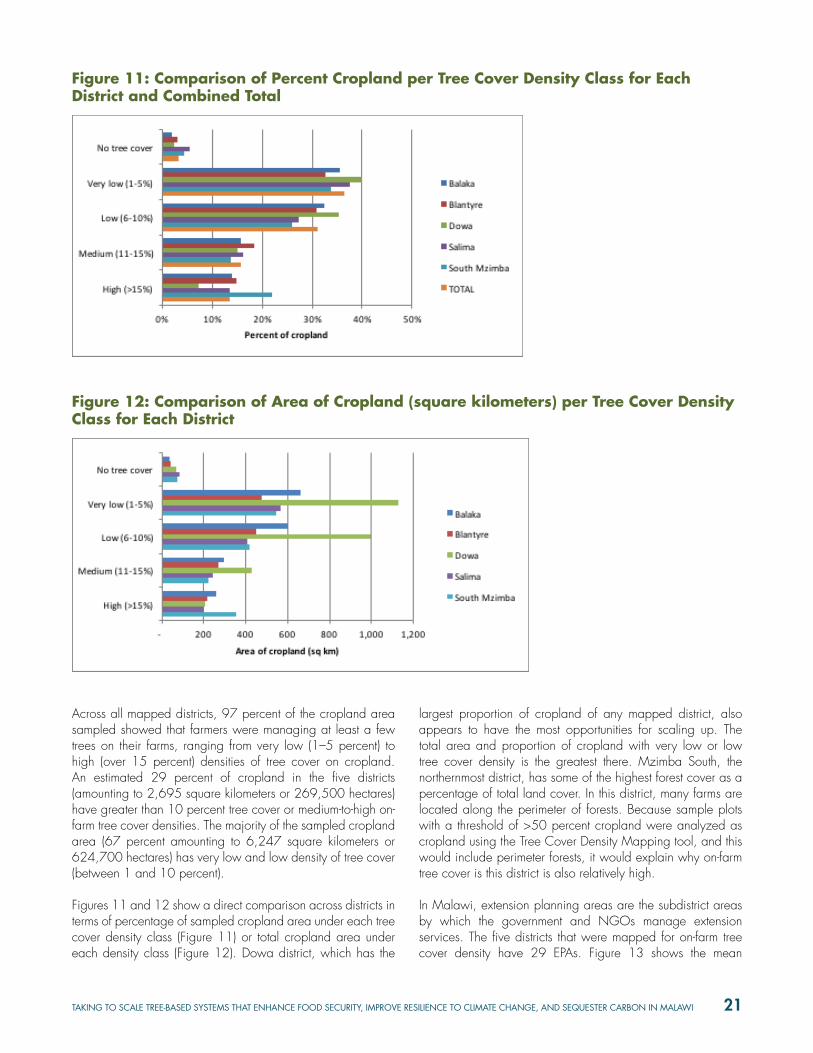
Figures 11 and 12 show a direct comparison across districts in terms of percentage of sampled cropland area under each tree cover density class (Figure 11) or total cropland area under each density class (Figure 12). Dowa district, which has the
largest proportion of cropland of any mapped district, also appears to have the most opportunities for scaling up. The total area and proportion of cropland with very low or low tree cover density is the greatest there. Mzimba South, the northernmost district, has some of the highest forest cover as a percentage of total land cover. In this district, many farms are located along the perimeter of forests. Because sample plots with a threshold of >50 percent cropland were analyzed as cropland using the Tree Cover Density Mapping tool, and this would include perimeter forests, it would explain why on-farm tree cover is this district is also relatively high.
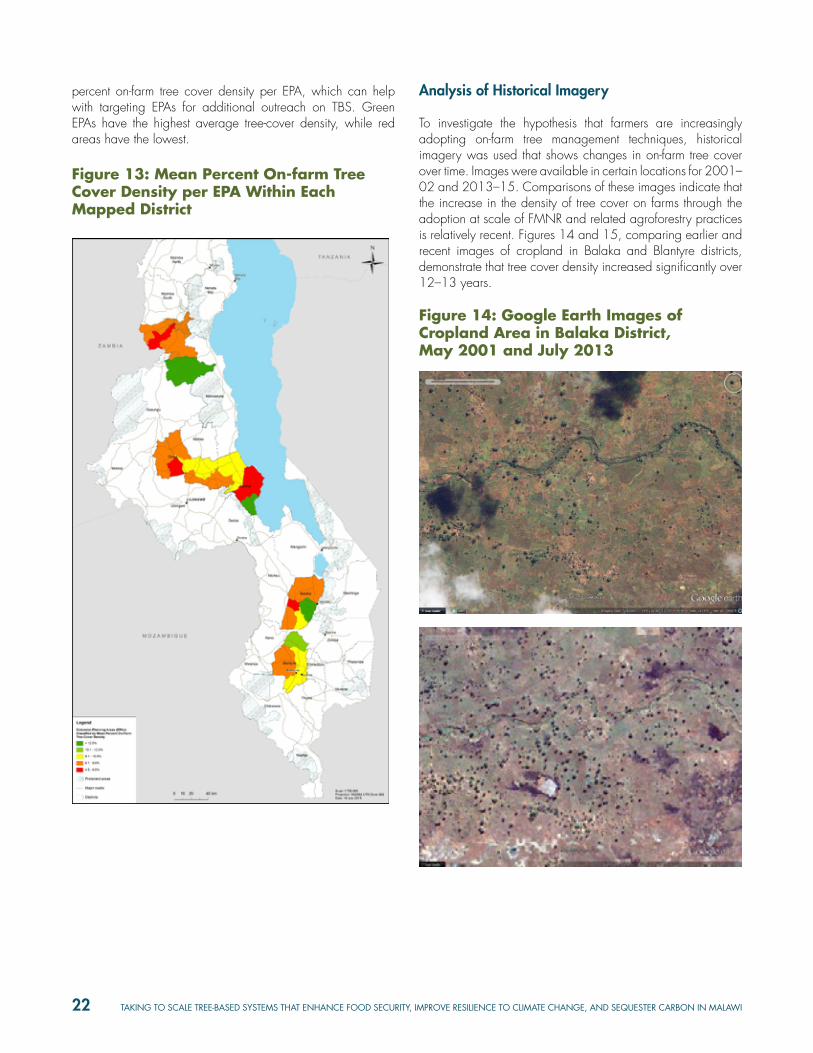
In Malawi, extension planning areas are the subdistrict areas by which the government and NGOs manage extension services. The five districts that were mapped for on-farm tree cover density have 29 EPAs. Figure 13 shows the mean
Figure 11: Comparison of Percent Cropland per Tree Cover Density Class for Each District and Combined Total
Figure 12: Comparison of Area of Cropland (square kilometers) per Tree Cover Density Class for Each District
22 TAKING TO SCALE TREE-BASED SYSTEMS THAT ENHANCE FOOD SECURITY, IMPROVE RESILIENCE TO CLIMATE CHANGE, AND SEQUESTER CARBON IN MALAWI
percent on-farm tree cover density per EPA, which can help with targeting EPAs for additional outreach on TBS. Green EPAs have the highest average tree-cover density, while red areas have the lowest.
Analysis of Historical Imagery
To investigate the hypothesis that farmers are increasingly adopting on-farm tree management techniques, historical imagery was used that shows changes in on-farm tree cover over time. Images were available in certain locations for 2001–02 and 2013–15. Comparisons of these images indicate that the increase in the density of tree cover on farms through the adoption at scale of FMNR and related agroforestry practices is relatively recent. Figures 14 and 15, comparing earlier and recent images of cropland in Balaka and Blantyre districts, demonstrate that tree cover density increased significantly over 12–13 years.
Figure 14: Google Earth Images of Cropland Area in Balaka District, May 2001 and July 2013
July 2013
Figure 13: Mean Percent On-farm Tree Cover Density per EPA Within Each Mapped District
TAKING TO SCALE TREE-BASED SYSTEMS THAT ENHANCE FOOD SECURITY, IMPROVE RESILIENCE TO CLIMATE CHANGE, AND SEQUESTER CARBON IN MALAWI 23
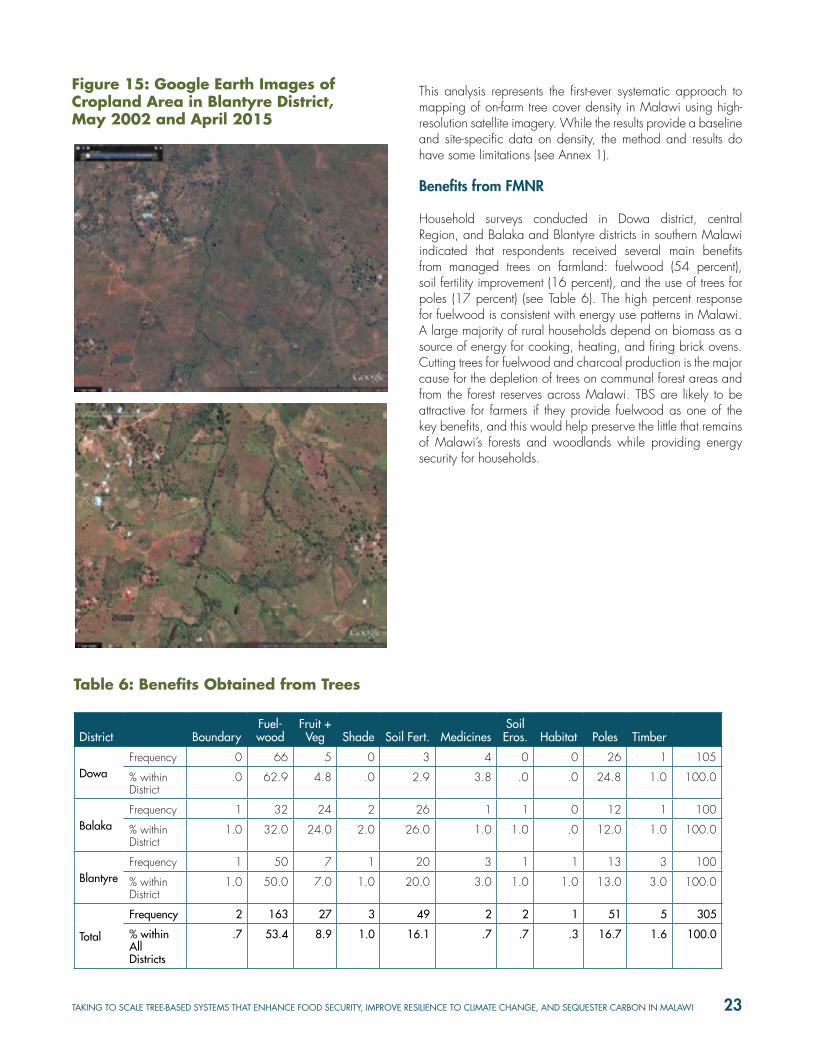
Figure 15: Google Earth Images of Cropland Area in Blantyre District, May 2002 and April 2015
This analysis represents the first-ever systematic approach to mapping of on-farm tree cover density in Malawi using high-resolution satellite imagery. While the results provide a baseline and site-specific data on density, the method and results do have some limitations (see Annex 1).
Benefits from FMNR
Household surveys conducted in Dowa district, central Region, and Balaka and Blantyre districts in southern Malawi indicated that respondents received several main benefits from managed trees on farmland: fuelwood (54 percent), soil fertility improvement (16 percent), and the use of trees for poles (17 percent) (see Table 6). The high percent response for fuelwood is consistent with energy use patterns in Malawi. A large majority of rural households depend on biomass as a source of energy for cooking, heating, and firing brick ovens. Cutting trees for fuelwood and charcoal production is the major cause for the depletion of trees on communal forest areas and from the forest reserves across Malawi. TBS are likely to be attractive for farmers if they provide fuelwood as one of the key benefits, and this would help preserve the little that remains of Malawi’s forests and woodlands while providing energy security for households.
Analysis of Historical Imagery
To investigate the hypothesis that farmers are increasingly adopting on-farm tree management techniques, historical imagery was used that shows changes in on-farm tree cover over time. Images were available in certain locations for 2001–02 and 2013–15. Comparisons of these images indicate that the increase in the density of tree cover on farms through the adoption at scale of FMNR and related agroforestry practices is relatively recent. Figures 14 and 15, comparing earlier and recent images of cropland in Balaka and Blantyre districts, demonstrate that tree cover density increased significantly over 12–13 years.
Figure 14: Google Earth Images of Cropland Area in Balaka District, May 2001 and July 2013
July 2013
Table 6: Benefits Obtained from Trees
District BoundaryFuel-wood
Fruit + Veg Shade Soil Fert. Medicines
Soil Eros. Habitat Poles Timber
DowaFrequency 0 66 5 0 3 4 0 0 26 1 105
% within District
.0 62.9 4.8 .0 2.9 3.8 .0 .0 24.8 1.0 100.0
BalakaFrequency 1 32 24 2 26 1 1 0 12 1 100
% within District
1.0 32.0 24.0 2.0 26.0 1.0 1.0 .0 12.0 1.0 100.0
BlantyreFrequency 1 50 7 1 20 3 1 1 13 3 100
% within District
1.0 50.0 7.0 1.0 20.0 3.0 1.0 1.0 13.0 3.0 100.0
Total
Frequency 2 163 27 3 49 2 2 1 51 5 305
% within All Districts
.7 53.4 8.9 1.0 16.1 .7 .7 .3 16.7 1.6 100.0
24 TAKING TO SCALE TREE-BASED SYSTEMS THAT ENHANCE FOOD SECURITY, IMPROVE RESILIENCE TO CLIMATE CHANGE, AND SEQUESTER CARBON IN MALAWI
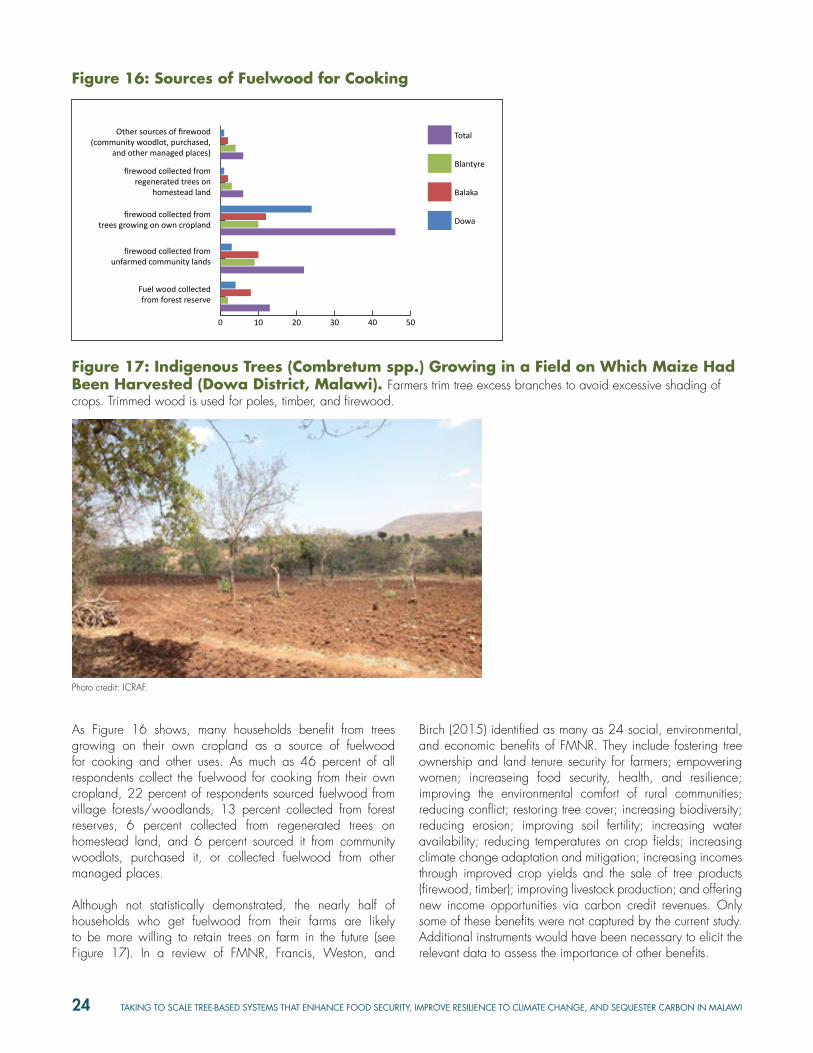
As Figure 16 shows, many households benefit from trees growing on their own cropland as a source of fuelwood for cooking and other uses. As much as 46 percent of all respondents collect the fuelwood for cooking from their own cropland, 22 percent of respondents sourced fuelwood from village forests/woodlands, 13 percent collected from forest reserves, 6 percent collected from regenerated trees on homestead land, and 6 percent sourced it from community woodlots, purchased it, or collected fuelwood from other managed places. Although not statistically demonstrated, the nearly half of households who get fuelwood from their farms are likely to be more willing to retain trees on farm in the future (see Figure 17). In a review of FMNR, Francis, Weston, and
Birch (2015) identified as many as 24 social, environmental, and economic benefits of FMNR. They include fostering tree ownership and land tenure security for farmers; empowering women; increaseing food security, health, and resilience; improving the environmental comfort of rural communities; reducing conflict; restoring tree cover; increasing biodiversity; reducing erosion; improving soil fertility; increasing water availability; reducing temperatures on crop fields; increasing climate change adaptation and mitigation; increasing incomes through improved crop yields and the sale of tree products (firewood, timber); improving livestock production; and offering new income opportunities via carbon credit revenues. Only some of these benefits were not captured by the current study. Additional instruments would have been necessary to elicit the relevant data to assess the importance of other benefits.
0 10 20 30 40 50
Total
Blantyre
Balaka
Dowa
Fuel wood collectedfrom forest reserve
firewood collected fromunfarmed community lands
firewood collected fromtrees growing on own cropland
firewood collected fromregenerated trees on
homestead land
Other sources of firewood(community woodlot, purchased,
and other managed places)
Figure 16: Sources of Fuelwood for Cooking
Figure 17: Indigenous Trees (Combretum spp.) Growing in a Field on Which Maize Had Been Harvested (Dowa District, Malawi). Farmers trim tree excess branches to avoid excessive shading of crops. Trimmed wood is used for poles, timber, and firewood.
Photo credit: ICRAF.

TAKING TO SCALE TREE-BASED SYSTEMS THAT ENHANCE FOOD SECURITY, IMPROVE RESILIENCE TO CLIMATE CHANGE, AND SEQUESTER CARBON IN MALAWI 25
The pattern for persons devoting most time collecting fuelwood was the same across the three districts. Men spent less time than women did, and the amount of time changed over the last five years: 26 percent said a lot more time is required now than five years ago for collecting fuelwood; 34 percent indicated more time is required; 8 percent said about the same amount of time; 15 percent said less time is required; and 16 percent indicated that much less time is now required. The depletion of trees on communal forest areas was cited by 68 percent of respondents as the main reason for the change in time needed to collect firewood. On average, men spent 2.4 hours per week collecting fuelwood and women spent 3.4 hours.
Most respondents (88 percent) in the study areas indicated that their household’s food security status over the last five years had changed. Of those who indicated a change in household food security, 68 percent stated that it had deteriorated, while 23 percent indicated that it had improved. The deterioration in food security was linked to drought, land degradation, inadequate inputs, and floods. Those whose food security had improved attributed the change to good farming practices, including the use of TBS. The impact of weather/ climate risks was evident in the 2014/2015 rain season, as districts such as Balaka experienced severe flooding. There is scope to encourage household to integrate trees in their farming systems, as this can provide options for reducing the negative impacts of climatic and other risks. There is growing recognition of the significant role that tree-based agroforestry systems can play in helping to build resilience to climate change among smallholder farmers, and the Malawi government and its partners have shown interest in supporting efforts to promote FMNR and other agroforestry systems.
There were also changes in average crop production over the last five years. Ninety percent of the respondents in three areas surveyed indicated change in average crop production in this time period, while 9 percent indicated no change. Some 67 percent stated that average crop production had decreased, 21 percent said it had increased, while 3 percent indicated that crop production had remained for five years. A common reason for decline in production was depletion of soil fertility. Because many respondents were aware of the soil fertility enhancement potential of trees, it should be possible to support scaling-up of tree-based systems.
Current Status of Soil Fertility and Management
Most respondents (90 percent) had the perception that soils in their fields were of poor fertility, while 6 percent said soil fertility of their fields was average or adequate (6 percent) and 3 percent perceived their fields as very fertile. The soil fertility management and conservation practices that farmers have adopted on their farms include applying mineral fertilizer, farm manure, and green manure; planting agroforestry trees; incorporating crop residue on the field, and managing naturally regenerated trees (see Figure 18). The use of inorganic fertilizer for soil fertility in Malawi increased in the past decade due to the government’s Farm Input Support Programme, which provides heavily subsided fertilizer to more than a third of the farmers across the country (farmers who are beneficiaries of the program pay less than 5 percent of the cost of fertilizer). Farmers do recognize the potential of trees, especially agroforestry fertilizer trees, to help in their soil fertility management strategies (see Figure 19).
Figure 18: Faidherbia albida in a Field Where the Farmer Practices Conservation Agriculture

26 TAKING TO SCALE TREE-BASED SYSTEMS THAT ENHANCE FOOD SECURITY, IMPROVE RESILIENCE TO CLIMATE CHANGE, AND SEQUESTER CARBON IN MALAWI
Across the three districts studied, about 10 percent of respondents deliberately retained or planted trees on the crop fields to improved soil fertility and help maintain integrity of the land. This general knowledge of the tree-based innovations for soil fertility provides a strong basis for government and NGOs to include these in their agricultural development programs.
Trend in Availability of Tree Resources and Products over the Last 10 Years
The majority of respondents (65 percent) indicated that the availability of tree resources and tree products in their community over the past 10 years had decreased, while 30 percent perceived an increase, and 4 percent thought it had not changed. And 62 percent reported that the amount of trees
in the landscapes in their community had not increased. It is important to note that this response was not directed at trees on farms per se. Some respondents reported that an increase in the density of trees in areas adjacent to forests and woodlands (14 percent), on croplands/cultivated fields (13 percent), around homesteads (6 percent), and in private woodlots (5 percent) (see Figure 20). The decline in tree resources and products from the communal forest areas was attributed to opening up land for cropping and cutting down trees for farm use as well and for charcoal production.
Public Benefits from TBS: Carbon Sequestration
To understand carbon storage better across the various land uses in Malawi, a baseline carbon stock assessment was done
Figure 19: Farmers’ Soil Fertility Management Strategies
Figure 20: Farmers’ Perceptions of Areas in Landscape Experiencing Increasing Tree Density
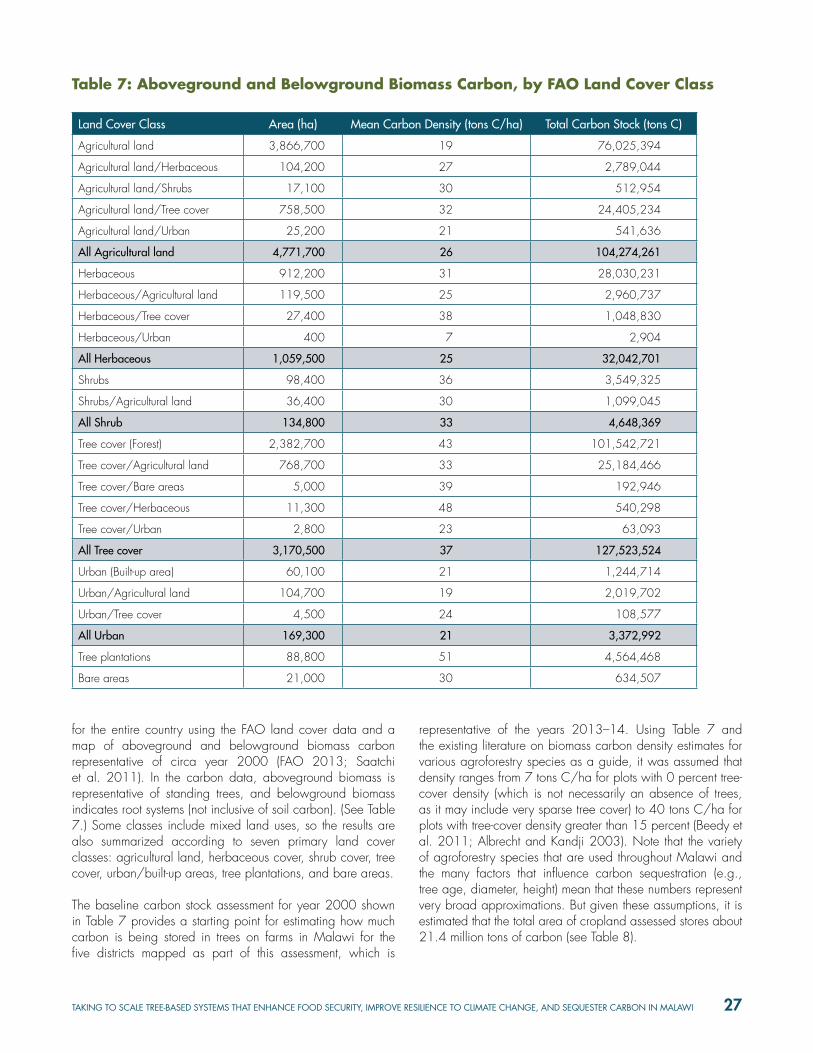
TAKING TO SCALE TREE-BASED SYSTEMS THAT ENHANCE FOOD SECURITY, IMPROVE RESILIENCE TO CLIMATE CHANGE, AND SEQUESTER CARBON IN MALAWI 27
for the entire country using the FAO land cover data and a map of aboveground and belowground biomass carbon representative of circa year 2000 (FAO 2013; Saatchi et al. 2011). In the carbon data, aboveground biomass is representative of standing trees, and belowground biomass indicates root systems (not inclusive of soil carbon). (See Table 7.) Some classes include mixed land uses, so the results are also summarized according to seven primary land cover classes: agricultural land, herbaceous cover, shrub cover, tree cover, urban/built-up areas, tree plantations, and bare areas.
The baseline carbon stock assessment for year 2000 shown in Table 7 provides a starting point for estimating how much carbon is being stored in trees on farms in Malawi for the five districts mapped as part of this assessment, which is
representative of the years 2013–14. Using Table 7 and the existing literature on biomass carbon density estimates for various agroforestry species as a guide, it was assumed that density ranges from 7 tons C/ha for plots with 0 percent tree-cover density (which is not necessarily an absence of trees, as it may include very sparse tree cover) to 40 tons C/ha for plots with tree-cover density greater than 15 percent (Beedy et al. 2011; Albrecht and Kandji 2003). Note that the variety of agroforestry species that are used throughout Malawi and the many factors that influence carbon sequestration (e.g., tree age, diameter, height) mean that these numbers represent very broad approximations. But given these assumptions, it is estimated that the total area of cropland assessed stores about 21.4 million tons of carbon (see Table 8).
Table 7: Aboveground and Belowground Biomass Carbon, by FAO Land Cover Class
Land Cover Class Area (ha) Mean Carbon Density (tons C/ha) Total Carbon Stock (tons C)
Agricultural land 3,866,700 19 76,025,394
Agricultural land/Herbaceous 104,200 27 2,789,044
Agricultural land/Shrubs 17,100 30 512,954
Agricultural land/Tree cover 758,500 32 24,405,234
Agricultural land/Urban 25,200 21 541,636
All Agricultural land 4,771,700 26 104,274,261
Herbaceous 912,200 31 28,030,231
Herbaceous/Agricultural land 119,500 25 2,960,737
Herbaceous/Tree cover 27,400 38 1,048,830
Herbaceous/Urban 400 7 2,904
All Herbaceous 1,059,500 25 32,042,701
Shrubs 98,400 36 3,549,325
Shrubs/Agricultural land 36,400 30 1,099,045
All Shrub 134,800 33 4,648,369
Tree cover (Forest) 2,382,700 43 101,542,721
Tree cover/Agricultural land 768,700 33 25,184,466
Tree cover/Bare areas 5,000 39 192,946
Tree cover/Herbaceous 11,300 48 540,298
Tree cover/Urban 2,800 23 63,093
All Tree cover 3,170,500 37 127,523,524
Urban (Built-up area) 60,100 21 1,244,714
Urban/Agricultural land 104,700 19 2,019,702
Urban/Tree cover 4,500 24 108,577
All Urban 169,300 21 3,372,992
Tree plantations 88,800 51 4,564,468
Bare areas 21,000 30 634,507

28 TAKING TO SCALE TREE-BASED SYSTEMS THAT ENHANCE FOOD SECURITY, IMPROVE RESILIENCE TO CLIMATE CHANGE, AND SEQUESTER CARBON IN MALAWI
Using the results from Tables 7 and 8, some basic assumptions can be made about how much carbon was stored on farms across all of Malawi in 2013–14. Assuming that the same proportions of tree cover density classes across all 4.8 million hectares of cropland, then Malawian farms stored about 110.2 million tons of carbon. If all farms across Malawi were to adopt TBS at a density of at least 15 percent, then they could store 190.9 million tons of carbon (an increase of 73 percent), which is equivalent to 700.5 million tons of carbon dioxide.
Evidence of Key Factors Driving Adoption of FMNR
For the sample households, the most frequent reasons given by farmers for increasing the amount of trees on farms were the need for more fuelwood (39 percent) and management of soil fertility (25 percent). (See Table 9.) Some 45 percent of farmers in Dowa reported that the need to increase supply of fuelwood was the main motivation for protecting and managing trees on crop fields. In Balaka, improving soil fertility (33 percent), fuelwood supply (29 percent), and rehabilitating
degraded land (21 percent) were reported as the main reasons. For Blantyre, increasing the supply of fuelwood (43 percent), improving soil fertility (22 percent), and restoration of degraded land (21 percent) were cited. The households currently practicing TBS mentioned that the benefits from increased tree stocks on farms include increased availability of fuelwood, improved soil fertility, higher crop yields, fodder for livestock, and increased availability of poles for construction. These are mostly direct benefits to the households. Other benefits such as carbon sequestration are more public benefits.
Respondents indicated that the main advantages of growing trees from natural regeneration compared with planted trees were that there was no cost of raising and transplanting seedlings (40 percent) and the trees had a better chance of survival. Many farmers in Malawi are very poor, scarcely affording fertilizer (even with the subsidy) and improved seed. These farmers generally cannot afford to purchase agroforestry tree seed and seedlings. Moreover, planted trees require further investment of labor watering and management. Many rural households send away some members to find wage labor,
Table 8: Estimate of Total Carbon Sequestered on Farms According to Tree Cover Density Class, Five Mapped Districts
Tree-cover density class Area of cropland (ha)
Mean carbon density(tons C/ha)
Total carbon stock (tons C)
High (>15%) 124,100 40 4,964,000
Medium (11–15%) 145,400 31 4,507,400
Low (6–10%) 287,400 23 6,610,200
Very low (1–5%) 337,300 15 5,059,500
No tree cover (0%) 30,000 7 210,000
Total 924,200 21,351,100
Not appli-cable
Help regenerate/reclaim degraded land
Help control erosion
Improve soil fertility and increase crop
Supply fuel-wood and poles
Supply of tree pro-ducts
Participate in a govern-ment project on natural resources
To comply with local/traditional rules on natural resources
Water-shed Total
Dowa Frequency 1 17 9 22 47 5 1 2 1 105
% of Total 0.3 5.6 3.0 7.2 15.4 1.6 0.3 0.7 0.3 34.4
Balaka Frequency 4 21 9 33 29 3 0 1 0 100
% of Total 1.3 6.9 3.0 10.8 9.5 1.0 0 0.3 0 32.8
Blantyre Frequency 1 21 10 22 43 2 0 1 0 100
% of Total 0.3 6.9 3.3 7.2 14.1 0.7 0 0.3 0 32.8
Total Frequency 6 59 28 77 119 10 1 4 1 305
% of Total 2.0 19.3 9.2 25.2 39.0 3.3 0.3 1.3 0.3 100.0
Table 9: Farmers’ Reasons to Protect and Manage Trees
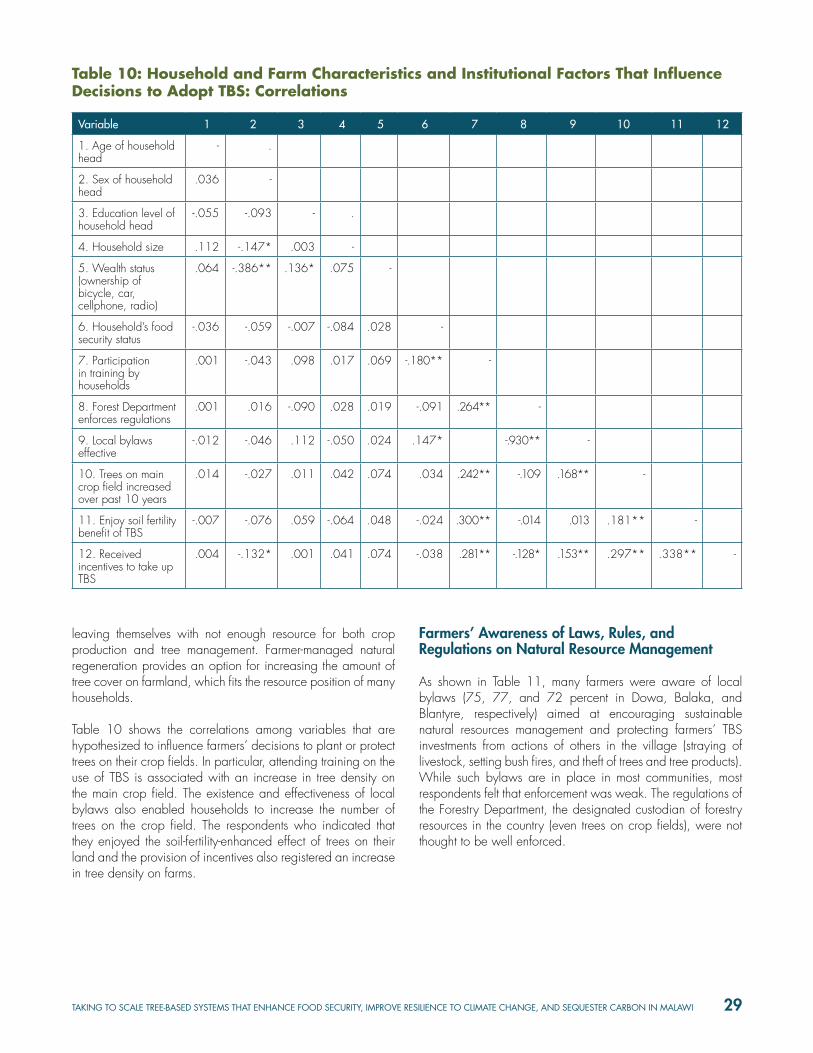
TAKING TO SCALE TREE-BASED SYSTEMS THAT ENHANCE FOOD SECURITY, IMPROVE RESILIENCE TO CLIMATE CHANGE, AND SEQUESTER CARBON IN MALAWI 29
leaving themselves with not enough resource for both crop production and tree management. Farmer-managed natural regeneration provides an option for increasing the amount of tree cover on farmland, which fits the resource position of many households.
Table 10 shows the correlations among variables that are hypothesized to influence farmers’ decisions to plant or protect trees on their crop fields. In particular, attending training on the use of TBS is associated with an increase in tree density on the main crop field. The existence and effectiveness of local bylaws also enabled households to increase the number of trees on the crop field. The respondents who indicated that they enjoyed the soil-fertility-enhanced effect of trees on their land and the provision of incentives also registered an increase in tree density on farms.
Farmers’ Awareness of Laws, Rules, and Regulations on Natural Resource Management
As shown in Table 11, many farmers were aware of local bylaws (75, 77, and 72 percent in Dowa, Balaka, and Blantyre, respectively) aimed at encouraging sustainable natural resources management and protecting farmers’ TBS investments from actions of others in the village (straying of livestock, setting bush fires, and theft of trees and tree products). While such bylaws are in place in most communities, most respondents felt that enforcement was weak. The regulations of the Forestry Department, the designated custodian of forestry resources in the country (even trees on crop fields), were not thought to be well enforced.
Variable 1 2 3 4 5 6 7 8 9 10 11 12
1. Age of household head
- .
2. Sex of household head
.036 -
3. Education level of household head
-.055 -.093 - .
4. Household size .112 -.147* .003 -
5. Wealth status (ownership of bicycle, car, cellphone, radio)
.064 -.386** .136* .075 -
6. Household’s food security status
-.036 -.059 -.007 -.084 .028 -
7. Participation in training by households
.001 -.043 .098 .017 .069 -.180** -
8. Forest Department enforces regulations
.001 .016 -.090 .028 .019 -.091 .264** -
9. Local bylaws effective
-.012 -.046 .112 -.050 .024 .147* -.930** -
10. Trees on main crop field increased over past 10 years
.014 -.027 .011 .042 .074 .034 .242** -.109 .168** -
11. Enjoy soil fertility benefit of TBS
-.007 -.076 .059 -.064 .048 -.024 .300** -.014 .013 .181** -
12. Received incentives to take up TBS
.004 -.132* .001 .041 .074 -.038 .281** -.128* .153** .297** .338** -
Table 10: Household and Farm Characteristics and Institutional Factors That Influence Decisions to Adopt TBS: Correlations

30 TAKING TO SCALE TREE-BASED SYSTEMS THAT ENHANCE FOOD SECURITY, IMPROVE RESILIENCE TO CLIMATE CHANGE, AND SEQUESTER CARBON IN MALAWI
Sources of Information on TBS
Many farmers learned about FMNR and other TBS either from government extension officers (agricultural and forestry extension personnel) or from NGOs promoting the practice, or they came across it themselves through self-experimentation (see Table 12). The most important sources of information are government agriculture and forestry extension system (40 percent), NGOs (16 percent), and self-teaching (11 percent). The lower percentage receiving information from NGOs is not surprising, as most NGOs do not have extension staff at EPA or Section level. The role of radios as a source of information is surprisingly low. The sources from which information about TBS is obtained by farmers are very limited. Also, the use of innovative approaches to deliver information to farmers remains largely unexploited. In order to reach large numbers of farmers, there is need to use mass media approaches such as radio, since many households own one. Further, use of information and communication technologies can be enhanced, for example by using mobile phones.
Factors Considered by Farmers in Deciding on Soil Fertility Management Practices
Respondents cited the following as influencing their decisions to adopt the four most important soil fertility management and conservation practices they currently use (see Figure 21):
• The practice produces benefits quickly • Observed/ perceived low soil fertility levels • Practices recommended by Ministry of Agriculture • Practices have been observed to provide benefits to other
farmers currently using them
While trees are generally characterized by the relatively long period before benefits can be realized, organizations such as the World Agroforestry Centre include shrubs like Tephrosia species among the TBS they promote because within a season these can provide large amounts of biomass that can be used as green manure, and the productivity enhancement benefits
Table 11: Awareness of Laws, Rules, and Regulations on Natural Resources Management
Dowa Balaka Blantyre
Not aware of any rules, laws, and bylaws
Frequency 1 4 0
Percent (%) 1 4 0
Forest Department’s laws and regulations
Frequency 24 19 28
Percent (%) 33.8 26.8 39.4
Local/ community bylaws Frequency 79 77 72
Percent (%) 72.5 77 72
Restrictions by tobacco companies
Frequency 1 0 0
Percent 1 0 0
Sources of Information on TBS
Table 12: Where Farmers First Learned about Natural Regeneration of Trees on Crop Fields
District NGOsNeighboring community
Government Agricultural
Extension Officers
Government Forestry Officers
Self-taught Radio Parents
Village head
Dowa Count 28 1 27 3 7 0 7 3
% of Total 9.2 0.3 8.9 1.0 2.3 0 2.3 1.0
Balaka Count 10 2 37 17 8 5 2 4
% of Total 3.3 0.7 12.1 5.6 2.6 1.6 0.7 1.3
Blantyre Count 11 1 25 13 18 4 2 1
% of Total 3.6 0.3 8.2 4.3 5.9 1.3 0.7 0.3
Total Count 49 4 89 33 33 9 11 8
% of Total 16.1 1.3 29.2 10.8 10.8 3.0 3.6 2.6
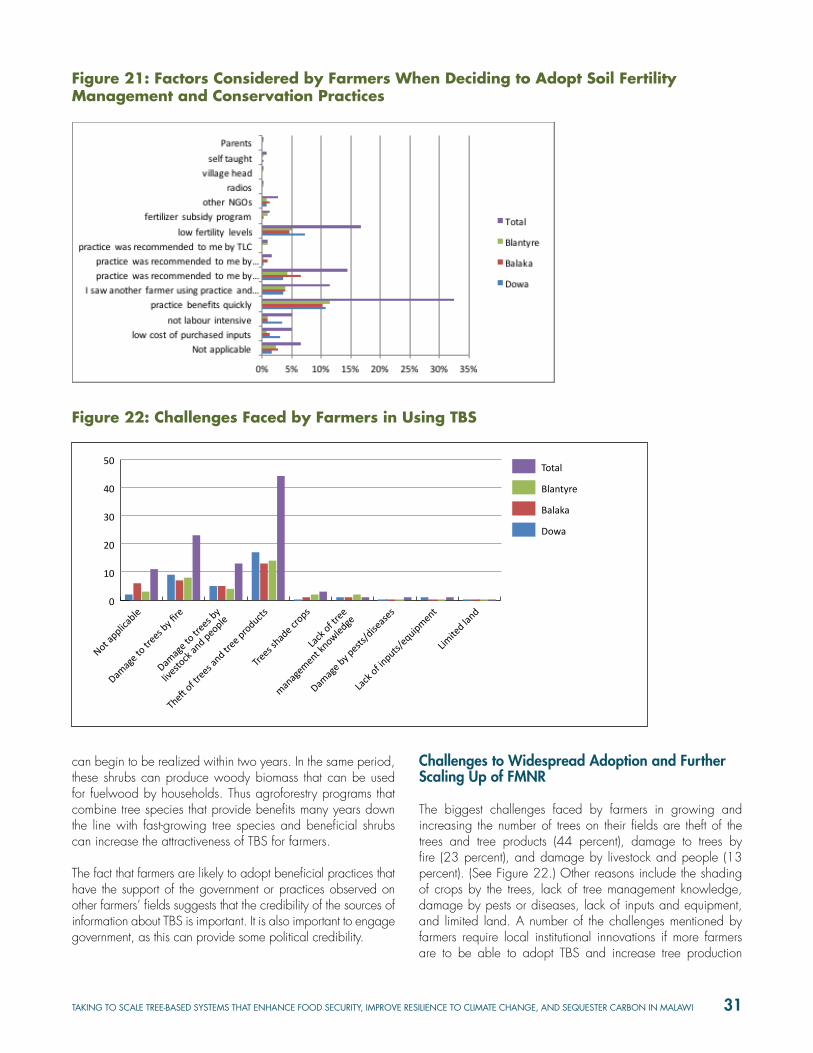
TAKING TO SCALE TREE-BASED SYSTEMS THAT ENHANCE FOOD SECURITY, IMPROVE RESILIENCE TO CLIMATE CHANGE, AND SEQUESTER CARBON IN MALAWI 31
can begin to be realized within two years. In the same period, these shrubs can produce woody biomass that can be used for fuelwood by households. Thus agroforestry programs that combine tree species that provide benefits many years down the line with fast-growing tree species and beneficial shrubs can increase the attractiveness of TBS for farmers.
The fact that farmers are likely to adopt beneficial practices that have the support of the government or practices observed on other farmers’ fields suggests that the credibility of the sources of information about TBS is important. It is also important to engage government, as this can provide some political credibility.
Challenges to Widespread Adoption and Further Scaling Up of FMNR
The biggest challenges faced by farmers in growing and increasing the number of trees on their fields are theft of the trees and tree products (44 percent), damage to trees by fire (23 percent), and damage by livestock and people (13 percent). (See Figure 22.) Other reasons include the shading of crops by the trees, lack of tree management knowledge, damage by pests or diseases, lack of inputs and equipment, and limited land. A number of the challenges mentioned by farmers require local institutional innovations if more farmers are to be able to adopt TBS and increase tree production
Figure 21: Factors Considered by Farmers When Deciding to Adopt Soil Fertility Management and Conservation Practices
Figure 22: Challenges Faced by Farmers in Using TBS
0
10
20
30
40
50Total
Blantyre
Balaka
Dowa
Limite
d land
Lack
of inputs/
equipment
Damag
e by pests
/dise
ases
Lack
of tree
manag
ement knowledge
Trees s
hade cr
ops
Theft of trees a
nd tree products
Damag
e to tr
ees by
livesto
ck an
d people
Damag
e to tr
ees by fi
re
Not applica
ble

32 TAKING TO SCALE TREE-BASED SYSTEMS THAT ENHANCE FOOD SECURITY, IMPROVE RESILIENCE TO CLIMATE CHANGE, AND SEQUESTER CARBON IN MALAWI
to meet their needs and provide environmental benefits to the public. Such institutional innovations should include the development of bylaws to regulate use of fire, management of livestock (especially during the dry season), and protection of the rights of those who invest in the production of trees on the farmland. These bylaws would need to be accompanied by mechanisms for credible enforcement.
Some of the Key Challenges in Managing Crop-Tree Intercrop
The biggest challenge faced by farmers growing crops in a field where there are trees are excessive shading crops (42 percent), lack of knowledge of best tree species to grow (17 percent), destruction of crops by people collecting tree
products (14 percent), and lack of knowledge on how to best manage tree-crop interactions (14 percent). (See Figure 23.) Regarding the perception of negative interactions with crops, it is important to note that very few tree species’ interactions with crops are known, with the exception of a few that have been studied in agroforestry systems. This information needs to be generated to enable farmers to choose the right tree species for integration with tree crops without having a negative impact on crop yields.
In general, farmers reported that they need more training and knowledge to enable them to successfully incorporate more trees on their crop fields. Most farmers indicated that they need more knowledge on how to best combine trees (e.g., types of trees to grow on fields in which different types of crops
0 10 20 30 40 50
Balaka
Blantyre
Dowa
Total
No challenges
Lack of knowledge ofbest tree species to grow
Lack of knowledge on how to bestmanage tree crop-interactions
Trees excessively shade crops
Trees attract birds andpest which damage crops
People coming to collecttree products damage crops
Lack of equipment
Figure 23: Key Challenges Faced by Farmers When Managing Crop-Tree Intercropping
Table 13: Gaps in Knowledge on Tree Management
DistrictNo gap
How best to combine trees and
crops
Benefits of
different trees
Tree manage-
ment practices
Tree species choice
Nursery manage-
ment
How to manage
fruit trees
Grafting/budding
Pest and
disease control Total
Dowa Frequency 7 35 12 37 8 5 1 0 0 105
% within District
6.7 33.3 11.4 35.2 7.6 4.8 1.0 0 0 100
Balaka Frequency 2 19 13 47 12 4 0 2 1 100
% within District
2.0 19.0 13.0 47.0 12.0 4.0 0 2.0 1.0 100
Blantyre Frequency 2 30 15 35 7 8 2 1 0 100
% within District
2.0 30.0 15.0 35.0 7.0 8.0 2.0 1.0 0 100
Total Frequency 11 84 40 119 27 17 3 3 1 305
% within All District
3.6 27.5 13.1 39.0 8.9 5.6 1.0 1.0 0.3 100

TAKING TO SCALE TREE-BASED SYSTEMS THAT ENHANCE FOOD SECURITY, IMPROVE RESILIENCE TO CLIMATE CHANGE, AND SEQUESTER CARBON IN MALAWI 33
are grown) and crops on their fields and on tree management practices to ensure optimal tree productivity (see Table 13). In practice many farmers do retain many tree species on their fields that are beneficial with little or no negative impacts to crop production. This statement may reflect the fact that farmers are not certain if they are currently obtaining optimal output from both the trees and the crops. There is a need for development and extension agents to generate information and to package and disseminate it in a form in to reach the intended beneficiaries.
Availability of Incentives to Support Adoption of TBS
Most farmers (54 percent) indicated that they did not receive external support in the form of incentives to encourage adoption of TBS. Yet 46 percent of respondents reported receiving free inputs (e.g., seeds and seedlings, mineral fertilizers), equipment (e.g., watering cans), food (food aid/ support programs), and cash to encourage them to plant, protect, and manage trees on their farms (see Table 14). Where incentives are in the
form of food for work, there is always the danger that once the period of hunger is over the trees are often neglected. The same applies to cash incentives. A study carried out in Ntchisi district on cash incentives for planting and caring of trees showed that for the duration of study, 97 percent of farmers enthusiastically protected the trees during the period when incentives were being paid (Jack 2010).
Institutions and Bylaws on Adoption and Management of Trees on Farmers’ Fields
Survey respondents indicated that the institution most effective for facilitating the management of trees on farmers’ fields was the Village Headman when she/he has an interest in natural resource management issues (36 percent)—that is, the village head participates in Village Natural Resources Management Committee (VNRMC) and is involved in enforcing bylaws (see Figure 24). Thirty-five percent of respondents indicated that there was a functional VNRMC in their community, and 16 percent indicated that their community has written down
Table 14: Availability of and Access to Incentives for Supporting Adoption of TBS
District None Equipment Cash Inputs Food Training Total
DowaFrequency 69 21 5 10 0 0 105
% of Total 22.6 6.9 1.6 3.3 0 0 34.4
BalakaFrequency 52 21 1 15 9 2 100
% of Total 17.0 6.9 .3 4.9 3.0 0.7 32.8
BlantyreFrequency 45 25 3 25 1 1 100
% of Total 14.8 8.2 1.0 8.2 0.3 0.3 32.8
TotalFrequency 166 67 9 50 10 3 305
% of Total 54.4 22.0 3.0 16.4 3.3 1.0 100
0
8
16
24
32
40Total
Blantyre
Balaka
Dowa
AgriculturalExtension
Officers helpcommunities
ForestryOfficers
helpcommunitis
VillageHeadmaninvolved
Communityby-laws
have afunctional
VNRMC
no effectivestructures
Figure 24: Effectiveness Structures and Bylaws Facilitating Adoption and Management of Trees on Farmers’ Fields Determinants of Household Adoption of FMNR
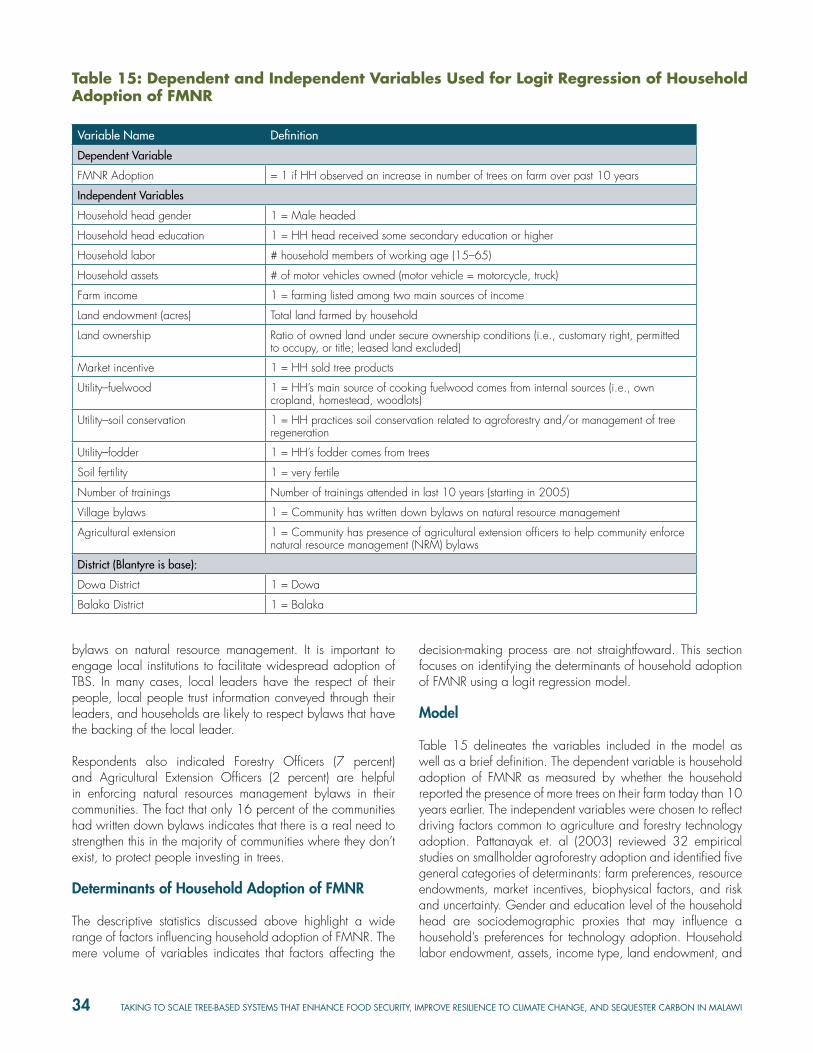
34 TAKING TO SCALE TREE-BASED SYSTEMS THAT ENHANCE FOOD SECURITY, IMPROVE RESILIENCE TO CLIMATE CHANGE, AND SEQUESTER CARBON IN MALAWI
bylaws on natural resource management. It is important to engage local institutions to facilitate widespread adoption of TBS. In many cases, local leaders have the respect of their people, local people trust information conveyed through their leaders, and households are likely to respect bylaws that have the backing of the local leader.
Respondents also indicated Forestry Officers (7 percent) and Agricultural Extension Officers (2 percent) are helpful in enforcing natural resources management bylaws in their communities. The fact that only 16 percent of the communities had written down bylaws indicates that there is a real need to strengthen this in the majority of communities where they don’t exist, to protect people investing in trees.
Determinants of Household Adoption of FMNR
The descriptive statistics discussed above highlight a wide range of factors influencing household adoption of FMNR. The mere volume of variables indicates that factors affecting the
decision-making process are not straightfoward. This section focuses on identifying the determinants of household adoption of FMNR using a logit regression model.
Model
Table 15 delineates the variables included in the model as well as a brief definition. The dependent variable is household adoption of FMNR as measured by whether the household reported the presence of more trees on their farm today than 10 years earlier. The independent variables were chosen to reflect driving factors common to agriculture and forestry technology adoption. Pattanayak et. al (2003) reviewed 32 empirical studies on smallholder agroforestry adoption and identified five general categories of determinants: farm preferences, resource endowments, market incentives, biophysical factors, and risk and uncertainty. Gender and education level of the household head are sociodemographic proxies that may influence a household’s preferences for technology adoption. Household labor endowment, assets, income type, land endowment, and
Table 15: Dependent and Independent Variables Used for Logit Regression of Household Adoption of FMNR
Variable Name Definition
Dependent Variable
FMNR Adoption = 1 if HH observed an increase in number of trees on farm over past 10 years
Independent Variables
Household head gender 1 = Male headed
Household head education 1 = HH head received some secondary education or higher
Household labor # household members of working age (15–65)
Household assets # of motor vehicles owned (motor vehicle = motorcycle, truck)
Farm income 1 = farming listed among two main sources of income
Land endowment (acres) Total land farmed by household
Land ownership Ratio of owned land under secure ownership conditions (i.e., customary right, permitted to occupy, or title; leased land excluded)
Market incentive 1 = HH sold tree products
Utility–fuelwood 1 = HH’s main source of cooking fuelwood comes from internal sources (i.e., own cropland, homestead, woodlots)
Utility–soil conservation 1 = HH practices soil conservation related to agroforestry and/or management of tree regeneration
Utility–fodder 1 = HH’s fodder comes from trees
Soil fertility 1 = very fertile
Number of trainings Number of trainings attended in last 10 years (starting in 2005)
Village bylaws 1 = Community has written down bylaws on natural resource management
Agricultural extension 1 = Community has presence of agricultural extension officers to help community enforce natural resource management (NRM) bylaws
District (Blantyre is base):
Dowa District 1 = Dowa
Balaka District 1 = Balaka

TAKING TO SCALE TREE-BASED SYSTEMS THAT ENHANCE FOOD SECURITY, IMPROVE RESILIENCE TO CLIMATE CHANGE, AND SEQUESTER CARBON IN MALAWI 35
ownership measure the resources available to the household to adopt FMNR. Economic incentives, such as income from selling tree products as well as in-kind benefits from fuelwood, soil conservation, and fodder, represent net benefits gained from technology adoption. Biophysical factors, such as soil fertility, influence the physical production processes associated with agroforestry. Household training, village bylaws, and external support institutions reflect the degree of risk and uncertainty in the enabling environment.
The dataset used included observations from Dowa, Balaka, and Blantyre. To control for any unobserved heterogeneity among the districts, dummy district variables were included for Dowa and Balaka, with Blantyre as the base district.
Results
Table 16 provides the logit regression results. The estimated coefficients for farm income, soil conservation, village bylaws and agricultural extension are statistically significant and have the expected sign.
Having farm income among the two main sources of household income had a significant negative effect on adoption. The negative association could be interpreted as risk aversion
to investing in an unknown technology that could negatively affect a dominant source of income. Although not statistically significant, land ownership rights had a positive impact on adoption, implying that households are more willing to make long-term investments in trees if they have secure rights to their land. In addition, household labor endowment, measured as number of working-age adults, increased the likelihood of FMNR adoption. Of course, households with more labor have the human resources needed to invest time in adopting new technology practices. Surprisingly, resource endowments related to monetary wealth did not have a significant effect on adoption. For example, household assets, measured by whether high-value assets such as motor vehicles were owned, had a negative impact on adoption. Land endowment also had a negative association, but since the parameter was so small (-0.001), this estimation is negligible.
The market incentive and utility variables are all positively associated with adoption; however, only soil conservation is statistically significant. Households that practiced agroforestry and/or tree regeneration as a means for soil conservation had an increased likelihood of maintaining trees on their cropland. Similarly, although not significant, households where the most important source of livestock fodder came from trees were more likely to adopt FMNR. Although the majority of households
Table 16: FMNR Adoption Model Parameter Estimates
Variable Coefficient Significance SE
Household head gender 0.038 0.067
Household head education 0.027 0.079
Household labor 0.023 0.017
Household assets -0.055 0.164
Farm income -0.105 *** 0.058
Land endowment (acres) -0.001 0.011
Land ownership 0.229 0.165
Market incentive 0.059 0.081
Utility–fuelwood 0.072 0.060
Utility–soil conservation 0.112 *** 0.065
Utility–fodder 0.169 0.118
Soil fertility 0.218 *** 0.116
Number of trainings 0.027 0.026
Village bylaws 0.166 * 0.064
Agricultural extension 0.145 ** 0.067
District (Blantyre District is base):
Dowa District -0.054 0.071
Balaka District 0.129 *** 0.069
*Significant at 0.01; ** Significant at 0.05; *** Significant at 0.1
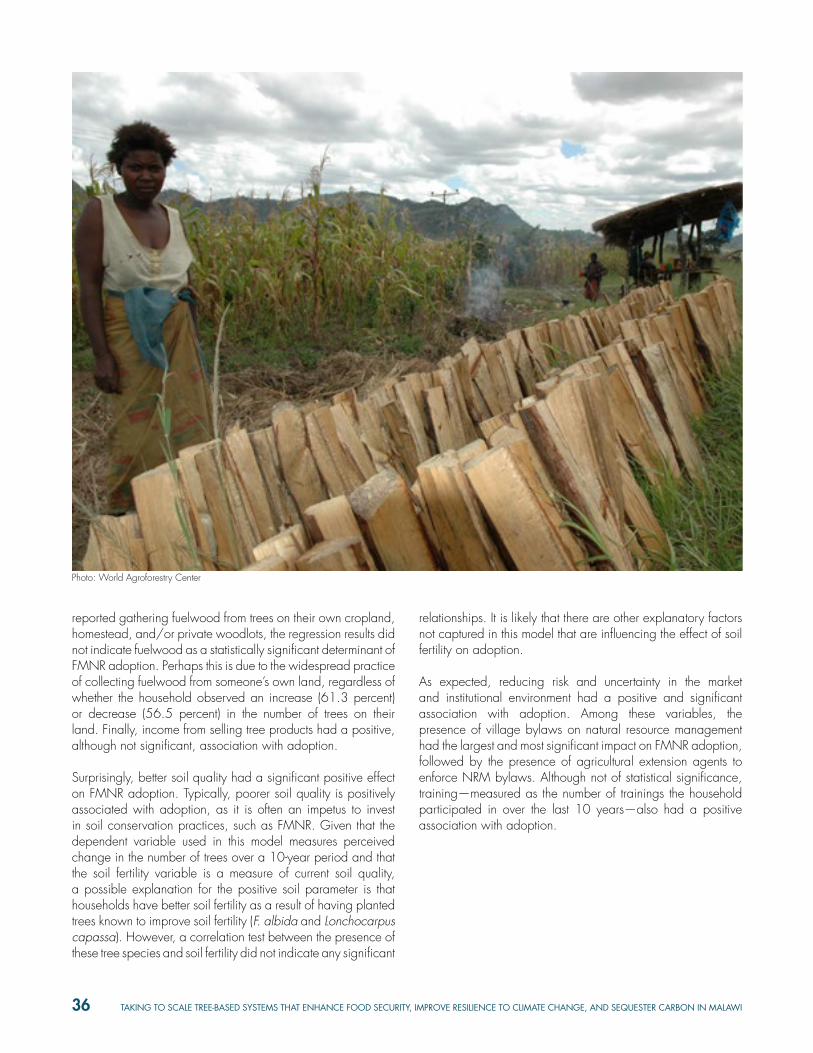
36 TAKING TO SCALE TREE-BASED SYSTEMS THAT ENHANCE FOOD SECURITY, IMPROVE RESILIENCE TO CLIMATE CHANGE, AND SEQUESTER CARBON IN MALAWI
reported gathering fuelwood from trees on their own cropland, homestead, and/or private woodlots, the regression results did not indicate fuelwood as a statistically significant determinant of FMNR adoption. Perhaps this is due to the widespread practice of collecting fuelwood from someone’s own land, regardless of whether the household observed an increase (61.3 percent) or decrease (56.5 percent) in the number of trees on their land. Finally, income from selling tree products had a positive, although not significant, association with adoption.
Surprisingly, better soil quality had a significant positive effect on FMNR adoption. Typically, poorer soil quality is positively associated with adoption, as it is often an impetus to invest in soil conservation practices, such as FMNR. Given that the dependent variable used in this model measures perceived change in the number of trees over a 10-year period and that the soil fertility variable is a measure of current soil quality, a possible explanation for the positive soil parameter is that households have better soil fertility as a result of having planted trees known to improve soil fertility (F. albida and Lonchocarpus capassa). However, a correlation test between the presence of these tree species and soil fertility did not indicate any significant
relationships. It is likely that there are other explanatory factors not captured in this model that are influencing the effect of soil fertility on adoption.
As expected, reducing risk and uncertainty in the market and institutional environment had a positive and significant association with adoption. Among these variables, the presence of village bylaws on natural resource management had the largest and most significant impact on FMNR adoption, followed by the presence of agricultural extension agents to enforce NRM bylaws. Although not of statistical significance, training—measured as the number of trainings the household participated in over the last 10 years—also had a positive association with adoption.
Photo: World Agroforestry Center

TAKING TO SCALE TREE-BASED SYSTEMS THAT ENHANCE FOOD SECURITY, IMPROVE RESILIENCE TO CLIMATE CHANGE, AND SEQUESTER CARBON IN MALAWI 37
CONCLUSIONS AND RECOMMENDATIONS
Malawi faces several challenges, including food insecurity. National food security is largely dependent on the performance of rain-fed agriculture, which is vulnerable to a range environmental risks (climate variability), and production and market risks. The World Bank (Giertz et al. 2015), estimated that the annual losses in Malawi from production risks for major crops amounted to US$149 million, on average, between 1980 and 2012. Droughts and pests and diseases are considered to be the most damaging production risks, especially for food crops. Malawi has suffered significant droughts in the past that had a notable fiscal impact and required assistance from the international community.
To improve food security while also increasing incoming and augmenting adaptive capacity of farming systems, Malawi will need to promote agricultural practices and technologies that can generate much needed multiple benefits. TBS include systems that integrate trees into annual food crop systems. Depending on the woody species and how they are managed, the systems such as those described by Garrity et al. (2010) have shown to contribute to improving vegetative soil cover year-round, which in turn improves soil structure and water infiltration, reducing occurrences of pests and weeds, enhancing carbon storage aboveground and belowground, and producing more food, fodder, fuel, and fiber from the products associated with the intercropped trees (Garrity et al. 2010).
In Malawi, TBS are not new and have been adopted across vast areas of the landscape in some districts. Households adopting TBS have identified improved access to wood energy and greater soil fertility as some of the key reasons for allocating land to trees. The TBS also generate other long-term (less visible) benefits both at the household and national level, such as greater carbon sequestration, improved soil quality, and greater biodiversity.
Reviewing the underlying rationale of surveyed farming households that adopted tree-based systems in their small holdings, this study recommends that efforts to promote further adoption of such systems at scale will need to ensure the following:
• Promoted systems are low cost and have the productivity benefits farmers need: The promoted systems need to be low-cost (e.g., FMNR), easy to adopt, and help address an immediate constraint faced by the household. Evidence from the analysis suggests that when households have adequate income to buffer themselves from potential constraints, they do not necessarily adopt TBS.
• Public and private extension services need to be improved and expanded: The knowledge gap that farmers face needs to be addressed to be able to change their perception of negative interactions between trees and crops, when there is limited information on specific interactions. Government research and extension organizations must generate information that would enable farmers to choose the right tree species for integration with annual crops without a negative impact on crop yields. There should be exploration of also extending the delivery of public extension through private technical service providers and the gradual phasing in of services from multiple sources so rural households can choose among these and identify the provider that is most effective at delivery the services and support needed.
• Strengthen village institutions: Village institutions need to be strengthened to implement village bylaws that local communities set up to manage common areas (e.g., forests) that also specify how encroachers and law offenders from neighboring villages and beyond will be penalized/punished. Drawing on evidence from other analyses, this recommendation comes with the caveat that there are many bylaws in each district, making it difficult for community-based organizations to effectively implement these. Bylaws therefore need to be harmonized and enable the right natural resource management structures to effectively implement them.
• Village institutions need to be strengthened and able to work as an effective vehicle for transferring knowledge, building on the inherent trust that village households have in these institutions.
• Consider economic incentives: Appropriate incentives that can be monitored need to be available to farmers. Of the population sampled, some households mentioned the incentives they had access to for adopting the TBS. What will be central to these incentives is ensuring that they are designed with an explicit approach for being phased out, in order to not jeopardize the replicability of the incentive at scale. Currently households that plant trees are benefiting from both revenue and avoided costs. To adopt at scale, it will be important to augment the incentives for planting trees on agricultural lands. While there are opportunities for linking this effort with payments for carbon sequestered, the transaction costs need to be carefully considered, and the opportunity to retool current fertilizer subsidies to create positive incentives for planting trees should be explored.

38 TAKING TO SCALE TREE-BASED SYSTEMS THAT ENHANCE FOOD SECURITY, IMPROVE RESILIENCE TO CLIMATE CHANGE, AND SEQUESTER CARBON IN MALAWI
• Provide compelling evidence for TBS helping deliver national objectives: The government has committed to food security, and also set targets in its nationally determined contribution. As noted in the report, the scaling up of TBS can assist the government to deliver on both. However, the government will need to be selective and strategic in how it links TBS scale up with these national objectives as it will influence the technologies adopted. The latter in turn will shape costs and feasibility. Keeping scale in mind, technical assistance and analysis should be carried out to identify the suitable low cost technology options for contributing to national objectives of food security and climate targets. Ideally this is done in coordination with the work being led by organizations such as World Resources Institute on mapping potential area available for TBS. Such coordination would assist in prioritizing the regions for intervention and guide the implementation of the aforementioned recommendations.
Information from the analysis points to some unexpected results, such as low adoption of TBS in districts with have a high number of development partners working on improving land management. While the sample size and data collection processes had some shortcomings, these results warrant a closer examination to ensure that the delivery mechanisms being used are promoting the building of community institutions and mechanisms while also buffering the communities against other broader risks.
As with any effort to document and understand existing practices, there is room for additional work that would assist the government of Malawi and development partners to understand the scale of adoption of TBS and the underlying drivers. A few of these are mentioned here:
• Strengthen the capacity and provide needed resources for the geographic information system team in Malawi’s Land and Resources Conservation Department to expand the mapping exercise beyond the five districts mapped in this study to provide a more complete baseline of on-farm tree cover density in Malawi. Having a more complete baseline and improved understanding of the location of agricultural landscapes with lower densities of on-farm tree cover would enable LRCD to provide documentation and guidance for targeted efforts to accelerate the scaling up of the adoption of FMNR and other TBS where it is needed the most. By overlaying the tree density maps with population density, poverty indices, data on food security, presence of rural development programs, and other parameters, scaling-up interventions could be targeted to provide additional benefits to rural households with the greatest needs and improved prospects of adoption of TBS.
• Grant support for the LRCD to track changes in tree cover density at sample points over fixed time intervals to assess how the situation is changing, and target efforts to support promotion of TBS.
• Support additional field-level sampling or surveying that would help to fill in informational gaps that could not be addressed in this project. For example, provide support for sampling the tree carbon stocks in each of the density classes to provide an accurate estimate of carbon sequestration benefits from the adoption at scale of TBS. Based on more in-depth analysis that has been done in other countries, it is likely that the carbon stocks associated with the higher density of trees on farms are significant; this information is important as Malawi moves ahead with the formulation of their post-2020 climate actions under the Intended Nationally Determined Contributions program, the development of plans and strategies to address climate change and green growth, and initiatives in support of climate-smart agriculture.

TAKING TO SCALE TREE-BASED SYSTEMS THAT ENHANCE FOOD SECURITY, IMPROVE RESILIENCE TO CLIMATE CHANGE, AND SEQUESTER CARBON IN MALAWI 39
ANNEX 1: DETAILED DESCRIPTION OF TREE COVER DENSITY MAPPING TOOL
The mapping component of the TBS assessment for Malawi used the Tree Cover Density Mapping (TCDM) tool developed by the U.S. Geological Survey’s West Africa Land Use and Land Cover Trends team. The TCDM tool, which is run within ArcGIS mapping software, utilizes very-high resolution (~1m) imagery and a sample-based approach to produce gridded maps of on-farm tree cover density. The tool (see Figure 1–1) provides the infrastructure for a user to estimate the tree density
within a 10-hectare sample plot containing a calibration grid of 100 points. The number of points that cover trees in the imagery represents the density percentage. This sampling exercise is replicated thousands of times for the entire study area to produce a gridded map of tree cover density, which can then be classified into various density categories. An example of tree cover density categories is shown in Figure 1–2.
Figure 1–1: Screenshot of the Tree Cover Density Mapping Tool
Figure 1–2: Example of Tree Cover Density Classes
0 %No tree cover
0 - 2 %Open with
isolated trees
2 - 5 %Low density
5 - 15 %Medium density
40 TAKING TO SCALE TREE-BASED SYSTEMS THAT ENHANCE FOOD SECURITY, IMPROVE RESILIENCE TO CLIMATE CHANGE, AND SEQUESTER CARBON IN MALAWI
This tool has certain limitations, however. First, the exercise uses a sampling approach; it is not a comprehensive mapping of tree cover density on all cropland in the district. Thus a 10-hectare sample plot is representative of an entire square kilometer of cropland on the map. The sample locations are randomly generated within cropland areas and not selected based on their representativeness of the area or any other preformed criteria, so some sample sites may be an anomaly rather than typical of the entire square kilometer. In locations where farmers are cultivating particularly small plots of land, this is an important limitation to note. Furthermore, data do not exist at this time to show the delineation of boundaries between farms according to which household they belong. Therefore, it is possible that some sample plots intersect the boundaries of multiple farms and account for different management strategies among different households.
Second, while the resolution of the imagery is the highest available (~1m), it is not at a sufficient resolution to determine the species of tree nor to identify very young trees or sprouts. Furthermore, it is not possible to determine whether a tree was planted or generated naturally from root, seed, or stump. The farm-level surveys are necessary to fill in this information and will be incorporated in the next phase of the analysis.
In terms of the TCDM tool used for this exercise, while it is a very straightforward method based on visual interpretation and relatively easy to train users who have only basic experience with GIS software, a few logistical constraints may limit the uptake of the tool. Foremost, reliable Internet access is necessary to get access to the imagery, which is streaming from an online server and is not built into the tool. It may be possible to cache imagery on a hard drive for use in areas lacking Internet service, but more work needs to be done to investigate the feasibility of this. Also, the tool requires that the user have access to ArcGIS software, which is proprietary and not free. Most nonprofits or governments in developing countries can acquire the software at little to no cost, but it still may present a constraint in some situations. Malawi’s Land and Resources Conservation Department (LRCD) is staffed with highly skilled GIS analysts, but they have noted that the lack of consistent Internet access would hinder their ability to use the tool without having access to offline imagery. LRCD does have access to ArcGIS software, so this aspect does not present a limitation.
As noted in the discussion of results, the dates for images mainly covered the time period of 2013–14, but in some cases images were from 2009 or 2010. The use of freely available imagery from Google and Bing Maps for this analysis limited the ability to control for year to maintain consistency because these image providers generally make available only the most recent, highest-quality images on their platforms (e.g., images with the least amount of cloud cover). This lack of consistency has the potential to introduce some error in the results. However, given that the number of images outside of the 2013–2014 timeframe was relatively small (<5 percent of 9,242 images sampled) and that all images were within a five-year time span, which is relatively short in the time span of tree growth cycles, this error is presumably mostly negligible.
In addition to some variation in image years, the months in which the images were taken varied widely across each district. However, the very nature of satellite imagery, which is dependent on the time scale of satellite orbit, limits the ability to maintain consistency across a large area, such as the size of a district, within a short time period. The variation across months means that seasonal differences ranging from rainy to dry were captured in the image analysis. However, the high resolution of the imagery and the distinctive features of trees (e.g., a distinctive crown and cast of a shadow) limit the reasons for visual interpretation of trees to be significantly affected by seasonal variation.
Last, a small sample of pairwise images were used to demonstrate changes in on-farm tree cover density over the last 10–15 years, but time and resources were insufficient to map these changes more comprehensively or systematically. Options are available for acquiring consistent historical imagery, such as through the United States Geological Survey’s archives or Malawi’s LRCD, but the level of effort was beyond the scope of this project. A second phase of this project is needed to focus on mapping tree cover density changes over time.

TAKING TO SCALE TREE-BASED SYSTEMS THAT ENHANCE FOOD SECURITY, IMPROVE RESILIENCE TO CLIMATE CHANGE, AND SEQUESTER CARBON IN MALAWI 41
ANNEX 2: POTENTIAL SAVINGS IN SUBSI-DIZED FERTILIZER PROGRAM IN MALAWI
For tree-based systems to be adopted at scale, it helps to have evidence of their national or public benefits. This Annex presents some analysis done to estimate the annual cost of the Malawi fertilizer subsidy program and—using estimates of typical nutrient application rates and grain yields under subsidized fertilizer as well as tree fertilizer systems—to assess the potential for tree-based ecosystem approaches to replace subsidized fertilizer, with any potential savings.
The following assumptions were made in this analysis:
• As maize is the main staple crop in Malawi, this analysis focused on fertilizer subsidies directed at maize production (urea and nitrogen-phosphorus-potassium (NPK)). This was also the crop prioritized by the Farmer Input Subsidy Program (FISP), as indicated by the proportion of spending on maize inputs versus other crops, such as tobacco.
• As nitrogen is the main nutrient required by maize, the analysis focused mainly on substitution of N nutrients.
• Since local maize is the de facto crop for smallholder farmers, this analysis focused on local maize. In addition, this analysis aimed to isolate the incremental yield gained from subsided fertilizer use, which may have been more difficult to do with hybrid maize varieties due to confounding effects.
Cost of Maize Fertilizer Subsidy Program
The costs of the Malawi FISP from 2005 to 2013 are provided in Table 2–1. The figures includes the cost of inputs, including seeds, chemicals, and fertilizer, along with operating costs, which includes costs related to transport, financing, operations, coupon production, communications, monitoring, and evaluation, among others. Total program costs are net of any farmer redemption paid and unused stock. Net costs ranged from US$32 million in 2005/06 (the beginning of the program) to US$251.78 million in 2008/09 (when international fertilizer prices were exceptionally high). In more recent years (2010–13), the net cost of the program has ranged from US$140.92 million to $151.17 million. FISP’s budget accounted for 41–49 percent of Malawi’s total public expenditures on the agricultural sector and 1.9–5.8 percent of Malawaian gross domestic product (GDP). (See Tables 2–2 and 2–3.)
Since FISP included several types of inputs, it was necessary to isolate the cost of the maize fertilizer subsidy itself. Using data from Dorward et al. (2013), Table 2–4 itemizes the direct input costs across the types of inputs (seed, chemicals, and fertilizer); there were no data on input costs itemized by crop (maize, tobacco, legumes, etc.), however. In addition, operating costs are indirect and cannot easily be attributed to individual inputs or crops. As such, an allocation method was used to determine what proportion of direct input costs and indirect operating costs could be assigned to maize fertilizer. For each year with
Table 2–1: Costs of Farmer Input Subsidy Program (million US$)
2005/06 2006/07 2007/08 2008/09 2009/10 2010/11 2011/12 2012/13
Costs (million US$)
Seeds 0 5.23 6.47 12.57 19.96 28.3 21.38 15.9
Chemicals 0 0 0.24 n/a 0 0 0 0
Fertilizer 51.62 78.59 113.95 262.51 92.35 115.28 112.63 119.52
Operating costs 0 7.11 7.82 19.65 17.51 18.18 15.38 13.19
Subtotal 51.62 90.93 128.48 294.73 129.82 161.76 149.39 148.61
Less: Farmer redemption and unused stock
19.62 17.02 21.32 42.95 11.43 10.59 8.47 4.68
Net costs 32 73.91 107.16 251.78 118.39 151.17 140.92 143.93
Funding
Direct Donor Support 0 9.51 7.13 37.75 17.48 22.05 44.85 17.56
Balance: Malawi Government
32 64.4 100.03 214.03 100.91 129.12 96.07 126.37
Source: Dorward et al. 2013.
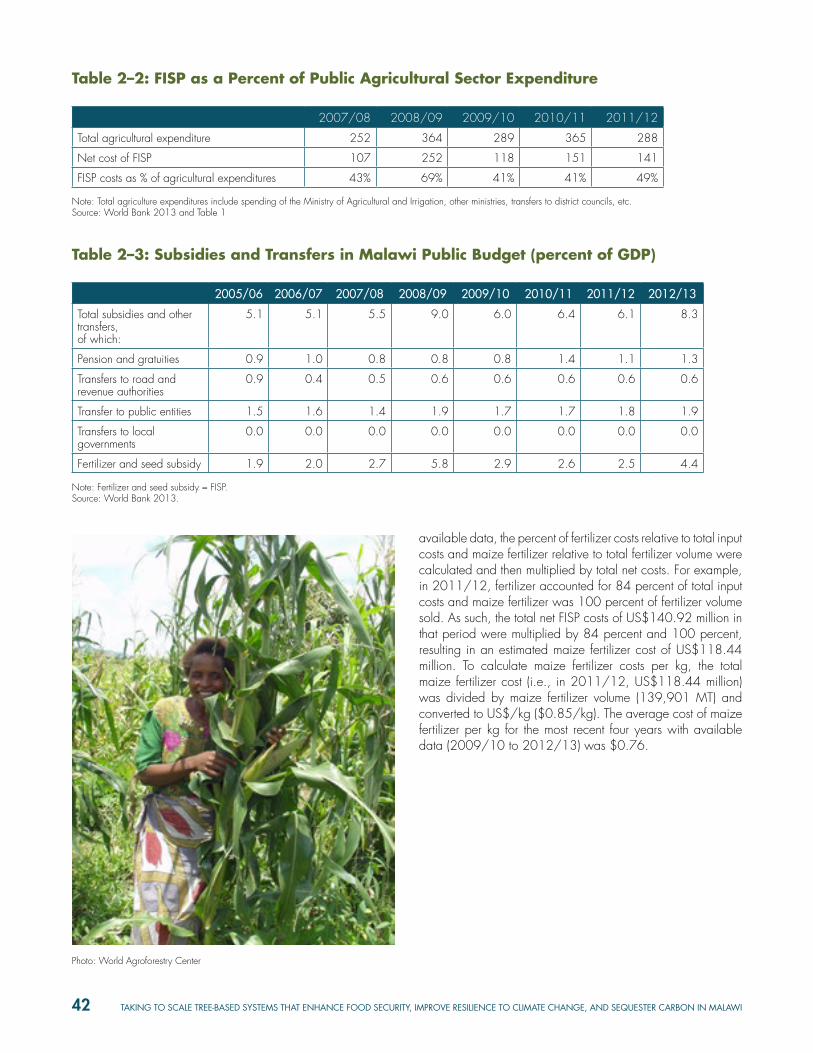
42 TAKING TO SCALE TREE-BASED SYSTEMS THAT ENHANCE FOOD SECURITY, IMPROVE RESILIENCE TO CLIMATE CHANGE, AND SEQUESTER CARBON IN MALAWI
available data, the percent of fertilizer costs relative to total input costs and maize fertilizer relative to total fertilizer volume were calculated and then multiplied by total net costs. For example, in 2011/12, fertilizer accounted for 84 percent of total input costs and maize fertilizer was 100 percent of fertilizer volume sold. As such, the total net FISP costs of US$140.92 million in that period were multiplied by 84 percent and 100 percent, resulting in an estimated maize fertilizer cost of US$118.44 million. To calculate maize fertilizer costs per kg, the total maize fertilizer cost (i.e., in 2011/12, US$118.44 million) was divided by maize fertilizer volume (139,901 MT) and converted to US$/kg ($0.85/kg). The average cost of maize fertilizer per kg for the most recent four years with available data (2009/10 to 2012/13) was $0.76.
Table 2–2: FISP as a Percent of Public Agricultural Sector Expenditure
2007/08 2008/09 2009/10 2010/11 2011/12
Total agricultural expenditure 252 364 289 365 288
Net cost of FISP 107 252 118 151 141
FISP costs as % of agricultural expenditures 43% 69% 41% 41% 49%
Note: Total agriculture expenditures include spending of the Ministry of Agricultural and Irrigation, other ministries, transfers to district councils, etc. Source: World Bank 2013 and Table 1
Table 2–3: Subsidies and Transfers in Malawi Public Budget (percent of GDP)
2005/06 2006/07 2007/08 2008/09 2009/10 2010/11 2011/12 2012/13
Total subsidies and other transfers,of which:
5.1 5.1 5.5 9.0 6.0 6.4 6.1 8.3
Pension and gratuities 0.9 1.0 0.8 0.8 0.8 1.4 1.1 1.3
Transfers to road and revenue authorities
0.9 0.4 0.5 0.6 0.6 0.6 0.6 0.6
Transfer to public entities 1.5 1.6 1.4 1.9 1.7 1.7 1.8 1.9
Transfers to local governments
0.0 0.0 0.0 0.0 0.0 0.0 0.0 0.0
Fertilizer and seed subsidy 1.9 2.0 2.7 5.8 2.9 2.6 2.5 4.4
Note: Fertilizer and seed subsidy = FISP. Source: World Bank 2013.
Photo: World Agroforestry Center
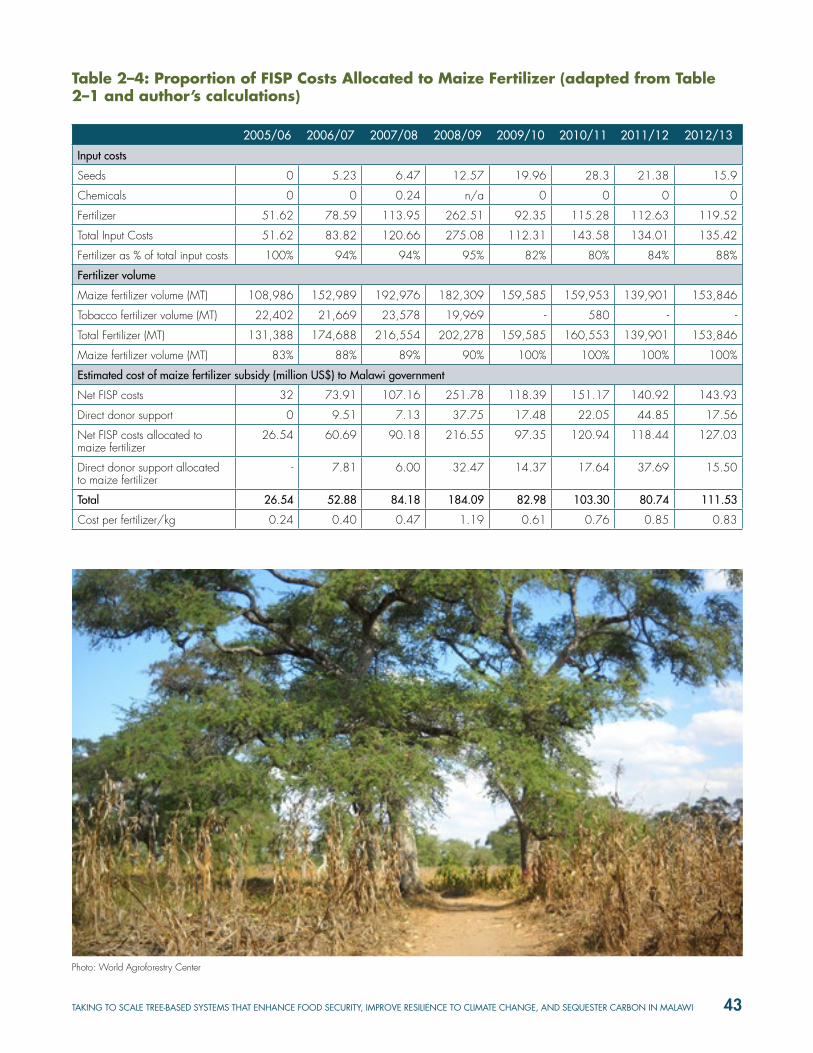
TAKING TO SCALE TREE-BASED SYSTEMS THAT ENHANCE FOOD SECURITY, IMPROVE RESILIENCE TO CLIMATE CHANGE, AND SEQUESTER CARBON IN MALAWI 43
Photo: World Agroforestry Center
Table 2–4: Proportion of FISP Costs Allocated to Maize Fertilizer (adapted from Table 2–1 and author’s calculations)
2005/06 2006/07 2007/08 2008/09 2009/10 2010/11 2011/12 2012/13
Input costs
Seeds 0 5.23 6.47 12.57 19.96 28.3 21.38 15.9
Chemicals 0 0 0.24 n/a 0 0 0 0
Fertilizer 51.62 78.59 113.95 262.51 92.35 115.28 112.63 119.52
Total Input Costs 51.62 83.82 120.66 275.08 112.31 143.58 134.01 135.42
Fertilizer as % of total input costs 100% 94% 94% 95% 82% 80% 84% 88%
Fertilizer volume
Maize fertilizer volume (MT) 108,986 152,989 192,976 182,309 159,585 159,953 139,901 153,846
Tobacco fertilizer volume (MT) 22,402 21,669 23,578 19,969 - 580 - -
Total Fertilizer (MT) 131,388 174,688 216,554 202,278 159,585 160,553 139,901 153,846
Maize fertilizer volume (MT) 83% 88% 89% 90% 100% 100% 100% 100%
Estimated cost of maize fertilizer subsidy (million US$) to Malawi government
Net FISP costs 32 73.91 107.16 251.78 118.39 151.17 140.92 143.93
Direct donor support 0 9.51 7.13 37.75 17.48 22.05 44.85 17.56
Net FISP costs allocated to maize fertilizer
26.54 60.69 90.18 216.55 97.35 120.94 118.44 127.03
Direct donor support allocated to maize fertilizer
- 7.81 6.00 32.47 14.37 17.64 37.69 15.50
Total 26.54 52.88 84.18 184.09 82.98 103.30 80.74 111.53
Cost per fertilizer/kg 0.24 0.40 0.47 1.19 0.61 0.76 0.85 0.83

44 TAKING TO SCALE TREE-BASED SYSTEMS THAT ENHANCE FOOD SECURITY, IMPROVE RESILIENCE TO CLIMATE CHANGE, AND SEQUESTER CARBON IN MALAWI
Table 2–5: Profile of Mean Local Maize Plot with Subsidized Fertilizer in Whitbread, Sennhenn, and Grotelüschen 2013 Study
Farming Practice / Conditions Units Mean Conditions
Nitrogen applied kg/ha 33.2
Phosphorus applied kg/ha 8.3
Plant population ‘000 plants/ha 20.1
In crop rain mm 590
Planting time months from Dec 1 0.08
Variety local
Weeding poor 0, good 1 0.66
Soil depth shallow 0, deep 1 0.5
Fertilizer timing months from planting 0.91
Soil Phosphorous kg/ha 0.75
Source: Adapted from Dorward et al. 2013.
Nutrient Application and Maize Yields—Subsidized Fertilizer
Determining the direct benefit of the fertilizer subsidies (incremental yields) is difficult, as there is limited published information about yield responses under smallholder conditions (Dorward et al. 2013, 2008; Whitbread, Sennhenn, and Grotelüschen 2013). Results are inconsistent due to biased estimates obtained in farmer household survey studies (Dorward and Chirwa 2010) and multicollinearity between different crop management variables, such as variety, fertilizer use, plant density, weeding, and time of planting (Dorward et al. 2013). Whitbread, Sennhenn, and Grotelüschen (2013) conducted a meta-analysis of published literature and found that the majority of studies were from researcher-managed on-station or on-farm experiments; they concluded that further efforts were needed to collect on-farm data about nutrient responses under ‘on-farm’ smallholder conditions. In the second part of their study, they used a crop simulation to explore key drivers of yield response and found that weeding practices, phosphorous levels, plant population, rainfall, and maize varieties have important effects and interactions. While yield gains varied according to agronomic conditions, the authors found that under mean farming practices and conditions (see Table 2–5), average local maize yields were 1,392 kg/ha. In terms of incremental response from N, average maize yield response to nitrogen was 18 kg grain per kg N for local maize. Overall, results for local maize ranged from 10 to 18 kg maize per kg N.
Given these yield results, it is estimated that the mean farm described in the Whitbread, Sennhenn, and Grotelüschen (2013) simulation would use the following amounts of urea (N=46 percent) and NPK (23:21:0), which are the two maize fertilizer products offered under FISP:
Applied phosphorus: Applied nitrogen:
Thus, total fertilizer used under this scenario is .
Incremental yield rate is calculated as ,
or , In other words, of the total average yield of 1,392 kg/ha, 597.6 kg can be attributed to N application of 33.2 kg/ha.
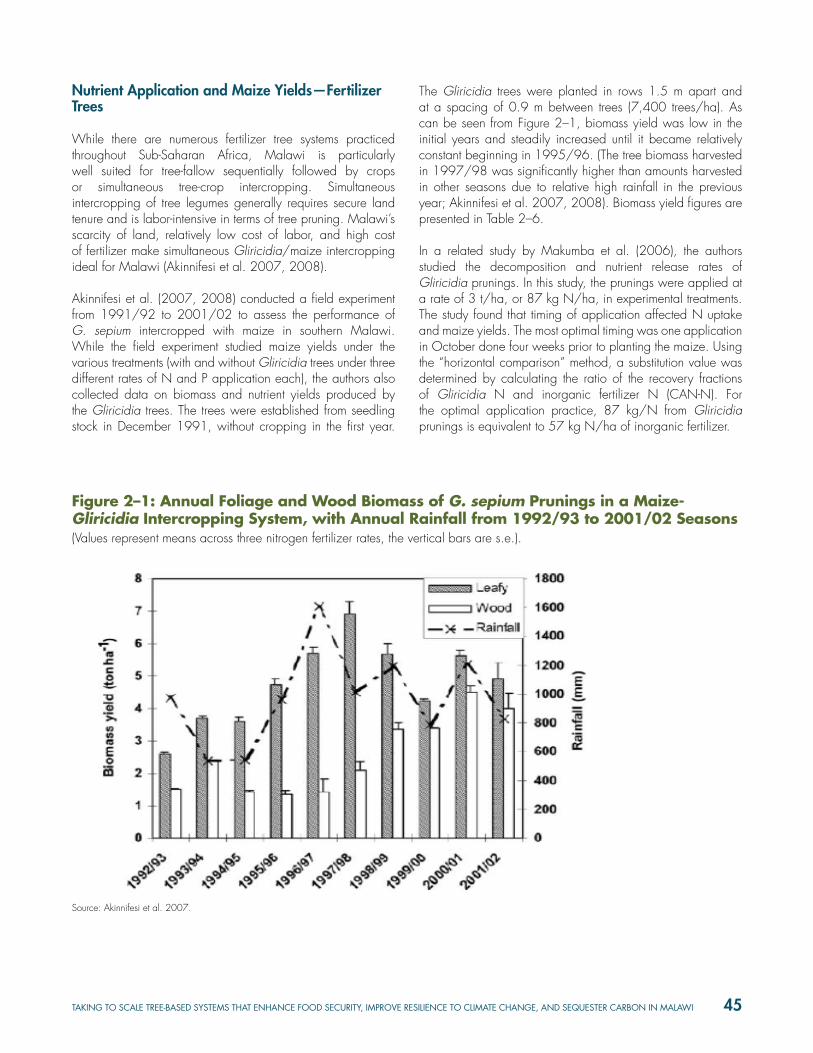
TAKING TO SCALE TREE-BASED SYSTEMS THAT ENHANCE FOOD SECURITY, IMPROVE RESILIENCE TO CLIMATE CHANGE, AND SEQUESTER CARBON IN MALAWI 45
Nutrient Application and Maize Yields—Fertilizer Trees
While there are numerous fertilizer tree systems practiced throughout Sub-Saharan Africa, Malawi is particularly well suited for tree-fallow sequentially followed by crops or simultaneous tree-crop intercropping. Simultaneous intercropping of tree legumes generally requires secure land tenure and is labor-intensive in terms of tree pruning. Malawi’s scarcity of land, relatively low cost of labor, and high cost of fertilizer make simultaneous Gliricidia/maize intercropping ideal for Malawi (Akinnifesi et al. 2007, 2008).
Akinnifesi et al. (2007, 2008) conducted a field experiment from 1991/92 to 2001/02 to assess the performance of G. sepium intercropped with maize in southern Malawi. While the field experiment studied maize yields under the various treatments (with and without Gliricidia trees under three different rates of N and P application each), the authors also collected data on biomass and nutrient yields produced by the Gliricidia trees. The trees were established from seedling stock in December 1991, without cropping in the first year.
The Gliricidia trees were planted in rows 1.5 m apart and at a spacing of 0.9 m between trees (7,400 trees/ha). As can be seen from Figure 2–1, biomass yield was low in the initial years and steadily increased until it became relatively constant beginning in 1995/96. (The tree biomass harvested in 1997/98 was significantly higher than amounts harvested in other seasons due to relative high rainfall in the previous year; Akinnifesi et al. 2007, 2008). Biomass yield figures are presented in Table 2–6.
In a related study by Makumba et al. (2006), the authors studied the decomposition and nutrient release rates of Gliricidia prunings. In this study, the prunings were applied at a rate of 3 t/ha, or 87 kg N/ha, in experimental treatments. The study found that timing of application affected N uptake and maize yields. The most optimal timing was one application in October done four weeks prior to planting the maize. Using the “horizontal comparison” method, a substitution value was determined by calculating the ratio of the recovery fractions of Gliricidia N and inorganic fertilizer N (CAN-N). For the optimal application practice, 87 kg/N from Gliricidia prunings is equivalent to 57 kg N/ha of inorganic fertilizer.
Figure 2–1: Annual Foliage and Wood Biomass of G. sepium Prunings in a Maize-Gliricidia Intercropping System, with Annual Rainfall from 1992/93 to 2001/02 Seasons (Values represent means across three nitrogen fertilizer rates, the vertical bars are s.e.).
Source: Akinnifesi et al. 2007.

46 TAKING TO SCALE TREE-BASED SYSTEMS THAT ENHANCE FOOD SECURITY, IMPROVE RESILIENCE TO CLIMATE CHANGE, AND SEQUESTER CARBON IN MALAWI
Table 2–6: Gliricidia sepium Biomass Yields Based on a Planting of 7,400 Trees/ha
Biomass yield (ton/ha)
1992/93 2.6
1993/94 3.8
1994/95 3.8
1995/96 4.75
1996/97 5.75
1997/98 6.8
1998/99 5.75
1999/00 4.25
2000/01 5.7
2001/02 5
Source: Figures collected from Akinnifesi et al. (2007) and approximated from Figure
2–1.
Based on the biomass yields presented in Table 2–6, the Gliricidia trees should produce sufficient biomass (3 t/ha) to produce 87 kg of Gliricidia N/ha after two years. The inorganic fertilizer N equivalent of 57 kg N/ha is more than the average amount of N applied (33.2 kg N/ha) in Whitbread, Sennhenn, and Grotelüschen’s (2013) study and approximately the same amount of subsidized fertilizer (60.5 kg) received by each beneficiary household in 2012/13.
Estimates for Substituting Fertilizer Trees for Subsidized Maize Fertilizer
Potential Savings per Farmer
In the 2012/13 cropping season, FISP reached 1,544,400 beneficiaries (households). Although each household was eligible to receive up to two 50 kg bags of fertilizer, it is estimated that the average household received 1.21 bags (60.5 kg) (Dorward et al 2013). Assuming that intercropping maize with Gliricidia trees would result in full Gliricidia fertilizer
4. While it is possible to augment Gliricidia trees with inorganic fertilizer, such practices are beyond the scope of this analysis.5. Trees do not produce N till year 3.6. This ratio assumes a linear relationship between amount of Gliricidia prunings applied and resulting inorganic N equivalent, which very well may not be the case. Even if the relationship is not linear, the ratio can be used with the assumption that farmers could sell excess Gliricidia biomass to be used as fertilizer.
substitution for subsidized fertilizer as early as the second cropping year (or the third year after tree establishment), fertilizer subsidies would only be necessary in the first cropping year.4 Even with a conservative assumption that households would receive the average 1.21 bags (60.5 kg) in the first cropping year, subsequent years would result in a savings of $0.76 * 60.5kg = $45.98 per household. While there are no good data on the lifespan of Gliricidia trees, some studies have reported the trees living up to 50 years under favorable conditions (Elevitch and Francis 2006). Using a conservative lifespan estimate of 15 years,5 of which 12 would produce sufficient Gliricidia fertilizer, the total savings (strictly in terms of FISP costs) from replacing subsidized fertilizer with Gliricidia fertilizer is $45.98 * 12 years = $551.76 per household.
Land Area under Fertilizer Tree Cover Needed to Replace All Maize Fertilizer Subsidies
Makumba et al. (2006) found that 3 t of Gliricidia prunings/ha produced enough organic N to replace 57 kg N/ha. However, as indicated in Table 2–6, Gliricidia trees planted at a density of 7,400 trees/ha produced more than 3 t of biomass/ha beginning in the third year after establishment. To estimate the full amount of inorganic fertilizer that can be replaced if all Gliricidia prunings are applied, the following ratio was calculated: 57 kg N / 3 t biomass = 19 kg N / t biomass. Using this ratio, the amount of inorganic N that can be replaced each year given varying biomass yields can be calculated (see Table 2–7).6 In years where biomass yield exceeded 3 t/ha (1993–2002), the average amount of inorganic N that can be replaced was 96.3 kg/ha. The average annual volume of subsidized maize fertilizer between 2009 and 2013 was 153,321 MT. In order to fully replace this volume, 1,592,617 ha (=153,321 MT / 96.3 kg) would need to be under a Gliricidia/maize intercropping system with a density of 7,400 trees/ha. Table 2–8 indicates the amount of land under cereal production in 2009–13 (World Bank Data 2016). As can be seen, the amount of land needed to produce enough biomass to replace subsidized maize fertilizer volumes is 84-89 percent of the land under cereal production. Practically speaking, using fertilizer trees to fully replace inorganic maize fertilizer subsidies would indeed be a large undertaking.

TAKING TO SCALE TREE-BASED SYSTEMS THAT ENHANCE FOOD SECURITY, IMPROVE RESILIENCE TO CLIMATE CHANGE, AND SEQUESTER CARBON IN MALAWI 47
Table 2–7: Inorganic N Equivalent to Biomass Yields, Using a Ratio of 19 N kg/t Biomass
Biomass yield (ton/ha)
Inorganic N equivalent (kg/ha)
1992/93 2.6
1993/94 3.8 72.2
1994/95 3.8 72.2
1995/96 4.75 90.3
1996/97 5.75 109.3
1997/98 6.8 129.2
1998/99 5.75 109.3
1999/00 4.25 80.8
2000/01 5.7 108.3
2001/02 5 95.0
Average 96.3
Table 2–8: Amount of Land under Fertilizer Tree Cover Needed as a Percent of Total Land under Cereal Production
Source: World Bank Data and analyst’s own calculations
Potential Total Savings
Assuming FISP continues to reach approximately 1,544,400 households and all of them adopt Gliricidia/maize intercropping systems, the potential total annual savings is estimated at $71 million per year (=1,544,400 * $45.98). If annual FISP costs remain relatively constant at $141 million to $151 million, from 2010–13, these savings would nearly halve FISP costs. However, full-scale adoption of Gliricidia/maize intercropping would require significant investment and capacity building, and there would likely be several years before such significant savings could be achieved.
Photo: World Agroforestry Center
Land under cereal
production (ha)
Amount of land under
fertilizer trees (ha)
% of land under cereal
production2009 1,792,559 1,592,617 89%2010 1,893,306 1,592,617 84%2011 1,874,110 1,592,617 85%2012 1,836,365 1,592,617 87%2013 1,881,457 1,592,617 85%

48 TAKING TO SCALE TREE-BASED SYSTEMS THAT ENHANCE FOOD SECURITY, IMPROVE RESILIENCE TO CLIMATE CHANGE, AND SEQUESTER CARBON IN MALAWI
Household Characteristics of Subsidized Fertilizer Beneficiaries and Fertilizer Tree Adopters
Table 2–9 outlines the characteristics of households receiving fertilizer coupons, disaggregated by number of coupons received per household. The households receiving more coupons tend to be wealthier, as indicated by the amount of land owned and value of assets. In addition, households receiving more coupons are less likely to be female-headed.
There are limited studies profiling households adopting agroforestry systems. Nonetheless, Table 2–10 summarizes some basic characteristics of households of both adopters and non-adopters. Thangata and Alavalapati’s (2003) data indicate that compared with non-adopters, adopters of Gliricidia/maize intercropping systems were younger and more educated, had more household members dedicated to farm work, and had fewer income-generating activities.
Given the different variables used in the two studies, it is difficult to compare the types of households that have access to fertilizer subsidies and are adopting fertilizer trees. However, one study by Sirrine, Shennan, and Sirrine (2010) indicated that 30.4 percent of households practicing agroforestry were headed by a female. Referring back to Table 2–9 on subsidized fertilizer users, this is a possible suggestion that FMNR benefits more female-headed households, and expanding adoption of FMNR could lead to improved impacts on households led by women.
Table 2–9: Mean Attributes of Households by Number of Fertilizer Subsidy Coupons Received per Household, 2012/13
Source: Dorward et al. 2013.
0 > 0 & < 1 1 > 1 AllSample size 789 222 621 348 1980% of households female headed 24 30 29 24 0.26Owned Area in ha 0.9 0.88 0.94 1.16 0.96Value durable assets (MK) 34,401 23,242 25,804 55,189 34,052 Value Livestock assets (MK) 53,110 26,824 45,697 179,997 69,787 Total Value livestock & durable assets (MK) 87,511 50,066 71,501 235,185 103,840 Subjective score of hh food consumption over past 12 months 1.4 1.4 1.5 1.6 1.5Subjective score on welfare 2.2 2.2 2.2 2.3 2.2Month after harvest that maize ran out 6.9 7.3 7.2 7.5 7.2
Fertilizer Coupon numbers per HH
Table 2–10: Household Characteristics of Gliricidia/Maize Intercropping System Adopters in Southern Malawi
Source: Adapted from Thangata and Alavalapati 2003.
Sample Adopters Non-adoptersn= 49 29 20
Age of household head 51.33 50.07 53.15Education level 3.31 3.86 2.5Income generating activities 11.98 11.9 12.1Number of HH members active in farm work 3.55 4.03 2.1
TAKING TO SCALE TREE-BASED SYSTEMS THAT ENHANCE FOOD SECURITY, IMPROVE RESILIENCE TO CLIMATE CHANGE, AND SEQUESTER CARBON IN MALAWI 49
REFERENCES
Ajayi, O. C. 2007. “User Acceptability of Soil Fertility Management Technologies: Lessons from Farmers’ Knowledge, Attitude and Practices in Southern Africa.” Journal of Sustainable Agriculture 30(3): 21–40.
Akinnifesi, F. K., W. Makumba, G. Sileshi, O. C. Ajayi, and D. Mweta. 2007. “Synergistic Effect of Inorganic N and P Fertilizers and Organic Inputs from Gliricidia sepium on Productivity of Intercropped Maize in Southern Malawi.” Plant Soil 294: 203–17.
Akinnifesi, F. K., P. W. Chirwa, O. C. Ajayi, G. Sileshi, P. Matakala, F. R. Kwesiga, H. Harawa, and W. Makumba. 2008. “Contributions of Agroforestry Research to Livelihood of Smallholder Farmers in Southern Africa: 1. Taking Stock of the Adaptation, Adoption and Impact of Fertilizer Tree Options.” Agricultural Journal 3(1): 58–75.
Albrecht, A., and S. Kandji. 2003.” Carbon Sequestration in Tropical Agroforestry Systems.” Agriculture, Ecosystems and Environment 99: 15–27.
Beedy, T., F. M. Place, Jules Bayala, and A. Kalinganire. 2011. “ Targeted Food Security and Carbon Benefits from Soil Fertility Replenishment Agroforestry Technologies.” Paper presented at an IFPRI Conference on Increasing Agricultural Productivity and Enhancing Food Security in Africa: New Challenges and Opportunities, Addis Ababa, Ethiopia, 1–3 November 2011.
De Leeuw, J., M. Njenga, B. Wagner, and M. Iiyama, eds. 2014. Treesilience: An Assessment of the Resilience Provided by Trees in the Drylands of Eastern Africa. Nairobi: World Agroforestry Centre.
Dewees, P. A. 1995. “Trees on Farms in Malawi: Private Investment, Public Policy, and Farmer Choice.” World Development 23(7): 1085–102.
Dorward, A., and E. Chirwa. 2010. “A Review of Methods for Estimating Yield and Production Impacts.” London: School of Oriental and African Studies.
——–. 2011. “The Malawi Agricultural Input Subsidy Programme: 2005–6 to 2008–9.” International Journal of Agricultural Sustainability 9(1): 232–47.
Dorward, A., E. Chirwa, R. Slater, T. Jayne, D. Boughton, and K. Valerie. 2008. “Evaluation of the 2006/7 Agricultural Input Subsidy Programme, Malawi: Final Report.” Prepared for MoAFS Malawi and DFID. London: School of Oriental and African Studies.
Dorward, A. R., E. W. Chirwa, M. M. Matita, W. Mhango, P. M. Mvula, E. J. Taylor, and K. Thorne. 2013. “Evaluation of the 2012/13 Farm Input Subsidy Programme, Malawi: Final Report.” Prepared for MoAFS Malawi and DFID. London: School of Oriental and African Studies.
Elevitch, C. R., and J. K. Francis. 2006. “Species Profiles for Pacific Island Agroforestry: Gliricidia sepium (Gliricidia).”
FAO (Food and Agriculture Organization of the United Nations). 2013. Land Cover Database of Malawi (data file). At www.fao.org/geonetwork/srv/en/resources.get?id=47987&fname=malawi_lc_full_res_47987.zip&access=private.
Francis, R., P. Weston, and J. Birch. 2015. The Social, Environmental and Economic Benefits of Farmer Managed Natural Regeneration (FMNR). World Vision.
Gamula, G. E. T., L. Hui, and W. Peng 2013. ”An Overview of the Energy Sector In Malawi.” Energy and the Power Engineering 5: 8-17.
Garrity, D. P., F. Akinnifesi, O. C. Ajayi, S. G. Weldesemayat, J. G. Mowo, A. Kalinganire, M. Larwanou, and J. Bayala. 2010. “Evergreen Agriculture: A Robust Approach to Sustainable Food Security in Africa.” Food Security 2: 197–214.
Giertz, A., J. Caballero, D. Galperin, D. Makoka, J. Olson, and G. German. 2015. Malawi: Agricultural Risk Assessment. Washington, D.C.
Jack, K. 2010. “Allocation in Environmental Markets: A Field Experiment with Tree Planting Contracts.” Discussion Paper 2009–14. Cambridge, MA: Harvard Environmental Economics Program.
Johnson, K. B., Jacob, A., and Brown, M.E. 2013. “ Forest Cover Associated with Improved Child Health and Nutrition: Evidence from the Malawi Demographic and Health Survey and Satellite Data.” Global Health: Science and Practice 1(2): 237–48.

50 TAKING TO SCALE TREE-BASED SYSTEMS THAT ENHANCE FOOD SECURITY, IMPROVE RESILIENCE TO CLIMATE CHANGE, AND SEQUESTER CARBON IN MALAWI
Makumba, W., B. Janssen, O. Oenema, and F. K. Akinnifesi. 2006. “Influence of Time of Application on the Performance of Gliricidia Prunings as a Source of N for Maize.“ Experimental Agriculture 42: 51–63.
Meijer, S. S., D. Catacutan, G. W. Sileshi, and M. Nieuwenhuis. 2015. “Tree Planting by Smallholder Farmers in Malawi: Using the Theory of Planned Behaviour to Examine the Relationship Between Attitudes and Behaviour.” Journal of Environmental Psychology 43: 1–12.
Oeba, V. O., S. C. J. Otor, J. B. Kung’u, and M. N. Muchiri. 2012. “Modelling Determinants of Tree Planting and Retention on Farm for Improvement of Forest Cover in Central Kenya.” ISRN Forestry. doi:10.5402/2012/867249.
Pattanayak, S. K., D. E. Mercer, E. Sills, and J. C. Yang. 2003. “Taking Stock of Agroforestry Adoption Studies.” Agroforestry Systems 57: 173–86.
Rhoades, C. C. 1995. “Seasonal Patterns of Nitrogen Mineralization and Soil Moisture Beneath Faidherbia albida (syn Acacia albida) in Central Malawi.” Agroforestry Systems 29: 133–45.
Saatchi, S. S., N. L. Harris, S. Brown, M. Lefsky, E. Mitchard, W. Salas, B. Zutta et al. 2011. “Benchmark Map of Forest Carbon Stocks in Tropical Regions across Three Continents.” Proceedings of the National Academy of Sciences 108 (24): 9899–904.
Shitumbanuma, V. 2012. “Analyses of Crop Trials Under Faidherbia albida.” Conservation Farming Unit, University of Zambia.
Sileshi, G. W., L. K. Debusho, and F. K. Akinnifesi. 2012. “Can Integration of Legume Trees Increase Yield Stability in Rainfed Maize Cropping Systems in Southern Africa.” Agronomy Journal 104: 1392–98.
Sileshi, G., F. K. Akinifesi, L. K. Bebusho, T. Beedy, O. C. Ajayi, and S. Mogomba. 2010. “Variation in Maize Yield Gaps with Plant Nutrient Inputs, Soil Type, and Climate across sub-Saharan Africa.” Field Crops Research 116: 1–3.
Sileshi, G. W., F. K. Akinifesi, O. C. Ajayi, and B. Muys. 2011. “Integration of Legume Trees in Maize Based Cropping Systems Improves Rainfall Use Efficiency and Crop Yield Stability.” Agricultural Water Management 98: 1364–72.
Sirrine, D., C. Shennan, and J. R. Sirrine. 2010. “Comparing Agroforestry Systems’ Ex Ante Adoption Potential and Ex Post Adoption: On-Farm Participatory Research from Southern Malawi.” Agroforestry Systems 79: 253–66.
Thangata, P., and J. R. R. Alavalapati. 2003. “Agroforestry Adoption in Southern Malawi: The Case of Mixed Intercropping of Gliricidia sepium and Maize.” Agricultural Systems 78: 57–71.
United Nations. 2010. The World’s Women 2010. New York.
Whitbread, A., A. Sennhenn, and K. Grotelüschen. 2013. Nitrogen-Use-Efficiency in Maize-Based Farming Systems in Malawi: A Simulation Study and Meta-Analysis of Literature: Final Report. Göttingen, Germany: University of Goettingen.
World Bank. 2012. Malawi - Country Assistance Strategy for the Period FY13–FY16. Washington, DC.
———. 2013. Malawi Public Expenditure Review. Poverty Reduction and Economic Management 4 Africa Region. Report No. 79865-NW. Washington, DC.
———. 2015. World Development Indicators 2015. Washington, DC.
———. World Bank Data: Malawi. Accessed 6/1/2016. At http://data.worldbank.org/country/malawi.
Zomer, R. J., A. Trabucco, R. Coe, F. Place, M. van Noordwijk, and J. C. Xu. 2014. Trees on Farms: An Update and Reanalysis of Agroforestry’s Global Extent and Socio-ecological Characteristics. Working Paper 179. Bogor, Indonesia: Southeast Asia Regional Program, World Agroforestry Centre.

TAKING TO SCALE TREE-BASED SYSTEMS THAT ENHANCE FOOD SECURITY, IMPROVE RESILIENCE TO CLIMATE CHANGE, AND SEQUESTER CARBON IN MALAWI C
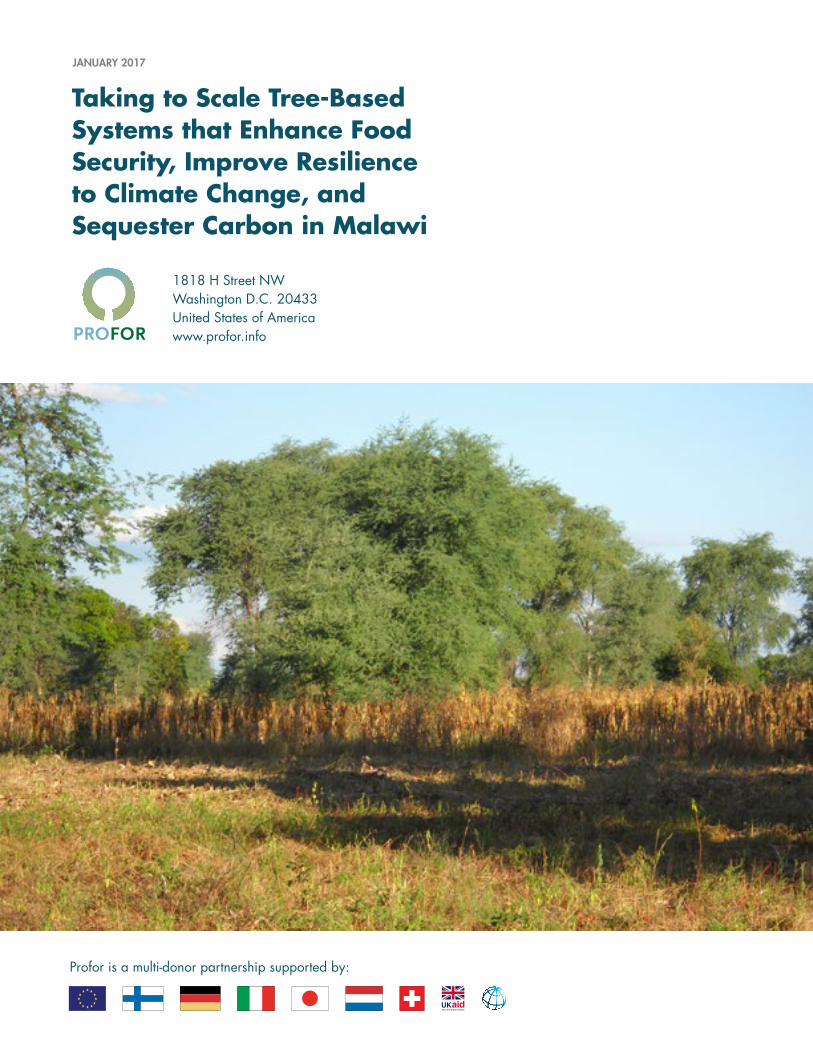
Taking to Scale Tree-Based Systems that Enhance Food Security, Improve Resilience to Climate Change, and Sequester Carbon in Malawi
1818 H Street NWWashington D.C. 20433United States of Americawww.profor.info
JANUARY 2017
Profor is a multi-donor partnership supported by: