Taking Charge 2011 Reportppc.unl.edu/wp-content/uploads/2014/03/TakingCharge2011...Manya Arond...
57
215 Centennial Mall South, Suite 401, Lincoln, NE 68588-0228 Ph: 402-472-5678 | Fax: 402-472-5679 www.ppc.nebraska.edu TAKING CHARGE 2011 A Study of the 2011 Budgeting Priorities of the Residents of Lincoln, Nebraska FINAL REPORT July 11, 2011 With Contributions from Lisa M. PytlikZillig, Ph.D. Tarik Abdel-Monem, J.D., M.P.H. Mitchel N. Herian, Ph.D. Deadric T. Williams, M.S. & Alan J. Tomkins, J.D., Ph.D.
-
Upload
truonghuong -
Category
Documents
-
view
213 -
download
0
Transcript of Taking Charge 2011 Reportppc.unl.edu/wp-content/uploads/2014/03/TakingCharge2011...Manya Arond...

215 Centennial Mall South, Suite 401, Lincoln, NE 68588-0228 Ph: 402-472-5678 | Fax: 402-472-5679
www.ppc.nebraska.edu
TAKING CHARGE 2011 A Study of the 2011 Budgeting Priorities of the Residents of Lincoln, Nebraska FINAL REPORT July 11, 2011 With Contributions from Lisa M. PytlikZillig, Ph.D. Tarik Abdel-Monem, J.D., M.P.H. Mitchel N. Herian, Ph.D. Deadric T. Williams, M.S. & Alan J. Tomkins, J.D., Ph.D.
Page | 1
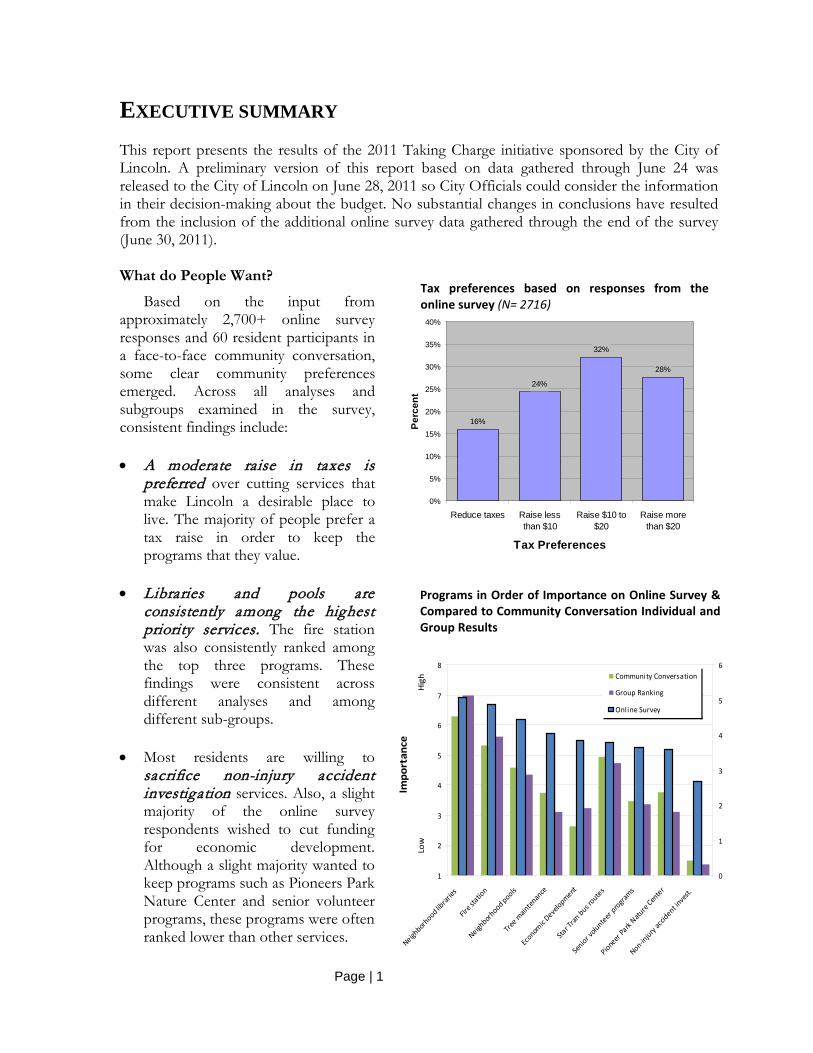
EXECUTIVE SUMMARY This report presents the results of the 2011 Taking Charge initiative sponsored by the City of Lincoln. A preliminary version of this report based on data gathered through June 24 was released to the City of Lincoln on June 28, 2011 so City Officials could consider the information in their decision-making about the budget. No substantial changes in conclusions have resulted from the inclusion of the additional online survey data gathered through the end of the survey (June 30, 2011). What do People Want?
Based on the input from approximately 2,700+ online survey responses and 60 resident participants in a face-to-face community conversation, some clear community preferences emerged. Across all analyses and subgroups examined in the survey, consistent findings include: • A moderate raise in taxes is
preferred over cutting services that make Lincoln a desirable place to live. The majority of people prefer a tax raise in order to keep the programs that they value.
• Libraries and pools are consistently among the highest priority services. The fire station was also consistently ranked among the top three programs. These findings were consistent across different analyses and among different sub-groups.
• Most residents are willing to sacrifice non-injury accident investigation services. Also, a slight majority of the online survey respondents wished to cut funding for economic development. Although a slight majority wanted to keep programs such as Pioneers Park Nature Center and senior volunteer programs, these programs were often ranked lower than other services.
Tax preferences based on responses from the online survey (N= 2716)
16%
24%
32%
28%
0%
5%
10%
15%
20%
25%
30%
35%
40%
Reduce taxes Raise lessthan $10
Raise $10 to$20
Raise morethan $20
Tax Preferences
Perc
ent
Programs in Order of Importance on Online Survey & Compared to Community Conversation Individual and Group Results
1
2
3
4
5
6
7
8
Neighborh
ood librar
ies
Fire s
tation
Neighborh
ood pools
Tree m
ainten
ance
Econom
ic Deve
lopment
Star T
ran bus r
outes
Senior v
olunteer
programs
Pioneer
Park
Nature
Center
Non-injury
accid
ent inve
st.
0
1
2
3
4
5
6Community Conversation
Group Ranking
Online Survey
Impo
rtan
ceLo
wH
igh
Page | 2
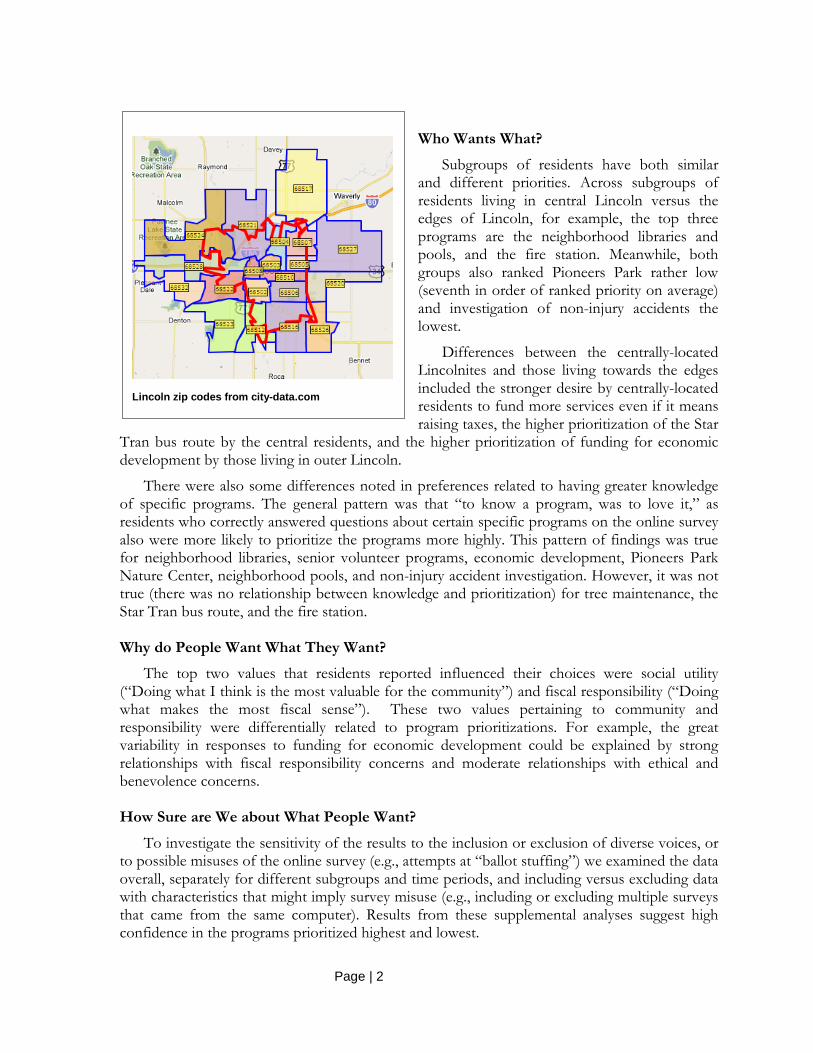
Who Wants What?
Subgroups of residents have both similar and different priorities. Across subgroups of residents living in central Lincoln versus the edges of Lincoln, for example, the top three programs are the neighborhood libraries and pools, and the fire station. Meanwhile, both groups also ranked Pioneers Park rather low (seventh in order of ranked priority on average) and investigation of non-injury accidents the lowest.
Differences between the centrally-located Lincolnites and those living towards the edges included the stronger desire by centrally-located residents to fund more services even if it means raising taxes, the higher prioritization of the Star
Tran bus route by the central residents, and the higher prioritization of funding for economic development by those living in outer Lincoln.
There were also some differences noted in preferences related to having greater knowledge of specific programs. The general pattern was that “to know a program, was to love it,” as residents who correctly answered questions about certain specific programs on the online survey also were more likely to prioritize the programs more highly. This pattern of findings was true for neighborhood libraries, senior volunteer programs, economic development, Pioneers Park Nature Center, neighborhood pools, and non-injury accident investigation. However, it was not true (there was no relationship between knowledge and prioritization) for tree maintenance, the Star Tran bus route, and the fire station. Why do People Want What They Want?
The top two values that residents reported influenced their choices were social utility (“Doing what I think is the most valuable for the community”) and fiscal responsibility (“Doing what makes the most fiscal sense”). These two values pertaining to community and responsibility were differentially related to program prioritizations. For example, the great variability in responses to funding for economic development could be explained by strong relationships with fiscal responsibility concerns and moderate relationships with ethical and benevolence concerns. How Sure are We about What People Want?
To investigate the sensitivity of the results to the inclusion or exclusion of diverse voices, or to possible misuses of the online survey (e.g., attempts at “ballot stuffing”) we examined the data overall, separately for different subgroups and time periods, and including versus excluding data with characteristics that might imply survey misuse (e.g., including or excluding multiple surveys that came from the same computer). Results from these supplemental analyses suggest high confidence in the programs prioritized highest and lowest.
Lincoln zip codes from city-data.com
Page | 3
TABLE OF CONTENTS
Acknowledgements ................................................................................................................. 4
Background .............................................................................................................................. 5
Purpose .......................................................................................................................... 5
Budgeting for Outcomes: From Priority Lincoln to Taking Charge ...................... 5
Taking Charge 2011 ................................................................................................................ 6
The 2011 Fiscal Environment ...................................................................................... 6
Public Participation Methods ....................................................................................... 6
Online Survey ........................................................................................................... 6
Community Conversation ...................................................................................... 9
Online Discussions ................................................................................................10
Timeline: Recruitment, Publicity & Concurrent Events ........................................11
Demographics & Data Representativeness ..............................................................13
Key Findings ..........................................................................................................................14
What do People Want? Overall Program Priorities ................................................14
Who Wants What? Differences between Groups ...................................................19
Residents of Central & Outer Lincoln ................................................................19
Knowledge-Related Differences in Opinions ....................................................21
Why do People Want What They Want? Reasons from Residents ......................22
How Sure are We about What People Want? Caveats and Confidences .............26
References ..............................................................................................................................28
Appendices .............................................................................................................................29
Appendix A: Inclusion & Exclusion of Online Survey Responses ......................29
Appendix B: Resident Reasons for Program Prioritizations ................................35
Appendix C: Preliminary Report ..............................................................................45
Page | 4
ACKNOWLEDGEMENTS
While the work in this report could not have been accomplished without the vision of Lincoln Mayor Chris Beutler, it takes a village—or a city like Lincoln—to successfully accomplish the expansive public participation activities that were undertaken to make this report possible. In addition to funding from the City of Lincoln, in-kind and other product and service donations were provided by The Mediation Center (www.themediationcenter.org), The Nebraska Mediation Association (nemediation.org), Leadership Lincoln (www.leadershiplincoln.org), Creighton University’s Werner Institute for Negotiation and Dispute Resolution (www.creighton.edu/werner), University of Nebraska-Lincoln Department of Communication Studies Graduate Program (www.unl.edu/cs/grad), the University of Nebraska-Lincoln College of Law (law.unl.edu), Qualtrics Survey Software Company of Provo, Utah (www.qualtrics.com), the Pesticide Education Office of the Agronomy and Horticulture Department (pested.unl.edu), and the University of Nebraska Public Policy Center (ppc.nebraska.edu).
Many thanks go to Nancy Shank of the Public Policy Center for moderating the June 18th Community Conversation, and Dr. Eric Thompson, UNL College of Business Administration, for offering his expertise and a presentation on the impact of taxes on local economic development. Thanks also go to the many individuals who volunteered their efforts to ensure the Community Conversation was a success by managing the event and moderating discussions: Kristen Blankley, Linda Butcher, Jennifer Elliott, Joshua Ewalt, Bruce Friedman, Scott Goodloe, Laura Hasemann, Stacey Hoffman, Paul Huebner, Jennifer Klein, Maggie Krause, Ryan Lowry, Laura Kaputska, Liz King, Justin Kohmetscher, Jayme Neiman, Amy Sherman, Rachel Stohr, Manya Arond Thomas, Rick Vest, Tobin Wolfe, Cyndi Woollam, and the many members of the City Staff who helped plan and set up and participated in the event.
Additional thanks to Clyde Ogg and Vicki Schroeder of the University of Nebraska-Lincoln Pesticide Education Office for providing the remote voting technology used at the Community Conversation, and Bill Luxford and the staff of 5 City-TV for taping and producing part of the Community Conversation events for broadcast on Channel 5. The Lincoln Journal Star provided coverage of the events and links from their website to facilitate access the online survey, for which we are most appreciative. We also want to thank Coby Mach, host of Drive Time Lincoln (KLIN radio, www.klin.com), for featuring the Taking Charge survey and events on his show. Special thanks also go to those members of the Mayor’s Environmental Task Force who helped to spread awareness of the survey. Numerous others also did their part to recruit survey participation among their associates, and to encourage Lincoln residents to give their input. We extend our thanks for their assistance, which was a vital part of ensuring the representation of a wide range of voices throughout Lincoln.
The most important thanks, however, go to the approximately 2,700 residents of Lincoln, Nebraska who took their time and put forth their effort to think through the difficult choices currently facing City administrators. Their willingness to learn more about the City’s fiscal situation and the programs that could be affected, and to give both their recommendations and reasons for how the City should handle the current fiscal challenges are key to keeping democracy alive and Lincoln thriving.
Page | 5
BACKGROUND
PURPOSE As part of its commitment to transparency and the inclusion of public input into its
decision-making, the City of Lincoln held its Taking Charge 2011 initiative from May 10th to June 30th of 2011. The initiative included a citywide online survey, opportunities for online discussion, and a day-long face-to-face Community Conversation among residents and public officials. This report presents the key findings from the City’s 2011 activities. A preliminary version of this report based on data gathered through June 24 was released to the City of Lincoln on June 28, 2011 so City Officials could consider the information in their decision-making about the budget. No substantial changes in conclusions have resulted from the inclusion of the additional online survey data gathered through the end of the survey (June 30, 2011).
In addition to reporting key findings, this report provides an overview of the activities and procedures used to gather public input, the analyses applied to the data gathered, and the strengths and limitations of various approaches. The intended audiences of the report are the City of Lincoln Government, who requested the information for consideration as they make their final budgeting decisions, and the City of Lincoln residents and interest groups who provided input or otherwise have an interest in the results.
Feedback pertaining to the findings of this report and how they might relate to prioritizing City services1 can be directed to [email protected]. Feedback, questions and comments pertaining to the study design, procedures and statistical analyses in this report can be sent to Lisa PytlikZillig at [email protected].
BUDGETING FOR OUTCOMES: FROM PRIORITY LINCOLN TO TAKING CHARGE
The Taking Charge 2011 project was the fourth public engagement initiative the City of Lincoln has convened about its budget and public services. In 2008 the City of Lincoln began its long-term commitment to moving away from incremental budgeting and toward outcome-based budgeting. In outcomes-based budgeting, city priorities and performance criteria are identified and assessed with active input from residents. Thus, the City launched Priority Lincoln, which consisted of a random sample telephone survey, a nonrandom online survey, town hall meetings, a deliberative discussion involving over 50 residents and City officials, and a small focus group. Since the effort in 2008, the City has convened a series of additional surveys (both random and nonrandom) and online and face-to-face discussions about the budget in order to stay in touch with Lincoln
1 For more information about the current prioritization of services, and to view the Mayor’s Community Prioritization, including the ranking of all 224 of the City’s programs in light of citizen and staff input, see http://lincoln.ne.gov/city/mayor/takingcharge/program-prioritization.htm.
Page | 6
residents’ interests and priorities regarding the budget (University of Nebraska Public Policy Center, 2008, 2009). Specifically, in 2009 in conjunction with the Alfred P. Sloan Foundation, the City implemented a non-random online survey with over 1,800 respondents and convened an all-day discussion with 107 Lincolnites to measure community attitudes toward various performance measures with which to guide City budget decisions. In 2010, the City focused on incorporating a public satisfaction with services element into its budgeting process. From November 2009 to January 2010, the Policy Center worked with the City to conduct a random phone survey of 605 residents and a non-random online survey with about 1,000 respondents. Another discussion, this time involving 83 residents and City officials, was also held to focus on budgetary issues and City services.
TAKING CHARGE 2011
THE 2011 FISCAL ENVIRONMENT The 2011 budget was perceived to be an extremely difficult fiscal year for the City
due to a reported deficit of at least $6.2 million dollars (later projected at $9.3 million), a state legislative decision to reduce state aid to cities, and the continuing national recession (Hicks, 2011a; O’Hanlon, 2011; Pascale, 2011). The budgetary situation was preceded by several consecutive years of City budget deficits which resulted in significant reductions in City programs and the elimination of positions (Lincoln Journal Star, 2010). Since 2008, 116 City positions have been eliminated, and public bus and library services have been reduced, among other changes (Hicks, 2011b).2
PUBLIC PARTICIPATION METHODS As part of the Taking Charge 2011 efforts, the City provided multiple opportunities
for residents to give their input, including an online survey, online discussions, and a face-to-face Community Conversation with City officials.
Online Survey The online survey3 was open from May 10 until June 30, 2011. The survey was
available via a link on the front page of the City’s website, and prominently featured on the City’s Taking Charge webpage.4 In addition, press releases and media publicity directed residents to the websites linking to the survey.5 The Taking Charge 2011 survey 2 For additional information about the deficit, see http://lincoln.ne.gov/city/mayor/takingcharge/index.htm. 3 All surveys and measures used in this study are available from the authors. For copies, contact Lisa PytlikZillig at [email protected] or [email protected]. 4 Webpage is located at http://lincoln.ne.gov/city/mayor/takingcharge/. 5 A list of media coverage of the Taking Charge 2011 activities and events can be found at the Public Policy Center project page, http://ppc.unl.edu/project/TakingCharge2011.
Page | 7
had a record number of hits—it was accessed 4,617 times (this includes 314 views of the student version of the survey, the data for which are not included in this report6), approximately 2-3 times more than previous years in which online surveys were made available. Of the total number of accesses, however, it was estimated that approximately 2,700 responses were serious and valid responses (see Appendix A for a description of procedures used to determine inclusion of survey responses).
The survey question of greatest relevance to decisions facing the City was the simulated budgeting question in which nine programs were listed and residents were asked to choose to fund or cut each program. This question was presented at the beginning of the survey7 and accompanied by information about the projected deficit. Residents were asked to imagine that they were in the process of balancing the budget, that they had already allocated monies to mandated and high priority programs, and now only had $750K left to allocate if they wanted to avoid raising taxes. Then they were asked to choose from among $3.52M worth of current programs that were still in need of funding in order to be continued.
It should be noted that the simulation simplified and represented only a small portion of the deficit. The simulated deficit was only $2.77M (i.e., $750K less than $3520K), while the actual deficit was projected to be between $6.2M and $9.3M (Hicks, 2011; Pascale, 2011). The reason for using a simulation with a smaller deficit was in order to keep the task manageable. Attempting to represent the full deficit and to list all of the medium and lower priority programs that could be affected (there were 122 total Tier 2 and 3 programs that were considered of medium or low priority) would have resulted in an overwhelming task that, in all likelihood, most people would not have completed.
The small list of programs presented to residents were chosen based on the following criteria: (1) each program needed to be one that the City was able to cut and under serious consideration for cutting back,8 (2) each program needed to be one which would likely benefit from community discussion (e.g., programs that were of medium or low
6 The citywide survey was part of research that had been approved for adults by the Institutional Review Board for Protection of Human Subjects. Therefore, the student survey was launched to provide an alternative place for residents under the age of 19 (Nebraska’s legal age of majority) to express their views to the City, while still keeping their information separate from the research data. At the beginning of the primary survey, a prominent link was displayed requesting that persons under 19 complete the student version. While there were 314 visits to the student survey, it appeared that most of the people who viewed it were simply curious to see it. Only 20 of the responses appeared to be serious responses from actual students (based on an examination of items pertaining to age and grade). An additional 26 persons appeared to be adults who chose to complete the student version of the survey. The remainder of the entries appeared to be invalid (based on very high rates of missing data and time stamps indicating quickly moving from one page to another). It may be that many who visited the student survey were simply curious about the extent to which it differed from the actual survey. In fact, the student survey was identical to the adult version except for a few questions, such as level of education (students were asked their grade level, and adults were asked about the highest level of education they had achieved). 7 The question was presented right after a consent form and five brief questions asking residents how informed they were about City issues and the budget and how much confidence they had in City government 8 As noted on its Community Prioritization page (see http://lincoln.ne.gov/city/mayor/takingcharge/program-prioritization.htm), certain programs designated as “Tier 0” programs were required by state or federal mandates and could not be considered for cuts.
Page | 8
priority but that community members might reasonably disagree about whether the programs were vital in times of economic hardship), and (3) programs were chosen to be representative of a broad spectrum of outcomes (e.g., Safety & Security, Economic Opportunity, Efficient Transportation9).
The final list of programs in the budget simulation survey question were financial support for economic development ($500K), support of a low-use fire station ($900K), maintenance of street trees ($500K), non-injury accident investigations ($140K), operation and maintenance of neighborhood libraries ($510K) and pools ($150K), support of Pioneers Park Nature Center ($430K), coordination and support of senior citizen volunteer programs ($200K) and the continued offering of a low-use Star Tran bus route ($190K). The program costs associated with each program were real and matched the reported amounts listed on the City’s Community Prioritization page.10 Participants were also offered the opportunity to read additional information that the City had prepared about each program and the likely implications of cutting the program.
Participants’ choices of programs to fund or cut were followed by computer-generated feedback regarding how their choices would (according to the simulation) impact property taxes. The possible outcomes in the simulation ranged from a $7.50 decrease to a $27.70 increase in annual property taxes on an average cost ($150K) Lincoln home.11 The computation of the change in taxes was based on the actual relationship between property taxes on an average home and the revenue generated by those taxes (i.e., $1 per year results in approximately $100K of revenue). The feedback page also encouraged participants to return to the budget simulation question to change their choices if they did not agree with the tax result.
After completing the simulated budgeting question, participants were asked to explicitly indicate whether or not they would accept the estimated increase or decrease in estimated taxes computed by the system (yes/no) and the extent to which they felt satisfied with their choices. As noted in the survey, this opportunity was provided because “Although you [the participant] may have made the best choices you felt you could given the constraints of the exercise, the constraints themselves may have affected how satisfied you feel about the choices you made.” To obtain more detail about resident preferences, participants also were asked to rank order the programs that they chose to fund or not to fund in order of importance for funding. Finally, participants were also asked to explain why they ranked certain programs higher or lower in priority, and if they were not satisfied with their choices of programs, to explain why not.
Other survey questions included questions designed to assess resident reasons for their choices of programs, their satisfaction with and trust in City government, and demographics (e.g., race/ethnicity, gender, age, zip code). Demographics were asked in 9 See http://lincoln.ne.gov/city/mayor/takingcharge/performance-indicators.htm for the list of program areas, outcomes and goals. 10 See http://lincoln.ne.gov/city/mayor/takingcharge/program-prioritization.htm. 11 Throughout most of the survey, the estimated deficit was about $6.2M and the actual increase in taxes needed to cover that deficit was estimated to be approximately $60-$70 annually, for an average cost ($150K) Lincoln home.
Page | 9
order to assess the extent to which the survey respondents represented Lincoln as a whole.
Finally, at the end of the survey, participants were asked if they would be willing to answer an additional set of questions strictly for the purposes of the research being conducted by the Public Policy Center. These questions were for the purposes of improving public engagement activities in the future and not for the purposes of providing input to the City. Thus, they are not discussed at length in the current report.
Community Conversation The Community Conversation on the budget was held Saturday, June 18, 2011 at City
Hall. The objective of the Conversation was to provide an opportunity for respondents to engage with each other, City department heads, and the Mayor, about the budget situation and City services. Moderators recruited for the Conversation included experienced facilitators from the Public Policy Center, The Mediation Center, Nebraska Mediation Association, and Creighton University’s Werner Institute for Negotiation and Dispute Resolution, as well as graduate students from the University of Nebraska-Lincoln Department of Communication Studies, and the University of Nebraska-Lincoln College of Law.
A total of 281 online survey respondents indicated on the survey that they wanted to attend the Community Conversation. Those individuals were contacted by e-mail, letter, and telephone, and asked to confirm their participation. A total of 70 people confirmed their attendance with the Policy Center prior to the event, and 60 individuals attended.
The format for the Conversation was based on the Deliberative Polling model - a public engagement method which has been used successfully in a variety of other municipalities across the nation (Fishkin, 1996, 1996). Deliberative Polling measures changes in opinions and knowledge about a public policy issue among individuals after having had an opportunity to learn more about the issue and discuss it with others. As opposed to a survey, Deliberative Polling thus provides individuals with an opportunity to consider their ideas with others, and make decisions informed by other perspectives (Fishkin & Luskin, 2005).
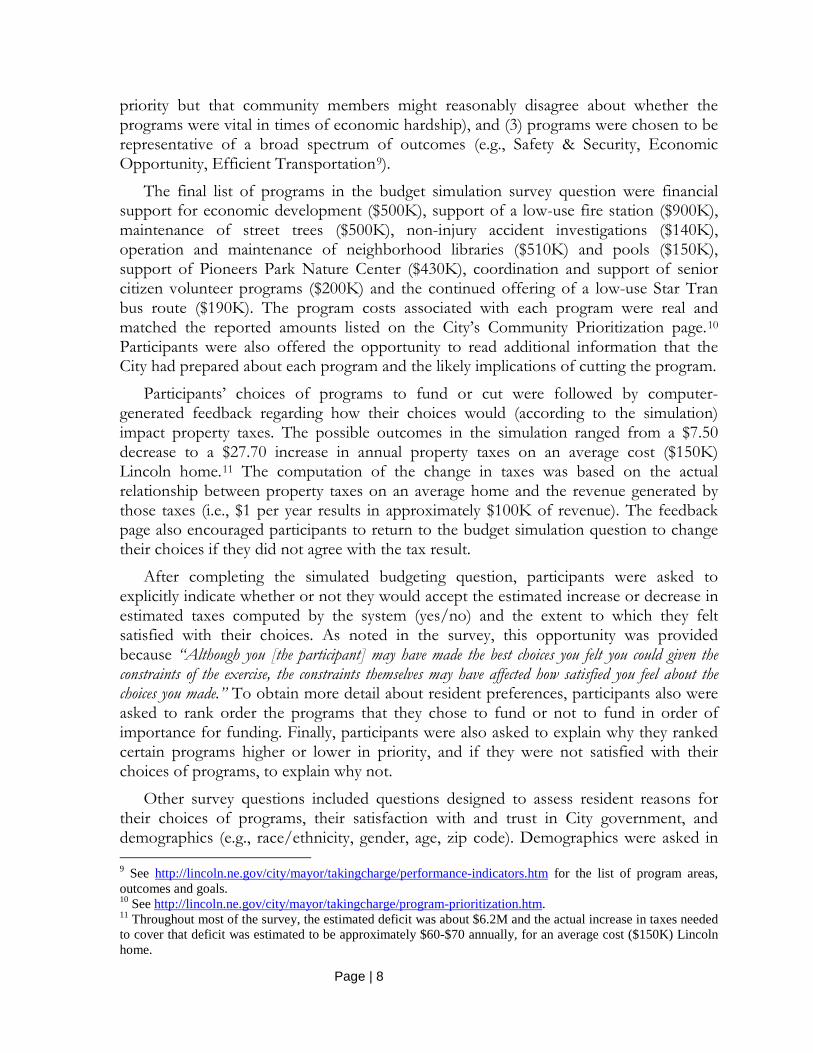
Upon arrival at the meeting, individuals were randomly assigned to one of eight small discussion groups, each one facilitated by discussion moderators. Participants completed a pre-event survey at the beginning of the day. The Conversation was then composed of the following activities: 1) A large group session in which Mayor Chris Beutler provided a presentation about the City of Lincoln’s budget and City services; 2) a small group session
Mayor Chris Beutler presented an overview of the City budget and services to residents at the Community Conversation.
Page | 10
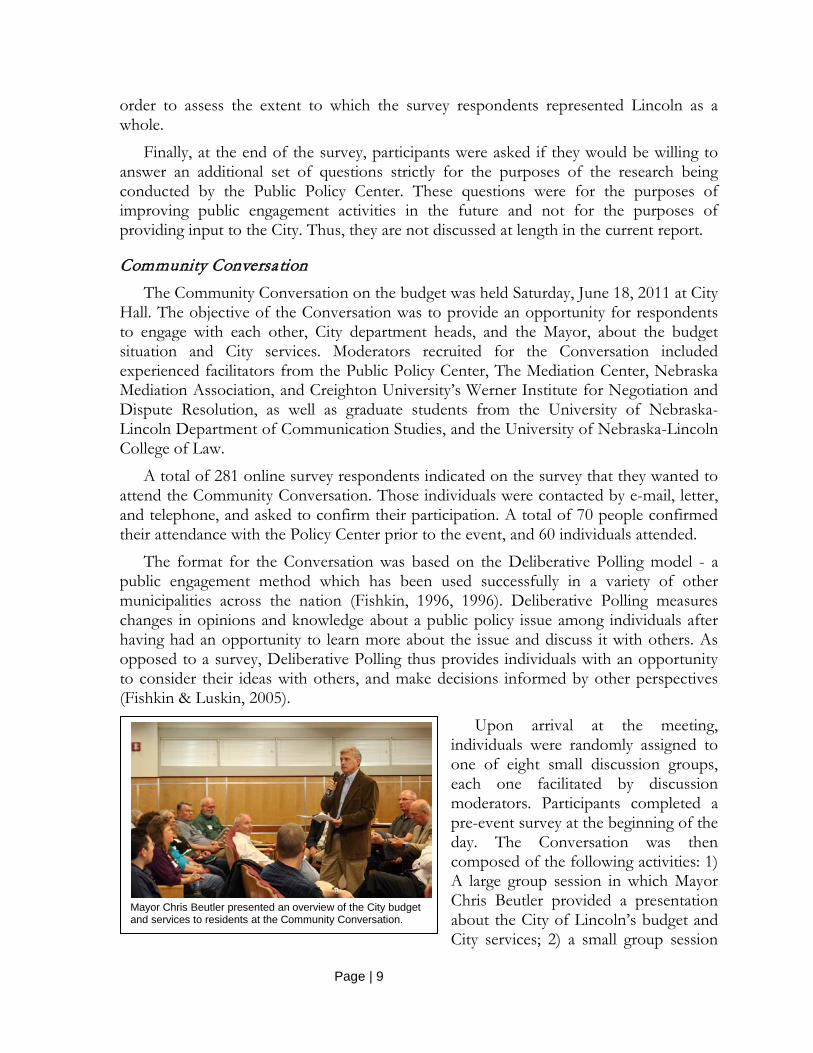
in which participants identified questions for City department heads about the budget and services; 3) a large group session featuring a presentation by Dr. Eric Thompson, UNL College of Business Administration concerning tax revenue and local economic development; 4) a question and answer session with City department heads responding to participants’ questions; 5) a small group session in which participants ranked the select City services in order of importance and identified whether they should be preserved or eliminated from the budget; and finally, 6) a large group session in which participants reported back on their discussion results. At the end of the day, participants completed a post-event survey containing many of the same questions asked on the pre-event survey.
In addition, throughout the day, Conversation participants were given the opportunity to video-record individual messages that they would like the Mayor and City Directors to hear. The proceedings were also videotaped and played on the City’s Channel 5.12
Online Discussion Opportunities In addition to the online survey and the Community Conversation, this year the
Taking Charge initiative offered two opportunities for online discussions. Within these discussions, City officials had agreed to monitor and respond to questions posed in their areas of the discussion sites. The first opportunity was the availability of an online discussion forum hosted by a free provider (takingcharge2011discussion.iforums.us). This discussion site included threads for the discussion of each of the nine programs included on the survey, and additional threads for introductions between participants, questions about the discussion forum, and other questions or topics that did not fit neatly under any of the program topics. However, very few Lincoln residents participated in the online discussions. To encourage greater participation, the link to the discussion area was posted prominently on the City’s Community Prioritization webpage, and the discussion area was mentioned in at least two press conferences. In addition, a sample of the reasons frequently mentioned by initial survey responders for keeping or eliminating each program were posted to the discussion area in hopes of generating discussion.
In spite of these efforts, a question on the survey asking people to indicate if they visited the discussion area found that only 14.5% said that they did. These visitors were more frequent than contributors: A total of only approximately 25 individuals appeared to participate in the discussions.
12 The 2011 Taking Charge Community Conversation can be viewed at http://lincoln.ne.gov/city/mayor/cic/5citytv/vod/vod-current.htm#charge.
Lincoln parks and recreation director Lynn Johnson answering questions from residents at the Community Conversation.
Page | 11
A second opportunity to interact with other residents online was offered when the City unveiled their new Community Prioritization webpage. A common comment within the online survey was that the list of nine budget items on the survey was too restrictive. In response to this sentiment, a free website hosting service was used to allow participants to make suggestions about items they felt should be cut from the budget and to vote on suggestions made by others (takingcharge.uservoice.com). Once again, however, participation in this online discussion area was also limited. Although up to approximately 50 people may have participated, only about 20 of the people were identified as individuals with valid email addresses. There is no way to know if the numerous “Anonymous” participants were single persons logging on multiple times or not.13
TIMELINE: RECRUITMENT, PUBLICITY & CONCURRENT EVENTS
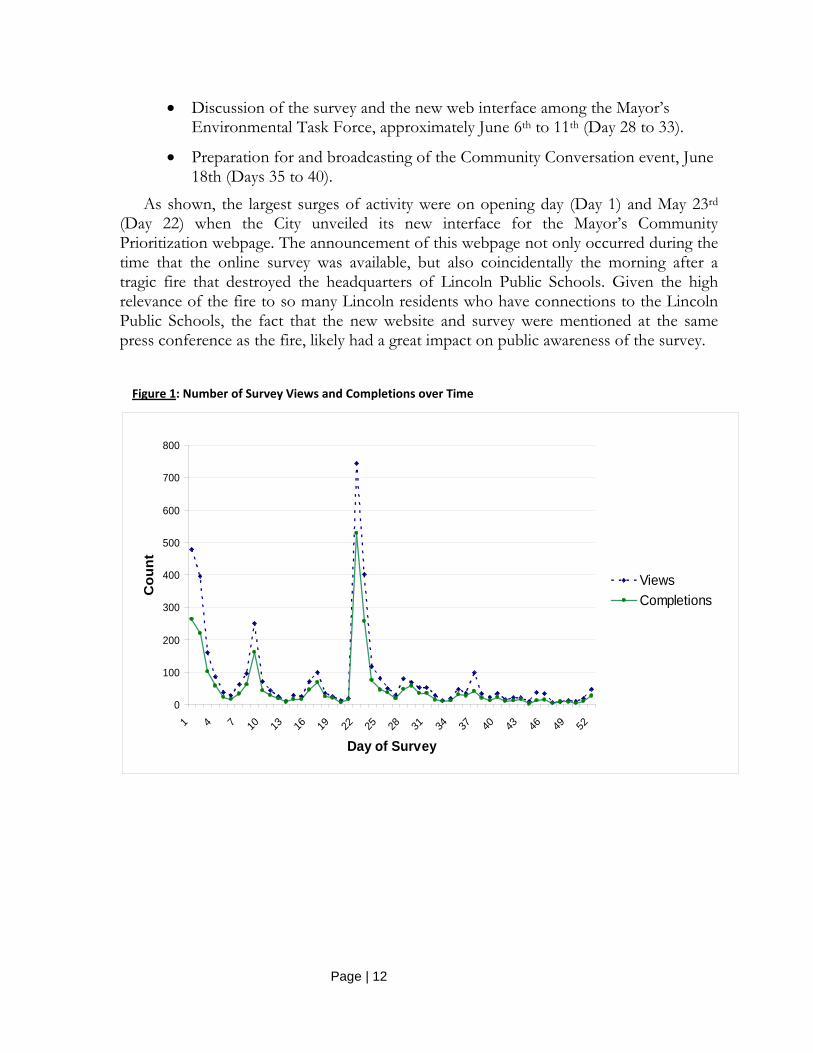
All public participation events occur in a historical context that may influence the overall results. Recruitment efforts, publicity, and coincidental concurrent events can influence who participates, and why they do so. A timeline of the number of survey responses received by day of the survey is shown in Figure 1. Examination of Figure 1 shows that while there were many more views of the survey than actual completion of the budgeting questions, the percentage of completions to views was relatively constant and thus the profile shapes of the two lines are similar. Increases in participation may be tied to events occurring during the time that the survey was open as follows:
• The survey’s opening day press conference on May 10th (Day 1 peak, falling to Day 6).
• News and media attention focused on the survey due to the optional questions included as part of the PPC’s research. May 16-19th (Days 7 to 10, and participation falling through Day 13).
• An announcement of the survey in a newsletter sent to businesses and persons oriented toward economic development opportunities, at the end of May, beginning of June.14
• A second press conference held by the City to release a new interface for the Mayor’s Community Prioritization page, which was designed to facilitate transparency by listing all City programs and their costs, May 31st (Day 22 and falling to Day 27).
13 Those interested in seeing the votes cast and comments made may wish to visit takingcharge.uservoice.com. At the time of the release of this report, the top 10 suggestions for program elimination were Financial Support for Economic Development (38 votes), Take a long hard look at administrative costs (35 votes), Stop spending money on bogus surveys (31), Non-injury accident investigations (24), Fire station (23), Maintenance of street trees (16 votes), Pioneers Park Nature Center (16 votes), Consider taxes and their sources (14 votes), Operation and maintenance of neighborhood libraries (10 votes), and Senior citizen volunteer programs (9 votes). 14 The article is in the June 2011 issue of Strictly Business, see also http://www.strictly-business.com/35/199.3483/surveys-roads-the-cir.aspx.
Page | 12
• Discussion of the survey and the new web interface among the Mayor’s Environmental Task Force, approximately June 6th to 11th (Day 28 to 33).
• Preparation for and broadcasting of the Community Conversation event, June 18th (Days 35 to 40).
As shown, the largest surges of activity were on opening day (Day 1) and May 23rd (Day 22) when the City unveiled its new interface for the Mayor’s Community Prioritization webpage. The announcement of this webpage not only occurred during the time that the online survey was available, but also coincidentally the morning after a tragic fire that destroyed the headquarters of Lincoln Public Schools. Given the high relevance of the fire to so many Lincoln residents who have connections to the Lincoln Public Schools, the fact that the new website and survey were mentioned at the same press conference as the fire, likely had a great impact on public awareness of the survey.
Figure 1: Number of Survey Views and Completions over Time
0
100
200
300
400
500
600
700
800
1 4 7 10 13 16 19 22 25 28 31 34 37 40 43 46 49 52
Day of Survey
Cou
nt
ViewsCompletions
Page | 13
DEMOGRAPHICS & DATA REPRESENTATIVENESS
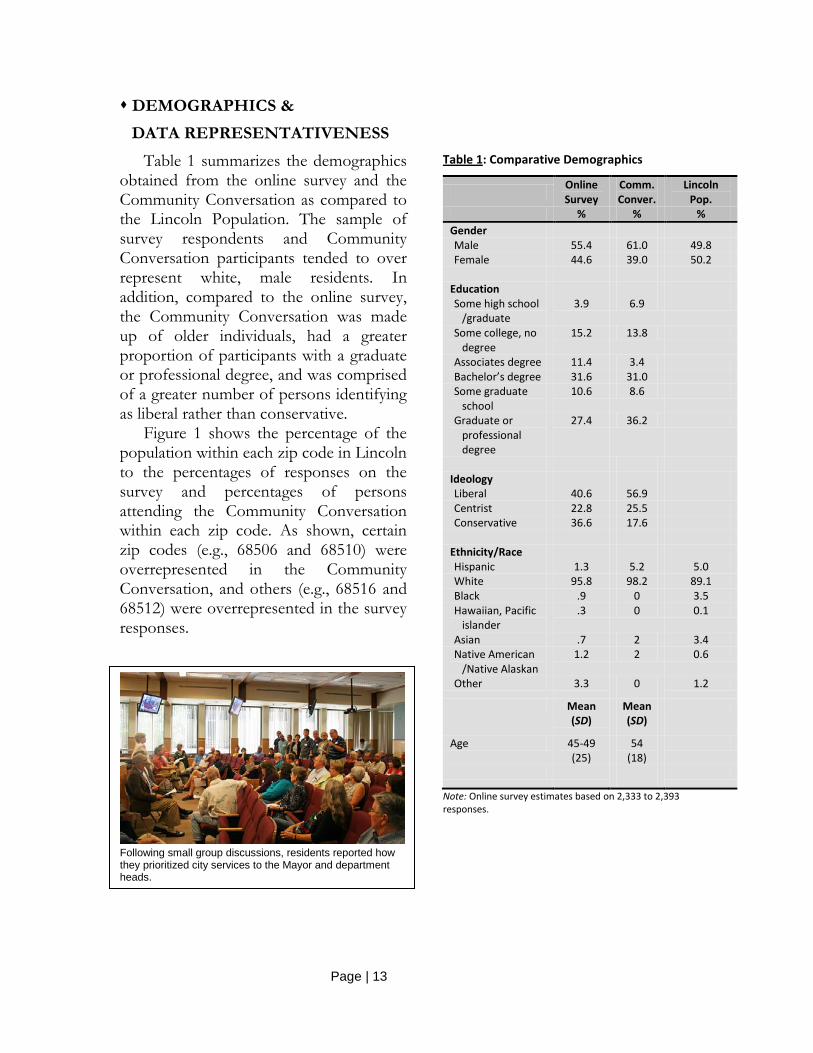
Table 1 summarizes the demographics obtained from the online survey and the Community Conversation as compared to the Lincoln Population. The sample of survey respondents and Community Conversation participants tended to over represent white, male residents. In addition, compared to the online survey, the Community Conversation was made up of older individuals, had a greater proportion of participants with a graduate or professional degree, and was comprised of a greater number of persons identifying as liberal rather than conservative.
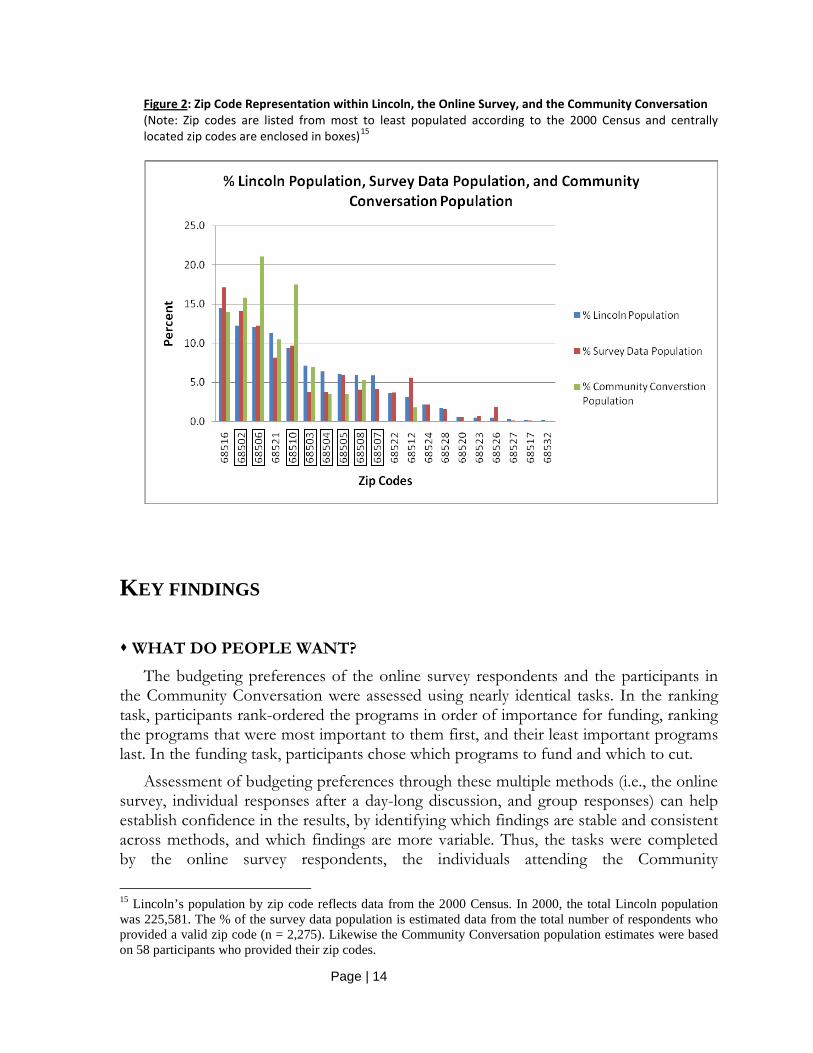
Figure 1 shows the percentage of the population within each zip code in Lincoln to the percentages of responses on the survey and percentages of persons attending the Community Conversation within each zip code. As shown, certain zip codes (e.g., 68506 and 68510) were overrepresented in the Community Conversation, and others (e.g., 68516 and 68512) were overrepresented in the survey responses.
Table 1: Comparative Demographics
Online Survey
Comm. Conver.
Lincoln Pop.
% % % Gender Male 55.4 61.0 49.8 Female 44.6 39.0 50.2
Education Some high school
/graduate 3.9 6.9
Some college, no degree
15.2 13.8
Associates degree 11.4 3.4 Bachelor’s degree 31.6 31.0 Some graduate
school 10.6 8.6
Graduate or professional degree
27.4 36.2
Ideology Liberal 40.6 56.9 Centrist 22.8 25.5 Conservative 36.6 17.6
Ethnicity/Race Hispanic 1.3 5.2 5.0 White 95.8 98.2 89.1 Black .9 0 3.5 Hawaiian, Pacific
islander .3 0 0.1
Asian .7 2 3.4 Native American
/Native Alaskan 1.2 2 0.6
Other 3.3 0 1.2
Mean (SD)
Mean (SD)
Age 45-49 (25)
54 (18)
Note: Online survey estimates based on 2,333 to 2,393 responses.
Following small group discussions, residents reported how they prioritized city services to the Mayor and department heads.
Page | 14
Figure 2: Zip Code Representation within Lincoln, the Online Survey, and the Community Conversation (Note: Zip codes are listed from most to least populated according to the 2000 Census and centrally located zip codes are enclosed in boxes)15
KEY FINDINGS WHAT DO PEOPLE WANT?
The budgeting preferences of the online survey respondents and the participants in the Community Conversation were assessed using nearly identical tasks. In the ranking task, participants rank-ordered the programs in order of importance for funding, ranking the programs that were most important to them first, and their least important programs last. In the funding task, participants chose which programs to fund and which to cut.
Assessment of budgeting preferences through these multiple methods (i.e., the online survey, individual responses after a day-long discussion, and group responses) can help establish confidence in the results, by identifying which findings are stable and consistent across methods, and which findings are more variable. Thus, the tasks were completed by the online survey respondents, the individuals attending the Community
15 Lincoln’s population by zip code reflects data from the 2000 Census. In 2000, the total Lincoln population was 225,581. The % of the survey data population is estimated data from the total number of respondents who provided a valid zip code (n = 2,275). Likewise the Community Conversation population estimates were based on 58 participants who provided their zip codes.
Page | 15
Conversation, and by the small groups (which were subsets of the individual attendees) who worked together at the Community Conversation. Individual assessments were completed before and after the Community Conversation in order to see if individual preferences changed over the course of the day.
The pre- and post-event preferences of Community Conversation participants are listed in Tables 2 and 3, alongside of the results obtained from the responses to the larger-scale citywide survey and the results from the group discussions at the Community Conversation.
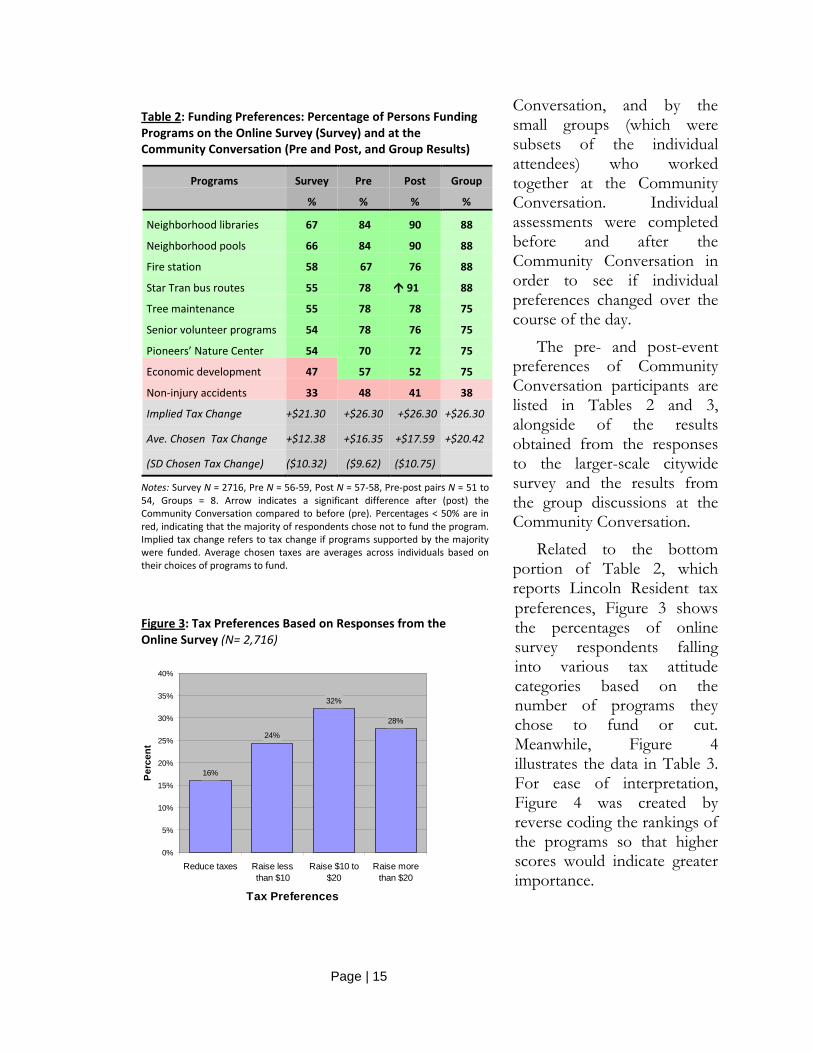
Related to the bottom portion of Table 2, which reports Lincoln Resident tax preferences, Figure 3 shows the percentages of online survey respondents falling into various tax attitude categories based on the number of programs they chose to fund or cut. Meanwhile, Figure 4 illustrates the data in Table 3. For ease of interpretation, Figure 4 was created by reverse coding the rankings of the programs so that higher scores would indicate greater importance.
Table 2: Funding Preferences: Percentage of Persons Funding Programs on the Online Survey (Survey) and at the Community Conversation (Pre and Post, and Group Results)
Programs Survey Pre Post Group
% % % %
Neighborhood libraries 67 84 90 88
Neighborhood pools 66 84 90 88
Fire station 58 67 76 88
Star Tran bus routes 55 78 91 88
Tree maintenance 55 78 78 75
Senior volunteer programs 54 78 76 75
Pioneers’ Nature Center 54 70 72 75
Economic development 47 57 52 75
Non-injury accidents 33 48 41 38
Implied Tax Change +$21.30 +$26.30 +$26.30 +$26.30
Ave. Chosen Tax Change +$12.38 +$16.35 +$17.59 +$20.42
(SD Chosen Tax Change) ($10.32) ($9.62) ($10.75)
Notes: Survey N = 2716, Pre N = 56-59, Post N = 57-58, Pre-post pairs N = 51 to 54, Groups = 8. Arrow indicates a significant difference after (post) the Community Conversation compared to before (pre). Percentages < 50% are in red, indicating that the majority of respondents chose not to fund the program. Implied tax change refers to tax change if programs supported by the majority were funded. Average chosen taxes are averages across individuals based on their choices of programs to fund.
Figure 3: Tax Preferences Based on Responses from the Online Survey (N= 2,716)
16%
24%
32%
28%
0%
5%
10%
15%
20%
25%
30%
35%
40%
Reduce taxes Raise lessthan $10
Raise $10 to$20
Raise morethan $20
Tax Preferences
Perc
ent
Page | 16
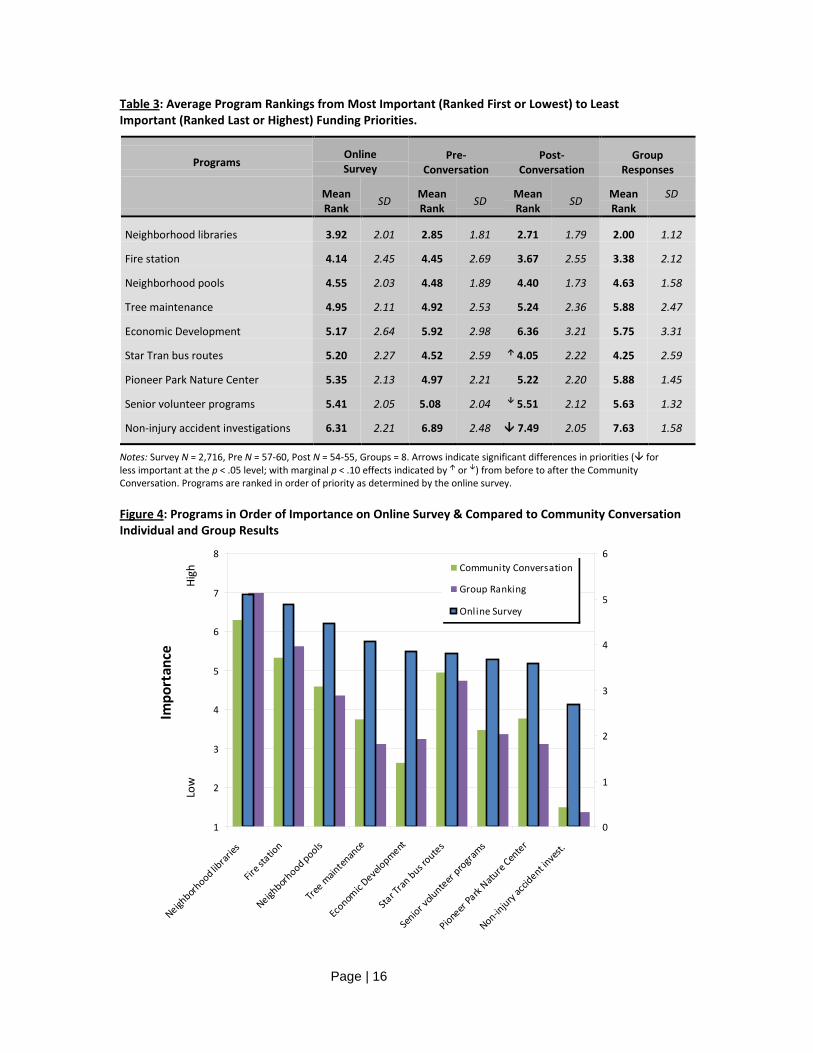
Table 3: Average Program Rankings from Most Important (Ranked First or Lowest) to Least Important (Ranked Last or Highest) Funding Priorities.
Programs Online Survey
Pre- Conversation
Post- Conversation
Group Responses
Mean Rank SD Mean
Rank SD Mean Rank SD Mean
Rank SD
Neighborhood libraries 3.92 2.01 2.85 1.81 2.71 1.79 2.00 1.12
Fire station 4.14 2.45 4.45 2.69 3.67 2.55 3.38 2.12
Neighborhood pools 4.55 2.03 4.48 1.89 4.40 1.73 4.63 1.58
Tree maintenance 4.95 2.11 4.92 2.53 5.24 2.36 5.88 2.47
Economic Development 5.17 2.64 5.92 2.98 6.36 3.21 5.75 3.31
Star Tran bus routes 5.20 2.27 4.52 2.59 4.05 2.22 4.25 2.59
Pioneer Park Nature Center 5.35 2.13 4.97 2.21 5.22 2.20 5.88 1.45
Senior volunteer programs 5.41 2.05 5.08 2.04 5.51 2.12 5.63 1.32
Non-injury accident investigations 6.31 2.21 6.89 2.48 7.49 2.05 7.63 1.58
Notes: Survey N = 2,716, Pre N = 57-60, Post N = 54-55, Groups = 8. Arrows indicate significant differences in priorities ( for less important at the p < .05 level; with marginal p < .10 effects indicated by or ) from before to after the Community Conversation. Programs are ranked in order of priority as determined by the online survey.
Figure 4: Programs in Order of Importance on Online Survey & Compared to Community Conversation Individual and Group Results
1
2
3
4
5
6
7
8
Neighborh
ood librar
ies
Fire s
tation
Neighborh
ood pools
Tree m
ainten
ance
Econom
ic Deve
lopment
Star T
ran bus r
outes
Senior v
olunteer
programs
Pioneer
Park
Nature
Center
Non-injury
accid
ent inve
st.
0
1
2
3
4
5
6Community Conversation
Group Ranking
Online Survey
Impo
rtan
ceLo
wHi
gh
Page | 17
Examination of Tables 2 and 3 and Figures 3 and 4 shows the Community Conversation participants differed from overall survey respondents in their initial and final preferences. For example, even prior to their participation, Community Conversation participants tended to be more willing to fund more of the programs overall and more tolerant of raising taxes (see Table 2). In addition, they ranked neighborhood libraries, bus routes, the Pioneers Park Nature Center, and senior volunteer programs higher, and the fire station, economic development, and non-injury accidents lower, than the online survey respondents who did not attend the Community Conversation (see Table 3).
In spite of the differences between groups, examination of the data shows there are important consistencies across the results obtained from each. Important patterns of results include the following:
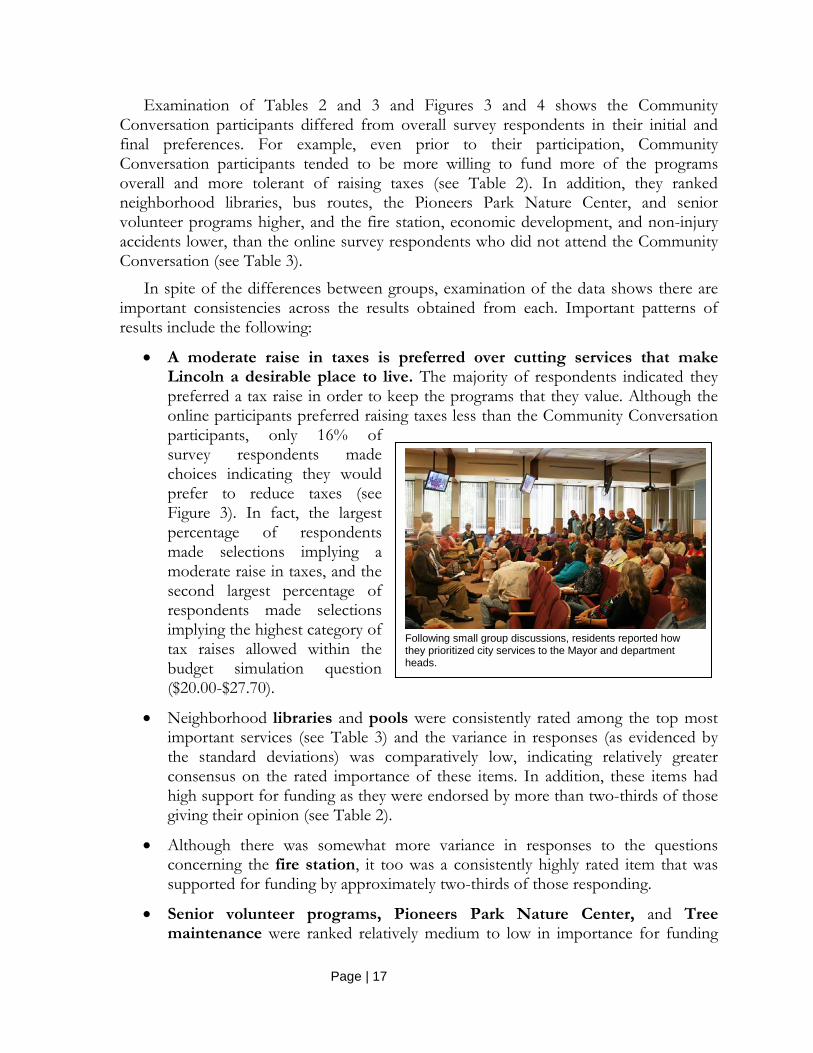
• A moderate raise in taxes is preferred over cutting services that make Lincoln a desirable place to live. The majority of respondents indicated they preferred a tax raise in order to keep the programs that they value. Although the online participants preferred raising taxes less than the Community Conversation participants, only 16% of survey respondents made choices indicating they would prefer to reduce taxes (see Figure 3). In fact, the largest percentage of respondents made selections implying a moderate raise in taxes, and the second largest percentage of respondents made selections implying the highest category of tax raises allowed within the budget simulation question ($20.00-$27.70).
• Neighborhood libraries and pools were consistently rated among the top most important services (see Table 3) and the variance in responses (as evidenced by the standard deviations) was comparatively low, indicating relatively greater consensus on the rated importance of these items. In addition, these items had high support for funding as they were endorsed by more than two-thirds of those giving their opinion (see Table 2).
• Although there was somewhat more variance in responses to the questions concerning the fire station, it too was a consistently highly rated item that was supported for funding by approximately two-thirds of those responding.
• Senior volunteer programs, Pioneers Park Nature Center, and Tree maintenance were ranked relatively medium to low in importance for funding
Following small group discussions, residents reported how they prioritized city services to the Mayor and department heads.
Page | 18
compared to the other programs (see Table 3). Nonetheless, a majority of responses favored funding these programs (see Table 2).
• Non-injury accident investigation was a service that a majority of respondents across input methods felt they could do without. Less than half of those giving their input (and only one-third of those who took the survey, see Table 2) indicated a desire to continue funding this service. Once again, the relatively small standard deviation for this item indicates that there was relatively great consensus (especially after the Community Conversation) that this was among the very lowest priorities for funding among those giving their input (Table 3).
With regard to the moderate raise in taxes, it is important to note that these were, for the most part, choices made by survey respondents and then explicitly approved by the respondents. In response to the following question:
Given your choices of programs, the change in property taxes for a 150K home would be $____ per year. If Lincoln City government funded your choices of programs, would you be willing to accept this change in property taxes?
Only 7.7% of online survey respondents answered, “No.” In response to the question:
Although you may have made the best choices you felt you could given the constraints of the exercise, the constraints themselves may have affected how satisfied you feel about the choices you made. Overall, how satisfied or dissatisfied are you with the choices of programs you made?
A total of 78% of online survey respondents said they were satisfied, somewhat satisfied, or very satisfied, while only 14% said that they were dissatisfied, somewhat dissatisfied, or very dissatisfied. Eight percent of respondents were neither satisfied or dissatisfied. Thus, it does not seem that many people, after finishing with the task, felt that they were somehow coerced by the question itself into raising taxes. Furthermore, a number of respondents left comments suggesting that the exercise underestimated the level of taxes they were willing to pay, including the following:
“I'm more than happy to pay five times the $27 increase in property taxes on a $150,000 home... to me that's an incredibly cheap investment. $27 isn't even a single night out for most adults...”
“All of the proposed programs are important to maintaining a vibrant and socially responsible city. In fact, I would be willing to double or triple the increase in property taxes if we could not only maintain our current standard of living, but improve safety and access to public facilities, including parks, pools, etc.”
Page | 19
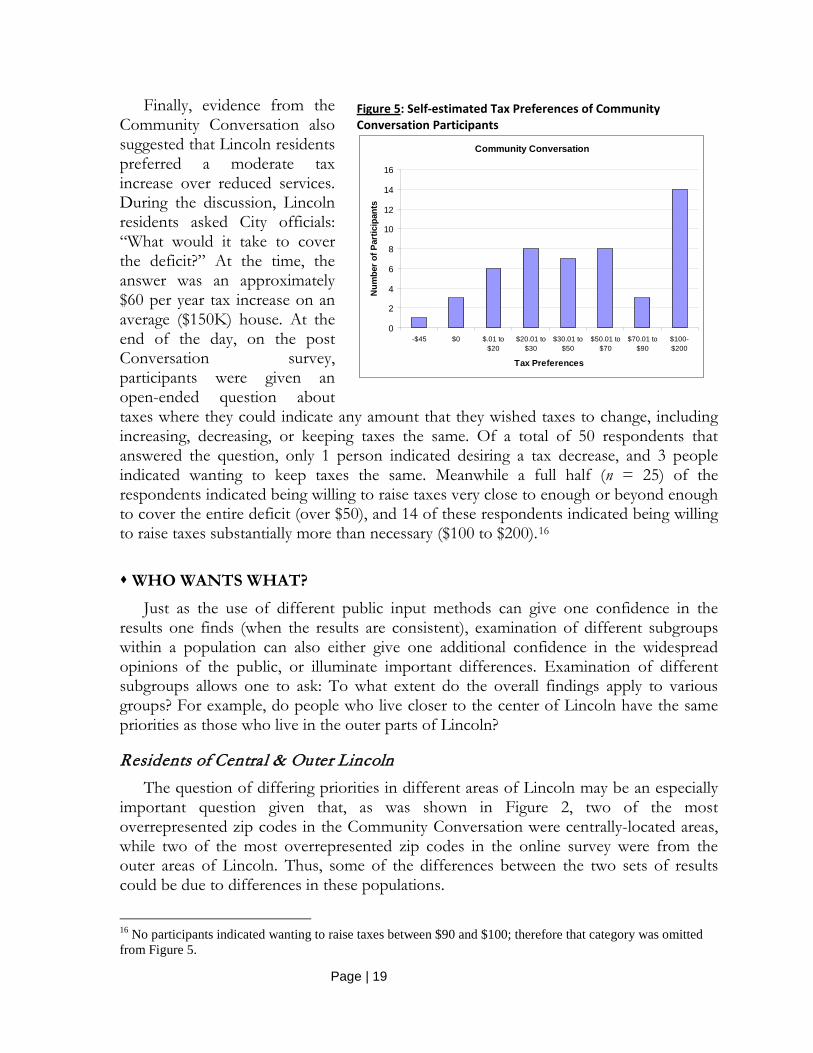
Finally, evidence from the Community Conversation also suggested that Lincoln residents preferred a moderate tax increase over reduced services. During the discussion, Lincoln residents asked City officials: “What would it take to cover the deficit?” At the time, the answer was an approximately $60 per year tax increase on an average ($150K) house. At the end of the day, on the post Conversation survey, participants were given an open-ended question about taxes where they could indicate any amount that they wished taxes to change, including increasing, decreasing, or keeping taxes the same. Of a total of 50 respondents that answered the question, only 1 person indicated desiring a tax decrease, and 3 people indicated wanting to keep taxes the same. Meanwhile a full half (n = 25) of the respondents indicated being willing to raise taxes very close to enough or beyond enough to cover the entire deficit (over $50), and 14 of these respondents indicated being willing to raise taxes substantially more than necessary ($100 to $200).16
WHO WANTS WHAT? Just as the use of different public input methods can give one confidence in the
results one finds (when the results are consistent), examination of different subgroups within a population can also either give one additional confidence in the widespread opinions of the public, or illuminate important differences. Examination of different subgroups allows one to ask: To what extent do the overall findings apply to various groups? For example, do people who live closer to the center of Lincoln have the same priorities as those who live in the outer parts of Lincoln?
Residents of Central & Outer Lincoln The question of differing priorities in different areas of Lincoln may be an especially
important question given that, as was shown in Figure 2, two of the most overrepresented zip codes in the Community Conversation were centrally-located areas, while two of the most overrepresented zip codes in the online survey were from the outer areas of Lincoln. Thus, some of the differences between the two sets of results could be due to differences in these populations.
16 No participants indicated wanting to raise taxes between $90 and $100; therefore that category was omitted from Figure 5.
Figure 5: Self-estimated Tax Preferences of Community Conversation Participants
Community Conversation
0
2
4
6
8
10
12
14
16
-$45 $0 $.01 to$20
$20.01 to$30
$30.01 to$50
$50.01 to$70
$70.01 to$90
$100-$200
Tax PreferencesN
umbe
r of P
artic
ipan
ts

Page | 20
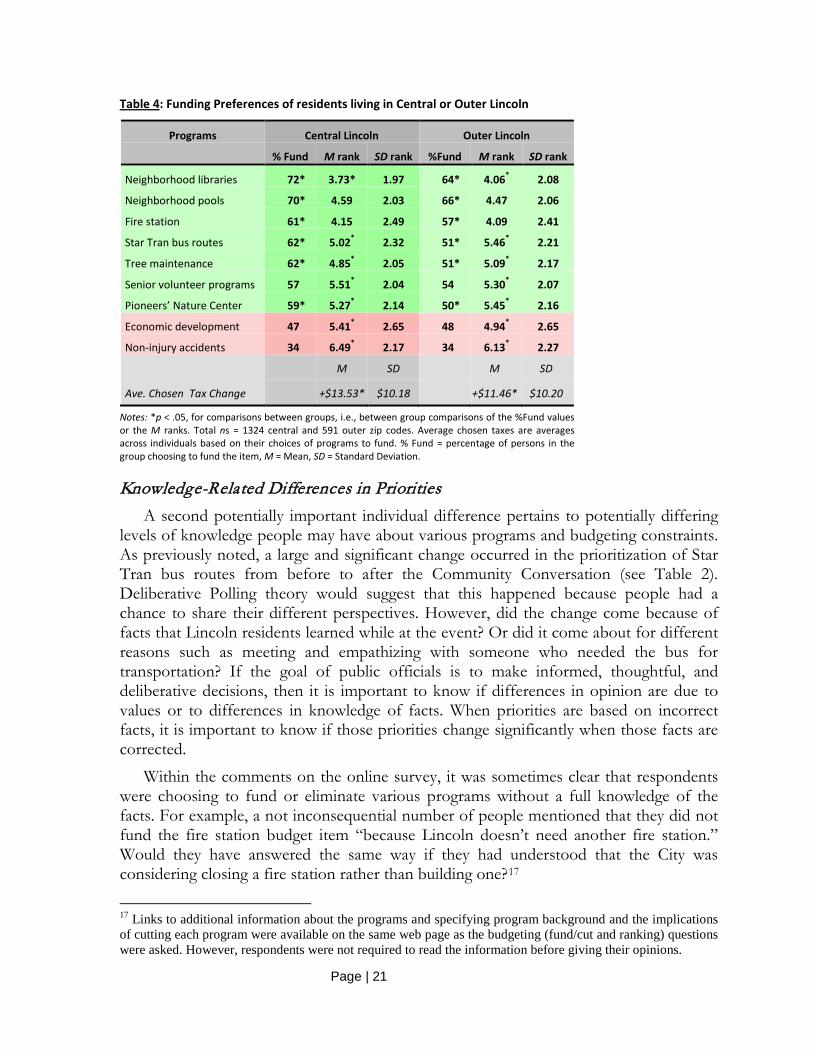
The data in Table 4 suggests that centrally-located and outer areas agree on some, but not all, priorities. With regard to their top three priorities, there is strong agreement. Although survey participants from the central areas of the City ranked neighborhood libraries as significantly more important than participants from the outer areas, both groups, consistent with the overall results, ranked neighborhood libraries the highest. Following libraries, both groups next ranked the fire station, followed by neighborhood pools. The rankings of these two programs did not
significantly differ between groups. Both groups also ranked Pioneers Park Nature Center fairly low (it was the seventh-most important program for both groups) and ranked investigation of non-injury accidents lowest, although residents living closer to the center of Lincoln did rank the Nature Center as significantly more important (on average), and investigation of non-injury accidents as significantly less important (on average), than respondents living nearer the edges of Lincoln.
Beyond the similarities described above, there were also a number of differences. First, persons in central Lincoln were generally more willing to fund programs and pay additional taxes as a result. With regard to program rankings, the biggest differences were in the ranked prioritizations of the Star Tran bus route, which was ranked significantly higher by persons living in central Lincoln than outer Lincoln (5th vs. 8th in rank order of average importance) and the provision of funding for economic development, which was ranked higher by those living in outer Lincoln than by those living in central Lincoln (4th vs. 6th in order of importance). Smaller but still significant differences were seen in the prioritization of tree maintenance (significantly more important to central Lincolnites) and senior citizen volunteer programs (significantly more important to those living in outer Lincoln). With the exception of senior volunteer programs (which Community Conversation participants had ranked higher), most of these differences are consistent with the differences predicted by the different zip code demographics of online survey (only) respondents and Community Conversation participants.
Lincoln zip codes from city-data.com
Page | 21
Table 4: Funding Preferences of residents living in Central or Outer Lincoln
Programs Central Lincoln Outer Lincoln
% Fund M rank SD rank %Fund M rank SD rank
Neighborhood libraries 72* 3.73* 1.97 64* 4.06* 2.08
Neighborhood pools 70* 4.59 2.03 66* 4.47 2.06
Fire station 61* 4.15 2.49 57* 4.09 2.41
Star Tran bus routes 62* 5.02* 2.32 51* 5.46* 2.21
Tree maintenance 62* 4.85* 2.05 51* 5.09* 2.17
Senior volunteer programs 57 5.51* 2.04 54 5.30* 2.07
Pioneers’ Nature Center 59* 5.27* 2.14 50* 5.45* 2.16
Economic development 47 5.41* 2.65 48 4.94* 2.65
Non-injury accidents 34 6.49* 2.17 34 6.13* 2.27
M SD M SD
Ave. Chosen Tax Change +$13.53* $10.18 +$11.46* $10.20
Notes: *p < .05, for comparisons between groups, i.e., between group comparisons of the %Fund values or the M ranks. Total ns = 1324 central and 591 outer zip codes. Average chosen taxes are averages across individuals based on their choices of programs to fund. % Fund = percentage of persons in the group choosing to fund the item, M = Mean, SD = Standard Deviation.
Knowledge-Related Differences in Priorities A second potentially important individual difference pertains to potentially differing
levels of knowledge people may have about various programs and budgeting constraints. As previously noted, a large and significant change occurred in the prioritization of Star Tran bus routes from before to after the Community Conversation (see Table 2). Deliberative Polling theory would suggest that this happened because people had a chance to share their different perspectives. However, did the change come because of facts that Lincoln residents learned while at the event? Or did it come about for different reasons such as meeting and empathizing with someone who needed the bus for transportation? If the goal of public officials is to make informed, thoughtful, and deliberative decisions, then it is important to know if differences in opinion are due to values or to differences in knowledge of facts. When priorities are based on incorrect facts, it is important to know if those priorities change significantly when those facts are corrected.
Within the comments on the online survey, it was sometimes clear that respondents were choosing to fund or eliminate various programs without a full knowledge of the facts. For example, a not inconsequential number of people mentioned that they did not fund the fire station budget item “because Lincoln doesn’t need another fire station.” Would they have answered the same way if they had understood that the City was considering closing a fire station rather than building one?17
17 Links to additional information about the programs and specifying program background and the implications of cutting each program were available on the same web page as the budgeting (fund/cut and ranking) questions were asked. However, respondents were not required to read the information before giving their opinions.
Page | 22
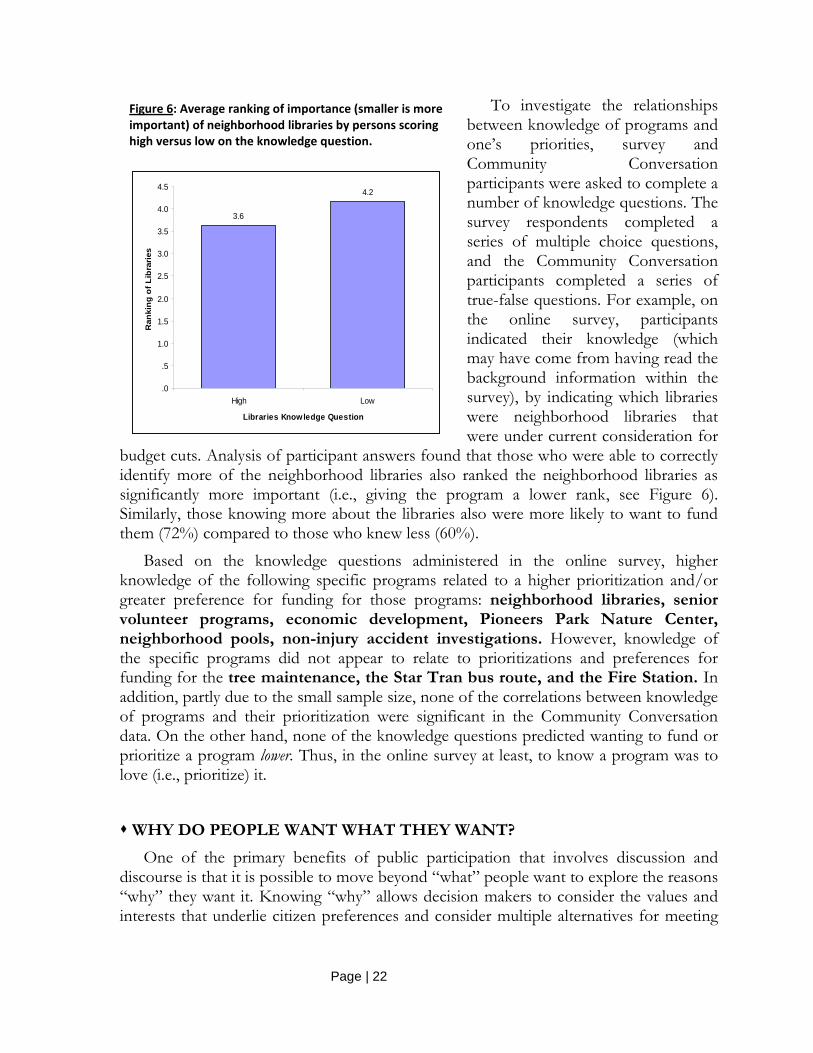
To investigate the relationships between knowledge of programs and one’s priorities, survey and Community Conversation participants were asked to complete a number of knowledge questions. The survey respondents completed a series of multiple choice questions, and the Community Conversation participants completed a series of true-false questions. For example, on the online survey, participants indicated their knowledge (which may have come from having read the background information within the survey), by indicating which libraries were neighborhood libraries that were under current consideration for
budget cuts. Analysis of participant answers found that those who were able to correctly identify more of the neighborhood libraries also ranked the neighborhood libraries as significantly more important (i.e., giving the program a lower rank, see Figure 6). Similarly, those knowing more about the libraries also were more likely to want to fund them (72%) compared to those who knew less (60%).
Based on the knowledge questions administered in the online survey, higher knowledge of the following specific programs related to a higher prioritization and/or greater preference for funding for those programs: neighborhood libraries, senior volunteer programs, economic development, Pioneers Park Nature Center, neighborhood pools, non-injury accident investigations. However, knowledge of the specific programs did not appear to relate to prioritizations and preferences for funding for the tree maintenance, the Star Tran bus route, and the Fire Station. In addition, partly due to the small sample size, none of the correlations between knowledge of programs and their prioritization were significant in the Community Conversation data. On the other hand, none of the knowledge questions predicted wanting to fund or prioritize a program lower. Thus, in the online survey at least, to know a program was to love (i.e., prioritize) it.
WHY DO PEOPLE WANT WHAT THEY WANT? One of the primary benefits of public participation that involves discussion and
discourse is that it is possible to move beyond “what” people want to explore the reasons “why” they want it. Knowing “why” allows decision makers to consider the values and interests that underlie citizen preferences and consider multiple alternatives for meeting
Figure 6: Average ranking of importance (smaller is more important) of neighborhood libraries by persons scoring high versus low on the knowledge question.
3.6
4.2
.0
.5
1.0
1.5
2.0
2.5
3.0
3.5
4.0
4.5
High Low
Libraries Knowledge Question
Ran
king
of L
ibra
ries
Page | 23
those interests. Thus, understanding why people want what they want can open the door to other options and ideas in a way that focusing on a single “what” cannot.
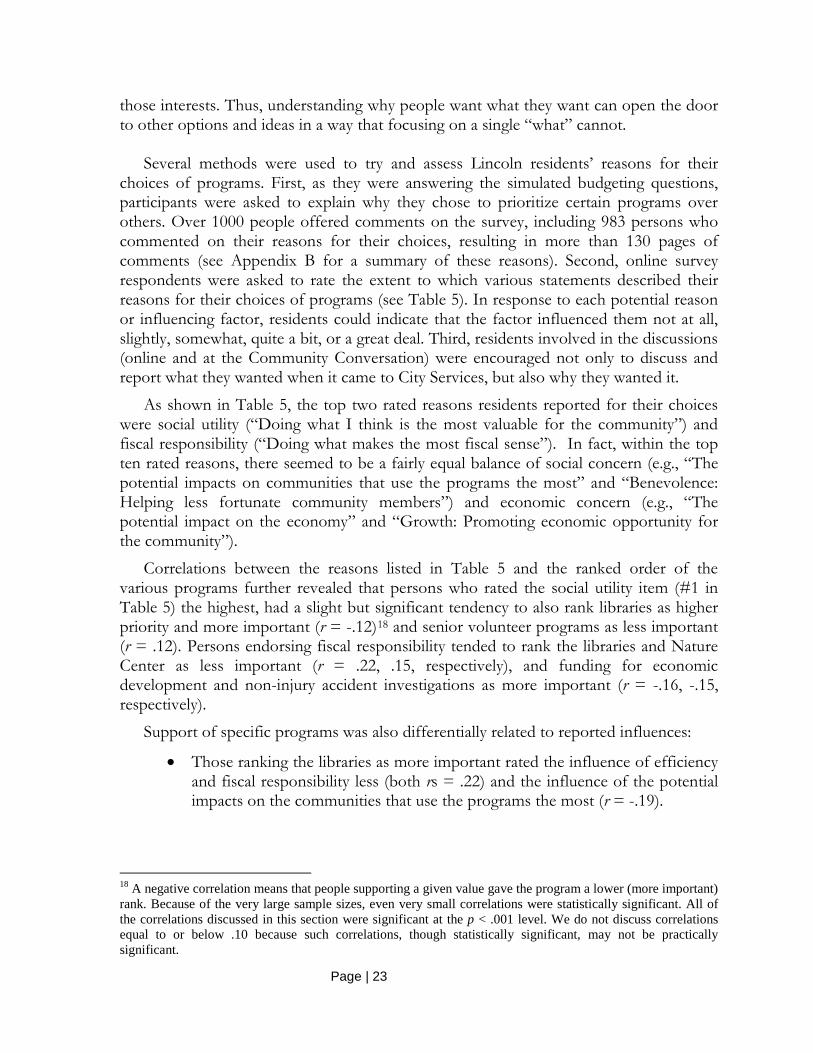
Several methods were used to try and assess Lincoln residents’ reasons for their choices of programs. First, as they were answering the simulated budgeting questions, participants were asked to explain why they chose to prioritize certain programs over others. Over 1000 people offered comments on the survey, including 983 persons who commented on their reasons for their choices, resulting in more than 130 pages of comments (see Appendix B for a summary of these reasons). Second, online survey respondents were asked to rate the extent to which various statements described their reasons for their choices of programs (see Table 5). In response to each potential reason or influencing factor, residents could indicate that the factor influenced them not at all, slightly, somewhat, quite a bit, or a great deal. Third, residents involved in the discussions (online and at the Community Conversation) were encouraged not only to discuss and report what they wanted when it came to City Services, but also why they wanted it.
As shown in Table 5, the top two rated reasons residents reported for their choices were social utility (“Doing what I think is the most valuable for the community”) and fiscal responsibility (“Doing what makes the most fiscal sense”). In fact, within the top ten rated reasons, there seemed to be a fairly equal balance of social concern (e.g., “The potential impacts on communities that use the programs the most” and “Benevolence: Helping less fortunate community members”) and economic concern (e.g., “The potential impact on the economy” and “Growth: Promoting economic opportunity for the community”).
Correlations between the reasons listed in Table 5 and the ranked order of the various programs further revealed that persons who rated the social utility item (#1 in Table 5) the highest, had a slight but significant tendency to also rank libraries as higher priority and more important (r = -.12)18 and senior volunteer programs as less important (r = .12). Persons endorsing fiscal responsibility tended to rank the libraries and Nature Center as less important (r = .22, .15, respectively), and funding for economic development and non-injury accident investigations as more important (r = -.16, -.15, respectively).
Support of specific programs was also differentially related to reported influences:
• Those ranking the libraries as more important rated the influence of efficiency and fiscal responsibility less (both rs = .22) and the influence of the potential impacts on the communities that use the programs the most (r = -.19).
18 A negative correlation means that people supporting a given value gave the program a lower (more important) rank. Because of the very large sample sizes, even very small correlations were statistically significant. All of the correlations discussed in this section were significant at the p < .001 level. We do not discuss correlations equal to or below .10 because such correlations, though statistically significant, may not be practically significant.
Page | 24
• The ranking of the pools was most highly correlated with the influence of “Growth: Promoting economic opportunity for the community” such that those influenced by this value ranked the pools as less important (r = .12).
Table 5: Resident Ratings of Reasons for their Choices of City Programs in Order of Importance.
How much did the following influence your choices…? N Mean SD
1. Social utility: Doing what I think is the most valuable for the community.
1,262 4.18 .963
2. Fiscal responsibility: Doing what makes the most fiscal sense.
1,345 3.82 1.069
3. The potential impacts on communities that use the programs the most.
1,335 3.72 1.141
4. The long-term impacts of funding or not funding certain programs.
1,294 3.66 1.200
5. Equity: Doing what is the fairest for the most amount of people.
1,300 3.64 1.189
6. The potential impact on the economy. 1,303 3.43 1.156 7. Benevolence: Helping less fortunate community
members. 1,308 3.40 1.213
8. Sacrifice: Making sacrifices for the greater good. 1,281 3.33 1.261 9. Growth: Promoting economic opportunity for the
community. 1,297 3.25 1.298
10. Efficiency: Eliminating as many unneeded services as possible.
1,321 3.14 1.388
11. The potential impacts on businesses. 1,293 2.96 1.245 12. Ethical concerns: My feeling that it would be unethical
to fund or not to fund certain programs. 1,310 2.94 1.443
13. The likely impact on me and my family as recipients of the programs.
1,318 2.91 1.347
14. The total cost of certain programs compared to other programs.
1,307 2.68 1.247
15. Personal situation: Doing what is best for me given my personal situation.
1,356 2.60 1.308
16. The estimated impact on my property taxes. 1,320 2.55 1.331 17. Viewpoints expressed by my family members (e.g.,
spouse, children, parents, extended family members). 1,302 2.10 1.301
18. Viewpoints expressed by my friends, colleagues, and neighbors.
1,300 2.01 1.212
19. Viewpoints expressed by other community members. 1,298 1.89 1.124 20. Viewpoints expressed by public officials. 1,313 1.61 .914 21. Viewpoints expressed by other people who were
taking part in this activity. 1,299 1.44 .882
22. Viewpoints expressed by the media (TV news, the newspaper, etc.)
1,249 1.42 .779
Notes: Participants in the online survey were given a random sample of these questions rather than all of them, resulting in a lower number of respondents per question than would otherwise be expected. Response scale used for these items was 1 = not at all, 2 = slightly, 3 = somewhat, 4 = quite a bit, 5 = a great deal. SD = Standard Deviation.
Page | 25
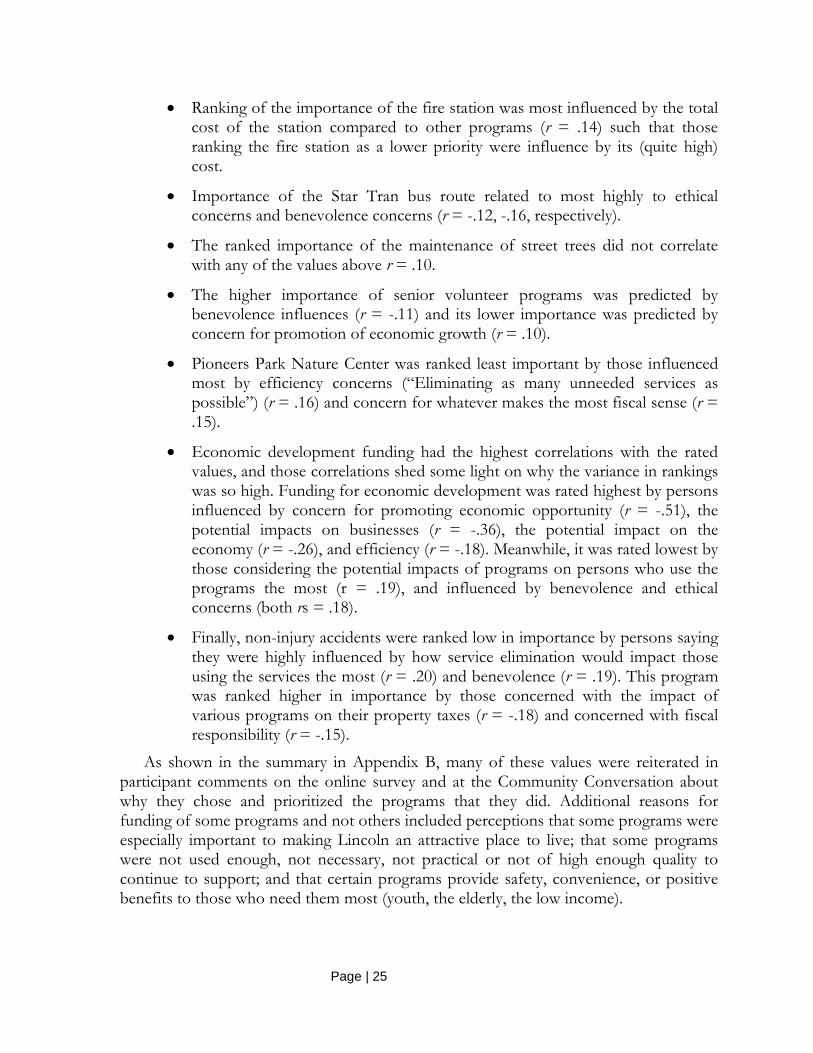
• Ranking of the importance of the fire station was most influenced by the total cost of the station compared to other programs (r = .14) such that those ranking the fire station as a lower priority were influence by its (quite high) cost.
• Importance of the Star Tran bus route related to most highly to ethical concerns and benevolence concerns (r = -.12, -.16, respectively).
• The ranked importance of the maintenance of street trees did not correlate with any of the values above r = .10.
• The higher importance of senior volunteer programs was predicted by benevolence influences (r = -.11) and its lower importance was predicted by concern for promotion of economic growth (r = .10).
• Pioneers Park Nature Center was ranked least important by those influenced most by efficiency concerns (“Eliminating as many unneeded services as possible”) (r = .16) and concern for whatever makes the most fiscal sense (r = .15).
• Economic development funding had the highest correlations with the rated values, and those correlations shed some light on why the variance in rankings was so high. Funding for economic development was rated highest by persons influenced by concern for promoting economic opportunity (r = -.51), the potential impacts on businesses (r = -.36), the potential impact on the economy (r = -.26), and efficiency (r = -.18). Meanwhile, it was rated lowest by those considering the potential impacts of programs on persons who use the programs the most (r = .19), and influenced by benevolence and ethical concerns (both rs = .18).
• Finally, non-injury accidents were ranked low in importance by persons saying they were highly influenced by how service elimination would impact those using the services the most (r = .20) and benevolence (r = .19). This program was ranked higher in importance by those concerned with the impact of various programs on their property taxes (r = -.18) and concerned with fiscal responsibility (r = -.15).
As shown in the summary in Appendix B, many of these values were reiterated in participant comments on the online survey and at the Community Conversation about why they chose and prioritized the programs that they did. Additional reasons for funding of some programs and not others included perceptions that some programs were especially important to making Lincoln an attractive place to live; that some programs were not used enough, not necessary, not practical or not of high enough quality to continue to support; and that certain programs provide safety, convenience, or positive benefits to those who need them most (youth, the elderly, the low income).
Page | 26
HOW SURE ARE WE ABOUT WHAT PEOPLE WANT? While online survey methods are relatively inexpensive and deliberative methods
allow one to delve deeper into the reasons that residents offer for their choices, neither approach has the advantage of more expensive random sample surveys in terms of ensuring that the data is representative of the larger population. Other concerns sometimes expressed about online surveys involve “ballot stuffing”—the potential for individuals or subgroups to take a survey repeatedly so that their voices and opinions have more weight than those of others.
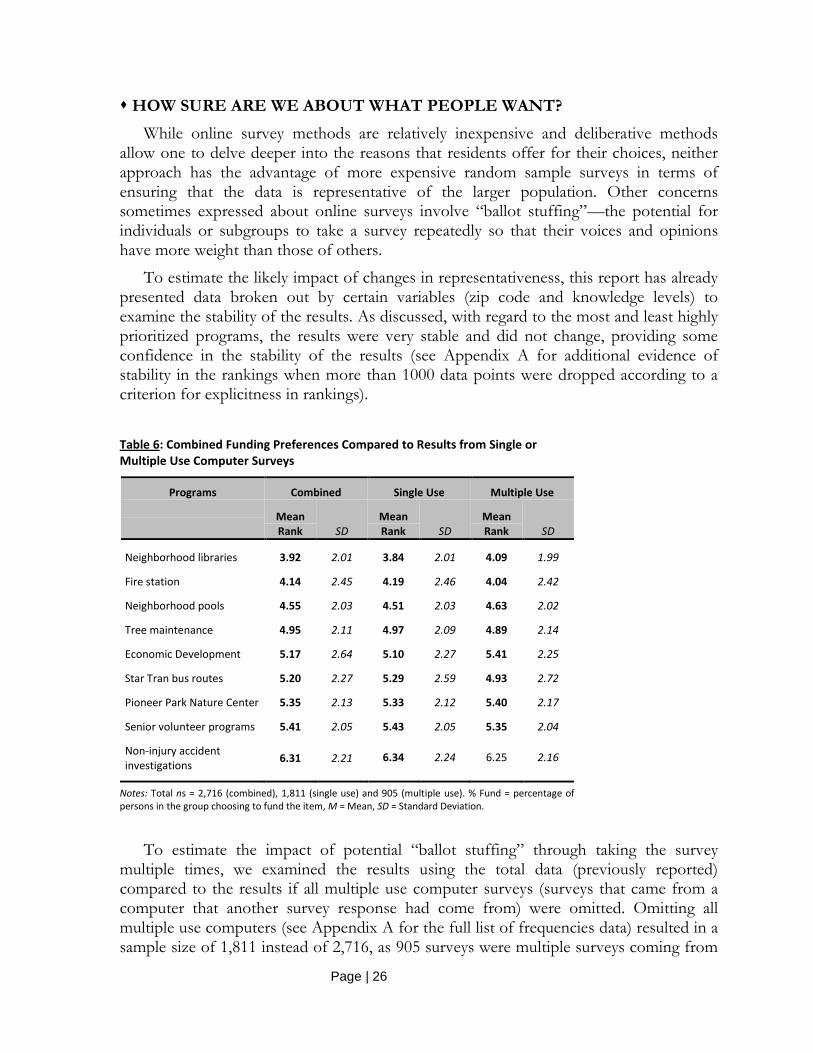
To estimate the likely impact of changes in representativeness, this report has already presented data broken out by certain variables (zip code and knowledge levels) to examine the stability of the results. As discussed, with regard to the most and least highly prioritized programs, the results were very stable and did not change, providing some confidence in the stability of the results (see Appendix A for additional evidence of stability in the rankings when more than 1000 data points were dropped according to a criterion for explicitness in rankings).
Table 6: Combined Funding Preferences Compared to Results from Single or Multiple Use Computer Surveys
Programs Combined Single Use Multiple Use
Mean Rank SD
Mean Rank SD
Mean Rank SD
Neighborhood libraries 3.92 2.01 3.84 2.01 4.09 1.99
Fire station 4.14 2.45 4.19 2.46 4.04 2.42
Neighborhood pools 4.55 2.03 4.51 2.03 4.63 2.02
Tree maintenance 4.95 2.11 4.97 2.09 4.89 2.14
Economic Development 5.17 2.64 5.10 2.27 5.41 2.25
Star Tran bus routes 5.20 2.27 5.29 2.59 4.93 2.72
Pioneer Park Nature Center 5.35 2.13 5.33 2.12 5.40 2.17
Senior volunteer programs 5.41 2.05 5.43 2.05 5.35 2.04
Non-injury accident investigations 6.31 2.21 6.34 2.24 6.25 2.16
Notes: Total ns = 2,716 (combined), 1,811 (single use) and 905 (multiple use). % Fund = percentage of persons in the group choosing to fund the item, M = Mean, SD = Standard Deviation.
To estimate the impact of potential “ballot stuffing” through taking the survey multiple times, we examined the results using the total data (previously reported) compared to the results if all multiple use computer surveys (surveys that came from a computer that another survey response had come from) were omitted. Omitting all multiple use computers (see Appendix A for the full list of frequencies data) resulted in a sample size of 1,811 instead of 2,716, as 905 surveys were multiple surveys coming from

Page | 27
a computer that another survey had also come from. Table 6 shows the comparison of the results of the rankings of programs based on each group of responses. The single use responses are actually in exactly the same order as the overall responses, indicating that the responses from multiple use computers did not change the results.
There are, however, some noticeable differences between single use computer surveys and multiple use computer surveys. These included that, compared to the single use computer responses, in the data from the multiple use computers, the fire station was ranked as highly as (or slightly higher than) libraries, Star Tran bus routes were ranked substantially higher, senior volunteer programs were ranked somewhat higher, and funding for economic development was ranked somewhat lower. These results do not necessarily imply that the differences are due to ballot stuffing, however. Multiple use computers include those used by different persons at the library or other public locations. Thus, if lower-income persons are more apt to use and value bus services and to use a library or public computer to complete the survey, this could explain the different ranking of bus services obtained from each group in Table 6.
In conclusion, these results are consistent with and expand further upon results released in a preliminary report to the City (see Appendix C). The preliminary results had suggested commonalities between the views of the general public and potential special interest groups who may have been recruited at specific time periods over the course of the survey. The present results suggest commonalities (as well as differences) among responses from different areas of the city, knowledge levels, and whether or not the survey was taken on a multiple use computer. Taken together, these results give us added confidence that, at least for the highest prioritized programs (neighborhood libraries, pools, and fires stations) and the lowest priority program (non-injury accident investigations), there is measurable and consistent consensus among Lincoln residents.
Page | 28
References
Fishkin, J. (1995). The voice of the people: Public opinion and democracy. New Haven, CT: Yale
University Press. Fishkin, J. (1996). The televised deliberative poll: An experiment in democracy. Annals of
the American Academy of Political Science, 546, 132-140. Fishkin, J., & Luskin, R. (2005). Experimenting with a democratic ideal: Deliberative
polling and public opinion. Acta Politica, 40, 284-298. Hicks, N. (2011a, February 28). Estimates show city faces $6.2 million deficit next year. Lincoln
Journal Star. Retrieved from http://journalstar.com/news/local/govt-and-politics/article_955a04fd-05f4-5af0-9e29-13c05009e532.html
Hicks, N. (2011b, July 10). Mayor’s budget plan includes property tax hike. Lincoln Journal Star. Retrieved from http://journalstar.com/news/local/govt-and-politics/article_be828c64-3c80-57d8-aaa0-e0ff416597bd.html
Lincoln Journal Star (2010, July 8). Lincoln mayor looks to volunteers, private funding. Lincoln Journal Star. Retrieved from http://journalstar.com/news/local/govt-and-politics/article_e1195104-8aad-11df-912d-001cc4c03286.html
Myers, A. (2008, February 12). Mayor wants public input on budget. KOLN/KGIN. Retrieved from http://www.1011now.com/
O’Hanlon, K. (2011, March 4). Lawmakers approve bills on topics ranging from state aid to local goverment to breastfeeding rights. Lincoln Journal Star. Retrieved from http://journalstar.com/news/unicameral/article_ab253397-ca11-52d9-a784-0951d4d510b9.html
Pascale, J. (2011, July 9). Aging Partners director: Cutting programs would lower quality of life for elderly. Lincoln Journal Star. Retrieved from http://journalstar.com/news/local/govt-and-politics/article_20cec04a-7a6b-591a-a80f-132cb07b890d.html
University of Nebraska Public Policy Center (2008). Priority Lincoln: Budgeting for outcomes: Final report. Retrieved from http://ppc.unl.edu/userfiles/file/Documents/projects/BudgetingOutcomesandPriorities/reports/PriorityLincolnFinalReport.pdf
University of Nebraska Public Policy Center (2009). Taking charge: Survey and discussion report. Retrieved from http://ppc.unl.edu/userfiles/file/Documents/mayorsproject/TakingChargeFINALREPORTJune2009.pdf
Page | 29
Appendix A: Inclusion & Exclusion of Online Survey Response
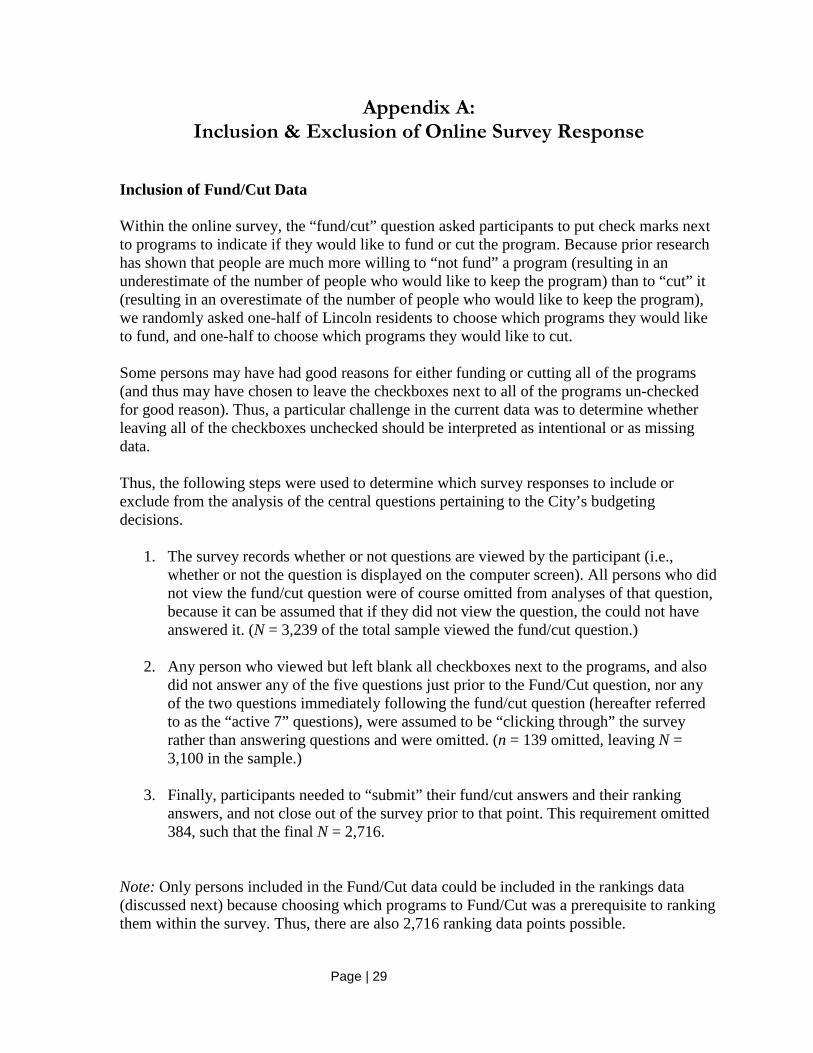
Inclusion of Fund/Cut Data Within the online survey, the “fund/cut” question asked participants to put check marks next to programs to indicate if they would like to fund or cut the program. Because prior research has shown that people are much more willing to “not fund” a program (resulting in an underestimate of the number of people who would like to keep the program) than to “cut” it (resulting in an overestimate of the number of people who would like to keep the program), we randomly asked one-half of Lincoln residents to choose which programs they would like to fund, and one-half to choose which programs they would like to cut. Some persons may have had good reasons for either funding or cutting all of the programs (and thus may have chosen to leave the checkboxes next to all of the programs un-checked for good reason). Thus, a particular challenge in the current data was to determine whether leaving all of the checkboxes unchecked should be interpreted as intentional or as missing data. Thus, the following steps were used to determine which survey responses to include or exclude from the analysis of the central questions pertaining to the City’s budgeting decisions.
1. The survey records whether or not questions are viewed by the participant (i.e., whether or not the question is displayed on the computer screen). All persons who did not view the fund/cut question were of course omitted from analyses of that question, because it can be assumed that if they did not view the question, the could not have answered it. (N = 3,239 of the total sample viewed the fund/cut question.)
2. Any person who viewed but left blank all checkboxes next to the programs, and also
did not answer any of the five questions just prior to the Fund/Cut question, nor any of the two questions immediately following the fund/cut question (hereafter referred to as the “active 7” questions), were assumed to be “clicking through” the survey rather than answering questions and were omitted. (n = 139 omitted, leaving N = 3,100 in the sample.)
3. Finally, participants needed to “submit” their fund/cut answers and their ranking
answers, and not close out of the survey prior to that point. This requirement omitted 384, such that the final N = 2,716.
Note: Only persons included in the Fund/Cut data could be included in the rankings data (discussed next) because choosing which programs to Fund/Cut was a prerequisite to ranking them within the survey. Thus, there are also 2,716 ranking data points possible.
Page | 30
Inclusion and Computation of Ranking Data A second challenge related to the ranking questions (in which participants needed to drag and drop programs in order of importance). This challenge was that a large number of participants seemed either to not understand how to rank order, thought it was unnecessary. It is especially understandable that participants may not have thought it necessary to drag/drop a single program, if, for example, they only chose one program to fund or cut and thus it was listed alone. A number of participants may have also agreed with the original order that the programs were displayed, and for that reason, did not explicitly click on the programs to let the system know that they were ranking them. Unfortunately, when this happened, the system recorded the question as viewed but not answered. To avoid an error of commission or omission, we computed the rankings both based on explicit rankings and implicit rankings. Explicit rankings required the survey system to have detected that the person had rated an item. Implicit rankings were computed as follows:
1. All funded programs were assumed to be of higher priority than cut programs. 2. If a person explicitly ranked some programs but not others (e.g., only ranking the
programs that they funded, but not the ones they cut), the explicit rankings were always used. For funded programs, the rankings were 1 through n where n = the total number funded. For cut programs, the rankings were n + 1 through 9. That is, the top most ranked cut program was assumed to be ranked after the last ranked funded program.
3. When programs were not explicitly ranked, they were given the “average” rank of the
entire fund or cut category. Thus, if someone chose to fund 6 of the nine programs and explicitly ranked them, but did not explicitly rank the 3 programs that were cut, then the three programs that were cut were all assigned a ranking of (7+8+9)/3 = 8. Likewise, if the person had only explicitly rank ordered the 3 cut programs, the 6 funded programs that were not explicitly ranked would all receive a ranking of (1+2+3+4+5+6)/6 = 3.5.
A table based only on explicit ranking data is below. As shown, the programs are in an order identical to the results obtained when including implicit ratings, but more spread out (which is to be expected, since the implicit data includes many “averaged” rankings to substitute for the lack of explicit rankings). Given the similarity of results, in the main section of the report we report the data that includes a greater number of voices (the implicit data).
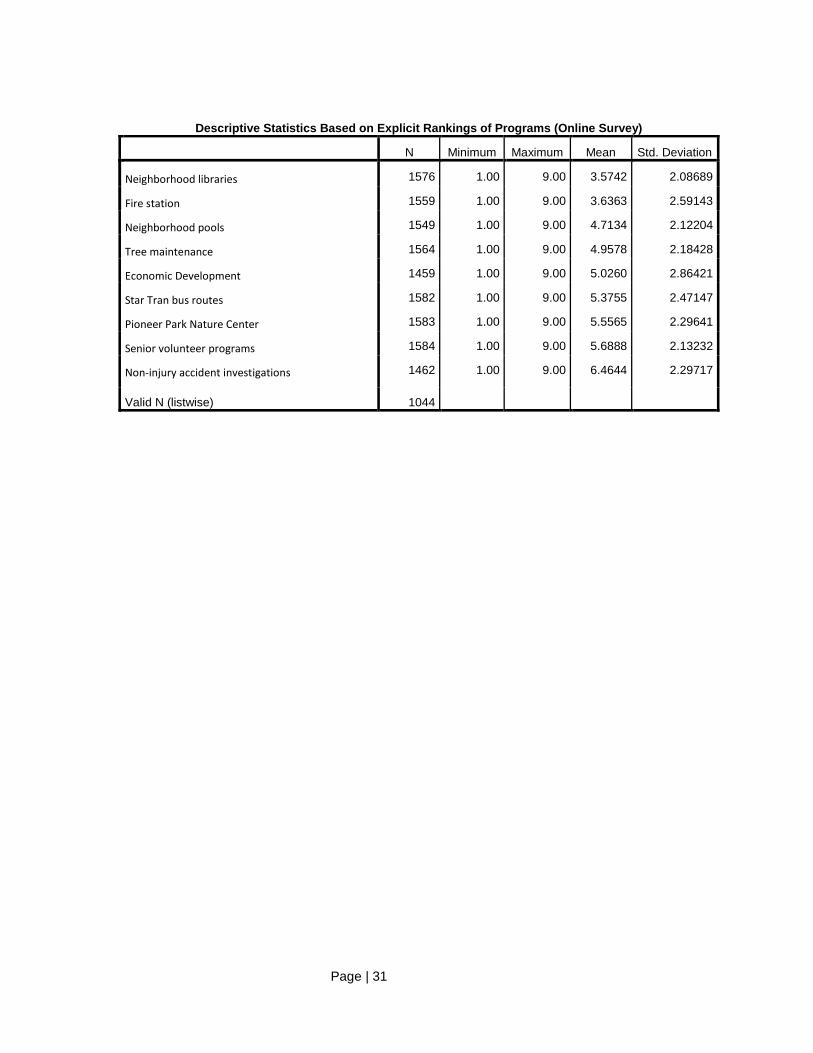
Page | 31
Descriptive Statistics Based on Explicit Rankings of Programs (Online Survey)
N Minimum Maximum Mean Std. Deviation
Neighborhood libraries 1576 1.00 9.00 3.5742 2.08689
Fire station 1559 1.00 9.00 3.6363 2.59143
Neighborhood pools 1549 1.00 9.00 4.7134 2.12204
Tree maintenance 1564 1.00 9.00 4.9578 2.18428
Economic Development 1459 1.00 9.00 5.0260 2.86421
Star Tran bus routes 1582 1.00 9.00 5.3755 2.47147
Pioneer Park Nature Center 1583 1.00 9.00 5.5565 2.29641
Senior volunteer programs 1584 1.00 9.00 5.6888 2.13232
Non-injury accident investigations 1462 1.00 9.00 6.4644 2.29717
Valid N (listwise) 1044
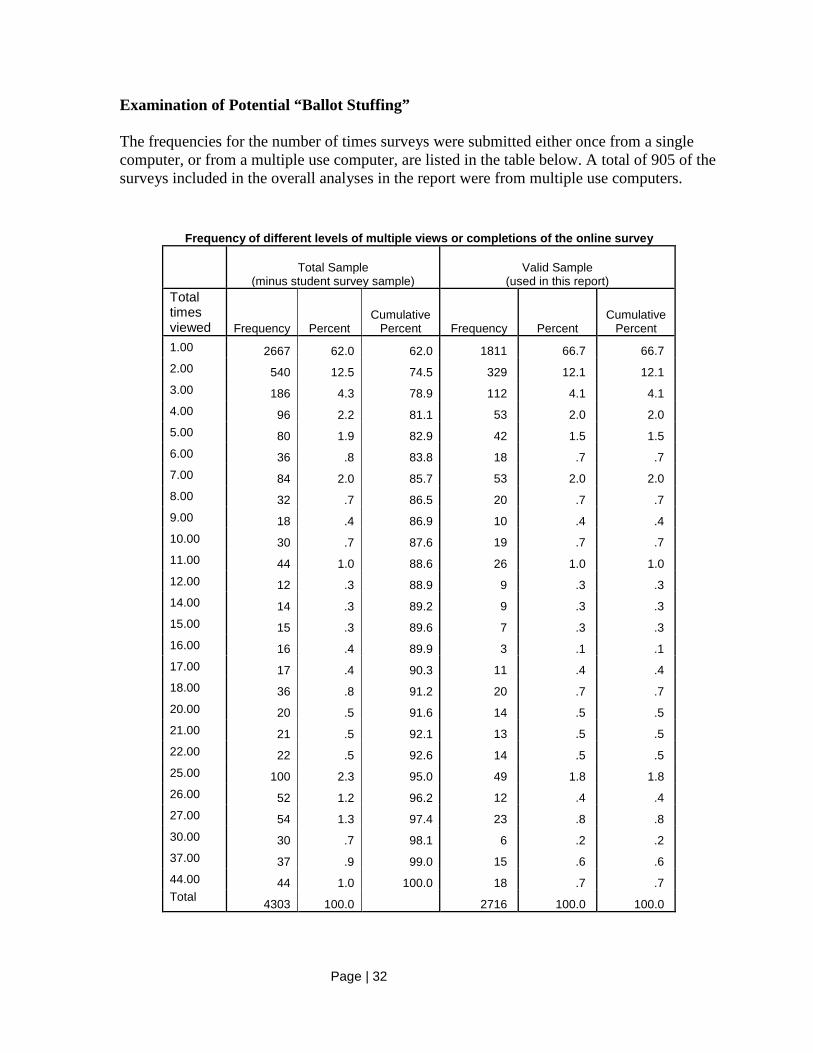
Page | 32
Examination of Potential “Ballot Stuffing” The frequencies for the number of times surveys were submitted either once from a single computer, or from a multiple use computer, are listed in the table below. A total of 905 of the surveys included in the overall analyses in the report were from multiple use computers.
Frequency of different levels of multiple views or completions of the online survey
Total Sample (minus student survey sample)
Valid Sample
(used in this report) Total times viewed Frequency Percent
Cumulative Percent Frequency Percent
Cumulative Percent
1.00 2667 62.0 62.0 1811 66.7 66.7 2.00 540 12.5 74.5 329 12.1 12.1 3.00 186 4.3 78.9 112 4.1 4.1 4.00 96 2.2 81.1 53 2.0 2.0 5.00 80 1.9 82.9 42 1.5 1.5 6.00 36 .8 83.8 18 .7 .7 7.00 84 2.0 85.7 53 2.0 2.0 8.00 32 .7 86.5 20 .7 .7 9.00 18 .4 86.9 10 .4 .4 10.00 30 .7 87.6 19 .7 .7 11.00 44 1.0 88.6 26 1.0 1.0 12.00 12 .3 88.9 9 .3 .3 14.00 14 .3 89.2 9 .3 .3 15.00 15 .3 89.6 7 .3 .3 16.00 16 .4 89.9 3 .1 .1 17.00 17 .4 90.3 11 .4 .4 18.00 36 .8 91.2 20 .7 .7 20.00 20 .5 91.6 14 .5 .5 21.00 21 .5 92.1 13 .5 .5 22.00 22 .5 92.6 14 .5 .5 25.00 100 2.3 95.0 49 1.8 1.8 26.00 52 1.2 96.2 12 .4 .4 27.00 54 1.3 97.4 23 .8 .8 30.00 30 .7 98.1 6 .2 .2 37.00 37 .9 99.0 15 .6 .6 44.00 44 1.0 100.0 18 .7 .7 Total 4303 100.0 2716 100.0 100.0
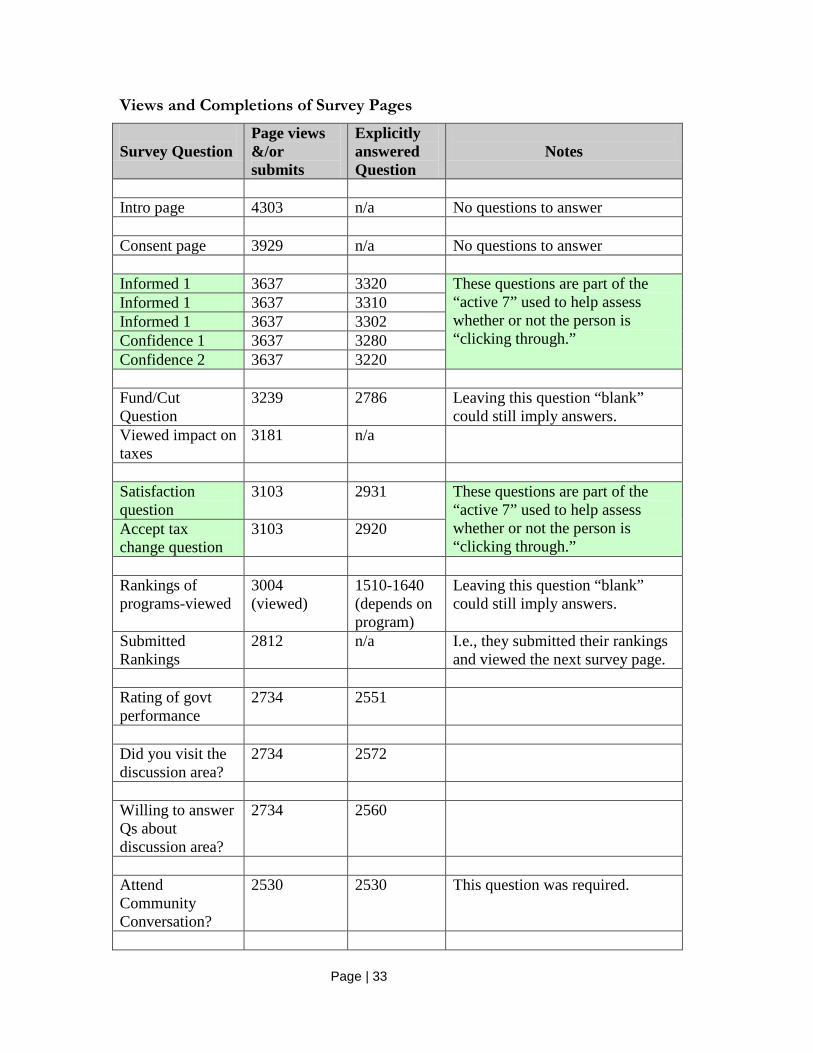
Page | 33
Views and Completions of Survey Pages
Survey Question
Page views &/or submits
Explicitly answered Question
Notes
Intro page 4303 n/a No questions to answer Consent page 3929 n/a No questions to answer Informed 1 3637 3320 These questions are part of the
“active 7” used to help assess whether or not the person is “clicking through.”
Informed 1 3637 3310 Informed 1 3637 3302 Confidence 1 3637 3280 Confidence 2 3637 3220 Fund/Cut Question
3239 2786 Leaving this question “blank” could still imply answers.
Viewed impact on taxes
3181 n/a
Satisfaction question
3103 2931 These questions are part of the “active 7” used to help assess whether or not the person is “clicking through.”
Accept tax change question
3103 2920
Rankings of programs-viewed
3004 (viewed)
1510-1640 (depends on program)
Leaving this question “blank” could still imply answers.
Submitted Rankings
2812 n/a I.e., they submitted their rankings and viewed the next survey page.
Rating of govt performance
2734 2551
Did you visit the discussion area?
2734 2572
Willing to answer Qs about discussion area?
2734 2560
Attend Community Conversation?
2530 2530 This question was required.
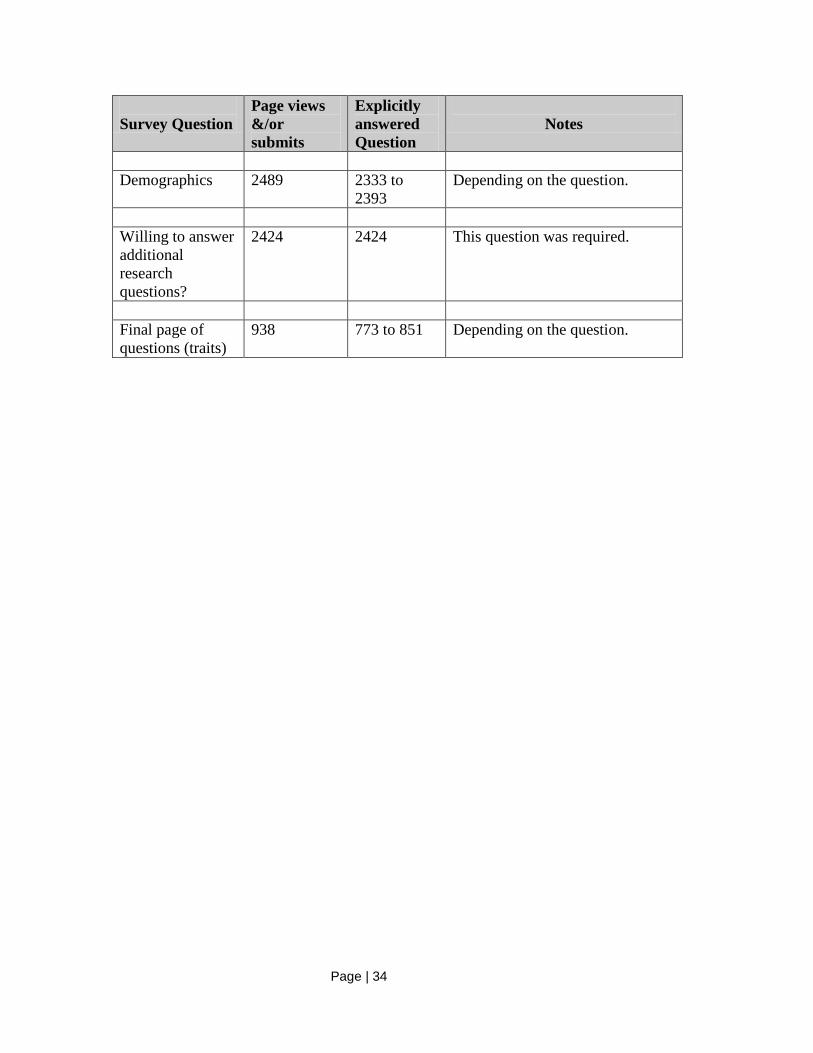
Page | 34
Survey Question
Page views &/or submits
Explicitly answered Question
Notes
Demographics 2489 2333 to
2393 Depending on the question.
Willing to answer additional research questions?
2424 2424 This question was required.
Final page of questions (traits)
938 773 to 851 Depending on the question.
Page | 35
Appendix B: Resident Reasons for Program Prioritizations
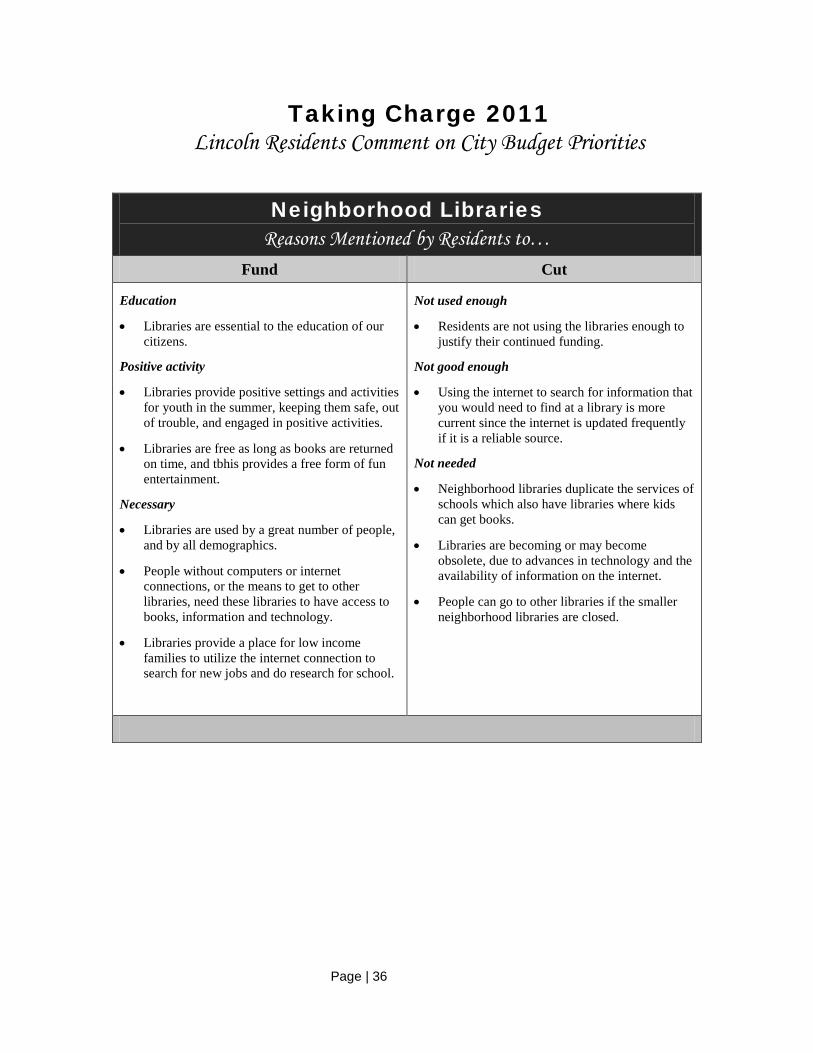
Page | 36
Taking Charge 2011 Lincoln Residents Comment on City Budget Priorities
Neighborhood Libraries Reasons Mentioned by Residents to…
Fund Cut
Education
• Libraries are essential to the education of our citizens.
Positive activity
• Libraries provide positive settings and activities for youth in the summer, keeping them safe, out of trouble, and engaged in positive activities.
• Libraries are free as long as books are returned on time, and tbhis provides a free form of fun entertainment.
Necessary
• Libraries are used by a great number of people, and by all demographics.
• People without computers or internet connections, or the means to get to other libraries, need these libraries to have access to books, information and technology.
• Libraries provide a place for low income families to utilize the internet connection to search for new jobs and do research for school.
Not used enough
• Residents are not using the libraries enough to justify their continued funding.
Not good enough
• Using the internet to search for information that you would need to find at a library is more current since the internet is updated frequently if it is a reliable source.
Not needed
• Neighborhood libraries duplicate the services of schools which also have libraries where kids can get books.
• Libraries are becoming or may become obsolete, due to advances in technology and the availability of information on the internet.
• People can go to other libraries if the smaller neighborhood libraries are closed.
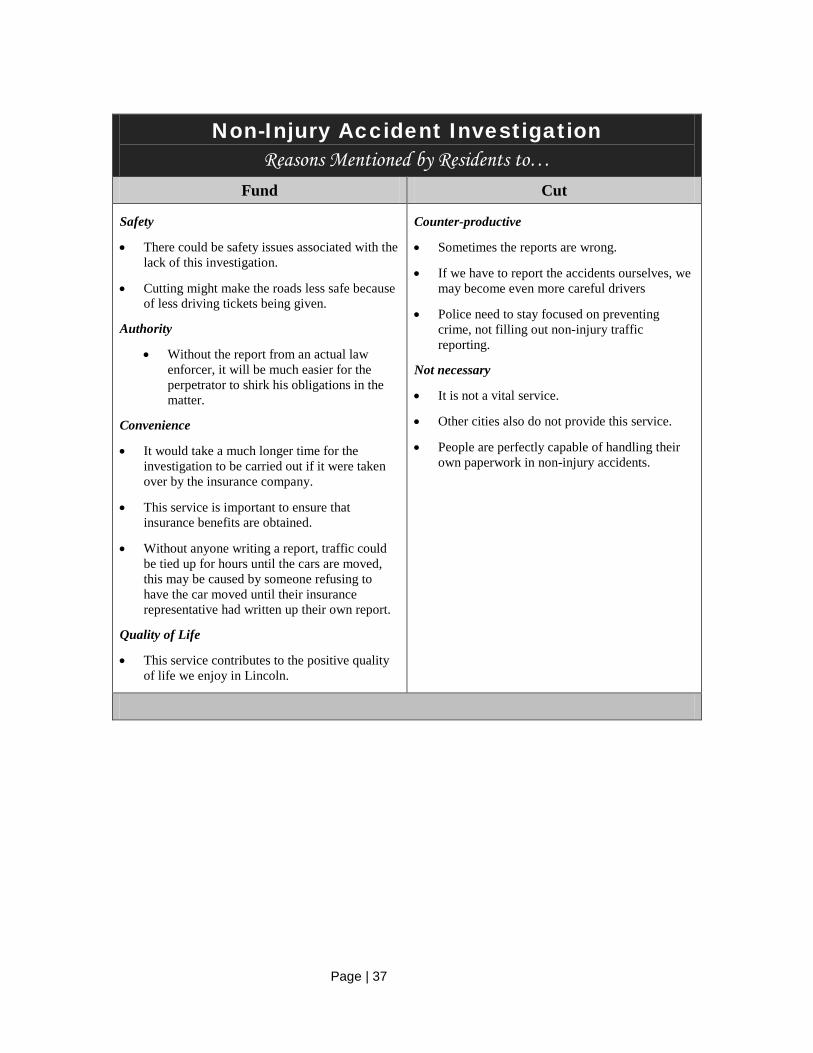
Page | 37
Non-Injury Accident Investigation Reasons Mentioned by Residents to…
Fund Cut
Safety
• There could be safety issues associated with the lack of this investigation.
• Cutting might make the roads less safe because of less driving tickets being given.
Authority
• Without the report from an actual law enforcer, it will be much easier for the perpetrator to shirk his obligations in the matter.
Convenience
• It would take a much longer time for the investigation to be carried out if it were taken over by the insurance company.
• This service is important to ensure that insurance benefits are obtained.
• Without anyone writing a report, traffic could be tied up for hours until the cars are moved, this may be caused by someone refusing to have the car moved until their insurance representative had written up their own report.
Quality of Life
• This service contributes to the positive quality of life we enjoy in Lincoln.
Counter-productive
• Sometimes the reports are wrong.
• If we have to report the accidents ourselves, we may become even more careful drivers
• Police need to stay focused on preventing crime, not filling out non-injury traffic reporting.
Not necessary
• It is not a vital service.
• Other cities also do not provide this service.
• People are perfectly capable of handling their own paperwork in non-injury accidents.
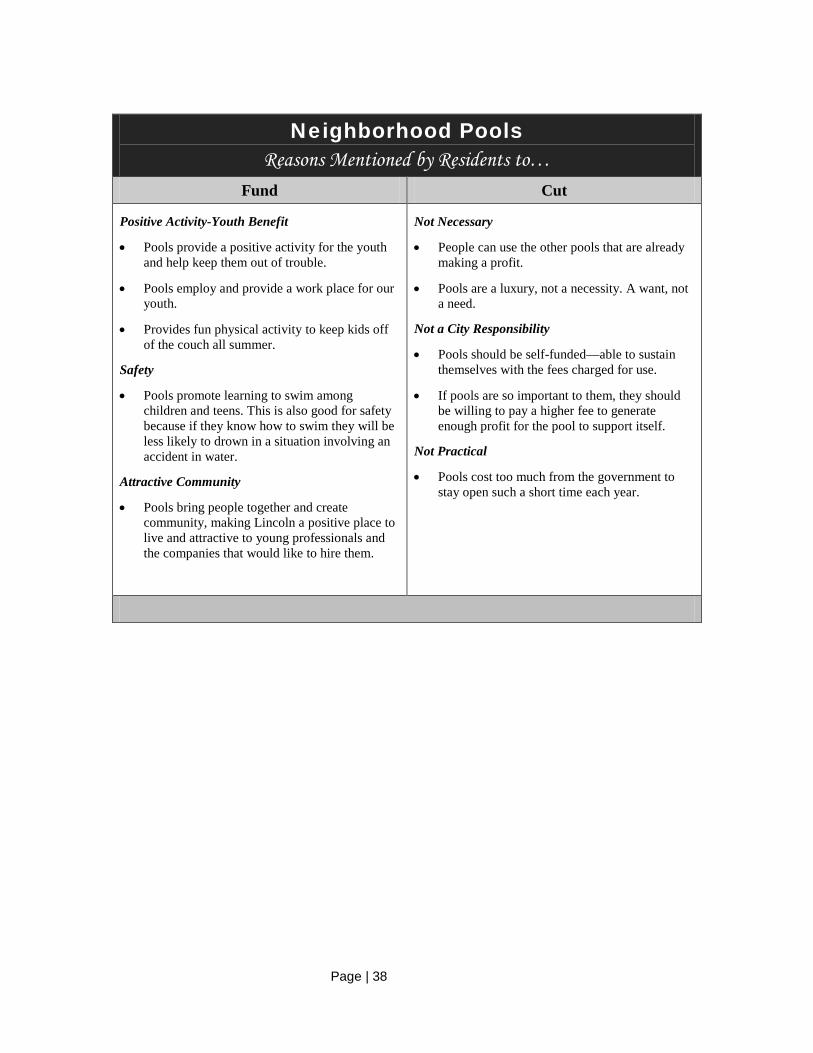
Page | 38
Neighborhood Pools Reasons Mentioned by Residents to…
Fund Cut
Positive Activity-Youth Benefit
• Pools provide a positive activity for the youth and help keep them out of trouble.
• Pools employ and provide a work place for our youth.
• Provides fun physical activity to keep kids off of the couch all summer.
Safety
• Pools promote learning to swim among children and teens. This is also good for safety because if they know how to swim they will be less likely to drown in a situation involving an accident in water.
Attractive Community
• Pools bring people together and create community, making Lincoln a positive place to live and attractive to young professionals and the companies that would like to hire them.
Not Necessary
• People can use the other pools that are already making a profit.
• Pools are a luxury, not a necessity. A want, not a need.
Not a City Responsibility
• Pools should be self-funded—able to sustain themselves with the fees charged for use.
• If pools are so important to them, they should be willing to pay a higher fee to generate enough profit for the pool to support itself.
Not Practical
• Pools cost too much from the government to stay open such a short time each year.
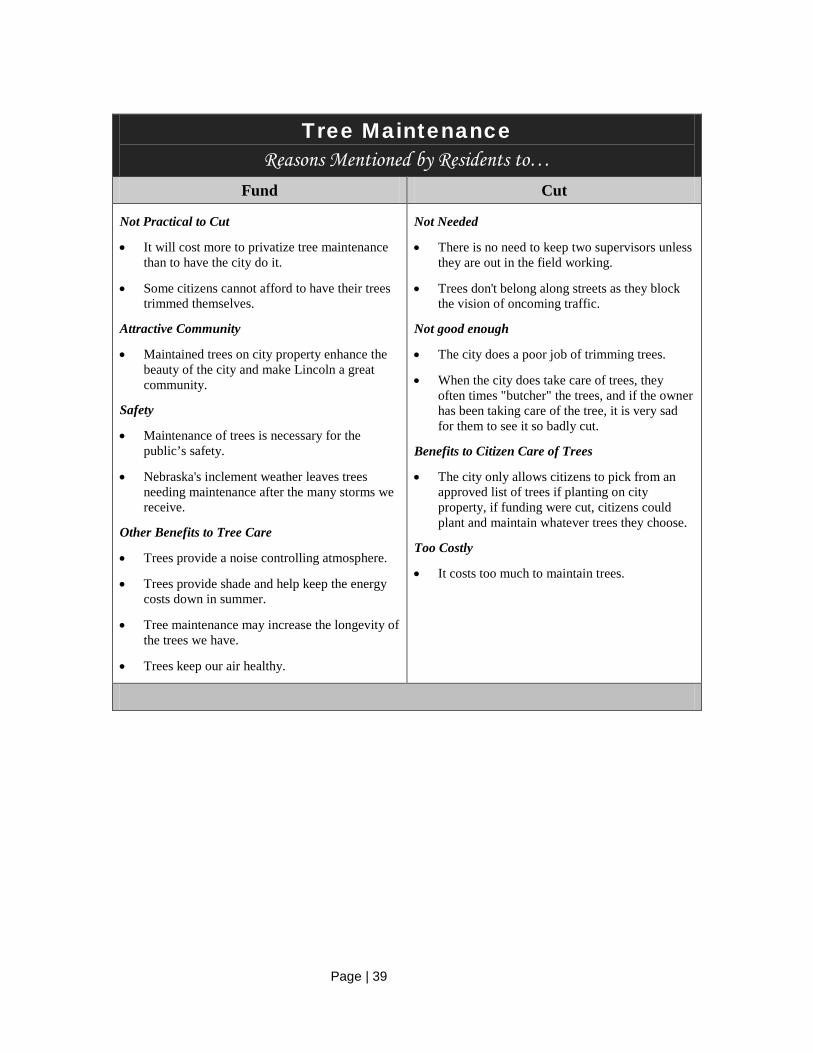
Page | 39
Tree Maintenance Reasons Mentioned by Residents to…
Fund Cut
Not Practical to Cut
• It will cost more to privatize tree maintenance than to have the city do it.
• Some citizens cannot afford to have their trees trimmed themselves.
Attractive Community
• Maintained trees on city property enhance the beauty of the city and make Lincoln a great community.
Safety
• Maintenance of trees is necessary for the public’s safety.
• Nebraska's inclement weather leaves trees needing maintenance after the many storms we receive.
Other Benefits to Tree Care
• Trees provide a noise controlling atmosphere.
• Trees provide shade and help keep the energy costs down in summer.
• Tree maintenance may increase the longevity of the trees we have.
• Trees keep our air healthy.
Not Needed
• There is no need to keep two supervisors unless they are out in the field working.
• Trees don't belong along streets as they block the vision of oncoming traffic.
Not good enough
• The city does a poor job of trimming trees.
• When the city does take care of trees, they often times "butcher" the trees, and if the owner has been taking care of the tree, it is very sad for them to see it so badly cut.
Benefits to Citizen Care of Trees
• The city only allows citizens to pick from an approved list of trees if planting on city property, if funding were cut, citizens could plant and maintain whatever trees they choose.
Too Costly
• It costs too much to maintain trees.
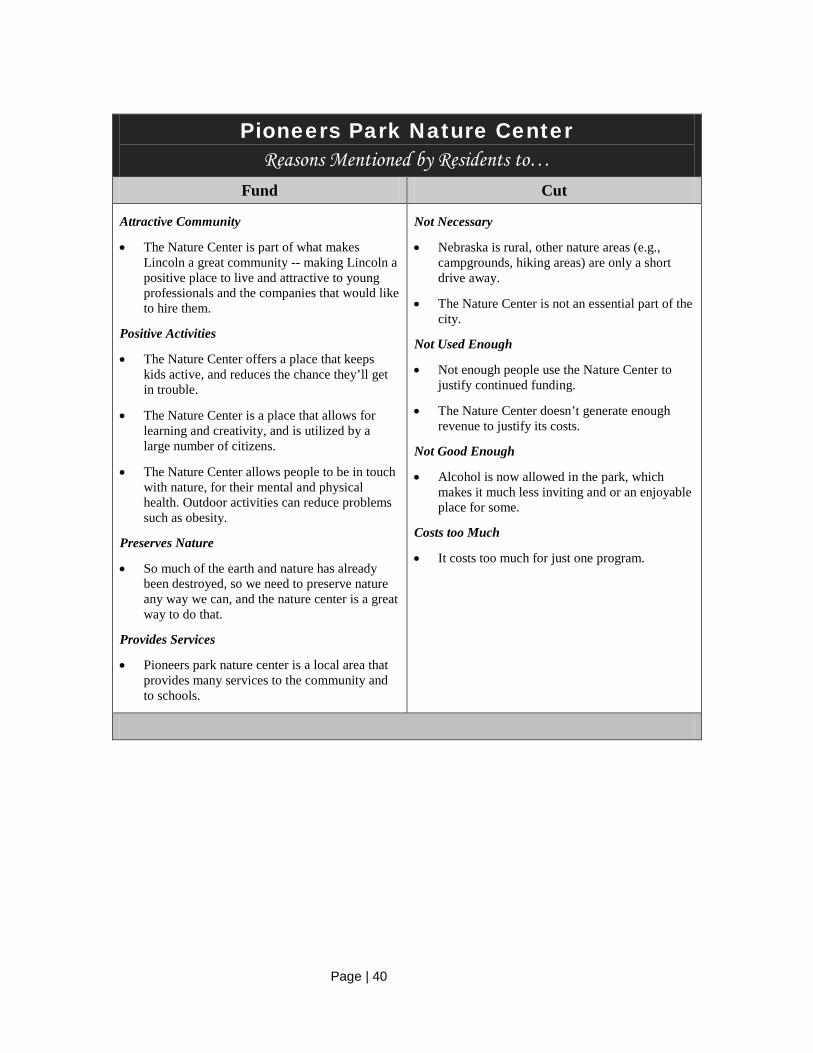
Page | 40
Pioneers Park Nature Center Reasons Mentioned by Residents to…
Fund Cut
Attractive Community
• The Nature Center is part of what makes Lincoln a great community -- making Lincoln a positive place to live and attractive to young professionals and the companies that would like to hire them.
Positive Activities
• The Nature Center offers a place that keeps kids active, and reduces the chance they’ll get in trouble.
• The Nature Center is a place that allows for learning and creativity, and is utilized by a large number of citizens.
• The Nature Center allows people to be in touch with nature, for their mental and physical health. Outdoor activities can reduce problems such as obesity.
Preserves Nature
• So much of the earth and nature has already been destroyed, so we need to preserve nature any way we can, and the nature center is a great way to do that.
Provides Services
• Pioneers park nature center is a local area that provides many services to the community and to schools.
Not Necessary
• Nebraska is rural, other nature areas (e.g., campgrounds, hiking areas) are only a short drive away.
• The Nature Center is not an essential part of the city.
Not Used Enough
• Not enough people use the Nature Center to justify continued funding.
• The Nature Center doesn’t generate enough revenue to justify its costs.
Not Good Enough
• Alcohol is now allowed in the park, which makes it much less inviting and or an enjoyable place for some.
Costs too Much
• It costs too much for just one program.
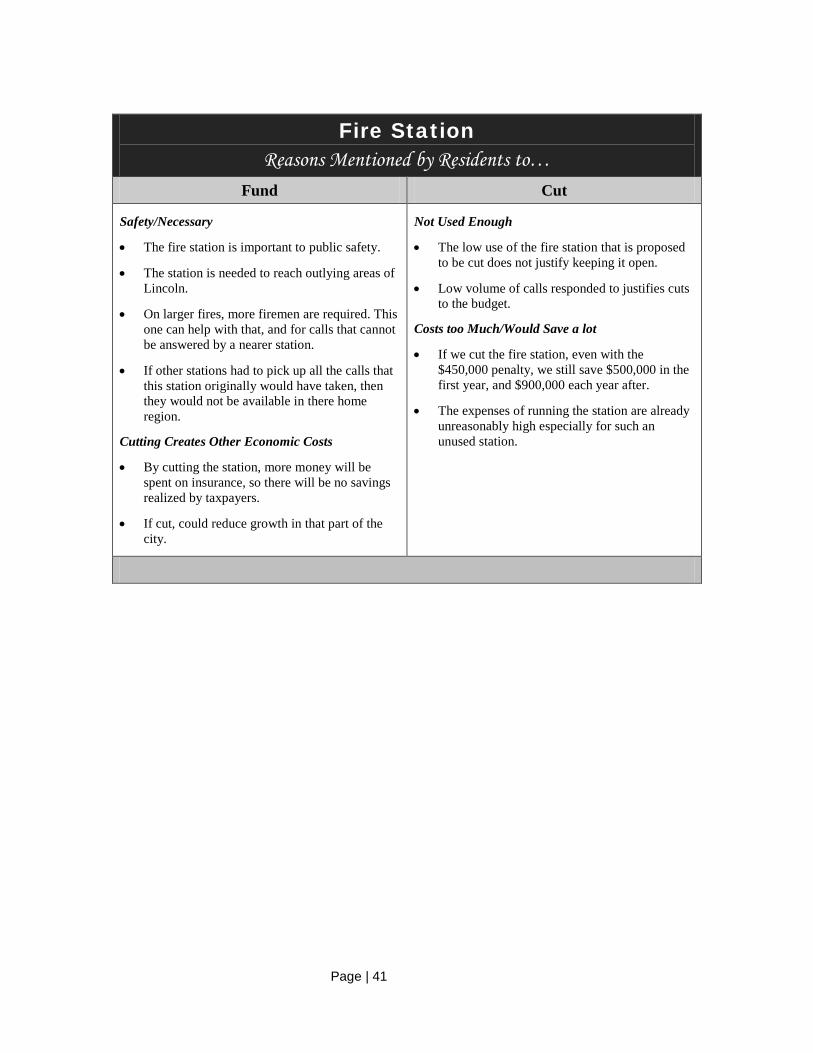
Page | 41
Fire Station Reasons Mentioned by Residents to…
Fund Cut
Safety/Necessary
• The fire station is important to public safety.
• The station is needed to reach outlying areas of Lincoln.
• On larger fires, more firemen are required. This one can help with that, and for calls that cannot be answered by a nearer station.
• If other stations had to pick up all the calls that this station originally would have taken, then they would not be available in there home region.
Cutting Creates Other Economic Costs
• By cutting the station, more money will be spent on insurance, so there will be no savings realized by taxpayers.
• If cut, could reduce growth in that part of the city.
Not Used Enough
• The low use of the fire station that is proposed to be cut does not justify keeping it open.
• Low volume of calls responded to justifies cuts to the budget.
Costs too Much/Would Save a lot
• If we cut the fire station, even with the $450,000 penalty, we still save $500,000 in the first year, and $900,000 each year after.
• The expenses of running the station are already unreasonably high especially for such an unused station.
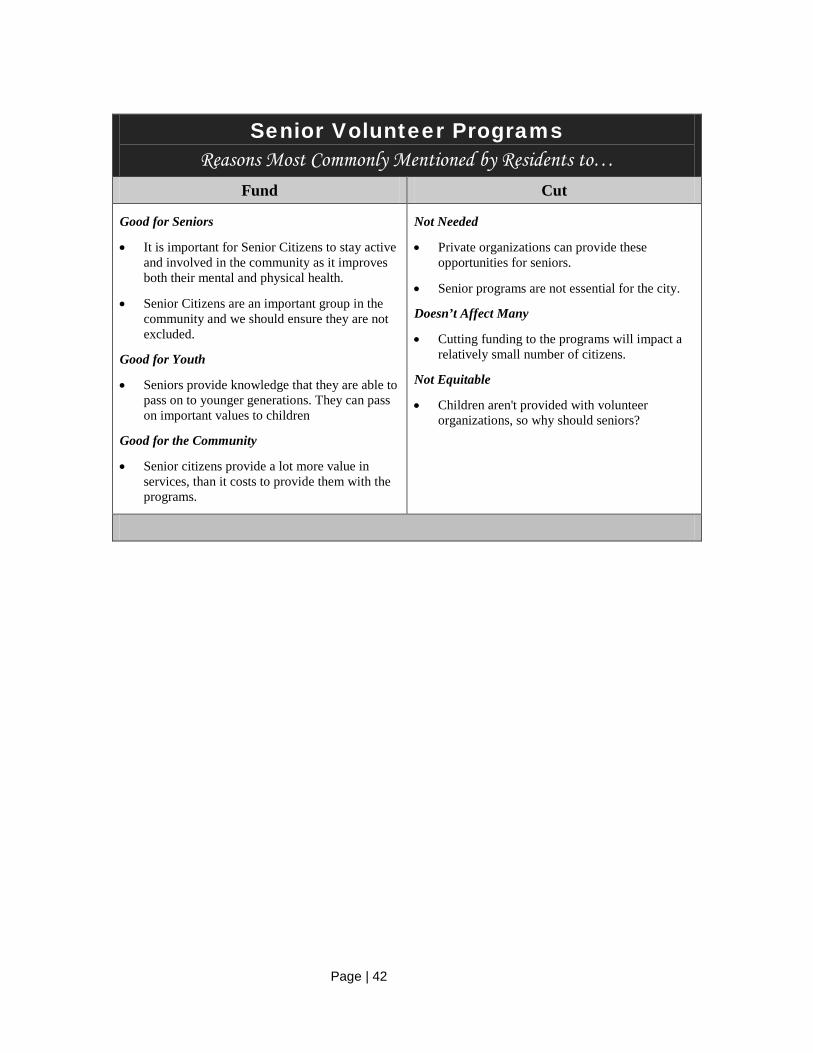
Page | 42
Senior Volunteer Programs Reasons Most Commonly Mentioned by Residents to…
Fund Cut
Good for Seniors
• It is important for Senior Citizens to stay active and involved in the community as it improves both their mental and physical health.
• Senior Citizens are an important group in the community and we should ensure they are not excluded.
Good for Youth
• Seniors provide knowledge that they are able to pass on to younger generations. They can pass on important values to children
Good for the Community
• Senior citizens provide a lot more value in services, than it costs to provide them with the programs.
Not Needed
• Private organizations can provide these opportunities for seniors.
• Senior programs are not essential for the city.
Doesn’t Affect Many
• Cutting funding to the programs will impact a relatively small number of citizens.
Not Equitable
• Children aren't provided with volunteer organizations, so why should seniors?
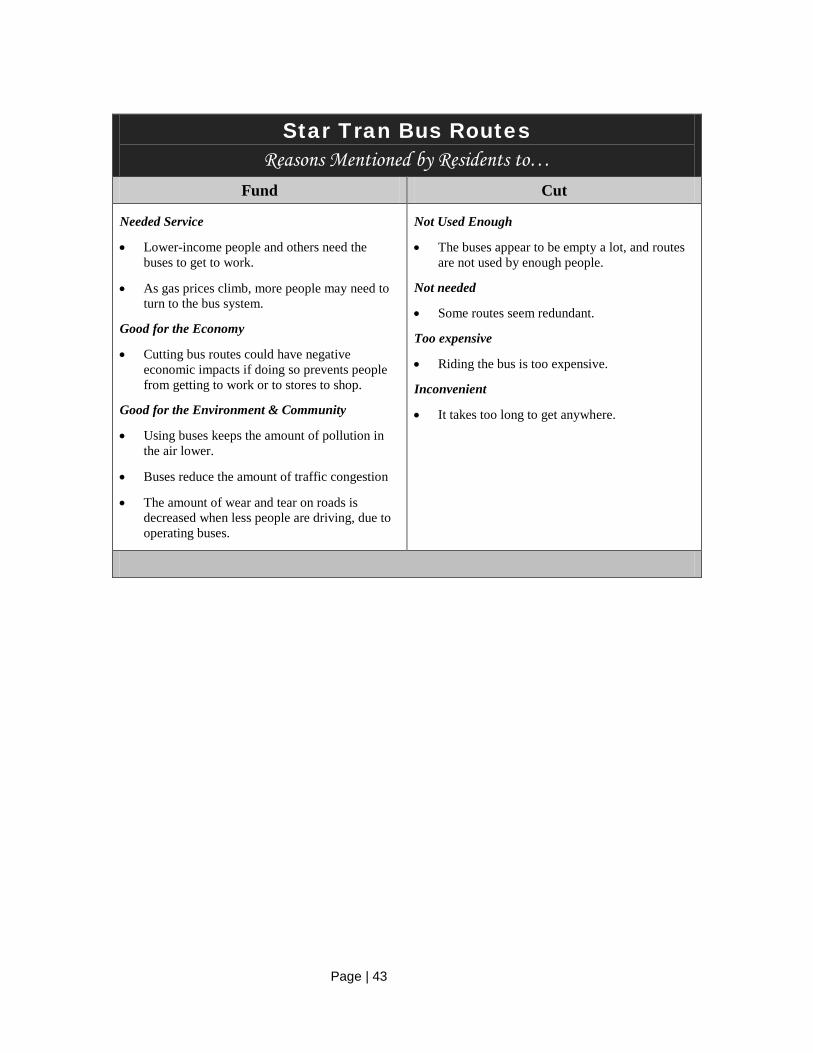
Page | 43
Star Tran Bus Routes Reasons Mentioned by Residents to…
Fund Cut
Needed Service
• Lower-income people and others need the buses to get to work.
• As gas prices climb, more people may need to turn to the bus system.
Good for the Economy
• Cutting bus routes could have negative economic impacts if doing so prevents people from getting to work or to stores to shop.
Good for the Environment & Community
• Using buses keeps the amount of pollution in the air lower.
• Buses reduce the amount of traffic congestion
• The amount of wear and tear on roads is decreased when less people are driving, due to operating buses.
Not Used Enough
• The buses appear to be empty a lot, and routes are not used by enough people.
Not needed
• Some routes seem redundant.
Too expensive
• Riding the bus is too expensive.
Inconvenient
• It takes too long to get anywhere.
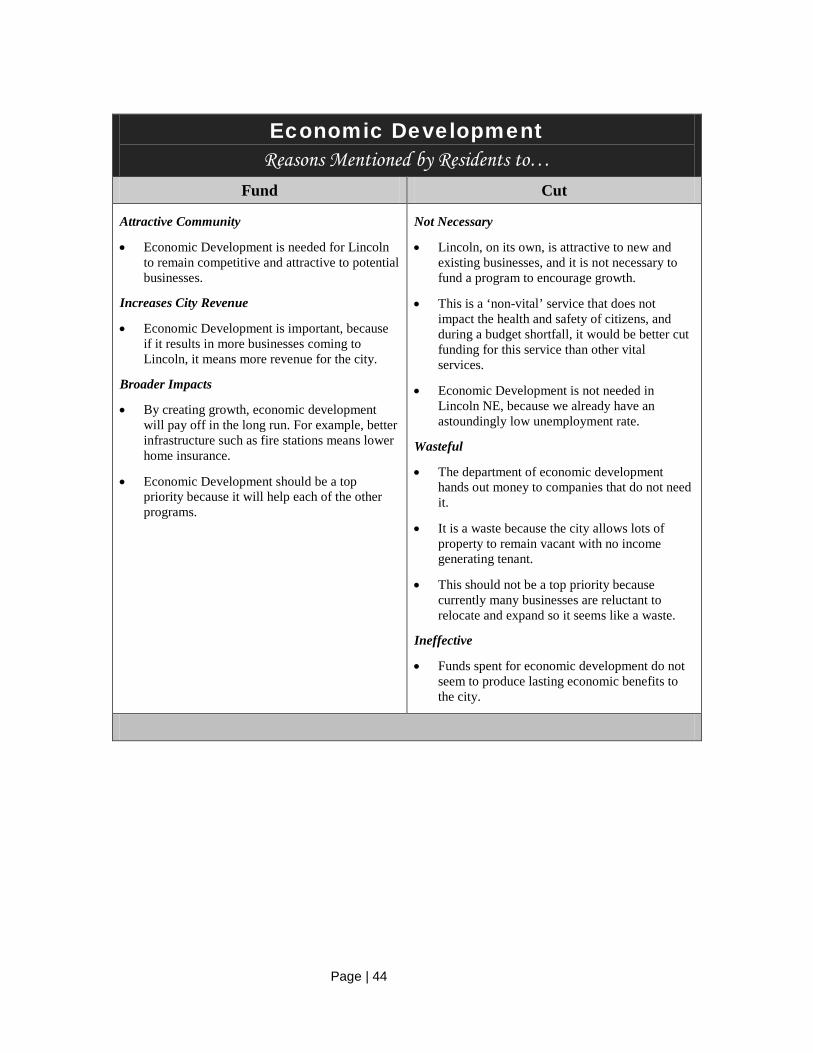
Page | 44
Economic Development Reasons Mentioned by Residents to…
Fund Cut
Attractive Community
• Economic Development is needed for Lincoln to remain competitive and attractive to potential businesses.
Increases City Revenue
• Economic Development is important, because if it results in more businesses coming to Lincoln, it means more revenue for the city.
Broader Impacts
• By creating growth, economic development will pay off in the long run. For example, better infrastructure such as fire stations means lower home insurance.
• Economic Development should be a top priority because it will help each of the other programs.
Not Necessary
• Lincoln, on its own, is attractive to new and existing businesses, and it is not necessary to fund a program to encourage growth.
• This is a ‘non-vital’ service that does not impact the health and safety of citizens, and during a budget shortfall, it would be better cut funding for this service than other vital services.
• Economic Development is not needed in Lincoln NE, because we already have an astoundingly low unemployment rate.
Wasteful
• The department of economic development hands out money to companies that do not need it.
• It is a waste because the city allows lots of property to remain vacant with no income generating tenant.
• This should not be a top priority because currently many businesses are reluctant to relocate and expand so it seems like a waste.
Ineffective
• Funds spent for economic development do not seem to produce lasting economic benefits to the city.
Page | 45
Appendix C: Preliminary Report
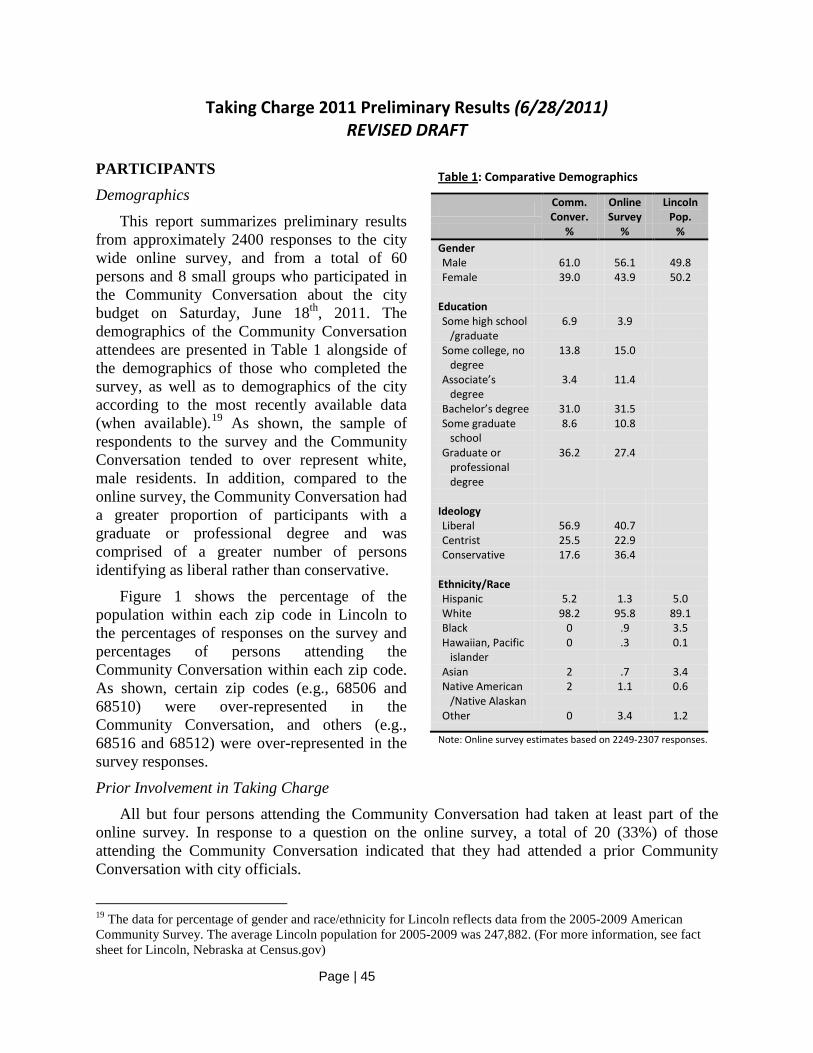
Page | 45
Taking Charge 2011 Preliminary Results (6/28/2011) REVISED DRAFT
PARTICIPANTS Demographics
This report summarizes preliminary results from approximately 2400 responses to the city wide online survey, and from a total of 60 persons and 8 small groups who participated in the Community Conversation about the city budget on Saturday, June 18th, 2011. The demographics of the Community Conversation attendees are presented in Table 1 alongside of the demographics of those who completed the survey, as well as to demographics of the city according to the most recently available data (when available).19 As shown, the sample of respondents to the survey and the Community Conversation tended to over represent white, male residents. In addition, compared to the online survey, the Community Conversation had a greater proportion of participants with a graduate or professional degree and was comprised of a greater number of persons identifying as liberal rather than conservative.
Figure 1 shows the percentage of the population within each zip code in Lincoln to the percentages of responses on the survey and percentages of persons attending the Community Conversation within each zip code. As shown, certain zip codes (e.g., 68506 and 68510) were over-represented in the Community Conversation, and others (e.g., 68516 and 68512) were over-represented in the survey responses.
Prior Involvement in Taking Charge All but four persons attending the Community Conversation had taken at least part of the
online survey. In response to a question on the online survey, a total of 20 (33%) of those attending the Community Conversation indicated that they had attended a prior Community Conversation with city officials.
19 The data for percentage of gender and race/ethnicity for Lincoln reflects data from the 2005-2009 American Community Survey. The average Lincoln population for 2005-2009 was 247,882. (For more information, see fact sheet for Lincoln, Nebraska at Census.gov)
Table 1: Comparative Demographics
Comm. Conver.
Online Survey
Lincoln Pop.
% % % Gender Male 61.0 56.1 49.8 Female 39.0 43.9 50.2
Education Some high school
/graduate 6.9 3.9
Some college, no degree
13.8 15.0
Associate’s degree
3.4 11.4
Bachelor’s degree 31.0 31.5 Some graduate
school 8.6 10.8
Graduate or professional degree
36.2 27.4
Ideology Liberal 56.9 40.7 Centrist 25.5 22.9 Conservative 17.6 36.4
Ethnicity/Race Hispanic 5.2 1.3 5.0 White 98.2 95.8 89.1 Black 0 .9 3.5 Hawaiian, Pacific
islander 0 .3 0.1
Asian 2 .7 3.4 Native American
/Native Alaskan 2 1.1 0.6
Other 0 3.4 1.2
Note: Online survey estimates based on 2249-2307 responses.
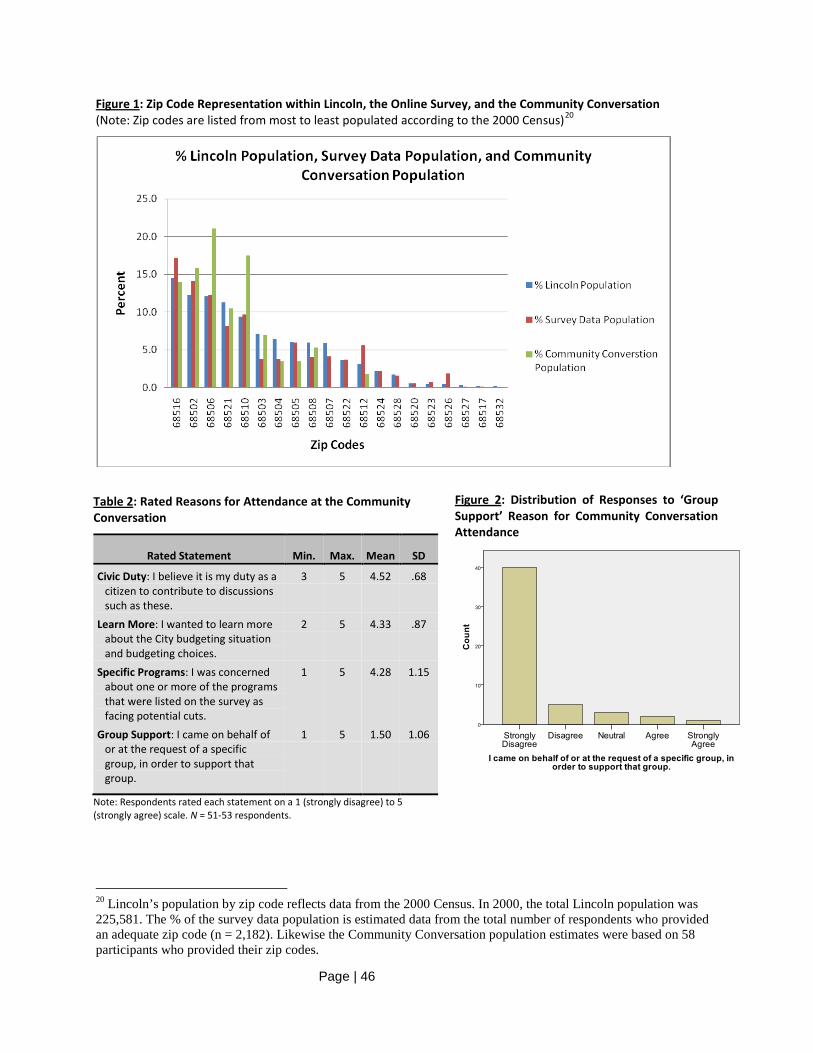
Page | 46
Figure 1: Zip Code Representation within Lincoln, the Online Survey, and the Community Conversation (Note: Zip codes are listed from most to least populated according to the 2000 Census)20
Figure 2: Distribution of Responses to ‘Group Support’ Reason for Community Conversation Attendance
20 Lincoln’s population by zip code reflects data from the 2000 Census. In 2000, the total Lincoln population was 225,581. The % of the survey data population is estimated data from the total number of respondents who provided an adequate zip code (n = 2,182). Likewise the Community Conversation population estimates were based on 58 participants who provided their zip codes.
Table 2: Rated Reasons for Attendance at the Community Conversation
Rated Statement Min. Max. Mean SD
Civic Duty: I believe it is my duty as a citizen to contribute to discussions such as these.
3 5 4.52 .68
Learn More: I wanted to learn more about the City budgeting situation and budgeting choices.
2 5 4.33 .87
Specific Programs: I was concerned about one or more of the programs that were listed on the survey as facing potential cuts.
1 5 4.28 1.15
Group Support: I came on behalf of or at the request of a specific group, in order to support that group.
1 5 1.50 1.06
Note: Respondents rated each statement on a 1 (strongly disagree) to 5 (strongly agree) scale. N = 51-53 respondents.
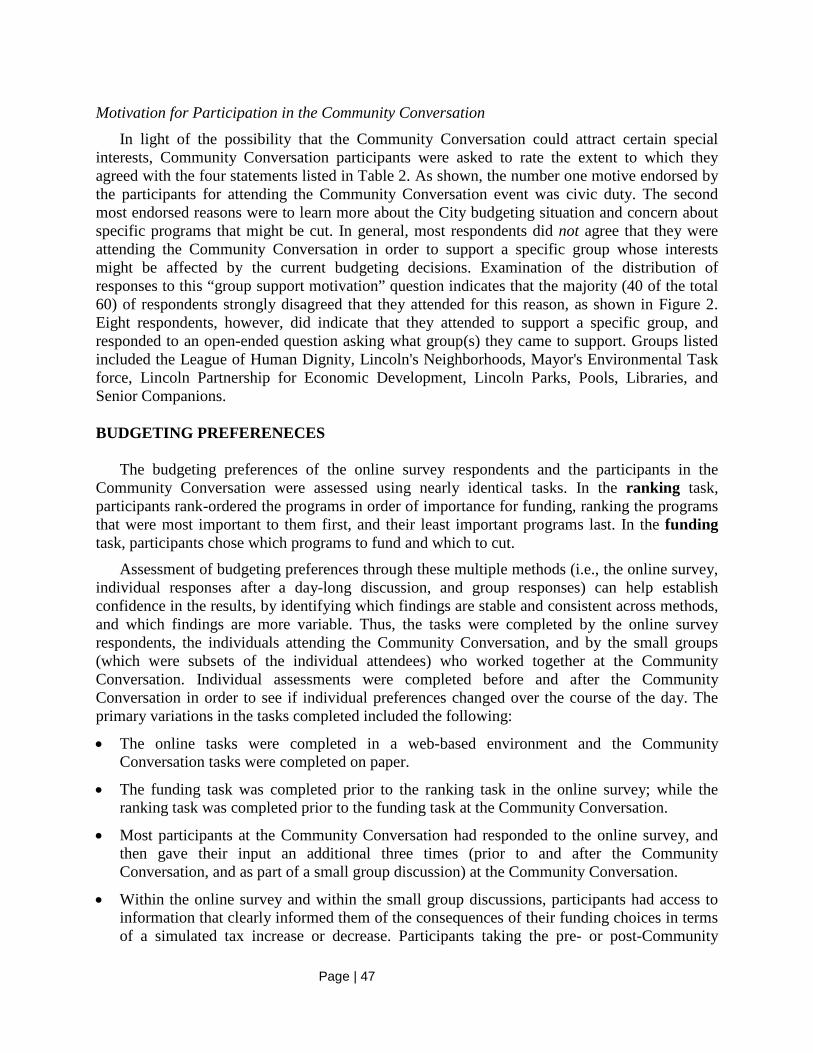
Page | 47
Motivation for Participation in the Community Conversation In light of the possibility that the Community Conversation could attract certain special
interests, Community Conversation participants were asked to rate the extent to which they agreed with the four statements listed in Table 2. As shown, the number one motive endorsed by the participants for attending the Community Conversation event was civic duty. The second most endorsed reasons were to learn more about the City budgeting situation and concern about specific programs that might be cut. In general, most respondents did not agree that they were attending the Community Conversation in order to support a specific group whose interests might be affected by the current budgeting decisions. Examination of the distribution of responses to this “group support motivation” question indicates that the majority (40 of the total 60) of respondents strongly disagreed that they attended for this reason, as shown in Figure 2. Eight respondents, however, did indicate that they attended to support a specific group, and responded to an open-ended question asking what group(s) they came to support. Groups listed included the League of Human Dignity, Lincoln's Neighborhoods, Mayor's Environmental Task force, Lincoln Partnership for Economic Development, Lincoln Parks, Pools, Libraries, and Senior Companions. BUDGETING PREFERENECES
The budgeting preferences of the online survey respondents and the participants in the Community Conversation were assessed using nearly identical tasks. In the ranking task, participants rank-ordered the programs in order of importance for funding, ranking the programs that were most important to them first, and their least important programs last. In the funding task, participants chose which programs to fund and which to cut.
Assessment of budgeting preferences through these multiple methods (i.e., the online survey, individual responses after a day-long discussion, and group responses) can help establish confidence in the results, by identifying which findings are stable and consistent across methods, and which findings are more variable. Thus, the tasks were completed by the online survey respondents, the individuals attending the Community Conversation, and by the small groups (which were subsets of the individual attendees) who worked together at the Community Conversation. Individual assessments were completed before and after the Community Conversation in order to see if individual preferences changed over the course of the day. The primary variations in the tasks completed included the following:
• The online tasks were completed in a web-based environment and the Community Conversation tasks were completed on paper.
• The funding task was completed prior to the ranking task in the online survey; while the ranking task was completed prior to the funding task at the Community Conversation.
• Most participants at the Community Conversation had responded to the online survey, and then gave their input an additional three times (prior to and after the Community Conversation, and as part of a small group discussion) at the Community Conversation.
• Within the online survey and within the small group discussions, participants had access to information that clearly informed them of the consequences of their funding choices in terms of a simulated tax increase or decrease. Participants taking the pre- or post-Community
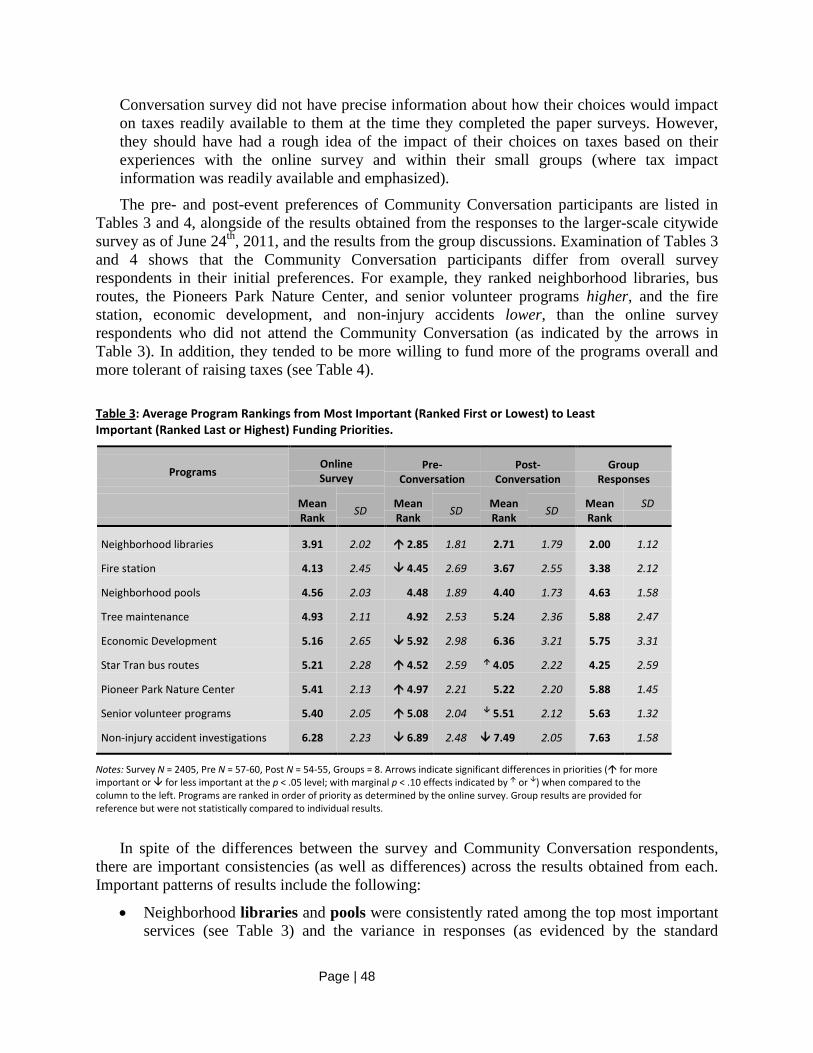
Page | 48
Conversation survey did not have precise information about how their choices would impact on taxes readily available to them at the time they completed the paper surveys. However, they should have had a rough idea of the impact of their choices on taxes based on their experiences with the online survey and within their small groups (where tax impact information was readily available and emphasized).
The pre- and post-event preferences of Community Conversation participants are listed in Tables 3 and 4, alongside of the results obtained from the responses to the larger-scale citywide survey as of June 24th, 2011, and the results from the group discussions. Examination of Tables 3 and 4 shows that the Community Conversation participants differ from overall survey respondents in their initial preferences. For example, they ranked neighborhood libraries, bus routes, the Pioneers Park Nature Center, and senior volunteer programs higher, and the fire station, economic development, and non-injury accidents lower, than the online survey respondents who did not attend the Community Conversation (as indicated by the arrows in Table 3). In addition, they tended to be more willing to fund more of the programs overall and more tolerant of raising taxes (see Table 4).
Table 3: Average Program Rankings from Most Important (Ranked First or Lowest) to Least Important (Ranked Last or Highest) Funding Priorities.
Programs Online Survey
Pre- Conversation
Post- Conversation
Group Responses
Mean Rank SD Mean
Rank SD Mean Rank SD Mean
Rank SD
Neighborhood libraries 3.91 2.02 2.85 1.81 2.71 1.79 2.00 1.12
Fire station 4.13 2.45 4.45 2.69 3.67 2.55 3.38 2.12
Neighborhood pools 4.56 2.03 4.48 1.89 4.40 1.73 4.63 1.58
Tree maintenance 4.93 2.11 4.92 2.53 5.24 2.36 5.88 2.47
Economic Development 5.16 2.65 5.92 2.98 6.36 3.21 5.75 3.31
Star Tran bus routes 5.21 2.28 4.52 2.59 4.05 2.22 4.25 2.59
Pioneer Park Nature Center 5.41 2.13 4.97 2.21 5.22 2.20 5.88 1.45
Senior volunteer programs 5.40 2.05 5.08 2.04 5.51 2.12 5.63 1.32
Non-injury accident investigations 6.28 2.23 6.89 2.48 7.49 2.05 7.63 1.58
Notes: Survey N = 2405, Pre N = 57-60, Post N = 54-55, Groups = 8. Arrows indicate significant differences in priorities ( for more important or for less important at the p < .05 level; with marginal p < .10 effects indicated by or ) when compared to the column to the left. Programs are ranked in order of priority as determined by the online survey. Group results are provided for reference but were not statistically compared to individual results.
In spite of the differences between the survey and Community Conversation respondents, there are important consistencies (as well as differences) across the results obtained from each. Important patterns of results include the following:
• Neighborhood libraries and pools were consistently rated among the top most important services (see Table 3) and the variance in responses (as evidenced by the standard

Page | 49
deviations) was comparatively low, indicating relatively greater consensus on the rated importance of these items. In addition, these items had high support for funding as they were endorsed by more than two-thirds of those giving their opinion (see Table 4).
• Although there was somewhat more variance in responses to the questions concerning the fire station, it too was a consistently highly rated item that was supported for funding by approximately two-thirds of those responding.
• Non-injury accident investigation was a service that a majority of respondents across input methods felt they could do without. Less than half of those giving their input (and only one-third of those who took the survey, see Table 4) indicated a desire to continue funding this service. Once again, the relatively small standard deviation for this item indicates that there was relatively great consensus (especially after the Community Conversation) that this was among the very lowest priorities for funding among those giving their input (Table 3).
• Senior volunteer programs, Pioneers Park Nature Center, and Tree maintenance were ranked relatively medium to low in importance for funding compared to the other programs (see Table 3). Nonetheless, a majority of responses favored funding these programs (see Table 4).
Figure 3: Tax Preference Groups Arising from the Online Budget Activity Simulation
Table 4: Funding Preferences: Percentage of Persons Funding Programs on the Survey and at the Community Conversation (Pre and Post, and Group Results)
Programs Survey Pre Post Group
% % % %
Neighborhood libraries 67 84 90 88
Neighborhood pools 66 84 90 88
Fire station 59 67 76 88
Star Tran bus routes 56 78 91 88
Tree maintenance 56 78 78 75
Senior volunteer programs 55 78 76 75
Pioneers’ Nature Center 53 70 72 75
Economic development 47 57 52 75
Non-injury accidents 33 48 41 38
Implied Tax Change +$21.30 +$26.30 +$26.30 +$26.30
Ave. Chosen Tax Change +$12.28 +$16.35 +$17.59 +$20.42
(SD Chosen Tax Change) ($10.26) ($9.62) ($10.75)
Notes: Reported means and percentages are based on all data available. Survey N = 2405, Pre N = 56-59, Post N = 57-58, Pre-post pairs N = 51 to 54, Groups = 8. Arrows indicate significant differences in percentage of persons funding when compared to the column to the left. Programs are ranked in order of priority as determined by the online survey. Percentages < 50% are in red, indicating that the majority of respondents chose not to fund the program. Implied tax change refers to tax change if programs supported by the majority were funded. Average chosen tax is an average across individual choices of programs to fund.
Page | 50
• Two programs—economic development, and bus routes—were notable for their pattern of inconsistency and change.
o Economic development was not consistently chosen to be funded or cut, and though rated medium in importance overall, it had the largest standard deviation of any of the programs, indicating less consensus regarding its ranked importance. It was one of only two programs that had a larger standard deviation around its mean rating after the Community Conversation than before, indicating less rather than more consensus on its importance after discussion at the Community Conversation event (Table 3).
o Bus routes were ranked medium in importance by online survey respondents, but of relatively high importance by those attending the Community Conversation. Notably, over the course of the Community Conversation bus routes came to be seen as more important to many participants, resulting in a change in the percent supporting the funding of buses rising from 78% to 91% (see Table 4) and an increase in prioritization from fourth place to third place (see Table 3).
• Finally, with regard to property taxes, there seemed to be general support for a moderate raise in taxes in order to keep most of the programs listed in the budget simulation (see bottom of Table 4 and Figure 3). If all the choices of programs that received more than 50% support in the simulation were funded, the implied impact on taxes would be an increase of more than $20 per year—which is more than two-thirds the simulated maximum (the largest possible increase in taxes was $27.70). Averaging across individual choices suggested that lower levels of tax increases, between $10 and $20 per year (less than half and up to about two-thirds of the maximum in the simulation), would be acceptable to most. Although the average suggested tax increase resulting from the choices of programs was greater after the Community Conversation than prior, the standard deviation was greater indicating that there was not as much consensus around that higher average as around the lower average (see bottom two rows of Table 4).
ASSESSING THE ASSESSMENTS
The methods used to obtain public input are many, and each have their strengths and weaknesses. The current public input effort used two primary methods, an online survey and a day-long Community Conversation. The day-long Community Conversation involves relatively few voices and is not likely to be representative of the residents of Lincoln. This weakness is substantiated by Table 1 and Figure 1. However, unlike the online survey, the Community Conversation has the benefit of ensuring the participants are relatively informed about the choices before them. In the comments on the online survey, it was clear that not everyone spent sufficient amounts of time familiarizing themselves with the programs and the implications of cutting or funding them. For example, some who voted to cut the fire station apparently did not understand that cutting the fire station meant cutting an existing station. In fact, several people justified not funding the fire station item by claiming that Lincoln does not need a new fire station. At the Community Conversation, several features (background materials, a presentation by the Mayor, a question and answer session with city officials, a presentation by an economic expert, and group discussion) were implemented to ensure that people’s choices were relatively informed and not mis-informed.

Page | 51
Drawbacks of the online survey include the ability to take the survey more than once and/or the possibility that special interests will flood the survey with responses reflecting their interests, resulting in an inaccurate picture of what the larger public might prefer. Although it is not possible to entirely eliminate these possibilities, various analytic methods can be used to examine and assess these scenarios. Thus, Figure 4 shows the results obtained from the full 2405 responses (as of approximately June 24, 2011), compared to results obtained after eliminating possible repeated surveys. Of the 2405 surveys, there were 177 computers (identified by unique IP addresses) that were used for two or more (up to 15) surveys. The total number of surveys coming from these computers was 597. Comparison between the results including repeated use computers (N = 2405) versus eliminating any responses from repeated use computers (N = 1808) reveals no differences in the priority ordering of programs whether assessed by the funding task (see Figure 4, left graph) or by average ranking (right graph).
Figure 4: Comparison of inclusion versus exclusion of data from repeated use computers.
0%
10%
20%
30%
40%
50%
60%
70%
80%
Librar
iesPoo
ls
Fire Stat
ion
Bus R
oute
Tree M
aint.
Senior
Vol. Pgm
s.
Nature
Center
Econ.
Dev.
Accide
nt Inv
.
Perc
ent S
uppo
rtin
g Fu
ndin
g
1.0
2.0
3.0
4.0
5.0
6.0
7.0
Librar
ies
Fire Stat
ionPoo
ls
Tree M
aint.
Econ.
Dev.
Bus R
oute
Senior
Vol. Pgm
s.
Nature
Center
Accide
nt Inv
.
Ave
rage
Ran
king
No RepeatsRepeats
Figures 5 and 6 show the online survey results over time. In Figure 5, the number of survey
“views” are shown (dotted line) as well as the number of surveys actually completed (solid line) each day. The rise and fall of these two lines correspond to different known events including:
• The survey’s opening day press conference (Day 1 peak, falling to Day 6)
• Attention focused on the survey by a radio talk host who was critical of the survey (Day 7 to 13)
• A newsletter/magazine announcement of the survey sent to businesses and members of an organization oriented toward economic development opportunities near the end of May/early June.
• A second press conference held by the city to release a new interface designed to facilitate transparency in budgeting by listing all programs and their costs (Day 22 to 27)21
21 This press conference was pre-planned but coincidentally held the morning after a catastrophic fire that destroyed the Lincoln Public Schools headquarters. Thus, Lincoln residents may have been especially alert to the newscasts that day. The mayor did devote time during the press conference to discussion of the fire, followed by a discussion of the budgeting survey and new web interface.
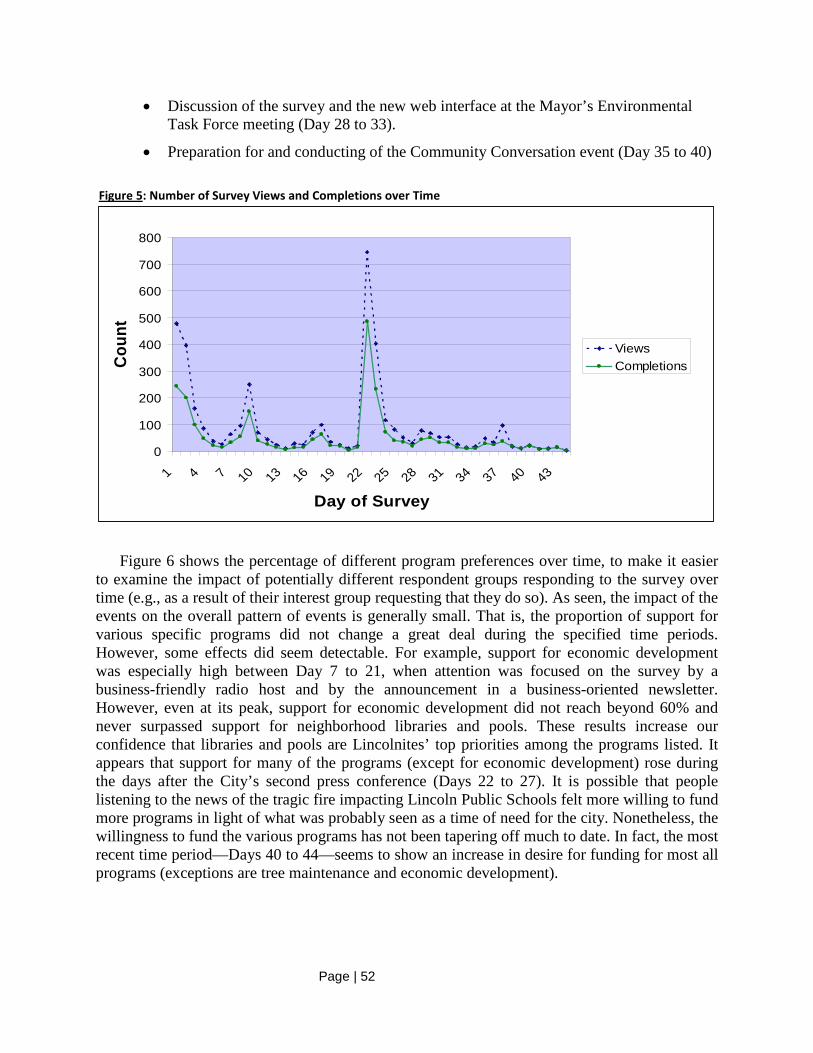
Page | 52
• Discussion of the survey and the new web interface at the Mayor’s Environmental Task Force meeting (Day 28 to 33).
• Preparation for and conducting of the Community Conversation event (Day 35 to 40)
Figure 5: Number of Survey Views and Completions over Time
0
100
200
300
400
500
600
700
800
1 4 7 10 13 16 19 22 25 28 31 34 37 40 43
Day of Survey
Coun
t
ViewsCompletions
Figure 6 shows the percentage of different program preferences over time, to make it easier to examine the impact of potentially different respondent groups responding to the survey over time (e.g., as a result of their interest group requesting that they do so). As seen, the impact of the events on the overall pattern of events is generally small. That is, the proportion of support for various specific programs did not change a great deal during the specified time periods. However, some effects did seem detectable. For example, support for economic development was especially high between Day 7 to 21, when attention was focused on the survey by a business-friendly radio host and by the announcement in a business-oriented newsletter. However, even at its peak, support for economic development did not reach beyond 60% and never surpassed support for neighborhood libraries and pools. These results increase our confidence that libraries and pools are Lincolnites’ top priorities among the programs listed. It appears that support for many of the programs (except for economic development) rose during the days after the City’s second press conference (Days 22 to 27). It is possible that people listening to the news of the tragic fire impacting Lincoln Public Schools felt more willing to fund more programs in light of what was probably seen as a time of need for the city. Nonetheless, the willingness to fund the various programs has not been tapering off much to date. In fact, the most recent time period—Days 40 to 44—seems to show an increase in desire for funding for most all programs (exceptions are tree maintenance and economic development).
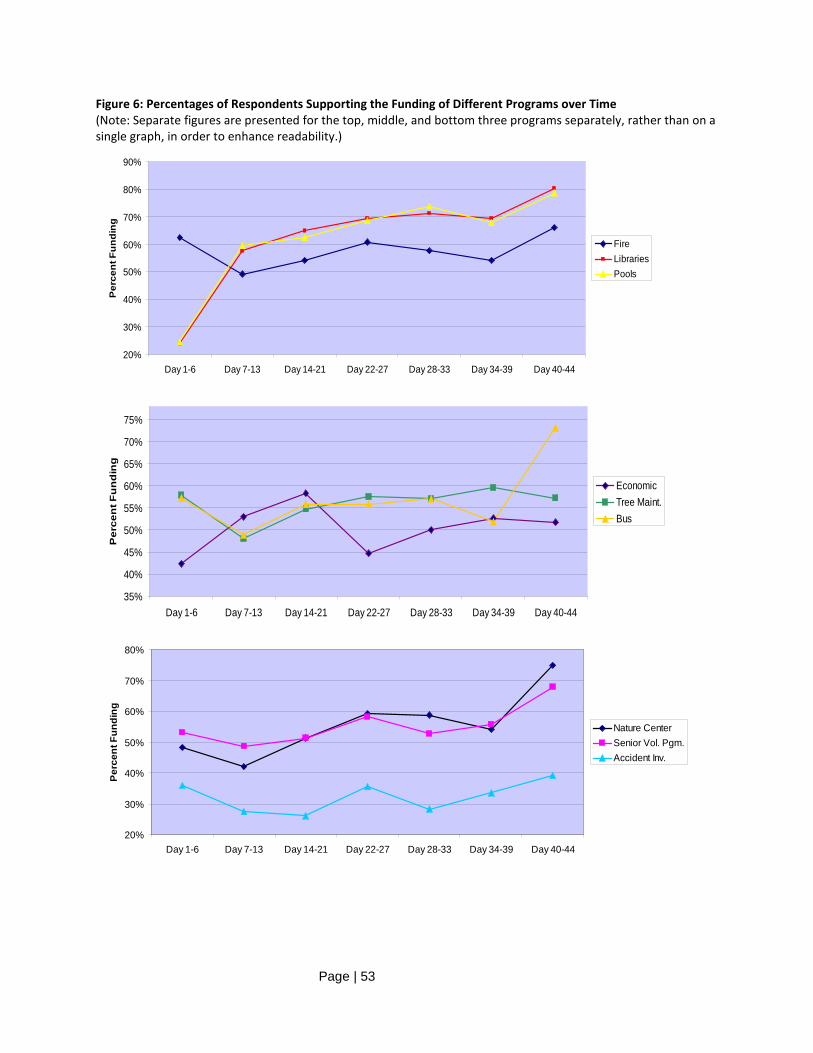
Page | 53
Figure 6: Percentages of Respondents Supporting the Funding of Different Programs over Time (Note: Separate figures are presented for the top, middle, and bottom three programs separately, rather than on a single graph, in order to enhance readability.)
20%
30%
40%
50%
60%
70%
80%
90%
Day 1-6 Day 7-13 Day 14-21 Day 22-27 Day 28-33 Day 34-39 Day 40-44
Per
cent
Fun
ding
FireLibrariesPools
35%
40%
45%
50%
55%
60%
65%
70%
75%
Day 1-6 Day 7-13 Day 14-21 Day 22-27 Day 28-33 Day 34-39 Day 40-44
Per
cen
t Fu
nd
ing
EconomicTree Maint.Bus
20%
30%
40%
50%
60%
70%
80%
Day 1-6 Day 7-13 Day 14-21 Day 22-27 Day 28-33 Day 34-39 Day 40-44
Per
cent
Fun
ding
Nature CenterSenior Vol. Pgm.Accident Inv.
Page | 54
CONCLUSIONS AND CAVEATS Taken together, the evidence strongly suggests that the majority of Lincolnites who took the
time to give their input did so because they valued the programs that could be affected by the budget cuts—especially libraries, pools, and the fire station. The majority of these respondents are willing to accept a small or moderate increase in taxes to keep valued programs, but they will not necessarily accept an unlimited increase. In fact, the majority of respondents also indicate a willingness to cut some programs, such as the investigation of non-injury accidents, in order to minimize tax increases.
Of course, caution should be exercised in extending these preliminary results to the population of Lincoln as a whole. As illustrated in Table 1, and as is common with surveys of volunteer respondents, the results presented here are not representative of all segments (zip codes, demographics, etc.) of Lincoln’s population. Further analyses need to be conducted to examine whether results are consistent between different populations, to better assess how differences in the demographic make-up of the survey and Conversation samples may be impacting the results. Finally, at the time of this preliminary report, the citywide survey is still ongoing, due to end June 30th. The data reported here do not include any survey responses obtained after approximately June 24th, 2011. A final report will be subsequently released based on the full data set.
The University of Nebraska Public Policy Center provides assistance to policymakers in all three branches of government and researchers on a wide range of public policy issues. The mission of the PPC is to actively inform public policy by facilitating, developing, and making available objective research and analyses of issues for elected and appointed officials; state and local agency staff; the public at large; and others who represent policy interests.
® The University of Nebraska does not discriminate based on gender, age, disability, race, color, religion, marital status, veteran’s status, national or ethnic origin, or sexual orientation.