TAKEOFF AND LANDING DATA (TOLD) CARDS FOR C12 R/T3/F3
55
TAKEOFF AND LANDING DATA (TOLD) CARDS FOR C12 R/T3/F3
description
TAKEOFF AND LANDING DATA (TOLD) CARDS FOR C12 R/T3/F3. Purpose New TOLD cards Example problem Part I- Back of TOLD card Part II- Front of TOLD card Conclusion. AGENDA. PURPOSE. The purpose of this presentation is to provide guidance and disseminate the changes to the - PowerPoint PPT Presentation
Transcript of TAKEOFF AND LANDING DATA (TOLD) CARDS FOR C12 R/T3/F3

1
TAKEOFF AND LANDING DATA (TOLD) CARDS FOR C12 R/T3/F3

2
AGENDAAGENDA
• Purpose
• New TOLD cards
• Example problem
• Part I- Back of TOLD card
• Part II- Front of TOLD card
• Conclusion

3
PURPOSEPURPOSE
The purpose of this presentation is to provide guidance and disseminate the changes to the
TOLD card to ensure safe flight planning.

4
REFERENCESREFERENCES
1. TM 1-1510-225-10
2. TC 1-218, Task # 1022

NEW TOLD CARDNEW TOLD CARD

6
Mission: Transport the following load (personnel, baggage and equipment) from Airport Alpha (AAA) to Airport Bravo (BBB), a distance of 700 NM with a cruising altitude of FL240. Personnel - 6 subtotal: 1060 lbs. Baggage and equipment- 6 bags, 1box subtotal: + 265 lbs.
Total load: 1325 lbs.
EXAMPLE MISSION:EXAMPLE MISSION:

7
CONDITIONS (AAA)CONDITIONS (AAA)
OAT: +30°C(85 °F)FLD ELE: 3800 ftALT SET: 29.72 in. HgPRESSURE ALTITUDE: 4000 ftWIND: 330 ° at 10 ktsRWY 35 : 6000 ftWEATHER: 400 ft OVC VIS: 1 M, RA/HANON-STAN T/O MIN: RWY 35, 500-2
or STAN w/ MIN CLIMB 250/NM to 5000’

PERFORMANCE PLANNING PERFORMANCE PLANNING (Back of TOLD)(Back of TOLD)
Complete the information for the departure airfield as follows:
(1) Field Length Available -
(2) Temperature -
(3) Pressure Altitude -
600030 4000

PERFORMANCE PLANNING PERFORMANCE PLANNING (Back of TOLD)(Back of TOLD)
Determine the maximum weight to achieve single engine climb
use Figure 7-15 for Flaps UPand Figure 7-16 for Flaps
APPROACH
600030 4000

14,000

12,750

PERFORMANCE PLANNING PERFORMANCE PLANNING (Back of TOLD)(Back of TOLD)
Determine the maximum weight to achieve single engine climb
use Figure 7-15 for FLAPS UPand Figure 7-16 for FLAPS
APPROACH
600030 4000
14000 12750

PERFORMANCE PLANNING PERFORMANCE PLANNING (Back of TOLD)(Back of TOLD)
Determine the maximum weight for ACC/STOP -
use Figure 7-22, Accelerate – Stop, Flaps UP
and Figure 7-26, Accelerate – Stop Flaps APPROACH
600030 4000
14000 12750

Baseline
12,800

Baseline
14,000

PERFORMANCE PLANNING PERFORMANCE PLANNING (Back of TOLD)(Back of TOLD)
Determine the maximum weight for ACC/STOP -
use Figure 7-22, Accelerate – Stop, Flaps UP
and Figure 7-26, Accelerate – Stop Flaps APPROACH
600030 4000
14000 12750
12800 14000

PERFORMANCE PLANNING PERFORMANCE PLANNING (Back of TOLD)(Back of TOLD)
Determine the Maximum Weight for Required SE CLB GRAD -
use Figure 7-31, Climb – One Engine Inoperative
Before beginning, determine if standard or non-standard takeoff minimums apply.
600030 4000
14000 12750
12800 14000

18
Max Wt For Required SE Max Wt For Required SE CLB GRADCLB GRAD
• A 3.3% SE climb gradient required for all IFR takeoffs.
• Weather does not meet Non-standard T.O. minimums.• SE Climb Gradient of 250 ft/nm must now be met.• Therefore 250 ft/nm must be converted to a 4.1% climb
gradient using the formula on the bottom of the TOLD card.

PERFORMANCE PLANNING PERFORMANCE PLANNING (Back of TOLD)(Back of TOLD)
Use the formula on the bottom of the TOLD card to compute climb gradient in percent.
(250 ft/nm 6076) 100 = 4.1%
600030 4000
14000 12750
12800 14000
4.1
Insert the 4.1% into Figure 7-31 to determine the Max Wt to achieve a 4.1 SE Grad Climb.

12,600
Baseline

PERFORMANCE PLANNING PERFORMANCE PLANNING (Back of TOLD)(Back of TOLD)
Enter the value derived for the Maximum Weight for Required SE CLB GRAD -
use Figure 7-31, Climb – One Engine Inoperative
600030 4000
14000 12750
12800 14000
4.1
12600

PERFORMANCE PLANNING PERFORMANCE PLANNING (Back of TOLD)(Back of TOLD)
Determine the Maximum Allowable Takeoff Weight based on the most restrictive condition.
In this case, the most restricted aircraft weight condition is based on the value derived from the climb gradient. Enter this value.
600030 4000
14000 12750
12800 14000
4.1
12600
12600

23
CONFIGURATIONCONFIGURATION
• With the backside completed, the crew can decide upon the configuration.
• The decision is based on which configuration has the most restrictive max allowable takeoff weight.
• In this example, the max allowable takeoff weight is 12, 600 lbs.
• This will allow a takeoff with flaps UP, because max weight with flaps up is 12,800 lbs.

24
ZERO FUEL WEIGHTZERO FUEL WEIGHT
• At this point we can determine Zero Fuel Weight.
• In this example the Operating Weight is 9,300 pounds and the Load for the mission is 1,325 pounds.
• Therefore, the the Zero Fuel Weight is 10,625 pounds.
• The takeoff weight of 12,600 minus zero fuel weight of 10,625 allows for 1,975 pounds for fuel.

25
PART II
THE FRONT OF THE TOLD CARD

PERFORMANCE PLANNING PERFORMANCE PLANNING (Front of TOLD)(Front of TOLD)
Complete the information for the departure airfield as follows:
(1) Station
(2) Field Length Available
(3) Temperature
(4) Pressure Altitude
(5) Takeoff Weight (determined from back of card)
AAA 6000+30 4000
12600

PERFORMANCE PLANNING PERFORMANCE PLANNING (Front of TOLD)(Front of TOLD)
Determine the Minimum Takeoff Power
Use Figure 7-17 Minimum Takeoff Power at 2000 RPM with Ice Vanes Retracted (65 knots)
or Figure 7-18 Minimum Takeoff Power with Ice Vanes Extended (65 knots)
AAA 6000+30 4000
12600

90

PERFORMANCE PLANNING PERFORMANCE PLANNING (Front of TOLD)(Front of TOLD)
Determine the Minimum Takeoff Power
Use Figure 7-17 Minimum Takeoff Power at 2000 RPM with Ice Vanes Retracted (65 knots)
or Figure 7-18 Minimum Takeoff Power with Ice Vanes Extended (65 knots)
AAA 6000+30 4000
12600 90%

PERFORMANCE PLANNING PERFORMANCE PLANNING (Front of TOLD)(Front of TOLD)
Determine the Configuration
Based on the back of the TOLD card, the maximum takeoff weight of 12600 lbs. allows for a flaps up takeoff.
Place an X in the Flaps 0% block.
AAA 6000+30 4000
12600 90%X

PERFORMANCE PLANNING PERFORMANCE PLANNING (Front of TOLD)(Front of TOLD)
Determine the T.O. FLD. Length Required -
the actual ACC/STOP distance for a 12,600 pound aircraft.
Use fig. 7-22, Accelerate – Stop, Flaps UP
AAA 6000+30 4000
12600 90%X

12,600
5900

PERFORMANCE PLANNING PERFORMANCE PLANNING (Front of TOLD)(Front of TOLD)
Determine the T.O. FLD. Length Required -
The actual ACC/STOP distance for a 12,600 pound aircraft.
Use fig. 7-22, Accelerate – Stop, Flaps UP
AAA 6000+30 4000
12600 90%X
5900

PERFORMANCE PLANNING PERFORMANCE PLANNING (Front of TOLD)(Front of TOLD)
Determine the Accelerate / Go Distance
Use Figure 7-23 Accelerate – Go, Flaps Up
or Figure 7-27 Accelerate – Go,
Flaps Approach
AAA 6000+30 4000
12600 90%X
5900

8,800

PERFORMANCE PLANNING PERFORMANCE PLANNING (Front of TOLD)(Front of TOLD)
Determine the Accelerate / Go Distance
Use Figure 7-23 Accelerate – Go, Flaps Up
or Figure 7-27 Accelerate – Go,
Flaps Approach
The Accelerate-Go Distance is advisory only in nature.
AAA 6000+30 4000
12600 90%X
5900 8800

PERFORMANCE PLANNING PERFORMANCE PLANNING (Front of TOLD)(Front of TOLD)
Determine the V1 / VR Speed -
use Figure 7-21 Takeoff Distance, Flaps UP or Figure 7-25 Takeoff Distance, Flaps APPROACH
AAA 6000+30 4000
12600 90%X
5900 8800

112 knots

PERFORMANCE PLANNING PERFORMANCE PLANNING (Front of TOLD)(Front of TOLD)
Determine the V1 / VR Speed -
use Figure 7-21 Takeoff Distance, Flaps UP or Figure 7-25 Takeoff Distance, Flaps APPROACH
AAA 6000+30 4000
12600 90%X
5900 8800112

PERFORMANCE PLANNING PERFORMANCE PLANNING (Front of TOLD)(Front of TOLD)
Determine the V2 / Vyse Speed
use Figure 7-31 Climb - One Engine Inoperative
AAA 6000+30 4000
12600 90%X
5900 8800112

122 knots

PERFORMANCE PLANNING PERFORMANCE PLANNING (Front of TOLD)(Front of TOLD)
Determine the V2 / Vyse Speed
use Figure 7-31 Climb - One Engine Inoperative
AAA 6000+30 4000
12600 90%X
5900 8800112 122

PERFORMANCE PLANNING PERFORMANCE PLANNING (Front of TOLD)(Front of TOLD)
Determine the Vx Speed
Obtain the Vx speed from the Takeoff Distance, Flaps APPROACH chart, FIG 7-25, Tabular Data at the top of the page, column labeled Vx.
AAA 6000+30 4000
12600 90%X
5900 8800112 122 106

PERFORMANCE PLANNING PERFORMANCE PLANNING (Front of TOLD)(Front of TOLD)
Climb Gradient Alt -
the altitude as specified for SE Climb Grad in the Departure Procedure.
AAA 6000+30 4000
12600 90%X
5900 8800112 122 106
5000
PERFORMANCE PLANNING PERFORMANCE PLANNING (Front of TOLD)(Front of TOLD)
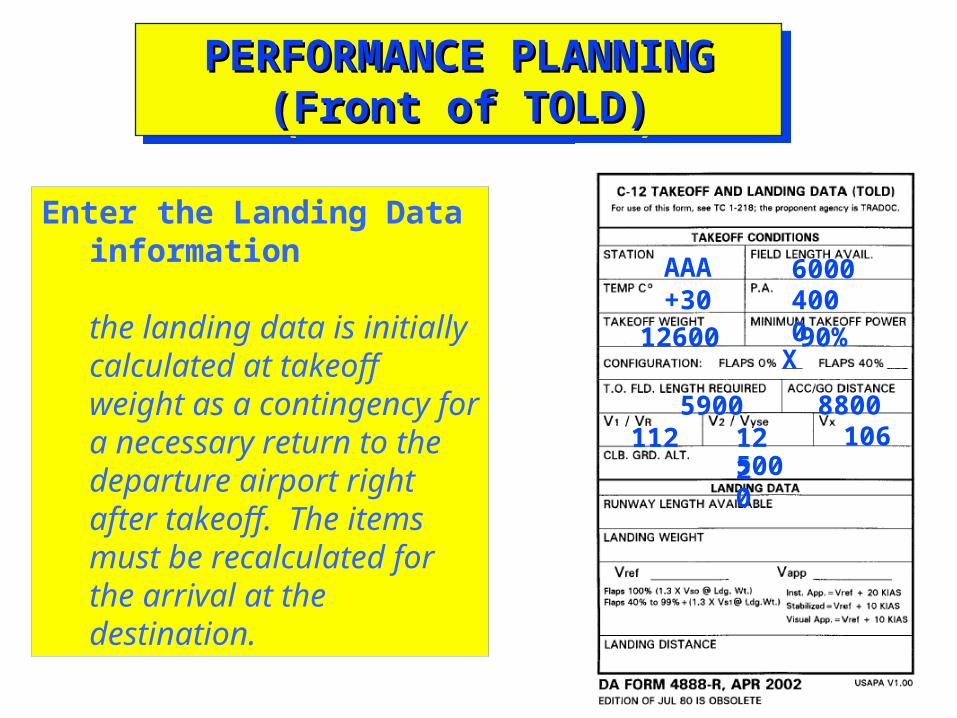
Enter the Landing Data information
the landing data is initially calculated at takeoff weight as a contingency for a necessary return to the departure airport right after takeoff. The items must be recalculated for the arrival at the destination.
AAA 6000+30 4000
12600 90%X
5900 8800112 122 106
5000

PERFORMANCE PLANNING PERFORMANCE PLANNING (Front of TOLD)(Front of TOLD)
Enter the Landing Data information
Enter the runway length available and the landing weight based on takeoff conditions.
AAA 6000+30 4000
12600 90%X
5900 8800112 122 106
5000
600012600

PERFORMANCE PLANNING PERFORMANCE PLANNING (Front of TOLD)(Front of TOLD)
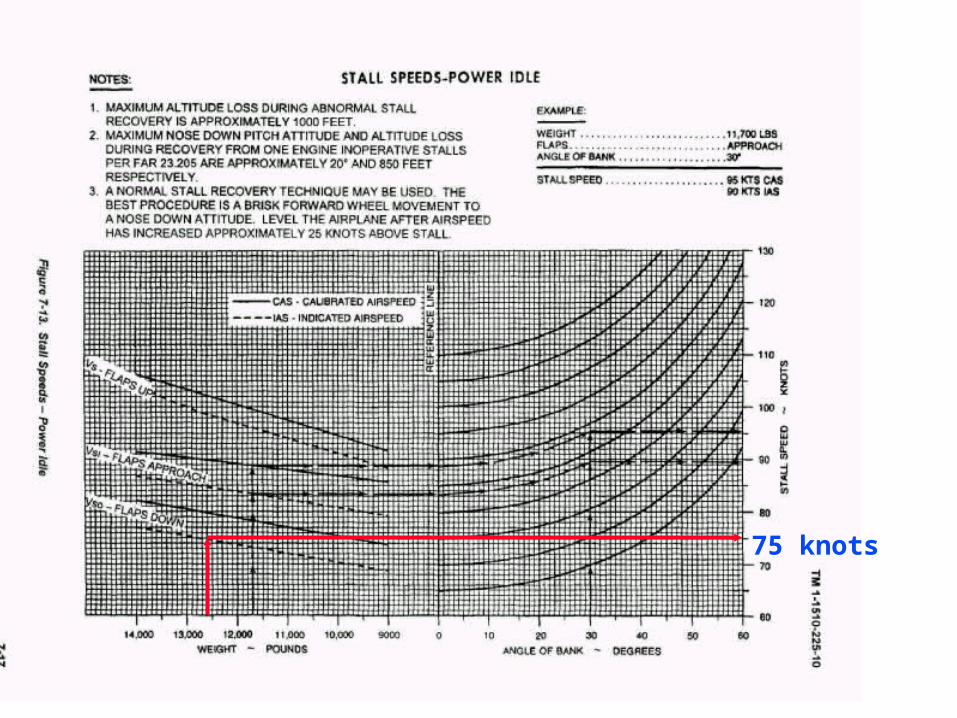
Compute the Vref speed
Vref = 1.3 times Vso @ landing weight
use Figure 7-13, Stall Speeds - Power Idle to determine Vso.
AAA 6000+30 4000
12600 90%X
5900 8800112 122 106
5000
600012600
75 knots

PERFORMANCE PLANNING PERFORMANCE PLANNING (Front of TOLD)(Front of TOLD)
Complete as follows:
Vso is 75 knots
Vref = 75 x 1.3
Vref = 98 knots (97.5 rounded up to 98)
AAA 6000+30 4000
12600 90%X
5900 8800112 122 106
5000
600012600
98

PERFORMANCE PLANNING PERFORMANCE PLANNING (Front of TOLD)(Front of TOLD)
There is another method to determine Vref. Subtract 5 knots from the value obtained from the APPROACH SPEED – KNOTS data table at the top of Fig. 107, Landing Distance Without Propeller Reversing, Flaps Down. For a 12,600 pound aircraft the given APPROACH SPEED is 103 KIAS – 5 KIAS = 98 KIAS.
AAA 6000+30 4000
12600 90%X
5900 8800112 122 106
5000
600012600
98

PERFORMANCE PLANNING PERFORMANCE PLANNING (Front of TOLD)(Front of TOLD)
Compute the Vapp Speed:
For a normal instrument approach, Vapp is Vref plus 20 For a stabilized approach, Vapp is Vref plus 10For a visual approach, Vapp is between Vref and Vref plus 10 as determined by the PC
In this case a normal instrument approach is planned.
AAA 6000+30 4000
12600 90%X
5900 8800112 122 106
5000
600012600
98 118

PERFORMANCE PLANNING PERFORMANCE PLANNING (Front of TOLD)(Front of TOLD)
Determine the Landing Distance
use Figure 7-107, Normal Landing Distance Without Propeller Reversing, Flaps DOWN
AAA 6000+30 4000
12600 90%X
5900 8800112 122 106
5000
600012600
98 118

2000 ft

PERFORMANCE PLANNING PERFORMANCE PLANNING (Front of TOLD)(Front of TOLD)
Determine the Landing Distance
use Figure 7-107, Normal Landing Distance Without Propeller Reversing, Flaps DOWN
AAA 6000+30 4000
12600 90%X
5900 8800112 122 106
5000
600012600
98 118
2000

CONCLUSIONCONCLUSION


![Takeoff Rotation[1]](https://static.fdocuments.in/doc/165x107/545ef10eaf795949708b4a7b/takeoff-rotation1.jpg)