
Taiwan’s Capital Market --Features and Transformations · 2013-02-02 · Taiwan’s Capital...
35
Chairman Sush-Der Lee Taiwan Stock Exchange Oct. 24, 2013 Taiwan’s Capital Market --Features and Transformations
Transcript of Taiwan’s Capital Market --Features and Transformations · 2013-02-02 · Taiwan’s Capital...

Chairman Sush-Der LeeTaiwan Stock Exchange
Oct. 24, 2013
Taiwan’s Capital Market
--Features and Transformations

Outline
1. Market Profile
2. Features
3. Transformations
4. Conclusion
1
1. Market Profile
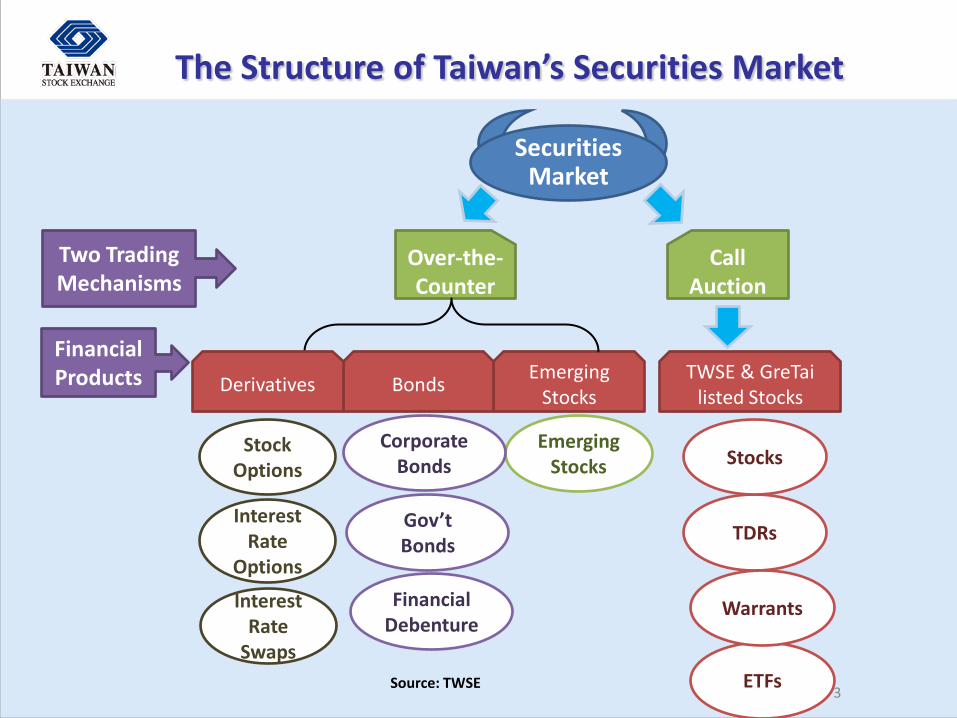
The Structure of Taiwan’s Securities Market
3ETFs
Securities Market
TDRs
Over-the-Counter
Stock Options
Emerging Stocks
Call Auction
TWSE & GreTailisted Stocks
Emerging Stocks
BondsDerivatives
Warrants
Stocks
Gov’tBonds
Corporate Bonds
Financial Debenture
Interest Rate
Options
Interest Rate
Swaps
Financial Products
Two Trading Mechanisms
Source: TWSE

Capital Demander
Capital Supplier
Investors Companies
Investors Companies
Liquidity
Market Size
Taiwan Securities Market Overview

Taiwan Stock ExchangeTaiwan Blue-Chips
GreTai Securities MarketPotential Growth Stocks
Emerging MarketStartups
813 companies, with a market cap of 23 trillion NTD− Domestic 785− Foreign 28
30 TDRs, 21 ETFs, over 8,000 warrants…
279 companies
Multi-level Equity Markets in Taiwan
5
645 companies, with a market cap of 2 trillion NTD − Domestic 626− Foreign 19
1 TDR, 1 ETF, over 2,000 warrants…
Source:TWSE, GreTai, as of August 2013
Go Incubation Board small-sized innovative companies
Expected to operate in late 2013

49%
14% 14%
23%TechnologySemiconductorOptoelectronicInformation ServiceComputer and Peripheral Equip.
Industry sectors by market cap
Others
Basic IndustryPlastic, Oil, Elec., Steel, Chemical
Finance and Insurance
• Nearly half consists of high-tech, others remain relatively dispersed
Industry Sectors on TWSE
Source: TWSE, as of August 2013Note: Calculated by market cap.
Communications and InternetElectronic Parts/ComponentsElectronic Products DistributionOther Electronic

Investor Structure by Trading Value
• High proportion of retail investing, but yearly increase of foreign participation.
Retail Investors
86%
Domestic Institutions
10%
Foreign Institutions
4%
Year 2000
7
Retail Investors
62%
Domestic Insitutions
15%
Foreign Institution
23%
Year 2012

TWSE: 50 Years in Review
0
5
10
15
20
25
30
0 100 200 300 400 500 600 700 800 900
Listings Market Value
NT$ million
8
1960Start
• Securities traded on the OTC
•Need to manage dispersed securities leads to formation of TWSE
1970Expansion
•Rise of capital markets industrial development creation of high-tech industry
1980Change
•Adoption of computerized trading, in tandem with global trends
•Central depository and clearing systems
•Allow for establishment of brokerages
1990Liberalization
•Brokerages permitted to engage in margin trading
•Eligible foreign institutional investors may invest directly in Taiwan securities
2000Outlook
•Advancement of international investment
•Active endorsement of both domestic and foreign listings
• At each critical turning point, TWSE leadership rose to the challenge of the present with a view to the future

Contributions of the Capital Market to Economic Growth
9
Generating Revenue
Increasing Employment
Building Brands
Raising Funds

Contributions of the Capital Market to Enterprises
Number of listed companies917 in 2001
1,447 in 2012
Growth 57.8%
Capital issued by listed
companies4.78tn in 20017.07tn in 2012
Growth 47.6%
Market cap of listed
companies11tn in 200123tn in 2012
Growth 109%
Fundraising by TWSE-listed companies
53.12bn in 200177.69bn in 2012
Growth 46.2%
10
MaximizingCompetitiveness
BuildingGoodwill Increasing
Employment
BoostingRevenue
Note: 1. NTD-denominated2.Fundraising through GDR not included

2. Features

IT Concentration
1990 1995 1999 2012/8
US 18.3 21.8 33.3 20.6
Canada 18.3 17.9 27.9 6.8
France 10.7 8.8 19.8 9.1
Germany 3.5 6.2 22.9 12.3
UK 12.0 12.9 18.8 7.9
Finland 8.7 40.2 71.3 12.7
Japan 11.1 12.4 23.9 16.9
Korea 0.4 5.1 18.2 28.1
Hong Kong 16.0 10.9 18.0 14.8
Singapore 3.9 28.9 27.0 10.2
Taiwan 2.7 13.4 54.2 47.9
12
Unit :%
Source: 1. 1990-1999 data from World Economic Outlook, IMF, Sept. 20002. 2012 data from All Exchanges and Bloomberg
• Share of IT Sector in Market Value

Superior Dividend Yield
Cash Dividends
Stock Dividends
Total Dividends
Dividend Yield
Deposit Rate
2009 464 91 555 2.38% 0.90%
2010 718 116 834 3.14% 1.13%
2011 892 163 1,055 4.85% 1.35%
2012 715 173 888 3.48% 1.35%
• Dividend payment by domestic TWSE listed companies (in billion NTD)
Note: The deposit rate is the average of the 1-year fixed deposit rates of Bank of Taiwan, Land Bank of Taiwan,Taiwan Cooperative Bank, First Commercial Bank, and Hua Nan Commercial BankSource: Bloomberg, CBC 13
TW JP HK KR SG SH SZ NY LN BZ
2009 2.38 1.79 2.46 1.37 2.85 1.22 0.54 2.64 3.47 2.632010 3.14 1.96 2.72 1.43 2.59 1.49 0.57 2.48 3.17 3.452011 4.85 2.55 3.71 1.49 4.12 2.21 1.02 2.60 3.92 4.242012 3.48 1.96 3.12 1.29 2.93 2.51 1.14 2.65 3.95 4.23
• Dividend Yield Rate (%)

Taiwan: Good Fundamentals
14
Taiwan has highest cash dividend yield in Asia, on par with developed markets of U.S. and Europe
Reasonable P/B Ratio
Taiwan
Japan
Hong Kong
Korea
Singapore
Shanghai
Shenzhen
US
UKBrazil
0.0 0.5 1.0 1.5 2.0 2.5 3.0 3.5 4.0 4.5 5.0
0.0 0.5 1.0 1.5 2.0 2.5 3.0
Dividend Yield
PB RatioSource: Bloomberg, updated Feb 2, 2013

15
High Liquidity, Reasonable P/E
source: Major Indicators of Securities & Futures Market, SFB, FSC, Taiwan
TW JP HK KR SG NY LN SH
2010 136.74 109.64 62.17 176.31 53.30 130.19 76.13 178.47
2011 119.87 123.74 69.22 194.19 45.91 138.46 69.22 159.51
2012 97.33 101.48 42.33 138.08 48.69 93.43 55.74 106.56
• Turnover Rate among Main Markets Unit:%
TW JP HK KR SG NY LN SH
2010 16.04 45.00 16.67 18.96 12.70 17.50 12.14 21.62
2011 15.76 21.00 9.68 10.90 7.67 14.55 10.06 13.40
2012 23.62 24.90 10.50 12.92 10.78 15.10 11.52 12.30
• P/E Ratio among Main Markets
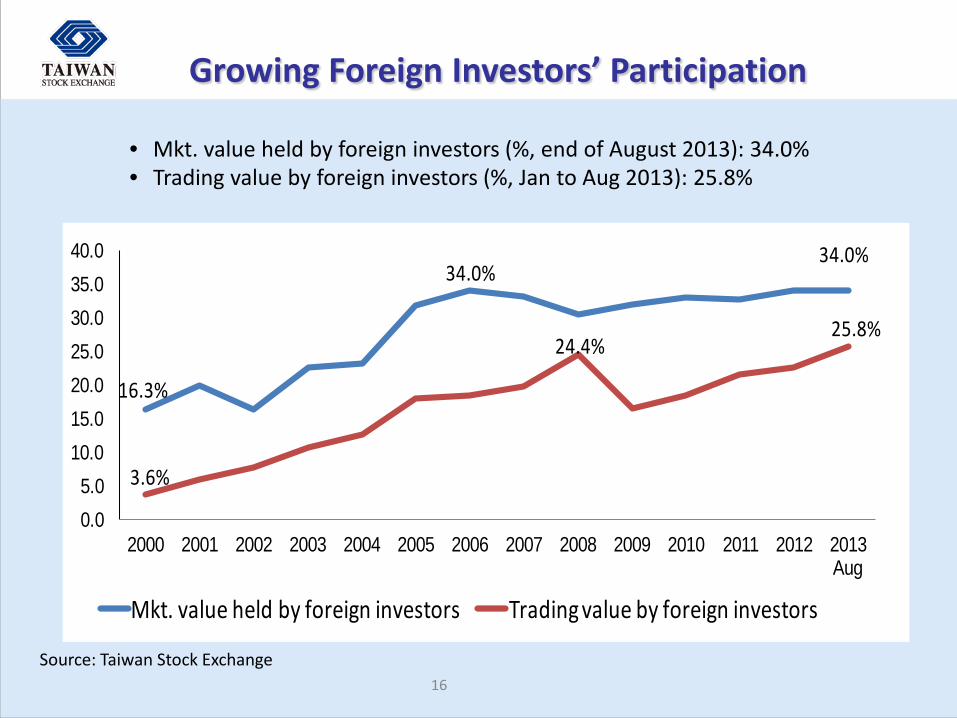
Growing Foreign Investors’ Participation
Source: Taiwan Stock Exchange
16.3%
34.0%34.0%
3.6%
24.4%25.8%
0.05.0
10.015.020.025.030.035.040.0
2000 2001 2002 2003 2004 2005 2006 2007 2008 2009 2010 2011 2012 2013 Aug
Mkt. value held by foreign investors Trading value by foreign investors
• Mkt. value held by foreign investors (%, end of August 2013): 34.0%• Trading value by foreign investors (%, Jan to Aug 2013): 25.8%
16

Application Process
Easy and cost effective
TWSE Listing
SFBRegistration
TWSE & CBCReview
•Review Time: 2.5~3 months
•Initial Listing Review Fee: NT$500,000
•Annual Listing Fee: NT$450,000
︴NT$100,000
Friendly Listing Process
• Fast and transparent review process, effective supervision

Resources for Retail Investors
Investor Protection Mechanisms
Corporate Governance Center
Securities and Futures Investors Protection Center
Market Observation Post System (MOPS)
Investor Education Campaign
Campus Investment Simulation Contests
Investment Training Seminars
In-house and on-line “Investor Library”

3. Transformations

Global Market
Domestic Market
Transformation: via 4 Action Plans
internationalization, liberalization, market expansion
Past Future
Innovating New Products
Servicing the Market
Forging International Alliances
Expanding Market Scale

Transparent
Orderly
Fair
Cost-saving
Responsive
Efficient
MarketSurveillance Trading
Environment
Trading System
Servicing the Market

Innovative products
Cross-border
products
Innovating New Products
New Products
Warrants
T-sharesETFs

Reduce market operating costs
boost appeal of local investor
engage large scale
enterprises
High-quality Financing
Environment
Expanding Market Scale
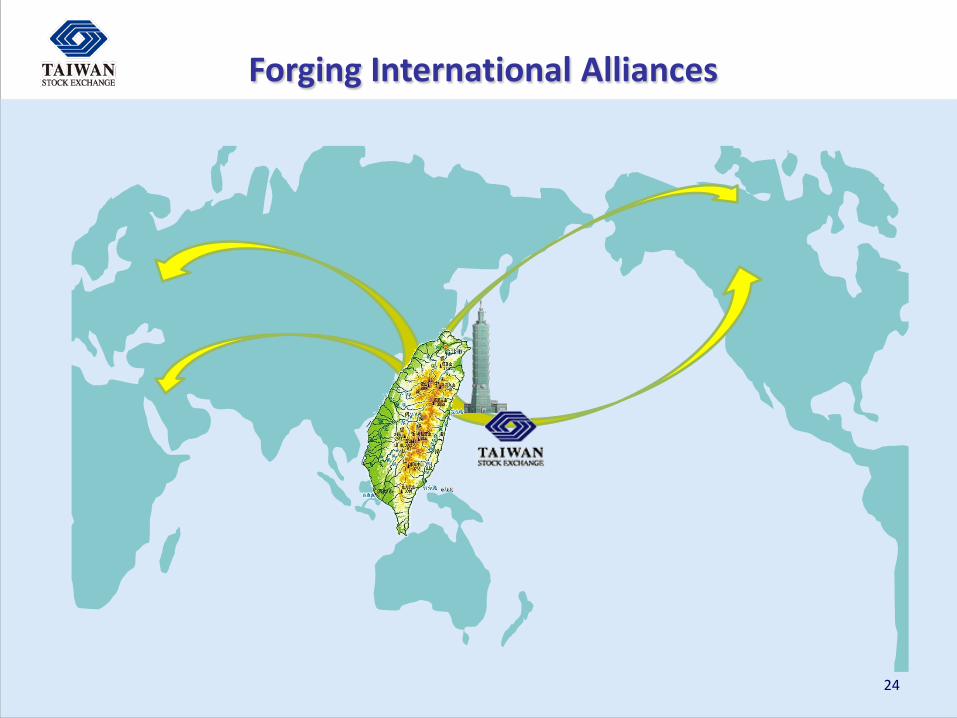
Forging International Alliances
24

New Products
New Markets
New Mechanisms
New IT
New Competition
Innovating New Products
Servicing the Market
Forging International Alliances
Expanding Market Scale
Looking Ahead: 5 Opportunities

New Products
1. Innovative products (ETFs, warrants)
• Provide investors more channels for financial instruction, varying levels of service
• Future-based ETFs, synthetic ETFs, and new type warrants
2. T-shares• Allow companies with 30%+ of Chinese ownership file IPOs• Allow China-registered companies file IPOs and issue TDRs
3. RMB products• Build a trading platform for foreign currency-denominated
products• R-QFII ETFs probably will be the first listed RMB product
26

New Mechanisms
1.Matching Interval Decrease•Matching Interval 20 sec 15 sec in July 1, 2013•10 sec in Feb 2014•5 sec in late 2014
2.Information Disclosure• Implementation slated for late
2014• More information disclosure
during opening and closing sessions
Other Ongoing Reforms •Relax SBL restrictions•Prepare day trading•Introduce continuous trading
27
::

New Markets
28
• Mainland China
• Europe/North America
• ASEAN
• Other emerging marketsSource: Google map
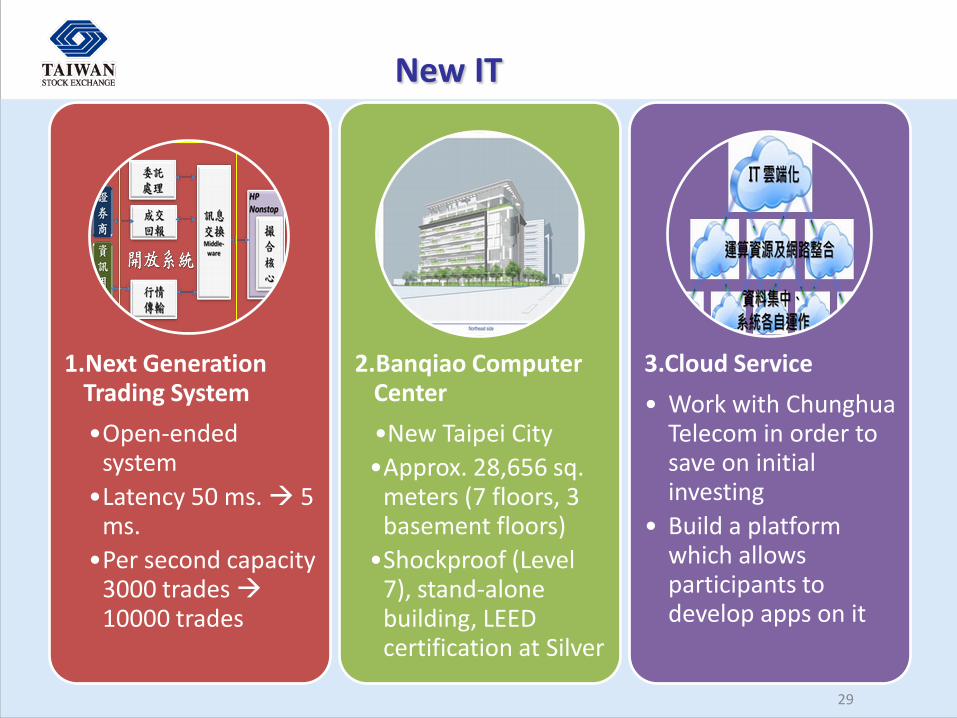
New IT
1.Next Generation Trading System
•Open-ended system
•Latency 50 ms. 5 ms.
•Per second capacity 3000 trades 10000 trades
2.Banqiao Computer Center
•New Taipei City•Approx. 28,656 sq.
meters (7 floors, 3 basement floors)
•Shockproof (Level 7), stand-alone building, LEED certification at Silver
3.Cloud Service
• Work with ChunghuaTelecom in order to save on initial investing
• Build a platform which allows participants to develop apps on it
29

New Competition
30
• Further deregulation for more globally mobile funds

4. Conclusion

Dynamic Economic Growth – Capital Flows
32
TWSE market cap: NT$23 trillGTSM market cap: NT$2 trill
TWSE proceeds: NT$9.6 billGTSM proceeds: NT$ 22.8 bill
TWSE listings: 813GTSM listings: 645
TWSE op income: NT$19.65 trillGTSM op income: NT$1.40 trill
TWSE turnover: NT$20.24 trillGTSM turnover: NT$2.95 trill
People flow
Logistics & Transportation
Information flow
$
Note: Listings, market cap values as of Aug 2013, proceeds raised (incl. GDR), operational income, turnover, as of year-end 2012Source: Financial Supervisory Commision,TWSE, GreTai Securities

Securities firms
Investors
Lawyers/ Accountants
Securities related
industries
Listed companies
Liquid securities, vibrant economy
Revenue increases
New opening of channels
Employment rises
Economy prospers
Individual investor
Securities Market
Regulators
Thank You!


