Taiwan Entertainment & Media Outlook 2019-2023 · made up of OTT video services. Global OTT video...
20
Taiwan Entertainment & Media Outlook 2019-2023 www.pwc.tw
Transcript of Taiwan Entertainment & Media Outlook 2019-2023 · made up of OTT video services. Global OTT video...

TaiwanEntertainment & MediaOutlook 2019-2023
www.pwc.tw

PwC | Taiwan Entertainment & Media Outlook 2019-2023 1
About PwC’s OutlookPwC released its Global Entertainment and Media Outlook for 2019-2023 on 5 June 2019.
The Outlook is a comprehensive online source of analyses with five-year historical and five-year forecasts of consumer and advertiser spending data for 14 entertainment and media (E&M) segments and across 53 territories, including Taiwan.
The numerical data presented in the Outlook was supplied by Ovum, a UK-based provider of business intelligence and strategic services to the global telecoms and media markets.
The E&M segments covered this year include: books; business-to-business; cinema; data consumption (across the internet, by devices and content categories) ; internet access; internet advertising; music, radio and podcasts; newspaper and consumer magazines; OTT video; out-of-home advertising; traditional TV and home video; TV advertising; video games and e-sports; and virtual reality.
Please note that the datasets for the data consumption (non-revenue), e-sports and virtual reality segments are not available for the Taiwan market due to the scope restrictions of the data provider Ovum; only the top twenty largest territory markets are covered for e-sports and ten for virtual reality.
The Outlook comes in two formats:
• An interactive online tool at www.pwc.com/outlook allows paying subscribers to dig deeper into the latest report’s data at a segment and territory level, as well as to compare and contrast consumer and advertising spend.
• A special report, Perspectives from the Global Entertainment & Media Outlook 2019–2023, is available free to non-subscribers and provides insights into the key trends shaping the E&M industry and how companies can respond.

PwC | Taiwan Entertainment & Media Outlook 2019-2023 2
IntroductionWhile the entertainment and media (E&M) industry was one of the first sectors to navigate digital disruption, its transformation is far from over.
The 2019 edition of PwC’s Global Entertainment and Media Outlook – “Getting Personal: Putting the Me in Entertainment and Media” -- shows that the rise of increasingly personal — and personalised — media interactions, fuelled by technology and evolving customer behaviour, shows no signs of abating.
The Outlook provides informed perspective and five-year (2019-2023) forecasts on the E&M industry worldwide. For the convenience of interested parties locally, PwC Taiwan has produced this PDF booklet to provide a concise summary, in English and Chinese, of the key messages from the global and Taiwan markets, which are drawn from the online resources at www.pwc.com/outlook.
The overall recommendation from this year’s Outlook is that E&M companies must reconsider their business and revenue models, anticipate emerging technologies, respond to regulation and build trust.
Only by embracing the personalisation wave as today’s consumers seize the opportunity to enjoy media experiences uniquely tailored to their own preferences can businesses stay ahead of current trends and plan for future ones.
Gary ChihEntertainment and Media Leader, PwC Taiwan
PwC | Taiwan Entertainment & Media Outlook 2019-2023 3
Contents
About PwC’s Outlook 1
Introduction 2
Key Outlook messages - Global 4
Key Outlook messages - Taiwan 6
Taiwan segment analysis:
• Books 7
• Business-to-business 8
• Cinema 9
• Internet access 10
• Internet advertising 11
• Music, radio and podcasts 12
• Newspaper and consumer magazines 13
• OTT video 14
• Out-of-home advertising 15
• Traditional TV and home video 16
• TV advertising 17
• Video games and e-sports 18

-5 5 200 1510 25
2018-2023 CAGR%
PwC | Taiwan Entertainment & Media Outlook 2019-2023 4
Key Outlook messages - GlobalConsumer demand for personalisation and technological advances are driving innovation in the global entertainment and media (E&M) industry. These trends are taking place against a background of ongoing global growth in E&M revenues.
Global industry growth continues to outpace GDP…
The Outlook projects that total global E&M revenue will rise at a compound annual growth rate (CAGR) of 4.3% over the next five years to reach US$2.6tn in 2023, up from US$2.1tn in 2018. Over the forecast period, six segments will exhibit growth above the average, and seven below it. (The 14th segment, data consumption, which refers to the flow of data across the internet, does not generate revenue.)
Global E&M revenue and growth forecast for next five years
…but with sharp differences in growth rates at the segment level
Looking at specific E&M segments, virtual reality (22.2% CAGR) maintains its position as the highest-growth segment, but its lead over the OTT video (13.8% CAGR) segment is greatly diminished. Podcasts and e-sports, which sit within larger segments, have extremely strong growth revenue forecasts at CAGRs of 28.5% and 18.3%, respectively.
At the lower end of the growth spectrum, the traditional TV and home video (-0.7% CAGR) segment now has negative growth expectations for the first time, as cord-cutting by consumers continues to rise and sales of DVDs keep falling. The print-exposed newspapers and consumer magazines (-2.3% CAGR) segment has the worst forecast through to 2023.
E&M segment compound annual growth for next five years
VR
OTT
Internet advertising
Video games and e-sports
Internet access
Cinema
Out-of-home
Music, radio and podcasts
Business-to-business
TV advertising
Books
Traditional TV and home video
Newspaper and consumer magazines
Source: PwC Global Entertainment & Media Outlook 2019-2023.
2014 20192015 20202016 20212017 20222018 2023
Source: PwC Global Entertainment & Media Outlook 2019-2023.
Global E&M revenues Global E&M revenues (projected data)
$1.7tn$2.2tn
$1.8tn$2.3tn
$1.9tn$2.4tn
$2.0tn$2.5tn
$2.1tn$2.6tn
2018-2023CAGR 4.3%

PwC | Taiwan Entertainment & Media Outlook 2019-2023 5
Innovating for growth in a world of media personalisation
The underlying shift that is currently reshaping and reorienting the entire E&M industry is changing human behaviour, with a decisive turn towards personalisation. Advances in new technologies and service offerings are finally enabling people to move from passive to active consumption — not just of individual pieces of media, but of media as a whole.
Many signs of this change are highlighted in the Outlook. One is the growing trend for consumers to reject the bundles of TV channels offered by cable or satellite providers, and instead construct their own ad hoc bundles made up of OTT video services. Global OTT video revenue reached US$38.2bn in 2018, and is forecast to almost double by 2023.
It is also an increasingly mobile world, soon to be augmented by new 5G networks. The key impacts of 5G for E&M will include enabling more streaming of high-quality video and better use of AI, together with considerable opportunities for video games and VR in terms of speed and quality of images. It will also hasten existing trends towards personalisation.
Four priorities shaping companies’ strategies
As consumers embrace the expanding opportunities to enjoy media experiences tailored to their needs, companies are designing business models and offerings for an increasingly personalised world. Four priorities are coming to the fore:
1. One size does not fit all: Companies are finding that it makes sense to present different options: all-you-can-eat offerings with unlimited usage in some areas, tiers of payments for different services in less developed markets, and competing on affordability. PwC’s research finds stark differences in terms of segment growth across all markets.
2. The number of consumer touch points is expanding: Content creators and distributors are devising new ways to appeal to consumers and marketers are figuring out how to meet consumers at the point of consumption and point them directly towards purchase. Witness the rise of shoppable online advertising, often promoted by ‘influencers.’
3. Technological innovation introduces a new era of personalised computing: Companies are leveraging AI to understand individuals’ tastes and consumption habits to offer up compelling content. The combination of AI with 5G will be especially powerful, as it will fuel the rapid growth of segments such as video games and virtual reality.
4. Trust and regulation remain pivotal, as personal data hygiene becomes key: For companies, this goes beyond regulatory compliance, and extends to building trust by behaving transparently and responsibly with customers’ data, ensuring the accuracy of news, and being sensitive to concerns around issues such as digital addiction.
The current personalisation wave in the global E&M industry — fuelled by evolving customer behaviour — is set to be amplified by the forces of technology, scale and aggressive investing and competition. The implications for E&M organisations are profound. Put simply: it is time to get personal with consumers — or be left out of the conversation.
PwC | Taiwan Entertainment & Media Outlook 2019-2023 6
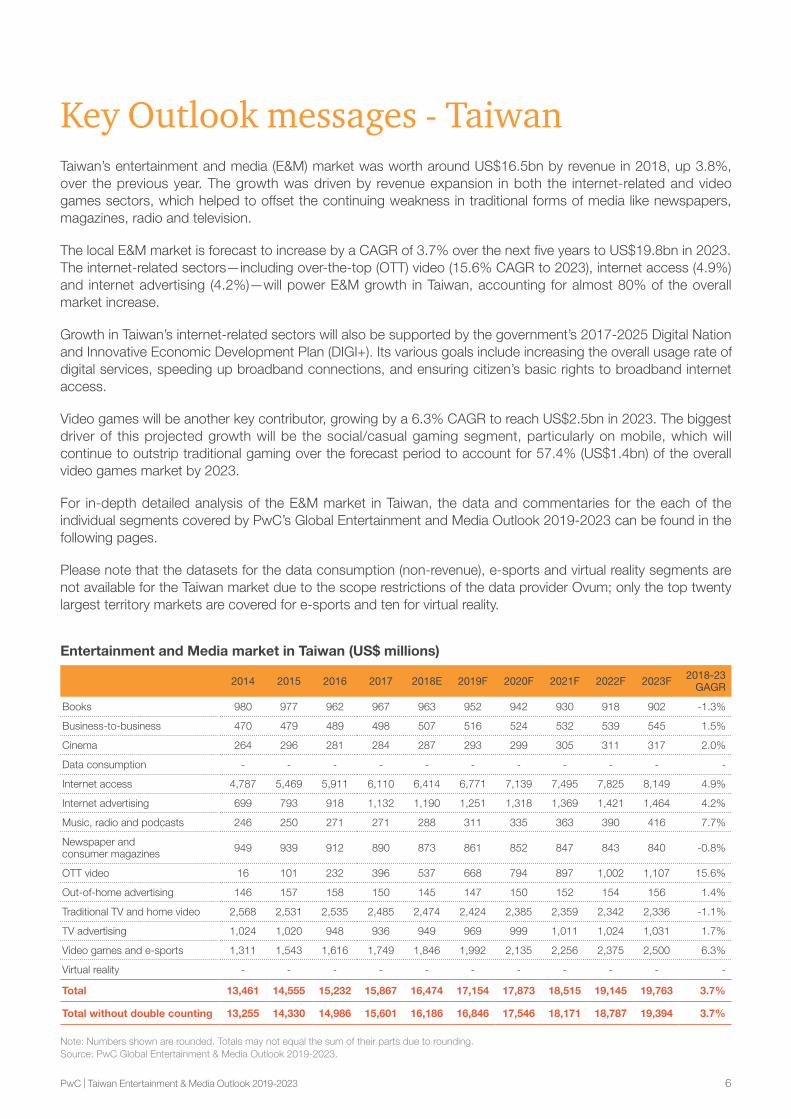
Key Outlook messages - TaiwanTaiwan’s entertainment and media (E&M) market was worth around US$16.5bn by revenue in 2018, up 3.8%, over the previous year. The growth was driven by revenue expansion in both the internet-related and video games sectors, which helped to offset the continuing weakness in traditional forms of media like newspapers, magazines, radio and television.
The local E&M market is forecast to increase by a CAGR of 3.7% over the next five years to US$19.8bn in 2023. The internet-related sectors—including over-the-top (OTT) video (15.6% CAGR to 2023), internet access (4.9%) and internet advertising (4.2%)—will power E&M growth in Taiwan, accounting for almost 80% of the overall market increase.
Growth in Taiwan’s internet-related sectors will also be supported by the government’s 2017-2025 Digital Nation and Innovative Economic Development Plan (DIGI+). Its various goals include increasing the overall usage rate of digital services, speeding up broadband connections, and ensuring citizen’s basic rights to broadband internet access.
Video games will be another key contributor, growing by a 6.3% CAGR to reach US$2.5bn in 2023. The biggest driver of this projected growth will be the social/casual gaming segment, particularly on mobile, which will continue to outstrip traditional gaming over the forecast period to account for 57.4% (US$1.4bn) of the overall video games market by 2023.
For in-depth detailed analysis of the E&M market in Taiwan, the data and commentaries for the each of the individual segments covered by PwC’s Global Entertainment and Media Outlook 2019-2023 can be found in the following pages.
Please note that the datasets for the data consumption (non-revenue), e-sports and virtual reality segments are not available for the Taiwan market due to the scope restrictions of the data provider Ovum; only the top twenty largest territory markets are covered for e-sports and ten for virtual reality.
Entertainment and Media market in Taiwan (US$ millions)
2014 2015 2016 2017 2018E 2019F 2020F 2021F 2022F 2023F 2018-23GAGR
Books 980 977 962 967 963 952 942 930 918 902 -1.3%
Business-to-business 470 479 489 498 507 516 524 532 539 545 1.5%
Cinema 264 296 281 284 287 293 299 305 311 317 2.0%
Data consumption - - - - - - - - - - -
Internet access 4,787 5,469 5,911 6,110 6,414 6,771 7,139 7,495 7,825 8,149 4.9%
Internet advertising 699 793 918 1,132 1,190 1,251 1,318 1,369 1,421 1,464 4.2%
Music, radio and podcasts 246 250 271 271 288 311 335 363 390 416 7.7%
Newspaper and consumer magazines 949 939 912 890 873 861 852 847 843 840 -0.8%
OTT video 16 101 232 396 537 668 794 897 1,002 1,107 15.6%
Out-of-home advertising 146 157 158 150 145 147 150 152 154 156 1.4%
Traditional TV and home video 2,568 2,531 2,535 2,485 2,474 2,424 2,385 2,359 2,342 2,336 -1.1%
TV advertising 1,024 1,020 948 936 949 969 999 1,011 1,024 1,031 1.7%
Video games and e-sports 1,311 1,543 1,616 1,749 1,846 1,992 2,135 2,256 2,375 2,500 6.3%
Virtual reality - - - - - - - - - - -
Total 13,461 14,555 15,232 15,867 16,474 17,154 17,873 18,515 19,145 19,763 3.7%
Total without double counting 13,255 14,330 14,986 15,601 16,186 16,846 17,546 18,171 18,787 19,394 3.7%
Note: Numbers shown are rounded. Totals may not equal the sum of their parts due to rounding.Source: PwC Global Entertainment & Media Outlook 2019-2023.

PwC | Taiwan Entertainment & Media Outlook 2019-2023 7
BooksTotal publishing revenue from book sales in Taiwan – comprising consumer (53.5% of the overall market in 2018), educational (32.5%) and professional (14%) titles – fell 0.4% yoy to US$963mn in 2018. With many Taiwanese spending increasingly more time on social media platforms, the declining trend in book publishing is set to continue, with market revenue seen decreasing by a -1.3% CAGR over the next five years to US$902m in 2023.
Taiwan’s publishing market supports around 5,000 publishing houses, which produced 39,114 new books in 2018, down 3.2% on the year. Taiwan is also one of the major buyers of overseas rights in the region, with translated books, mainly sourced from Japan and the US, representing 24.3% of new titles produced in 2018. Martial arts and fantasy fiction are particularly popular in the consumer category.
E-publishing has been slow to take off in Taiwan, but is now picking up pace. The number of e-books grew 4.9% yoy in 2018, representing 11.1% of all books published locally that year, more than double the 5.2% figure for 2016. Taiwanese publishers have been quick to adapt their business models, buying e-book rights from other countries and digitalising locally produced content. By revenue, the market share of e-books is forecast to rise to 27.1% by 2023, up from 15.9% in 2018.
Books in Taiwan
Unit: US$ millions 2014 2015 2016 2017 2018E 2019F 2020F 2021F 2022F 2023F 2018-23GAGR
Consumer books 533 530 514 519 515 505 494 483 471 457 -2.4%
Electronic 21 29 41 55 69 82 95 106 115 123 12.2%
Print/audio 513 501 473 464 446 423 399 377 355 334 -5.6%
Educational books 318 315 315 314 313 313 313 313 313 313 0.0%
Electronic 11 16 22 27 33 38 43 48 52 56 11.4%
Print/audio 307 299 293 287 280 275 270 266 261 257 -1.8%
Professional books 129 131 133 134 135 135 135 134 134 133 -0.3%
Electronic 30 36 41 46 51 55 58 61 64 66 5.6%
Print/audio 99 96 92 88 84 80 76 73 70 66 -4.6%
Total 980 977 962 967 963 952 942 930 918 902 -1.3%
Source: PwC Global Entertainment & Media Outlook 2019-2023.
PwC | Taiwan Entertainment & Media Outlook 2019-2023 8
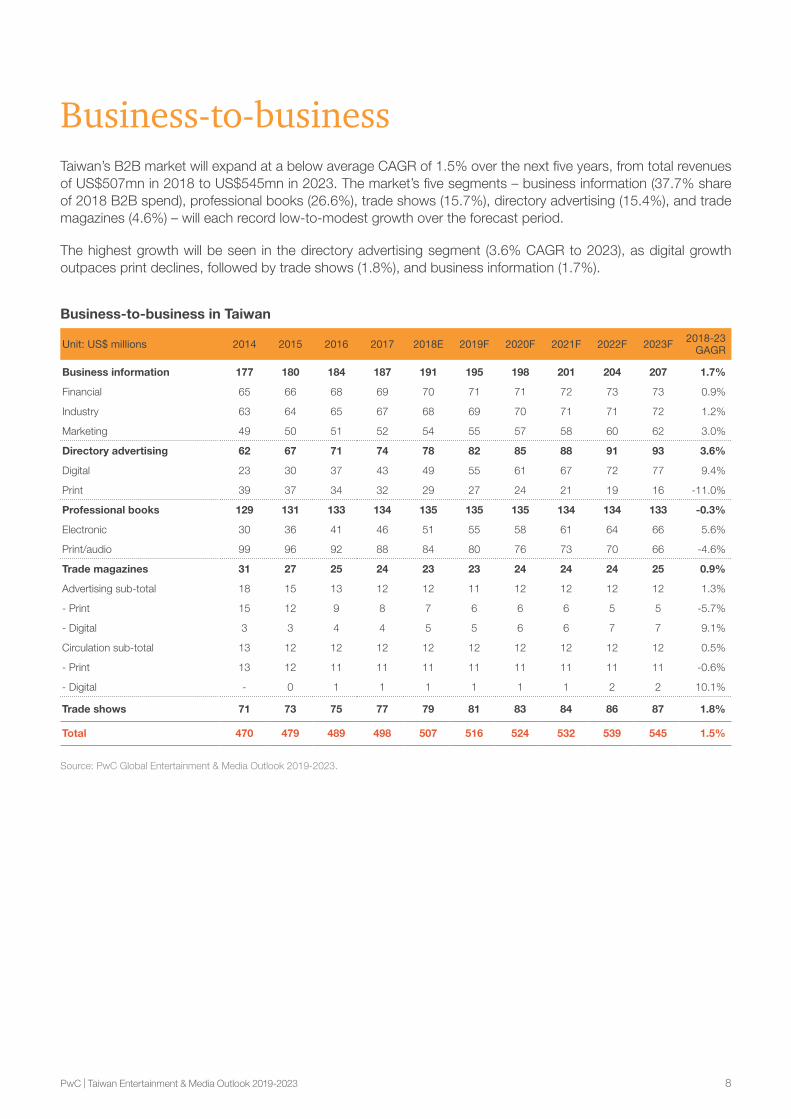
Business-to-businessTaiwan’s B2B market will expand at a below average CAGR of 1.5% over the next five years, from total revenues of US$507mn in 2018 to US$545mn in 2023. The market’s five segments – business information (37.7% share of 2018 B2B spend), professional books (26.6%), trade shows (15.7%), directory advertising (15.4%), and trade magazines (4.6%) – will each record low-to-modest growth over the forecast period.
The highest growth will be seen in the directory advertising segment (3.6% CAGR to 2023), as digital growth outpaces print declines, followed by trade shows (1.8%), and business information (1.7%).
Business-to-business in Taiwan
Unit: US$ millions 2014 2015 2016 2017 2018E 2019F 2020F 2021F 2022F 2023F 2018-23GAGR
Business information 177 180 184 187 191 195 198 201 204 207 1.7%
Financial 65 66 68 69 70 71 71 72 73 73 0.9%
Industry 63 64 65 67 68 69 70 71 71 72 1.2%
Marketing 49 50 51 52 54 55 57 58 60 62 3.0%
Directory advertising 62 67 71 74 78 82 85 88 91 93 3.6%
Digital 23 30 37 43 49 55 61 67 72 77 9.4%
Print 39 37 34 32 29 27 24 21 19 16 -11.0%
Professional books 129 131 133 134 135 135 135 134 134 133 -0.3%
Electronic 30 36 41 46 51 55 58 61 64 66 5.6%
Print/audio 99 96 92 88 84 80 76 73 70 66 -4.6%
Trade magazines 31 27 25 24 23 23 24 24 24 25 0.9%
Advertising sub-total 18 15 13 12 12 11 12 12 12 12 1.3%
- Print 15 12 9 8 7 6 6 6 5 5 -5.7%
- Digital 3 3 4 4 5 5 6 6 7 7 9.1%
Circulation sub-total 13 12 12 12 12 12 12 12 12 12 0.5%
- Print 13 12 11 11 11 11 11 11 11 11 -0.6%
- Digital - 0 1 1 1 1 1 1 2 2 10.1%
Trade shows 71 73 75 77 79 81 83 84 86 87 1.8%
Total 470 479 489 498 507 516 524 532 539 545 1.5%
Source: PwC Global Entertainment & Media Outlook 2019-2023.
PwC | Taiwan Entertainment & Media Outlook 2019-2023 9
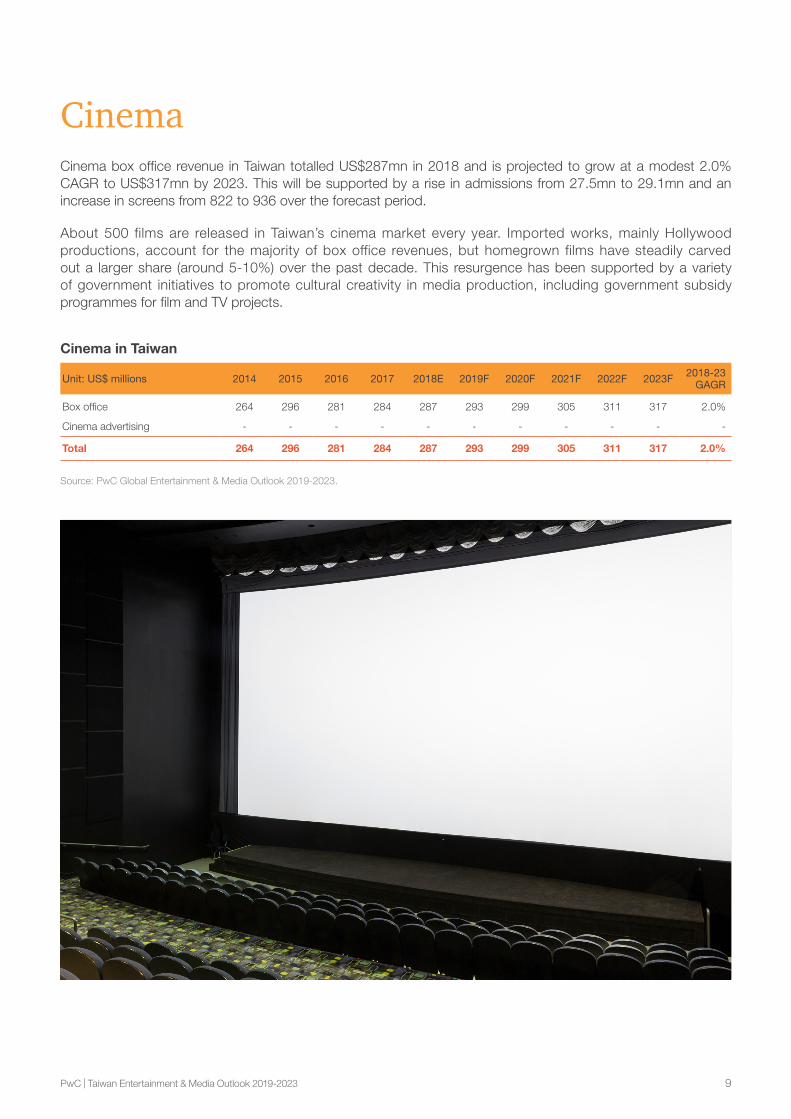
CinemaCinema box office revenue in Taiwan totalled US$287mn in 2018 and is projected to grow at a modest 2.0% CAGR to US$317mn by 2023. This will be supported by a rise in admissions from 27.5mn to 29.1mn and an increase in screens from 822 to 936 over the forecast period.
About 500 films are released in Taiwan’s cinema market every year. Imported works, mainly Hollywood productions, account for the majority of box office revenues, but homegrown films have steadily carved out a larger share (around 5-10%) over the past decade. This resurgence has been supported by a variety of government initiatives to promote cultural creativity in media production, including government subsidy programmes for film and TV projects.
Cinema in Taiwan
Unit: US$ millions 2014 2015 2016 2017 2018E 2019F 2020F 2021F 2022F 2023F 2018-23GAGR
Box office 264 296 281 284 287 293 299 305 311 317 2.0%
Cinema advertising - - - - - - - - - - -
Total 264 296 281 284 287 293 299 305 311 317 2.0%
Source: PwC Global Entertainment & Media Outlook 2019-2023.

PwC | Taiwan Entertainment & Media Outlook 2019-2023 10
Internet accessThe Internet access market in Taiwan is projected to grow at a 4.9% CAGR to US$8.1bn in 2023, up from US$6.4bn in 2018. Fixed broadband revenues will grow by 0.8% in the next five years to reach US$2.1bn, while mobile Internet revenues will expand 6.6% over the same period to US$6bn in 2023, representing 73.8% of the total market (versus 68.1% in 2018).
Taiwan has an advanced fixed broadband sector, with operators expanding their fibre coverage to offer higher Internet speeds, but growth is slowing as users move to mobile broadband. High mobile phone penetration has resulted in intense competition to gain new subscribers among Taiwan’s six mobile network operators, hence the mobile sector was quick to embrace 4G LTE (93% share at the end of November 2018).
Taiwan shut down 3G networks at the end of 2018, and mobile operators are now preparing for the migration to 5G. Most plan to commercially launch 5G services in 2020, the frequency spectrums for which the government plans to put up for auction in the second half of 2019.
Internet access in Taiwan
Unit: US$ millions 2014 2015 2016 2017 2018E 2019F 2020F 2021F 2022F 2023F 2018-23GAGR
Mobile internet access 2,828 3,429 3,900 4,083 4,366 4,703 5,052 5,391 5,706 6,013 6.6%
Fixed broadband access 1,960 2,039 2,010 2,027 2,048 2,068 2,087 2,104 2,119 2,136 0.8%
Total 4,787 5,469 5,911 6,110 6,414 6,771 7,139 7,495 7,825 8,149 4.9%
Source: PwC Global Entertainment & Media Outlook 2019-2023.
PwC | Taiwan Entertainment & Media Outlook 2019-2023 11
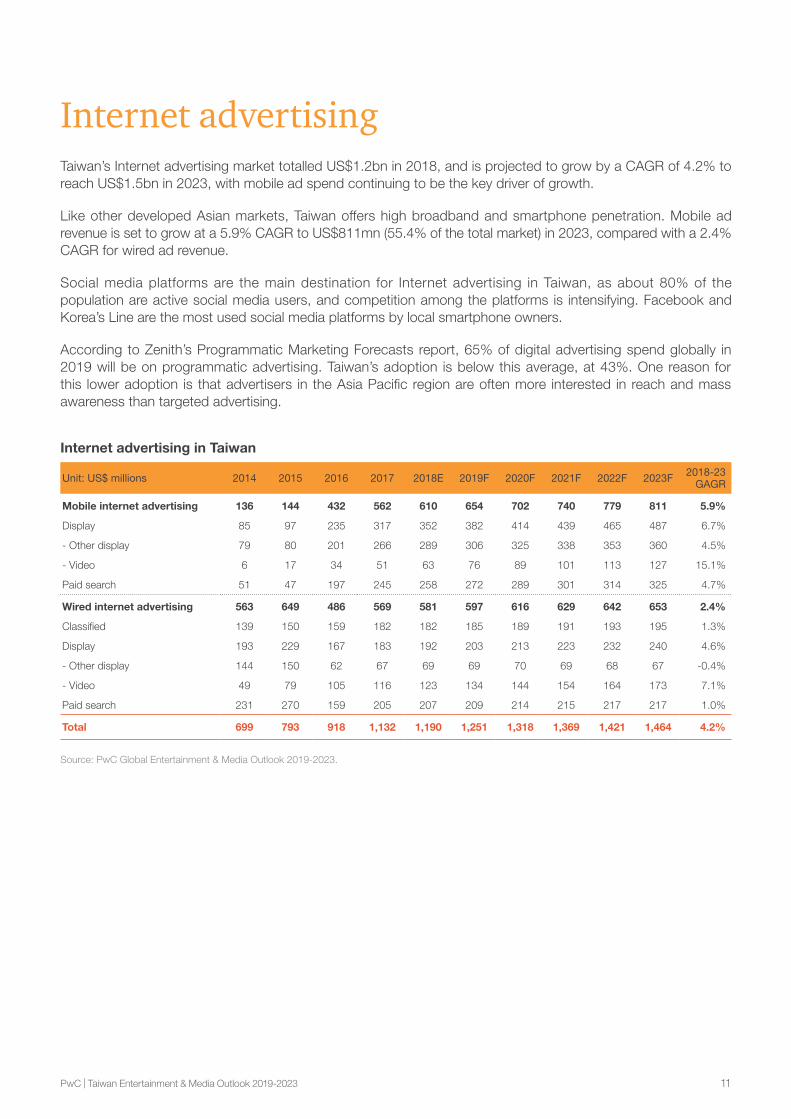
Internet advertisingTaiwan’s Internet advertising market totalled US$1.2bn in 2018, and is projected to grow by a CAGR of 4.2% to reach US$1.5bn in 2023, with mobile ad spend continuing to be the key driver of growth.
Like other developed Asian markets, Taiwan offers high broadband and smartphone penetration. Mobile ad revenue is set to grow at a 5.9% CAGR to US$811mn (55.4% of the total market) in 2023, compared with a 2.4% CAGR for wired ad revenue.
Social media platforms are the main destination for Internet advertising in Taiwan, as about 80% of the population are active social media users, and competition among the platforms is intensifying. Facebook and Korea’s Line are the most used social media platforms by local smartphone owners.
According to Zenith’s Programmatic Marketing Forecasts report, 65% of digital advertising spend globally in 2019 will be on programmatic advertising. Taiwan’s adoption is below this average, at 43%. One reason for this lower adoption is that advertisers in the Asia Pacific region are often more interested in reach and mass awareness than targeted advertising.
Internet advertising in Taiwan
Unit: US$ millions 2014 2015 2016 2017 2018E 2019F 2020F 2021F 2022F 2023F 2018-23GAGR
Mobile internet advertising 136 144 432 562 610 654 702 740 779 811 5.9%
Display 85 97 235 317 352 382 414 439 465 487 6.7%
- Other display 79 80 201 266 289 306 325 338 353 360 4.5%
- Video 6 17 34 51 63 76 89 101 113 127 15.1%
Paid search 51 47 197 245 258 272 289 301 314 325 4.7%
Wired internet advertising 563 649 486 569 581 597 616 629 642 653 2.4%
Classified 139 150 159 182 182 185 189 191 193 195 1.3%
Display 193 229 167 183 192 203 213 223 232 240 4.6%
- Other display 144 150 62 67 69 69 70 69 68 67 -0.4%
- Video 49 79 105 116 123 134 144 154 164 173 7.1%
Paid search 231 270 159 205 207 209 214 215 217 217 1.0%
Total 699 793 918 1,132 1,190 1,251 1,318 1,369 1,421 1,464 4.2%
Source: PwC Global Entertainment & Media Outlook 2019-2023.
PwC | Taiwan Entertainment & Media Outlook 2019-2023 12
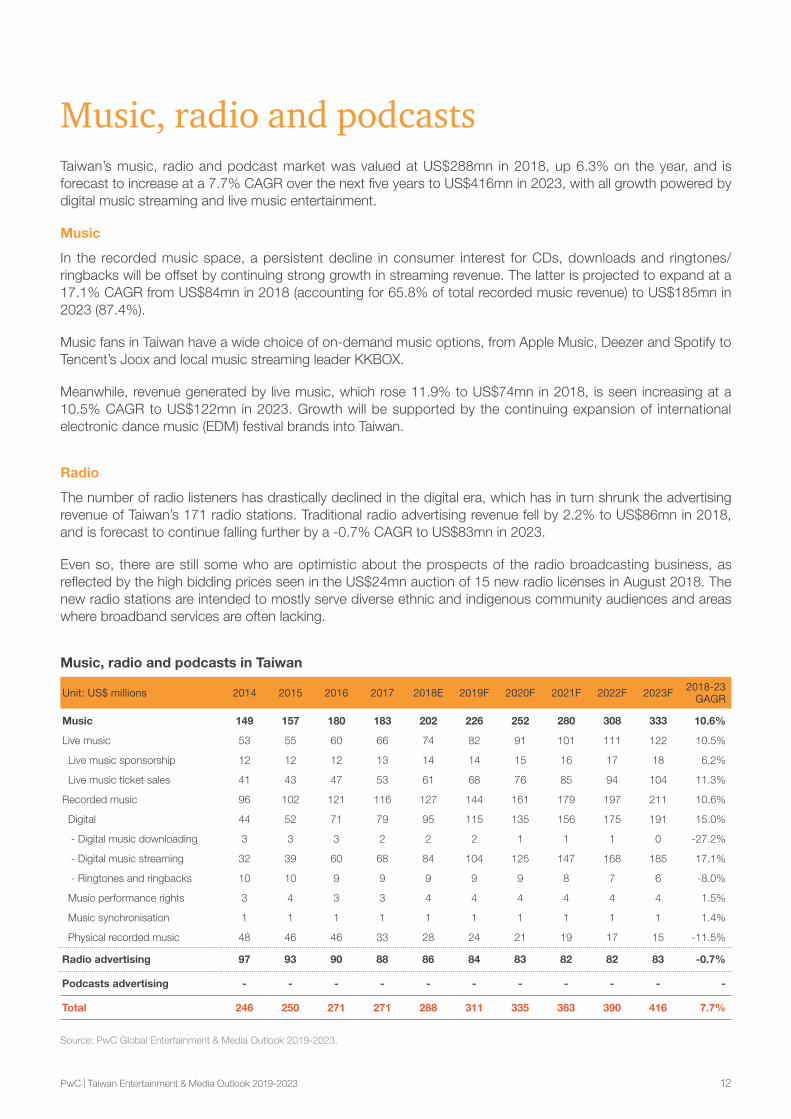
Music, radio and podcastsTaiwan’s music, radio and podcast market was valued at US$288mn in 2018, up 6.3% on the year, and is forecast to increase at a 7.7% CAGR over the next five years to US$416mn in 2023, with all growth powered by digital music streaming and live music entertainment.
Music
In the recorded music space, a persistent decline in consumer interest for CDs, downloads and ringtones/ringbacks will be offset by continuing strong growth in streaming revenue. The latter is projected to expand at a 17.1% CAGR from US$84mn in 2018 (accounting for 65.8% of total recorded music revenue) to US$185mn in 2023 (87.4%).
Music fans in Taiwan have a wide choice of on-demand music options, from Apple Music, Deezer and Spotify to Tencent’s Joox and local music streaming leader KKBOX.
Meanwhile, revenue generated by live music, which rose 11.9% to US$74mn in 2018, is seen increasing at a 10.5% CAGR to US$122mn in 2023. Growth will be supported by the continuing expansion of international electronic dance music (EDM) festival brands into Taiwan.
Radio
The number of radio listeners has drastically declined in the digital era, which has in turn shrunk the advertising revenue of Taiwan’s 171 radio stations. Traditional radio advertising revenue fell by 2.2% to US$86mn in 2018, and is forecast to continue falling further by a -0.7% CAGR to US$83mn in 2023.
Even so, there are still some who are optimistic about the prospects of the radio broadcasting business, as reflected by the high bidding prices seen in the US$24mn auction of 15 new radio licenses in August 2018. The new radio stations are intended to mostly serve diverse ethnic and indigenous community audiences and areas where broadband services are often lacking.
Music, radio and podcasts in Taiwan
Unit: US$ millions 2014 2015 2016 2017 2018E 2019F 2020F 2021F 2022F 2023F 2018-23GAGR
Music 149 157 180 183 202 226 252 280 308 333 10.6%
Live music 53 55 60 66 74 82 91 101 111 122 10.5%
Live music sponsorship 12 12 12 13 14 14 15 16 17 18 6.2%
Live music ticket sales 41 43 47 53 61 68 76 85 94 104 11.3%
Recorded music 96 102 121 116 127 144 161 179 197 211 10.6%
Digital 44 52 71 79 95 115 135 156 175 191 15.0%
- Digital music downloading 3 3 3 2 2 2 1 1 1 0 -27.2%
- Digital music streaming 32 39 60 68 84 104 125 147 168 185 17.1%
- Ringtones and ringbacks 10 10 9 9 9 9 9 8 7 6 -8.0%
Music performance rights 3 4 3 3 4 4 4 4 4 4 1.5%
Music synchronisation 1 1 1 1 1 1 1 1 1 1 1.4%
Physical recorded music 48 46 46 33 28 24 21 19 17 15 -11.5%
Radio advertising 97 93 90 88 86 84 83 82 82 83 -0.7%
Podcasts advertising - - - - - - - - - - -
Total 246 250 271 271 288 311 335 363 390 416 7.7%
Source: PwC Global Entertainment & Media Outlook 2019-2023.
PwC | Taiwan Entertainment & Media Outlook 2019-2023 13
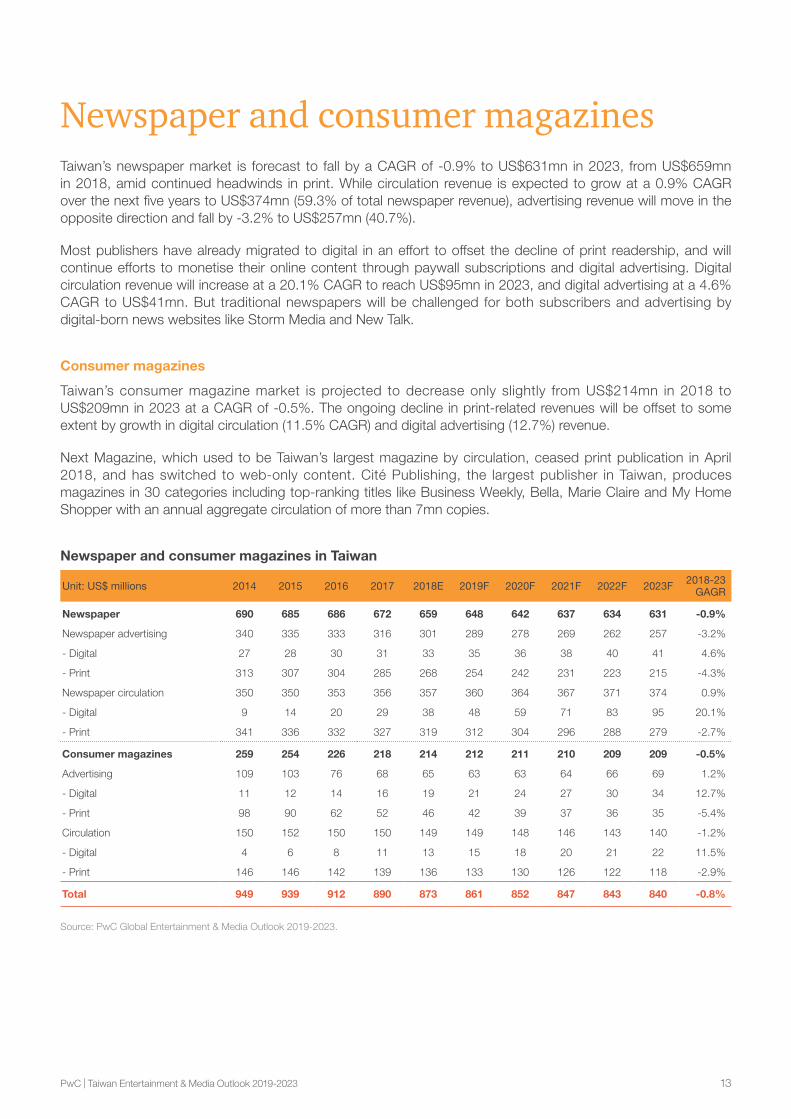
Newspaper and consumer magazinesTaiwan’s newspaper market is forecast to fall by a CAGR of -0.9% to US$631mn in 2023, from US$659mn in 2018, amid continued headwinds in print. While circulation revenue is expected to grow at a 0.9% CAGR over the next five years to US$374mn (59.3% of total newspaper revenue), advertising revenue will move in the opposite direction and fall by -3.2% to US$257mn (40.7%).
Most publishers have already migrated to digital in an effort to offset the decline of print readership, and will continue efforts to monetise their online content through paywall subscriptions and digital advertising. Digital circulation revenue will increase at a 20.1% CAGR to reach US$95mn in 2023, and digital advertising at a 4.6% CAGR to US$41mn. But traditional newspapers will be challenged for both subscribers and advertising by digital-born news websites like Storm Media and New Talk.
Consumer magazines
Taiwan’s consumer magazine market is projected to decrease only slightly from US$214mn in 2018 to US$209mn in 2023 at a CAGR of -0.5%. The ongoing decline in print-related revenues will be offset to some extent by growth in digital circulation (11.5% CAGR) and digital advertising (12.7%) revenue.
Next Magazine, which used to be Taiwan’s largest magazine by circulation, ceased print publication in April 2018, and has switched to web-only content. Cité Publishing, the largest publisher in Taiwan, produces magazines in 30 categories including top-ranking titles like Business Weekly, Bella, Marie Claire and My Home Shopper with an annual aggregate circulation of more than 7mn copies.
Newspaper and consumer magazines in Taiwan
Unit: US$ millions 2014 2015 2016 2017 2018E 2019F 2020F 2021F 2022F 2023F 2018-23GAGR
Newspaper 690 685 686 672 659 648 642 637 634 631 -0.9%
Newspaper advertising 340 335 333 316 301 289 278 269 262 257 -3.2%
- Digital 27 28 30 31 33 35 36 38 40 41 4.6%
- Print 313 307 304 285 268 254 242 231 223 215 -4.3%
Newspaper circulation 350 350 353 356 357 360 364 367 371 374 0.9%
- Digital 9 14 20 29 38 48 59 71 83 95 20.1%
- Print 341 336 332 327 319 312 304 296 288 279 -2.7%
Consumer magazines 259 254 226 218 214 212 211 210 209 209 -0.5%
Advertising 109 103 76 68 65 63 63 64 66 69 1.2%
- Digital 11 12 14 16 19 21 24 27 30 34 12.7%
- Print 98 90 62 52 46 42 39 37 36 35 -5.4%
Circulation 150 152 150 150 149 149 148 146 143 140 -1.2%
- Digital 4 6 8 11 13 15 18 20 21 22 11.5%
- Print 146 146 142 139 136 133 130 126 122 118 -2.9%
Total 949 939 912 890 873 861 852 847 843 840 -0.8%
Source: PwC Global Entertainment & Media Outlook 2019-2023.

PwC | Taiwan Entertainment & Media Outlook 2019-2023 14
OTT video In Taiwan, OTT video revenue will overtake that of physical home video revenue in 2019 – US$668mn to US$605mn respectively – a tipping point in the fortunes of the two media. By 2023 OTT video revenue will have grown at a CAGR of 15.6% to US$1.1bn.
The number of broadband households in Taiwan will barely edge upwards between 2018 and 2023, rising at a 0.3% CAGR from 6.3mn to 6.4mn, but with a high penetration rate hitting 86% by 2023.
International OTT service providers Netflix and Amazon Prime Video launched locally in 2016, followed by the Fox+ service in 2017 in partnership with Chunghwa Telecom. The telco giant has also signed up with Netflix to offer ultra-high-definition content for its IPTV subscribers starting from February 2019. Local OTT competitors include CatchPlay, which offers a video-on-demand service specialising in Hollywood and Asian movies. The Taiwan OTT Association in December 2018 released a White Paper, which aims to encourage the development of local OTT platforms and content.
Facing increasing competition from unregulated OTT services, some cable operators are leveraging their fully digitised networks to also provide video-on-demand services, and even cooperate with OTT providers (as with CNS and CatchPlay) to attract or retain subscribers, especially young people.
OTT video in Taiwan
Unit: US$ millions 2014 2015 2016 2017 2018E 2019F 2020F 2021F 2022F 2023F 2018-23GAGR
Subscription video on demand 6 91 221 385 525 655 779 882 986 1,090 15.8%
Transactional video on demand 10 10 11 12 12 13 14 15 16 17 6.4%
Total 16 101 232 396 537 668 794 897 1,002 1,107 15.6%
Source: PwC Global Entertainment & Media Outlook 2019-2023.
PwC | Taiwan Entertainment & Media Outlook 2019-2023 15
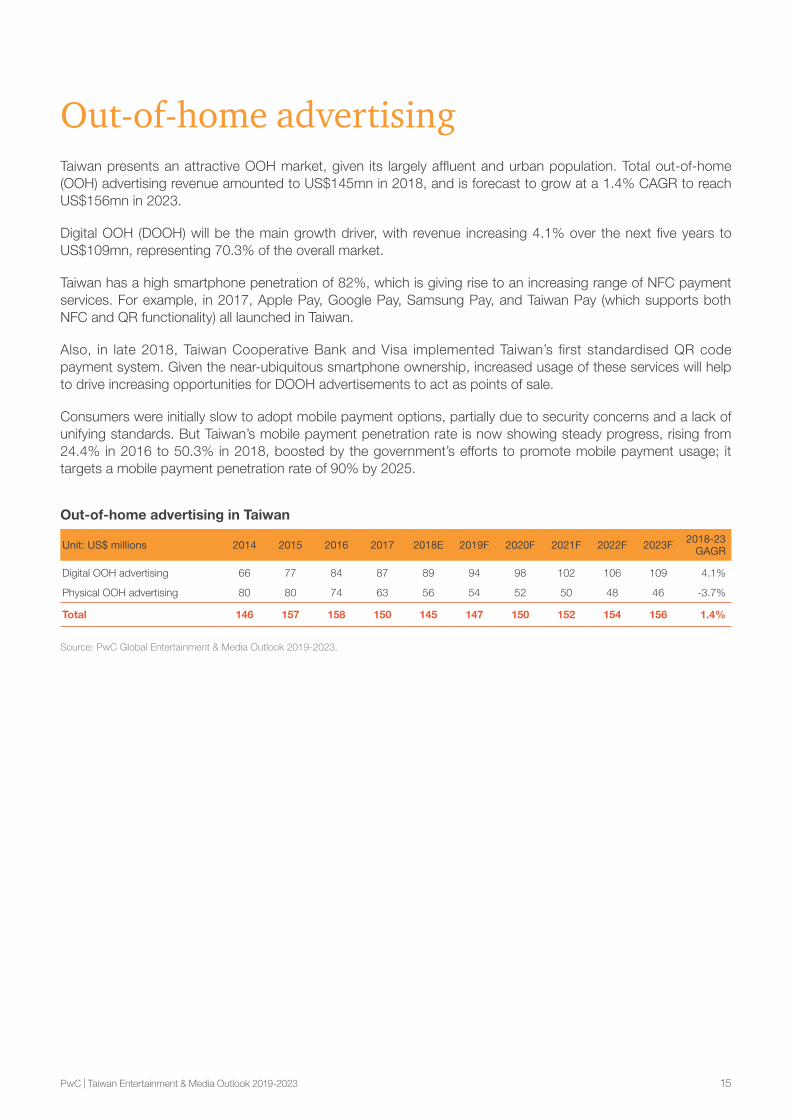
Out-of-home advertisingTaiwan presents an attractive OOH market, given its largely affluent and urban population. Total out-of-home (OOH) advertising revenue amounted to US$145mn in 2018, and is forecast to grow at a 1.4% CAGR to reach US$156mn in 2023.
Digital OOH (DOOH) will be the main growth driver, with revenue increasing 4.1% over the next five years to US$109mn, representing 70.3% of the overall market.
Taiwan has a high smartphone penetration of 82%, which is giving rise to an increasing range of NFC payment services. For example, in 2017, Apple Pay, Google Pay, Samsung Pay, and Taiwan Pay (which supports both NFC and QR functionality) all launched in Taiwan.
Also, in late 2018, Taiwan Cooperative Bank and Visa implemented Taiwan’s first standardised QR code payment system. Given the near-ubiquitous smartphone ownership, increased usage of these services will help to drive increasing opportunities for DOOH advertisements to act as points of sale.
Consumers were initially slow to adopt mobile payment options, partially due to security concerns and a lack of unifying standards. But Taiwan’s mobile payment penetration rate is now showing steady progress, rising from 24.4% in 2016 to 50.3% in 2018, boosted by the government’s efforts to promote mobile payment usage; it targets a mobile payment penetration rate of 90% by 2025.
Out-of-home advertising in Taiwan
Unit: US$ millions 2014 2015 2016 2017 2018E 2019F 2020F 2021F 2022F 2023F 2018-23GAGR
Digital OOH advertising 66 77 84 87 89 94 98 102 106 109 4.1%
Physical OOH advertising 80 80 74 63 56 54 52 50 48 46 -3.7%
Total 146 157 158 150 145 147 150 152 154 156 1.4%
Source: PwC Global Entertainment & Media Outlook 2019-2023.

PwC | Taiwan Entertainment & Media Outlook 2019-2023 16
Traditional TV and home videoTaiwan’s subscription TV sector produced revenue of US$1.8bn in 2018 and will increase at a 2.7% CAGR to reach US$2bn in 2023. Pay-TV is well established, with 94.1% of households subscribing to services, which leaves little room for organic growth. Despite this, IPTV and satellite will continue to gain subscribers over the forecast period, while the dominant cable sector will plateau at around 5.2mn households.
With limited growth in Taiwan’s cable market, consolidation is set to accelerate over the forecast period, with nearly 2.3mn cable subscriptions outside of the leading five cable operators at end-September 2018. The two largest cable providers at this time were CNS and Kbro with an estimated 1.1mn subscribers each. But the pay-TV market-leader remained incumbent telco Chunghwa Telecom, with 1.9mn subscribers to its Multimedia On Demand (MOD) IPTV service. The company has benefitted from a rule change in early 2017 that granted IPTV equal status with local cable operators in sourcing content and TV channels.
The physical home video segment is in long-term decline, but unlike many other advanced markets it remains an important part of the market in Taiwan, accounting for 28.4% (US$703mn) of traditional TV revenue in 2018. This is due to a lingering preference for owning physical media, especially when it comes to local content. Further shrinkage at a -14.8% CAGR will see physical home video account for just 13.5% (US$315mn) of total traditional TV market revenue by 2023.
Traditional TV and home video in Taiwan
Unit: US$ millions 2014 2015 2016 2017 2018E 2019F 2020F 2021F 2022F 2023F 2018-23GAGR
TV subscription 1,652 1,642 1,658 1,690 1,771 1,819 1,868 1,917 1,968 2,021 2.7%
Through-TV-subscription 40 45 48 50 51 51 51 52 52 52 0.5%
Non-through-TV subscription 1,612 1,597 1,610 1,640 1,720 1,768 1,816 1,866 1,916 1,969 2.7%
Physical home video 916 889 877 795 703 605 518 442 374 315 -14.8%
Rentals 202 199 199 171 138 108 83 64 47 35 -24.2%
Sell through 713 691 678 624 565 497 435 378 327 280 -13.1%
Total 2,568 2,531 2,535 2,485 2,474 2,424 2,385 2,359 2,342 2,336 -1.1%
Source: PwC Global Entertainment & Media Outlook 2019-2023.

PwC | Taiwan Entertainment & Media Outlook 2019-2023 17
TV advertisingTaiwan’s total TV advertising market expanded 1.4% in 2018 to reach US$949mn, ending three years of consecutive decline. A mixture of low economic growth and a shift in viewing habits towards online video and the OTT sector has placed a strain on traditional TV advertising, but the resilient pay-TV sector will help drive overall advertising growth of 1.7% CAGR over the next five years to exceed the US$1bn revenue threshold.
The multichannel advertising segment accounted for 59.8% of Taiwan’s total TV advertising market in 2018, and will grow at a 1.3% CAGR to US$605mn (58.6%). The terrestrial sector will struggle for further advertising expansion due to the strength of pay-TV in terms of premium content, niche channels and the opportunities for more-effective targeting, but will still grow at a modest pace of 0.9% CAGR to US$349mn (33.9%) in 2023. Meanwhile, the online TV advertising revenue will grow at a 10.2% CAGR to reach US$77mn (7.5%) in 2023, thanks to a shift in viewing habits to connected devices and the growing popularity of over-the-top platforms.
TV advertising in Taiwan
Unit: US$ millions 2014 2015 2016 2017 2018E 2019F 2020F 2021F 2022F 2023F 2018-23GAGR
Broadcast advertising 1,010 1,000 920 898 902 912 934 940 949 954 1.1%
Multichannel TV advertising 627 621 573 564 568 575 590 594 601 605 1.3%
Terrestrial TV advertising 382 378 346 334 334 337 344 346 348 349 0.9%
Online TV advertising 14 20 29 38 47 57 65 71 75 77 10.2%
Total 1,024 1,020 948 936 949 969 999 1,011 1,024 1,031 1.7%
Source: PwC Global Entertainment & Media Outlook 2019-2023.

PwC | Taiwan Entertainment & Media Outlook 2019-2023 18
Video games and e-sportsTaiwan’s total video games market is forecast to grow by a CAGR of 6.3% to US$2.5bn in 2023, from US$1.8bn in 2018, thanks to the rising popularity of social/casual games.
Benefiting from high smartphone penetration, Taiwan’s social/casual gaming sector will account for 57.4% (US$1.4bn) of the overall market by 2023, at a 7.8% CAGR. Taiwanese gamers have easy access to Western-developed titles such as Pokémon GO and Chinese-developed games like Arena of Valor, both of which have proved extremely successful.
However, Taiwan’s traditional gaming sector will remain steady, accounting for 41.9% (US$1bn) of the overall market by 2023, at a 4.4% CAGR over the forecast period, benefitting from gamers’ support for popular PC games such as League of Legends and new hardware releases from major console market players like Nintendo, PlayStation and Xbox.
Also, the e-sports sector in Taiwan is heating up, supported by the government’s recognition in 2017 of digital gaming as an official sport, and attracting attention from global games giants. The 10th International Esports Federation (IESF) World Championship was held in Kaohsiung in November 2018, with around 700 competitors from over 40 territories participating. Also, Riot Games, the developer of League of Legends, held its 2019 Mid-Season Invitational in Vietnam and Taiwan.
Video games and e-sports in Taiwan
Unit: US$ millions 2014 2015 2016 2017 2018E 2019F 2020F 2021F 2022F 2023F 2018-23GAGR
Video games 1,311 1,543 1,616 1,749 1,846 1,992 2,135 2,256 2,375 2,500 6.3%
Video games advertising 7 8 10 11 12 14 15 16 16 17 6.3%
Video games consumer 1,304 1,534 1,606 1,738 1,834 1,979 2,120 2,240 2,358 2,484 6.3%
Social/casual gaming 524 721 839 928 987 1,092 1,196 1,277 1,354 1,435 7.8%
- App-based 428 623 753 849 913 1,023 1,133 1,220 1,303 1,390 8.8%
- Browser-based 97 97 85 80 74 68 62 57 51 45 -9.3%
Traditional gaming 780 814 768 810 847 887 925 964 1,005 1,048 4.4%
- Console games 238 244 228 233 239 246 251 256 262 268 2.4%
• Digital 30 36 40 46 54 62 69 77 86 96 12.0%
• Online/microtransaction 1 1 1 1 1 2 2 2 2 3 13.6%
• Physical 208 207 188 185 183 183 180 177 174 170 -1.5%
- PC games 542 570 539 577 608 641 674 708 743 780 5.1%
• Digital 19 74 19 19 20 20 21 22 23 24 4.1%
• Online/microtransaction 521 494 520 556 587 619 651 685 719 756 5.2%
• Physical 1 1 1 1 1 1 1 1 1 0 -21.9%
E-sports - - - - - - - - - - -
Total 1,311 1,543 1,616 1,749 1,846 1,992 2,135 2,256 2,375 2,500 6.3%
Source: PwC Global Entertainment & Media Outlook 2019-2023.

PwC Taiwan contacts
Gary ChihPartner, Entertainment and Media [email protected]
Cynthia T ChenSenior Manager, Entertainment and media [email protected]
Jason W WangSenior Manager, Entertainment and media [email protected]
Chih-Hua HuSenior Manager, Entertainment and media [email protected]
James C ChenManager, Entertainment and media [email protected]
To subscribe, visit www.pwc.com/outlook
© 2019 PwC. All rights reserved. PwC refers to the PwC network and/or one or more of its member firms, each of which is also a separate legal entity. Please see www.pwc.com/structure for further details. Global entertainment and media outlook is a trademark owned by PricewaterhouseCoopers LLP. This content is for general information purposes only, and should not be used as a substitute for consultation with professional advisors.