Tadesse - The Allocation and Monitoring Role of Capital Markets- Theory and International Evidence
32
The Allocation and Monitoring Role of Capital Markets: Theory and International Evidence Author(s): Solomon Tadesse Source: The Journal of Financial and Quantitative Analysis, Vol. 39, No. 4 (Dec., 2004), pp. 701 -730 Published by: University of Washington School of Business Administration Stable URL: http://www.jstor.org/stable/30031882 Accessed: 01/08/2010 02:30 Your use of the JSTOR archive indicates your acceptance of JSTOR's Terms and Conditions of Use, available at http://www.jstor.org/page/info/about/policies/terms.jsp . JSTOR's Terms and Conditions of Use provides, in part, that unless you have obtained prior permission, you may not download an entire issue of a journal or multiple copies of articles, and you may use content in the JSTOR archive only for your personal, non-commercial use. Please contact the publisher regarding any further use of this work. Publisher contact information may be obtained at http://www.jstor.org/action/showPublisher?publisherCode=uwash . Each copy of any part of a JSTOR transmission must contain the same copyright notice that appears on the screen or printed page of such transmission. JSTOR is a not-for-profit service that helps scholars, researchers, and students discover, use, and build upon a wide range of content in a trusted digital archive. We use information technology and tools to increase productivity and facilitate new forms of scholarship. For more information about JSTOR, please contact [email protected]. University of Washington School of Business Administration is collaborating with JSTOR to digitize, preserve and extend access to The Journal of Financial and Quantitative Analysis. http://www.jstor.org
Transcript of Tadesse - The Allocation and Monitoring Role of Capital Markets- Theory and International Evidence
8/8/2019 Tadesse - The Allocation and Monitoring Role of Capital Markets- Theory and International Evidence
http://slidepdf.com/reader/full/tadesse-the-allocation-and-monitoring-role-of-capital-markets-theory-and 1/31
8/8/2019 Tadesse - The Allocation and Monitoring Role of Capital Markets- Theory and International Evidence
http://slidepdf.com/reader/full/tadesse-the-allocation-and-monitoring-role-of-capital-markets-theory-and 2/31

8/8/2019 Tadesse - The Allocation and Monitoring Role of Capital Markets- Theory and International Evidence
http://slidepdf.com/reader/full/tadesse-the-allocation-and-monitoring-role-of-capital-markets-theory-and 3/31

8/8/2019 Tadesse - The Allocation and Monitoring Role of Capital Markets- Theory and International Evidence
http://slidepdf.com/reader/full/tadesse-the-allocation-and-monitoring-role-of-capital-markets-theory-and 4/31

8/8/2019 Tadesse - The Allocation and Monitoring Role of Capital Markets- Theory and International Evidence
http://slidepdf.com/reader/full/tadesse-the-allocation-and-monitoring-role-of-capital-markets-theory-and 5/31
8/8/2019 Tadesse - The Allocation and Monitoring Role of Capital Markets- Theory and International Evidence
http://slidepdf.com/reader/full/tadesse-the-allocation-and-monitoring-role-of-capital-markets-theory-and 6/31
8/8/2019 Tadesse - The Allocation and Monitoring Role of Capital Markets- Theory and International Evidence
http://slidepdf.com/reader/full/tadesse-the-allocation-and-monitoring-role-of-capital-markets-theory-and 7/31

8/8/2019 Tadesse - The Allocation and Monitoring Role of Capital Markets- Theory and International Evidence
http://slidepdf.com/reader/full/tadesse-the-allocation-and-monitoring-role-of-capital-markets-theory-and 8/31

8/8/2019 Tadesse - The Allocation and Monitoring Role of Capital Markets- Theory and International Evidence
http://slidepdf.com/reader/full/tadesse-the-allocation-and-monitoring-role-of-capital-markets-theory-and 9/31
8/8/2019 Tadesse - The Allocation and Monitoring Role of Capital Markets- Theory and International Evidence
http://slidepdf.com/reader/full/tadesse-the-allocation-and-monitoring-role-of-capital-markets-theory-and 10/31
8/8/2019 Tadesse - The Allocation and Monitoring Role of Capital Markets- Theory and International Evidence
http://slidepdf.com/reader/full/tadesse-the-allocation-and-monitoring-role-of-capital-markets-theory-and 11/31
8/8/2019 Tadesse - The Allocation and Monitoring Role of Capital Markets- Theory and International Evidence
http://slidepdf.com/reader/full/tadesse-the-allocation-and-monitoring-role-of-capital-markets-theory-and 12/31
8/8/2019 Tadesse - The Allocation and Monitoring Role of Capital Markets- Theory and International Evidence
http://slidepdf.com/reader/full/tadesse-the-allocation-and-monitoring-role-of-capital-markets-theory-and 13/31
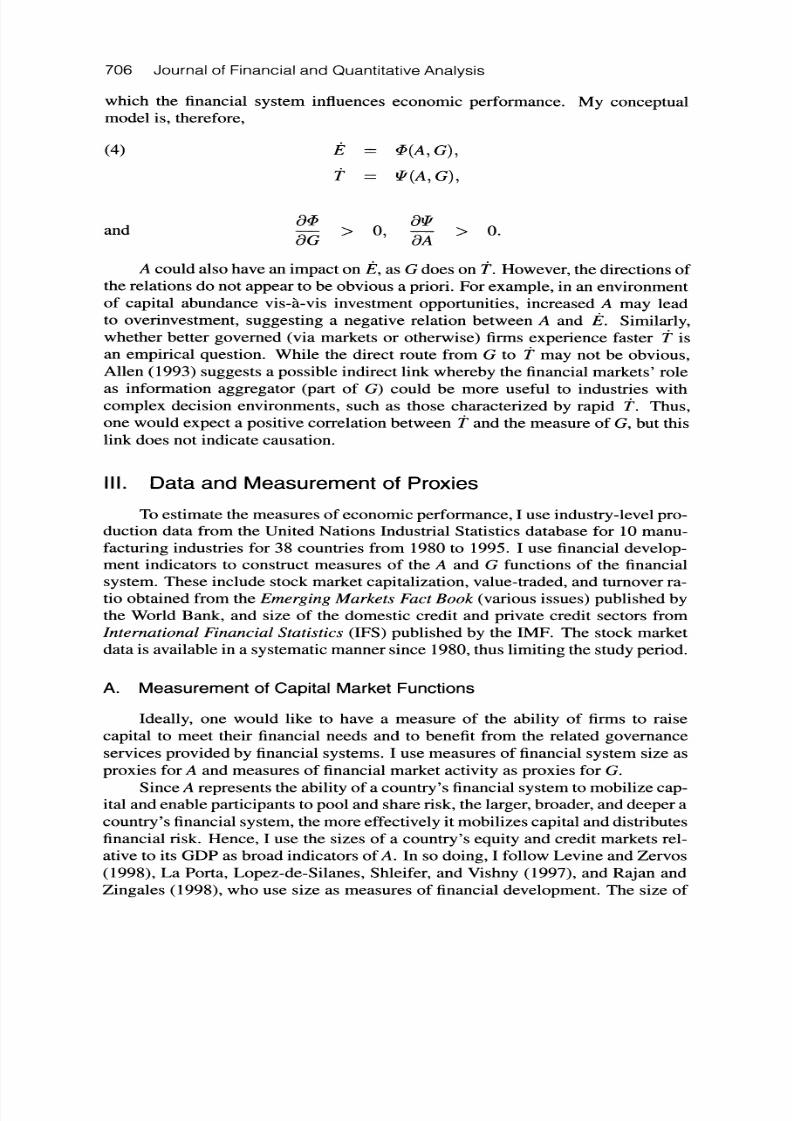
712 Journal of Financial and Quantitative Analysis
negatively correlated with per capita real GDP in Table 2. On the other hand,GP is not related to a country's level of economic development. Productivitygrowth n the U.S. (3.1%) compares well with that of the Philippines 3.3%), the
highest being registered by industries n Korea (4.9%) and in Sri Lanka (5.4%).More importantly, he growth rates in efficiency (AECONEF and APRODEFF)are not related o a country's evel of economic development. The growth rates neconomic efficiency and in production fficiencies range from 0.93% and 0.54%in Korea to -0.74% in Bangladesh and -0.87% in Peru, respectively. Yet, anadvanced country ike the U.S. (0.11%) could have realized growth n economic
efficiency comparable o that for Chile (0.09%) and Colombia 0.09%). Industriesin richer countries realize higher rates of TC. TC is positively correlated with percapita GDP (Table 2). This might reflect that richer countries have the where-withal to support advanced R&D activities, which keep them in the technologicallead.
IV. Market-Based overnance, Allocation, nd EconomicPerformance
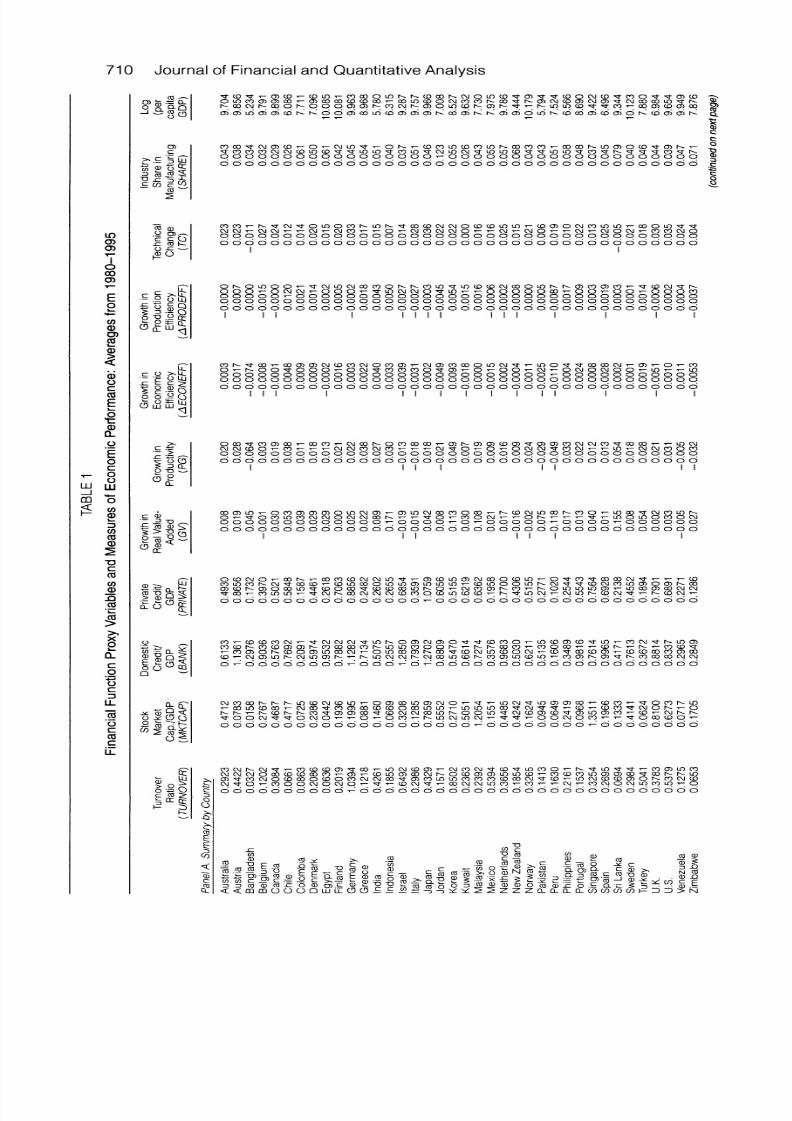
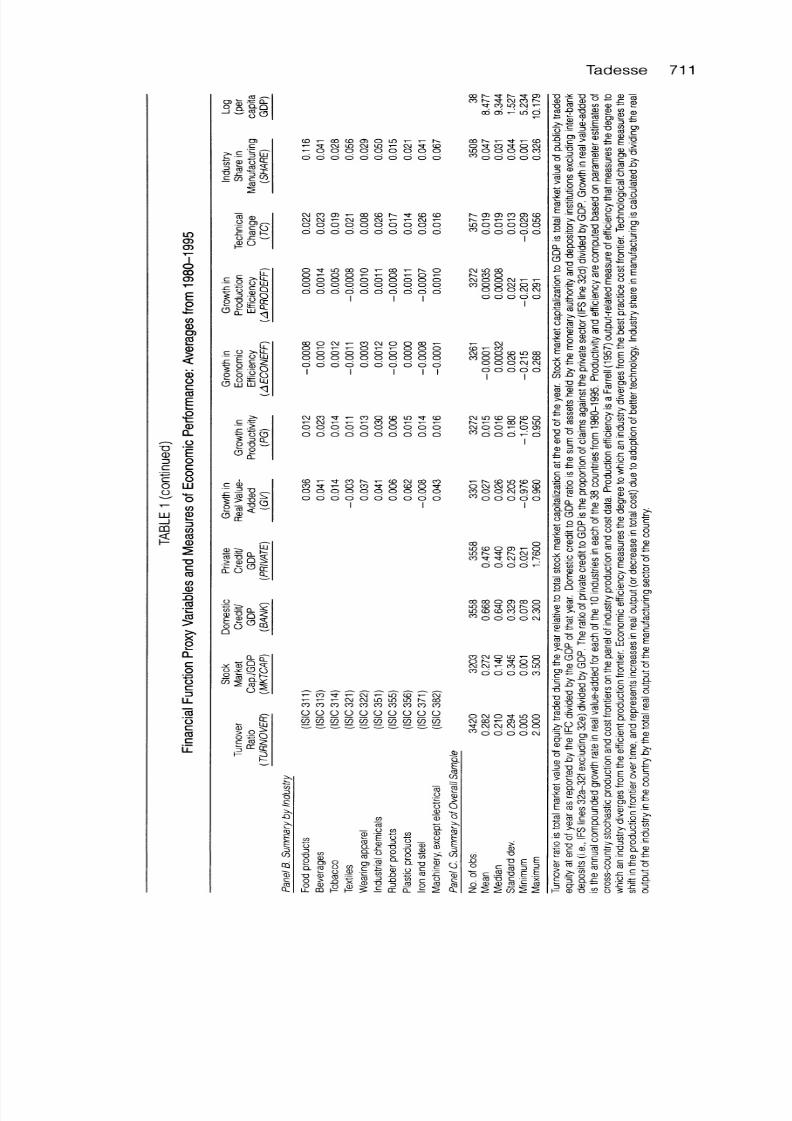
Panel C of Table 1 summarizes both the capital market unction variables
and the economic performance ariables or the entire sample of 3,605 industrycountry years. There are wide variations n realized performance measures. Themedian industry growth rate in real value-added s 2.6% for the entire sample.The growth rate in economic efficiency has a median value of 0.032%, with a
range from -21.5% to 26.8%. The median growth rate in production fficiencyis 0.008% with a range of -20.1% to 29.1%. The rate of technological changeaverages 1.9% per annum. The average industry contributes about 5% of the
manufacturing ector's total real value-added or real output.These variations n performance appear o be closely associated with vari-
ations in the measures of capital market unctions across countries. Table 3 ex-plores the relations between the two sets of variables urther by presenting a dif-ference of means test of the performance measures across subsamples ormed onthe basis of rankings n the finance variables. From panel A, more active equitymarkets are strongly associated with higher growth rates in value-added, produc-tivity, and efficiency. On the other hand, the size of equity markets s weaklyrelated to growth rates in value-added, productivity, nd efficiency (see panel B).Better allocation by the credit sector is strongly related to productivity gains andTC (panels C and D).
A. Financial System Functions and Aggregate Measures ofPerformance
I begin the analysis of the relations between financial systems and economic
performance by examining the link between capital market unctions and aggre-gate measures of industry performance. This would facilitate a comparison withthe extant iterature. use the growth rates n real value-added nd productivity s

8/8/2019 Tadesse - The Allocation and Monitoring Role of Capital Markets- Theory and International Evidence
http://slidepdf.com/reader/full/tadesse-the-allocation-and-monitoring-role-of-capital-markets-theory-and 14/31
Tadesse 713
TABLE
2
Correlation
Matrix
Growth
Industry
Credit
to
inReal
Growth
in
Growth
in
Share
Turnover
Stock
Market
Domestic
Private
Value-
Growth
in
Production
Economic
Technical
in
Ratio
Capitalization
Credit
Sector
Added
Productivity
Efficiency
Efficiency
Change
Manufacturing
(TURNOVER)
(MKTCAP)
(BANK)
(PRIVATE)
(GV)
(PG)
(APRODEFF)
(AECONEFF)
(TC)
(SHARE)
Stock
market
0.186***
capitalizationMKTCAP)Domestic
0.249***
0.242**
creditBANK)Credit
toprivate
0.328***
0.517***
0.774***
sectorPRIVATE)Growth
inreal
0.120***
0.008
0.004
0.043
value
added
(GV)Growth
in
0.115***
0.033
0.085**
0.083**
0.901***
productivityPG)Growth
inproduction
0.083**
0.040
0.046
0.060
0.899***
0.937***
efficiencyAPRODEFF)Growth
ineconomic
0.140***
0.011
0.049
0.074
0.740***
0.831**
0.895***
efficiencyAECONEFF)Technical
0.357***
0.255***
0.465***
0.487***
-0.125***
0.006
-0.089**
0.037
changeTC)Industry
share
-0.031
-0.071
-0.061
-0.108**
0.063
0.008
0.052
0.048
-0.028
inmanufacturing
(SHARE)Per
capita
0.236***
0.308***
0.500***
0.609***
-0.145***
0.033
-0.050
0.043
0.650***
-0.270***
GDP ,*,nd
***indicate
significance
atthe
10%,
5%,
and
1%
levels,
respectively.

8/8/2019 Tadesse - The Allocation and Monitoring Role of Capital Markets- Theory and International Evidence
http://slidepdf.com/reader/full/tadesse-the-allocation-and-monitoring-role-of-capital-markets-theory-and 15/31
714 Journal of Financial nd Quantitative Analysis
TABLEInter-Quartile eanDifferences n Industry erformance
Bottom 5%vs. Top 25%
Bottom Middle Top WilcoxonVariables 25% 50% 25% Test t-Test
Panel A. Ranking y Stock Market Turnover atio
Growth n real value-added 0.0240 0.0176 0.0468 -3.48*** -2.28**Growth n real gross output 0.0330 0.0150 0.0443 1.87* -1.42Growth n productivity 0.0073 0.0128 0.0268 -3.77*** -2.12**Growth n production fficiency -0.0002 0.0002 0.0013 -2.81*** -1.37Growth n economic efficiency -0.0025 0.0001 0.0020 -4.21** -3.17***Technical hange 0.0133 0.0204 0.0246 -18.51** -20.7***Panel B. Ranking y Market Capitalization
Growth n real value-added 0.0237 0.0282 0.0334 -1.85* -0.89Growth n real gross output 0.0307 0.0257 0.0303 -0.29 0.05Growth n productivity 0.0096 0.0209 0.0141 -1.62 -0.46Growth n production fficiency -0.0006 0.001 -0.00006 -1.05 -0.43Growth n economic efficiency -0.0030 0.0013 0.0004 -2.54** -2.28**Technical hange 0.0134 0.0203 0.0250 16.05** -18.04**
Panel C. Ranking y Domestic Credit o GDP
Growth n real value-added 0.0268 0.0287 0.0315 -0.24 -0.41Growth n real gross output 0.0254 0.0287 0.0313 0.41 -0.64Growth n productivity 0.0085 0.0151 0.0256 -2.82*** -1.67*Growth n production fficiency -0.0003 0.0007 0.0009 -1.21 -1.05Growth n economic efficiency -0.0021 0.0009 0.0002 -2.57*** -1.59Technical hange 0.00118 0.0195 0.0252 20.5*** -23.1***
Panel D. Ranking y Credit o Private Credit o GDPGrowth n real value-added 0.0396 0.0240 0.0261 2.40** 1.19Growth n real gross output 0.0376 0.0249 0.0260 2.72** 1.19Growth n productivity 0.0166 0.0155 0.0164 -0.46 0.02Growth n production fficiency 0.0013 0.0002 0.0003 1.14 0.80Growth n economic efficiency -0.0008 0.0004 -0.0001 0.11 -0.53Technical hange 0.0108 0.0207 0.0240 19.77** -21.9***
Panel E Ranking y Average per Capita GDP
Growth n real value-added 0.0427 0.0230 0.0209 2.89*** 2.05**Growth n real gross output 0.0416 0.0253 0.0159 4.77** 2.97***Growth n productivity 0.0086 0.0131 0.0232 -3.23*** -1.51Growth n production fficiency 0.0008 0.0002 0.0002 -1.04 0.52Growth n economic efficiency -0.0015 0.0002 0.0007 -2.22* * -1.40Technical hange 0.0097 0.0198 0.0262 -26.4*** -31.6***
The sample is classified nto quartiles based on stock market urnover atio, market apitalization, omestic credit, reditto private ector and average per capita GDP, espectively, ver the period 1980-1995. Turnover atio s the value of totalshares of stock traded divided by market apitalization. tock market apitalization s the ratio of the total market alueof publicly raded equity o GDP. Domestic credit s the sum of assets held by the monetary uthority nd depositoryinstitutions xcluding nter-bank ransfer ivided by GDP. Credit o private ector equals claims against he private ectordivided by GDP. *, **,and *** ndicate ignificance at the 10%, 5%, and 1% evels, respectively.
measures of how well off an industry s. My empirical model is a four-way error
component random ffects) of the following form,
(5)GVcit=kFk+Zct+Ecit,
(6)GPcit=k+
whereGVcit
and GPcit are, respectively, he annual compounded growth rates ofreal value-added nd total factor productivity f industry in country c over periodt. c = 1,..., C; i = 1,..., Ic; and, t= 1,..., Tci. Fkt
is the kth financial unctionindicator variable for country c in period t. The financial function variables are
TURNOVER, MKTCAP, BANK, and PRIVATE. The control variable Zct repre-
8/8/2019 Tadesse - The Allocation and Monitoring Role of Capital Markets- Theory and International Evidence
http://slidepdf.com/reader/full/tadesse-the-allocation-and-monitoring-role-of-capital-markets-theory-and 16/31
Tadesse 715
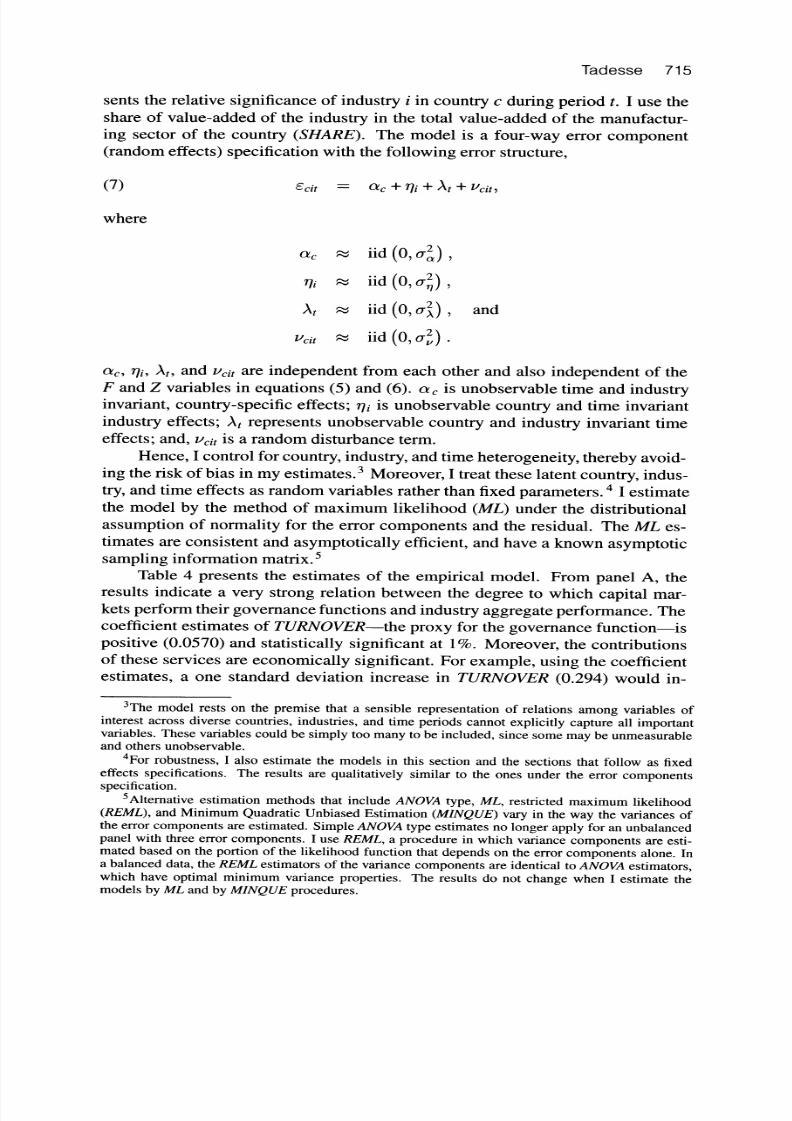
sents the relative significance of industry in country c during period t. I use theshare of value-added of the industry n the total value-added of the manufactur-ing sector of the country (SHARE). The model is a four-way error component(random ffects) specification with the following error structure,
(7) Ecit=c+Ti+At+vcit,
where
aciid(0,or),
qijiid(0,o2),
Attiid(0,0r), and
vcitr-iid(0,2)
ac, Ti, At, and vcit are independent rom each other and also independent of theF and Z variables n equations (5) and (6). ac is unobservable ime and industryinvariant, ountry-specific ffects; qi is unobservable ountry and time invariantindustry effects; At represents unobservable ountry and industry nvariant imeeffects; and, vcit is a random disturbance erm.
Hence, I control for country, ndustry, nd time heterogeneity, hereby avoid-ing the risk of bias in my estimates.3 Moreover, treat hese latent country, ndus-try, and time effects as random variables rather han fixed parameters.4 estimatethe model by the method of maximum ikelihood (ML) under the distributionalassumption of normality or the error components and the residual. The ML es-timates are consistent and asymptotically fficient, and have a known asymptoticsampling nformation matrix.5
Table 4 presents the estimates of the empirical model. From panel A, theresults indicate a
very strongrelation between the
degreeto which
capital mar-kets perform heir governance unctions and ndustry aggregate performance. Thecoefficient estimates of TURNOVER-the proxy for the governance unction-ispositive (0.0570) and statistically significant at 1%. Moreover, he contributionsof these services are economically significant. For example, using the coefficientestimates, a one standard deviation increase in TURNOVER 0.294) would in-
3The model rests on the premise that a sensible representation f relations among variables ofinterest across diverse countries, industries, and time periods cannot explicitly capture all importantvariables. These variables could be simply too many to be included, since some may be unmeasurable
and others unobservable.4For robustness, I also estimate the models in this section and the sections that follow as fixedeffects specifications. The results are qualitatively similar to the ones under the error componentsspecification.
5Alternative estimation methods that include ANOVA ype, ML, restricted maximum likelihood(REML), and Minimum Quadratic Unbiased Estimation MINQUE) vary in the way the variances ofthe error components are estimated. Simple ANOVA ype estimates no longer apply for an unbalancedpanel with three error components. I use REML, a procedure n which variance components are esti-mated based on the portion of the likelihood function that depends on the error components alone.
Ina balanced data, the REML stimators of the variance components are identical to ANOVA stimators,which have optimal minimum variance properties. The results do not change when I estimate themodels by ML and by MINQUE procedures.

8/8/2019 Tadesse - The Allocation and Monitoring Role of Capital Markets- Theory and International Evidence
http://slidepdf.com/reader/full/tadesse-the-allocation-and-monitoring-role-of-capital-markets-theory-and 17/31
716 Journal of Financial and Quantitative Analysis
crease the growth rate n real value-added of the average ndustry by about 1.68%
per annum.6
TABLE
Aggregate erformance nd CapitalMarket unctions
Dependent Panel A. Panel B.Variable Growth n Real Value-Added Growth n Real Gross Output
IndependentVariables I II Ill IV I II III IV
Turnover 0.0570*** 0.0358***ratio (0.015) (0.012)(TURNOVER)
Stock market 0.0161 0.0100capitalization (0.016) (0.013)(MKTCAP)
Domestic 0.0706*** 0.0854***credit (0.021) (0.018)(BANK)
Credit o private 0.0940*** 0.1049***sector (0.024) (0.021)(PRIVATE)
Industry's hare 0.6178*** 0.6008*** 0.6159*** 0.6187*** 0.3830*** 0.3718*** 0.4085*** 0.4106***in manufacturing (0.097) (0.098) (0.102) (0.102) (0.081) (0.080) (0.087) (0.087)(SHARE)
Error omponents
a2 0.0018*** 0.0013*** 0.0020*** 0.0015*** 0.0014*** 0.0011** 0.0019*** 0.0015***2 0.0007* 0.0007* 0.0006* 0.0006* 0.0005* 0.0004* 0.0004* 0.0004*
2 0.0008** 0.0009** 0.0009** 0.0009** 0.0006** 0.0007** 0.0005** 0.0006**
a2 0.0307*** 0.0317*** 0.0365*** 0.0366*** 0.0215*** 0.0213*** 0.0263*** 0.0263***
The parameter stimates are maximum ikelihood stimates of four-way rror omponent models containing andom oun-try, ndustry, nd time effects. The dependent variables are the annual compound growth ate in the real value-addedand the annual compound growth ate n the real gross output or each of the 10 industries n 38 countries or the period1980-1995. Turnover atio s the value of total shares of stocks traded divided by market apitalization. tock marketcapitalization s the ratio of the total market alue of publicly raded equity o GDP. Domestic credit s the sum of assetsheld by the monetary uthority nd depository nstitutions xcluding nter-bank ransfer ivided by GDP. Credit o privatesector equals claims against he private ector divided by GDP. Industry hare n manufacturing s calculated by dividingthe real output f the industry n the country by the total real output f the manufacturing ector of the country. Coefficientsof the intercept re not reported. Asymptotic tandard rrors re given in parentheses. *, **,and *** ndicate ignificanceat the 10%, 5%, and 1% evels, respectively.
While MKTCAP s not significant, he variables BANK and PRIVATE prox-ies for the allocation function of credit markets) are positive and statistically sig-nificant. The larger coefficient on PRIVATE eflects the fact that the variable sa tighter measure of capital mobilization to the private sector. A one standarddeviation ncrease n the size of domestic credit (BANK) would increase the GVof the average ndustry by 2.32% per annum, he same order of magnitude as theestimates of the effect of bank development on per capita GDP (2.52%) n Levine
(1998). Note, however, hat a one standard eviation (0.329) increase s approxi-mately the difference n size of domestic credit between India and the U.S.
Industries hat account for a larger portion of the country's manufacturinghave higher growth rates, which may reflect the effects of other sources of com-
parative advantage (i.e., other than the financial system). Developed countrieshave lower growth rates (the coefficient of log per capita GDP (not reported) s
6This is calculated by multiplying the coefficient estimate for TURNOVER rom Table 4 (i.e.,0.0570) by the standard deviation of TURNOVER rom Table 1 (i.e., 0.294).
8/8/2019 Tadesse - The Allocation and Monitoring Role of Capital Markets- Theory and International Evidence
http://slidepdf.com/reader/full/tadesse-the-allocation-and-monitoring-role-of-capital-markets-theory-and 18/31
8/8/2019 Tadesse - The Allocation and Monitoring Role of Capital Markets- Theory and International Evidence
http://slidepdf.com/reader/full/tadesse-the-allocation-and-monitoring-role-of-capital-markets-theory-and 19/31
718 Journal f Financial nd Quantitative nalysis
TABLE
5
Productivity
Growth
and
Capital
Market
Functions
Variable
I
II
Ill
IV
V
VI
VII
Vill
IX
X
XI
XII
Turnover
ratio
0.0389***
0.0344***
0.0393***
0.0385***
0.1073***
0.0393***
0.0933***
0.0348***
0.0335***
(TURNOVER)
(0.011)
(0.010)
(0.014)
(0.012)
(0.027)
(0.012)
(0.025)
(0.010)
(0.011)
Stock
market
capitalization
-0.0077
-0.0087
-0.0020
-0.0087
-0.0090
(MKTCAP)
(0.010)
(0.009)
(0.015)
(0.009)
(0.010)
Domestic
credit
0.0267**
-0.0016
0.0218
-0.0093
(BANK)
(0.012)
(0.013)
(0.015)
(0.011)
Credit
toprivate
sector
0.0426***
-0.0079
0.0222
-0.0007
(PRIVATE)
(0.015)
(0.017)
(0.020)
(0.016)
Interaction
-0.0190
-0.079***
-0.0934**
(0.034)
(0.028)
(0.038)
Industry's
share
inmanufacturing
0.2431**
0.2458***
0.2486***
0.2619***
0.2230***
0.2245***
0.2539***
0.2495***
0.2525***
0.2562***
0.2281**
0.2290***
(SHARE)
(0.072)
(0.073)
(0.072)
(0.073)
(0.071)
(0.071)
(0.072)
(0.071)
(0.072)
(0.072)
(0.069)
(0.070)
Error
Components
r2
0.0001
0.0001
<0.0001
<0.0001
<0.0001
<0.0001
0.0001
0.0001
0.0001
0.0001
<0.0001
<0.0001
S<00001
<0.0001
<0.0001
<0.0001
<0.0001
<0.0001
<0.0001
<0.0001
<0.0001
<0.0001
<0.0001
<0.0001
2
0.0008**
0.0008**
0.0009**
0.0009**
0.0007**
0.0007**
0.0008**
0.0008**
0.0008**
0.0008**
0.0007**
0.0007**
.2
0.0267***
0.0272***
0.0300***
0.0300***
0.0258***
0.0258***
0.0266***
0.0266***
0.0266***
0.0266***
0.0257***
0.0257***
The
parameter
estimates
are
maximum
likelihood
estimates
offour-way
errorcomponent
models
containing
random
country,
industry,
and
time
effects.
Thedependent
variable
isthe
annual
growth
intotal
factor
productivity
foreach
ofthe
10industries
in38countries
forthe
period
1980-1995.
Economic
efficiency
isinterms
of
deviation
ofactual
cost
tothe
optimal
minimum
cost
onastochastic
cost
frontier.
Turnover
ratio
isthe
value
oftotal
shares
ofstocks
traded
divided
bymarket
capitalization.
Stock
market
capitalization
isthe
ratio
ofthe
total
market
value
ofpublicly
traded
equity
toGDP.
Domestic
credit
isthe
sum
ofassets
held
bythe
monetary
authority
and
depository
institutions
excluding
inter-bank
transfer
divided
byGDP.
Credit
toprivate
sector
equals
claims
against
the
private
sector
divided
byGDP.
The
variable
interaction
represents
the
product
ofthe
two
other
variables
inthe
respective
model.
Industry
share
inmanufacturing
iscalculated
bydividing
the
real
output
ofthe
industry
inthe
country
bythetotal
real
output
ofthe
manufacturing
sector
ofthe
country.
Coefficients
ofthe
intercept
arenot
reported.
Asymptotic
standard
errors
are
given
inparentheses.
*,**,and
***indicate
significance
atthe
10%,
5%,and
1%
levels,
respectively.

8/8/2019 Tadesse - The Allocation and Monitoring Role of Capital Markets- Theory and International Evidence
http://slidepdf.com/reader/full/tadesse-the-allocation-and-monitoring-role-of-capital-markets-theory-and 20/31
Tadesse 719
the firm. I use a four-way error components (random effects) model of the fol-
lowing form,
(8)AECONEFFcit=-o+S1
(9)APRODEFFcit=/3o+:kFEct
where AECONEFF is the growth rate in the economic efficiency of industryof country c in period t, and APRODEFF is the growth rate in the productionefficiency of industry of country c in period t. Fk is the kth financial functionvariable or
countryc in
periodt. The finance function variables are
TURNOVER,MKTCAP, BANK, and PRIVATE. The model is a four-way random effects modelwith random country, ndustry, and time effects as specified in equation 7).
Table 6 reports a very strong association between the degree to which capitalmarkets perform G and improvements n industry economic efficiency (AECON-EFF). In Model I of Table 6, TURNOVER-the governance proxy-enters witha positive coefficient that s statistically different rom zero. The relation betweenMKTCAP and efficiency, while positive, lacks statistical significance (Model II),as does the relation between the size of the credit sector (BANK and PRIVATE)
and efficiency (Models III and IV).Higher TURNOVER s also accompanied by larger efficiency improvements
on the margin after controlling for the other financial proxies. In Model V inTable 6, TURNOVER s positive (0.0057) and significant at the 1% level, whileMKTCAP s not different from zero. Similarly, in Models VII and IX, whichinclude the proxies for capital mobilization by the credit sector, TURNOVER spositive (0.0063 and 0.0062) and significant at 1%. The coefficients on the othervariables all sharply and remain statistically nsignificant. For Models VIII andX, where TURNOVER nteracts with BANK and PRIVATE, he interaction erm
is negative and significant, ndicating again that the marginal efficiency effect ofmarket-based overnance s lower in countries where the credit sector s the dom-inant medium for capital provision. Finally, in Model XI, which includes BANKand MKTCAP, he governance proxy, is robustly positive (0.0060, significant at1%) and none of the other variables are marginally significant. The same resultholds when I use PRIVATE n Model XII. Thus, controlling for the allocationservices of both stock markets and the credit sector, the proxy for the governancefunction of markets adds value to efficiency growth.
The evidence is consistent with the hypothesis that the information aggre-gation and monitoring unction of markets determines he relative efficiency withwhich firms utilize resources. Increases in my proxy for G raise industry effi-ciency after controlling or unobservable ountry, ndustry, ime effects, and otherservices provided by the financial sector. The contributions f these services to in-dustry economic efficiency are economically arge. For example, using the coeffi-cient estimates n Model I, Table 6, a one standard eviation ncrease n the proxyfor the governance unction (0.294) would increase the growth rate in economicefficiency of the average ndustry by about 0.18% per annum. Accumulating overthe 15 years of the sample period, the average ndustry would be about 3% more

8/8/2019 Tadesse - The Allocation and Monitoring Role of Capital Markets- Theory and International Evidence
http://slidepdf.com/reader/full/tadesse-the-allocation-and-monitoring-role-of-capital-markets-theory-and 21/31
720 Journal of Financial and Quantitative Analysis
TABLE
6
Growth
inEconomic
Efficiency
and
Capital
Market
Functions
Variable
I
II
III
IV
V
VI
VII
VIII
IX
X
Xl
XII
Turnover
ratio
0.0061***
0.0057***
0.0077***
0.0063***
0.0181***
0.0062***
0.0152***
0.0060***
0.0057***
(TURNOVER)
(0.002)
(0.002)
(0.002)
(0.002)
(0.004)
(0.002)
(0.004)
(0.002)
(0.002)
Stock
market
capitalization
0.0003
-0.0002
0.0026
-0.0001
-0.0001
(MKTCAP)
(0.002)
(0.002)
(0.002)
(0.002)
(0.002)
Domestic
credit
0.0015
-0.0020
0.0021
-0.0023
(BANK)
(0.002)
(0.002)
(0.002)
(0.002)
Credit
toprivate
sector
0.0038
-0.0013
0.0038
-0.0005
(PRIVATE)
(0.002)
(0.003)
(0.003)
(0.003)
Interaction
-0.0077
-0.014***
0.0154***
(0.005)
(0.004)
(0.006)
Industry's
share
inmanufacturing
0.0236**
0.0243**
0.0283**
0.0289**
0.0221**
0.0226**
0.0256***
0.0251**
0.0255**
0.0260**
0.0244***
0.0245***
(SHARE)
(0.011)
(0.011)
(0.011)
(0.011)
(0.011)
(0.011)
(0.011)
(0.011)
(0.011)
(0.011)
(0.011)
(0.011)
Error
Components
A2
<0.001
<0.001
<0.001
<0.001
<0.001
<0.001
<0.001
<0.001
<0.001
<0.001
<0.001
A3
<0.001
<0.001
<0.001
<0.001
<0.001
<0.001
<0.001
<0.001
<0.001
<0.001
<0.001
2
<0.001**
<0.001**
<0.001**
<0.001**
<0.001**
<0.001**
<0.001**
<0.001**
<0.001**
<0.001**
<0.001**
<0.001**
2
0.0006***
0.0006***
0.0006***
0.0006***
0.0006***
0.0006***
0.0006***
0.0006***
0.0006***
0.0006***
0.0006***
0.0006***
The
parameter
estimates
are
maximum
likelihood
estimates
offour-way
error
component
models
containing
random
country,
industry,
and
time
effects.
The
dependent
variable
isthe
annual
compound
growth
rate
ineconomic
efficiency
foreach
of
the
10industries
in38countries
forthe
period
1980-1995.
Economic
efficiency
isinterms
ofdeviation
ofactual
cost
from
the
optimal
minimum
cost
onastochastic
cost
frontier.
Turnover
ratio
isthevalue
oftotal
shares
ofstocks
traded
divided
bymarket
capitalization.
Stock
market
capitalization
isthe
ratio
ofthetotal
market
value
ofpublicly
traded
equity
toGDP.
Domestic
credit
isthe
sum
ofassets
held
bythe
monetary
authority
and
depository
institutions
excluding
inter-bank
transfer
divided
by
GDP.
Credit
toprivate
sector
equals
claims
against
the
private
sector
divided
byGDP.
The
variable
interaction
represents
the
product
ofthe
two
other
variables
inthe
respective
model.
Industry
share
inmanufacturing
iscalculated
bydividing
thereal
output
ofthe
industry
inthecountry
by
thetotal
real
output
ofthe
manufacturing
sector
ofthe
country.
Coefficients
ofthe
intercept
are
not
reported.
Asymptotic
standard
errors
are
given
inparentheses.
*,**,and
***indicate
significance
atthe
10%,
5%,
and
1%
levels,
respectively.
8/8/2019 Tadesse - The Allocation and Monitoring Role of Capital Markets- Theory and International Evidence
http://slidepdf.com/reader/full/tadesse-the-allocation-and-monitoring-role-of-capital-markets-theory-and 22/31
Tadesse 721
efficient by the end of the study period, compared o the actual 15 years medianof 0.032%.
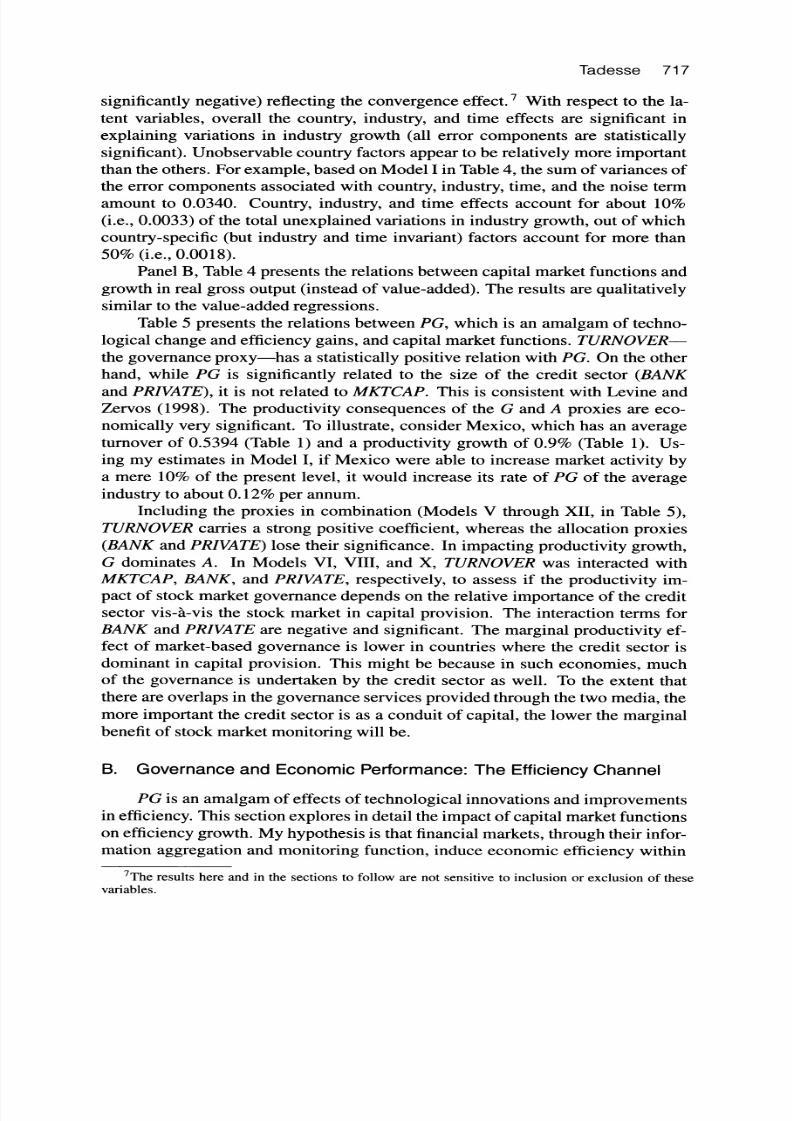
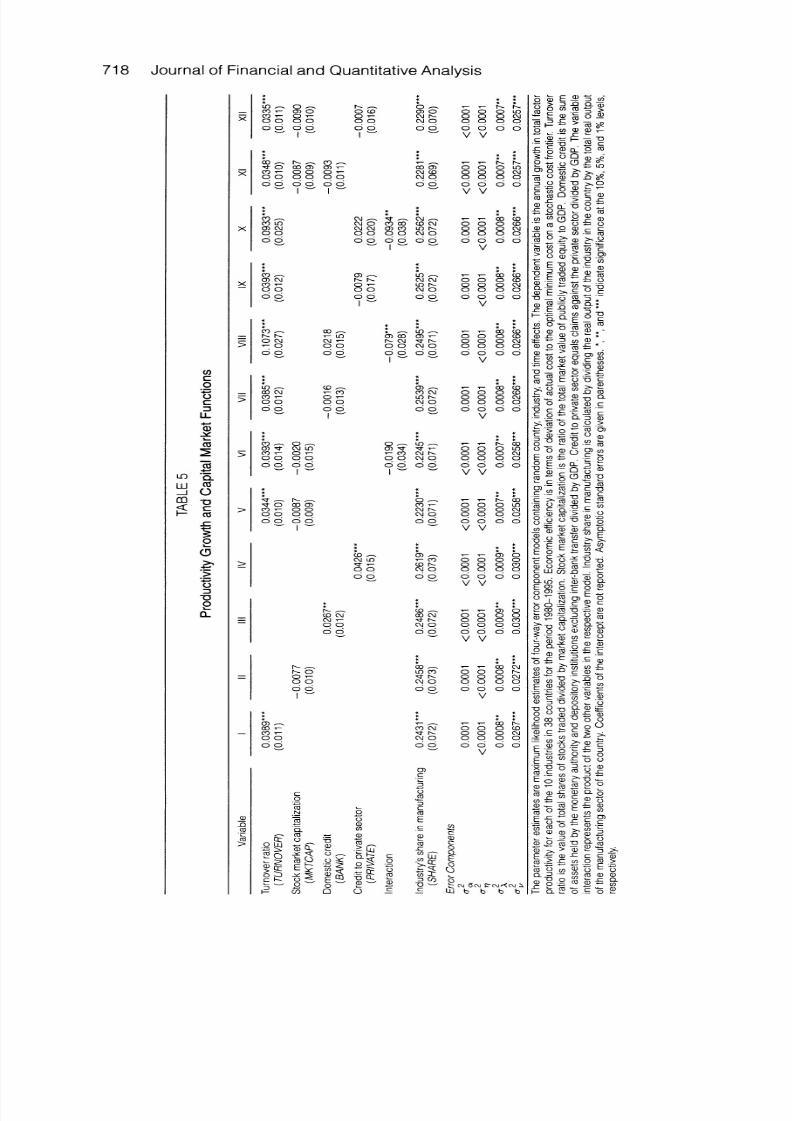
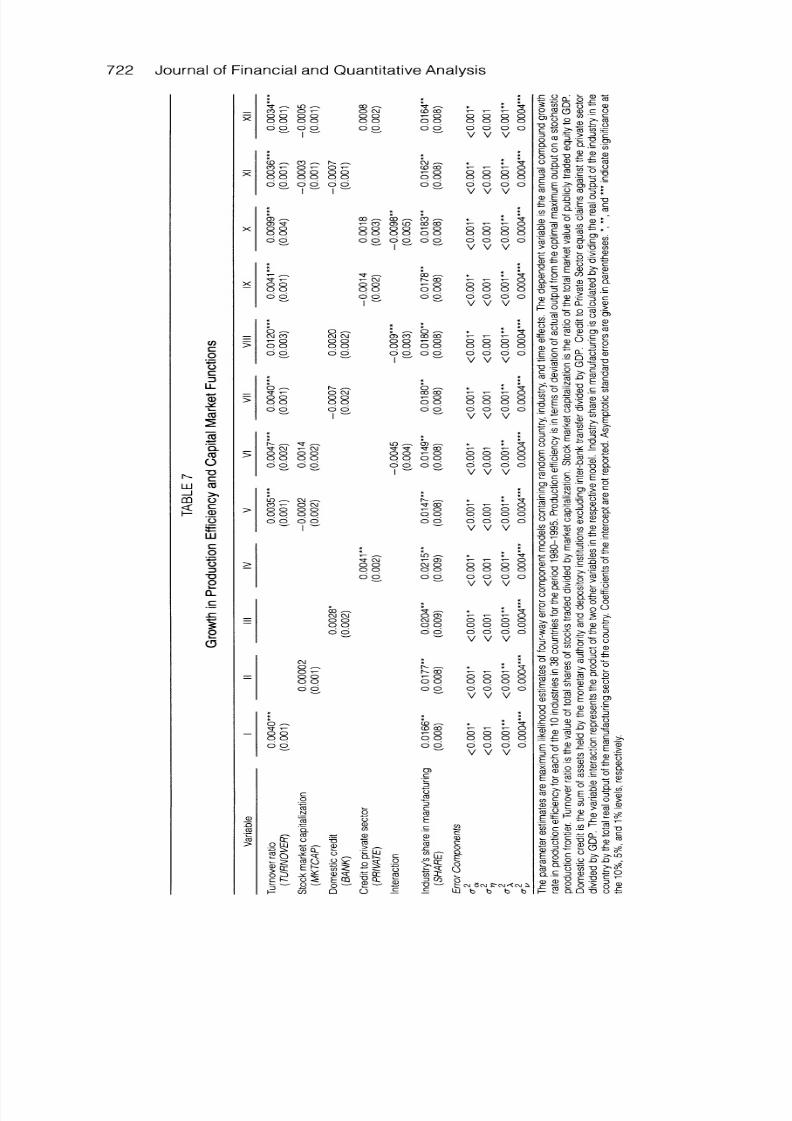
The results based on growth n production fficiency (APRODEFF), the al-ternative measure of efficiency, are presented n Table 7. In the individual regres-sions, TURNOVER gain has a relatively arge and positive effect on productionefficiency (0.004 and significant at 1%). MKTCAP as no effect on production f-ficiency. On the other hand, BANK and PRIVATE ave positive and significant co-efficients n the individual egressions but they lose significance once TURNOVERis controlled or. The results from Models V to XII in Table 7 are similar to theresults on economic efficiency (AECONEFF) in Table 6.
In light of the structural ifferences between developed and emerging coun-tries discussed in Section III.A, I estimate equations (8) and (9) on the subsam-ples of developed and emerging countries separately. The results (not reported)are qualitatively similar to Tables 6 and 7 for the total sample. TURNOVERis positively correlated with AECONEFF and none of the size variables enterthe regressions with statistical significance. Raising TURNOVER lso increasesAPRODEFF in both subsamples, while raising the size variables does not af-fect APRODEFF. The consistency of the results across the sub-groups providesadditional obustness.
C. Allocation nd Economic erformance: he Technological hangeChannel
This section explores in detail the impact of capital market unctions on TC.My hypothesis s that through A the financial system enables firms to adopt tech-nological innovations and inventions.
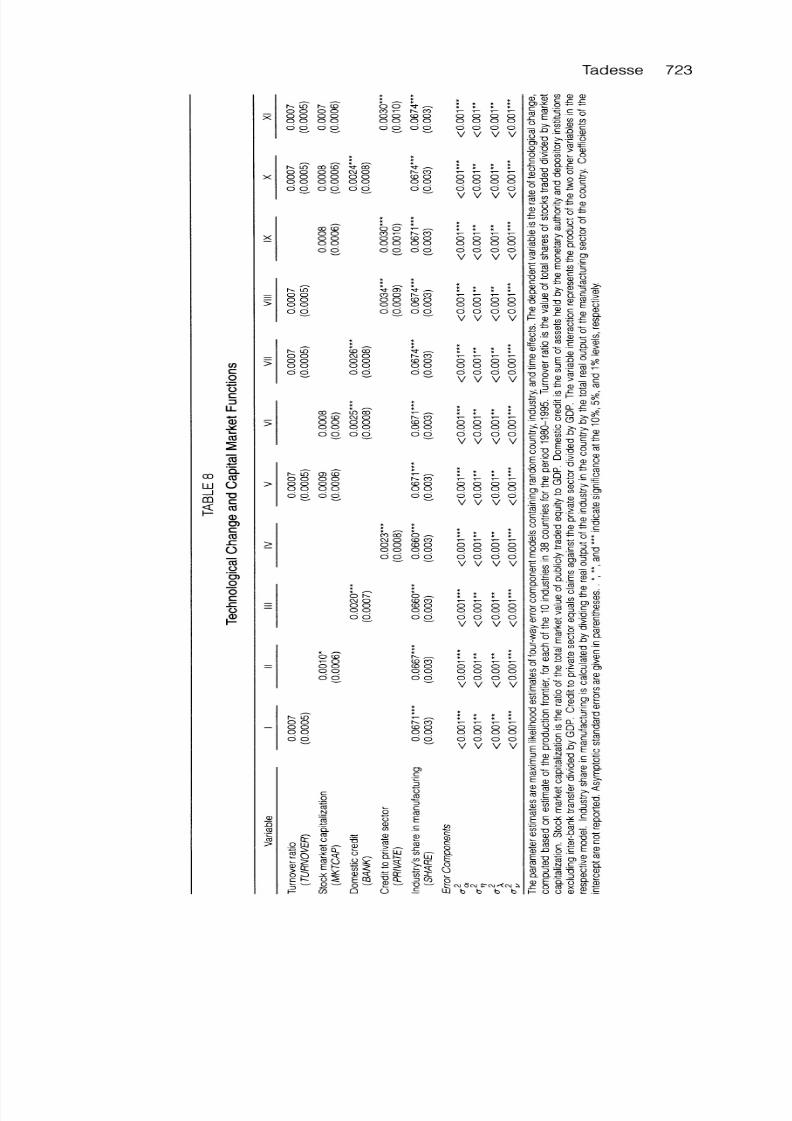
Table 8 presents the results in which I regress industry TC on proxies of Gand A. In the individual regressions, TURNOVER ails to be statistically signifi-cant. MKTCAP nters positively but s significant only at 10%. On the other hand,
both BANK and PRIVATE arry statistically significant positive coefficients, in-dicating a strong relation between the degree to which the supporting inancialsystem provides allocation services and the rate of technological change attain-able by industries. Raising the size of BANK by one standard deviation (0.329)increases the t of the average industry by about 0.07% per annum (double theeffect of MKTCAP).
In Model V of Table 8, where MKTCAP appears with TURNOVER, othvariables enter positively but both fail to be significant. In Models VI and VII,where TURNOVER nd MKTCAP are included, respectively, beside BANK,
TURNOVER nd MKTCAP ail to be significant while BANK is robustly posi-tive (0.0025 and 0.0026). Increasing the size of domestic credit raises the rateof TC even after controlling for effects of equity markets. Similarly, the coeffi-cients of PRIVATE re significantly positive in Models VIII and IX. Finally, inModels X and XI, where both TURNOVER nd MKTCAP appear n addition toBANK and PRIVATE, espectively, only the credit market variables (BANK andPRIVATE) emain statistically significant. Controlling or the governance and al-location services of the equity market, ncreasing A by the credit sector increasesthe rate of TC.
8/8/2019 Tadesse - The Allocation and Monitoring Role of Capital Markets- Theory and International Evidence
http://slidepdf.com/reader/full/tadesse-the-allocation-and-monitoring-role-of-capital-markets-theory-and 23/31
722 Journal of Financial and Quantitative Analysis
TABLE
7
Growth
inProduction
Efficiency
and
Capital
Market
Functions
Variable
I
II
III
IV
V
VI
VII
VIII
IX
X
Xi
XII
Turnover
ratio
0.0040***
0.0035***
0.0047***
0.0040***
0.0120***
0.0041***
0.0099***
0.0036***
0.0034***
(TURNOVER)
(0.001)
(0.001)
(0.002)
(0.001)
(0.003)
(0.001)
(0.004)
(0.001)
(0.001)
Stock
market
capitalization
0.00002
-0.0002
0.0014
-0.0003
-0.0005
(MKTCAP)
(0.001)
(0.002)
(0.002)
(0.001)
(0.001)
Domestic
credit
0.0028*
-0.0007
0.0020
-0.0007
(BANK)
(0.002)
(0.002)
(0.002)
(0.001)
Credit
toprivate
sector
0.0041*
-0.0014
0.0018
0.0008
(PRIVATE)
(0.002)
(0.002)
(0.003)
(0.002)
Interaction
-0.0045
-0.009***
-0.0098**
(0.004)
(0.003)
(0.005)
Industry'
share
inmanufacturing
0.0166**
0.0177**
0.0204**
0.0215**
0.0147**
0.0149**
0.0180**
0.0180**
0.0178**
0.0183**
0.0162*
0.0164"*
(SHARE)
(0.008)
(0.008)
(0.009)
(0.009)
(0.008)
(0.008)
(0.008)
(0.008)
(0.008)
(0.008)
(0.008)
(0.008)
Error
Components
2
<0.001"
<0.001*
<0.001
<0.001*.
<0.001
<0.001<.
<0.001
<
0.001
"
<0.001*
<0.001"
<0.001"
<0.001*
2
<0.001
<0.001
<0.001
<0.001
<0.001
<0.001
<0.001
<0.001
<0.001
<0.001
<0.001
<0.001
.77 o2
<0.001**
<0.001**
<0.001**
<0.001**
<0.001**
<0.001**
<0.001**
<0.001**
<0.001**
<0.001**
<0.001**
<0.001*
2
0.0004***
0.0004***
0.0004***
0.0004***
0.0004***
0.0004***
0.0004***
0.0004***
0.0004***
0.0004***
0.0004***
0.0004***
The
parameter
estimates
are
maximum
likelihood
estimates
offour-way
error
component
models
containing
random
country,
industry,
and
time
effects.
The
dependent
variable
isthe
annual
compound
growth
rate
inproduction
efficiency
foreach
of
the
10industries
in38countries
forthe
period
1980-1995.
Production
efficiency
isinterms
ofdeviation
ofactual
output
from
the
optimal
maximum
output
on
astochastic
production
frontier.
Turnover
ratio
isthe
value
oftotal
shares
ofstocks
traded
divided
bymarket
capitalization.
Stock
market
capitalization
isthe
ratio
ofthe
total
market
value
ofpublicly
traded
equity
toGDP.
Domestic
credit
isthe
sum
ofassets
held
bythe
monetary
authority
and
depository
institutions
excluding
inter-bank
transfer
divided
byGDP.
Credit
toPrivate
Sector
equals
claims
against
the
private
sector
divided
byGDP.
The
variable
interaction
represents
the
product
ofthe
twoother
variables
inthe
respective
model.
Industry
share
inmanufacturing
iscalculated
bydividing
the
real
output
oftheindustry
inthe
country
bythetotal
real
output
ofthemanufacturing
sector
ofthe
country.
Coefficients
ofthe
intercept
are
not
reported.
Asymptotic
standard
errors
are
given
inparentheses.
*,**,and
***indicate
significance
at
the
10%,
5%,
and
1%
levels,
respectively.
8/8/2019 Tadesse - The Allocation and Monitoring Role of Capital Markets- Theory and International Evidence
http://slidepdf.com/reader/full/tadesse-the-allocation-and-monitoring-role-of-capital-markets-theory-and 24/31
Tadesse 723
TABLE
8
Technological
Change
and
Capital
Market
Functions
Variable
I
II
Ill
IV
V
VI
VII
VIll
IX
X
Xl
Turnover
ratio
0.0007
0.0007
0.0007
0.0007
0.0007
0.0007
(TURNOVER)
(0.0005)
(0.0005)
(0.0005)
(0.0005)
(0.0005)
(0.0005)
Stock
market
capitalization
0.0010*
0.0009
0.0008
0.0008
0.0008
0.0007
(MKTCAP)
(0.0006)
(0.0006)
(0.006)
(0.0006)
(0.0006)
(0.0006)
Domestic
credit
0.0020***
0.0025***
0.0026***
0.0024***
(BANK)
(0.0007)
(0.0008)
(0.0008)
(0.0008)
Credit
toprivate
sector
0.0023***
0.0034***
0.0030***
0.0030***
(PRIVATE)
(0.0008)
(0.0009)
(0.0010)
(0.0010)
Industry's
share
inmanufacturing
0.0671***
0.0667***
0.0660***
0.0660***
0.0671***
0.0671***
0.0674***
0.0674***
0.0671***
0.0674***
0.0674***
(SHARE)
(0.003)
(0.003)
(0.003)
(0.003)
(0.003)
(0.003)
(0.003)
(0.003)
(0.003)
(0.003)
(0.003)
Error
Components
o2
<0.001**
<0.001**
<0.001**
<0.001**
<0.001**
<0.001***
<0.001**
<0.001**
<0.001***
<0.001"**
<0.001"**
2
<0.001**
<0.001**
<0.001*
**
<0.001**
<
**
<0.001**
<0.001*
<0.001**
<0.001**
<0.001**
<0.001**
or2
<0.001**
<0.001**
<0.001**
<0.001**
<0.001**
<0.001**
<0.001**
<0.001*
<0.001*
<0.001*
<0.001*
o2
<0.001***
<0.001*
**
<0.001***
<0.001***
<0.001***
<0.001*
**
<0.001*
**
0.001**
<
0.001**<
<0.001**
The
parameter
estimates
are
maximum
likelihood
estimates
offour-way
error
component
models
containing
random
country,
industry,
and
time
effects.
Thedependent
variable
isthe
rate
oftechnological
change,
computed
based
onestimate
ofthe
production
frontier,
foreach
ofthe
10industries
in38countries
forthe
period
1980-1995.
Turnover
ratio
isthe
value
oftotal
shares
ofstocks
traded
divided
bymarket
capitalization.
Stock
market
capitalization
isthe
ratio
ofthe
total
market
value
ofpublicly
traded
equity
toGDP.
Domestic
credit
isthe
sum
ofassets
held
bythe
monetary
authority
and
depository
institutions
excluding
inter-bank
transfer
divided
byGDP.
Credit
toprivate
sector
equals
claims
against
the
private
sector
divided
byGDP.
The
variable
interaction
represents
the
product
ofthe
two
other
variables
inthe
respective
model.
Industry
share
inmanufacturing
iscalculated
bydividing
the
real
output
ofthe
industry
inthecountry
bythe
total
real
output
ofthe
manufacturing
sector
ofthe
country.
Coefficients
ofthe
intercept
are
not
reported.
Asymptotic
standard
errors
are
given
inparentheses.
.,**,and
***indicate
significance
at
the
10%,
5%,
and
1%
levels,
respectively.
8/8/2019 Tadesse - The Allocation and Monitoring Role of Capital Markets- Theory and International Evidence
http://slidepdf.com/reader/full/tadesse-the-allocation-and-monitoring-role-of-capital-markets-theory-and 25/31
724 Journal of Financial and Quantitative Analysis
Industries hat account for a larger portion of a country's manufacturing e-alize higher TC, which may reflect the effects of other sources of comparativeadvantage. Also, not surprisingly, ndustries n developed countries achieve a
higher rate of TC.Given the differences between developed and emerging countries discussed
in Section III.A, I estimate the model on the subsamples of developed and emerg-ing countries separately. Again the results (not reported) are qualitatively imilarto those in Table 8 for the total sample. Increasing BANK or PRIVATE-the prox-ies for A-increases TC in both subsamples, whereas TURNOVER nd MKTCAPdo not explain variation n TC. As would be expected, the impact of mobilizationin emerging markets appears o be larger han that n developed countries. While
statistically significant, he coefficients for BANK and PRIVATE n emerging mar-kets (0.0048 and 0.0087) are arger han those for the developed countries 0.0019and 0.0020, respectively).
Overall, the results are consistent with the hypotheses. First, industries hatare supported by financial systems with greater capital mobilization ability ex-hibit faster rates of TC. This is true even after controlling for G of the capi-tal markets. Second, in its role as capital mobilizer, the credit sector appears ohave stronger and larger mpact on TC than stock markets. The effects of BANKand PRIVATE n TC remain significantly positive even in models that include
MKTCAP. Third, the role of markets as providers of G appears to have littleimpact on TC. TURNOVER nvariably ails to explain differences n TC.
V. Robustness
A. Accounting isclosure nd Efficiency
I use market urnover s my main proxy for information roduction nd mon-
itoring. An alternative way to measure he degree of information low in a capitalmarket s to look at the accounting standards hat determine he amount and qual-ity of disclosure by firms trading n the market. I use an index of accountingreporting quality for different countries developed by the Center or InternationalFinancial Analysis and Research. The index rates the annual reports of at leastthree companies in each country based on the inclusion or omission of 90 re-
portable tems. The sample of companies used in each country is designed to
represent a cross-section of representative ndustries. The index can be viewed asa measure of the degree of sophistication and efficiency of the capital market n
processing nformation. Also, more disclosure as measured by the index indicatesthe availability of public information hat might be associated with some of the
governance unctions of markets intend to measure. The index ranges from 0 to90, the higher score indicating more mandated public disclosure. For my sample(I have the index only for 31 countries), the range is from 24 to 83, the lowest
registered by Egypt and the highest by Sweden. The U.S. scores 71 on this index.More developed countries have higher accounting standards (correlation with log
per capita GDP is 0.56); yet, there are exceptions. The U.S. (71), Norway (74),Canada (74), and Australia (75) score less than Malaysia (78); whereas the Philip-
8/8/2019 Tadesse - The Allocation and Monitoring Role of Capital Markets- Theory and International Evidence
http://slidepdf.com/reader/full/tadesse-the-allocation-and-monitoring-role-of-capital-markets-theory-and 26/31
Tadesse 725
pines (65) and Mexico (60) score as high as Italy (65), Japan 62), and Germany(62).
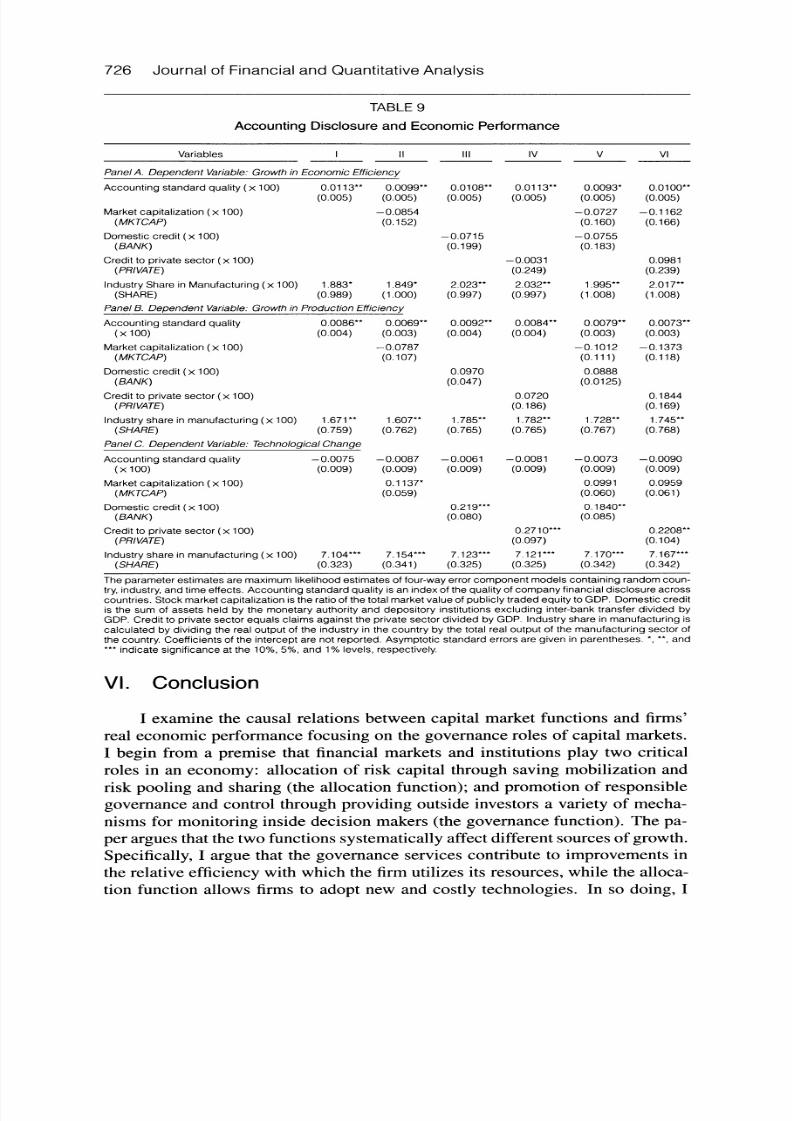
Table 9 presents the results using this index, instead of TURNOVER, s aproxy for G. G as measured by the index of accounting quality s strongly relatedwith improvements n economic as well as production fficiency. The coefficientestimates of the accounting quality index in panels A and B are positive (around0.0001) and statistically significant at 5%. On the other hand, the index is notimportant n explaining differences in TC (panel C). The index is also positiveand significant on the margin n Models II through VI in which I control for the
capital mobilization proxies. Thus, after controlling or capital provision n equitymarkets (Models II and V of Table 9) and in credit markets (Models III, IV, V,and VI), higher accounting tandard uality s related o larger gains in efficiency.Also, consistent with the earlier results, none of the proxies for allocation appearto be associated with efficiency gains. Thus, market-based overnance s stronglyrelated to firm efficiency, whether governance s measured n terms of level ofmarket activity or in terms of quality of accounting disclosure.
B. Causality ssues
So far, I have examined the association between economic performance ndthe degree to which capital markets discharge G and A. I measure he latter usingvariables hat I assume to be exogenous and predetermined. t may be argued hatmy proxies for capital market unctions are not exogenous enough in that capitalmarket development may simply be a leading ndicator ather han a causal factor.In an attempt to isolate the exogenous component of capital market functions,Table 10 uses two sets of variables as instruments: ndices of investor-protectinglegal codes and country of legal origin. La Porta et al. (1997) argues that legalprotections and a country's egal origin determine inancial development and that
these, in turn, are primarily determined by a country's colonial history. Hence,the two sets of variables would be ideal instruments or capital market unctionsin that while the variables are strongly correlated with my proxies, they do notdirectly correlate with economic performance. Levine and Zervos (1998) usethese variables as instruments or financial development.
In Model I of Table 10, TURNOVER redetermined y the extent of legalprotection afforded o investors has a positive, statistically arge mpact on growthin economic efficiency (panel A), and on growth n production fficiency (panelB). The exogenous component of the governance proxy is robustly positivelyrelated to growth n economic and production fficiency on the margin after con-trolling or stock market ize and the size of the credit sector. Similarly, he size ofthe credit sector predetermined y the extent of legal protection s strongly relatedto TC (panel C). In Model II, the component of the governance proxy predeter-mined by legal origin has a significant positive impact on growth in economicefficiency (panel A), and on growth in production efficiency (panel B), as doesthe allocation proxy on the rate of TC (panel C). Hence, the relations betweengovernance and efficiency, and allocation and technological change identified sofar are less likely to be explained by endogeneity.
8/8/2019 Tadesse - The Allocation and Monitoring Role of Capital Markets- Theory and International Evidence
http://slidepdf.com/reader/full/tadesse-the-allocation-and-monitoring-role-of-capital-markets-theory-and 27/31
726 Journal of Financial and Quantitative Analysis
TABLE
Accounting isclosure nd Economic erformance
Variables I II III IV V VI
Panel A. Dependent Variable: rowth n Economic Efficiency
Accounting tandard quality x 100) 0.0113** 0.0099** 0.0108** 0.0113** 0.0093* 0.0100**(0.005) (0.005) (0.005) (0.005) (0.005) (0.005)
Market apitalization x 100) -0.0854 -0.0727 -0.1162(MKTCAP) (0.152) (0.160) (0.166)
Domestic redit x 100) -0.0715 -0.0755(BANK) (0.199) (0.183)
Credit o private ector (x 100) -0.0031 0.0981(PRIVATE) (0.249) (0.239)
Industry hare n Manufacturing x 100) 1.883* 1.849* 2.023** 2.032** 1.995** 2.017**
(SHARE) (0.989) (1.000) (0.997) (0.997) (1.008) (1.008)Panel B. Dependent Variable: rowth n Production fficiency
Accounting tandard quality 0.0086** 0.0069** 0.0092** 0.0084** 0.0079** 0.0073**(x 100) (0.004) (0.003) (0.004) (0.004) (0.003) (0.003)
Market apitalization x 100) -0.0787 -0.1012 -0.1373(MKTCAP) (0.107) (0.111) (0.118)
Domestic redit x 100) 0.0970 0.0888(BANK) (0.047) (0.0125)
Credit o private ector (x 100) 0.0720 0.1844(PRIVATE) (0.186) (0.169)
Industry hare n manufacturing x 100) 1.671* 1.607** 1.785** 1.782** 1.728** 1.745**(SHARE) (0.759) (0.762) (0.765) (0.765) (0.767) (0.768)
Panel C.Dependent
Variable:echnological hange
Accounting tandard quality -0.0075 -0.0087 -0.0061 -0.0081 -0.0073 -0.0090(x 100) (0.009) (0.009) (0.009) (0.009) (0.009) (0.009)
Market apitalization x 100) 0.1137* 0.0991 0.0959(MKTCAP) (0.059) (0.060) (0.061)
Domestic redit x 100) 0.219*** 0.1840**(BANK) (0.080) (0.085)
Credit o private ector (x 100) 0.2710*** 0.2208**(PRIVATE) (0.097) (0.104)
Industry hare n manufacturing x 100) 7.104*** 7.154*** 7.123*** 7.121*** 7.170*** 7.167***(SHARE) (0.323) (0.341) (0.325) (0.325) (0.342) (0.342)
The parameter stimates are maximum ikelihood stimates of four-way rror omponent models containing andom oun-try, ndustry, nd time effects. Accounting tandard uality s an index of the quality fcompany inancial isclosure across
countries. Stock market apitalization s the ratio f the total market alue of publicly raded quity o GDP. Domestic reditis the sum of assets held by the monetary uthority nd depository nstitutions xcluding nter-bank ransfer ivided byGDP. Credit o private ector equals claims against he private ector divided by GDP. Industry hare n manufacturing scalculated by dividing he real output of the industry n the country by the total real output of the manufacturing ector ofthe country. Coefficients f the intercept re not reported. Asymptotic tandard rrors re given in parentheses. *, **,and*** ndicate ignificance t the 10%, 5%, and 1% evels, respectively.
VI. Conclusion
I examine the causal relations between capital market unctions and firms'real economic performance ocusing on the governance roles of capital markets.
I begin from a premise that financial markets and institutions play two criticalroles in an economy: allocation of risk capital through saving mobilization andrisk pooling and sharing (the allocation function); and promotion of responsiblegovernance and control through providing outside investors a variety of mecha-nisms for monitoring nside decision makers (the governance unction). The pa-per argues hat the two functions systematically affect different ources of growth.Specifically, I argue that the governance services contribute o improvements nthe relative efficiency with which the firm utilizes its resources, while the alloca-tion function allows firms to adopt new and costly technologies. In so doing, I

8/8/2019 Tadesse - The Allocation and Monitoring Role of Capital Markets- Theory and International Evidence
http://slidepdf.com/reader/full/tadesse-the-allocation-and-monitoring-role-of-capital-markets-theory-and 28/31
Tadesse 727
TABLE 0
Capital Market Functions and Economic Performance: nstrumental ariables
Variables 1 II
Panel A. Dependent Variable: rowth n Economic EfficiencyTurnover atio 0.0187*** 0.0171**
(TURNOVER) (0.007) (0.009)Market apitalization 0.0008 -0.0030
(MKTCAP) (0.004) (0.004)Domestic credit 0.0081 -0.0099
(BANK) (0.006) (0.009)
Panel B Dependent Variable: rowth n Production fficiencyTurnover atio 0.0105** 0.0149*
(TURNOVER) (0.005) (0.008)
Market apitalization 0.0018 -0.0019(MKTCAP) (0.003) (0.003)Domestic redit 0.0079 -0.0108
(BANK) (0.005) (0.008)Panel C Dependent Variable: echnological hangeTurnover atio 0.0096 0.0112
(TURNOVER) (0.012) (0.008)Market apitalization 0.0179* -0.0019
(MKTCAP) (0.010) (0.005)Domestic credit 0.0371*** 0.0241***
(BANK) (0.009) (0.008)The parameter stimates are maximum ikelihood stimates of four-way rror omponent models containing andom oun-
try, ndustry,nd time effects. In Model , he instruments re an index of shareholder's
egal rights providedn the
country'slegal codes, an index of legal rights protecting ebt holders, udicial fficiency, nd an index of rule of law rom La Porta tal. (1998). In Model I, he instruments re the origin f a country's egal system. The egal origin ariables nclude dummyvariables or English origin, French origin, German origin, and Scandinavian rigin rom La Porta et al. (1998). Industryshare n manufacturing s calculated by dividing he real output f the industry n the country by the total real output of themanufacturing ector of the country. Coefficients f the intercept re not reported. Asymptotic tandard rrors re givenin parentheses. *, **,and ***indicate ignificance t the 10%, 5%, and 1% evels, respectively.
trace the mechanisms hrough which financial development nfluences economicgrowth.
Based on industry-level data for 10 manufacturing ndustries across 38 coun-
tries from 1980-1995, I find evidence consistent with these hypotheses. First, Ifind that both governance and allocation are significant determinants f real out-put growth and productivity. Second, I report that the impact of governance onproductivity dominates the impact of allocation. Third, I find that while gover-nance works through he channel of improving economic efficiency to promoteproductivity, he allocation function affects the technological change componentof productivity.
The finding of a strong association between economic performance nd theeffectiveness of financial markets suggests the importance of financial develop-ment as a policy for accelerating economic growth. It provides evidence thatfinancial sector policies that promote a financial market's functional capacitieslead to better real economic performance. t points out the incompleteness of tra-ditional development strategies that exclusively focus on real sector reforms toinduce economic development.
Furthermore, hrough inking the multiple functions of the financial systemto the primal sources of economic performance, he study underscores he impor-tance of a functional perspective n guiding financial sector policies. The studydocuments hat the different unctions of the financial system play distinct roles
8/8/2019 Tadesse - The Allocation and Monitoring Role of Capital Markets- Theory and International Evidence
http://slidepdf.com/reader/full/tadesse-the-allocation-and-monitoring-role-of-capital-markets-theory-and 29/31
8/8/2019 Tadesse - The Allocation and Monitoring Role of Capital Markets- Theory and International Evidence
http://slidepdf.com/reader/full/tadesse-the-allocation-and-monitoring-role-of-capital-markets-theory-and 30/31
Tadesse 729
From equation (A-1), the estimate of the rate of technological change, TC, for industry incountry c for period t is given by
(A-3)TCcit
Using the predicted value of the inefficiency term (pci(t)) from equation (A-1), thelevel of production efficiency of industry of country c during period t is
(A-4) PRODEFFcit=e-uci(t)
PRODEFF represents he ratio of actual output to the maximum attainable output if theindustry were efficient, holding the technology (i.e., the production rontier) and the levelof input usage constant. Its value ranges from 0 to 1 (i.e., 100% efficient). Growth inproduction efficiency (APRODEFF) for industry i in country c over period (t) is thengiven by
(A-5) APRODEFF=0nPRODEFF
Using the production function framework, his estimate only measures productionefficiency. It does not account for the possible error of the firm n choosing an appropriateinput mix given relative prices (i.e., price inefficiency). I estimate an economic efficiencyscore that reflects both production and price efficiencies based on the dual stochastic costfrontier.9,10 fter estimating a translog cost function analogous to equation (A-1), the levelof economic efficiency for industry , in country c, and in period t is
(A-6) ECONEFFci(t)=e-Oci(t)
where Oci(t) is a one-sided random variable denoting the degree of economic inefficiency.Equation A-6) is the ratio of the minimum cost on the frontier o actual cost incurred andranges in value from 0 (inefficient) to 100% (efficient). Growth in economic efficiency(AECONEFF) is then given by
(A-7)AECONEFFci(t)=InECONEFFi-(t)
ReferencesAllen, F. "Stock Markets ndResource llocation." nCapital Markets nd Financial ntermediation,
C. Mayer ndX. Vives, ds. Cambridge niv.Press 1993).Bencivenga, .;B. D. Smith; nd M. S. Ross. "Transactions osts, Technological hoice, and En-
dogenous Growth." ournal f Economic heory, 7 (1995), 153-177.Bhide, A. "The Hidden Cost of Stock Market iquidity." ournal f Financial conomics, 4 (1993),
31-51.Bresnahan, .; P. Milgrom; nd J. Paul. "The Real Output f Stock Exchange." n Output Measure-
ment n the Service ectors,Z. Griliches, d. Chicago, L:Univ. of Chicago ress 1992).Demirguc-Kunt, ., and V. Maksimovic. Law, inance nd Firm Growth." ournal f Finance, 3(1998), 2107-2137.
9A cost function maps cost-minimizing oints where relative prices are set to equal marginalproductivities. his s a result f an optimization roblem n which he firmminimizes ost (choosinginput evels) subject o the technological onstraints epresented y the production unction. Thus,a production nit on the cost frontier s both technically nd allocatively fficient. The deviationof actual cost from the cost frontier, holding output evel and input prices constant, would naturallymeasure he amount f total economic nefficiency.
10Duality theory suggests that under certain regularity conditions, if producers pursue a cost-minimizing bjective, he production unction an be uniquely epresented ya dual cost function.
8/8/2019 Tadesse - The Allocation and Monitoring Role of Capital Markets- Theory and International Evidence
http://slidepdf.com/reader/full/tadesse-the-allocation-and-monitoring-role-of-capital-markets-theory-and 31/31


![Financial markets and the allocation of capital - [email protected]](https://static.fdocuments.in/doc/165x107/62073ec649d709492c2f702f/financial-markets-and-the-allocation-of-capital-emailprotected.jpg)