Tactical Playbook - Waverly Advisors Playbook, Week of 16 February 2016 2016 Waverly dvisors, ......
17
©2016 Waverly Advisors, LLC. All Rights Reserved. Please review disclosures on the final page of this report. Market context and trade ideas for the active trader Waverly Advisors, LLC Adam Grimes Chief Investment Officer [email protected] [email protected] Contact Sales: (607) 684-5300 [email protected] www.waverlyadvisors.com Tactical Playbook Week of 16 February 2016 Contents Market Insight 2 U.S. Equities 3 Equity Indexes: Short-Term 5 U.S. Equity Sectors 6 U.S. Individual Stocks 7 Global Stocks 9 Rates & FX 10 Commodities 12 Discretionary Trade Ideas 14 Relative Strength Rankings 15 Equity Screens & Models 16 Disclaimers & Contact 17 Market Return σSpike Kpos Trend Volatility USA (0.81%) (0.3σ) 15 Bear Volatile Europe 2.20% 0.8σ 14 Bear Volatile Asia (1.76%) (0.6σ) 8 Bear Volatile Developed (1.91%) (0.7σ) 7 Bear Normal Emerging (2.30%) (0.5σ) 11 Bear Normal 30 Yr Tr (0.66%) (0.5σ) 92 Bull/Neutral Normal Euro (0.72%) (0.5σ) 66 Bull/Neutral Normal Yen 1.08% 0.7σ 14 Bear/Neutral Volatile Gold (2.52%) (1.0σ) 91 Bull/Neutral Normal Crude 4.82% 0.8σ 9 Bear Normal Last Week’s Performance Market Short term (< 1 month) Int. Term (2-12 months) USA Up Europe Asia Developed Emerging 10 Yr Tr Euro Yen Up Gold Up Crude Down Major Market Direction and Bias ▶ Global stocks were soſt last week, as nearly all major indexes booked significant losses. EM stocks are showing some outper- formance, but this is most likely mean reversion and not a sign to focus on these countries. ▶ Watch for a rally in stocks this week. e strength of the rally will give good information about character and tone of this market. A sharp rally, recovering much of the recent damage, is somewhat unlikely, but would be an extremely bullish signal. Do not fade a strong rally in stocks. ▶ We have no adjustments to sector biases or allocations, but suggest that swing traders may wish to focus on longs in defen- sive sectors this week. ▶ Longer-term bullish patterns are intact in stocks, but short-term tactical risks demand attention. ▶ e US Dollar continues to slide, and now appears to be in a year-long trading range. Here, too, the longer-term bullish setup is still intact, but a retest of the lower end of the range is likely. ▶ Sharp upside volatility in gold last week, but be careful—this move could indicate a short-term momentum extreme, likely leading to a setback and reversal. If there is a spot to buy gold, it will require a few days to stabilize and set up a good pull- back. Long positons are possible, but highly speculative at this point in time. ▶ Downtrends in crude oil and related stocks are intact. No reason to look to fade this trend at this time.
Transcript of Tactical Playbook - Waverly Advisors Playbook, Week of 16 February 2016 2016 Waverly dvisors, ......
©2016 Waverly Advisors, LLC. All Rights Reserved. Please review disclosures on the final page of this report.
Market context and trade ideas for the active trader
Waverly Advisors, LLC
Adam GrimesChief Investment [email protected]@waverlyadvisors.com
Contact Sales: (607) [email protected]
Tactical PlaybookWeek of 16 February 2016
Contents
Market Insight 2U.S. Equities 3Equity Indexes: Short-Term 5U.S. Equity Sectors 6U.S. Individual Stocks 7Global Stocks 9Rates & FX 10Commodities 12Discretionary Trade Ideas 14Relative Strength Rankings 15Equity Screens & Models 16Disclaimers & Contact 17
Market Return σSpike Kpos Trend VolatilityUSA (0.81%) (0.3σ) 15 Bear VolatileEurope 2.20% 0.8σ 14 Bear VolatileAsia (1.76%) (0.6σ) 8 Bear VolatileDeveloped (1.91%) (0.7σ) 7 Bear NormalEmerging (2.30%) (0.5σ) 11 Bear Normal30 Yr Tr (0.66%) (0.5σ) 92 Bull/Neutral NormalEuro (0.72%) (0.5σ) 66 Bull/Neutral NormalYen 1.08% 0.7σ 14 Bear/Neutral VolatileGold (2.52%) (1.0σ) 91 Bull/Neutral NormalCrude 4.82% 0.8σ 9 Bear Normal
Last Week’s Performance
MarketShort term (< 1 month)
Int. Term (2-12 months)
USA UpEuropeAsiaDevelopedEmerging10 Yr TrEuroYen UpGold UpCrude Down
Major Market Direction and Bias
▶ Global stocks were soft last week, as nearly all major indexes booked significant losses. EM stocks are showing some outper-formance, but this is most likely mean reversion and not a sign to focus on these countries.
▶ Watch for a rally in stocks this week. The strength of the rally will give good information about character and tone of this market. A sharp rally, recovering much of the recent damage, is somewhat unlikely, but would be an extremely bullish signal. Do not fade a strong rally in stocks.
▶ We have no adjustments to sector biases or allocations, but suggest that swing traders may wish to focus on longs in defen-sive sectors this week.
▶ Longer-term bullish patterns are intact in stocks, but short-term tactical risks demand attention.
▶ The US Dollar continues to slide, and now appears to be in a year-long trading range. Here, too, the longer-term bullish setup is still intact, but a retest of the lower end of the range is likely.
▶ Sharp upside volatility in gold last week, but be careful—this move could indicate a short-term momentum extreme, likely leading to a setback and reversal. If there is a spot to buy gold, it will require a few days to stabilize and set up a good pull-back. Long positons are possible, but highly speculative at this point in time.
▶ Downtrends in crude oil and related stocks are intact. No reason to look to fade this trend at this time.
Tactical Playbook, Week of 16 February 2016
2©2016 Waverly Advisors, LLC. All Rights Reserved. Please review disclosures on the final page of this report.
Market Insight
Action this week offers us a good backdrop against which to consider the concept of followthrough. This is a facet of market action that can be difficult to quantify at times, but can also give good insight into the character of market moves and future market direction. There is immediately relevant perspective here for swing traders, and also importance for longer term investors and portfolio allocators.
FollowthroughQuite simply, followthrough is the ability of a sharp move in a market to lead to another move in the same direction. We might “package” this tendency in a few dif-ferent ways: we can look at pullbacks, which are patterns that we assume should set up another thrust in the same direction as the move that set up the pullback. From a quantitative perspective, we also can talk about asymmetrical volatility, look at mean reversion, serial correlation of returns, and a number of other factors, but the core understanding is this: when a dominant group controls the market, that market trends. When a market trends, it will do so with good followthrough.
At first glance, this might not seem to be very helpful. A cynical reading of that previous paragraph might be “if the market is going to go up, it’s going to do so by going up.” However, there is great value in some of the subtle relationships between market movements. When we talk about “volatility conditions”, what we are really interested in is the probability that a market move will continue or reverse—will volatility expand or contract following any sharp move? Volatility, in this sense, is tied to market direction and followthrough, and we can see this in a few important patterns in the market.
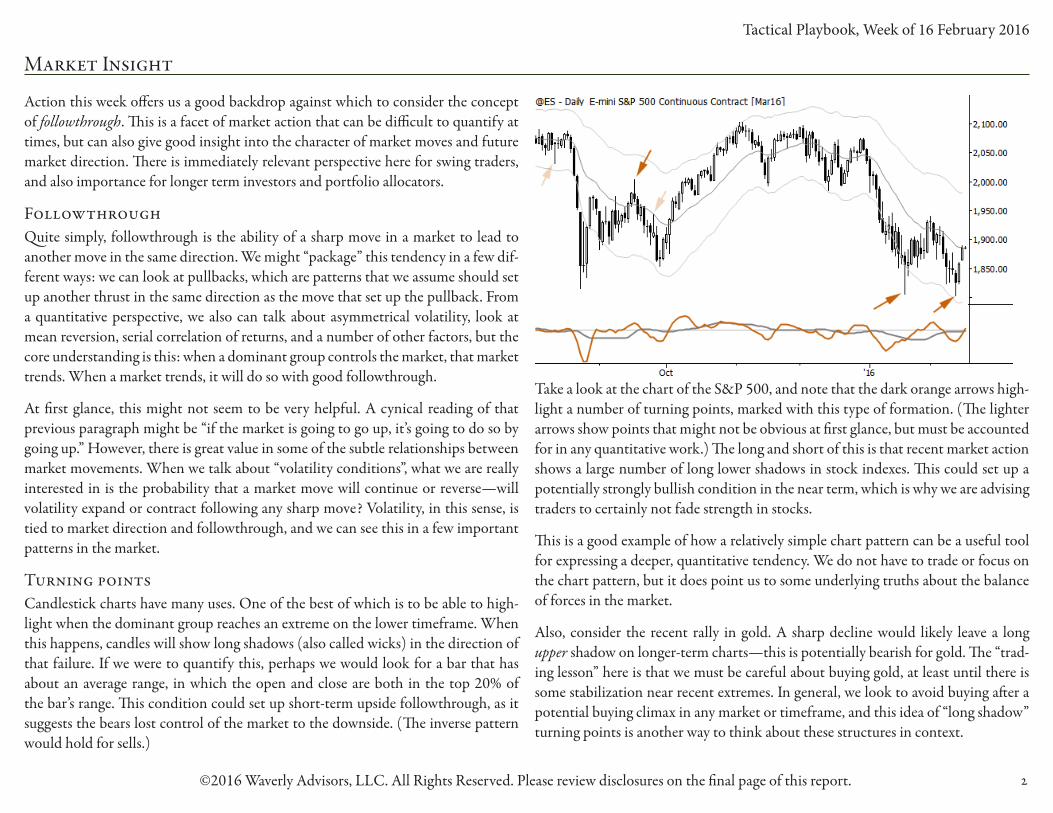
Turning pointsCandlestick charts have many uses. One of the best of which is to be able to high-light when the dominant group reaches an extreme on the lower timeframe. When this happens, candles will show long shadows (also called wicks) in the direction of that failure. If we were to quantify this, perhaps we would look for a bar that has about an average range, in which the open and close are both in the top 20% of the bar’s range. This condition could set up short-term upside followthrough, as it suggests the bears lost control of the market to the downside. (The inverse pattern would hold for sells.)
Take a look at the chart of the S&P 500, and note that the dark orange arrows high-light a number of turning points, marked with this type of formation. (The lighter arrows show points that might not be obvious at first glance, but must be accounted for in any quantitative work.) The long and short of this is that recent market action shows a large number of long lower shadows in stock indexes. This could set up a potentially strongly bullish condition in the near term, which is why we are advising traders to certainly not fade strength in stocks.
This is a good example of how a relatively simple chart pattern can be a useful tool for expressing a deeper, quantitative tendency. We do not have to trade or focus on the chart pattern, but it does point us to some underlying truths about the balance of forces in the market.
Also, consider the recent rally in gold. A sharp decline would likely leave a long upper shadow on longer-term charts—this is potentially bearish for gold. The “trad-ing lesson” here is that we must be careful about buying gold, at least until there is some stabilization near recent extremes. In general, we look to avoid buying after a potential buying climax in any market or timeframe, and this idea of “long shadow” turning points is another way to think about these structures in context.
Tactical Playbook, Week of 16 February 2016
3©2016 Waverly Advisors, LLC. All Rights Reserved. Please review disclosures on the final page of this report.
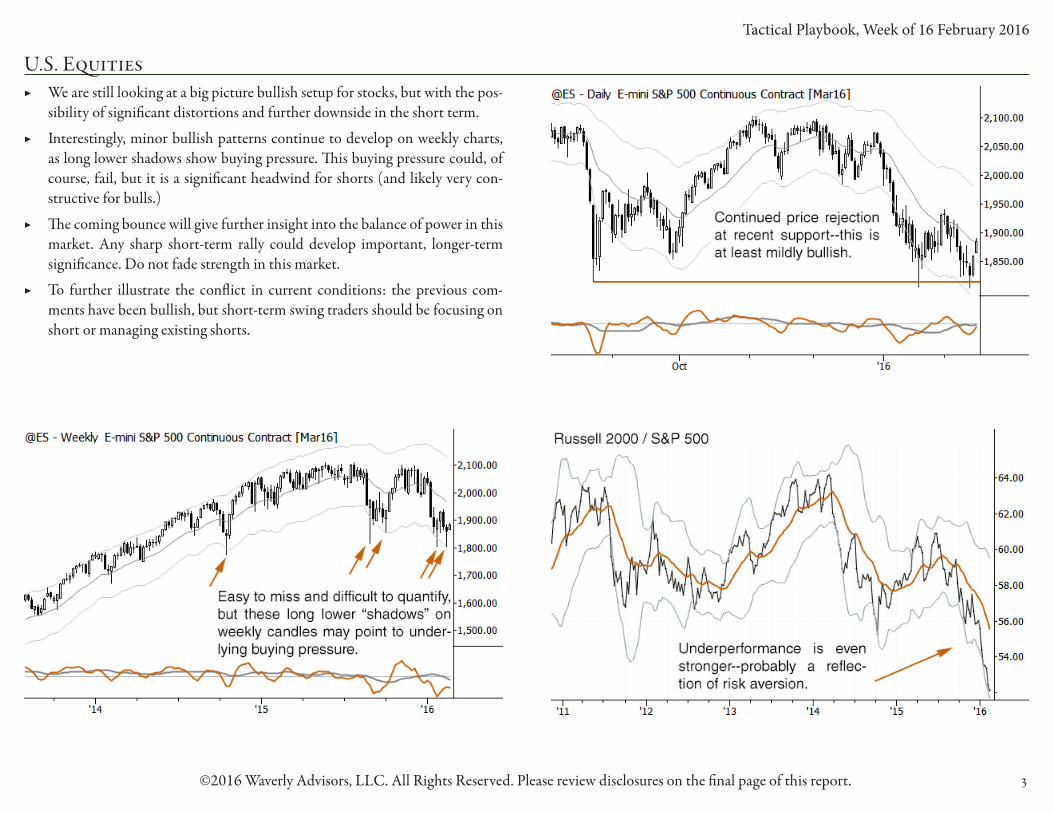
U.S. Equities ▶ We are still looking at a big picture bullish setup for stocks, but with the pos-
sibility of significant distortions and further downside in the short term.
▶ Interestingly, minor bullish patterns continue to develop on weekly charts, as long lower shadows show buying pressure. This buying pressure could, of course, fail, but it is a significant headwind for shorts (and likely very con-structive for bulls.)
▶ The coming bounce will give further insight into the balance of power in this market. Any sharp short-term rally could develop important, longer-term significance. Do not fade strength in this market.
▶ To further illustrate the conflict in current conditions: the previous com-ments have been bullish, but short-term swing traders should be focusing on short or managing existing shorts.

Tactical Playbook, Week of 16 February 2016
4©2016 Waverly Advisors, LLC. All Rights Reserved. Please review disclosures on the final page of this report.
U.S. Equities (continued)
Sector Assessment Weight LastChg RelPerfTechnology Over 9/25/15 1.8%Discret'nary Over 1/2/15 6.7%Financials Market 11/27/15 -Hcare Market 10/9/15 -Industrials Market 12/4/15 -Staples Market 10/10/14 -Energy Market 9/12/14 -Utilities Market 10/10/14 -Materials Market 10/9/15 -
U.S. Large Cap Sector Weighting

Tactical Playbook, Week of 16 February 2016
5©2016 Waverly Advisors, LLC. All Rights Reserved. Please review disclosures on the final page of this report.
Equity Indexes: Short-Term ▶ This is a time where we recommend not focusing too much on higher timeframe
influences (i.e., complications), and simply focusing on intraday structure.
▶ Though it might not be obvious, the best reading of this market is as being in a range, with attempted breakouts above and below.
▶ Contrary to the claims of some “charting systems”, there are no clear edges from these multiple tests of ranges. Based on other structural factors, we would favor the immediate upside, but best plan is to let early morning character set the tone for the day.
▶ This is a market in breakout mode: any sharp intraday move away from the range is likely to lead to multiple trend legs in that direction. There should be an edge to holding both longs and shorts overnight, if the day closes with a strong trend move.
Market ATR 20 Avg Gap% GapsS&P 500 42.85 11.14 16.1%R2K 28.29 5.71 10.6%MiniDow 340 95 18.9%Nasdaq 117.15 27.70 15.0%
Gap & Risk Analysis
Tactical Playbook, Week of 16 February 2016
6©2016 Waverly Advisors, LLC. All Rights Reserved. Please review disclosures on the final page of this report.
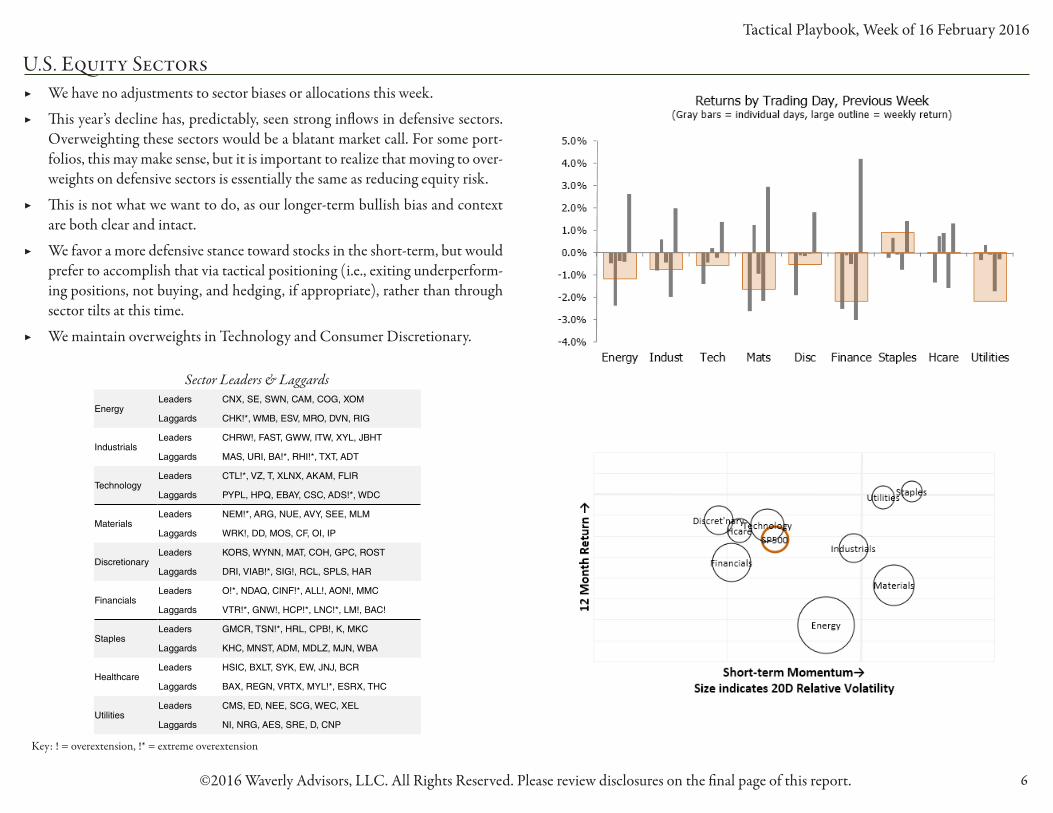
U.S. Equity Sectors ▶ We have no adjustments to sector biases or allocations this week.
▶ This year’s decline has, predictably, seen strong inflows in defensive sectors. Overweighting these sectors would be a blatant market call. For some port-folios, this may make sense, but it is important to realize that moving to over-weights on defensive sectors is essentially the same as reducing equity risk.
▶ This is not what we want to do, as our longer-term bullish bias and context are both clear and intact.
▶ We favor a more defensive stance toward stocks in the short-term, but would prefer to accomplish that via tactical positioning (i.e., exiting underperform-ing positions, not buying, and hedging, if appropriate), rather than through sector tilts at this time.
▶ We maintain overweights in Technology and Consumer Discretionary.
Key: ! = overextension, !* = extreme overextension
Sector Leaders & Laggards
EnergyLeaders CNX, SE, SWN, CAM, COG, XOM
Laggards CHK!*, WMB, ESV, MRO, DVN, RIG
IndustrialsLeaders CHRW!, FAST, GWW, ITW, XYL, JBHT
Laggards MAS, URI, BA!*, RHI!*, TXT, ADT
TechnologyLeaders CTL!*, VZ, T, XLNX, AKAM, FLIR
Laggards PYPL, HPQ, EBAY, CSC, ADS!*, WDC
MaterialsLeaders NEM!*, ARG, NUE, AVY, SEE, MLM
Laggards WRK!, DD, MOS, CF, OI, IP
DiscretionaryLeaders KORS, WYNN, MAT, COH, GPC, ROST
Laggards DRI, VIAB!*, SIG!, RCL, SPLS, HAR
FinancialsLeaders O!*, NDAQ, CINF!*, ALL!, AON!, MMC
Laggards VTR!*, GNW!, HCP!*, LNC!*, LM!, BAC!
StaplesLeaders GMCR, TSN!*, HRL, CPB!, K, MKC
Laggards KHC, MNST, ADM, MDLZ, MJN, WBA
HealthcareLeaders HSIC, BXLT, SYK, EW, JNJ, BCR
Laggards BAX, REGN, VRTX, MYL!*, ESRX, THC
UtilitiesLeaders CMS, ED, NEE, SCG, WEC, XEL
Laggards NI, NRG, AES, SRE, D, CNP
Tactical Playbook, Week of 16 February 2016
7©2016 Waverly Advisors, LLC. All Rights Reserved. Please review disclosures on the final page of this report.
U.S. Individual Stocks ▶ We think two guiding principles are appropriate for swing traders this week:
First, look to reduce overall activity and exposure.
– There are times in which we might take trades with correct stops without strong supporting entry factors, but this is not that time. Now, focus on only the best setups and look to reduce the overall amount of the portfolio that is at risk.
– Second, focus on both long and short exposure, and work to tighten stops rather quickly as trades develop.
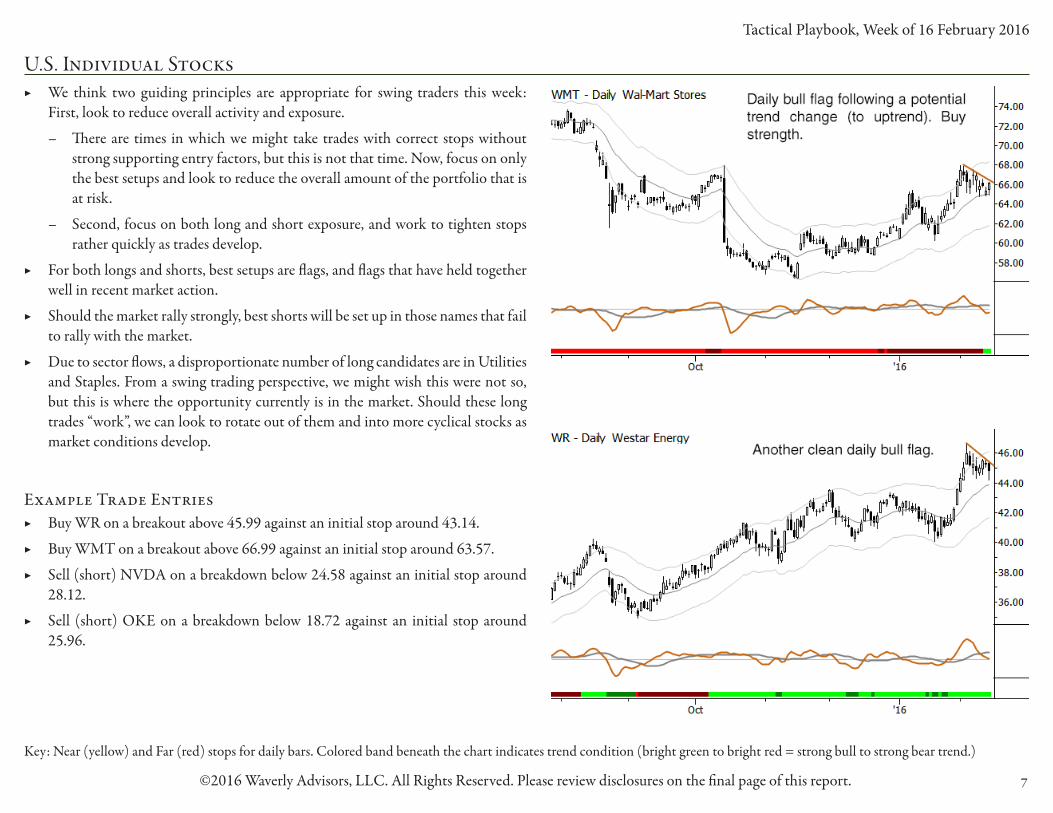
▶ For both longs and shorts, best setups are flags, and flags that have held together well in recent market action.
▶ Should the market rally strongly, best shorts will be set up in those names that fail to rally with the market.
▶ Due to sector flows, a disproportionate number of long candidates are in Utilities and Staples. From a swing trading perspective, we might wish this were not so, but this is where the opportunity currently is in the market. Should these long trades “work”, we can look to rotate out of them and into more cyclical stocks as market conditions develop.
Example Trade Entries ▶ Buy WR on a breakout above 45.99 against an initial stop around 43.14.
▶ Buy WMT on a breakout above 66.99 against an initial stop around 63.57.
▶ Sell (short) NVDA on a breakdown below 24.58 against an initial stop around 28.12.
▶ Sell (short) OKE on a breakdown below 18.72 against an initial stop around 25.96.
Key: Near (yellow) and Far (red) stops for daily bars. Colored band beneath the chart indicates trend condition (bright green to bright red = strong bull to strong bear trend.)

Tactical Playbook, Week of 16 February 2016
8©2016 Waverly Advisors, LLC. All Rights Reserved. Please review disclosures on the final page of this report.
U.S. Individual Stocks (continued)

Tactical Playbook, Week of 16 February 2016
9©2016 Waverly Advisors, LLC. All Rights Reserved. Please review disclosures on the final page of this report.
Global Stocks ▶ Global stocks are trading in tight correlation, and the process of untangling
those correlations is fraught with difficulty.
▶ For swing traders, it makes sense to realize that stocks are basically “one buck-et” of risk. Any strong divergences are likely to fall along the DM/EM axis, rather than geography, and most traders are best served by focusing on mar-ket conditions in liquid, common indexes.
▶ For longer-term allocators, recent EM outperformance demands some atten-tion. To be clear, we do not think that there is justification for overweighting EM slices in portfolios. Recent rallies in these indexes are probably due to mean reversion (in previously, severely underperforming indexes.)
▶ Recent market action has seen failures on both the long and short side. Lon-ger-term bullish setups are intact, but we urge short-term caution.
Tactical Playbook, Week of 16 February 2016
10©2016 Waverly Advisors, LLC. All Rights Reserved. Please review disclosures on the final page of this report.
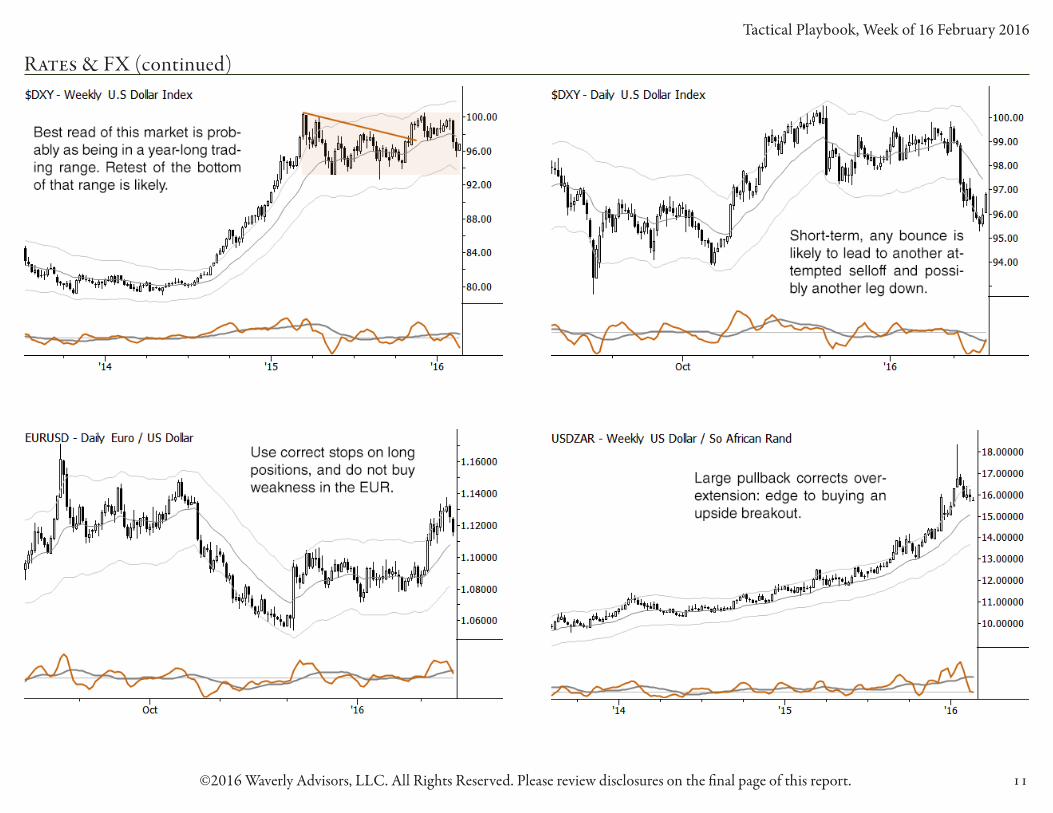
Rates & FX ▶ The US Dollar index now most clearly reads as being in a large, year-long
trading range. (Is it coincidence that this range aligns with a similar period in US stocks? Probably not.)
▶ Short-term, patterns continue to favor the downside in the Dollar.
▶ Look for moves in currencies to be sharp and fast, but perhaps with limited followthrough. Swing traders can use this information to better set stops and manage active entries.
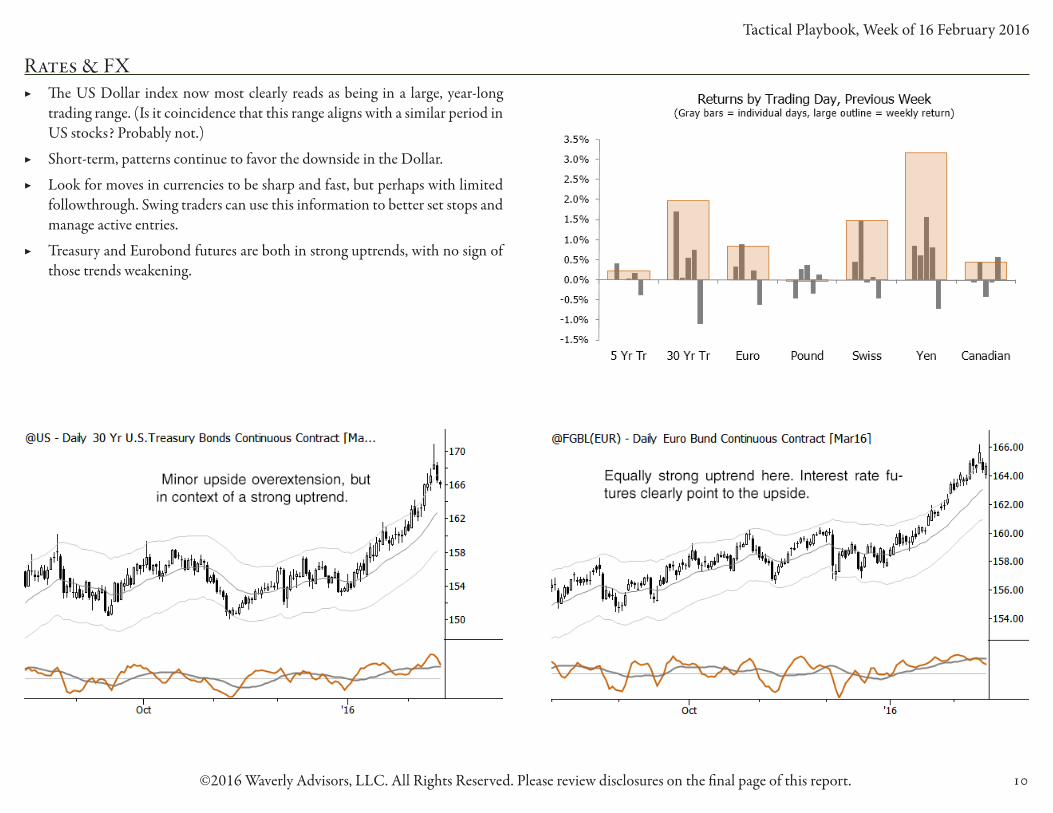
▶ Treasury and Eurobond futures are both in strong uptrends, with no sign of those trends weakening.
Tactical Playbook, Week of 16 February 2016
11©2016 Waverly Advisors, LLC. All Rights Reserved. Please review disclosures on the final page of this report.
Rates & FX (continued)
Tactical Playbook, Week of 16 February 2016
12©2016 Waverly Advisors, LLC. All Rights Reserved. Please review disclosures on the final page of this report.
CommoditiesMetals:
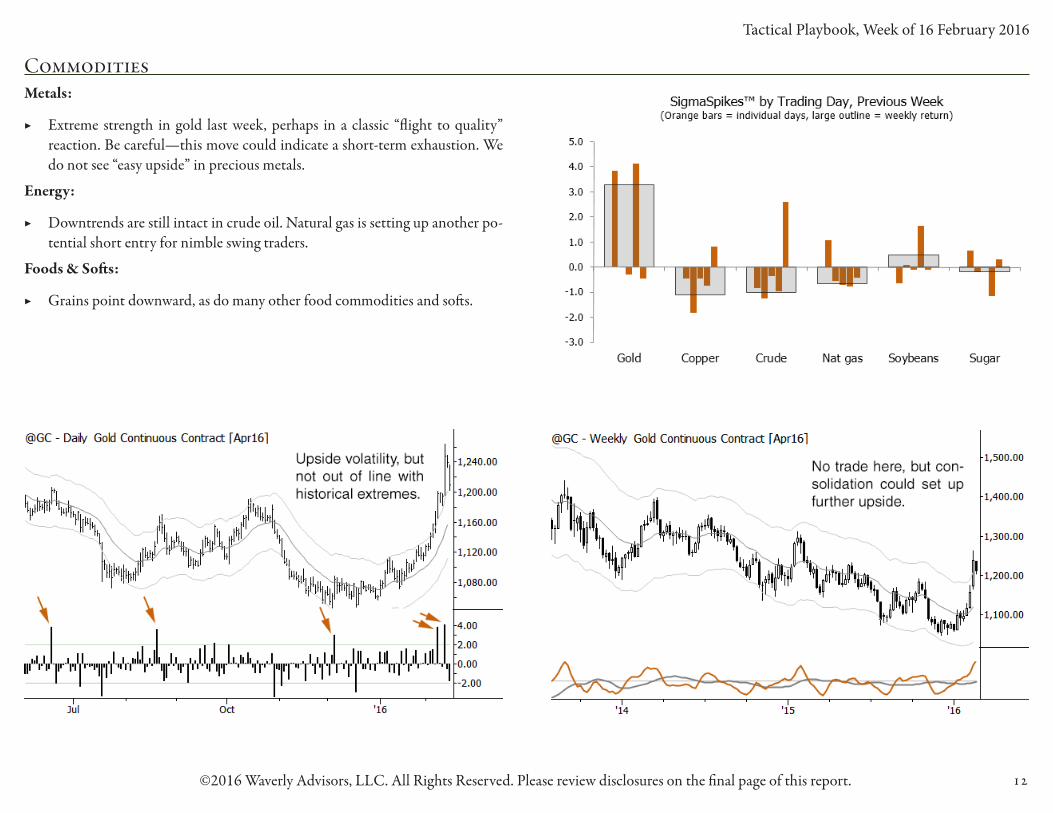
▶ Extreme strength in gold last week, perhaps in a classic “flight to quality” reaction. Be careful—this move could indicate a short-term exhaustion. We do not see “easy upside” in precious metals.
Energy:
▶ Downtrends are still intact in crude oil. Natural gas is setting up another po-tential short entry for nimble swing traders.
Foods & Softs:
▶ Grains point downward, as do many other food commodities and softs.

Tactical Playbook, Week of 16 February 2016
13©2016 Waverly Advisors, LLC. All Rights Reserved. Please review disclosures on the final page of this report.
Commodities (continued)

Tactical Playbook, Week of 16 February 2016
14©2016 Waverly Advisors, LLC. All Rights Reserved. Please review disclosures on the final page of this report.
Discretionary Trade Ideas
Commentary ▶ Market conditions are in flux, now more than ever. This is driven by shifts in stock indexes and currencies. For active traders, the bottom line is that this is a period in
which we must look to enter traders with realistic expectations—meaning that many of these trades will likely lose.
▶ We are looking to reduce risk both by reducing number of entries and by tightening the stops in open positions aggressively.
▶ Watch our daily note for updates as market conditions develop.
Potential entries ▶ Sell May sugar futures 13.01, against an initial stop around 13.97.
▶ Buy USDZAR 16.50, against an initial stop around 15.19.
▶ *All breakout entries should only be held if confirmed by a strong/weak close (for a buy/sell) on the day of trade entry.
Note: These are a distillation of our quantitative and discretionary work. In a sense, they are specific trade examples of our bigger picture tactical themes. Please contact us for further information on our discretionary and systematic trading approaches.
Date In L/S Size Contract Proxy Type Price In InitStop Last Target Stop StopATR CurrentRisk Open% Open%R Total P&L
2/2/16 S Full Crude oil (May) USO PB 34.25 39.50 33.25 29.00 34.95 0.8 13% 2.9% 0.2x 0.2x
2/8/16 S Full R2K (March) IWM PB 982.00 1040.00 968.00 924.00 994.00 0.9 21% 1.4% 0.2x 0.2x
2/9/16 L Full EURUSD FXE PB 1.1250 1.0950 1.1249 1.1550 1.1130 1.1 40% (0.0%) 0.0x 0.0x
Key: D = Discretionary, I = Intermediate-term (otherwise it is short-term), PB = Pullback, A = Anti, FT = Failure Test, BO = Breakout
Tactical Playbook, Week of 16 February 2016
15©2016 Waverly Advisors, LLC. All Rights Reserved. Please review disclosures on the final page of this report.
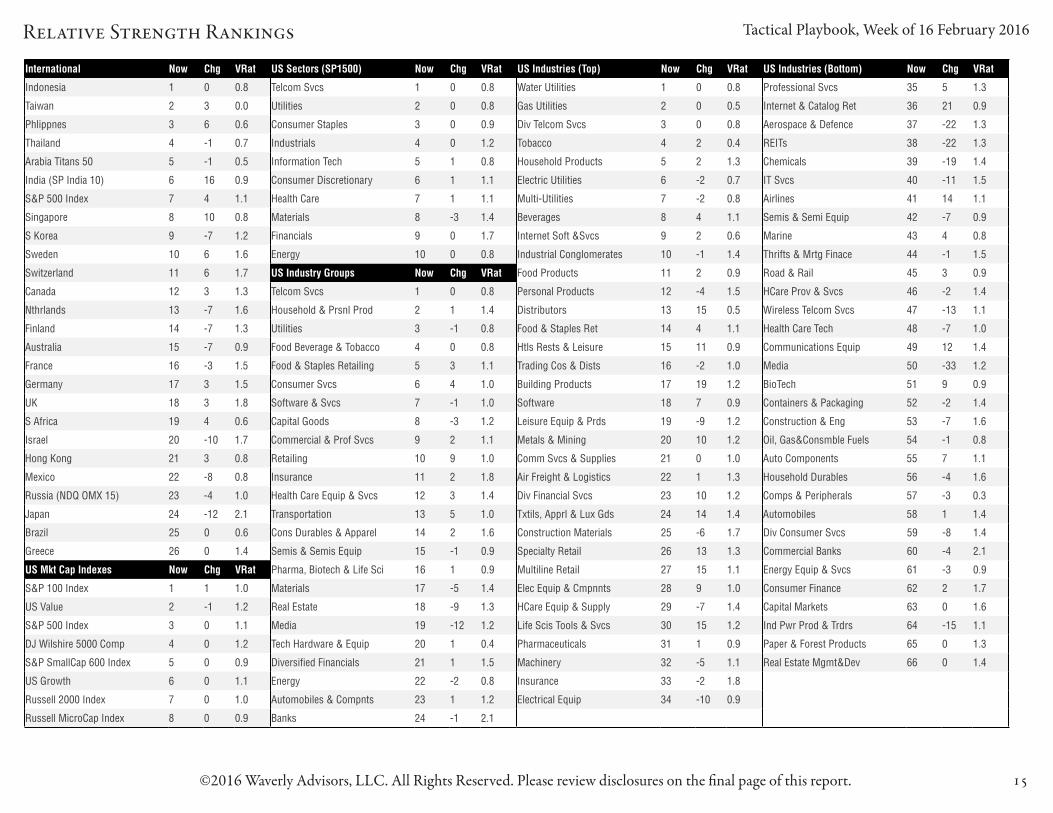
Relative Strength Rankings
International Now Chg VRat US Sectors (SP1500) Now Chg VRat US Industries (Top) Now Chg VRat US Industries (Bottom) Now Chg VRat
Indonesia 1 0 0.8 Telcom Svcs 1 0 0.8 Water Utilities 1 0 0.8 Professional Svcs 35 5 1.3
Taiwan 2 3 0.0 Utilities 2 0 0.8 Gas Utilities 2 0 0.5 Internet & Catalog Ret 36 21 0.9
Phlippnes 3 6 0.6 Consumer Staples 3 0 0.9 Div Telcom Svcs 3 0 0.8 Aerospace & Defence 37 -22 1.3
Thailand 4 -1 0.7 Industrials 4 0 1.2 Tobacco 4 2 0.4 REITs 38 -22 1.3
Arabia Titans 50 5 -1 0.5 Information Tech 5 1 0.8 Household Products 5 2 1.3 Chemicals 39 -19 1.4
India (SP India 10) 6 16 0.9 Consumer Discretionary 6 1 1.1 Electric Utilities 6 -2 0.7 IT Svcs 40 -11 1.5
S&P 500 Index 7 4 1.1 Health Care 7 1 1.1 Multi-Utilities 7 -2 0.8 Airlines 41 14 1.1
Singapore 8 10 0.8 Materials 8 -3 1.4 Beverages 8 4 1.1 Semis & Semi Equip 42 -7 0.9
S Korea 9 -7 1.2 Financials 9 0 1.7 Internet Soft &Svcs 9 2 0.6 Marine 43 4 0.8
Sweden 10 6 1.6 Energy 10 0 0.8 Industrial Conglomerates 10 -1 1.4 Thrifts & Mrtg Finace 44 -1 1.5
Switzerland 11 6 1.7 US Industry Groups Now Chg VRat Food Products 11 2 0.9 Road & Rail 45 3 0.9
Canada 12 3 1.3 Telcom Svcs 1 0 0.8 Personal Products 12 -4 1.5 HCare Prov & Svcs 46 -2 1.4
Nthrlands 13 -7 1.6 Household & Prsnl Prod 2 1 1.4 Distributors 13 15 0.5 Wireless Telcom Svcs 47 -13 1.1
Finland 14 -7 1.3 Utilities 3 -1 0.8 Food & Staples Ret 14 4 1.1 Health Care Tech 48 -7 1.0
Australia 15 -7 0.9 Food Beverage & Tobacco 4 0 0.8 Htls Rests & Leisure 15 11 0.9 Communications Equip 49 12 1.4
France 16 -3 1.5 Food & Staples Retailing 5 3 1.1 Trading Cos & Dists 16 -2 1.0 Media 50 -33 1.2
Germany 17 3 1.5 Consumer Svcs 6 4 1.0 Building Products 17 19 1.2 BioTech 51 9 0.9
UK 18 3 1.8 Software & Svcs 7 -1 1.0 Software 18 7 0.9 Containers & Packaging 52 -2 1.4
S Africa 19 4 0.6 Capital Goods 8 -3 1.2 Leisure Equip & Prds 19 -9 1.2 Construction & Eng 53 -7 1.6
Israel 20 -10 1.7 Commercial & Prof Svcs 9 2 1.1 Metals & Mining 20 10 1.2 Oil, Gas&Consmble Fuels 54 -1 0.8
Hong Kong 21 3 0.8 Retailing 10 9 1.0 Comm Svcs & Supplies 21 0 1.0 Auto Components 55 7 1.1
Mexico 22 -8 0.8 Insurance 11 2 1.8 Air Freight & Logistics 22 1 1.3 Household Durables 56 -4 1.6
Russia (NDQ OMX 15) 23 -4 1.0 Health Care Equip & Svcs 12 3 1.4 Div Financial Svcs 23 10 1.2 Comps & Peripherals 57 -3 0.3
Japan 24 -12 2.1 Transportation 13 5 1.0 Txtils, Apprl & Lux Gds 24 14 1.4 Automobiles 58 1 1.4
Brazil 25 0 0.6 Cons Durables & Apparel 14 2 1.6 Construction Materials 25 -6 1.7 Div Consumer Svcs 59 -8 1.4
Greece 26 0 1.4 Semis & Semis Equip 15 -1 0.9 Specialty Retail 26 13 1.3 Commercial Banks 60 -4 2.1
US Mkt Cap Indexes Now Chg VRat Pharma, Biotech & Life Sci 16 1 0.9 Multiline Retail 27 15 1.1 Energy Equip & Svcs 61 -3 0.9
S&P 100 Index 1 1 1.0 Materials 17 -5 1.4 Elec Equip & Cmpnnts 28 9 1.0 Consumer Finance 62 2 1.7
US Value 2 -1 1.2 Real Estate 18 -9 1.3 HCare Equip & Supply 29 -7 1.4 Capital Markets 63 0 1.6
S&P 500 Index 3 0 1.1 Media 19 -12 1.2 Life Scis Tools & Svcs 30 15 1.2 Ind Pwr Prod & Trdrs 64 -15 1.1
DJ Wilshire 5000 Comp 4 0 1.2 Tech Hardware & Equip 20 1 0.4 Pharmaceuticals 31 1 0.9 Paper & Forest Products 65 0 1.3
S&P SmallCap 600 Index 5 0 0.9 Diversified Financials 21 1 1.5 Machinery 32 -5 1.1 Real Estate Mgmt&Dev 66 0 1.4
US Growth 6 0 1.1 Energy 22 -2 0.8 Insurance 33 -2 1.8
Russell 2000 Index 7 0 1.0 Automobiles & Compnts 23 1 1.2 Electrical Equip 34 -10 0.9
Russell MicroCap Index 8 0 0.9 Banks 24 -1 2.1

Tactical Playbook, Week of 16 February 2016
16©2016 Waverly Advisors, LLC. All Rights Reserved. Please review disclosures on the final page of this report.
Equity Screens & Models
Equity Screens, Trading Models, and Systems are available in the Excel attachment to this email.
Summary of Equity Screens: ▶ Big Movers: highlights stocks that have had large volatility-adjusted moves the previous trading day.
▶ Historical Movers: A look at the big movers screen, highlighting the largest moves over the past 10 trading days. This is a tool for finding pullbacks and for measuring market reaction to these large moves.
▶ In Play: Highlights stocks that are trading with exceptional volume and activity, relative to their own longer-term trading history.
▶ Consecutive Closes: an overbough/oversold screen based on consecutive closes in one direction.
▶ Extension: a long/short model for stocks, with a focused edge for short-term trades.
▶ Pullback Buy & Pullback Sell: Long/short screens highlighting stocks that are potential candidates for pullback trades. Typical use of this screen would then involve a look at the names on this list, choosing the best patterns and examples.
▶ RS Strong: highlights the strongest relative strength stocks in the market, based on a relatively short-term, volatility-adjusted measure of relative strength.
Tactical Playbook, Week of 16 February 2016
17©2016 Waverly Advisors, LLC. All Rights Reserved. Please review disclosures on the final page of this report.
Disclaimers & Contact
Waverly Advisors, LLC
5607 Pittsford-Palmyra Rd. #1034Pittsford, NY 14534
(607) 684-5300 or [email protected]
The Tactical Playbook (“The Report”) is a newsletter published by Waverly Advisors LLC. Receipt of The Report is subject to terms of service: http://waverlyadvisors.com/legal/terms-of-service/
Waverly Advisors uses reasonable care in preparing and publishing The Report, however, Waverly Advisors does not guarantee The Report’s accuracy or completeness. Opinions expressed in The Report are subject to change without notice. The Report, and www.waverlyadvisors.com (“The Website”) and all information provided therein should not be construed as a request to engage in any transaction involving the purchase or sale of securities, futures contracts, commodities, currencies and/or options thereon. The risk of loss in trading securities, futures contracts, commodities, currencies and/or op-tions thereon is substantial, and investors should carefully consider the inherent risks of such an investment in light of their financial condition and discuss with their financial advisor(s). The information provided in The Report is not designed to replace your own decision-making processes.
Hypothetical or simulated performance results have certain inherent limitations. Unlike an actual performance record, simulated results do not represent actual trading. Also, since the trades have not actually been executed, the results may have under- or over-compensated for the impact, if any, of certain market factors, such as lack of liquidity. Simulated trading programs in general are also subject to the fact that they are designed with the benefit of hindsight. No representation is being made that any account will or is likely to achieve profits or losses similar to those shown.
Copyright © Waverly Advisors, LLC 2016. All rights reserved. All material presented in this document, unless specifically indicated otherwise, is under copyright to Waverly Advisors, LLC. None of the material, nor its content, nor any copy of it, may be altered in any way, or transmitted to or distributed to any other party, without the prior express written permission of Waverly Advisors, LLC.
This report is limited for the sole use of clients of Waverly Advisors, LLC. Any redistribution of this report or of its content will violate the terms of service.