Tackling Risk Through Customer Satisfaction · Methodology – Gather Survey Data . Customer...
32
Tackling Risk Through Customer Satisfaction Presented by: Angela Song and Margo Simpson
Transcript of Tackling Risk Through Customer Satisfaction · Methodology – Gather Survey Data . Customer...
Tackling Risk Through Customer Satisfaction
Presented by: Angela Song and Margo Simpson
Introductions
Angela Song, PhD – UCSD Director of Organizational Performance Assessment (Operational Strategic Initiatives, VC-CFO)
Margo Simpson – IBM Managing Consultant (Strategy and Analytics – Finance and Risk)
Agenda
• UCSD’s Challenge • Why ERMIS? • Survey and Dashboard Methodology • Case Study: Health Sciences “We Heard
You” Campaign • Group Exercise: Procurements Specialized
Outreach
UCSD’s Challenge
Cumbersome and manual data compilation, statistical analysis and report generation
Two qualified individuals to complete work for thousands of report requests
Only able to accommodate some departments due to limited capabilities
Campus demand for the reports was growing; Angela and her team saw that the current process was not sustainable
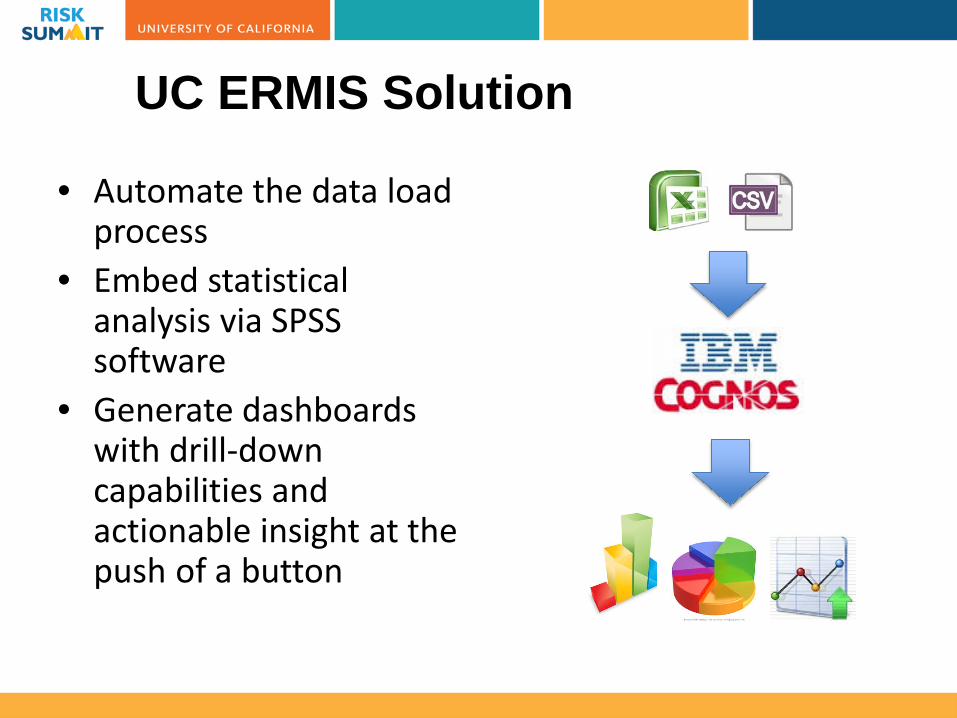
UC ERMIS Solution
• Automate the data load process
• Embed statistical analysis via SPSS software
• Generate dashboards with drill-down capabilities and actionable insight at the push of a button
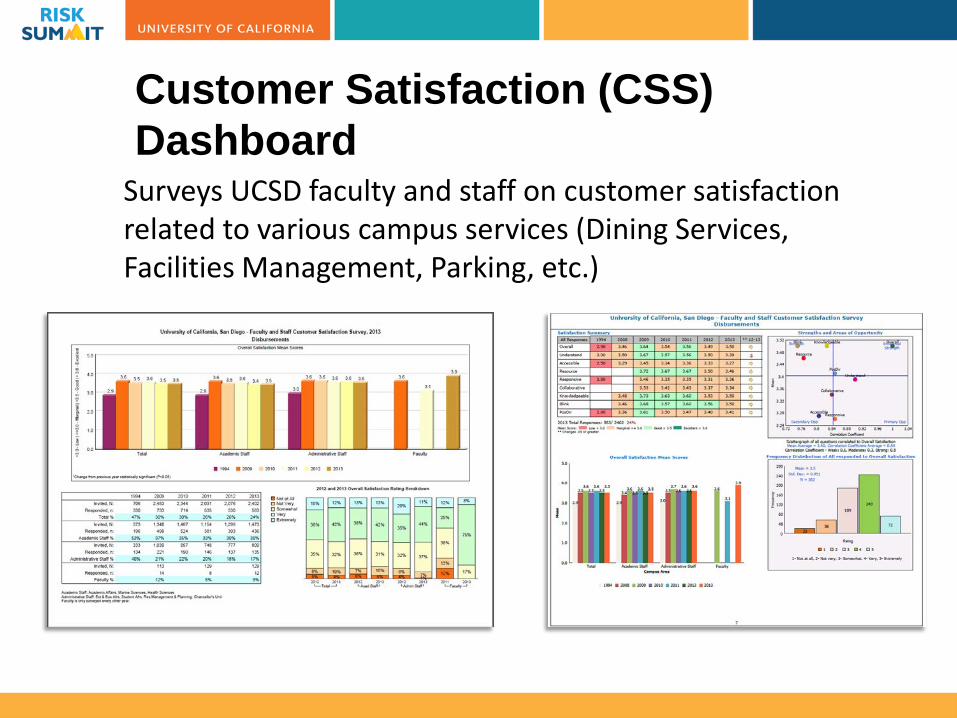
Customer Satisfaction (CSS) Dashboard
Surveys UCSD faculty and staff on customer satisfaction related to various campus services (Dining Services, Facilities Management, Parking, etc.)
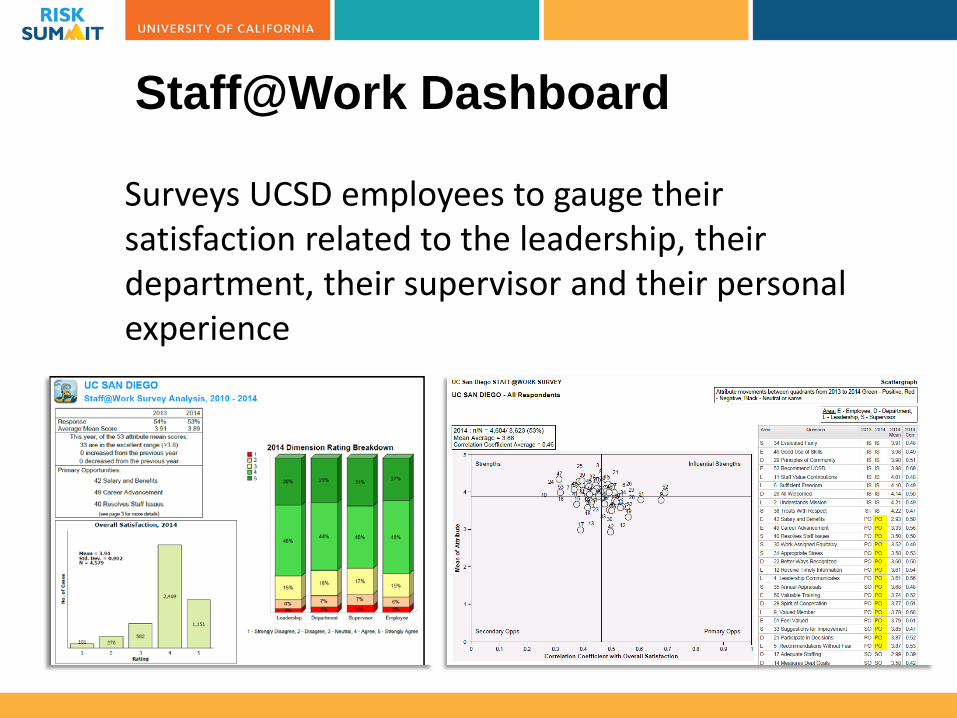
Staff@Work Dashboard
Surveys UCSD employees to gauge their satisfaction related to the leadership, their department, their supervisor and their personal experience
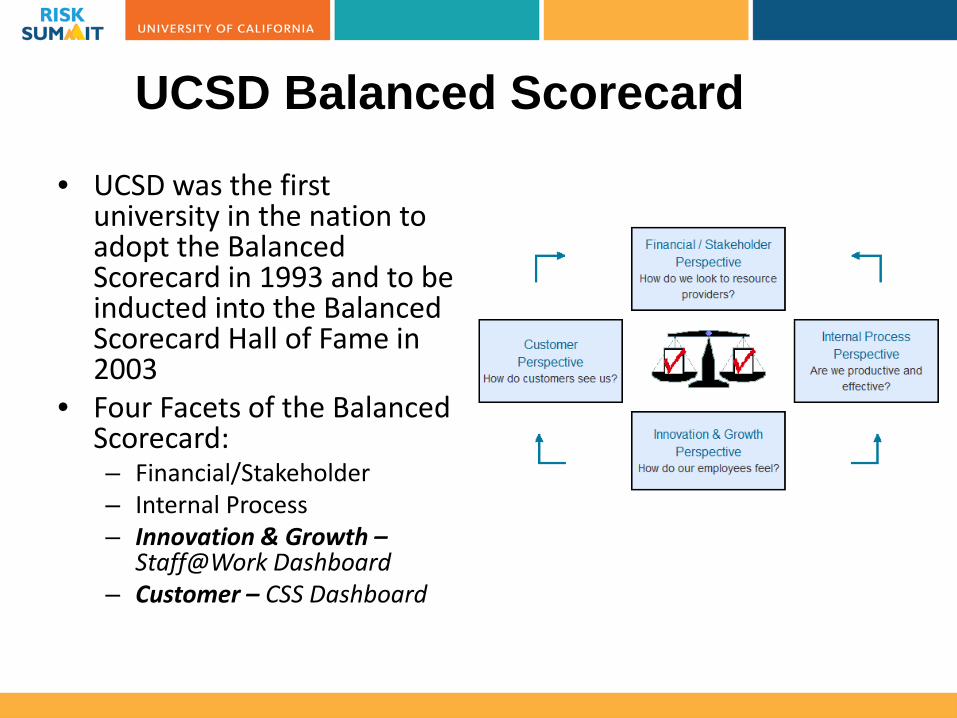
UCSD Balanced Scorecard
• UCSD was the first university in the nation to adopt the Balanced Scorecard in 1993 and to be inducted into the Balanced Scorecard Hall of Fame in 2003
• Four Facets of the Balanced Scorecard: – Financial/Stakeholder – Internal Process – Innovation & Growth –
Staff@Work Dashboard – Customer – CSS Dashboard
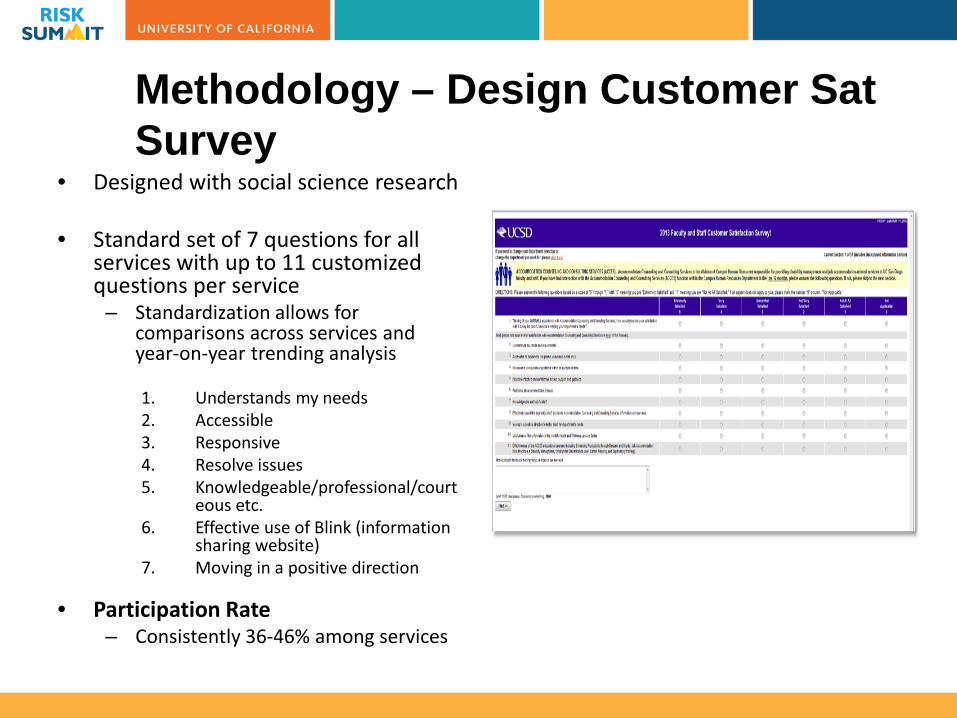
Methodology – Design Customer Sat Survey
• Designed with social science research • Standard set of 7 questions for all
services with up to 11 customized questions per service
– Standardization allows for comparisons across services and year-on-year trending analysis
1. Understands my needs 2. Accessible 3. Responsive 4. Resolve issues 5. Knowledgeable/professional/court
eous etc. 6. Effective use of Blink (information
sharing website) 7. Moving in a positive direction
• Participation Rate – Consistently 36-46% among services
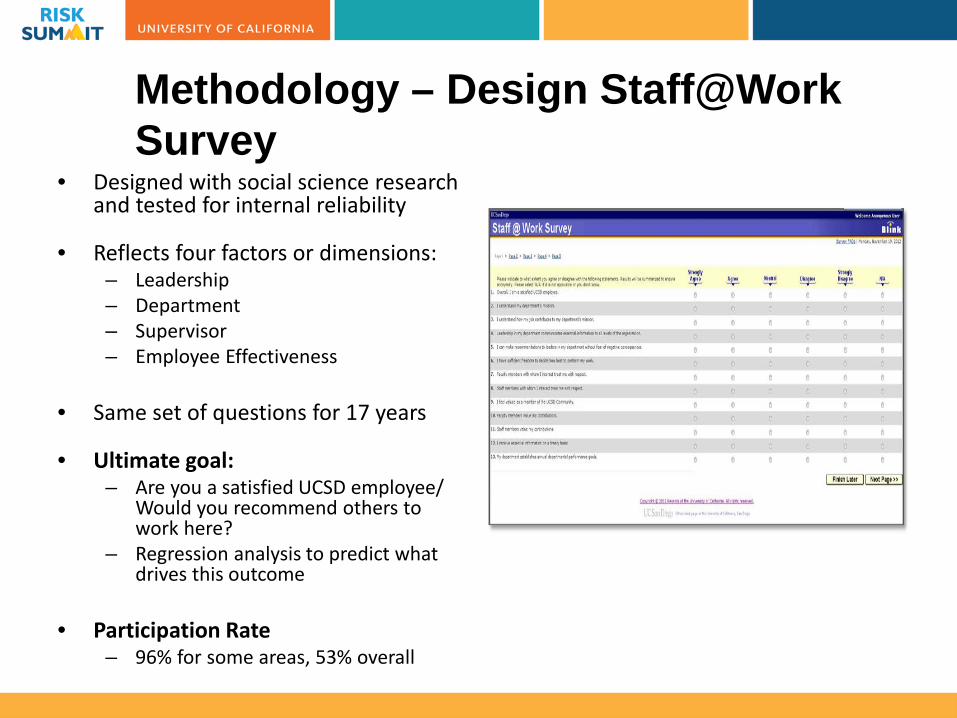
Methodology – Design Staff@Work Survey
• Designed with social science research and tested for internal reliability
• Reflects four factors or dimensions: – Leadership – Department – Supervisor – Employee Effectiveness
• Same set of questions for 17 years
• Ultimate goal: – Are you a satisfied UCSD employee/
Would you recommend others to work here?
– Regression analysis to predict what drives this outcome
• Participation Rate
– 96% for some areas, 53% overall
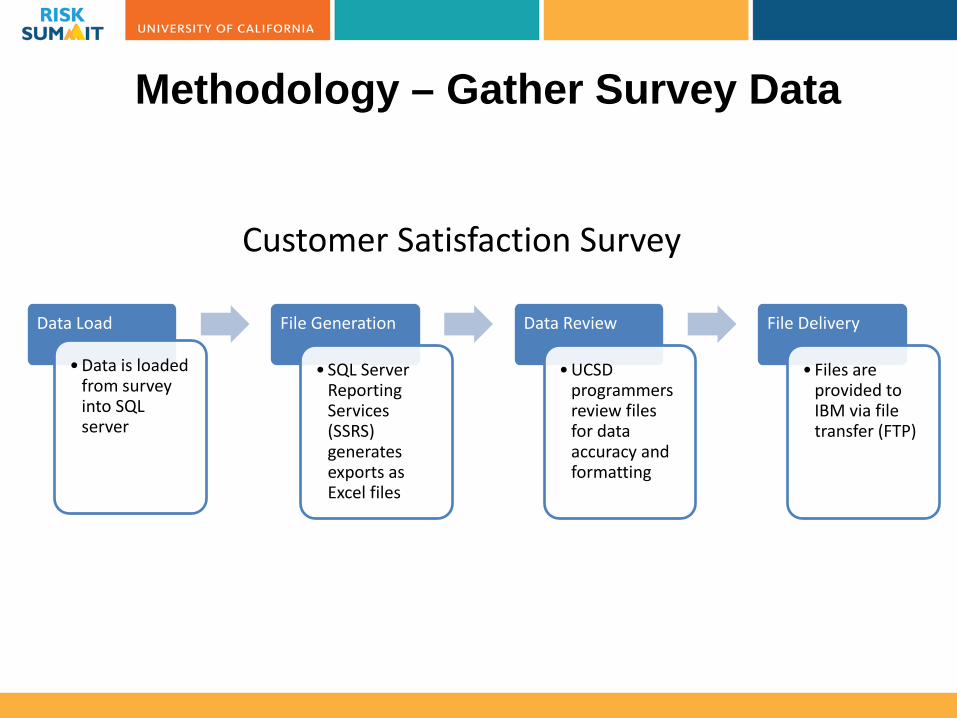
Methodology – Gather Survey Data
Customer Satisfaction Survey
Data Load
•Data is loaded from survey into SQL server
File Generation
• SQL Server Reporting Services (SSRS) generates exports as Excel files
Data Review
•UCSD programmers review files for data accuracy and formatting
File Delivery
• Files are provided to IBM via file transfer (FTP)
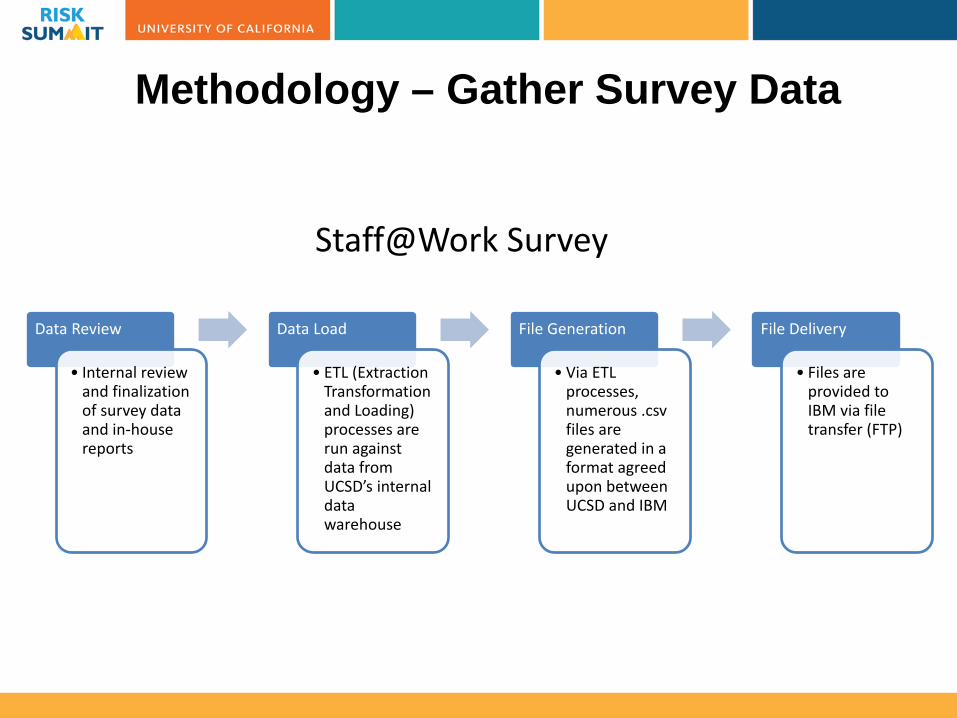
Methodology – Gather Survey Data
Staff@Work Survey
Data Review
• Internal review and finalization of survey data and in-house reports
Data Load
• ETL (Extraction Transformation and Loading) processes are run against data from UCSD’s internal data warehouse
File Generation
• Via ETL processes, numerous .csv files are generated in a format agreed upon between UCSD and IBM
File Delivery
• Files are provided to IBM via file transfer (FTP)
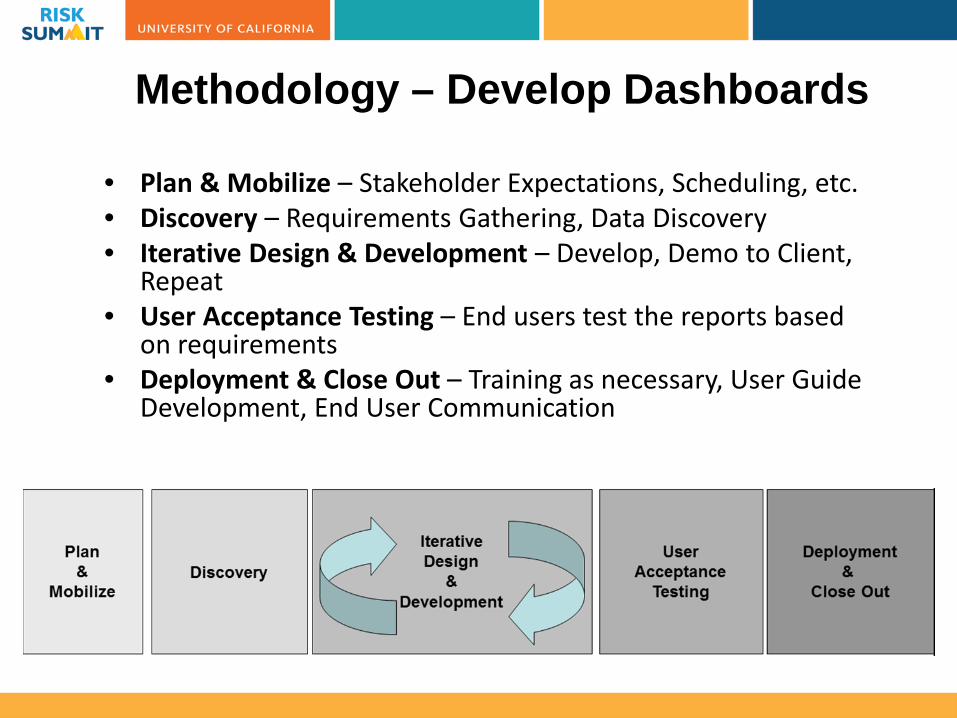
Methodology – Develop Dashboards
• Plan & Mobilize – Stakeholder Expectations, Scheduling, etc. • Discovery – Requirements Gathering, Data Discovery • Iterative Design & Development – Develop, Demo to Client,
Repeat • User Acceptance Testing – End users test the reports based
on requirements • Deployment & Close Out – Training as necessary, User Guide
Development, End User Communication
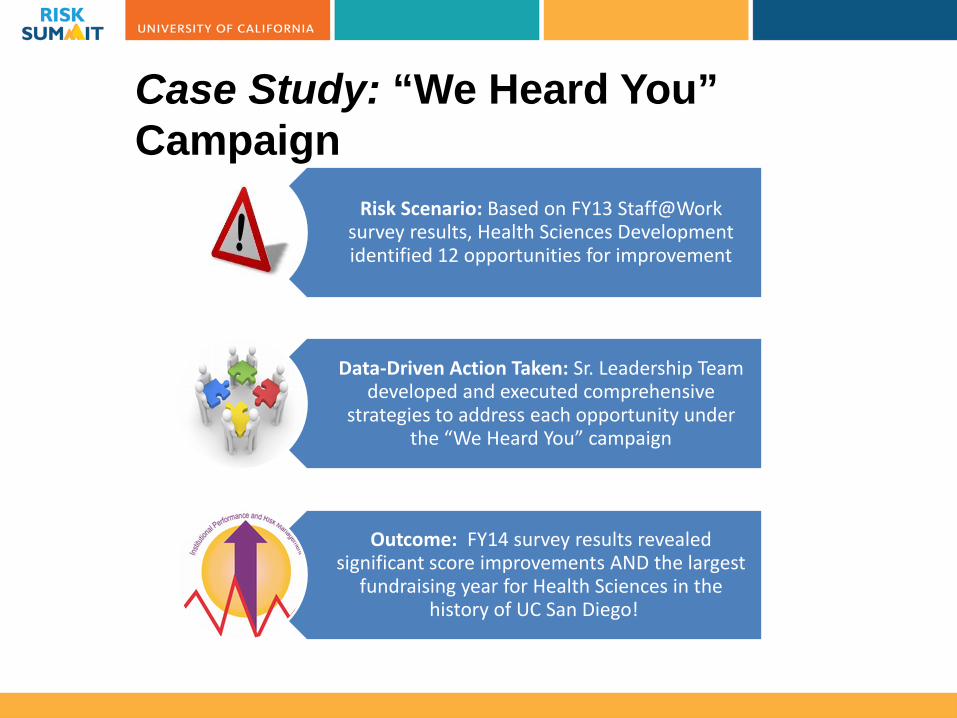
Case Study: “We Heard You” Campaign
Risk Scenario: Based on FY13 Staff@Work survey results, Health Sciences Development identified 12 opportunities for improvement
Data-Driven Action Taken: Sr. Leadership Team developed and executed comprehensive
strategies to address each opportunity under the “We Heard You” campaign
Outcome: FY14 survey results revealed significant score improvements AND the largest
fundraising year for Health Sciences in the history of UC San Diego!
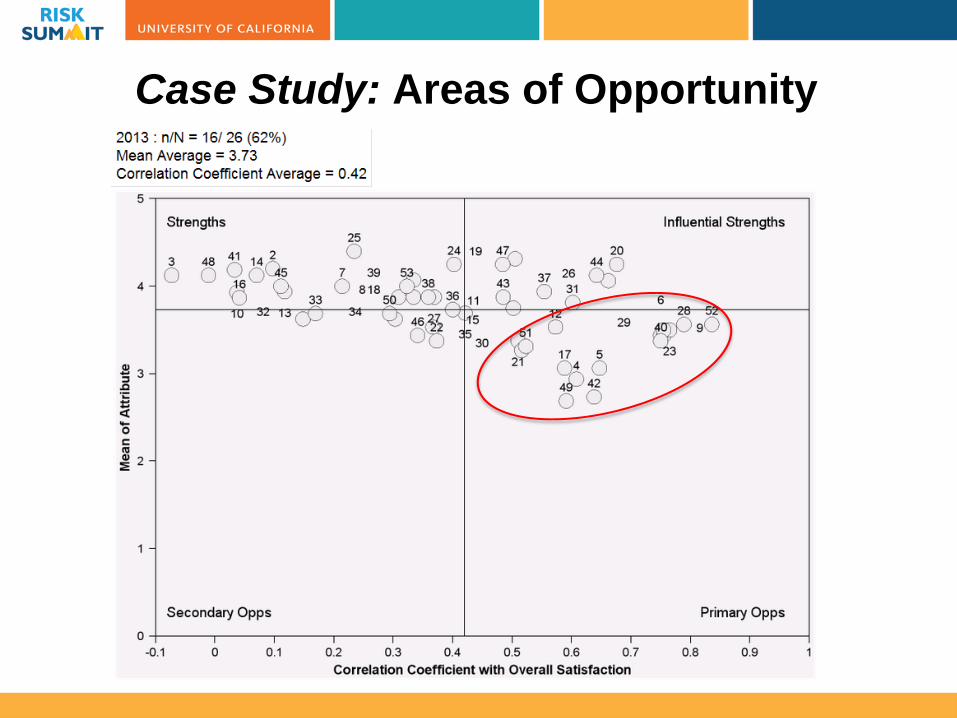
Case Study: Areas of Opportunity
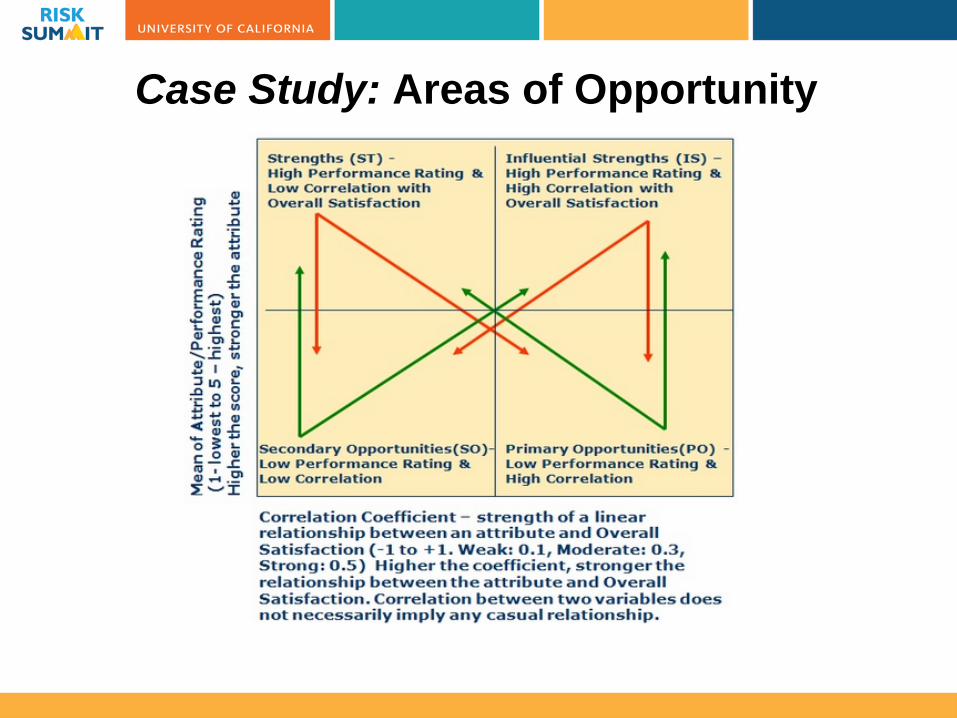
Case Study: Areas of Opportunity
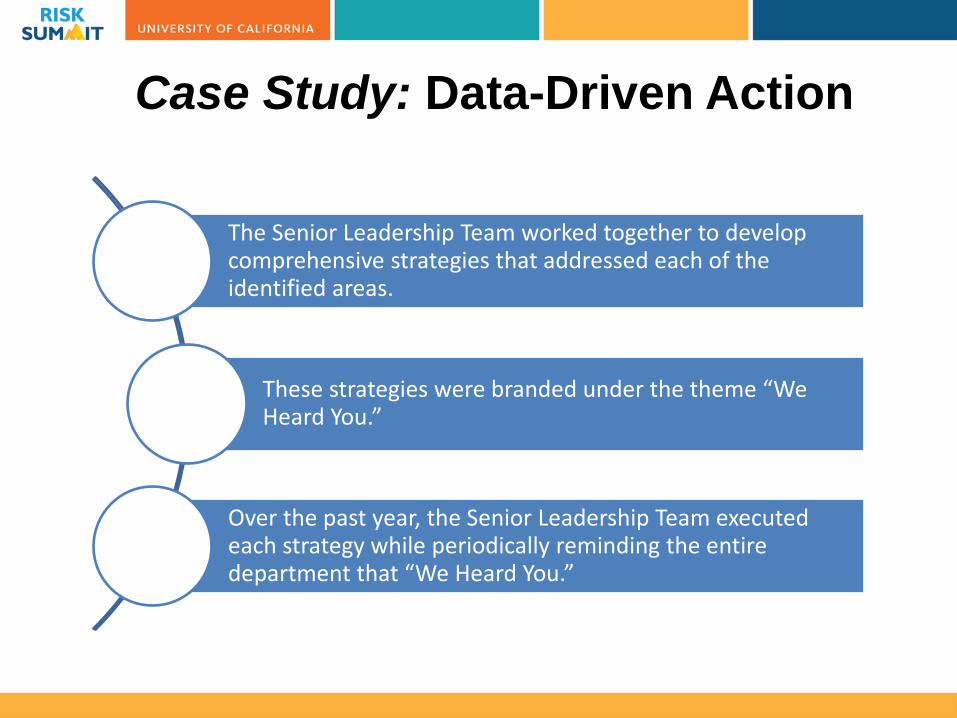
Case Study: Data-Driven Action
The Senior Leadership Team worked together to develop comprehensive strategies that addressed each of the identified areas.
These strategies were branded under the theme “We Heard You.”
Over the past year, the Senior Leadership Team executed each strategy while periodically reminding the entire department that “We Heard You.”
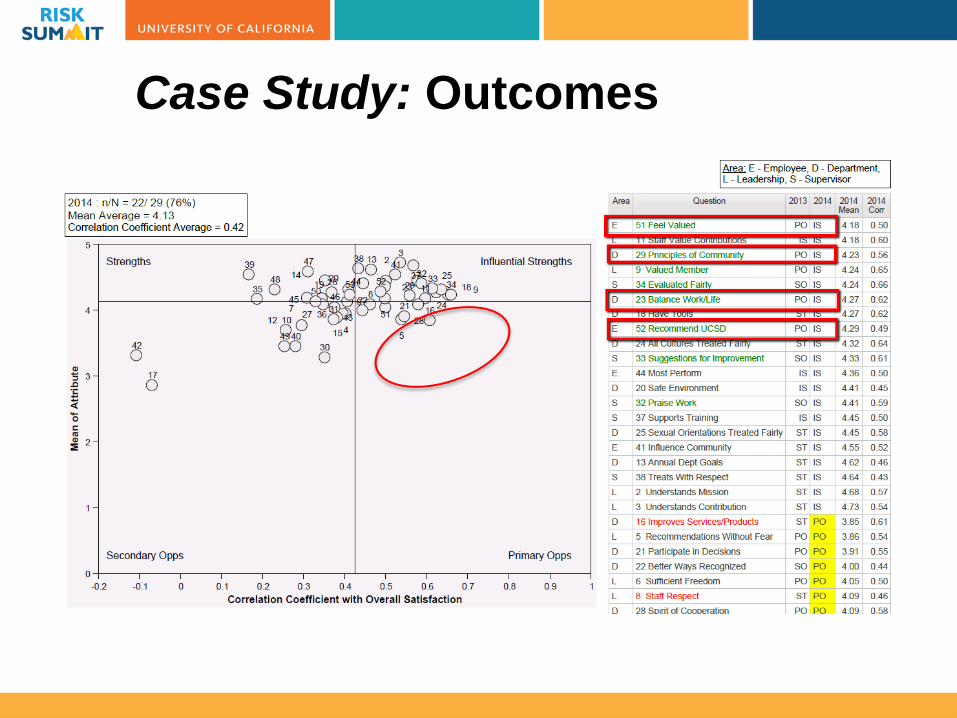
Case Study: Outcomes
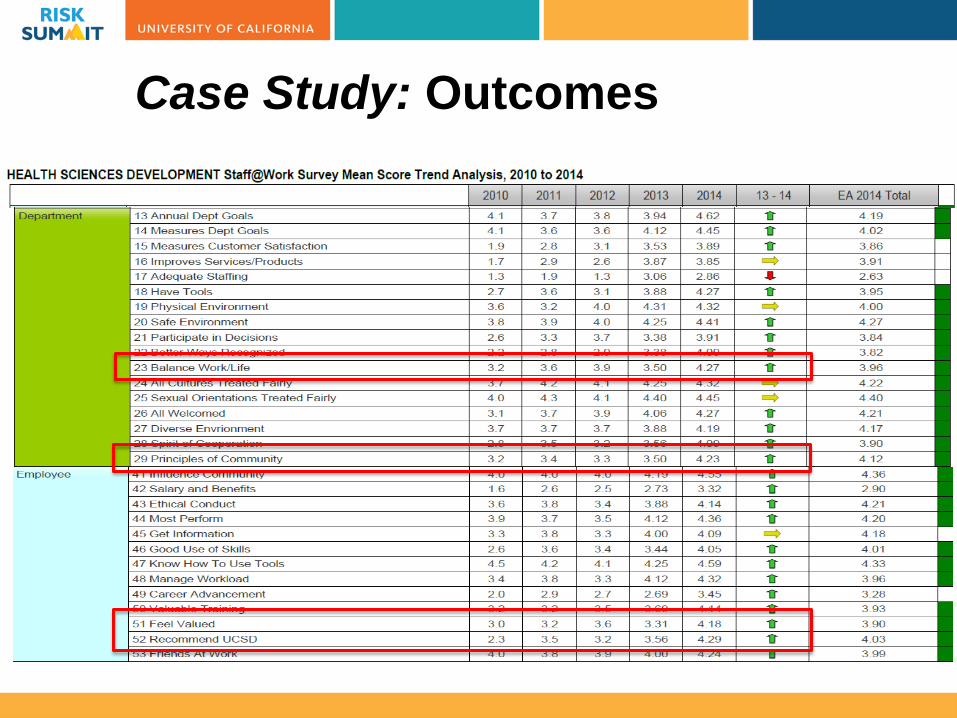
Case Study: Outcomes
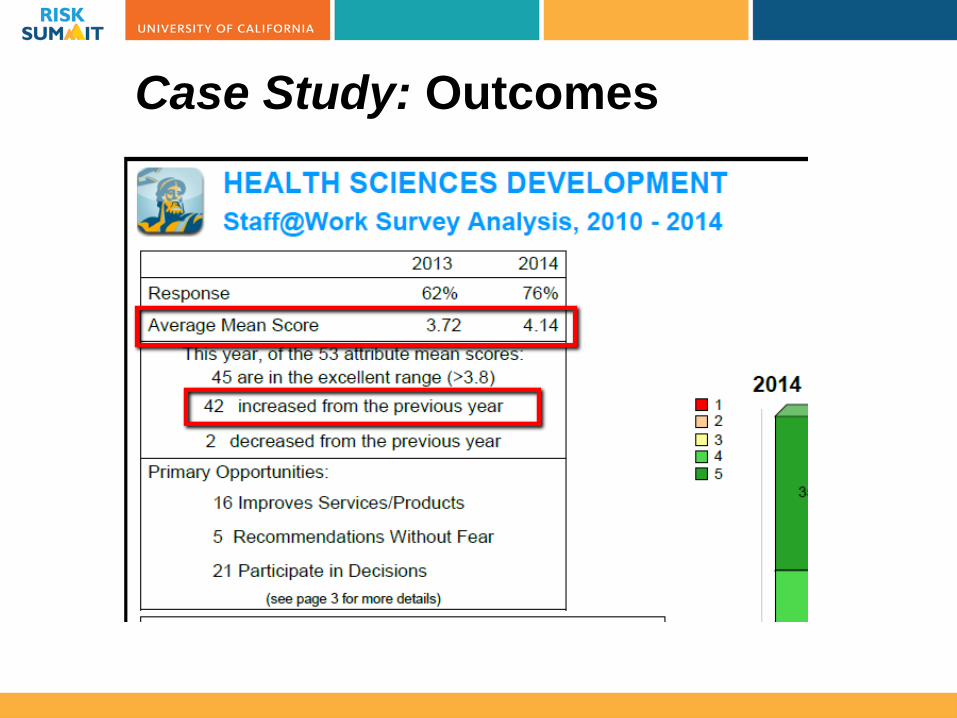
Case Study: Outcomes
Case Study: Outcomes
• Quote from the Sr. Executive Director of Health Sciences Development: – “While we know our work is not complete,
the Staff@Work survey has provided a roadmap to help guide our entire team toward improved results, least of which is accomplishing the largest fundraising year for Health Sciences in the history of UC San Diego.”
Group Exercise: Procurements Specialized Outreach
• Risk Scenario: – UCSD Procurements received their annual
Customer Satisfaction Survey results for FY12 and noticed that there were certain departments that were consistently rating Procurements low in the same areas.
• For the following two slides, we will break into groups and try to identify those opportunities for improvement.
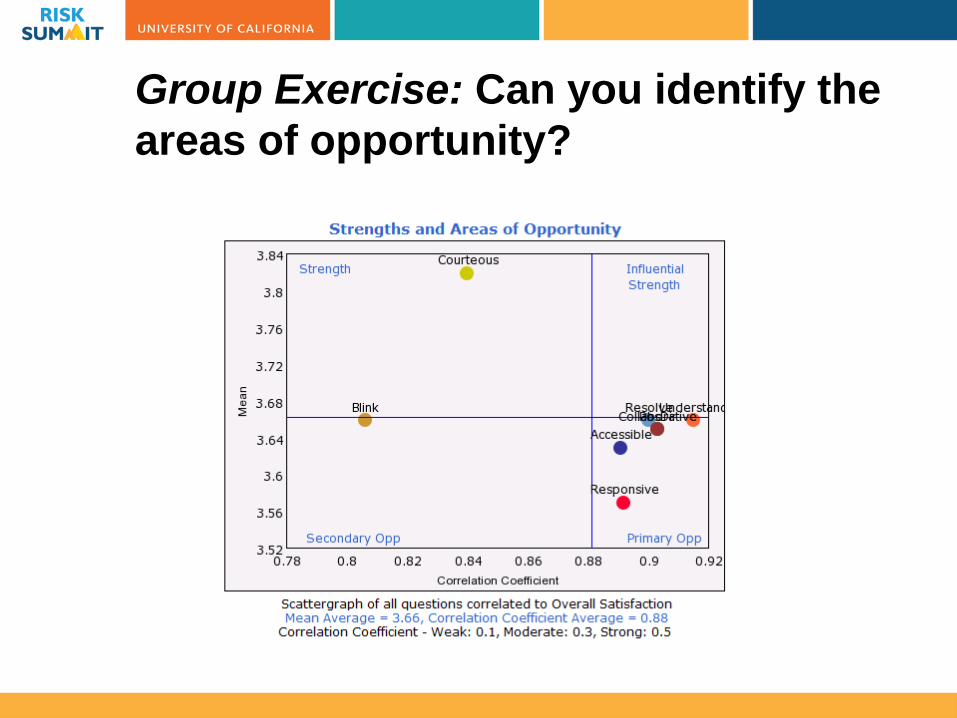
Group Exercise: Can you identify the areas of opportunity?
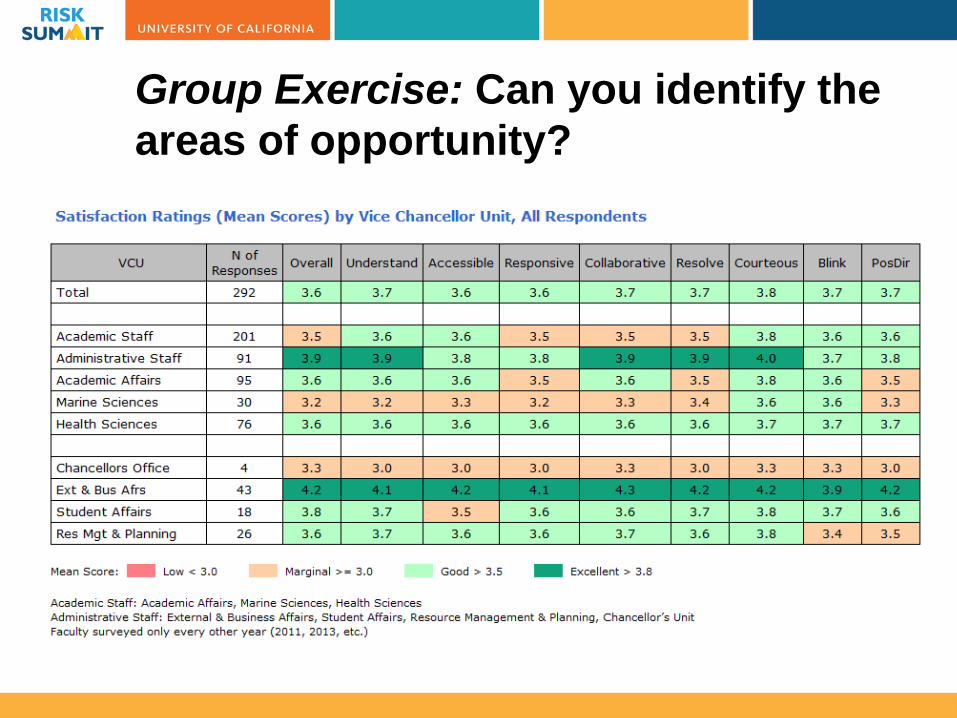
Group Exercise: Can you identify the areas of opportunity?
Group Exercise: What should Procurements do?
Let’s take a few minutes to brainstorm potential risk intervention strategies that Procurements could employ.
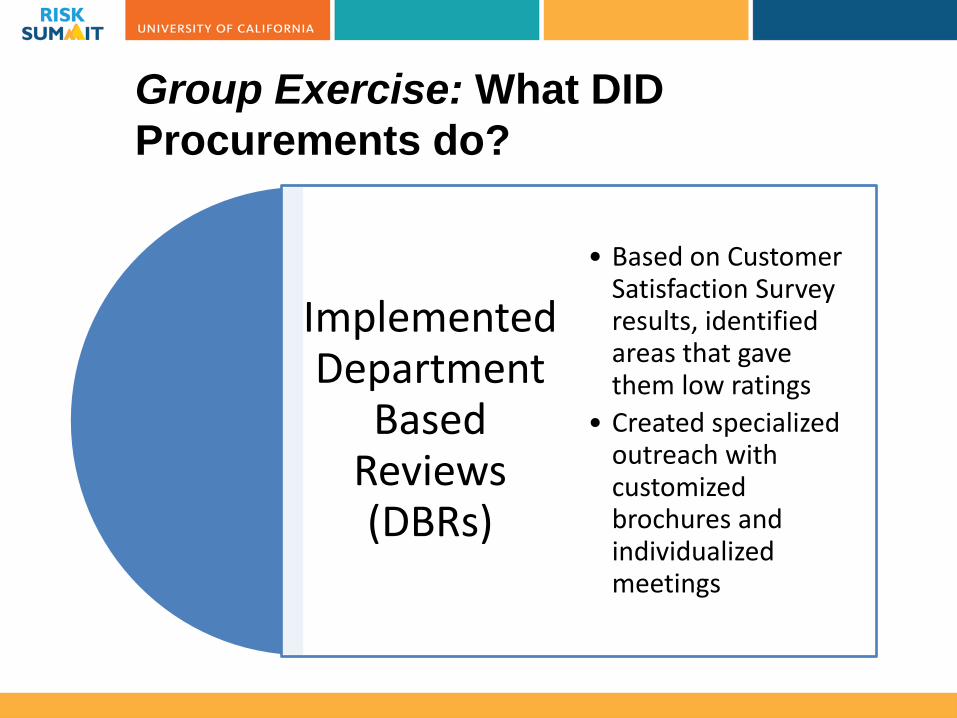
Group Exercise: What DID Procurements do?
Implemented Department
Based Reviews (DBRs)
• Based on Customer Satisfaction Survey results, identified areas that gave them low ratings
• Created specialized outreach with customized brochures and individualized meetings
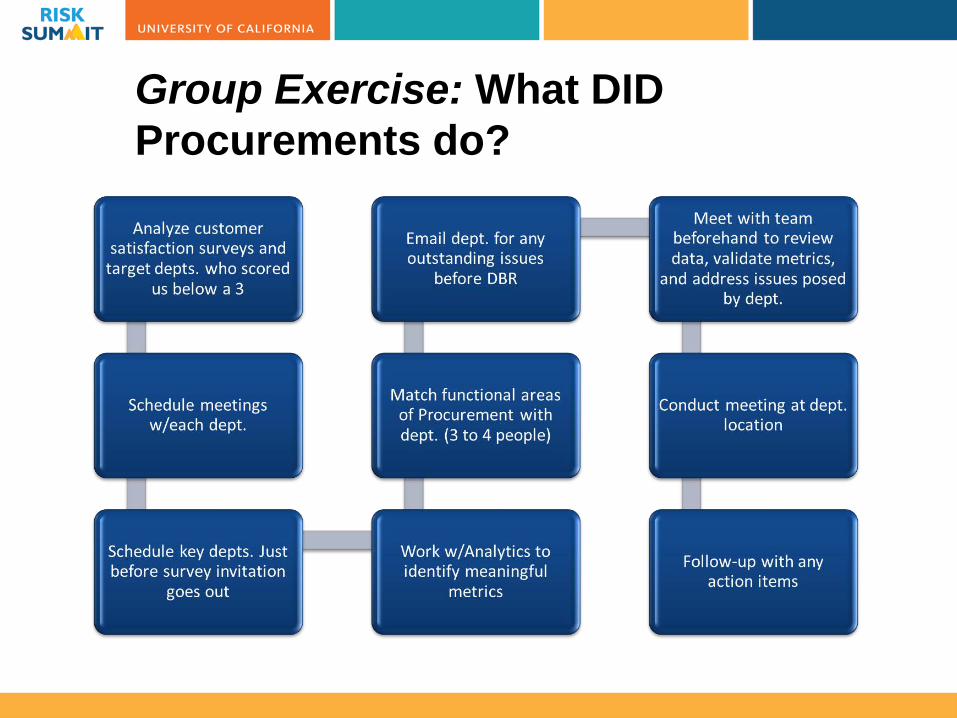
Group Exercise: What DID Procurements do?
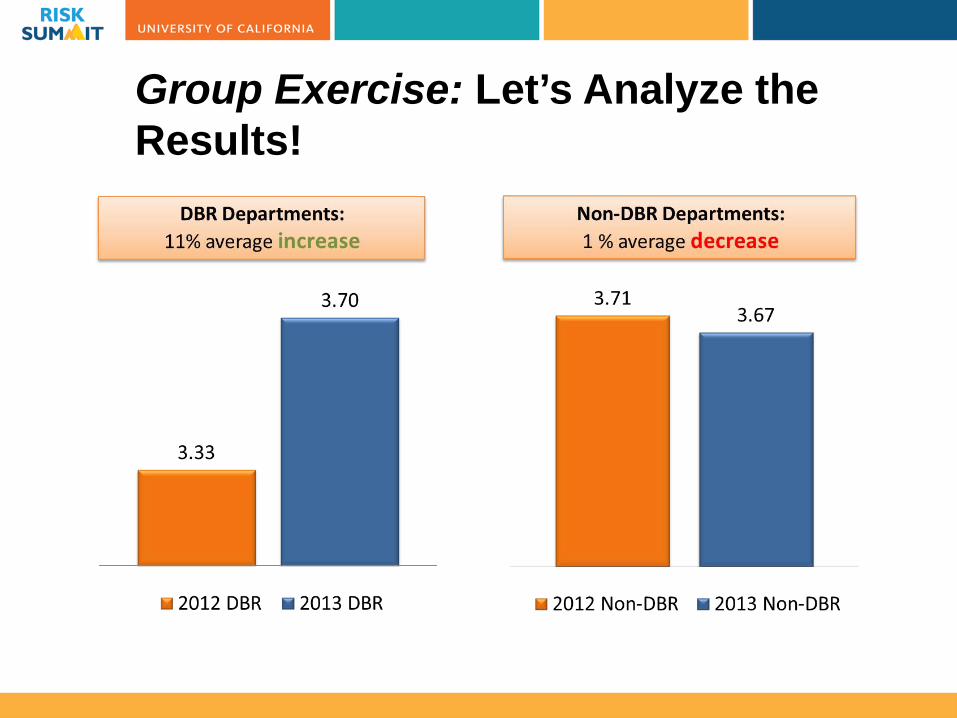
Group Exercise: Let’s Analyze the Results!
Group Exercise: Let’s Analyze the Results!
2012 Results 2013 Results
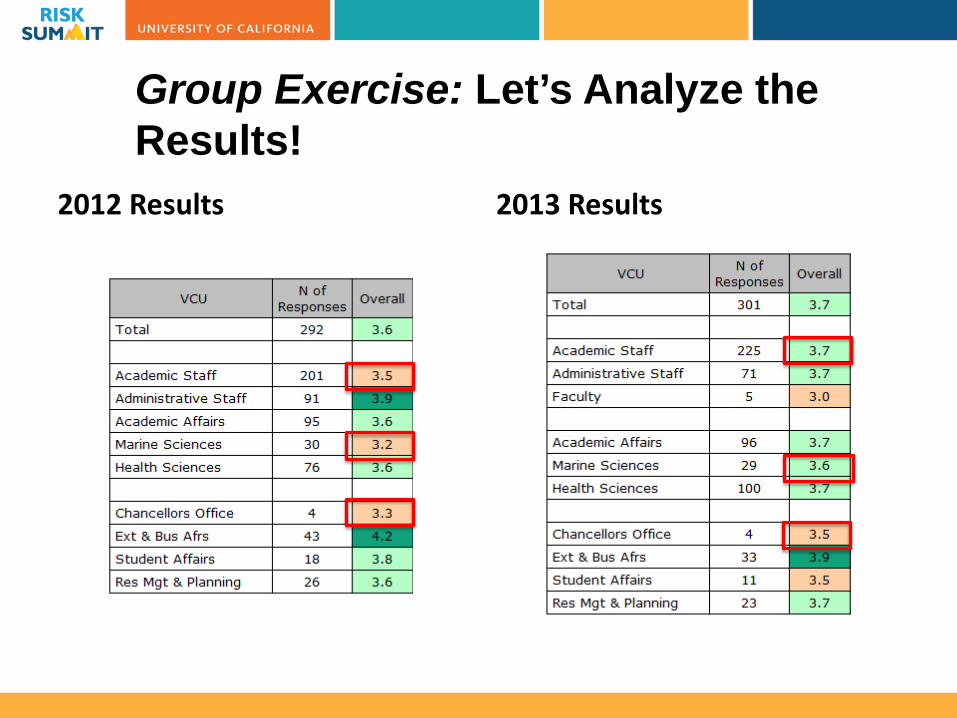
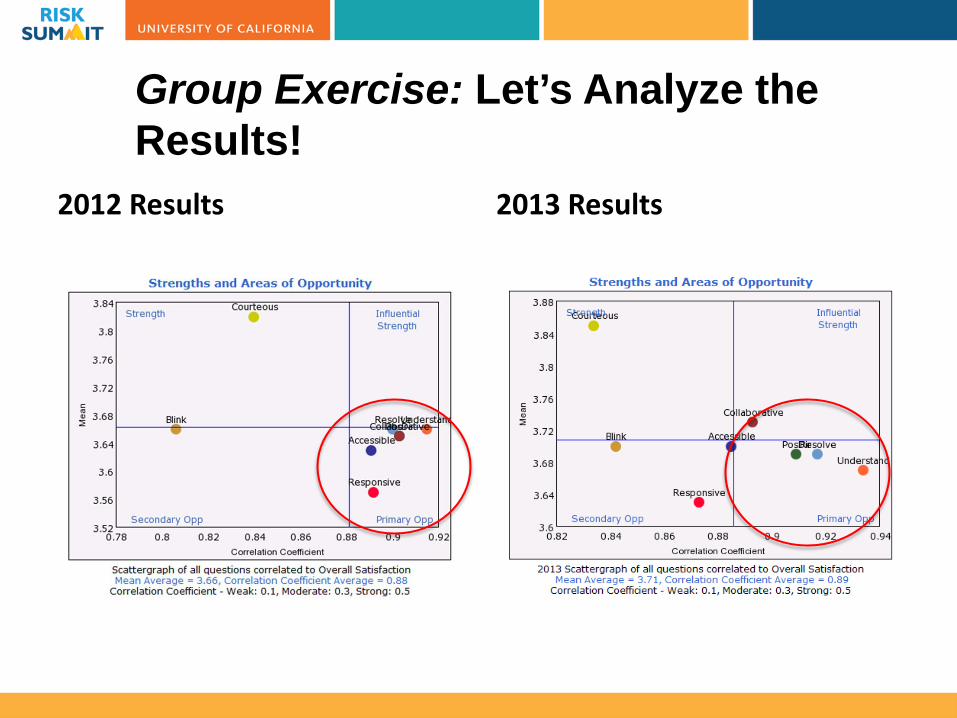
Group Exercise: Let’s Analyze the Results!
2012 Results 2013 Results
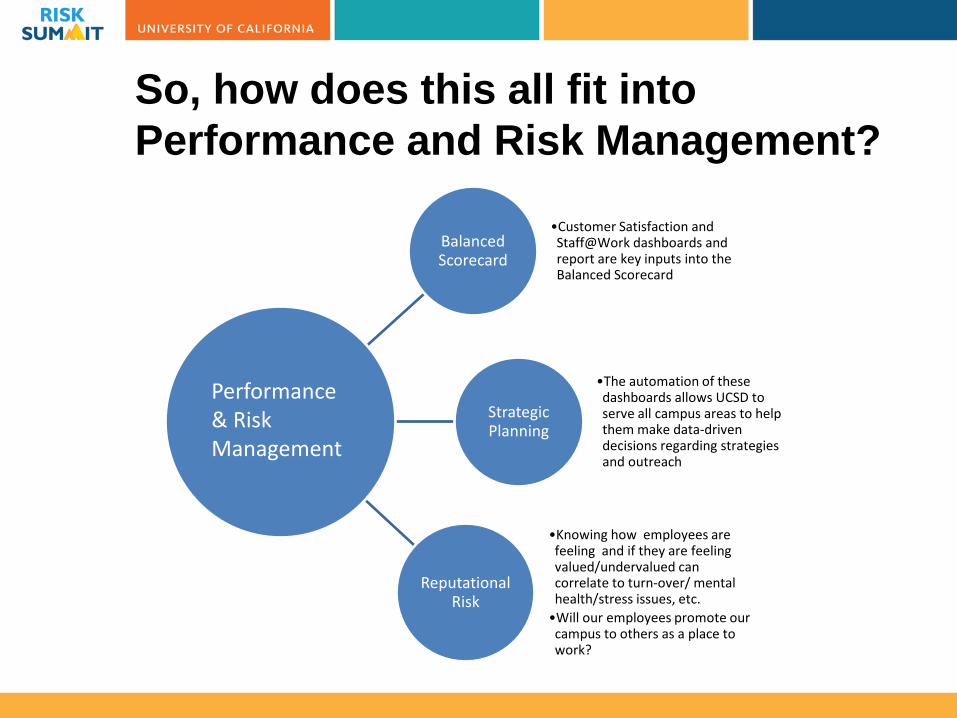
So, how does this all fit into Performance and Risk Management?
Balanced Scorecard
•Customer Satisfaction and Staff@Work dashboards and report are key inputs into the Balanced Scorecard
Strategic Planning
•The automation of these dashboards allows UCSD to serve all campus areas to help them make data-driven decisions regarding strategies and outreach
Reputational Risk
•Knowing how employees are feeling and if they are feeling valued/undervalued can correlate to turn-over/ mental health/stress issues, etc. •Will our employees promote our campus to others as a place to work?
Performance & Risk Management
Questions?
Performance & Risk Management