Tackling Poverty and Inequality in Croatia: The Way Forward
47
January 2020 The World Bank Tackling Poverty and Inequality in Croatia: The Way Forward
Transcript of Tackling Poverty and Inequality in Croatia: The Way Forward

January 2020
The World Bank
Tackling Poverty and Inequality in
Croatia: The Way Forward

2
Contents
Overview and Summary ..................................................................................................................................................... 3
1. Poverty Reduction and Pro-Poor Economic Growth ........................................................................................ 5
2. Inclusive Social Development............................................................................................................................... 12
3. Effectiveness of social protection in protecting poor and vulnerable households ...................................... 25
4. Conclusions and Policy Directions ...................................................................................................................... 34
References ................................................................................................................................................................ 37
Methodological Annex ........................................................................................................................................... 40
Annex I. Additional Figures and Tables .................................................................................................................. 40
Annex II. Poverty Measurement: Relative vs Absolute Poverty .......................................................................... 43
Annex III. Index of Multiple Deprivations (IMD) ................................................................................................ 44
Annex IV. Social Protection Benefits captured in EU-SILC ................................................................................ 46

3
Overview and Summary
This note presents an overview of recent poverty and inequality developments in Croatia to
provide insight into the key challenges for poverty reduction and inclusive growth going forward,
as well as the key development priorities. The note is designed as a support in the process of
preparation of the National Development Strategy of the Republic of Croatia by 2030 (NDS) in the
segment of poverty reduction and inclusive growth.
As an EU member state, Croatia is a part of the Europe 2020 strategy and, accordingly, aims to
decrease the number of persons living at risk of poverty or social exclusion1. By setting a poverty target,
the EU has put social concerns on an equal footing with economic objectives2. In accordance with the main
goal of the Europe 2020 strategy, the Republic of Croatia was aiming to reduce the number of persons at risk
of poverty and social exclusion by 150,000, i.e. from 1,370,000 in 2012 to 1,220,000 by 2020.3 These targets
have already been met in 2015, and the percentage of people at risk of poverty or social exclusion is firmly on
a downward path but remains above the EU average. These trends should be taken in the context of shifting
demographics, notably the population decline observed in recent years due to natural decreases and
outmigration. Positive trends are also observed when looking at absolute poverty.4 Further progress depends
on continuation of positive economic trends and government’s ability to develop the right set of policies and
programs and an effective targeting mechanism to ensure that these policies reach the people and communities
that need them the most, which requires detailed knowledge on the disparities in living standards across time
and space.
Despite progress in poverty and inequality in recent years, several challenges may hinder further
improvements going forward. First, progress during the more recent period 2013-20165 has been relatively
slow, with absolute poverty rates and welfare levels only returning to the 2009 levels in 2016, suggesting that
1 Croatia’s official poverty statistics are based on a relative measure, the at-risk of poverty rate (AROP), and the at-risk-of poverty and social exclusion indicator (AROPE), defined as the share of people who are at risk-of poverty or severely materially deprived or living in households with very low work intensity. The instrument used to construct this measure is the European Union Statistics on Income and Living Conditions (EU-SILC). 2 Source: European Commission, 2018b 3 Source: Croatia Ministry of Social Policy and Youth, 2014. “Strategy for Combating Poverty and Social Exclusion in the Republic of Croatia, 2014-2020”. 4 When measure changes in poverty over time, absolute poverty is preferable to relative poverty since it is based on fixed poverty lines that aim to capture a minimum standard of living. Measures of relative poverty are useful to identify segments of the population that may be lagging considerably behind the rest of the country. See Annex II for details. 5 In this note, we discuss poverty developments for two periods: a period of increasing poverty after the global financial
crisis (2009-2013), and a period of decreasing poverty (2013-2016). These periods do not coincide with phases of the recent economic cycle. Namely, the recession in Croatia lasted for six years, from 2009 until 2014, and recovery started in
2015, two years after poverty started to decrease.

4
the crisis has had long lasting welfare effects; this evidence highlights persistent vulnerability to future income
shocks that must be addressed through effective social safety net programs. Second, despite the recent welfare
improvements, significant inequalities exist between many segments of the population; in particular, spatial
disparities are still wide and persistent and represent a challenge for regional development policy. Third, social
transfers play a considerable role in reducing poverty and inequality in the EU, and Croatia is not the
exception, but there is scope for improving the effectiveness of social assistance programs.
Given these challenges, to further accelerate progress attention should be paid to the following
development priorities:
• Accelerate pro-poor economic growth: To achieve sustained poverty reduction, Croatia must
pursue economic growth that involves and benefits poor and vulnerable people. As shown later, not
all growth processes in Croatia have translated into poverty reduction.
• Promote inclusive social development: Economic growth must be accompanied by effective
social development programs that enable poor and vulnerable groups in society to benefit from the
increasing opportunities it provides. Special attention should be paid to the groups that are left
behind as well as the lagging regions.
• Improve effectiveness of social protection: Social policy efforts may need particularly to focus on
providing social protection to those who are vulnerable to economic shocks because of age, illness,
disability, natural disasters, and economic crises.
The note is organized as follows. Section 1 highlights the importance of pro-poor economic growth going
forward, while presenting the evidence on the relationship between growth and poverty in recent years, and the
central role of labor market developments and pensions in explaining the most recent poverty trends. Section
2 discusses the importance of focusing on the groups that are being left behind in the growth process, as well
as the lagging regions. It provides evidence on the spatial dimensions of poverty and non-monetary deprivations
in the country, drawing heavily upon the Index of Multiple Deprivation (IMD) and Small Area Estimates (SAE)
of poverty. Section 3 discusses the vulnerabilities that Croatian households face when impacted by economic
shocks and the effectiveness of social protection programs in protecting the poor and vulnerable. Section 4
concludes and provides policy directions.

5
1. Poverty Reduction and Pro-Poor Economic Growth
Rapid, broad-based economic growth is an important factor to achieve poverty reduction
Economic growth has recovered since the global financial crisis, but the recovery of the Croatian
economy started later and was weaker than in other Central and Eastern Europe (CEE) countries. The
Croatian economy was performing well until the global economic crisis, with growth averaged 4.1 percent
annually over the period 2004-2008, mostly fueled by booming domestic demand, strong capital flows and
robust domestic credit growth, rather than broad-based productivity growth.6 In 2009, real GDP fell drastically
by 7.3 percent (Figure 1 Panel a). In 2013, the country joined the European Union (EU) in the midst of a
prolonged recession. While growth was reignited in 2015, substantial structural weaknesses remain, and
Croatia’s real convergence process is yet to be restored to the pre-crisis pace. In the period 2015-2017, average
annual real GDP growth reached 3.0, mainly because of rising exports of goods and services and a recovery in
household consumption, supported by personal income tax cuts and low inflation.7 Notably, the average annual
real GDP growth over the period 2013-2017 is still well below pre-crisis levels (Figure 1, panel b). Private
consumption trends have mirrored GDP growth rates.
Figure 1. In the aftermath of the recent financial crisis and subsequent recession, slow recovery has been observed
a. Real GDP and Private Consumption Growth, Percent, 2004-2017
b. Compound Real GDP Annual Growth Rate, 2004-2017
Source: For GDP Growth, World Bank World Development Indicators based on GDP, PPP (constant 2011 international $) For private consumption, EUROSTAT, change in chain linked volumes related to previous year.
Since the global crisis, poverty rates have closely tracked overall economic growth; a trend of
decreasing absolute poverty8 is observed in recent years, regardless of the poverty line used. In the
6 Source: World Bank (2019a). 7 Source: World Bank (2019a). 8 In this note, we use the two measures of income-based poverty to monitor trends in absolute poverty. First, a measure of absolute poverty using the international $5.50 USD PPP 2011 per capita per day poverty line, associated with upper-
3.9 4.1 4.9 5.3
2.0
-7.3
-1.5-0.3
-2.3-0.5 -0.1
2.43.52.9
-10.0-8.0-6.0-4.0-2.00.02.04.06.08.0
Per
cen
t
GDP growth (annual %)
Private Consumption Growth
4.1
-1.2
2.2
-2.0
-1.0
0.0
1.0
2.0
3.0
4.0
5.0
2004-2008 2009-2013 2013-2017
Per
cen
t

6
period 2009-2013, weak economic growth and slower employment creation led to declining incomes, with
absolute poverty rates (measured by the UMI poverty line) increasing from 4.7 percent in 2009 to 7.3 percent
in 2013 (Figure 2 Panel a). During the most recent period 2013-2016, faster growth translated into significant
poverty reduction, with poverty rates reaching pre-crisis levels by 2016. Datt-Ravallion decompositions of
changes in poverty show that the majority of poverty reduction in this period was driven by growth, rather than
redistribution (See Annex I, Figure 23 for details).9 This is in contrast with the pre-crisis growth, a period in
which strong growth did not translate into better incomes among the poor and poverty reduction.10 Absolute
poverty levels are now similar to other EU countries such as Lithuania, but well below the levels seen in
Romania and Bulgaria (Figure 2 Panel b). Similar poverty trends are observed when using other poverty lines:
anchored at-risk-of-poverty rates reached a peak of 22.6 percent in 2013 but decreased afterwards, reaching
15.6 percent in 2016.
Figure 2. Poverty rose after the global financial crisis and progress has been observed in recent years, but levels are still high for EU standards (a) Income-based poverty rate, upper-middle income (UMI) poverty line (24.9 kuna per day in 2016 prices), Percent, 2004-2016
b. Income-based poverty rate, upper-middle income (UMI) poverty line (24.9 kuna per day in 2016 prices), Percent, EU countries, 2016
middle income (UMI) countries. We include this measure to benchmark poverty in Croatia against EU-28 countries. Second, an anchored measured of the national poverty line. National at risk of poverty lines in the EU are defined in relative terms and defined by the share of the population living on less than 60 percent of median income in a given year (at-risk-of poverty rate). For a full discussion on using absolute poverty measures to monitor poverty over time, rather than relative measures (AROP), see Annex II. 2016 poverty estimates use income data from the 2017 survey year of the EU-SILC. More recent absolute poverty rates are not available. 9 For a discussion of measurement of pro-poor growth, see Ravallion and Chen (2003). For empirical evidence of pro-poor growth, see Kraay (2006). 10 As seen in Figure 2 Panel a, poverty rates using the international upper-middle income country (UMI) poverty line slightly increased from 3.2 percent to 3.7 percent over the period 2004-2008, despite strong real output growth.
3.23.7 3.4
4.3
4.7
6.2
7.2 7.3 7.3
6.15.5
4.4
0
1
2
3
4
5
6
7
8
Per
cen
t
HBS EU-SILC
4.4
0
5
10
15
20
25
CY
P
FR
A
SV
N
BE
L
FIN
ML
T
LU
X
NL
D
DN
K
GB
R
CZ
E
SW
E
IRL
AU
T
EST
PO
L
HU
N
PR
T
ESP
ITA
SV
K
LV
A
HR
V
LT
U
GR
C
BG
R
RO
U
Per
cen
t

7
c. At-risk-of-poverty (AROP) rate anchored at a fixed moment in time (2011), Percent, 2004-2016
Source:
For Poverty Headcount Rates (UMI): For the period 2004-2010, World Bank estimates using income from Household Budget Survey (HBS). For the period 2009-2016, World Bank estimates using 2010-2017 EU-SILC UDB-C. The poverty line of 24.9 Kuna per day corresponds to the US$ 5.5 per day (2011 PPP Dollars) poverty line. The income poverty measure based on HBS may not be fully comparable to the EU-SILC measure, due to differences in survey instruments. Estimates are reported using income year, not survey year. For Anchored AROP: For the period 2009-2016, World Bank estimates using 2010-2017 EU-SILC UDB-C. This corresponds to the headcount poverty at 60 percent of the national median adult equivalent disposable income anchored to 2011, for time comparability. Estimates are reported using income year, not survey year. No data are available before 2009.
Considering the overall welfare changes over the
period 2009-2016, the median Croatian household
has experienced small increases in their
disposable income and the country is only now
reaching its pre-crisis income levels. Despite
income per capita of households along most of the
welfare distribution increased rapidly beginning in
2014, growth has not been fast enough relative to the
sizable 15 percent reduction in median incomes
between 2010 and 2013 (Figure 3).11 In 2016, median
real income12 was slightly above the 2009 levels. Every
11 This drop in median incomes in Croatia as a result of the crisis is large for EU standards. At the EU level, median
household incomes dropped by approximately 5 percent between 2007 and 2014 before growth resumed. By way of contrast, median incomes in the US dropped by 10 percent during the Great Recession. Source: World Bank (2019f).
12 Using median, rather than mean income, results in a much more accurate picture of the typical income of the middle
class since the data will not be skewed by gains and abnormalities in the extreme ends.
16.919
2122.622.4
20.618.4
15.6
0
5
10
15
20
25
Per
cen
t
EU-SILC
Figure 3. Median household income per capita only reached pre-crisis levels by 2016
Source: World Bank estimates using 2010-2017 EU-SILC
UDB-C.
0.80
0.85
0.90
0.95
1.00
1.05
2009 2010 2011 2012 2013 2014 2015 2016
Inco
me
of
gro
up
co
mp
ared
to
2009
Bottom 20 20-40
Top 20 Median
Income, 2009=100

8
quintile has experienced a full recovery except for the richest 20 percent, whose income remains below 2009
levels.
Not all growth processes are equal: given rates of economic growth have led to different rates of poverty reduction in Croatia; pro-poor growth is needed
Since the crisis, economic growth in Croatia has generally been pro-poor13. During the period 2009-2013,
weaker economic growth led to a decreasing household welfare among all population quintiles, with richer
households being disproportionately affected. Annual median per capita household disposable income fell
significantly (about 15.5 percent). While those the bottom quintile suffered a 15.1 percent reduction, the top
20 percent of the income distribution suffered a 17.7 percent decline (Figure 4 Panel a and b). During the more
recent period 2013-2016, income grew substantially across the welfare distribution (averaging 5 percent
annually) and benefited the poor more, with much higher growth among the poorest decile than among other
groups in the welfare distribution14; these patterns of income growth are also consistent with the downward
trend in poverty reduction observed during this period and a small decline in inequality.
Figure 4. Growth incidence curves and income growth by quintile, Period 2009-2016 a. Growth incidence curves, 2009-2016
b. Average household per capita income, 2009-2016
Source: World Bank estimates using 2010-2017 EU-SILC UDB-C. Note: The Growth Incidence Curve (GIC) captures graphically the annualized growth rate of per capita income for every percentile of the income distribution between two points in time. Right graph: Q1 refers to the bottom (poorest) quintile while Q5 refers to the richest quintile. Numbers above bars represent the cumulative growth rates over the period 2009-2013, showing the depth of the welfare losses.
This is in contrast with the pre-crisis period (2004-2008) in which the benefits of strong growth did not
reach the poorest Croatian households. During this period, economic growth contributed to rising welfare
13 There are two definitions of pro-poor growth, an absolute and a relative definition. Under the absolute definition, growth is considered to be pro-poor as long as poor people benefit in absolute terms, as reflected in some agreed measure of poverty (Ravallion and Chen, 2003). In contrast, in the relative definition, growth is “pro-poor” if and only if the incomes of poor people grow faster than those of the population as a whole, i.e., inequality declines (Dollar and Kraay, 2002). 14 This evidence suggests that growth during this period was pro-poor both in absolute and in relative terms.
-15.1%-16.3%
-15.5%
-15.7%
-17.7%
0
10,000
20,000
30,000
40,000
50,000
60,000
70,000
Q1 Q2 Q3 Q4 Q5
Ho
use
ho
ld in
com
e p
er c
apit
a in
2016 k
un
a
2009 2013 2016

9
across most income groups except those at lowest decile; in fact, income growth followed an inverted-U trend,
with the second quintile of the welfare distribution experiencing the highest growth rates (7.5 percent). In
contrast, the welfare of households in the bottom 20 percent of the welfare distribution grew at a much smaller
rate (0.6 percent), highlighting systematic gaps in terms of assets and income generation capacity among the
poorest households.15
Rapid growth is indisputably necessary for absolute poverty reduction, but for growth to be sustainable and effective in reducing poverty, it needs to be inclusive
Inclusive growth involves raising the pace of growth and enlarging the size of the economy by
providing a level playing field for investment and increasing productive employment opportunities
across the income distribution. For growth to be inclusive, the empirical evidence suggest it should be broad-
based16 and inclusive of a large part of the labor force. In Croatia, absolute poverty reduction17 in recent years
has been closely related to positive labor market developments, particularly among those at the bottom.
Findings from the decomposition of changes in poverty and income dynamics demonstrate the important role
that employment rates and labor income have had in improving (or deteriorating) household welfare over time.
Contributory social insurance benefits have also played a significant role, while social assistance18 has played a
minor role.
During the period 2013-2016, economic growth translated into job creation and higher labor earnings,
which together with pension income growth, constituted the main drivers behind poverty reduction.
Employment grew by 4.2 percentage points over the whole period, mostly driven by growth in wholesale and
retail, manufacturing and accommodation and food services, sectors in which the employed poor are
15 See Annex I, Figure 24 for details. 16 The term broad-based growth first came into usage in the World Development Report 1990 (World Bank, 1990),
indicating growth that involved a range of sectors across a country’s economy. It is now arguably subsumed within the World Bank’s definition of inclusive growth as ‘broad-based across sectors, and inclusive of the large part of the country’s labour force’ (World Bank, 2009). Recent evidence (Imb and Wacziag, 2013) show that countries diversify and broad their economic base over most of their development path. They start specializing quite late in the development process, and the turnaround point occurs at a robust level of income per capita. This means that increased sectoral specialization applies only to high-income economies. 17 In this note, we focus only on drivers behind changes in poverty incidence, rather than changes in the poverty gap (or the extent of poverty among the poor). 18 In this note, social assistance includes all non-contributory benefits that can be identified in the EU-SILC survey,
including social allowances, education allowance, housing allowance and child allowance. For the poverty decompositions, we aggregate them into one broad “Social assistance” component, given the low contribution of each individual component to poverty changes. We use the same definition in Section 4 for consistency, since we want to link the limited role of social assistance in poverty reduction with changes in coverage, generosity and targeting incidence of social assistance programs, in general. For performance of more detailed SP programs, the EU-SILC is not the most appropriate survey instrument. Other survey instruments such as the HBS, Eurostat/ESPROSS and ASPIRE, can be used to evaluate the effectiveness of more detailed SP programs (see World Bank, 2019c) but links to poverty reduction are difficult, since national and international poverty measures are based on EU-SILC.

10
concentrated19. Unemployment rates among the unskilled (ISCED levels 0-2) decreased by 4.1 percentage
points20 between 2013 and 2016. About 22 percent of the observed poverty reduction was driven by improved
earnings and better labor market outcomes (Figure 5, Panel a and b). Pension income21 contributed to lifting
incomes among the poor substantially, not only due to a slight increase in the share of elderly among the poor,
but also due to the improved coverage and generosity of pension benefits among the bottom quintile during
this period (see section 3 of this note for details). The contribution from social assistance was moderate,
explaining less than 20 percent of the overall poverty reduction. For the anchored AROP poverty line, rising
labor income and better employment outcomes contributed to more than 50 percent of the total reduction of
poverty. Social assistance played a minimal role in driving poverty reduction. Other income, including
household transfers, and demographic factors, did not play a major role either.22
Figure 5. Driving Factors behind Poverty Reduction, Period 2013-2016 a. Decomposition of Changes in Poverty Rates (Percentage Points)
b. Decomposition of Income Growth, by quintile
Source: World Bank estimates using 2010-2017 EU-SILC. Note: Labor Income includes wages, non-cash wages and self-employment income. Social assistance includes social allowances, education allowance, housing allowance and child allowance. Pension income includes old-age pension benefits. Social insurance includes unemployment benefit, sickness, disability and survivor benefits. Income from capital includes private pension income. Other income includes household transfers and under-age income. Share of adults per household capture demographic changes. Q1 refers to the bottom (poorest) quintile while Q5 refers to the richest quintile. Method: Decomposition approach using the Shapley method to simulating changes in the distribution of welfare by changing each component, one at a time, to calculate its contribution to the observed poverty changes. For details, see Inchauste et al (2014).
19 World Bank estimates based on official administrative employment data in legal entities from CBS and EU-SILC. 20 Source: Eurostat. [lfsa_urgaed] 21 In contrast to other countries, pensions in Croatia represent a significant share of household per capita income among the bottom quintile, about 31.6 percent in 2013 and 42.7 percent in 2016. In comparison, the share of labor income among the bottom quintile is close to 30 percent in both years. 22 While recognizing the importance of migration and remittances and their links with poverty and household welfare, in depth analysis on migration goes beyond the scope of this note.
-8 -7 -6 -5 -4 -3 -2 -1 0 1 2 3
Tax Ratio
AE Ratio
Share of Adults
Share Employed
Labor income
Other income
Social assistance income
Pension income
Social insurance income
Capital income
Total change
Percentage point contribution to poverty (percentage points)
2013-2016
At-risk of poverty (anchored in 2011)
24.9 kuna poverty line
-10
-5
0
5
10
15
20
25
30
35
Q1 Q2 Q3 Q4 Q5
Social insuranceincome
Social assistanceincome
Pension income
Other income
Capital income
Labor income
Share employed
Share of adults
Total change

11
Labor mobility can potentially have a positive impact on poverty reduction; however,
its effect depends on the scale of migrant flows and on composition of potential
migrants.
After the EU accession in 2013, Croatia experienced a rapid growth of emigration, with stronger
emigration flows in the regions with high unemployment. According to Croatian Bureau of Statistics
(CBS), prior to the crisis Croatia had a positive net migration balance (number of immigrants – number of
emigrants). However, after 2008 net migration balance turned negative, remaining relatively low and stable until
2013 when Croatia joint the EU. After Croatia became a member of the EU in 2013, emigration outflows
increased significantly, while the number of immigrants was relatively stable, which led to the negative net
migration balance (Draženović et. al, 2018).23 Importantly, outmigration was substantially stronger in the
regions with higher unemployment rates (Eastern Croatia, Central Croatia, Lika and Gorski Kotar).
On the one hand, migrants often gain higher wages after moving to a new country, which may help
them to escape poverty. On the other hand, outmigration of skilled labor may represent a serious
concern for Croatia since it may result in loss of production and human capital. Better employment
opportunities and higher wages in rich EU counties provide economic benefits to emigrants from Croatia -
according to World Bank (2018d), wage differentials between sending and receiving countries is one of the key
factors explaining migration patterns. Moreover, Zaiceva (2014) documents that high outmigration of new EU
members has contributed to wages increase and unemployment decrease in the source country by reducing
excess supply of labor. Outmigration also may have an impact on poverty reduction in the source country if
labour migrants provide sizable transfers to their economy. Finally, the source country’s economy may benefit
from the enhanced human capital of return migrants.
However, the effect of emigration in the source country economy depends on the magnitude and skill
composition of migrant flows. In fact, a positive poverty reduction effect of emigration is possible if the poor
are disproportionally distributed among emigrants. Yet, empirical evidence does not suggest that poor and low-
skilled workers are more likely to emigrate. Vidovic and Mara (2015) analyse the characteristics of potential
Croatian emigrants using survey data for 2014 and their analysis suggest that potential migrants are young,
unmarried, and highly educated. The worldwide empirical evidence suggests that emigration has a positive
impact on wages of “stayers” with intermediate skill levels (see Zaiceva, 2014 for the review). Therefore, it is
not clear whether high outmigration in Croatia has significantly contributed to the observed poverty reduction
trends.
23 Draženović et. al (2018) estimate that about 230 thousand persons emigrated from Croatia to the EU countries in the period from 2013-2016.

12
The effect of migration on poverty of “stayers” remains under-researched, mainly because of the lack
of accurate official data. There is no individual-level international data on cross-country mobility. Even at the
national level, there is limited information on the workers who migrate, because labor mobility is not
systematically collected in official household surveys. Macro estimates of emigration flows for Croatia after EU
accession vary significantly across sources. For instance, official migration statistics collected by the CBC come
from the Ministry of Interior, which capture only individuals who register the change in their country of usual
residence with the Ministry. Emigrants are very likely to underreport their emigration status since its reporting
may result in loss of domestic social security benefits. Therefore, official emigration numbers from CBS tend
to be underestimated, likely due to underreporting. Other indirect estimates based on data from the national
statistical offices in the EU destination countries show striking differences. The data, which contains
information on registered immigrants coming from Croatia, show that following EU accession, the average
emigration flows could be approximately 2.6 times higher than the officially registered numbers in Croatia.
Further research is necessary to shed light on the potential impacts of migration on labor market
outcomes and household welfare. As a first step, it is critical to accurately access the scale of migrant flows
and to analyze the characteristics of migrants; availability of individual-level international data on cross-country
mobility is also important.
2. Inclusive Social Development
Economic growth must be accompanied by effective social development programs that enable poor
and vulnerable groups to participate in the growth process. Despite recent improvements, inequality in
Croatia remains high for EU standards. Some groups are being left behind, including youth and unskilled,
female-headed households,.and households with higher dependency ratios. Spatial inequalities are still
prevalent, with pockets of poverty and deprivations in the eastern part of the country and some areas in the
Adriatic region. A successful strategy of poverty reduction must have at its core measures to promote rapid and
sustained economic growth. The challenge for policy makers is to combine growth promoting policies with
policies that allow the poor to participate fully in the opportunities available to them, allowing them to
contribute to growth.
The growth process in Croatia has resulted in small reductions in inequalities, with levels now close to the average EU levels
Income inequality has been slightly declining, with levels now close to the average EU levels. Croatia’s
Gini coefficient24 stood at 31.6 in 2009 (with 100 being extreme inequality), dropping gradually to 29.9 by 2016
(Figure 6 Panel a). In 2016, Croatia falls in the middle of the Gini distribution in the EU (Figure 6 Panel b), an
24 This measure is based on equivalized income, the preferred measure in the European Union.

13
improvement from 2009 when it was among the top ten most unequal countries in the bloc. This is partly
because, after the crisis, better off households saw deeper declines in their incomes than median and poor
households, and still had not recovered. The at-risk-of poverty rate (AROP), a measure of income inequality
rather than absolute poverty25, has remained stable over the past few years, with 19.3 percent of the population
having incomes below the national poverty line in 2017 (income year). Cross-country literature has found that,
the higher the level of inequality, the higher the growth rate needed to reduce poverty by any given amount
(World Bank, 2005; Ravallion and Chen, 2007).
Despite recent improvements in indicators of inequality, some groups continue to be left behind; the NDS could pay attention to these groups, which alongside increasing equity could also help to counteract the shrinking workforce linked to demographic trends
Poverty is strongly correlated with levels of education, age, health status and labor market conditions.
According to the 2017 EU-SILC data, only 6 percent (of adults aged 25 and over) of individuals in the bottom
40 percent of the income distribution have completed tertiary education, compared to over 20 percent among
the top 60. Among adults aged 30-34, the difference in the attainment of tertiary education is similarly striking:
7 percent in the bottom 40 have completed tertiary education, compared to 36 percent of the top 60. Meanwhile,
the bottom 40 is on average 7 years of younger than the top 60 in Croatia. Lastly, adverse health status (a
subjective measure of individual health status) affects a significantly larger share of the bottom 40 (24%) than
25 See Annex II on poverty measurement for details.
Figure 6. Small inequality improvements between 2009 and 2016
a. Gini Index of equivalized disposable income, Croatia, 2009-2016
b. Gini Index of equivalized disposable income, EU28, 2016
Source: World Bank estimates using 2010-2017 EU-SILC UDB-C. Note: Estimates based on adult equivalents of disposable income. Estimates are consistent with Eurostat and CBS official estimates, but we report income year rather than survey year. 2018 EU-SILC data not available.
31.6 31.2 30.9 30.930.2 30.4
29.8 29.9
25
27
29
31
33
35
2009 2010 2011 2012 2013 2014 2015 2016
Per
cen
t
Croatia Average EU28
29.9
0
5
10
15
20
25
30
35
40
45
SV
K
SV
N
CZ
E
FIN
BE
L
NL
D
DN
K
AU
T
SW
E
HU
N
ML
T
PO
L
FR
A
HR
V
IRL
CY
P
LU
X
EST
ITA
GB
R
RO
U
GR
C
PR
T
ESP
LV
A
LT
U
BG
R
Per
cen
t

14
the top 60 (17%), and a higher share face limitation in activities due to health status (31% vs 27% among the
bottom 40 and top 60, respectively).
Economic opportunities are more limited among the bottom 20 percent, with youth particularly
affected. While the share of the adult population economically active is similar across the income distribution
(Figure 7 Panel a), the unemployment rate among adults aged 15-74 in the bottom quintile is seven times higher
than the unemployment among the richest quintile (Figure 7 Panel b). Youth in Croatia face unique difficulties:
more than three quarters of the young living in households in the bottom quintile are identified as not in
employment, education or training (NEET). Yet again, the share is even higher among young poor women.
Figure 7. Labor market indicators by quintile, 2016
a. Labor force status (aged 15-64) b. Unemployment and NEET
Source: World Bank estimates using 2017 EU-SILC. Note: Q1 refers to the bottom (poorest) quintile while Q5 refers to the richest quintile.
The sectoral composition of the workforce along the income distribution and by poverty status shows
interesting trends: a disproportionate share of the absolute poor work in agriculture and industry and
manufacturing, but in recent years there has been a shift toward services. Between 2009 and 2016, the
share of employment among the poor shifted from agriculture and industry/manufacturing to services (Figure
8 Panel a). This could be the result of movement toward sectors with relatively more job opportunities, since
during the period 2009-2013, services was the most important driver of employment growth.26 In terms of the
level of employment by sector along the income distribution, a clear pattern along the income distribution can
be seen with regards to employment in agriculture (decreasing share from first to fifth quintile) and services
(increasing share from first to fifth quintile). Similarly, the total number unemployed and out of the labor force
grows along the income distribution, a trend that holds in both 2010 and 2014 (survey years). Figure 8 Panel b
26 Cumulative employment growth rate in the service sector over the period 2013-2016 was 10.7 percent, compared to only 1.8 percent in industry. Employment in agriculture fell by 26 percent over the whole period. Source: World Bank estimates based on official published employment estimates based on administrative data.
0%
20%
40%
60%
80%
100%
Q1 Q2 Q3 Q4 Q5
Employed Unemployed Retired Inactive Student
0%
20%
40%
60%
80%
100%
Q1 Q2 Q3 Q4 Q5
Unemployment rate (ages 15-74) NEET (15-24 only)

15
confirms these trends when disaggregating the four sectors to ten. Education and health services, and
wholesale/retail both display positive gradients from first to third quintiles in terms of the share of employment.
Showing the same results between rural and urban households also shows clear trends with regards to
employment in agriculture, services, and the total number of unemployed (the first and third larger in rural
areas, the second substantially larger in urban areas).
Figure 8. Share of employed adults in each sector, by quintile and poverty status
a. By Poverty Status, 2009 vs 2016 b. By quintile, 2016
Source: Left: World Bank estimates using 2010 and 2017 EU-SILC. Poor defined as those with poverty line of 24.9 Kunas. Note: Q1 refers to the bottom (poorest) quintile while Q5 refers to the richest quintile.
The incidence of temporary employment in
Croatia is high and remains well above the EU-
28 average.27 The disproportionate rise in
temporary employment among the poor,
potentially as a result of labor reforms28 to
address the substantial rise in unemployment,
raises concerns about the quality of jobs being
created. While temporary jobs provide flexibility to
employers and employment opportunities for
certain groups entering into the labor force, they
can signal a dual segmented labor market. Temporary employment displays sharp tendencies along the income
27 According to data from Eurostat, the share of temporary employees as a percentage of the total number of employees in Croatia has ranged between 17.3 and 22.5 over the period 2016Q4 and 2019Q2, while the average for the EU-28 countries has fluctuated around 14 percent.
28 The Labour Act was adopted by the Croatian Parliament on 15 July 2014 and aimed to increase labor market flexibility
through:1) more flexibility in working hours; ii) easier cancellation of employment contracts; c) encouragement of atypical forms of employment.
0%
20%
40%
60%
80%
100%
2009 2016 2009 2016
Sh
are
of
emp
loym
ent
Services
Construction
Industry & manufacturing
Agriculture
Poor Non-
Poor
0.1
0.3
0.1
0.2
0.1
0.1
0.1
0.1
0.1
0.0
0% 5% 10% 15% 20% 25% 30%
Agriculture
Manufacturing/energy
Construction
Wholesale, retail
Hotel & restaurant
Transport/communication
Financial services/real estate
Public administration
Education/health
Arts, others
Q5 Q4 Q3 Q2 Q1
Figure 9. Temporary contracts by quintile, 2009-2016
Source: World Bank estimates using 2010 and 2017 EU-SILC. Note: Q1 refers to the bottom (poorest) quintile while Q5 refers to the richest quintile.
0%
10%
20%
30%
40%
Q1 Q2 Q3 Q4 Q5
Sh
are
of
emp
loye
d a
dult
s
2009 2016

16
distribution, and these differences have been magnified since the crisis. As observed in Figure 9, by 2016 nearly
40 percent of the bottom 20 percent of employed adults had temporary employment, compared to just 11
percent of the top 20 percent, and about four times the OECD average. The bottom 40 observed the largest
increases in temporary employment between 2009 and 2016. The share of temporary employed was nearly 3
times higher among young adults (15-24) than all other age groups in 2017 (according to data from Eurostat).
Meanwhile, differences across gender were practically non-existent.
Poverty is most likely to affect
children and older people, and poor
households tend to have higher
dependency ratios. Households with
children are on average 20 percentage
points more likely to fall under the
poverty line than those without. Poor
households are also more likely to have
higher dependency ratios. Figure 10
shows that the dependency ratio is
substantially higher for the bottom 40
and especially for the bottom 20:
approximately 0.6 for the bottom 40 and below 0.2 for the top 40. The ratio of children to working age adults
is only slightly lower than the dependency ratio in the bottom two deciles, suggesting that these households
with high dependency rates are mostly composed of children. Moreover, the share of elderly only households,
while low overall, is slightly higher in the top half of the income distribution. This is consistent with the finding
that absolute poverty using the $5.50 USD PPP 2011 line is lowest among households composed only of elderly
individuals and highest in households with children (Figure 11 Panel a). It should be noted that when using
higher poverty lines, for example the at risk of poverty line, the demographic profile of poverty shifts towards
older households.
The risk of poverty is slightly higher among female-headed households and is particularly high among
households with a female breadwinner and no working males (Figure 11 Panel b). The latter finding is
suggestive of additional vulnerability faced when only females in a dual-gender household receive income from
employment, which reflects underutilization of household assets but also points towards a gender wage gap in
the labor market. Controlling for observable characteristics (including age, education and sector of
employment), hourly wages for females are estimated to be between 17 and 19 percent lower relative to males.
Figure 10. Dependency condition of households along the income distribution, 2016
Source: World Bank estimates using 2017 EU-SILC. Note: 1 and 10 correspond to the poorest and richest decile of the income distribution, respectively.
0
0.2
0.4
0.6
0
0.25
0.5
0.75
1
1 2 3 4 5 6 7 8 9 10
Sh
are
of
po
pula
tio
n
Rat
io
Dependency ratio No dependents
Elderly only Ratio of children to working age

17
Figure 11. Share of absolute poor and vulnerable households by demographic composition of the household, 2016
a. By age composition b. By gender-earning composition
Source: World Bank estimates using 2017 EU-SILC. Note: The “vulnerability” line of 98.15 Kuna per day corresponds to the US$ 21.7 per day (2011 PPP Dollars) poverty line. This line corresponds to the median poverty line of 29 high-income countries,
Demographic aging in Croatia means that promoting social inclusion of these groups is not only a
moral imperative but also smart economics. By 2030, one in four Croatians will be over 65 and Croatia’s
fertility rate in 2018 is already well below replacement levels. These trends have been driven by improvements
in life expectancy, persistently low fertility rates and high net out-migration rates of mostly young people
over the last decades.29 Investing in the skills and productive inclusion of the groups that are left behind
could help to counteract rising pension and health care costs and a shrinking labour force.
An important dimension of inclusiveness is the spatial dimension, as often pockets of poverty and deprivations persist in areas where development has not proceeded effectively.
Croatia is interested in designing policies and programs to reduce regional disparities within its
national borders. As one example, the Strategy on Combating Poverty and Social Exclusion in Croatia (2014-
2020) specifically cites taking a regional approach as part of its strategy to reduce poverty and social exclusion.
Disparities in regional development are reflected in disparities in household income, with a relatively high
concentration of poverty in the eastern part of the country and some areas in the Adriatic. The absence of
economic growth and development in the lagging areas could spur additional outward migration, which
29 Source: World Bank, 2019d.
0% 50% 100%
No dependents
Children, no elderly
Children & elderly
Elderly, no children
Only elderly
Poor, (<24.90 kuna (2016))
Vulnerable (24.90-98.15 kuna (2016))
Non-poor
0% 50% 100%
No working age adultswork
Male bread winner,females do not work
Male breadwinner,females work
Male breadwinner, noworking age female
Female bread winner,males do not work
Female bread winner,males work
Female breadwinner, noworking age male
Poor, (<24.90 kuna (2016))
Vulnerable (24.90-98.15 kuna (2016))
Non-poor

18
combined with low fertility rates and population ageing can decrease human capital levels and put pressure on
social security systems.
There is substantial evidence on spatial poverty and social exclusion in Croatia and evaluation of the
effectiveness of social benefits in reducing poverty for small sub-national areas in Croatia. In 2016-
2017, the World Bank worked with Croatia’s Central Bureau of Statistics (CBS), Ministry of Regional
Development and EU Funds (MRDEUF), and the Ministry of Demography, Family, Youth and Social Policy
(MDFYSP) on a project that included the production of localized estimates of absolute consumption and
income poverty and indicators of multiple deprivations using small area techniques (described in greater detail
below). The project also included a pilot survey of access to and quality of services.
This evidence shows large gaps across space which threaten the inclusiveness of economic
development across regions in Croatia; dispersion in income between regions has increased, with
Zagreb shifting ahead and other regions considerably lagging behind The highest geographical
concentration of factors influencing the share of people at risk of poverty can be found in small towns and
settlements in the east and southeast of the country mainly along the border with Bosnia & Herzegovina and
Serbia. These areas are also those affected most by the Homeland war in the 1990s. Zagreb was and still is
ahead of other regions. After EU membership, initially worse off regions have experienced more limited gains
implying a continued regional lag and rising dispersion across regions.
Monetary poverty is concentrated in the eastern part of the country and in some areas in the Adriatic
region.30 The at-risk-of-poverty rates for municipalities, and cities and districts of Zagreb are illustrated in
Figure 12 Panel a. Overall income poverty in the central and eastern part of the country, at almost 30 percent,
and more than 70 percent larger that of the Adriatic. Grad-Zagreb is the least poor county in the Republic of
Croatia, with an at-risk-of-poverty rate close to 10 percent, but has the third highest concentration of the
country’s poor due to having a high population density. On the other hand, the county with the lowest
concentration of poor is in the Adriatic region, Ličko-senjska; this county has an at-risk-of-poverty rate which
is relatively high, close to 20 percent, but it is one of the least populated counties in the country. Figure 12
Panel b illustrates regions that are significantly different from their neighbors, and regions with high and low
poverty areas (hot spots)31. Pockets of poverty in the East of the country suggests that further analysis into its
outcomes and circumstances are needed to find areas where the region may be lagging (World Bank, 2018a).
30 Direct poverty estimates from the EU-SILC are only reliable at the statistical area level, and thus at the NUTS-2 level. This complicates the analysis of poverty at more disaggregated levels since the reliability of direct estimates are questionable. Small-area estimation techniques were used to overcome the lack of precision at lower geographical levels, by combining this data with data from the 2011 of Population, Households and Dwellings 2011 (World Bank, 2018a). 31 Hot spot analysis is used to define areas of high occurrence versus areas of low occurrence.

19
Figure 12. Income Poverty Maps in Croatia (2011) a. Poverty Headcount for municipalities, cities and
districts of Zagreb b. Hotspot Analysis
Source: World Bank (2018a). Note: Left: Small-area estimates. Adult equivalized Income poverty. At risk of poverty threshold defined as 60 percent of the median adult equivalized disposable income (24,000 HRK). Right: The designation of an area as being a hot spot is expressed in terms of statistical confidence.
But given that poverty has more than the income dimension, the strategy going forward should focus also on the non-monetary dimensions of poverty.
Beyond monetary poverty, other indicators of deprivation –economic and social indicators, access to
services and infrastructure – show substantial spatial development gaps; in this context, the Index of
Multiple Deprivations is a critical tool to assist the development of the right mix of policies targeted
to the lagging regions and municipalities. To support economic and social convergence across regions and
align line ministries towards a common goal, an Index of Multiple Deprivation (IMD) for municipalities (LAU2)
for the period 2012-2015 was developed using available socioeconomic data and data on access to infrastructure
from a variety of sources32 (World Bank, 2017a). The index is a weighted aggregation of specific indicators of
poverty and social exclusion, categorized under three domains of deprivation (Economic, Social and Access to
Services) and their respective subdomains. 33 Domains (and Indicators) can be mapped separately, or together
as a map of Multiple Deprivation. Figures 13 Panel a shows the IMD Gap score for the 2013-2015 period,
where a higher score indicates higher levels of deprivations. Figure 13 Panel b shows in red the areas in a hot
32 The principal sources are administrative registries, the Central Bureau of Statistics, and the 2011 Census of Population,
Housing, and Dwellings. 33 The index uses districts as units of observation. See Annex III for details.

20
spot, meaning with a spatial weighted IMD value statistically significantly above the national average, and in
blue the regions in which the spatial weighted IMD is statistically significant below the national average. This
information can then be used to inform the design of policies and the allocation of resources through providing
detailed information on each place’s characteristics and competencies. 34 The information from the index can
assist with tailoring policies to each place’s characteristics and competencies. For instance, the IMD shows that
Croatia should prioritize human capital development in lagging regions and adopt the needed policies,
institutions, and infrastructure to deliver basic social services to the poor effectively.
Figure 13: IMD Score 2015 (left) and Hot-Spots (right)
Source: World Bank (2017a)
Note: IMD scores are three year moving average anchored for the period 2013-2015.
Using the index, clusters of deprivation are still highlighted in the eastern part of the country – but
the dimension of deprivation and priorities vary across municipalities. The spatial pattern of the IMD
mirrors the spatial pattern of monetary poverty, with large differences visible between eastern and central
Croatia and the areas closer to Zagreb. When one looks below the surface at the dimensions of deprivation
faced, it is clear that municipalities in the east of the country vary in their priorities and the domains under
which they are deprived (See Figure 14). While certainly education, and labor market developments show up as
areas that need improvement across almost all municipalities, the needs in other areas may be less pressing
depending on the municipality.
34 A dashboard for the index and municipal level information can be found in: http://dataviz.worldbank.org/t/ECA/views/hrv_imd_eng/DshIMDQuadrantHighlight?iframeSizedToWindow=true&:embed=y&:showAppBanner=false&:display_count=no&:showVizHome=no

21
Figure 14: IMD 2015 Sub-domain Hot-Spots
Source: World Bank (2017a)
The Slavonia region may require special attention, particularly in social protection, health and education
Over time, multiple deprivations have persisted at a higher level in Slavonia relative to the rest of the
country, though some progress has been recently made (Figure 15 Panel a); municipalities in Slavonia
are systematically deprived across multiple dimensions. Figure 15 panel b shows how each IMD
subdomain in Slavonia and the rest of Croatia differ. Values to the right show an increase in the level of
deprivation vis-à-vis the rest of the country, and values to the left show lower levels of deprivation. Results

22
show that deprivation levels are substantially higher in social protection, health and education. A recent labor
market assessment for Slavonia found that the labor force in Slavonia is characterized by low levels of education
and skills, which is often a powerful predictor of unemployment and inactivity (Source: Christiansen et al, 2019).
The gap in the domain of fiscal capacity between Slavonia and the rest of Croatia is also worrisome, and may
reflect governance issues.
Figure 15. Multiple Deprivation Index for Slavonia vs other regions a. Trends in Average Level of Multiple Deprivation b. Average Level of Multiple Deprivation by Subdomain
and Region
Source: World Bank (2017a)
Therefore, the strategy should put focus on both national as well as sub-national efforts, but governance might be a constraint going forward, given territorial fragmentation of the public administration and service delivery
Efforts at the national level alone may not be sufficient for sustainable poverty reduction going forward
if the efforts at a subnational level (province, district and local) towards the National Development
Strategy are also not coordinated in a cohesive way. Particular attention should be paid to territorial
fragmentation and gaps in service delivery.
Territorial fragmentation of the public administration limits its efficiency and further expands regional
disparity.35 Croatia has 556 municipalities and towns, some with populations of less than 300 individuals. This
territorial fragmentation weighs on the efficiency of public provision, and is the outcome of legislative
amendments of 1992, and 2001. Municipalities and towns have competencies and responsibilities in providing
public services, many of these local units lack the capacity to effectively fulfill said responsibilities. The EU
35 Source: EU Commission (2019).
0.09
0.14
0.19
0.24
2009 2010 2011 2012 2013 2014 2015Ind
ex g
ap (
low
er=
> le
ss d
epri
vat
ion
),
Croatia Croatia w/out Slavonia Slavonia
-10% 0% 10% 20%
Economic development
Fiscal capacity
Health and education
Labor market
Physicial infrastructure
Social protection
Social services
Deprivation level in percentage points
Low High
Slavonia Croatia w/out Slavonia Croatia

23
commission report (2019) has remarked that the responsibilities of the local governments often do not match
their financial capabilities.
There is a strong overlap between central and local governments, which hinders the implementation
of public policies and increases costs and leads to inefficiencies in the use of resources. Furthermore,
there is a lack of clarity in the responsibilities and competencies in service provision by the local units. The
country’s authorities have made plans to address territorial fragmentation and other weaknesses in the system,
yet these remain mostly unimplemented36. The 2018 EU commission report noted the need for strengthened
administrative capacity, given its importance in the design and execution of public policy.
Quality and access to services in the country remain below the EU average. During the 2017 round of
the European quality of governance index (EQI),37 Croatia ranked 4th from the bottom among all EU-28
countries (Figure 16). According to the World Bank’s Systematic Country Diagnostic’s (SCD) findings38 and
European Commission reports, ineffective public institutions pose challenges towards policy making and
implementation. The SCD also notes a high fragmentation of local and self-government which reduces the
quality, effectiveness and sustainability of service delivery. This resonates with the evidence that Croatia’s two
NUTS-2 regions are among the EU’s worst performers in the EQI measure, reflecting important efficiency
gaps of regional and local authorities39. Nevertheless, insights gained from the EQI at the NUTS-2 level hide
regional disparities underneath the classification, particularly among the counties of Slavonia.
Figure 16. 2017 EQI ranking at the national level
Source: World Bank (2018b)
36 Source: EU Commission (2018). 37 The EQI measures the level of governance at the national and subnational levels in the European Union, across three pillars: impartiality, corruption, and quality of services (Charron et al., 2014). 38 World Bank (2018c). 39 See Figure 25 in Annex I.
0
10
20
30
40
50
60
70
80
90
Fin
lan
d
Sw
eden
Den
mar
k
Net
her
lan
ds
Luxe
mb
o…
Ger
man
y
Un
ited
…
Irel
and
Aust
ria
Bel
gium
Fra
nce
Est
on
ia
Po
rtuga
l
Mal
ta
Cyp
rus
Lit
huan
ia
Slo
ven
ia
Cze
ch R
ep.
Sp
ain
Po
lan
d
Lat
via
Slo
vak
ia
Ital
y
Hun
gary
Cro
atia
Gre
ece
Ro
man
ia
Bulg
aria
EQ
I V
alue
(hig
her
is
bet
ter)

24
Slavonia, on its own, could be classified among the worst performing NUTS-240 in the EU, according
to a subnational EQI. A pilot survey41 was conducted in the 5 counties42 of Slavonia with the goal of
replicating the EQI for each county. The poor performance of Slavonia’s counties is linked to poor
administrative capacity in the region, which may explain the hindrance towards implementation of European
Structural and Investment (ESI) funds and policies in the country.43
One of the most important priorities in less developed regions is to invest in human capital to create
employment and investment opportunities. ESI funds could assist to such an end, since investing in
education, training and vocational training for skills and lifelong learning is one of the ESI’s thematic objectives.
Poor implementation of ESI funds incumbers the development prospects of Slavonia. The country needs to
promptly tackle the challenges mentioned before it finds itself lagging further behind.
The data agenda, particularly at a sub-national level, as well as data on specific topics such as migration, is critical for monitoring and evaluation
To further strengthen regional planning and monitoring of outcomes at a subnational level, as well as
assess recent spatial developments, more subnational evidence is critical; reliable data on migration
is also important to develop an evidence-based migration policy. Considering that most national surveys
are only representative at NUTS-2 level44, several options can be considered. First, administrative systems can
be strengthened to generate reliable and representative information. Second, the IMD could provide a unique
dataset available at municipal-level that can be used as tool to prioritize projects and interventions for lagging
regions. Finally, movements into and out of the country, as well as between and within municipalities have
significant implications for planning, budgeting and the provision of services at the central and state level;
municipalities are often unable to respond effectively because they do not have sufficient and accurate data
available.
40 According to population figures of the 2011 Census, 806,192 individuals, Slavonia could have been classified as a NUTS-2 region. Although given demographic shifts, it is possible the region’s population is no longer above the NUTS-2 population threshold of 800,000. 41 Conducted by the Ministry of Regional Development and EU Funds and the World Bank. 42 Osječko-baranjska, Vukovarsko-srijemska, Brodsko-posavska, Požeško-slavonska, and Virovitičko-podravska 43 Source: EU Commission (2016). 44 EU-SILC and EU-LFS are representative at the level of NUTS-2 (regions), while the Household Budget Survey is representative at the level of NUTS-1 (national level).

25
3. Effectiveness of social protection in protecting poor and vulnerable
households
Social development efforts should focus on providing social protection to those who are vulnerable to income shocks because of age, illness, disability, natural disasters or economic crises
Conceptually, the social protection system in Croatia is structured around three main pillars: social
assistance, social insurance, and labor market programs. Social assistance includes a non-contributory
means-tested programs such as the last-resort social assistance (Guaranteed Minimum Benefit, henceforth
GMB), as well as disability, family and child related benefits, HBRD/HRVI benefits45 and education allowances.
Social insurance typically comprises benefits based on contributions such as old-age pensions, family and
disability pensions, as well as other benefits such as unemployment, sickness, and maternity leave benefits.
Lastly, labor market programs aim to improve the functioning of the labor market (through employment
services), enhance labor supply (through training) and increase labor demand (through subsidies or public
works).
Social transfers, while below the EU average, represent a substantial share of government
expenditures at nearly 21 percent in 2017; however, the spending on mean-tested and non-contributory
social benefits is low by regional standards. In 2017, expenditure on social protection was 20.8 percent of
GDP, 7 percentage points below the EU-28 average (see Figure 17). It increased at the onset of the crisis and
has remained constant since then. Most of this spending has been directed towards contributory social
protection programs: two-thirds of the social spending budget is captured by old-age benefits, and sickness and
health care benefits. Means-tested social transfers represent less than 5 percent of total spending on social
protection; most social assistance transfers take the form of categorical targeting, with limited use of mean-
testing. Overall, it is estimated, according to 2014 HBS data, that more than 70 percent of the population
benefits from some type of social protection, 96 percent of those in the bottom 20 percent of the consumption
distribution).46
45 These are benefits for Croatian wartime military disabled.
46 Source: World Bank (2019c).
26
Figure 17. Expenditure on Social Protection, % of GDP, 2017
Source: Eurostat
One of the main objectives of social transfers is to reduce poverty. In the European Union, this is generally
examined by comparing at-risk-of-poverty before and after transfers. Both poverty rates are obtained by using
the same threshold, 60 percent of the national median adult equivalent disposable income after social transfers.
This allows for within country comparison, yet precautions should be taken when comparing over time or
across countries since different thresholds are used.
The impact of overall social transfers on reduction of relative poverty tends to be very different across
member states. For example, according to 2018 Eurostat estimates, some member states may reduce relative
poverty by as much as 53.7 percent as in the case of the Finland, while others may only reduce it by 14.7 percent,
such as the case of North Macedonia. The at risk of poverty before transfers in Croatia in 2018 fell by 24.9
percent, a significant reduction but still below the EU28 average (33.2).47
When looking at absolute poverty, the impact is also significant; this is because overall, social transfers
through multiple social protection programs in Croatia represent a significant share of household per
capita income. In 2016, absolute poverty in Croatia (at the 24.9 Kuna poverty line) would have been 5
percentage points higher without social transfers, which represents an increase of more than 50 percent in the
poverty rate.48
47 Source: Eurostat. Impact of social transfers (excluding pensions) on poverty reduction by sex [TESPM050]. It is measured as a reduction in the percentage of the at-risk-of poverty rate, due to social transfers (calculated comparing at-risk-of poverty rates before social transfers with those after transfers; pensions are not considered as social transfers in these calculations). The indicator is based on the EU-SILC (statistics on income, social inclusion and living conditions). 48 Following the Eurostat methodology, “retirement and survivor's pensions” are included into income before transfers and do not count as social transfers.
20.8
0
5
10
15
20
25
30
35
40P
erce
nt

27
When growth slowed down, social safety nets were not fully effective in protecting vulnerable households from declining incomes; vulnerabilities to future shocks must be addressed
During the period 2009-2013, large poverty increases were mostly driven by job losses and a decline in
labor income, as well as a reduction in social insurance income; social assistance played a marginal
role in mitigating the negative income shock. When the global crisis hit Croatia in 2009, unemployment
rates among 15 to 64-year-old increased by 5.1 percentage points, from 9.4 percent in 2009 to 17.5 percent in
201349. The increase among the uneducated (less than primary, primary and lower secondary education) was
even larger (11.7 percent)50, disproportionately affecting the poor. A substantial reduction in labor earnings led
to significant income losses among all quintiles of the welfare distribution (Figure 18 Panel b). The negative
labor income growth -as a result of lower employment rates and labor earnings- accounted for more than half
of the poverty increases using the 24.9 Kuna per day and anchored AROP poverty lines, respectively (Figure
18 Panel a). During the economic downturn, social insurance benefits (excluding old-age pensions) were not
sufficient to counteract income losses, and income associated with contributory social insurance benefits
(excluding old-age pensions) also decreased among the bottom quintile, mostly due to a reduction in coverage
and generosity of these benefits among the bottom quintile; in fact, lower social insurance income accounted
for nearly 40 percent of the increase in poverty (using the 24.9 Kuna per day line). Pension income played a
moderate role in compensating welfare losses among the poorest, but also among other quintiles of the welfare
distribution. All other factors such as social assistance transfers that were not enough to mitigate the negative
impact of the global economic crisis on household welfare among the bottom quintile, and demographic
changes did not play an important role. A comparison with other EU countries shows that Croatian poorer
households were not particularly well shielded during the contraction51.
49 Source: Eurostat, indicator lfsa_urgaed. 50 Source: Eurostat, indicator lfsa_urgaed. Unemployment rates among those with less than primary, primary and lower-secondary education levels increased from 11 percent in 2009 to 22.7 percent in 2013. 51 As presented in a recently published regional EU report (World Bank, 2019f), some EU countries were unable to shield well-off households during periods of contraction, particularly those characterized by low social assistance coverage of the poorest quintile. This was quantified by comparing the response of disposable income before and after transfers of lower-income groups to changes in average incomes. These countries include Croatia, Estonia, Portugal, Spain, Greece and Italy.

28
Figure 18. Driving Factors behind Poverty Increases, Period 2009-2013 a. Decomposition of Changes in Poverty Rates (Percentage Points)
b. Decomposition of Income Growth, by quintile
Source: World Bank estimates using 2010-2017 EU-SILC. Note: Labor Income includes wages, non-cash wages and self-employment income. Social assistance includes social allowances, education allowance, housing allowance and child allowance. Pension income includes old-age pension benefits. Social insurance includes unemployment benefit, sickness, disability and survivor benefits. Income from capital includes private pension income. Other income includes household transfers and under-age income. Share of adults per household capture demographic changes. Q1 refers to the bottom (poorest) quintile while Q5 refers to the richest quintile. Method: Decomposition approach using the Shapley method to simulating changes in the distribution of welfare by changing each component, one at a time, to calculate its contribution to the observed poverty changes. For details, see Inchauste et al (2014).
Despite recent improvements in targeting accuracy, the impact of social assistance programs on poverty reduction has been limited, partly due to the low generosity of programs and limited coverage of the poor.
Social assistance in Croatia includes all non-contributory benefits, including last-resort social
assistance, but also disability, family and children benefits, and education allowances. The last-resort
social assistance scheme includes a subsistence benefit which became a guaranteed minimum benefit (GMB) in
2014. It is a means-tested benefit intended for households whose income is below a basic needs threshold and
depends on the characteristics and composition of the household. Social assistance programs represent a small
portion of the overall spending on social protection, and about 3.4 percent of GDP in 2014. Means-tested
programs account for less than 1 percent of GDP.52 The EU-SILC captures non-contributory transfers,
including educational related allowances, family/child allowances, social exclusion benefits and housing
allowances., but the instrument is not designed to capture small programs.53 Therefore, the grouping of
52 Source: World Bank (2019c) 53 See Annex IV for a full discussion of benefits that can be identified using the EU-SILC.
-2 -1 0 1 2 3 4 5 6
Tax Ratio
AE Ratio
Share of Adults
Share Employed
Labor income
Other income
Social assistance income
Pension income
Social insurance income
Capital income
Total change
Percentage point contribution to poverty
(percentage points)
2009-2013
At-risk of poverty (anchored in 2011)
24.9 kuna poverty line
-30
-25
-20
-15
-10
-5
0
5
Q1 Q2 Q3 Q4 Q5
Social insurance
income
Social assistance
income
Pension income
Other income
Capital income
Labor income
Share employed
Share of adults
Total change

29
programs under “social assistance” based on the EU-SILC may not coincide exactly with the grouping of
programs created by ESPROSS using administrative data, or the grouping of programs made using the HBS
(World Bank, 2019c).
The limited role of overall social assistance (non-contributory) programs in driving income poverty
changes is partly explained by their limited coverage and generosity. Consistent with the low spending,
social assistance (SA) coverage of the income poor is low, with only 42 percent of the bottom quintile of the
income distribution receiving social assistance benefits in 2016. Coverage slightly increased after the global
financial crisis, and then decrease in the recovery period (Figure 19, Panel a).54 When looking only at social
exclusion benefits (which include the GMB) 55, coverage of the bottom 20 percent fluctuates between 9 and 11
percent, which is low by international standards.56. Maintaining adequate coverage of the poor through the
social assistance programs, especially the last-resort social assistance scheme, is imperative as the last-resort
social assistance scheme is the largest poverty-targeted social benefit system in Croatia.
Social assistance programs are not very generous compared to other countries in the Europe and
Central Asia region. Overall social assistance benefits in Croatia represent between slightly above 30 percent
of household per capita income over this period; generosity – captured using the share of household income
contributed by the SA transfer – has been relatively stable in recent years (Figure 19, Panel b). Relative to
comparator countries, the adequacy of this benefit in Croatia is lower compared to other social assistance
programs. When looking only at social exclusion benefits (which include the GMB), benefits amounted to
between 43 and 50 percent of the income of the poorest income quintile.
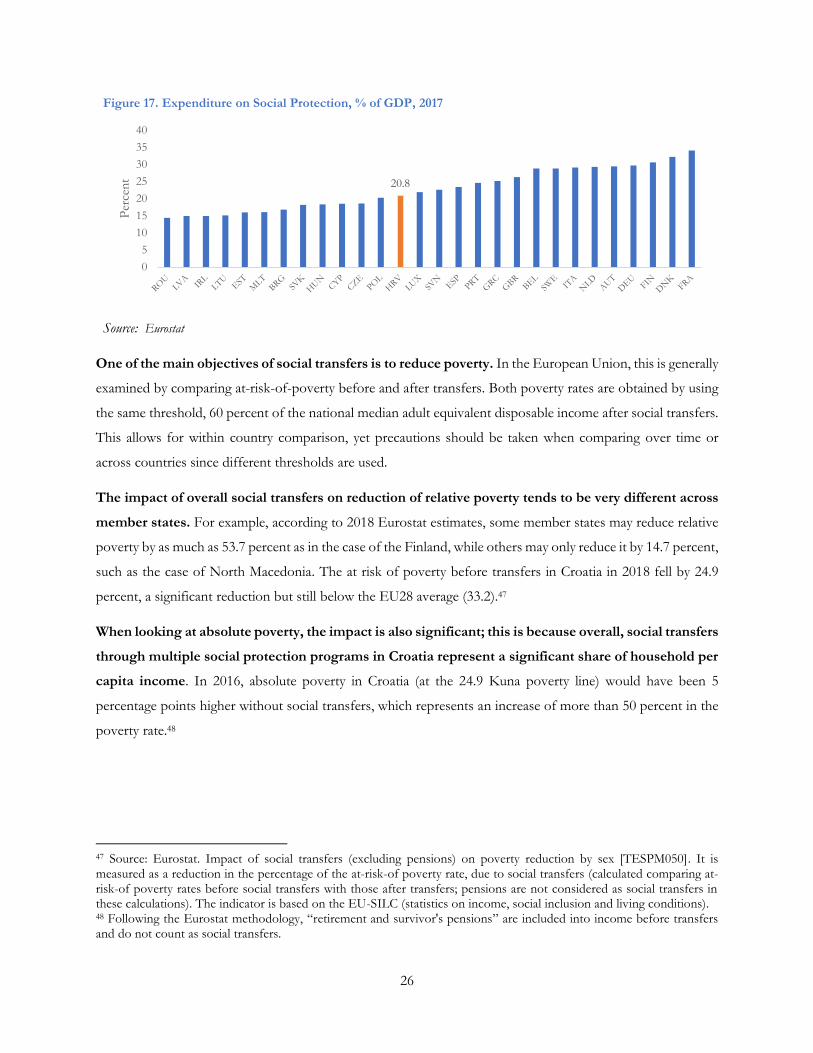
Despite low coverage and generosity, social assistance programs seem to be fairly well targeted and
progressive: 46 percent of SA transfers57 are allocated to households in the bottom quintile and this
share gradually decreases for higher quintiles. This targeting accuracy is relatively good when compared to
other countries in the region.58 Even though there is substantial leakage - less than 70 percent of the transfer
allocated to the bottom 40 - targeting accuracy has improved over time (Figure 19, Panel c). A comparison
54 When measured using the HBS, coverage of social assistance programs among the poorest consumption quintile has varied between 43 and 53 percent over the period 2008 and 2014. Source: World Bank (2019c). 55 Social exclusion benefits captured in the EU-SILC include the GMB but may capture also other small benefits. Note that the number of beneficiary families in administrative data and the number of social exclusion beneficiaries identified in EU-SILC is close (see Annex I Figure 27). More detail coverage measures of other social assistance programs that can be identified in the EU-SILC are also in Annex I. 56 See Annex I Figure 26a. See also World Bank (2019d) for international comparison of last-resort income support schemes. 57 When measured using the HBS, the estimate is quite close: about 47 percent of social assistance benefits go to the poorest consumption quintile in 2014. Source: World Bank, 2019c 58 See World Bank. (2019d) for international comparison of targeting incidence of social assistance programs.

30
between 2009 and 2016 illustrates that this improved targeting results from a larger number of recipients and
slightly more generous transfers to the bottom quintile.
Figure 19. Coverage, Generosity and Targeting Incidence of Social Assistance Programs, 2009-2016
a. Coverage of Social Assistance Transfers , by Quintile b. Generosity: Share of household per capita income constituted by SA Transfers
c. Targeting: Share of SA transfer devoted to each quintile
Note: Social assistance includes all non-contributory benefits, such as social allowances, education allowance, housing allowance and child allowances. Q1 refers to the bottom (poorest) quintile while Q5 refers to the richest quintile. Source: World Bank estimates using 2010-2017 EU-SILC.
A higher fraction of social protection resources is spent on contributory social insurance benefits,
which are less progressive than social assistance due to the contributory nature of these transfers. In
2017, two-thirds of the total social protection budget is allocated to sickness and health care benefits, and old-
age benefits; another 10 percent is absorbed by contributory unemployment benefits.59 Social insurance includes
all contributory benefits (excluding old-age pensions) such as unemployment, survivors, sickness and disability
benefits that can be identified in the EU-SILC. Coverage and generosity of social insurance among the bottom
59 Source: World Bank 2019c.
0.40
0.460.42
0%
10%
20%
30%
40%
50%
Q1 Q2 Q3 Q4 Q5
SH
are
of
ho
use
ho
lds
in
quin
tile
co
ver
ed
2009 2013 2016
0.310.33 0.32
0%
5%
10%
15%
20%
25%
30%
35%
Q1 Q2 Q3 Q4 Q5
Aver
age
shar
e o
f H
H in
com
e
2009 2013 2016
0.35 0.41 0.46
0%
20%
40%
60%
80%
100%
2009 2013 2016Quin
tile
sh
are
of
tota
l tr
ansf
ers
Q1 Q2 Q3 Q4 Q5

31
quintile is low and has been decreasing since 200960; this has been mostly driven by a reduction of coverage in
unemployment and disability benefits among the bottom quintile.61After the crisis, coverage of social insurance
benefits dropped for most segments of the welfare distribution, except for the fourth quintile (Figure 20 Panel
a); the generosity of social insurance benefits decreased as well for most quintiles (Figure 20 Panel b). This
pattern, together with a relatively uniform coverage of social insurance across the welfare distribution explains
why less than 40 percent of transfers go to the bottom 40, compared to close to 50 percent for the top 40
(Figure 20 Panel c).
Figure 20. Coverage, Generosity and Targeting Incidence of Social insurance Programs, 2009-2016
a. Coverage of Social Insurance Transfers, by quintile b. Generosity: Share of household per capita income constituted by Social Insurance Transfers
c. Targeting: Share of Social Insurance transfer devoted to each quintile
Source: World Bank estimates using 2010-2017 EU-SILC. Note: Social insurance includes all contributory benefits (excluding old-age pensions) such as family and disability pensions, as well as other benefits such as unemployment, sickness, and maternity leave benefits. Q1 refers to the bottom (poorest) quintile while Q5 refers to the richest quintile.
60 These measures cannot be directly compared with those produced using the HBS (World Bank, 2019c) given that in
this note social insurance exclude old-age pensions. 61 For details of coverage of unemployment benefits, survivor’s benefits, disability and sickness benefits separately, See Annex I, Figure 28.
0.410.39
0.31
0%
10%
20%
30%
40%
50%
Q1 Q2 Q3 Q4 Q5
SH
are
of
ho
use
ho
lds
in q
uin
tile
co
ver
ed
2009 2013 2016
0.650.60
0.58
0%
10%
20%
30%
40%
50%
60%
70%
Q1 Q2 Q3 Q4 Q5
Aver
age
shar
e o
f H
H in
com
e
2009 2013 2016
0.12 0.11 0.13
0.17 0.17 0.23
0%
20%
40%
60%
80%
100%
2009 2013 2016
Quin
tile
sh
are
of
tota
l tr
ansf
ers
Q1 Q2 Q3 Q4 Q5

32
Old- age pensions are largely contributory and reflect earlier wages in the labor market; as such old-
age pensions are regressive as relatively wealthier households receive higher transfers; pensions are
also less pro-poor than social welfare benefits, with only 7 percent of the pension benefits going to the
poorest income quintile. Old-age pensions, the largest social protection spending category in Croatia, is below
the EU average and it is almost exclusively non-means tested. In 2017, spending in old age pensions was 7.1
percent of Croatian GDP (with only 0.1 percent of this being means-tested), while the average spending in the
EU-28 was 10.9 percent.62 Between 2009 and 2013, the share of households in the bottom 40 percent receiving
old-age pensions decreased (Figure 21 Panel a)63, possibly reflecting demographic changes64 but also the reforms
that were implemented after the recession to strengthen the financial sustainability of the pension system65.
During this period, pension transfers became more generous for the richest quintile, but less so among the
poorest (Figure 21, Panel b). A similar picture arises in terms of the allocation of funds, where the share of
financial resources allocated to the poorest quintile decreased from 7 percent to 5 percent, and the
corresponding indicators for the wealthiest quintile increased from 28 percent in 2009 to more than 40 percent
in 2013 (Figure 21 Panel c). This suggests that there has been substantial re-ranking of households during the
crisis period, when households with steady income from old age pensions moved up in the welfare distribution.
Figure 21. Coverage, Generosity and Targeting Incidence of Old-Age pensions, 2004-2016
a. Coverage of old-age pensions, by Quintile b. Generosity: Share of household per capita income constituted by old-age pensions
(c) Targeting: Share of old-age pensions transfer devoted to each quintile
62 Source: World Bank (2019c). 63 When using the HBS, old-age pension coverage of the consumption poor is slightly higher, about 43 percent in 2014. Source: World Bank (2019c). 64 Notably, the share of elderly among the bottom quintile decreased significantly between 2009 and 2013. 65 These reforms focused on increasing the retirement age and an increase in the minimum contributions period to be entitled to an old-age pension (see World Bank, 2019d for details), which could have affected the share of households covered by old-age pensions.
0.28
0.20
0.32
0%
10%
20%
30%
40%
50%
Q1 Q2 Q3 Q4 Q5
SH
are
of
ho
use
ho
lds
in
quin
tile
co
ver
ed
2009 2013 2016
0%
20%
40%
60%
80%
Q1 Q2 Q3 Q4 Q5
Aver
age
shar
e o
f H
H in
com
e
2009 2013 2016
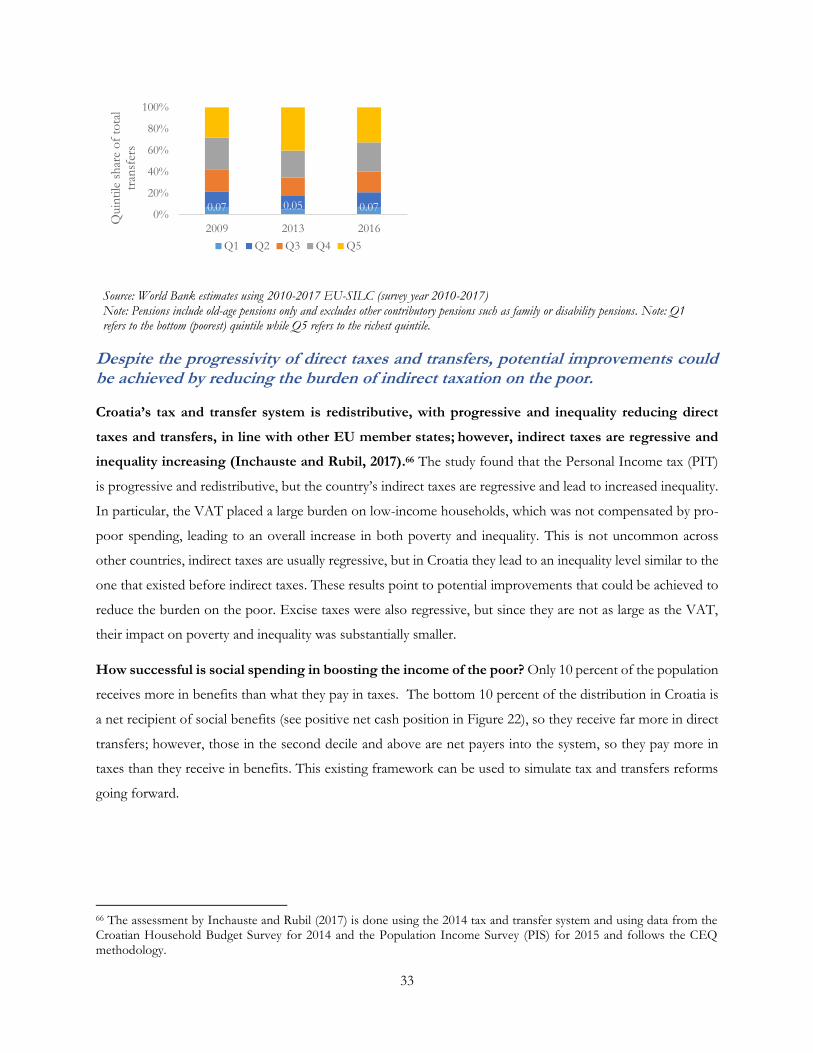
33
Source: World Bank estimates using 2010-2017 EU-SILC (survey year 2010-2017) Note: Pensions include old-age pensions only and excludes other contributory pensions such as family or disability pensions. Note: Q1 refers to the bottom (poorest) quintile while Q5 refers to the richest quintile.
Despite the progressivity of direct taxes and transfers, potential improvements could be achieved by reducing the burden of indirect taxation on the poor.
Croatia’s tax and transfer system is redistributive, with progressive and inequality reducing direct
taxes and transfers, in line with other EU member states; however, indirect taxes are regressive and
inequality increasing (Inchauste and Rubil, 2017).66 The study found that the Personal Income tax (PIT)
is progressive and redistributive, but the country’s indirect taxes are regressive and lead to increased inequality.
In particular, the VAT placed a large burden on low-income households, which was not compensated by pro-
poor spending, leading to an overall increase in both poverty and inequality. This is not uncommon across
other countries, indirect taxes are usually regressive, but in Croatia they lead to an inequality level similar to the
one that existed before indirect taxes. These results point to potential improvements that could be achieved to
reduce the burden on the poor. Excise taxes were also regressive, but since they are not as large as the VAT,
their impact on poverty and inequality was substantially smaller.
How successful is social spending in boosting the income of the poor? Only 10 percent of the population
receives more in benefits than what they pay in taxes. The bottom 10 percent of the distribution in Croatia is
a net recipient of social benefits (see positive net cash position in Figure 22), so they receive far more in direct
transfers; however, those in the second decile and above are net payers into the system, so they pay more in
taxes than they receive in benefits. This existing framework can be used to simulate tax and transfers reforms
going forward.
66 The assessment by Inchauste and Rubil (2017) is done using the 2014 tax and transfer system and using data from the Croatian Household Budget Survey for 2014 and the Population Income Survey (PIS) for 2015 and follows the CEQ methodology.
0.07 0.05 0.070%
20%
40%
60%
80%
100%
2009 2013 2016
Quin
tile
sh
are
of
tota
l tr
ansf
ers
Q1 Q2 Q3 Q4 Q5

34
Figure 22. Distributional Impact of the Tax and Benefit System in Croatia, 2014
Note: The net cash position of the household is measured as the difference between consumable and market income plus pensions and is equivalent to all the cash transfers to households minus all taxes. Source: Inchauste and Rubil (2017) based on 2014 Croatian PIS and HBS.
4. Conclusions and Policy Directions
Rapid, pro-poor economic growth is an important factor to achieve poverty reduction, and
inclusiveness should be a critical ingredient in a growth strategy in Croatia going forward. The country
has experienced significant poverty reduction over the period 2013-2016, which was largely driven by economic
growth. This growth was pro-poor, since the incomes of the poor people grew faster than those of the
population as a whole. This was not the case during the pre-crisis period, where growth did not translate into
significant poverty reduction and benefitted those at the top more. This evidence suggests that the pace of
growth is necessary but not sufficient for poverty reduction. To maintain equitable growth which benefits the
poor it is important to maintain macroeconomic stability, to ensure that growth is accompanied by increased
employment and finally to invest in the human capital of vulnerable groups to enable them to take advantage
of growth opportunities.
While economic growth favours poverty reduction, broad-based, labor-utilizing growth can have a
stronger impact. Recent evidence from Croatia showed the importance of growing labor income and better
employment outcomes -vis-a-vis transfers and demographic changes - for poverty reduction. This means that
the main instrument for sustainable and inclusive growth should be productive employment. Employment
growth generates new jobs and incomes for individuals, while productivity growth may lift the wages of those
already employed. In this context, policies that encourage steady growth in employment as well as rising
productivity can have a stronger impact on poverty reduction going forward.
Special attention should be placed on raising the rate of growth by using more segments of the labor
force previously excluded from the growth process. It is crucial to enable poor and vulnerable groups to
participate in the labor market and benefit from the growth process by stimulating skills creation among the
-100%
0%
100%
200%
300%
Poorest 2 3 4 5 6 7 8 9 Richest
Sh
are
of
mar
ket
in
com
e p
lus
pen
sion
s
Deciles of Market income plus pensions
All direct taxes Non-pension contributions All Direct TransfersAll indirect taxes Education HealthNet cash position Total

35
poor so they can meet the labor market demands of the growing sectors. Special consideration should be given
to reengaging the NEET youth, particularly in the lower quintiles in order to avoid further losses to human
capital and employment in the context of an already reduced workforce.
Growth enhancing policies in Croatia need to be coupled with inequality reducing polies to ensure
equitable pro-poor growth. The recent growth process in Croatia has resulted in inequality reductions, but
inequality is still higher than in most EU countries and some groups continue to be left behind. International
evidence shows that high inequality reduces the impact of growth on poverty reduction. By facilitating increased
labor force participation of previously excluded groups, Croatia can achieve reductions in inequality and offset
some of the unfavourable demographic changes linked to low fertility rates and high outmigration.
Social development efforts may need to focus on providing social protection to those who are
vulnerable to income shocks and the social protection system needs to be adjusted for economic
fluctuations. While social transfers represent a significant share of household income, social safety nets in
Croatia were not fully effective in protecting vulnerable households from the income shocks during the periods
of recession. Social protection systems need to adequately support individuals who have experienced job losses
in order to prevent them falling into poverty. Social protection systems should be complemented with active
labor market programs in order to prevent long-term unemployment which may lead to further increases in
poverty. Therefore, social protection system should act as a stabilizer of the economy during recessionary
periods, increasing the coverage of labor market and social insurance programs to minimize the fallout from
recessions.
The impact of social assistance programs on poverty reduction has been limited, despite recent
improvements in targeting accuracy. Non-contributory social assistance programs are progressive and seem
to be decently targeted, however, because of the low spending, its coverage of the poor is limited. A large part
of social protection resources is spent on contributory social insurance benefits (e.g., old-age pensions), which
are less progressive than social assistance. It is essential to provide adequate coverage of the poor through social
assistance programs through the last-resort social assistance program, since it is the largest poverty-targeted
social benefit in the social protection system in Croatia.
Limited growth in lagging areas can make the overall growth process less pro-poor in Croatia;
geographic targeting can be an effective tool for allocating public resources to the poor. The Eastern
part of the country is still suffering from high poverty rates, and a multisectoral effort is required to raise the
living standards. There are substantial geographic development gaps also in non-monetary indicators of
deprivation, such as access to services and infrastructure. The Slavonia region may require special attention,
particularly in the areas of social protection, health and education. There is a need to coordinate subnational
with national efforts, and proper institutional mechanism must be developed. In this context, good governance

36
is essential to efficient service delivery in order to facilitate poverty reduction. For monitoring and evaluation,
as well as territorial targeting of resources, the Index of Multiple Deprivations (IMD) can help allocating public
resources to areas with higher levels of social disadvantage and target area-based regeneration policies according
to each place’s characteristics and competencies. The analysis of regional disparities suggests that investment
in human capital to create employment and investment opportunities in more disadvantaged regions should be
a priority.
The poverty reduction strategy in the country should put focus on both national as well as sub-national
efforts, but territorial fragmentation of the public administration and service delivery might be a
constraint going forward. Efforts at the national level and at the subnational level for sustainable poverty
reduction should be coordinated in a cohesive way with no strong overlap in the responsibilities and
competencies between central and local governments. Attention should be paid to territorial fragmentation of
public administration and service delivery, which reduces quality and effectiveness of service provision and may
expand further regional disparity.
The data agenda, particularly at a sub-national level, as well as data on specific topics such as
migration, is critical for monitoring and evaluation and targeting. While subnational evidence is crucial
for monitoring of outcomes at a subnational level, most Croatian national surveys are representative only at a
national level or NUTS-2 level. Generation of reliable administrative data through administrative systems might
be considered, as well as updates of the Index of Multiple Deprivations. The creation of individual-level
international data on cross-country mobility can be useful to accurately measure the international migration
flows to assess its impact on poverty since official emigration statistics tend to be underestimated. Such
disaggregated data can also assist in targeted interventions and service delivery.

37
References
Bourguignon, F and Ferreira, F. (2005). “Decomposing Changes in the distribution of household incomes: Methodological aspects.” In the Microeconomics of Income Distribution Dynamics in East Asia and Latin America”, edited by Francois Bourguignon, Francisco H.G. Ferreira and Nora Lustig, 17-46. Washington DC., The World Bank.
Charron, N., Dijkstra, L., & Lapuente, V. (2014). “Regional governance matters: quality of government within European Union member states”. Regional Studies, 48(1), 68-90. Christiansen, L, Ferre, C., Matkovic, T. and Sharafudheen, T. (2019). “Jobs Challenges in Slavonia, Croatia – A Subnational Labor Market Assessment”. World Bank Jobs Working Paper Series No 35.
Croatia Ministry of Social Policy and Youth. (2014). “Strategy for Combating Poverty and Social Exclusion in the Republic of Croatia, 2014-2020”.
Datt, G., and Ravallion, M. (1992) “Growth and Redistribution Components of Changes in Poverty Measures: a Decomposition with applications to Brazil and India in the 1980’s.” Journal of Development Economics 38(2): 275-96”
Dollar, D., and A. Kraay. (2002), “Growth is Good for the Poor,” Journal of Economic Growth, 7(3), 195−225.
Draženović, I., Kunovac, M., and Pripužić, D. (2018). “Dynamics and determinants of emigration: the case of Croatia and the experience of new EU member states”. Public Sector Economics, 42(4), 415-447.
Elbers, C., Fujii, T., Lanjouw, P., Özler, B., and Yin, W. (2007). “Poverty alleviation through geographic targeting: How much does disaggregation help?”. Journal of Development Economics, 83(1), 198-213.
Elbers, C., Lanjouw, J. O., and Lanjouw, P. (2003). “Micro–level estimation of poverty and inequality”. Econometrica, 71(1), 355-364.
European Commission. (2016). “2016 European Semester: Assessment of progress on structural reforms, prevention and correction of macroeconomic imbalances, and results of in-depth reviews under Regulation (EU) No 1176/2011”.
European Commission. (2017). “2017 European Semester: Assessment of progress on structural reforms, prevention and correction of macroeconomic imbalances, and results of in-depth reviews under Regulation (EU) No 1176/2011”.
European Commission. (2018a). “2018 European Semester: Assessment of progress on structural reforms, prevention and correction of macroeconomic imbalances, and results of in-depth reviews under Regulation (EU) No 1176/2011”.
European Commission. (2018b). “Europe 2020 indicators - Poverty and social exclusion”.
European Commission. (2019). “2018 European Semester: Assessment of progress on structural reforms, prevention and correction of macroeconomic imbalances, and results of in-depth reviews under Regulation (EU) No 1176/2011”.
Imbs, J. and Wacziarg, R. (2003). “Stages of Diversification”, American Economic Review, 93(1), pp.63-86.

38
Inchauste, M. G, & Rubil, I. (2017). “The distributional impact of taxes and social spending in Croatia (English)”. Policy Research working paper; no. WPS 8203. Washington, D.C.: World Bank Group. http://documents.worldbank.org/curated/en/605341506024423991/The-distributional-impact-of-taxes-and-social-spending-in-Croatia
Inchauste, G., Azevedo, J.P., Essama-Nssah, B.; Olivieri, S., Van Nguyen, T., Saavedra-Chanduvi, J., Winkler, H. (2014). Understanding Changes in Poverty. Directions in Development--Poverty;. World Bank Group, Washington, DC. © World Bank. https://openknowledge.worldbank.org/handle/10986/19445
Kraay, Art. (2006). “When is growth Pro-Poor? Evidence from a panel of Countries.” Journal of Development Economics 80(1): 198-227.
Mara, I., & Vidovic, H. (2015). Free movement of workers, transitional arrangements and potential mobility from Croatia (No. 402). wiiw Research Report.
Nallari, R., and Griffith, B. (2011). “Understanding growth and poverty: theory, policy, and empirics”. The World Bank.
Ravallion, M. (2000). “On decomposing Changes in Poverty into ‘Growth’ and ‘Redistribution’ Components” Journal of Quantitative Economics, 16(1):105-18”.
Ravallion, M. and Chen, S. (2003).” Measuring Pro Poor Growth” Economic Letters 78(1): 93-99.
Ravallion, M. and Chen, S. (2007). “China’s (Uneven) Progress against Poverty”, Journal of Development Economics, 82(1): 1-42.
Ravallion, Martin. (2004). “Pro-poor growth: A primer (English)”. Policy, Research working paper; no. WPS3242. Washington, DC: World Bank. http://documents.worldbank.org/curated/en/358321468761705849/Pro-poor-growth-A-primerStrielkowski, W., Sarkova, K., and Zornaczuk, T. (2013). “EU Enlargement and Migration: Scenarios of Croatian Accession”. Romanian J. Eur. Aff., 13, 53.
Vidovic, H. and Mara, I. (2015). “Free Movement of Workers, Transitional Arrangements and Potential Mobility from Croatia”. The Vienna Institute for International Economic Studies Research Report, No. 402.
World Bank. (2001). “Croatia - Economic vulnerability and welfare study (English)”. Washington, DC: World Bank.
World Bank. (2005). World Development Report 2006: Equity and Development. Washington DC: World Bank and Oxford University Press.
World Bank. (2007). “Croatia - Living standards assessment: promoting social inclusion and regional equity : Main Report (English)”. Washington, DC: World Bank.
World Bank. (2009). “What is Inclusive Growth?” Washington DC: World Bank
World Bank. (2010). “Croatia - Social impact of the crisis and building resilience (English)”. Washington, DC: World Bank
World Bank. (2016). “Croatia Small-Area Estimation of Consumption-Based Poverty Maps”. Report prepared for the World Bank Spatial Analysis of Poverty and Policies Reimbursable Advisory Services.

39
World Bank (2017a). “Index of Multiple Deprivations: Conceptual Framework for identifying lagging regions and municipalities and towns in Croatia”. Report prepared for the World Bank Spatial Analysis of Poverty and Policies Reimbursable Advisory Services.
World Bank. (2017b). “Assessment of Social Benefit Effectiveness: An analysis at the municipal, and city level of Croatia”. Report prepared for the World Bank Spatial Analysis of Poverty and Policies Reimbursable Advisory Services.
World Bank. (2018a). “Small area estimates of income poverty in Croatia: methodological report (English)”. Available online at: http://documents.worldbank.org/curated/en/307961530044451676/Small-area-estimates-of-income-poverty-in-Croatia-methodological-report
World Bank. (2018b). “Poverty, Deprivation, Access to Services and User Satisfaction: Lessons for Croatia and Slavonia”. Report prepared for the World Bank Spatial Analysis of Poverty and Policies Reimbursable Advisory Services.
World Bank. (2018c). “Croatia - Systematic Country Diagnostic (English)”. Available online at: http://documents.worldbank.org/curated/en/452231526559636808/Croatia-Systematic-Country-Diagnostic
World Bank. (2018d). “Moving for Prosperity: Global Migration and Labor Markets”. Policy Research Report.
Washington, DC: World Bank
World Bank. (2019a). “Macroeconomic Stability, Fiscal Policy and Taxation Policy Note”. Policy Note prepared
for the Croatian National Development Strategy World Bank Reimbursable Advisory Services.
World Bank. (2019b). “Demography and Family Policies in Croatia Experience in Selected EU Countries”.
Policy Note prepared for the Croatian National Development Strategy World Bank Reimbursable Advisory
Services.
World Bank. (2019c). “A Note on Performance of Social Protection Programs in Croatia”.
World Bank. (2019d). “A Note on Adequacy of Pensions in Croatia”. Policy Note prepared for the Croatian
National Development Strategy World Bank Reimbursable Advisory Services.
World Bank. (2019e). “Migration and Brain Drain” Europe and Central Asia Economic Update (Fall),
Washington, DC: World Bank
World Bank. (2019f). “EU Regular economic report (English). Including Institutions: Boosting Resilience in
Europe”, Washington DC; World Bank Group”
Zaiceva, A. (2014). “Post-enlargement emigration and new EU members’ labor markets”. IZA World of Labor.

40
Methodological Annex
Annex I. Additional Figures and Tables
Figure 23. Contribution of Growth and Redistribution to Poverty Reduction in Croatia, Poverty line $5.5/day, Periods 2009-2013 and 2013-2016
Source: World Bank estimates using 2010-2017 EU-SILC.
Note: Based on methodology presented in Datt, Ravallion (1992). Growth component and redistribution component add up to the total poverty change (in percentage points) over the respective period. Growth refers to the distribution neutral mean growth of household income (also known as the size effect, in which the Lorenz curve does not change), and the ‘redistribution” effect measures the change in poverty resulting from a change in the Lorenz curve while holding the mean constant
Figure 24. Growth incidence curves and income growth by quintile: Period 2004-2008
a. Growth incidence curves, 2004-2008 b. Average Household Per capita income, 2004-2008
Source: World Bank estimates using 2004-2008 Household Budget Surveys. Note: The Growth Incidence Curve (GIC) captures graphically the annualized growth rate of per capita income for every percentile of the income distribution between two points in time. Right graph: Q1 refers to the bottom (poorest) quintile while Q5 refers to the richest quintile. Numbers above bars represent the cumulative growth rates over the period 2004-2008.
0.05 -0.58
2.57
-2.26
-4-3-2-10123
2009-2013 2013-2016
Co
ntr
ibuti
on
s to
P
over
ty R
educt
ion
(P
erce
nta
ge P
oin
ts)
Growth Component Redistribution Component
-4-3
-2-1
01
23
4
% A
nnu
aliz
ed
cha
nge
in in
com
e
0 10 20 30 40 50 60 70 80 90 100Percentile
0.6%7.5%
6.1%4.7%
3.2%
-4,000
1,000
6,000
11,000
16,000
Q1 Q2 Q3 Q4 Q5Ho
use
ho
ld p
er c
apit
a in
com
e (2
016 k
un
a)
2004 2008
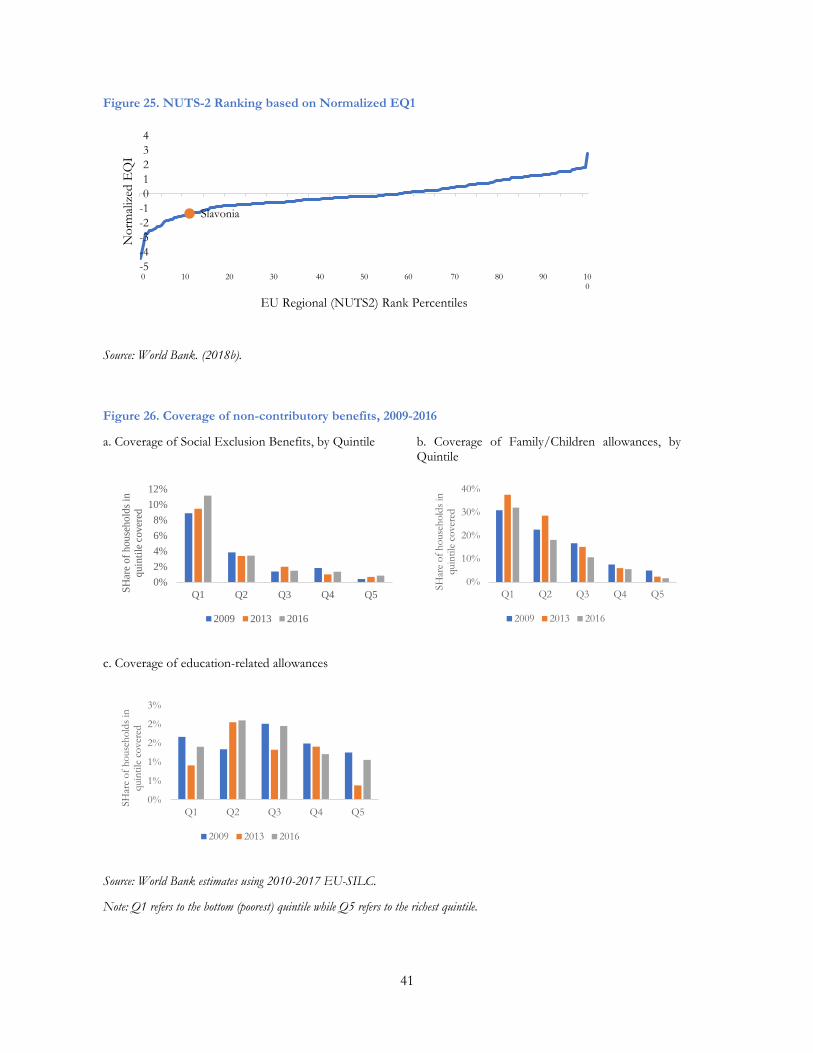
41
Figure 25. NUTS-2 Ranking based on Normalized EQ1
Source: World Bank. (2018b).
Figure 26. Coverage of non-contributory benefits, 2009-2016
a. Coverage of Social Exclusion Benefits, by Quintile b. Coverage of Family/Children allowances, by Quintile
c. Coverage of education-related allowances
Source: World Bank estimates using 2010-2017 EU-SILC.
Note: Q1 refers to the bottom (poorest) quintile while Q5 refers to the richest quintile.
Slavonia
-5
-4
-3
-2
-1
0
1
2
3
4
0 10 20 30 40 50 60 70 80 90 100
No
rmal
ized
EQ
I
EU Regional (NUTS2) Rank Percentiles
0%
2%
4%
6%
8%
10%
12%
Q1 Q2 Q3 Q4 Q5
SH
are
of
hou
seh
old
s in
qu
inti
le c
over
ed
2009 2013 2016
0%
10%
20%
30%
40%
Q1 Q2 Q3 Q4 Q5
SH
are
of
ho
use
ho
lds
in
quin
tile
co
ver
ed
2009 2013 2016
0%
1%
1%
2%
2%
3%
Q1 Q2 Q3 Q4 Q5
SH
are
of
ho
use
ho
lds
in
quin
tile
co
ver
ed
2009 2013 2016

42
Figure 27. Number of Beneficiary Families under Guarantee Minimum Benefit- Administrative Data vs EU-SILC estimate
Sources: World Bank (2017b) based on administrative data from Ministry of Demography, Family, Youth and Social Policy and survey-based estimates using 2010-2016 EU-SILC.
Figure 28. Coverage of contributory social insurance benefits, 2009-2016
a. Coverage of Unemployment Benefits, by Quintile b. Coverage of Survivor's Benefits, by Quintile
c. Coverage of Disability Benefits, by quintile d. Coverage of Sickness Benefits
Source: World Bank estimates using 2010-2017 EU-SILC.
Note: Q1 refers to the bottom (poorest) quintile while Q5 refers to the richest quintile.
0
20,000
40,000
60,000
80,000
2009 2010 2011 2012 2013 2014 2015Num
ber
of
Rec
ipie
nt
Ho
use
ho
lds
Guarantee Minimum Benefit/Support Allowance- Administrative Data
Social Exclusion not elsewhere classified- EU-SILC Estimate
0%
2%
4%
6%
8%
10%
12%
Q1 Q2 Q3 Q4 Q5
SH
are
of
ho
use
ho
lds
in
quin
tile
co
ver
ed
2009 2013 2016
0%
5%
10%
15%
20%
25%
Q1 Q2 Q3 Q4 Q5
SH
are
of
ho
use
ho
lds
in
quin
tile
co
ver
ed
2009 2013 2016
0%
5%
10%
15%
20%
25%
30%
Q1 Q2 Q3 Q4 Q5
SH
are
of
ho
use
ho
lds
in q
uin
tile
co
ver
ed
2009 2013 2016
0%
1%
2%
3%
4%
Q1 Q2 Q3 Q4 Q5SH
are
of
ho
use
ho
lds
in
quin
tile
co
ver
ed
2009 2013 2016

43
Annex II. Poverty Measurement: Relative vs Absolute Poverty
At-Risk of Poverty Rate: A measure of Relative Poverty
National official poverty estimates in
Croatia are produced by the Croatian
Bureau of statistics, based on a relative
measure constructed using the annual
EU-SILC survey. Following the
European Union standard, the national
poverty line (at-risk of poverty rate) in
Croatia is set at 60 percent of adult
equivalized median disposable income
after social transfers.
During 201767, the most recent year of
published figures, 19.3 percent of the
population lived in at-risk of poverty.
The at-risk-of-poverty rate is a measure
of relative poverty rather than an
absolute measure of poverty. Therefore,
it is a measure of income inequality,
useful to identify segments of the
population that may be lagging
considerably behind the rest of the
country. Since these measures rely on a
point of the income distribution (e.g.
median) to define a threshold of poverty
(e.g. 60 percent of median income), the
value of the poverty line can change from
one year to another. This may lead to
counterintuitive results when measuring
poverty over time. For instance, if the
67 2017 income year correspond to 2018 survey year. Eurostat reports survey year.
Figure 29. At-risk-of-poverty (AROP) and at-risk of poverty and social exclusion (AROPE) a. At-risk-of-poverty (AROP) rate and at-risk of poverty and social
exclusion (AROPE), Croatia, Percent, 2009-2016
b. At-risk-of-poverty (AROP) rate and at -risk of poverty and social exclusion (AROPE), EU countries, Percent, 2017
Source: Croatian Bureau of Statistics and Eurostat using 2010-2018 EU-SILC UDB-C. Note: This AROP measure corresponds to the headcount poverty at 60 percent of
the national median adult equivalent disposable income. The AROPE measure correspond to the share of people who are at risk-of poverty or severely materially deprived or living in households with very low work intensity. For consistency, estimates here are reported using income, not survey year. Note that official Eurostat and CBS statistics present these estimates using survey year. No data available before 2009.
20.6 20.9 20.4 19.5 19.4 20.0 19.5 20.0 19.3
31.1 32.6 32.629.9 29.3 29.1 27.9 26.4 24.8
0
10
20
30
40
2009 2010 2011 2012 2013 2014 2015 2016 2017
Per
cen
t
At-risk-of-poverty rate, %
People at risk of poverty or social exclusion, %
17.1 19.3
21.9 24.8
05
1015202530354045
Cze
chia
Fin
land
Slo
vak
ia
Den
mar
k
Hunga
ryN
orw
ay
Slo
ven
ia
Net
her
lands
Fra
nce
Aust
ria
Sw
itze
rlan
d
Po
lan
dIr
elan
d
Cyp
rus
Ger
man
ySw
eden
Bel
gium
Mal
ta
EU
28
Po
rtugal
Luxe
mb
ourg
Gre
ece
Un
ited
Kin
gdom
Cro
atia
Ital
y
Sp
ain
Est
on
ia
Nort
h M
aced
on
ia
Bulg
aria
Lit
huan
iaL
atvia
Ro
man
ia
Ser
bia
Per
cen
t
At-risk-of poverty rate, %
People at-risk-of-poverty or social exclusion, %

44
median income falls but there are no changes at the bottom, the relative poverty would pick up a decrease in
poverty when living conditions have not changed at the bottom. To track and monitor changes in poverty over
time, absolute poverty lines should be used. The World Bank reports absolute poverty based on international
poverty lines, which aim to capture a minimum standard of living; alternatively, national poverty lines can be
used if fixed in time or anchored to a particular year.
International and Anchored Poverty Rates- Measures of Absolute Poverty
The World Bank's international poverty rates are based on an absolute threshold (international poverty
line-IPL) that reflects how the world's poorest countries define a minimum threshold of living
standards, adjusted for purchasing power differences and for national inflation. Similarly, other
international thresholds are set in line with how middle and high-income countries define their living standards
thresholds. Two global poverty lines (income class poverty lines) can be used as a benchmark for countries
across the world whose level of development makes the IPL of little use, as well as track poverty over time.
• Lower Middle Income (LMI): $3.20 per person per day (in 2011 PPP Dollars)
• Upper Middle Income (UMI): $5.50 per person per day- correspond to 24.9 kuna per day in 2016
An anchored measured of the national poverty line can also be used to track changes in poverty over
time. We use this measure by anchoring the poverty line to the year 2011. Eurostat publishes some AROP
anchored at 2008 and 2009, but statistics for Croatia are not readily available.
The levels and trends of the national and international poverty rates can differ because: (1) the national line is
a function of the income distribution in any given year and therefore changes over time; (2) the international
line removes all negative welfare values; and (3) the international line is measured in per capita terms.
Annex III. Index of Multiple Deprivations (IMD)
The Index of Multiple Deprivations (IMD) is meant to complement monetary poverty measures by
providing a measure of multiple deprivation that goes beyond income or consumption alone.
Individuals are considered multidimensionally deprived if they fall short of the threshold in at least one
dimension.
The IMD index uses information on poverty at the municipal level to inform which indicators of
deprivation should be included and how they contribute (provided as a dashboard). Indicators are
mapped to sub-domains, and sub-domains are mapped to domains of deprivation (see Figure below – diagram
of IMD indicators).

45
Each indicator, sub-domain, and domain weigh the same (within each level). For example, road density
(within the physical infrastructure sub-domain) has an equal weight as all the other indicators within that sub-
domain, and the physical infrastructure subdomain carries the same weight as the social services sub-domain
under the Access to Services domain. However, social services is composed of three indicators, while physical
infrastructure has five. Consequently, any indicator in the social services sub-domain carries a greater weight
towards the total IMD, but the Access to Services domain has the same weight as the Economic and Social
domains.
The list of indicators comes from the digital social welfare register (Soc-Skrb) database at the
municipal level. The IMD is an aggregate index for different dimensions which is comparable across time
where a higher value indicates a higher deprivation. Comparability is achieved since values for any indicator
today are anchored to the specific indicator’s distribution from 2011 (to overcome issues of dimensionality and
temporal comparison). For example, a municipality’s current unemployment rate is compared to the municipal
distribution of unemployment in 2011, and if the current value is larger than the median of 2011 it will count
as a deprivation.
46
Annex IV. Social Protection Benefits captured in EU-SILC
The EU-SILC survey captures yearly income from social protection benefits in the form of both contributory
and non-contributory transfers. While EU-SILC attempts to capture these in both gross and net terms, coverage
for the former is universal and thus the focus of our analysis on social protection.
Non-contributory benefits are captured as categorical, means-tested, and universal monetary transfers
directed at individual and households.
• Educational related allowances (captured at the individual level) refer to grants, scholarships and
other assistance to students for education related activities.
• Family/child allowances refer to benefits providing financial support to households raising
children and for those who support relatives other than children. These benefits include income
maintenance due to childbirth/adoption (compensate for loss of earners due to absence from work),
birth grants, parental leave benefits, family or child allowances (to support cost of raising children),
alimonies paid by government (when child support is not paid), and other related benefits.
Beneficiaries of the family benefit programs should be captured in this category.
• Social exclusion benefits are meant to target socially excluded groups or those at risk of social
exclusion and include income support for those with insufficient resources (e.g., guaranteed
minimum benefit) and may include other benefits paid for by private non-profit organizations. In
principle, social exclusion benefits (not otherwise classified) contains the GMB benefits. However,
this variable may also include other benefits
• Housing allowances refer to interventions by public authorities to help households meet the cost
of housing and include rent benefits (means-tested) and benefits to owner-occupiers (means-tested).
Notice that it is not possible to identify in the EU-SILC survey the programs for Croatian Defenders of the
Homeland War (HBDR/HRVI related benefits).
Contributory benefits are captured as pensions or other forms of social insurance and captured at the
individual level.
• Pensions are defined by EU-SILC as old-age benefits; namely, old-age pensions (periodic payments
intended to maintain the income of the beneficiary after retirement from gainful employment at the
standard age, or to supplement the income of old persons), anticipated old age pensions, partial
retirement pensions, care allowances, and other cash benefits paid upon retirement or on account of

47
old age. In Croatia, beneficiaries of full-age and early-age retirement pension, as well as family
pension can be identified in the survey as the households receiving these benefits.
• Unemployment benefits (which are not necessarily contributory as a whole) are those meant to
replace partly or in full income lost by a worker as a result of full or partial loss of gainful
employment; namely, full unemployment benefits, partial employment benefits, early retirement
benefits, vocational training allowances, mobility and resettlement benefits, severance and
termination payments, redundancy compensation, and other financial assistance such as payments for
long-term unemployment.
• Survivor’s benefits are those that provide temporary or permanent income to people under
retirement age who have lost a spouse, partner, or next-of-kin. They include survivor’s pension,
death grants, and other unclassified survivor cash benefits.
• Sickness benefits are cash benefits that partly or wholly replace loss or earnings due to inability to
work as a result of sickness or injury and include paid sick leave and other miscellaneous payments.
In Croatia, beneficiaries of the sickness benefit A and B can be identified in the survey as the
households receiving these benefits
• Disability benefits are those that provide income to those under retirement age whose ability to
work and earn income is impaired at a level defined by national authorities. In Croatia, beneficiaries
of the disability pension can be identified in the survey as the households receiving these benefits.