
Tablet And Capsule Machine Instrumentation
273
Transcript of Tablet And Capsule Machine Instrumentation


Tablet and Capsule MachineInstrumentation


Tablet and Capsule Machine Instrumentation
Edited by
Peter Ridgway WattMSc, PhD, CChem, FRSC, CPhys, FInstPFormerly Instrument Services Co-ordinatorBeecham Pharmaceuticals Research DivisionBrockham Park, UK
and
N Anthony ArmstrongBPharm, PhD, FRPharmS, FCPPFormerly Senior Lecturer in PharmaceuticsWelsh School of PharmacyCardiff University, Cardiff, UK
London • Chicago

Published by the Pharmaceutical PressAn imprint of RPS Publishing
1 Lambeth High Street, London SE1 7JN, UK100 South Atkinson Road, Suite 200, Grayslake, IL 60030–7820, USA
© Peter Ridgway Watt and N Anthony Armstrong 2008
is a trade mark of RPS Publishing
RPS Publishing is the publishing organisation of the RoyalPharmaceutical Society of Great Britain
First published 2008
Typeset by J&L Composition, Filey, North YorkshirePrinted in Great Britain by TJ International, Padstow, Cornwall
ISBN 978 0 85369 657 5
All rights reserved. No part of this publication may be repro-duced, stored in a retrieval system, or transmitted in any form orby any means, without the prior written permission of the copy-right holder.
The publisher makes no representation, express or implied,with regard to the accuracy of the information contained in thisbook and cannot accept any legal responsibility or liability forany errors or omissions that may be made.
The right of Peter Ridgway Watt and N Anthony Armstrongto be identified as the authors of this work has been assertedby them in accordance with the Copyright, Designs and PatentsAct, 1988.
A catalogue record for this book is available from the BritishLibrary

I first met Peter Ridgway Watt about 30 yearsago when we were both speakers at a very earlyconference on instrumented tablet presses. Wequickly found that we had many interests in common. In 1988, Peter brought out his textbook on instrumentation, Tablet MachineInstrumentation in Pharmaceutics, and we collab-orated several times in organising short courseson the topic. It was at one of the most recent ofthese that Peter and I decided that a revision ofhis textbook was called for, to be written partlyby us, but inviting experts in certain areas tocontribute chapters on selected topics. Peter
threw himself into the task, but his health beganto fail, and he died on 12 February 2007, onlyfive days after the text of the one remainingchapter had been received.
This book is dedicated to Peter Ridgway Watt,an inspiring colleague and a good friend.
N Anthony ArmstrongHarpenden, UK
February 2007
Dedication
v


Contents
Preface xiContributors xiii
1 Introduction 1N Anthony Armstrong
Introduction 1A brief overview of instrumented systems 2Units of measurement 4The instrumentation of tablet presses and capsule-filling equipment 6References 8Further reading 9
2 The measurement of force 11Peter Ridgway Watt
Introduction 11Strain measurement 12Strain gauges 13Siting strain gauges 22The Wheatstone bridge circuit 32Load cells 38Miscellaneous methods 46References 49
3 The installation of strain gauges 51Anton Chittey
Introduction 51Health and safety considerations 51Surface preparation 51Bonding with adhesive 53Leadwire attachment 57Protection of the installation 58Inspection and testing 58Specialist applications 59
vii

Tools and installation accessories 61Professional assistance 63References 64Further reading 64
4 The measurement of displacement 65Peter Ridgway Watt
Introduction 65Displacement transducers with analogue output 65Displacement transducers with a digital output 76Dynamic measuring devices 79Miscellaneous methods of displacement measurement 82References 84
5 Power supplies and data acquisition 87Peter Ridgway Watt
Introduction 87Gauge excitation level 87The power supply unit 88Mains noise 89Battery power 91Power supply to and data acquisition from tablet presses 91Signal display 95References 97
6 Instrumented tablet presses 99N Anthony Armstrong and Peter Ridgway Watt
Introduction 99The eccentric press 99Rotary tablet presses 111The measurement of displacement in tablet presses 119Measurement of ejection forces 127Measurement of punch pull-up and pull-down forces 129Measurement of punch face adhesive forces 131Instrumentation packages 132References 136
7 Calibration of transducer systems 139Peter Ridgway Watt
Introduction 139Force 140
v i i i Contents

Displacement 142Calibration problems 145
8 Data handling 147Alister P Ridgway Watt
Introduction 147Sampling system theory 147Electronics sub-systems 153Embedded systems 157Computer interfacing 157Software 162Data backup 163Further reading 165
9 Applications of tablet press instrumentation 167N Anthony Armstrong
Introduction 167Punch displacement–time profiles 168Force–time profiles 176Force–porosity relationships 182The force–displacement curve 187Punch velocity 190Die wall stress 196Applications of press instrumentation to lubrication studies 201References 202Further reading 205
10 The instrumentation of capsule-filling machinery 207N Anthony Armstrong
Introduction 207Capsule-filling equipment 208Instrumentation of dosating disk capsule-filling machines 209Instrumentation of dosating nozzle capsule-filling machines 214References 220Further reading 222
11 Automatic control of tablet presses in a production environment 223Harry S Thacker
Introduction 223The force–weight relationship 224Monitoring systems 225
Contents ix

Control systems 225Reject systems 226Weighing systems 227Computer-controlled systems 228References 239Further reading 240
Appendix: Suppliers of materials and services 241Index 249
x Contents
W H E N W I L L I A M B R O C K E D O N patented thenotion of ‘shaping pills, lozenges and black leadby pressure in dies’, he could hardly have imag-ined the extent to which this apparently simpleidea would grow. It was largely this inventionthat extended the industrial revolution to thepreparation of medicines, giving rise to the phar-maceutical industry as it now exists. Individualpharmacies would no longer need to make upsmall quantities of medicines themselves, large-scale production in a relatively small number ofmanufacturing sites was now feasible, andmechanical engineering methods could beapplied to the process.
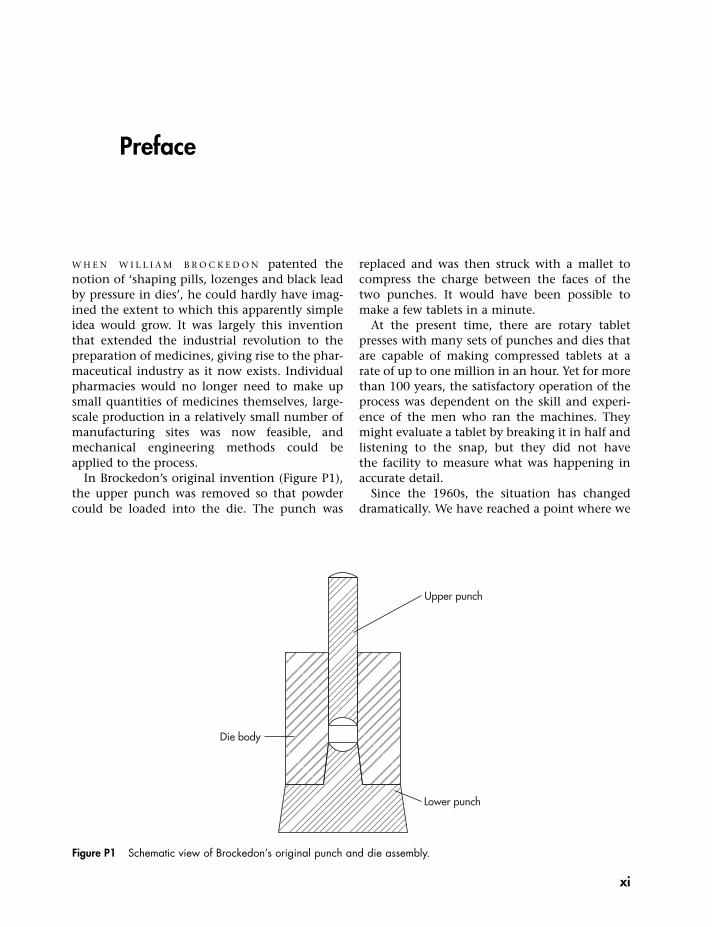
In Brockedon’s original invention (Figure P1),the upper punch was removed so that powdercould be loaded into the die. The punch was
replaced and was then struck with a mallet tocompress the charge between the faces of thetwo punches. It would have been possible tomake a few tablets in a minute.
At the present time, there are rotary tabletpresses with many sets of punches and dies thatare capable of making compressed tablets at arate of up to one million in an hour. Yet for morethan 100 years, the satisfactory operation of theprocess was dependent on the skill and experi-ence of the men who ran the machines. Theymight evaluate a tablet by breaking it in half andlistening to the snap, but they did not have the facility to measure what was happening inaccurate detail.
Since the 1960s, the situation has changeddramatically. We have reached a point where we
Preface
Upper punch
Die body
Lower punch
Figure P1 Schematic view of Brockedon’s original punch and die assembly.
xi

are in a position to measure many variablesbefore, during and after the compaction event,and to use the constant stream of information tocontrol the press automatically. In this book, wehave described a selection of measuring devicesthat have been developed in the general field ofengineering instrumentation, and we haveshown how some of them have been applied inour particular area of interest. Readers might beconcerned that many of the references quotedare of some considerable age, but in fact therehas been little published work on new measuringsystems for several decades. The most significantadvances have been in the field of electronics,and the application of computer techniques todata acquisition and processing, but measuringdevices such as strain gauges and displacementtransducers have not changed greatly since the1980s.
As for the equipment described in these pages,we have assumed little prior knowledge on thepart of the reader and have attempted to defineany new terms as they appear. Many tablet pressmanufacturers offer machines that are already
fitted with measuring devices and data process-ing systems. Nevertheless, it is still necessary tounderstand the essential principles of pressinstrumentation, the importance of transducerselection, siting, and calibration, and to have anappreciation of what a particular instrumenta-tion technique can and – equally important –cannot do. It is our hope that these pages willhelp to promote such understanding.
Of course, the idea that research progressessmoothly from one stage to the next is a myth,usually supported by papers and publicationsthat conveniently omit all mention of the deadends and disasters that happen in real life.We have, therefore, included a few anecdotesfrom our own experience, which confirm thehypothesis that if something can go wrong, itwill!
N Anthony Armstrong and Peter Ridgway Watt
February 2007
xi i Preface

N Anthony ArmstrongHarpenden, UKFormerly Senior Lecturer in Pharmaceutics,Welsh School of Pharmacy, Cardiff University,Cardiff, UK
Peter Ridgway WattFormerly Instrument Services Co-ordinator,Beecham Pharmaceuticals Research Division,Brockham Park, UK
Anton ChitteyTechnical Support Engineer, VishayMeasurements Group UK Ltd, Basingstoke, UK
Alister P Ridgway WattTechnical Director, QBI Ltd, Walton on Thames,UK
Harry S ThackerOrmskirk, UK; formerly of Manesty Machines,Knowsley, UK
Contributors
xiii


Introduction
The year 1843 saw the publication of BritishPatent Number 9977. It was issued to WilliamBrockedon, an English inventor, and its objectwas that of ‘shaping pills, lozenges and blacklead by pressure in dies’. This marked the intro-duction of the dosage form now known as thetablet. Brockedon did not set out to invent adosage form. His original aim was to reconstitutethe powdered graphite left as a waste productwhen natural Cumberland graphite was sawninto narrow strips for pencil ‘leads’. However,he later realised that his invention could beapplied to the production of single-dose units ofmedicinally active compounds.
The introduction of the tablet marked theimpact of the Industrial Revolution in theproduction of medicines and opened up awhole range of new possibilities for the phar-maceutical industry. Compared with earlierdosage forms such as the pill, it offered a stable,convenient form that was capable of beingmass produced by machines. Furthermore, withappropriate formulation, a range of differenttypes of tablet could be produced, includingthose to be swallowed intact, sucked, heldwithin the buccal pouch or under the tongue,dissolved or dispersed in water before ingestion,or so formulated that the active ingredient isreleased in a controlled manner. So popular hasthe tablet become that it has been estimatedthat of the 600 million National Health Serviceprescriptions written per annum in the UK, over65% are for tablets. There are 336 monographsfor tablets in the 2005 edition of the BritishPharmacopoeia.
The original Brockedon press consisted of a dieand two punches, force being applied by a blowfrom a hammer. Mechanised versions of thisdevice soon followed, either eccentric presseswith one die and one set of punches or rotarypresses with many sets of tooling. A modernrotary press can turn out approximately onemillion tablets every hour, rejecting any that areunsatisfactory. Such presses are often designed tooperate without continuous human supervision,and to achieve this aim, highly sophisticatedcontrol systems are required. However, all tabletpresses involve compression of a particulate solidcontained in a die between two punches, whichis essentially Brockedon’s invention.
The capsule originated at about the same timeas the tablet. The first recorded patent wasgranted in 1834 to two Frenchmen, Dublanc andMothes. This was a single piece unit that today isusually referred to as a soft-shell capsule, thecontents of which are almost invariably liquid orsemisolid. The hard-shell capsule was invented afew years later in 1846 by another Frenchman,Lehuby. Such capsules consist of two parts, thebody and the shell, and are usually made fromgelatin. The fill is almost always a particulatesolid, and the filling process usually involves theapplication of a compressive force. Hard-shellcapsules also proved to be a popular dosageform, and there are 64 monographs for hard-shell capsules in the 2005 edition of the BritishPharmacopoeia.
Research into the formulation and manufac-ture of tablets, and to a lesser extent that ofhard-shell capsule fills, soon followed but suf-fered from a major handicap. Many tablet proper-ties – thickness, crushing strength, resistance to
1Introduction
N Anthony Armstrong
1

abrasion, disintegration time, release of activeingredient – are dependent on the pressure thathas been applied to the tablet during manufac-ture. If the means of accurately measuring theapplied pressure are lacking, it follows thatmeaningful studies are impossible.
Measuring the force applied to a tablet in apress was not easy, given the constraints of earlytwentieth century technology. Even using therelatively simple presses of that era, the com-pression event lasted only a fraction of a second,and hence the measurement system had to reactto the change in pressure sufficiently rapidly.Mechanical devices, owing to their inherentinertia, were not appropriate for this purpose.Such devices are suitable for measuring pressureduring a longer-lasting event (e.g. compressionin a hydraulic press), but this is unrealisticallyslow in terms of tablet manufacture.
It is instructive to consider how the pressure ina tablet press arises. As the punch faces approacheach other, the volume containing the particu-late solid decreases. When the solid is in contactwith the faces of both punches, then pressureexerted by one punch will be transmittedthrough the solid mass and will be detected atthe other punch. The magnitude of the pressureis thus a function of the distance separating thepunch faces.
Many presses have some form of mechanicalindication of pressure. For example, the ManestyF3 press has an eccentric cam graduated with alinear scale. The reading on this scale is related tothe depth of penetration of the upper punchinto the die. It takes no account of lower punchposition and, therefore, is not a measure of thedistance separating the punch faces. The relation-ship between punch separation and pressure isnot linear, and it must be borne in mind thatthe relationship between pressure and punchface separation differs for different solids.Consequently, though the graduated scale givesa useful reference point, it is not a device foractually measuring pressure.
The major step that enabled compression press-ure in a tablet press to be directly measured wasthe independent discovery by Simmons and byRuge in 1938 that wires of small diameter couldbe bonded to a structure to measure surfacestrain. Since strain is proportional to force, this
marked the invention of the strain gauge as adevice for measuring force. The strain gauge wasdeveloped considerably during World War Two,primarily in the aircraft industry. Its applicationto tablet presses soon followed. The constructionand mode of operation of the strain gauge isdescribed in Chapter 2. However, its essentialcharacteristic, namely representing force interms of an electrical signal, means that force inthe die of a tablet press can be directly measuredin situ with the press operating at its normal rateof production.
The first report of the use of strain gauges in astudy of tablet preparation was made by Brake atPurdue University in 1951. This report was inthe form of a Master’s thesis that unfortunatelywas never published as a conventional scientificpaper. A year later, the first in a series of papersentitled ‘The physics of tablet compression’ waspublished by T. Higuchi and others at theUniversity of Wisconsin. In one of the earlierpapers in the series, the term ‘instrumentedtablet machine’ was used for the first time.The importance of this series, publication ofwhich continued until 1968, cannot be over-emphasised and it can be said to have initiatedthe systematic study of the tabletting processand of tablet properties.
Further important steps in the development ofinstrumented tablet presses and capsule-fillingequipment are given in Table 1.1. The instru-mented tablet press, with its output often linkedto a computer, is now a widely used research tool.In the pharmaceutical production environment,many presses are routinely fitted with some formof instrumentation during construction.
A brief overview of instrumentedsystems
The basic components of an instrumentedsystem are shown in Figure 1.1.
All instrumentation systems have severalessential attributes:
• a transducer of appropriate sensitivity• a suitable site for fixing the transducer to the
equipment
2 Tablet and capsule machine instrumentation
• a power supply and a means of getting thatpower to the transducer
• a means of getting the output away from thetransducer
• amplification circuitry• a method of observing and/or recording the
signals from the transducer• a method of calibration.
The main parameters of interest in the instru-mentation of tablet presses and capsule-fillingequipment are force, distance and time, with thefirst two often being measured in relation to thelast. Measurement is carried out by means oftransducers. A transducer is a device that permitsthe measurement of one physical parameter
(input) by presenting it as another (output). Aneveryday example of a transducer is a conven-tional thermometer, in which temperature ismeasured in terms of the volume of a liquid.Proportionality must be established betweenthe input of the transducer and its output – inthis case between temperature and the liquidvolume. In other words, the transducer must becalibrated.
Almost all the transducers used in instru-mented tablet presses have electrical outputs ofsome sort, which by appropriate circuitry can bechanged into signals based on voltage These, inturn, perhaps after transformation into digitalform, can be measured, stored and manipulated.
Numerous parameters involved in the tablet-ting process can be measured, though some aremore difficult to measure than others. For exam-ple, with a rotary tablet press fitted with forceand displacement transducers on upper andlower punches, it is possible to measure all theparameters described in Table 1.2.
Most of these involve force (pressure) andmovement. Since these parameters will havebeen recorded with respect to time, it is possibleto measure the duration of events in the com-pression cycle. The rate of change can also bemeasured; for example, punch speed can bederived from knowledge of punch movementwith respect to time. It is also possible to recordone of these parameters as a function of another.Examples of what can be measured are given inTable 1.3, and their significance will be discussedlater in this book.
If the primary objective for using an instru-mented press or capsule-filling equipment isfundamental research or to optimise a new for-mulation, it may be useful to measure as manyof these parameters as possible. Conversely, ifthe aim is to control a production machine, thenfewer need to be monitored. It must be borne inmind that instrumentation can be expensive,both in terms of equipment costs and the costsof skilled personnel to use it, maintain it andto interpret its output. Hence a ‘let’s measureeverything’ approach can be unnecessarilycostly. As in all scientific work, carefulconsideration of the objectives of the work andthe benefits that may be achieved must beundertaken as an initial step.
Introduction 3
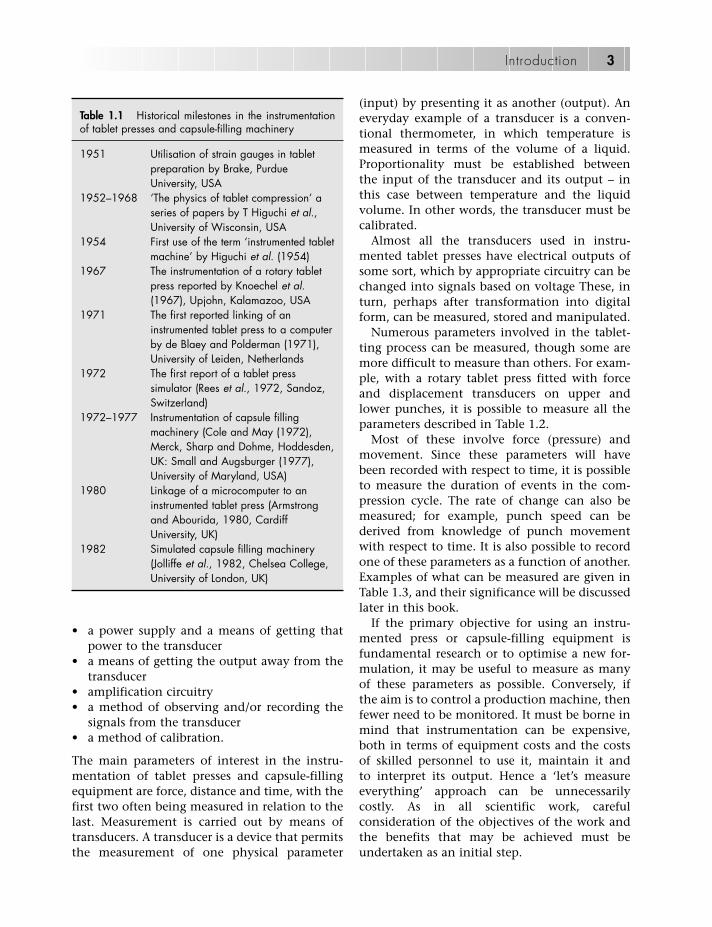
Table 1.1 Historical milestones in the instrumentationof tablet presses and capsule-filling machinery
1951 Utilisation of strain gauges in tabletpreparation by Brake, PurdueUniversity, USA
1952–1968 ‘The physics of tablet compression’ aseries of papers by T Higuchi et al.,University of Wisconsin, USA
1954 First use of the term ‘instrumented tabletmachine’ by Higuchi et al. (1954)
1967 The instrumentation of a rotary tabletpress reported by Knoechel et al.(1967), Upjohn, Kalamazoo, USA
1971 The first reported linking of aninstrumented tablet press to a computerby de Blaey and Polderman (1971),University of Leiden, Netherlands
1972 The first report of a tablet presssimulator (Rees et al., 1972, Sandoz,Switzerland)
1972–1977 Instrumentation of capsule fillingmachinery (Cole and May (1972),Merck, Sharp and Dohme, Hoddesden,UK: Small and Augsburger (1977),University of Maryland, USA)
1980 Linkage of a microcomputer to aninstrumented tablet press (Armstrongand Abourida, 1980, CardiffUniversity, UK)
1982 Simulated capsule filling machinery(Jolliffe et al., 1982, Chelsea College,University of London, UK)

Furthermore it is vitally important to be confi-dent that the collected information is a measureof the intended parameter, and not an artefactintroduced by the measuring device or its attach-ment, an error in data collection or manipu-lation, or some uncontrolled feature of theoverall system.
Units of measurement
Units of measurement can often be the source ofconfusion, though this would be reduced if SIunits were invariably used. Wherever possible,units outside the SI system should be replaced bySI units and their multiples and sub-multiplesformed by attaching SI prefixes. In the SI system,there are seven basic units from which all otherscan be derived. These base quantities, togetherwith their units and symbols, are shown in Table1.4. Such variables as displacement, time andtemperature can, therefore, be referred in prin-ciple to the base units of the SI system. Variables,such as force, that are not among the seven fun-damentals must be derived from combinationsof the latter.
In practice, all the base units are not equallyaccessible for everyday use. It is, therefore, nor-mal to approach them through the use ofderived units, and the derivation of some ofthese is shown below.
Base units
The base unit of length, the metre, is defined interms of time and the speed of light, which is
4 Tablet and capsule machine instrumentation
Powersupply
Transducerfitted to
equipment
Transduceroutput
Amplification Signalrecording
Figure 1.1 The basic components of an instrumented system.
Table 1.2 Parameters that can be measured using arotary tablet press fitted with force and displacementtransducers on upper and lower punches
Parameter Units
Upper punch precompression force Force (N)
Lower punch precompression force Force (N)
Upper punch compression force Force (N)
Lower punch compression force Force (N)
Ejection force Force (N)
Upper punch pull-up force Force (N)
Lower punch pull-down force Force (N)
Die wall force Force (N)
Upper punch movement Distance (m)
Lower punch movement Distance (m)
Punch or die temperature Temperature (°C)
299 792 458 m s�1. Thus, the metre is the lengthof the path travelled by light in a vacuumduring a time interval of 1/(299 792 458) of asecond. Secondary sources are lasers in the vis-ible and near infrared spectrum, and physicalobjects are calibrated by direct comparison withthese lasers.
The base unit of mass is the kilogram, and thisis the only unit of the seven that is currently rep-resented by a physical object. The internationalprototype of the kilogram is a cylinder made of aplatinum–iridium alloy kept at the InternationalBureau of Weights and Measures at Sèvres nearParis. Replicas are kept at various nationalmetrology laboratories such as National PhysicalLaboratory in the UK and the National Bureau ofStandards in the USA.
The SI unit of thermodynamic temperature isthe kelvin (K). The kelvin is defined as the frac-tion 1/(273.16) of the thermodynamic tempera-ture of the triple point of water.
The SI unit of time is the second, which isdefined as 9 192 631 770 periods of the radiationderived from an energy level transition of thecaesium atom. As such, it is independent ofastronomical observations on which previousdefinitions of time depended. The internationalatomic time is maintained by the InternationalBureau of Weights and Measures from data con-tributed by time-keeping laboratories aroundthe world. A quartz clock movement, kept at areasonably constant temperature, can maintainits rate to approximately one part per million,equivalent to 1 s in about 12 days.
Derived units
The SI unit of force is the newton (N), and isdefined as the force that imparts an accelerationof one metre per second every second (1 m s�2) toa body having a mass of one kilogram.
The SI unit of pressure is the pascal (Pa),which represents one newton per square metre(1 N m�2). The pascal is an inconvenientlysmall unit for practical purposes. For example,atmospheric pressure is approximately 105 Pa.
The SI unit of energy or work is the joule (J),which is the work done by a force of one newton
Introduction 5
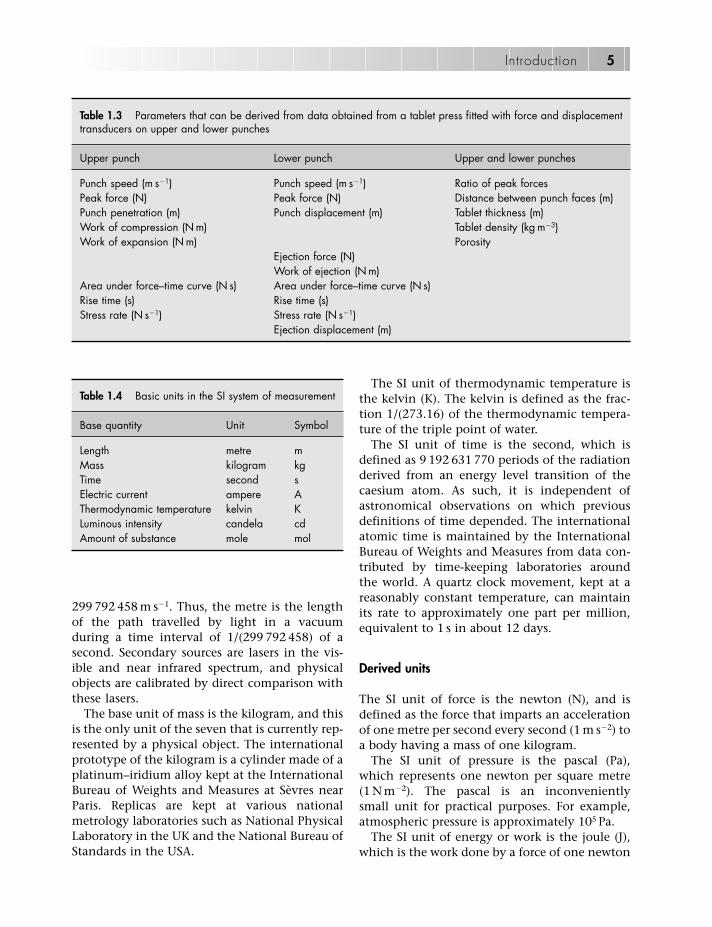
Table 1.3 Parameters that can be derived from data obtained from a tablet press fitted with force and displacementtransducers on upper and lower punches
Upper punch Lower punch Upper and lower punches
Punch speed (m s�1) Punch speed (m s�1) Ratio of peak forcesPeak force (N) Peak force (N) Distance between punch faces (m)Punch penetration (m) Punch displacement (m) Tablet thickness (m)Work of compression (N m) Tablet density (kg m�3)Work of expansion (N m) Porosity
Ejection force (N)Work of ejection (N m)
Area under force–time curve (N s) Area under force–time curve (N s)Rise time (s) Rise time (s)Stress rate (N s�1) Stress rate (N s�1)
Ejection displacement (m)
Table 1.4 Basic units in the SI system of measurement
Base quantity Unit Symbol
Length metre mMass kilogram kgTime second sElectric current ampere AThermodynamic temperature kelvin KLuminous intensity candela cdAmount of substance mole mol

when the point at which that force is applied isdisplaced by one metre in the direction of theforce.
The SI unit of power is the watt (W), and onewatt is the power that gives rise to the pro-duction of energy at the rate of one joule persecond.
Velocity is the rate of change of position of abody in a particular direction with respect totime. Since both a magnitude and a direction areimplied in this definition, velocity is a vector.The rate of change of position is known as speedif only the magnitude is specified, and hence thisis a scalar quantity.
Force is the most important parameter that ismeasured in instrumented tablet presses andcapsule-filling equipment, though often theterm ‘pressure’ is used. In some texts, the terms‘force’ and ‘pressure’ seem to be used inter-changeably, as if they were both measurementsof the same thing. This is incorrect, since press-ure is force per unit area. In some cases, such aswhen flat-faced tablet punches are used, the areaover which the force is applied can be easilymeasured, and so if the force is known, then thepressure can be readily calculated. However, ifthe area of contact is not known, or if the forceis not equally distributed over the whole surfaceof contact as, for example, with concave-facedpunches, then calculation of the pressure is morecomplex.
Table 1.5 shows the wide variety of units, bothSI and otherwise, that have been used in recentyears in scientific papers describing the relation-
ship between applied force or pressure and thecrushing or tensile strength of the resultanttablets. Comparison of data from sources thatuse different units of measurement is difficult,and the value of using a standard system such asSI is apparent.
The instrumentation of tablet pressesand capsule-filling equipment
Instrumentation techniques that can be appliedto tablet presses and capsule-filling equipmentare summarised here but are described in moredetail later in this book.
Eccentric tablet presses
Much of the earliest work on instrumentedtablet presses was carried out on eccentricpresses. The upper punch is readily accessible sothat force transducers can be easily fitted, andthere is no problem in getting the electrical sup-ply to the transducers and their signals out fromthem. It is usually considered desirable to mountthe force transducers as near to the point ofaction as possible (i.e. on the punches). Thisimplies that if the tablet diameter or shape ischanged, another set of instrumented punchesmust be provided. An alternative approach is tomount the force transducers on the punchholder or eccentric arm, an arrangement that
6 Tablet and capsule machine instrumentation
Table 1.5 Examples of units that have been used to describe force, pressure, tablet crushing strength and tablet tensilestrength in papers on tablet research in recent years
Abscissa OrdinateParameter Unit Parameter Unit
Force kg Crushing strength (hardness) kglb Strong-Cobb unitskN NN kp
Pressure kg cm�2 Tensile strength kg cm�2
Pa PaMPa MPalb in�2
can accommodate changes of punch. It is usuallypossible to mount transducers directly on to thelower punch, though a popular alternative is touse a load cell fitted into a modified punchholder.
There is also adequate room to mount dis-placement transducers on an eccentric press,but the siting of these may cause problemsowing to distortion of the press itself during thecompaction event.
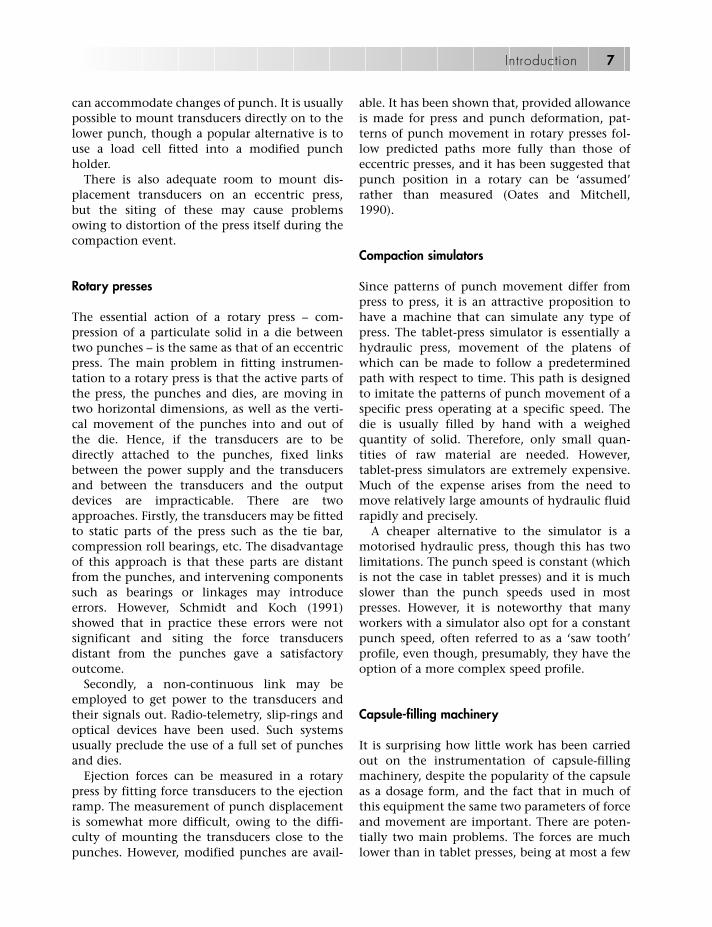
Rotary presses
The essential action of a rotary press – com-pression of a particulate solid in a die betweentwo punches – is the same as that of an eccentricpress. The main problem in fitting instrumen-tation to a rotary press is that the active parts ofthe press, the punches and dies, are moving intwo horizontal dimensions, as well as the verti-cal movement of the punches into and out ofthe die. Hence, if the transducers are to bedirectly attached to the punches, fixed linksbetween the power supply and the transducersand between the transducers and the outputdevices are impracticable. There are twoapproaches. Firstly, the transducers may be fittedto static parts of the press such as the tie bar,compression roll bearings, etc. The disadvantageof this approach is that these parts are distantfrom the punches, and intervening componentssuch as bearings or linkages may introduceerrors. However, Schmidt and Koch (1991)showed that in practice these errors were notsignificant and siting the force transducersdistant from the punches gave a satisfactoryoutcome.
Secondly, a non-continuous link may beemployed to get power to the transducers andtheir signals out. Radio-telemetry, slip-rings andoptical devices have been used. Such systemsusually preclude the use of a full set of punchesand dies.
Ejection forces can be measured in a rotarypress by fitting force transducers to the ejectionramp. The measurement of punch displacementis somewhat more difficult, owing to the diffi-culty of mounting the transducers close to thepunches. However, modified punches are avail-
able. It has been shown that, provided allowanceis made for press and punch deformation, pat-terns of punch movement in rotary presses fol-low predicted paths more fully than those ofeccentric presses, and it has been suggested thatpunch position in a rotary can be ‘assumed’rather than measured (Oates and Mitchell,1990).
Compaction simulators
Since patterns of punch movement differ frompress to press, it is an attractive proposition tohave a machine that can simulate any type ofpress. The tablet-press simulator is essentially ahydraulic press, movement of the platens ofwhich can be made to follow a predeterminedpath with respect to time. This path is designedto imitate the patterns of punch movement of aspecific press operating at a specific speed. Thedie is usually filled by hand with a weighedquantity of solid. Therefore, only small quan-tities of raw material are needed. However,tablet-press simulators are extremely expensive.Much of the expense arises from the need tomove relatively large amounts of hydraulic fluidrapidly and precisely.
A cheaper alternative to the simulator is amotorised hydraulic press, though this has twolimitations. The punch speed is constant (whichis not the case in tablet presses) and it is muchslower than the punch speeds used in mostpresses. However, it is noteworthy that manyworkers with a simulator also opt for a constantpunch speed, often referred to as a ‘saw tooth’profile, even though, presumably, they have theoption of a more complex speed profile.
Capsule-filling machinery
It is surprising how little work has been carriedout on the instrumentation of capsule-fillingmachinery, despite the popularity of the capsuleas a dosage form, and the fact that in much ofthis equipment the same two parameters of forceand movement are important. There are poten-tially two main problems. The forces are muchlower than in tablet presses, being at most a few
Introduction 7

hundred newtons rather than tens of kilo-newtons. Hence a more sensitive measuringsystem is needed. Secondly, for reasons of signalstability, transducers must be fixed to a ‘massive’component of the machine; otherwise distortionwill ensue. These positions are readily availableon a tablet press, but are not so abundant oncapsule-filling machinery. A further complica-tion is that there are two distinct types ofcapsule-filling equipment, dosating tube anddosating disk, the filling mechanisms of whichdiffer. Solutions to instrumentation challengesin one type might not be applicable to the other.Both dosating tube and dosating disk equipmenthave been simulated.
Instrumentation and computers
With the availability of cheap computing power,the use of computers for the acquisition, storageand manipulation of compression data is a nat-ural progression. Virtually all transducers used intablet-press instrumentation give out electricalsignals that can be converted by appropriate cir-cuitry to a voltage. However, the transducer givesout an analogue signal, which must be convertedto a digital signal before it can be processed bythe computer.
It must be stressed that it is perfectly possibleto have an instrumented press without a com-puter. Also the availability of suitable softwaremust be considered. The use of spreadsheets suchas Excel can be invaluable here.
Methods of interfacing a computer to a tabletpress or capsule-filling equipment are describedin Chapter 8.
Instrumentation packages
Only a few years ago, if one wanted to instru-ment a tablet press, it was necessary to fit thetransducers to the press oneself, and selectsuitable amplification and signal-conditioningequipment. This is no longer the case. Many pro-duction presses are available with instrumenta-tion built in, primarily for the purpose ofautomatic weight control leading to automatedpress operation.
Also available are instrumentation packagescapable of being fitted to a press. These typicallycomprise the transducers, power source, ampli-fiers, a computer interface and a computer fordata capture, storage and manipulation. Settingup is simplified by a ‘menu’ display on the com-puter screen. Computer software is available totransform the data received from the transducersinto parameters used for characterising the com-paction process. Care must be taken that the defi-nitions of such parameters are correct. It is theauthors’ experience that these parameters aresometimes incorrectly defined, and potentialusers must satisfy themselves on this score.
References
Armstrong NA, Abourida NMAH (1980). Compressiondata registration and manipulation by micro-computer. J Pharm Pharmacol 32: 86P.
Cole GC, May G (1972). Instrumentation of a hardshell encapsulation machine. J Pharm Pharmacol 24:122P.
de Blaey CJ, Polderman J (1971). Compression of phar-maceuticals. 2: Registration and determination offorce–displacement curves using a small digitalcomputer. Pharm Weekblad 106: 57–65.
Higuchi T, Nelson E, Busse LW (1954). The physics oftablet compression. 3: Design and construction ofan instrumented tabletting machine. J Am PharmAssoc Sci Ed 43: 344–348.
Jolliffe IG, Newton JM, Cooper D (1982). The designand use of an instrumented mG2 capsule fillingmachine simulator. J Pharm Pharmacol 34: 230–235.
Knoechel EL, Sperry CC, Ross HE, Lintner CJ (1967).Instrumented rotary tablet machines. 1: Design,construction and performance as pharmaceuticalresearch and development tools. J Pharm Sci 56:109–115.
Oates RJ, Mitchell AG (1990). Comparison of calcu-lated and experimentally determined punch dis-placement on a rotary tablet press using bothManesty and IPT punches. J Pharm Pharmacol 42:388–396.
Rees JE, Hersey JA, Cole ET (1972). Simulation devicefor preliminary tablet compression studies. J PharmSci 61: 1313–1315.
Schmidt PC, Koch H (1991). Single punch instrumenta-tion with piezoelectric transducer compared with astrain gauge on the level arm used for compressionforce–time curves. Pharm Ind 53: 508–511.
8 Tablet and capsule machine instrumentation

Small LE, Augsburger LL (1977). Instrumentation of anautomatic capsule filling machine. J Pharm Sci 66:504–509.
Further reading
Armstrong NA (2004). Instrumented capsule fillingmachines and simulators. In Podczeck F, Jones BE(eds), Pharmaceutical Capsules, 2nd edn. London:Pharmaceutical Press, pp. 139–155.
Celik M (1992). Overview of compaction data analysistechniques. Drug Dev Ind Pharm 18: 767–810.
Celik M, Marshall K (1989). Use of a compaction simu-lator in tabletting research Drug Dev Ind Pharm 15:759–800.
Celik M, Ruegger CE (1996). Overview of tablettingtechnology. 1: Tablet presses and instrumentation.Pharm Tech 20: 20–67.
Hoblitzell JR, Rhodes CT (1990). Instrumented tabletpress studies on the effect of some formulation andprocessing variables on the compaction process.Drug Dev Ind Pharm 16: 469–507.
Wray PE (1992). The physics of tablet compactionrevisited. Drug Dev Ind Pharm 18: 627–658.
Introduction 9

Introduction
There are two fundamental approaches to themeasurement of force: we can describe these asdirect and indirect.
The direct approach is exemplified by the useof a two-pan balance or domestic scales to weighan object of unknown mass. Placing the objecton one pan deflects the balance beam; knownmasses are then added to the other pan until thesystem is returned to a state of zero deflection.The restoring force may also be generated byelectrical means, but the general principleremains the same. As the deflection is returnedto zero for each operation, the system is largelyindependent of the elastic properties of itscomponents.
Weighing by a version of this technique wasfor many years the most precise operation thatcould be carried out in a chemical laboratory,though it was a notably time-consuming pro-cedure. In the double-weighing procedure sug-gested by Gauss, the unknown mass was firstweighed as carefully as possible on one side ofthe balance. Then it was transferred to the otherpan and weighed again, thus compensating forany asymmetry of the beam. The declared masswas taken as an average of the two readings. Atpresent, the National Physical Laboratory pre-cision balance is capable of comparing kilogrammasses to the nearest microgram, or one part ina thousand million, though the operation stillcalls for a great deal of patience, care and time.In spite of their achievable accuracy, directmethods of this kind are clearly unsuited to con-tinuous or near-continuous measurement. Forcebalancing calls for a system that can be restored
to zero deflection for each measurement, andthis effectively rules out its application to tabletpresses and associated machines, where theforces are large and vary rapidly. However, thebalance method is very important for the staticcalibration of gauges and transducers, as we shallsee later. Force balance systems were analysed in 1975 in a monograph by Neubert, and inprinciple have hardly varied since then.
The indirect approach is that in which forcesare inferred by the effect that they have ondeformable objects. This method is exemplifiedby the spring balance, where the gravitationalforce applied by an unknown mass extends aspring whose extension is read on an arbitraryscale to represent the mass. Within certainlimits, the deformation of an elastic solid is accu-rately proportional to the applied force, so if wecan assess the deformation we can infer the forcethat produced it.
Carrying out such a measurement on a work-ing machine need not affect its normal oper-ation, provided that appropriate systems are used.Indeed, a basic principle of good instrumen-tation is that it causes only minimal disturbance tothe characteristics being measured. Nevertheless,machines such as tablet presses are constructedas more or less rigid supports for their operatingelements, and in order to infer the forces actingwithin them, it is necessary to measure verysmall dimensional changes, or ‘surface strains’.
The measurement of surface strain is nor-mally achieved by the use of ‘strain gauges’attached to the component under examination,although many other methods exist, and weshall see more of these in succeeding pages. Areview of the techniques available for force
2The measurement of force
Peter Ridgway Watt
11
measurement was published in 1982 by Erdem,and although this particular article is now over20 years old, once again we can say that theessential principles have not changed materiallysince then.
Strain measurement
Stress and strain
We have already noted that mechanical stressesproduce dimensional changes in solid materials.Stress is conventionally measured in terms ofapplied force per unit area, and it may take vari-ous forms. Thus, ‘tensile’ stress is a force thattends to elongate or stretch a specimen, while‘compressive’ stress produces a correspondingshortening of the specimen; stress may alsoresult in ‘torsion’, when the specimen is twisted,or ‘shear’. Shear stresses are always in the planeof the area being considered and are at rightangles to compressive or tensile stresses.
Strain is defined as the proportional dimen-sional change resulting from the applied force.For example, if a wire were to be stretched untilits length increased by 1% of its original value,it would be said to exhibit 1% strain. Strain isoften signified by the Greek letter e. In mostpractical applications, very much smaller levelsof strain are to be expected, and the usual work-ing unit is the ‘microstrain’, le, or proportionalpart per million. Both stresses and strains arevector quantities, with direction as well as mag-nitude, and this has to be borne in mind whenmeasuring systems are devised.
Hooke’s law
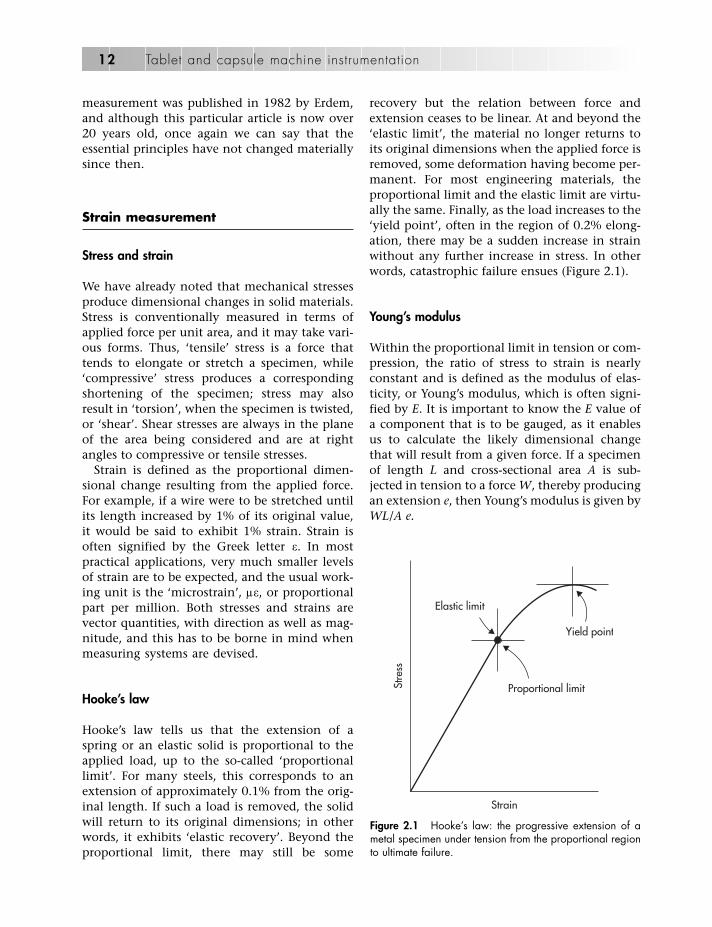
Hooke’s law tells us that the extension of aspring or an elastic solid is proportional to theapplied load, up to the so-called ‘proportionallimit’. For many steels, this corresponds to anextension of approximately 0.1% from the orig-inal length. If such a load is removed, the solidwill return to its original dimensions; in otherwords, it exhibits ‘elastic recovery’. Beyond theproportional limit, there may still be some
recovery but the relation between force andextension ceases to be linear. At and beyond the‘elastic limit’, the material no longer returns toits original dimensions when the applied force isremoved, some deformation having become per-manent. For most engineering materials, theproportional limit and the elastic limit are virtu-ally the same. Finally, as the load increases to the‘yield point’, often in the region of 0.2% elong-ation, there may be a sudden increase in strainwithout any further increase in stress. In otherwords, catastrophic failure ensues (Figure 2.1).
Young’s modulus
Within the proportional limit in tension or com-pression, the ratio of stress to strain is nearlyconstant and is defined as the modulus of elas-ticity, or Young’s modulus, which is often signi-fied by E. It is important to know the E value ofa component that is to be gauged, as it enablesus to calculate the likely dimensional changethat will result from a given force. If a specimenof length L and cross-sectional area A is sub-jected in tension to a force W, thereby producingan extension e, then Young’s modulus is given byWL/A e.
12 Tablet and capsule machine instrumentation
Elastic limit
Proportional limit
Yield point
Strain
Stre
ss
Figure 2.1 Hooke’s law: the progressive extension of ametal specimen under tension from the proportional regionto ultimate failure.

The approximate value of E for mid-rangesteels is 210 GN m�2, while that for aluminiumis 100 GN m�2, though in both examples, thevalues of E are not precisely constant since theyare affected by changes in temperature. As a rule,higher temperatures produce lower values of E.
Poisson ratio
When a length of solid material, such as a metalrod or wire, is placed under tension, its lengthincreases, and at the same time its diameteralmost always decreases. There are some anom-alous materials, known as ‘auxetics’, thatexpand under tension, but most of these arepolymer foams that fall outside our currentareas of interest.
The ratio of lateral contraction per unitbreadth to longitudinal extension per unitlength is defined as ‘Poisson ratio’, a dimension-less value often signified by the Greek letter nu(m). If the volume of the metal remained con-stant, it would be a simple matter to calculatethe change in diameter for a given change inlength. In practice, the original volume is notpreserved, and different materials exhibit a rangeof values for the Poisson ratio. Typical examplesmay be found in most engineering referencebooks, but the reader should be warned that thepublished values, although similar, do notalways agree precisely for all materials. ThePoisson ratio for zinc, for example, has beengiven variously as 0.21 and 0.331; that for castiron as 0.25 and 0.21. If the precise figure mightbe critical, it is always advisable to obtain a valuefrom the metal suppliers.
Gauge factor
As a result of changes both in its length and inits diameter, the electrical resistance of astretched wire increases, and measuring thatresistance can, therefore, provide informationabout the applied force. The proportionalchange in resistance for a given proportionalchange in length is called the ‘gauge factor’ forthat material, often indicated by the symbol K,and is a measure of its strain sensitivity.
Interestingly enough, it is not possible to predictthe gauge factor directly from Poisson ratioalone, since most resistive alloys show additionalchanges in their bulk resistivity when stressed,and this effect increases their strain sensitivity tosome extent. Without such an additional effect,the gauge factor for a typical alloy would bearound 1.6, whereas in practice most commercialfoil gauges have a factor slightly greater than 2.0.So an elongation of, say, ten parts per million(ppm) would result in a resistance change ofapproximately 20 ppm.
Strain gauges
Various devices have been developed for theassessment of strain in structures and mechan-isms, but the term ‘strain gauge’ when usedwithout qualification is generally taken to implythe electrical resistance strain gauge, in whichsmall changes in length produce accurately andreproducibly related changes in the resistance ofa conductive element.
The development of electrical resistancestrain gauges
The effect of strain on the resistance of a wireelement was observed by Lord Kelvin as early as1856, and the principle was employed in theearly 1930s by Charles Kearns to measure strainsin propeller blades, using carbon compositeresistors. In the period 1937–8, Simmons andRuge independently experimented with fineresistance wires as the basis for a strain-gaugingdevice. Later, following developments in instru-mentation during World War Two, it becamepossible to manufacture wire-based strain gaugesas a commercial proposition. For convenience inmeasurement, it was considered desirable to usewires with a resistance of at least 100 ohms (�),though there was a practical limit to the finenessof the wire that could be made and handledwithout damage. The first gauge elements were,therefore, made from a comparatively long thinwire that could achieve the required resistance.This was wound into a flat grid pattern so that
The measurement of force 13
the resulting gauge could be of reasonably smalldimensions. In these early examples, the wireswere usually held by adhesive between twolayers of insulating paper. However, they weredifficult to make and apply; they were notparticularly reproducible, and their thicknessmeant that they were not ideally adapted tofollowing small movements of the surfaces towhich they were attached.
All this changed in the 1950s with the devel-opment of photochemical etching techniquesfor the manufacture of printed electronic cir-cuits. Nowadays, gauges are mass produced fromvery thin metallic foil on an insulating backingsheet. During manufacture, the foil is coatedwith a film of light-sensitive ‘resist’, which isthen exposed to light – usually ultraviolet –through a photographic negative of the gridform. This induces local hardening of the resist,after which the soluble material can be etchedaway to leave the required pattern.
Characteristics of metal foil gauges
1. The foil gauge is essentially flat, and lendsitself well to adhesive bonding.
2. The foil elements are thin: typically in therange 0.003–0.005 mm. It is, therefore, poss-ible to produce grids of small area that never-theless have electrical resistances in the range100–5000 �. This is a convenient range formeasurement.
3. It is easy to incorporate alignment marks intothe gauge pattern, so that the gauges can befitted into precisely known positions.
4. The flat construction of the gauge ensuresthat thermal gradients between the gaugesand the surface to which it is attached arekept to a minimum.
5. The method of production provides for a veryhigh degree of reproducibility betweengauges, both in terms of resistance and inphysical dimensions.
6. Most strain gauges are intended to measurestrain in one direction, while remaininginsensitive to transverse strains. The etchedfoil gauge can be formed with narrow,high-resistance, elements along its principalaxis; the transverse elements can be made
much wider so that they are of relativelylow resistance.
7. Chemical etching introduces little or nostrain in the foil from which the gauges aremade. Etched foil elements, therefore, showgood stability and minimal drift.
Since etched foil gauges have a large surface area,they may be susceptible to oxidation and insu-lation leakage at elevated temperatures: butthese effects will not be apparent below 200ºC,and for applications in tablet and capsule studiesthey can reasonably be ignored.
Gauge construction
As has been noted, the gauge element is in theform of a metal grid. The metal itself is usuallyan alloy, and it will be chosen for some specificproperties since no single material is univer-sally applicable. However, the two most widelyused materials are copper–nickel alloy, or‘Constantan’, and nickel–chromium alloy,Karma or ‘K’ alloy. Copper–nickel alloy gridscan be used over the temperature range �75ºCto �175ºC, although they may exhibit slowchanges in resistance when held for long peri-ods over 70ºC. Nickel–chromium has a some-what greater range, extending up to at least300ºC, and also has slightly higher strainsensitivity.
Figure 2.2 shows a typical grid form. It can beseen that the gauge consists of many narrow par-allel elements joined by end loops to produce anelectrically continuous circuit. The end loops arerelatively wide, and not only give reduced trans-verse sensitivity but also help to provide goodmechanical attachment between the gauge andthe substrate. Large pads are provided for the con-nection of electrical leads, and there are align-ment marks that assist with gauge positioning.The ‘effective length’ of the element is defined asthe distance between the end loops of the grid.
The fine grid makes it possible to achieve asuitably high resistance in the gauge element.This configuration provides maximum strainsensitivity along the measurement axis whileremaining relatively insensitive to strains on thetransverse axis.
14 Tablet and capsule machine instrumentation

There are some specialised gauge alloys thatare not readily soluble in common etching flu-ids, and these materials may be punched out bythe technique known as ‘fine blanking’, with anaccurately ground punch and die assembly.However, for all practical purposes they can beignored in our particular areas of interest, whichin general involve the measurement of strain lev-els usually below 300 �e in materials at or nearroom temperature.
Gauge backing
Various insulating materials, such as fibreglassepoxy and resin-bonded papers, have been usedto support strain gauge elements, though now-adays cast polyimide films are perhaps the mostpopular for general work, particularly when thegauges are to be used at moderate temperatures.Clearly any backing material must retain highinsulation resistance at the working temperature,be dimensionally stable and transmit strain effi-ciently from the substrate to the gauge. For maxi-mum efficiency in this last respect, the backingmust be as thin as possible, typical values for
thickness being around 25 lm. The sensing gridmay be open faced, while some gauges areoffered with a protective upper encapsulatinglayer of approximately 13 lm.
It is evident that gauges of this light construc-tion will not affect the mechanical performanceof any large structure to which they are bonded;however, they may have more effect on smallcomponents of about their own size. In design-ing instrumentation for the estimation of veryweak forces, therefore, it is useful to bear in mindthat the gauge and its adhesive can add materi-ally to the stiffness of a very thin component. Afinal requirement is the ability for the gaugebacking to form a strong adhesive bond with anappropriate cement.
Gauge configuration
The gauge grid is designed, as we have seen, torespond mainly to strain along one direction:normally the axis of principal strain. However, itis often very useful to be able to measure the pat-tern of surface strains on an object, and to facili-tate this it is convenient to use composite or
The measurement of force 15
MeasurementaxisGauge alignmentmarks
Transverseaxis
Gau
ge
leng
th
Grid line
Grid area
End loops
Soldertabs
Matrix orbacking
Figure 2.2 Foil strain gauge terminology.

‘rosette’ gauges, with two or more grids on acommon backing. Figure 2.3 shows a selection ofdifferent forms that are available.
In the simplest example, two similar grids aremounted with their axes at right angles to eachother. Double gauges of this form are often usedto provide temperature compensation for oneactive gauge, the second gauge giving a smallersignal along the other axis. Since this smaller sig-nal is derived from the transverse movement of
the gauged surface, it is a function of Poissonratio for the material involved, and the gauge is,therefore, often described as the ‘Poisson gauge’.
There are many other common configurations,apart from the double gauge. For example, thereis the three-axis rosette with symmetrical armseither at 0–60–120º to each other (delta) or0–45–90º (rectangular), the latter being the morecommon configuration. These can be used in aninvestigative mode to determine the exact direc-
16 Tablet and capsule machine instrumentation
21
SR -4
SR -4
SR -4
Figure 2.3 Resistive strain gauges are available in a variety of configurations for specific applications.
tion of the principal strain on a surface; themethod of manufacture ensures that the grids arenot only well matched for their electrical proper-ties but also have accurate angular positions.There are also linear arrays of grid elements,which again can be used on a temporary basis tolocate the best site for subsequent attachment ofa permanent gauge, and circular gauges intendedto fit the diaphragms of pressure gauges.
Electrical characteristics
We have noted that the strain sensitivity of aresistive gauge is indicated by its gauge factor, K,and that foil gauges in general have a K valuethat is close to 2. This apparently simple picturebecomes less simple on closer examination, sincethe value of K is not invariant over the range ofworking conditions. In practice, gauge factorsvary with temperature, and to some extent withthe strain level itself.
Temperature variation of the gauge factor
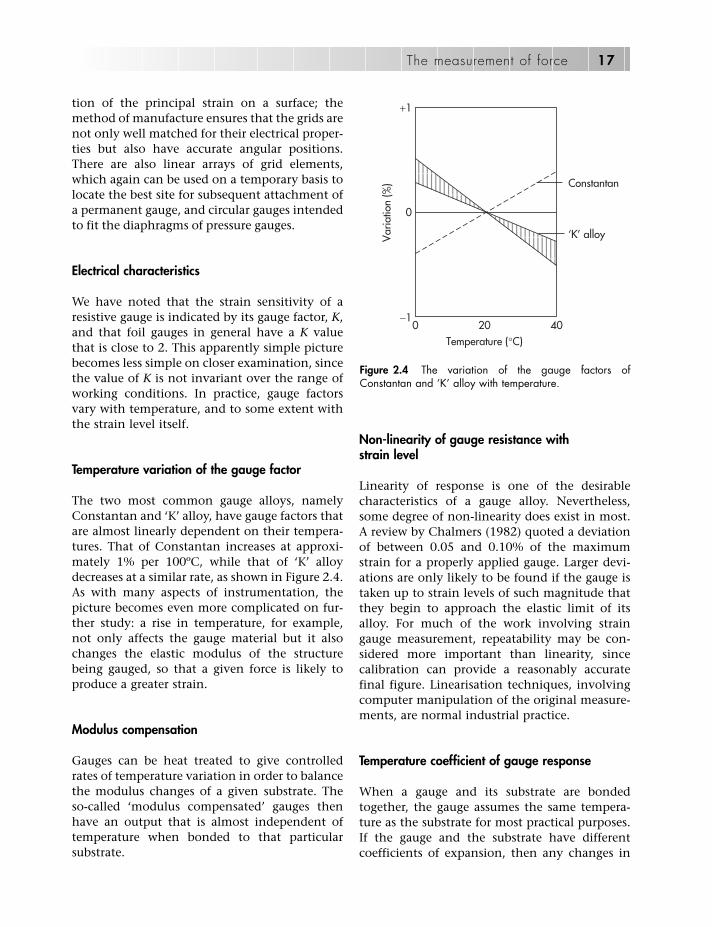
The two most common gauge alloys, namelyConstantan and ‘K’ alloy, have gauge factors thatare almost linearly dependent on their tempera-tures. That of Constantan increases at approxi-mately 1% per 100ºC, while that of ‘K’ alloydecreases at a similar rate, as shown in Figure 2.4.As with many aspects of instrumentation, thepicture becomes even more complicated on fur-ther study: a rise in temperature, for example,not only affects the gauge material but it alsochanges the elastic modulus of the structurebeing gauged, so that a given force is likely toproduce a greater strain.
Modulus compensation
Gauges can be heat treated to give controlledrates of temperature variation in order to balancethe modulus changes of a given substrate. Theso-called ‘modulus compensated’ gauges thenhave an output that is almost independent oftemperature when bonded to that particularsubstrate.
Non-linearity of gauge resistance withstrain level
Linearity of response is one of the desirablecharacteristics of a gauge alloy. Nevertheless,some degree of non-linearity does exist in most.A review by Chalmers (1982) quoted a deviationof between 0.05 and 0.10% of the maximumstrain for a properly applied gauge. Larger devi-ations are only likely to be found if the gauge istaken up to strain levels of such magnitude thatthey begin to approach the elastic limit of itsalloy. For much of the work involving straingauge measurement, repeatability may be con-sidered more important than linearity, sincecalibration can provide a reasonably accuratefinal figure. Linearisation techniques, involvingcomputer manipulation of the original measure-ments, are normal industrial practice.
Temperature coefficient of gauge response
When a gauge and its substrate are bondedtogether, the gauge assumes the same tempera-ture as the substrate for most practical purposes.If the gauge and the substrate have differentcoefficients of expansion, then any changes in
The measurement of force 17
0
+1
−10 20
Temperature (°C)40
Constantan
Var
iatio
n (%
)
‘K’ alloy
Figure 2.4 The variation of the gauge factors of Constantan and ‘K’ alloy with temperature.

temperature will set up strains in the gauge andwill produce misleading signals. These will beread as ‘apparent strain’ (more recently termed‘thermal output’) in the system and can bevery large in terms of the expected signal. Forexample, a nickel–chrome gauge bonded to amild steel bar may exhibit an apparent strain ofas much as 1000 �e for a temperature rise of 40ºCabove ambient. For a measuring system capableof resolving as little as 0.10 �e under the bestconditions, this would introduce a substantialerror indeed.
Gauge compensation
Interestingly enough, it is possible to adjust thecoefficients of expansion of certain strain gaugealloys in order to match those of common engin-eering metals. When the alloy is rolled into thethin foil that is needed for gauge construction, itbecomes work-hardened. It can be taken fromthe fully hardened state to a fully annealed – orsoftened – state by controlled heat treatment,and during this process its expansion character-istics progressively change. With appropriateattention to the time and temperature of anneal-ing, the alloy can be matched to a variety of dif-ferent substrates over a temperature range of upto 25ºC on either side of ambient. Gauges madefrom alloys that have been heat treated in thisway are known as ‘self temperature compensat-ing’ (STC) gauges. Commercial gauge manufac-turers offer STC gauges to suit a range of differentsubstrates, including aluminium, mild steel, stain-less steel, concrete, titanium, and some plastics:in effect, most common structural materials.The gauges may be ordered as needed to matcha given named substrate, or alternatively tomatch a given coefficient of thermal expan-sion. For example, a material with a measuredlinear coefficient of 16 � 10�6 ºC�1 could bematched well with a gauge such as the ShowaN11MA 5 120 16 3 LW, where the underlinednumeral indicates the average expansion coefficient in parts per million per degree centi-grade. Other makers provide a similar facility,though it is worth noting that, as many of thegauge suppliers are either from the USA or havestrong affiliations there, the temperatures
quoted in their documentation may be in theFahrenheit scale. The related code numbers maybe misleading if this is not borne in mind.
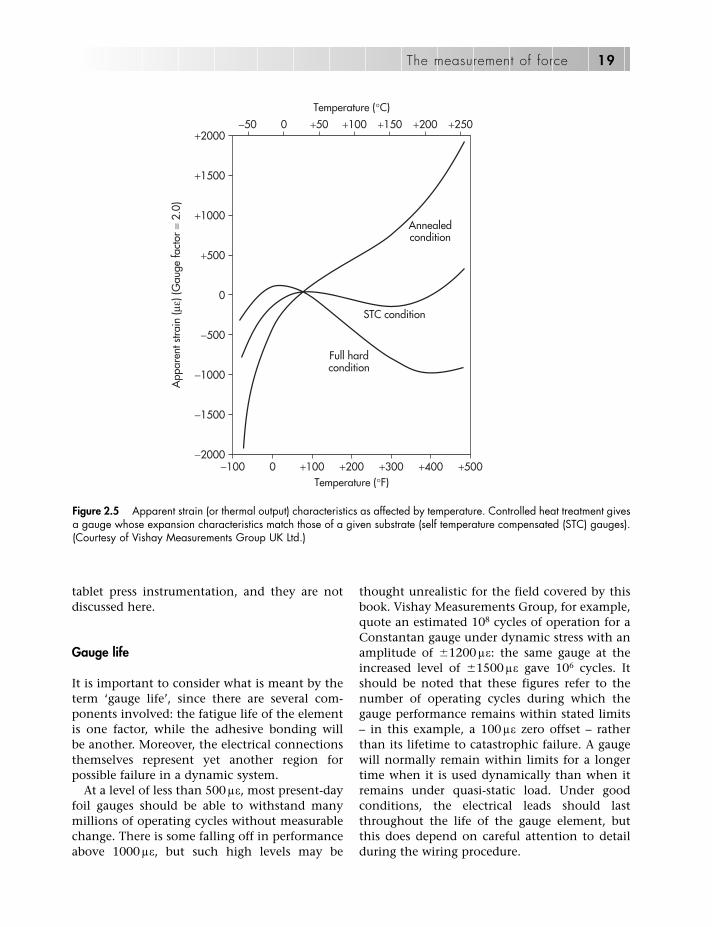
Figure 2.5 shows how the ‘thermal output’ of atypical foil gauge can vary as a result of its heattreatment. The compensation achieved with anoff-the-shelf STC gauge should be within0.3–0.4 le ºC�1. Where there are accurate andindependent means of checking the gaugetemperature, the data-logging system may beprogrammed with a compensating algorithm.
Dimensions of foil gauges
The photographic process that is used to formthe etch resist pattern during manufacture of thegauges is capable of high resolution, and in prin-ciple could be used to form grid lines down to afew micrometres in width, or up to any largersize as required. For convenience in measure-ment, it is useful to be able to produce gauge ele-ments whose electrical resistances fall in therange 100–1000 �, or occasionally up to 5000 �in some applications, and this requirementmeans that gauges are usually no smaller than0.20 mm in effective length. Even at this sizethere may be problems in ensuring that thestrain to be measured is transmitted completelyfrom the substrate to the element, and unlessthere is any over-riding need to have anextremely small gauge it is more usual to workwith, for example, a 1.5–3 mm version.
Measuring range
It has already been noted that the levels of strainlikely to be met in tablet presses or capsule fillersare relatively low, probably not exceeding300–500 le at most. This is well below the ratedcapability of modern gauges. Some Constantanfoil gauges, for example, are advertised as beingsafe for operation at strain levels of up to50 000 le, provided that the gauge length isgreater than 3.0 mm. The limitation is not thatof the backing, since polyimide is very flexible,but of the foil itself. There are special-purposegauges with even greater capabilities, but theyare hardly likely to be needed for applications in
18 Tablet and capsule machine instrumentation
tablet press instrumentation, and they are notdiscussed here.
Gauge life
It is important to consider what is meant by theterm ‘gauge life’, since there are several com-ponents involved: the fatigue life of the elementis one factor, while the adhesive bonding willbe another. Moreover, the electrical connectionsthemselves represent yet another region forpossible failure in a dynamic system.
At a level of less than 500 le, most present-dayfoil gauges should be able to withstand manymillions of operating cycles without measurablechange. There is some falling off in performanceabove 1000 le, but such high levels may be
thought unrealistic for the field covered by thisbook. Vishay Measurements Group, for example,quote an estimated 108 cycles of operation for aConstantan gauge under dynamic stress with anamplitude of �1200 le: the same gauge at theincreased level of �1500 le gave 106 cycles. Itshould be noted that these figures refer to thenumber of operating cycles during which thegauge performance remains within stated limits– in this example, a 100 le zero offset – ratherthan its lifetime to catastrophic failure. A gaugewill normally remain within limits for a longertime when it is used dynamically than when itremains under quasi-static load. Under goodconditions, the electrical leads should lastthroughout the life of the gauge element, butthis does depend on careful attention to detailduring the wiring procedure.
The measurement of force 19
App
aren
t stra
in (μ
ε) (G
auge
fact
or =
2.0
)
Annealedcondition
+2000−50 0 +50 +100
Temperature (°C)
Temperature (°F)
+150 +200 +250
+1500
+1000
+500
0
−500
−1000
−1500
−2000−100 0 +100 +200 +300 +400 +500
STC condition
Full hardcondition
Figure 2.5 Apparent strain (or thermal output) characteristics as affected by temperature. Controlled heat treatment givesa gauge whose expansion characteristics match those of a given substrate (self temperature compensated (STC) gauges).(Courtesy of Vishay Measurements Group UK Ltd.)

Gauge resistance
We have noted that the early gauges, which werebased on fine wire elements, usually had resist-ances in the region of 120 �, and a certainamount of instrumentation developed aroundthat particular value. However, the photolith-ography method used to make gauges nowadaysis capable of producing grids with a considerablyextended range of resistances, and higher values,from 350 to 5000 � are in common use.
The value selected for a given application willgenerally represent a compromise betweenopposing considerations. If the gauge resistanceis high, on the one hand, then it is possible toapply a higher voltage to the measuring bridge,and hence to extract larger signals for a givenstrain level. On the other hand, low ohmicvalues are less affected by electrical noise andinsulation leakage, although leakage should beminimal at near-ambient temperatures. The120 � gauges are still manufactured, but the350 � variety are widely used, and those of1000 � and above often appear in transducers ofvarious types. The use of high-resistance gaugesin portable equipment, which may be batterydriven, can help to minimise the current drain.
Semiconductor gauges
The electrical resistance gauges discussed abovehave alloy grids, and it is mainly the changes inlength and cross-section that provide corre-sponding changes in resistance when thesegauges are strained. In other words, there is alargely volumetric effect. However, there is afurther class of gauge that uses semiconductortechnology and has much greater gauge factors,extending from 50 up to 200. They are usuallymade from doped silicon wafers, and their resist-ance change results from a heavily stress-dependent change in specific resistivity. It ispossible to dope the silicon in modes that giveeither positive (P-type) or negative (N-type)gauge elements. Of these, the N-type can bemade in temperature-compensated forms for avariety of substrates. It is also possible to makea complete four-arm bridge with N- and P-typegauges.
Since the specific resistivity of the semicon-ductor materials is much higher than that of thenormal gauge alloys, it is not necessary to fabri-cate semiconductor gauges as fine grid struc-tures. They are usually made as narrow strips,sliced from the silicon crystal, with a thickness ofperhaps 0.01–0.05 mm and lengths varying from0.75 to around 6.0 mm. Figure 2.6 shows a typi-cal unbacked semiconductor gauge, with a scalein millimetres indicating its size. The connectingwires are made of small-diameter (30–40 lm)gold wire and are very soft and easily damaged.Unbacked gauges are extremely fragile andrequire great care in their application. Backedgauges are easier to apply.
Semiconductor gauges are available in a widerange of nominal resistances from 75 � up to1000 �. Their fatigue life is not substantially dif-ferent from that of foil gauges. At a dynamic loadof �1000 le, the expected life is over 108 cycles.
At one time, these gauges were considered tohave poor stability, linearity and reproducibility,
20 Tablet and capsule machine instrumentation
Figure 2.6 The semiconductor strain gauge. Because theelectrical resistance of these materials is much higher thanthat of metal foil, these gauges are made up of single ele-ments rather than grids. The scale on the right of the illus-tration is in millimetres.
though all these have been significantlyimproved, partly by better doping technologyand partly by the use of automated sortingsystems that can find matched sets of gaugesfrom a production batch. It is claimed that acomplete four-arm bridge of this type can havegood temperature compensation, in the regionof �0.015% ºC�1, but in general it has to be saidthat conventional alloy gauges still appear to besuperior in terms of sensitivity to temperaturevariations and drift. However, our particularareas of interest in instrumentation do notusually involve large temperature excursions, sofor many applications these points may not becritical. The major disadvantage of the semicon-ductor gauge appears to be the fact that itsresponse to strain is quite significantly non-linear; consequently, the gauge factor variesappreciably with the strain level. It is suggestedby the National Instruments Company that asemiconductor gauge may have a factor of �150with zero strain, dropping non-linearly to �50at 5000 �e. It is, therefore, necessary to apply acorrection curve to the raw data.
Semiconductor gauges have been used by,among others, Britten et al. (1995) in theconstruction of a capsule-filling machinesimulator.
Sputtered thin-film gauges
There is an additional method of productionthat has been applied to the manufacture ofresistive gauge elements; this uses sputteredthin-film technology that was developed forindustrial electronics. An insulating layer is firstevaporated on to the surface that is to be gauged.Then the resistive grid is directly deposited bysputtering under high vacuum. Thin-film ele-ments are used in transducer assemblies such aspressure gauges and load cells, and the methodof manufacture makes it possible to generate acomplete four-arm bridge in one operation.These elements have also been applied to smallcantilever beams, which are commercially avail-able with a range of load capacities from 0.5 to50 N. Since they do not use conventional adhe-sives to bond the gauge elements to their sub-strates, problems of adhesive creep and drift are
minimised. Their long-term stability is said to beextremely good, though their application is nat-urally limited to use on relatively small compo-nents that can be conveniently loaded into avacuum chamber.
Gauge selection
It will be apparent that it has only been poss-ible to give a simplified picture of current straingauge technology. However, the requirements oftablet press or capsule work are not particularlystringent, most operations taking place at ornear room temperature, and the levels of strainto be measured do not usually exceed 300 le, sofor most of our applications the standardConstantan or ‘K’ alloy gauges should be quitesufficient. In this context, we would stronglyrecommend that the gauge suppliers are bestplaced to give advice on the choice of gauge fora given application. The theory and practice ofelectrical resistance strain gauges were outlinedin a series of articles by Mansfield (1985) and areference work by Pople (1979) appeared in theBSSM Strain Measurement Reference Book, pub-lished by the British Society for StrainMeasurement.
Gauge attachment
Years ago, any research group embarking on theinstrumentation of a press or some allied equip-ment would have been obliged to carry out thegauging themselves. This is no longer to be rec-ommended for any permanent instrumentation,although it may well be useful to carry out inves-tigative gauging in-house, just in order to locatea suitable gauge position.
In Chapter 3, we shall see the detailed workthat is necessary to produce an installation ofprofessional quality. There are now quite a feworganisations that offer gauge installation ser-vices of this standard, and some are listed inthe Appendix at the end of the book. Once asuitable site for the gauges has been identified,our advice to the reader would be to leavepermanent installation to the experts.
The measurement of force 21

Siting strain gauges
If an unfamiliar piece of equipment is to be pro-vided with strain gauges on a permanent basis,then it will be important to know where, and inwhat orientation, the gauges should be sited. Wehave already seen that tablet machines are nor-mally designed for rigidity in use, so that littledimensional change occurs during a com-pression cycle. If a machine is to be gauged, it is,therefore, essential to site the gauges to the bestadvantage. It may be argued that the optimumpositions on familiar machines are already wellknown, but to some extent we have attempted tostart from first principles, assuming no priorknowledge, and illustrating the means thatare available to identify gauging sites on anystructure.
Stress analysis
There are two general methods of approach,namely modelling and direct measurement, eachwith a number of variations.
Modelling methods of stress analysis
Finite element analysisFinite element analysis is a purely mathematicalapproach in which the surface of the object to beanalysed is treated as if it were formed from anumber of simple geometrical figures such as tri-angles, rectangles and so on, each of which iscapable of individual stress analysis. Such ele-ments as the thin plate, the cylinder and varioustypes of loaded beam were analysed in greatdetail during the nineteenth century, and theirbehaviour under load can be predicted with con-siderable accuracy. The inter-relations of theseelements are calculated, and the response of theobject as a whole can then be deduced. Themethod becomes progressively more accurate assmaller and smaller elements are taken, thoughthe calculation of the interactions naturallybecomes more involved.
One important aspect of the finite elementmethod is its ability to handle both real andimaginary structures. Provided that a surface canbe described in sufficient detail, it can be
analysed. It is, therefore, possible to estimatethe likely effects of design changes in a structureor in a component without the expense of itsmanufacture and modification. In the study ofspecific machines, such as tablet presses, designchanges may clearly not be permissible, but it iscertainly possible to investigate, by this tech-nique, the effect of siting gauges at differentpositions on a given machine. Modern finite ele-ment analysis packages can be run successfullyon desktop computers and can be configured toshow lines of equal strain or to display areas infalse colour to give enhanced visualisation of astrain distribution pattern. Finite element analy-sis was used by Yeh et al. (1997) to determine theoptimum positions of strain gauges in an instru-mented die used for the measurement of die wallstress.
The over-riding consideration in any model-ling system is, of course, that the model must beadequately representative of the real structure,taking into account all dimensions and materi-als, and any internal cavities, blowholes, etc.,that might affect the mechanical behaviour ofthe structure. In this context, it is worth notingthat reports on the Tay bridge disaster of 1879found that some of the castings used in the con-struction of the ill-fated bridge had blowholes upto 2 inches deep (Lee, 1981). These holes hadbeen disguised by the application of a blackpaste, which carried the French name of ‘BeauMontage’ but unsurprisingly was known in theUK as ‘Beaumont Egg’. It had no mechanicalstrength and was applied as a purely cosmeticmeasure. Clearly here was an example of a struc-ture in which finite element analysis mighteasily have given a dangerously misleadingresult.
Photoelastic modelsThere are at least two ways in which modellingcan be used in this context. Firstly, some regionof particular interest can be reproduced at fullscale and tested in isolation. This may be quiteuseful if the original machine is complex, largeand heavy. Secondly, and perhaps more usually,the whole structure can be reproduced as asmall-scale model, with sufficient detail toensure that its behaviour simulates that of thereal machine for the purposes of the test. In each
22 Tablet and capsule machine instrumentation

case, the model will then be subjected to appliedforces that have themselves been scaled to corre-spond to those in the original machine and willproduce appropriate dimensional changes orstrains in the model. If the model is made oftransparent plastics material, it can be examinedby transmitted light. An unstressed plasticsmodel will not modify the light passing throughit to any marked extent, but physical stress maycause the material to exhibit some degree of bi-refringence. If such a model is set up in front ofa source of polarised light, and is examinedthrough a suitable optical analyser, any stressedareas will be seen to show visible fringe patterns.White light produces coloured fringes, whilemonochromatic light can give clear, sharplydefined fringes that are more useful for measure-ment. The effect can conveniently be seen bypositioning the model between two sheets of‘Polaroid’ with their optical axes crossed at rightangles (Figure 2.7). The addition of a quarter-wave plate generates colours in the fringe systemso that variations across the model are more eas-ily seen. Suitable equipment for this operation isusually to be found in any glass-blowing labora-tory, where it is used to detect residual stress inglass components before and after annealing.
The production of coloured fringes can bedemonstrated quite easily in models made from
‘Perspex’ or similar types of acrylic plastic, butfor careful analytical work it is customary to usespecially developed polycarbonate or epoxyresins. One feature of these specialised materialsis their ability to retain stress patterns after thestress itself has been removed. This retention canbe facilitated by raising and lowering the tem-perature in a prescribed controlled way so thatthe pattern is ‘frozen’ into place for subsequentstudy. In this technique, the model is heated ina sufficiently large oven and is stressed while atan elevated temperature. It is then allowed tocool, still under stress, to room temperature. It isthen stable enough for further analysis.
It must, of course, be remembered that stressdistributions are usually three dimensional andare not always easy to determine accuratelywithin a complex scale model. For the purposesof measurement, therefore, the model is usuallycut into thin laminar sections that can be treatedas two-dimensional forms. The cutting processmust, naturally, be carried out without alterationof the frozen stress pattern. After sectioning hasbeen accomplished, any further studies are likelyto require a completely new model, so detailedanalyses of complex structures by this procedurecan be fairly time consuming.
In spite of its disadvantages, the photoelasticmodel does provide a simultaneous picture of
The measurement of force 23
Light source Diffusing screen
Polarising filter
Transparent model under test
Viewpoint
Second polarising filter
Quarter-wave retardation plate to produce coloured fringes
Figure 2.7 Stress analysis in polarised light. A transparent plastics model is placed between two crossed polarisingscreens. Stresses appear as variations in the transmitted light intensity.

the stresses, both internal and external, associ-ated with a whole structure. If the model is sub-jected to progressive loading, changes in thefringe pattern can be observed as they happen.An increase in the stress level generally pro-duces a corresponding increase in the numberof fringes seen, but the particular spacingbetween fringes will depend on the compositionof the polymer used for the model, and on itstemperature.
Resins for modellingThe specially formulated casting polymers havehigher strain sensitivity than that of the com-mercial sheet plastics and will, therefore, exhibitmore fringes for a given load (Figure 2.8). Modelscut from sheet ‘Perspex’ can, nevertheless, pro-vide useful information on a rather more quali-tative basis. They are best used when thecomponent to be represented is itself relativelyflat, for example a plate cut from sheet metal. Insuch cases, the stress pattern is likely to be nearlytwo dimensional and will be less confusing thanthat from a complex, solid, object.
It is, however, important to be aware of thepossibilities of misinterpretation. Commercialsheet plastics often have internal stresses result-ing from the method of manufacture, and addi-tional stresses may be introduced by thesubsequent cutting procedure. An example of
this was seen in the writer’s laboratory duringthe production of a simplified model of theupper arm for an F3 single-punch tabletmachine. The outline of the arm was drawn onthe protective paper covering a sheet of 5.0 mm‘Perspex’, and the model was then cut from thesheet by a powered bandsaw. After cutting, themodel was examined in a glassblower’s polaris-ing ‘strain viewer’ and was found to show arepeated strain pattern around the cut edges,with a highly stressed region occurring every fewcentimetres. This appearance might have led towrong conclusions in a photoelastic analysis, butin fact it resulted solely from the method of cut-ting. Bandsaw blades are made from a narrow-toothed strip of metal welded into a continuousloop. The physical properties of the bandsawblade are modified by the presence of the weld,and small projections may be introduced at thejunction itself. In this particular instance, thewelded joint was striking the ‘Perspex’ sheet ateach revolution of the bandsaw blade, eachimpact causing localised changes in the material.
In addition to the strains produced by impacts,plastics may exhibit more generalised bulkeffects. The F3 arm model mentioned aboveappeared substantially colourless when vieweddirectly through its front face. When rotated sothat it could be seen edgewise, it appeared toshow a range of coloured fringes. In fact, these
24 Tablet and capsule machine instrumentation
Figure 2.8 Fringes in a stressed model made from a strain-sensitive epoxy resin. (Courtesy of Sharples Photomechanics Ltd.)
colours resulted from a general internal stress,coupled with the wedge-shaped configurationof the model: different thicknesses showeddifferent colours.
AnnealingIf commercial sheet plastics are to be used forsimple stress models, they should always beannealed after machining. Controlled heat treat-ment releases the internal stresses from thematerial and so they will not confuse the sub-sequent observation of load-related stress pat-terns. Information on suitable annealingprogrammes is available from the suppliers ofplastics, but, as an example, it is usually possibleto anneal polymethylmethacrylates such as‘Perspex’ or ‘Plexiglass’ by raising their temper-ature slowly to approximately 85ºC for 30 minor so, then cooling them down to room temper-ature over 1 or 2 h. Alternatively specialist sup-pliers of photoelastic materials can supply theplastic in a form that is stress free and requiresonly careful machining. The material is in theform of flat slabs and pre-cast blocks and roundsin various sizes. Sheets are available from 0.25 to12.7 mm thick and up to 500 mm square.
The photoelastic technique outlined here hasbeen discussed as being one means of determin-ing the most satisfactory site for the installationof strain gauges. However, it has sometimes beenapplied as a measurement system in its ownright. For example, Ridgway (1966) constructed amodel die from ‘Perspex’, used the model to pre-pare tablets and estimated the die-wall stressesinvolved by counting interference fringes as thecompression proceeded. The changing fringepatterns were recorded on cine film for lateranalysis. Accurate, quantitative interpretation ofphotoelastic patterns in solid, three-dimensionalobjects is not particularly easy to achieve,though the monograph by Frocht, published asearly as 1948, is still a useful guide to this field.
Direct methods of stress analysis
It is perhaps worth repeating that both the meth-ods outlined above have the disadvantage ofdealing with an idealised concept of the struc-ture being analysed rather than with the actualstructure itself. In reality, as we have noted,
materials may contain internal inhomogeneities.Methods designed to measure the mechanicalperformance of a real structure, by comparison,have the merit of including any of its weaknessesin the general picture that is obtained. Some ofthe available procedures are indicated below.
Photoelastic film measurementWe have already seen that mechanical stressmodifies the optical properties of some trans-parent plastics, as in the analysis of resinmodels. The physical behaviour of these modelsis, naturally, that of the plastics from whichthey are made. However, it is also possible to usesimilar plastics materials as thin coatings on thereal structures that are to be studied.
If the transparent plastic layer is fitted veryclosely, then its movement is controlled entirelyby that of the more massive underlying struc-ture. Interference fringes develop, as before, inthe plastics material and may then be observedthrough a reflection polariscope. Measurementsmade by this technique can be of considerablevalue in any study of machine deformationunder load but would not usually be attemptedby a formulation laboratory: they are normallycarried out by specialist companies who havethe experience and the equipment to provide areliable service, such as Vishay MeasurementsGroup.
Investigative strain gaugesOne commonly used procedure for stress – or,more accurately, strain – analysis is that ofapplying relatively large numbers of resistivestrain gauges to the accessible surface of the teststructure. Since neither the magnitude nor thedirection of the surface strains are likely to beknown at the outset, it is necessary to use pat-terns of gauges that can deal with a range ofpossibilities. Rosette gauges, with three elementsat 120º are most useful in determining thedirections of principal strains (see above).Another composite form of gauge, sometimesused for investigative work, carries many small-gauge grids arranged parallel to each other in alinear array. In some versions of this gauge,alternate grids are set at right angles to the axisof the assembly so that they provide a long lineof compensated half-bridges. Their signals are
The measurement of force 25

compared for magnitude, linearity and noise.An example of an investigative strain gauge isshown in Figure 2.9.
Since these gauges are generally used on a tem-porary basis, it is not normally essential to pro-vide the complete armoury of gauge-protectionmethods, or to provide strain-relief loops in allthe wire connections. Gauges with integral leads,or with large pads for soldering, may be used,and they may be conveniently attached withcyanoacrylate ‘instant’ adhesives.
If gauges are applied to areas that seem likelyto exhibit high strain levels, then the first exper-imental measurements should make it possibleto deduce new gauge positions for a second test,and so on. The optimum positions can thus beapproached through a series of iterative steps.
One advantage of investigative gauging overmethods such as brittle lacquer testing is that itdoes provide much greater accuracy and sensi-tivity at the points measured. Though its main
purpose is to identify a site for permanent straingauging at a later time, it also puts an approxi-mate value on the signal that may be expectedfrom the permanent gauges. It does not give ageneral contour map of strain distribution, how-ever, without a considerable amount of fairlytedious work and the fitting of many gauges.
Holographic interferometryWhen a component is strained, then by defi-nition its dimensions change. Points on itssurface will move by small amounts from theirrest positions, and that movement can bemeasured by various optical means. One sensi-tive optical method for the evaluation of smallmovements is holographic interferometry.
In one version of this method, a holographicexposure is first made of the component in itsunloaded state. The component is then stressed,and a second exposure is made while the holo-graphic film or plate is held in a fixed position.If the component has remained unchangedbetween the two exposures, a single holographicimage results. However, where there has beensurface strain, the composite hologram shows apattern of light and dark fringes. These consti-tute the interferogram, from which the extent ofsurface movement can be calculated.
Holographic interferometry has become anaccepted method for the study of small defor-mations in engineering components. It wasemployed by Ennos and Thomas (1978), forexample, to evaluate the distortion of plasticsafter injection moulding, and it has been usedby Ridgway Watt (1981) to observe the recoveryof compressed tablets after their ejection fromthe die.
Various methods can be used for the pro-duction of the hologram. The classical procedurenormally involves the use of a large optical table,together with a double-beam system for laserillumination. There are useful review articles onthis subject from Robertson and King (1983) andWeingartner (1983). There is also a comprehen-sive monograph by Abramson (1981). The necess-ity for absolute rigidity of the optical table issuch that only a few laboratories are likely to beequipped for the classical methods of holo-graphy. It is, nevertheless, quite possible toprepare useful holographic interferograms on
26 Tablet and capsule machine instrumentation
Figure 2.9 Investigative strain gauges. Groups of gaugesare applied temporarily to the test surface and their signalscompared for magnitude, linearity and noise.

inexpensive, simple, equipment by using the‘Denisyuk’ white light method.
White light holographyThe Denisyuk method avoids the problems ofdouble-beam operation by using a single laserbeam, which acts both as the signal and as thereference. With this arrangement, the mechan-ical properties of the equipment used are notparticularly critical, and it is possible to produceuseful holograms from small objects withoutundue complication. The object to be recorded issupported close to the surface of an unbackedtransparent plate or film, such as Agfa Holotest8E-75-HD. It is illuminated by laser light passingthrough the emulsion from the far side of theplate. Some of the light is reflected by the objectand is returned back to the plane of the emul-sion, where it interacts with the original or refer-ence beam, giving rise to a three-dimensionalinterference pattern. The holographic emulsionrecords a thin section through this pattern, rep-resenting the object as seen from the plane ofthe film provided that the film is capable ofresolving the fine structure of the interferencefringes. In practice, if the light source is ahelium–neon laser operating at a wavelength of633 nm, the film must be able to resolve about3000 lines mm�1. The exposure time for a2–3 mW laser will be in the range 0.2–10 s,depending on the beam width and the reflectiv-ity of the test object. After development, theresultant hologram can be seen clearly in whitelight from a point source, or in direct sunlight.Surface movements in and out of plane willresult in the appearance of fringes, each fringerepresenting a movement of half a wavelengthof the laser light used.
The holographic cameraThe Denisyuk method by itself is limited toobjects of a few centimetres in size, but with theaddition of a lens system it can be extendedsomewhat. Rowley (1979) modified a standard35–mm camera by fitting a mirror immediatelybehind the normal plane of the film, andmounted a second mirror next to the subject.Laser light, falling on the subject and the adjac-ent mirror, enters the camera lens and is imagedon to the transparent Holotest 10E-75 film. Some
light passes through the film and is reflected bythe internal mirror, so producing interferencefringes within the thickness of the emulsion.Rowley gives useful practical details, both of themodification to the camera and of the processingmethods.
Real-time holographic interferometryWhite light holograms can provide a sensitivemeasure of surface movement, but they are notnormally able to display the movement in realtime. For that it is necessary to be able to viewthe subject through a hologram of itself, sothat differences between the subject and itsimage can be observed continuously. In prac-tice this requires that the holographic platemust be developed in situ, since any movementwould destroy the image. Dudderar and Gilbert(1985) used a dry-process holographic film in aNewport Corporation HC300 ‘instant holo-camera’ to achieve continuous observation ofdeveloping fringes.
The moiré grid techniqueOne of the practical limitations of the holo-graphic method noted above is that of the poweravailable from the laser. A subject area of, say,100 cm2, lit by a laser of 2 mW, needs an expo-sure time of a few seconds. Larger areas lit by thesame laser would need correspondingly longertimes, but these inevitably lead to movementduring the exposure, and hence to hologramsthat are either degraded or non-existent. Higher-powered lasers can be used to illuminate struc-tures that may extend to several metres both inheight and in width, but they are expensive andpotentially dangerous pieces of equipment. It is,therefore, convenient to have methods of strainanalysis that can be carried out in daylight. Onesuch method was developed by Burch and Forno(1975) at the National Physical Laboratory, andis based on the generation of moiré fringes.
The structure to be examined is first providedwith a regular surface pattern. Usually, this isachieved by the application of paper that hasbeen printed with a fine half-tone dot screen.The object is, in effect, ‘wallpapered’ with thismaterial, and it is then photographed (Figure2.10b). While the camera remains in a fixed posi-tion, the structure is mechanically loaded so that
The measurement of force 27
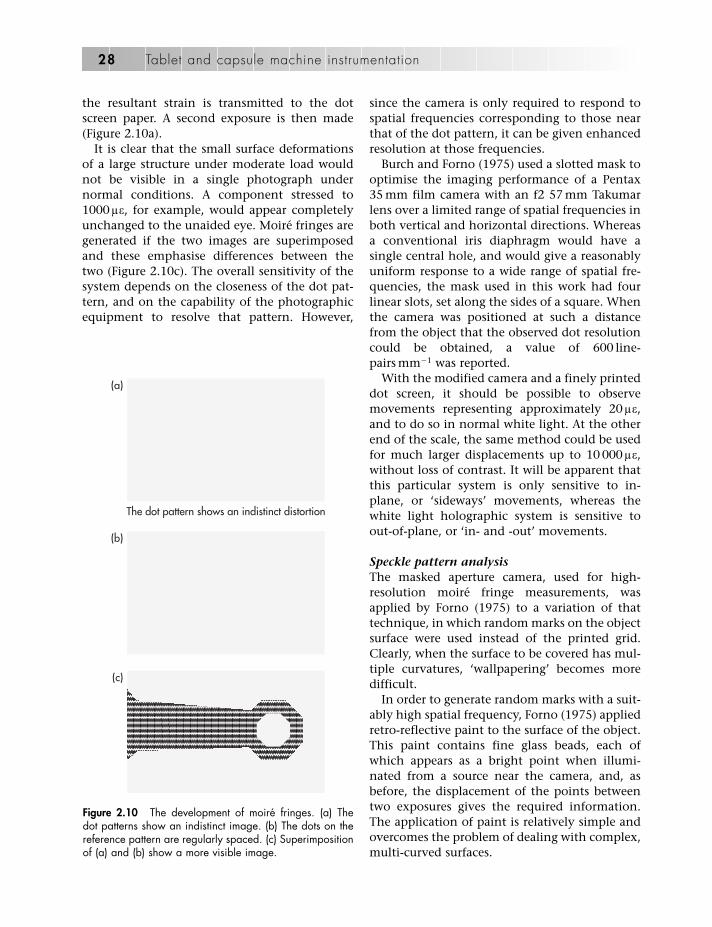
the resultant strain is transmitted to the dotscreen paper. A second exposure is then made(Figure 2.10a).
It is clear that the small surface deformationsof a large structure under moderate load wouldnot be visible in a single photograph undernormal conditions. A component stressed to1000 �e, for example, would appear completelyunchanged to the unaided eye. Moiré fringes aregenerated if the two images are superimposedand these emphasise differences between thetwo (Figure 2.10c). The overall sensitivity of thesystem depends on the closeness of the dot pat-tern, and on the capability of the photographicequipment to resolve that pattern. However,
since the camera is only required to respond tospatial frequencies corresponding to those nearthat of the dot pattern, it can be given enhancedresolution at those frequencies.
Burch and Forno (1975) used a slotted mask tooptimise the imaging performance of a Pentax35 mm film camera with an f2 57 mm Takumarlens over a limited range of spatial frequencies inboth vertical and horizontal directions. Whereasa conventional iris diaphragm would have asingle central hole, and would give a reasonablyuniform response to a wide range of spatial fre-quencies, the mask used in this work had fourlinear slots, set along the sides of a square. Whenthe camera was positioned at such a distancefrom the object that the observed dot resolutioncould be obtained, a value of 600 line-pairs mm�1 was reported.
With the modified camera and a finely printeddot screen, it should be possible to observemovements representing approximately 20 le,and to do so in normal white light. At the otherend of the scale, the same method could be usedfor much larger displacements up to 10 000 le,without loss of contrast. It will be apparent thatthis particular system is only sensitive to in-plane, or ‘sideways’ movements, whereas thewhite light holographic system is sensitive toout-of-plane, or ‘in- and -out’ movements.
Speckle pattern analysisThe masked aperture camera, used for high-resolution moiré fringe measurements, wasapplied by Forno (1975) to a variation of thattechnique, in which random marks on the objectsurface were used instead of the printed grid.Clearly, when the surface to be covered has mul-tiple curvatures, ‘wallpapering’ becomes moredifficult.
In order to generate random marks with a suit-ably high spatial frequency, Forno (1975) appliedretro-reflective paint to the surface of the object.This paint contains fine glass beads, each ofwhich appears as a bright point when illumi-nated from a source near the camera, and, asbefore, the displacement of the points betweentwo exposures gives the required information.The application of paint is relatively simple andovercomes the problem of dealing with complex,multi-curved surfaces.
28 Tablet and capsule machine instrumentation
The dot pattern shows an indistinct distortion
(a)
(b)
(c)
Figure 2.10 The development of moiré fringes. (a) Thedot patterns show an indistinct image. (b) The dots on thereference pattern are regularly spaced. (c) Superimpositionof (a) and (b) show a more visible image.
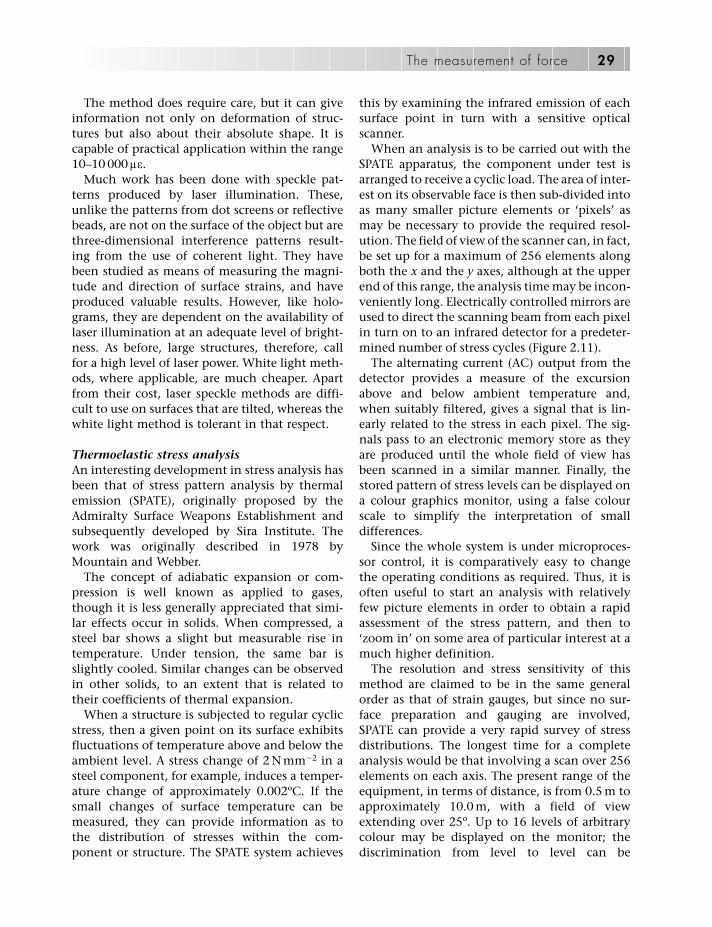
The method does require care, but it can giveinformation not only on deformation of struc-tures but also about their absolute shape. It iscapable of practical application within the range10–10 000 le.
Much work has been done with speckle pat-terns produced by laser illumination. These,unlike the patterns from dot screens or reflectivebeads, are not on the surface of the object but arethree-dimensional interference patterns result-ing from the use of coherent light. They havebeen studied as means of measuring the magni-tude and direction of surface strains, and haveproduced valuable results. However, like holo-grams, they are dependent on the availability oflaser illumination at an adequate level of bright-ness. As before, large structures, therefore, callfor a high level of laser power. White light meth-ods, where applicable, are much cheaper. Apartfrom their cost, laser speckle methods are diffi-cult to use on surfaces that are tilted, whereas thewhite light method is tolerant in that respect.
Thermoelastic stress analysisAn interesting development in stress analysis hasbeen that of stress pattern analysis by thermalemission (SPATE), originally proposed by theAdmiralty Surface Weapons Establishment andsubsequently developed by Sira Institute. Thework was originally described in 1978 byMountain and Webber.
The concept of adiabatic expansion or com-pression is well known as applied to gases,though it is less generally appreciated that simi-lar effects occur in solids. When compressed, asteel bar shows a slight but measurable rise intemperature. Under tension, the same bar isslightly cooled. Similar changes can be observedin other solids, to an extent that is related totheir coefficients of thermal expansion.
When a structure is subjected to regular cyclicstress, then a given point on its surface exhibitsfluctuations of temperature above and below theambient level. A stress change of 2 N mm�2 in asteel component, for example, induces a temper-ature change of approximately 0.002ºC. If thesmall changes of surface temperature can bemeasured, they can provide information as tothe distribution of stresses within the com-ponent or structure. The SPATE system achieves
this by examining the infrared emission of eachsurface point in turn with a sensitive opticalscanner.
When an analysis is to be carried out with theSPATE apparatus, the component under test isarranged to receive a cyclic load. The area of inter-est on its observable face is then sub-divided intoas many smaller picture elements or ‘pixels’ asmay be necessary to provide the required resol-ution. The field of view of the scanner can, in fact,be set up for a maximum of 256 elements alongboth the x and the y axes, although at the upperend of this range, the analysis time may be incon-veniently long. Electrically controlled mirrors areused to direct the scanning beam from each pixelin turn on to an infrared detector for a predeter-mined number of stress cycles (Figure 2.11).
The alternating current (AC) output from thedetector provides a measure of the excursionabove and below ambient temperature and,when suitably filtered, gives a signal that is lin-early related to the stress in each pixel. The sig-nals pass to an electronic memory store as theyare produced until the whole field of view hasbeen scanned in a similar manner. Finally, thestored pattern of stress levels can be displayed ona colour graphics monitor, using a false colourscale to simplify the interpretation of smalldifferences.
Since the whole system is under microproces-sor control, it is comparatively easy to changethe operating conditions as required. Thus, it isoften useful to start an analysis with relativelyfew picture elements in order to obtain a rapidassessment of the stress pattern, and then to‘zoom in’ on some area of particular interest at amuch higher definition.
The resolution and stress sensitivity of thismethod are claimed to be in the same generalorder as that of strain gauges, but since no sur-face preparation and gauging are involved,SPATE can provide a very rapid survey of stressdistributions. The longest time for a completeanalysis would be that involving a scan over 256elements on each axis. The present range of theequipment, in terms of distance, is from 0.5 m toapproximately 10.0 m, with a field of viewextending over 25º. Up to 16 levels of arbitrarycolour may be displayed on the monitor; thediscrimination from level to level can be
The measurement of force 29

sufficient to distinguish stress changes of lessthan 2.0 N mm�2. The method appears to beboth important and innovative, and in 1984 itreceived that year’s Achievement Award from theWorshipful Company of Scientific InstrumentMakers.
Brittle lacquerA method of stress analysis that was popular inearlier years was to use a brittle lacquer. The prin-ciple of the method is simple. It involves theapplication of a specially formulated lacquer tothe surface of the test structure. The lacquer isdesigned to be brittle at a specified temperature,and it cracks if it is subjected to tensile stressesabove a certain threshold value. The individualcracks run along directions perpendicular to thatof the principal strain on the underlying surface;consequently, observation of the cracking pat-tern makes it possible to construct maps of thesurface strain. One proprietary range of brittlelacquers is marketed under the name Stresscoat’.
Experience has shown that the lacquer is noteasy to work with, and tightly controlledconditions of humidity and temperature arerequired. Furthermore developments in healthand safety regulations necessitate the use ofcontained breathing apparatus and protectiveequipment.
General considerations
The preceding notes have shown a variety ofmeans for assessing the distribution of strains or stresses over the surface of a test object. It may often be convenient to combine severalapproaches to stress or strain analysis if the pur-pose of the analysis is to optimise the siting ofgauges for long-term measurement. For example,either SPATE or white light speckle methods canidentify highly strained areas on a machine.Then, in a second study stage, rosette straingauges can be fitted on a temporary basis to pro-vide more detailed information as to the magni-
30 Tablet and capsule machine instrumentation
Lens
Visualchannel
Detector
Scanningmirrors
Fixed mirrors
Beam splitter
Figure 2.11 The stress pattern analysis by thermal emission (SPATE) system. Electronically controlled mirrors scan the sur-face reflecting successive point images to the thermal detector. Temperature changes are related to the stress levelsinvolved (Courtesy of Ometron Ltd).
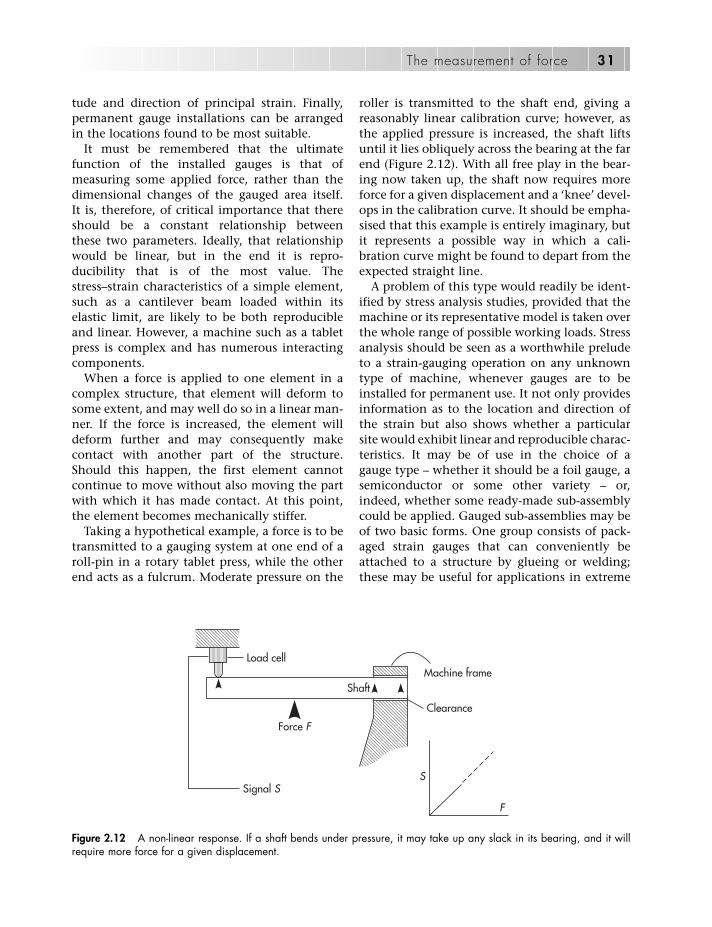
tude and direction of principal strain. Finally,permanent gauge installations can be arrangedin the locations found to be most suitable.
It must be remembered that the ultimatefunction of the installed gauges is that ofmeasuring some applied force, rather than thedimensional changes of the gauged area itself.It is, therefore, of critical importance that thereshould be a constant relationship betweenthese two parameters. Ideally, that relationshipwould be linear, but in the end it is repro-ducibility that is of the most value. Thestress–strain characteristics of a simple element,such as a cantilever beam loaded within itselastic limit, are likely to be both reproducibleand linear. However, a machine such as a tabletpress is complex and has numerous interactingcomponents.
When a force is applied to one element in acomplex structure, that element will deform tosome extent, and may well do so in a linear man-ner. If the force is increased, the element willdeform further and may consequently makecontact with another part of the structure.Should this happen, the first element cannotcontinue to move without also moving the partwith which it has made contact. At this point,the element becomes mechanically stiffer.
Taking a hypothetical example, a force is to betransmitted to a gauging system at one end of aroll-pin in a rotary tablet press, while the otherend acts as a fulcrum. Moderate pressure on the
roller is transmitted to the shaft end, giving areasonably linear calibration curve; however, asthe applied pressure is increased, the shaft liftsuntil it lies obliquely across the bearing at the farend (Figure 2.12). With all free play in the bear-ing now taken up, the shaft now requires moreforce for a given displacement and a ‘knee’ devel-ops in the calibration curve. It should be empha-sised that this example is entirely imaginary, butit represents a possible way in which a cali-bration curve might be found to depart from theexpected straight line.
A problem of this type would readily be ident-ified by stress analysis studies, provided that themachine or its representative model is taken overthe whole range of possible working loads. Stressanalysis should be seen as a worthwhile preludeto a strain-gauging operation on any unknowntype of machine, whenever gauges are to beinstalled for permanent use. It not only providesinformation as to the location and direction ofthe strain but also shows whether a particularsite would exhibit linear and reproducible charac-teristics. It may be of use in the choice of agauge type – whether it should be a foil gauge, asemiconductor or some other variety – or,indeed, whether some ready-made sub-assemblycould be applied. Gauged sub-assemblies may beof two basic forms. One group consists of pack-aged strain gauges that can conveniently beattached to a structure by glueing or welding;these may be useful for applications in extreme
The measurement of force 31
Load cell
ShaftMachine frame
Clearance
S
F
Force F
Signal S
Figure 2.12 A non-linear response. If a shaft bends under pressure, it may take up any slack in its bearing, and it willrequire more force for a given displacement.

conditions of temperature or in corrosive atmos-pheres. The second group comprises more elab-orate devices that are specifically designed to actas force transducers or ‘load cells’. Load cells maycontain resistive strain gauges or may operate onother principles.
The Wheatstone bridge circuit
Electrical resistance strain gauges, strainedwithin their normal limits, only show small pro-portional changes in resistance. The strain levelis not likely to exceed 300–400 ppm and evenwhen multiplied by the gauge factor, the result-ant alteration in resistance is still only a smallpercentage of the original value. In order tomeasure such changes conveniently, it is usualto connect one or more gauges together in thebridge circuit shown in Figure 2.13. This wasdevised by Samuel Christie in 1843. It was usedextensively by Charles Wheatstone and has eversince been associated with his name.
In the original form of the bridge circuit, fourresistors are connected to form the sides of asquare. A voltage is applied across two oppositecorners, while a sensitive voltmeter is connectedacross the two remaining corners. If the resistorsare either all of equal value or are symmetricallydisposed in two equal pairs, no current passesthrough the meter.
Wheatstone used this arrangement in a nullmode to measure unknown resistances. Theunknown device was connected in one arm ofthe bridge, while known resistances wereswitched into an adjacent arm until the metershowed no deflection. At that point, the tworesistances were assumed to be exactly equal.The advantage of this procedure was that it didnot need either an accurately stabilised powersupply or a calibrated meter. But, it could not beused in that precise form for the measurement ofrapidly changing values. To measure these, it isnecessary to depart from the null mode to one inwhich a continuous output signal is generatedfrom a dynamically unbalanced bridge.
If a resistive strain gauge is substituted for onebridge arm of exactly similar ohmic value, thebridge remains in balance, but if the gauge
should then be subjected to strain, its resistancewill be altered and a signal will appear across theoutput terminals. Provided that the power sup-ply is stable, and that the meter does not draw anappreciable amount of current from the bridge,then the measured output signal will be a reli-able, although not a linear, guide to the pro-portional resistance change of the strain gauge.It is possible to power a bridge either with AC ordirect current (DC), but the DC version is mostoften used.
When the bridge circuit is used in this mode,the output signal is directly proportional to theapplied voltage. It is, therefore, necessary topower the bridge from an accurately stabilisedDC supply, which can either be set to operate atconstant voltage or at constant current. A goodunit of this kind can have a thermal stability inthe region of 0.005% °C�1 and should show lessthan 0.01% variation in output voltage for a 90%change in load. In practice, the bridge itself doesnot impose a significantly variable load on thesupply, and the regulation can be extremelygood. If all four arms of the bridge have an ini-tial resistance R, and a voltage U is applied to ter-minals A and C of the circuit shown, then thevoltage at the point D (VD) will be given byEquation (2.1):
32 Tablet and capsule machine instrumentation
Output
C
B
A
D
R3
R4
R2
R1
Input
Figure 2.13 The Wheatstone bridge circuit. A voltage isapplied to two opposite corners of the bridge, and a volt-meter is connected across the remaining corners. If the fourresistors are of equal value, there will be no signal.

U � R UVD � or (2.1)
(R � R) 2
The voltage at point B will be the same as this,so there will be no potential difference betweenpoints B and D.
When the gauge connected between points Aand B is now subjected to strain, changing itsresistance to the new value of (R � dR), thepotential at point B is given by Equation (2.2)
R � dRU � (2.2)
(2R � dR)
and the output signal is given by Equation(2.3)
(R � dR) U � [R/2 � ] (2.3)
(2R � dR)
It will be apparent that this is not a linearfunction of dR/R, the proportional change in R,although the departure from linearity is small atlow levels of strain.
Gauge resistance
As we have seen, the voltage level of the outputsignal is directly dependent on the input voltage,and on the proportional resistance change of thegauge. From this point of view, the nominalresistance of the four bridge arms is not critical.However, in practice, there are other consider-ations that must be taken into account whenselecting a gauge resistance. For example, using agauge of relatively high resistance reduces theeffects of small resistance changes in the lead-wires and other circuit elements and also mini-mises the heat dissipation within the gauge fora given applied voltage. It is, therefore, possibleto use a higher excitation voltage and so producea larger signal. The disadvantage is that it doesrequire more attention to the insulation resist-ance of the whole system, and it will be moresusceptible to the possibility of errors fromcurrent leakage.
Historically, we have noted that the earliestindustrial strain gauges were formed from thin
wire elements, which tended to impose a certainlimitation on the maximum resistance thatcould be produced. Accordingly, a value of 120 �became accepted as an industry standard. Thedevelopment of photochemical etching allowedfoil gauges to be produced at considerably higherresistance values, and 350 � is a popular valuefor currently produced gauges. In fact, somemodern transducer-class gauges are offered at5000 �, the much higher resistance having theadvantage of reducing current drain in battery-operated systems.
The proportional change in resistance, dR/R,will be a nearly linear function of the strainexperienced by the gauge. However, we havealready shown that the bridge output voltagedoes not itself change linearly with strain. Itwould be more accurately linear if the bridgearm was energised at constant current, but it isusually energised at constant voltage. So as theresistance of the gauge increases, the currentthrough it correspondingly decreases, producinga slight reduction in the signal across the gauge.
Bridge configurations
Using one ‘active’ gauge, as in the previousexample, provides what is generally described asa ‘quarter-bridge’ configuration. Two gauges givea half-bridge, and four gauges a whole bridge.The gauges may be active or passive, but in eachcase, the bridge output will be related to thenumber of active gauges.
Active and passive gauges
‘Active’ gauges are those that are bonded to asubstrate in such a position that they respond tostrain in that substrate. ‘Passive’ gauges are notintended to respond in that way, being primarilyintended to provide temperature compensationfor the active gauges. They may be attached toan adjacent unstressed surface.
Poisson gauges
Changes in length of a stressed component willalways be accompanied by correspondingchanges in width, as indicated by the Poisson
The measurement of force 33

ratio. If one gauge is bonded along the axis ofprincipal strain, and the compensating gauge isbonded on to the same surface at right angles toit, the second gauge will not be completely pas-sive but will contribute a signal of opposite signfrom that of the first, or active, gauge at approxi-mately one-third of its magnitude. Such a gaugeis often referred to as a ‘Poisson’ gauge. The tem-perature compensation of the Poisson gauge isbetter than that of the passive gauge notedabove, since it will be attached to the same sub-strate as the active gauge and will in general beclose to it.
Lead resistance compensation
As the quarter-bridge configuration onlyinvolves one gauge, it has sometimes been usedin civil engineering practice on such applicationsas the long-term monitoring of bridges andbuildings. In this field, many gauging pointsmust usually be employed, though absolutemeasuring accuracy is not necessarily a primaryconsideration, and the cost of the installationmust be kept within limits. However, there areserious disadvantages in the quarter-bridgearrangement when particular accuracy ofmeasurement is needed. For example, the singleactive gauge may have to be connected at a site
that is comparatively remote from the remainderof the bridge circuit. Long leads introduce anadditional resistance, shown as RL in Figure 2.14,into the circuit; not only will this tend to unbal-ance the bridge but it will almost certainly besubject to thermal variations that differ fromthose of the other three bridge arms. The tra-ditional solution to this problem has been to runan additional wire between the strain gauge andthe bridge, as shown in Figure 2.14. This restoressymmetry to the right-hand part of the bridgecircuit and helps to balance the bridge again.
Zero drift
The quarter-bridge uses only one active straingauge, and three bridge completion resistors. Ifone resistor is variable, and the other two haveexactly equal resistances, then the bridge can bebalanced precisely. With no strain affecting thegauge, the output meter can be set to registerzero. However, problems arise if the temperatureof the gauged structure varies, since tempera-ture changes will not affect the resistances of thegauge and the completion resistors to the sameextent. Moreover, there may be some degree ofdifferential expansion between the gauge and itssubstrate, although the use of STC and modulus-compensated gauges (p. 18) should minimise
34 Tablet and capsule machine instrumentation
Output
R3
R4
R2
R1
RL
RL
Input
Figure 2.14 Using extended lead wires to a single gauge unbalances the quarter-bridge: it is usual to run two wires asshown to restore balance.

this particular problem. In any event, these twoeffects may result in a drift from the carefullybalanced zero.
The most satisfactory solution to this problemis to replace the adjacent bridge completionresistor with a compensating gauge, which willhave the same thermal characteristics as those ofthe active gauge. Provided that they are of a simi-lar type, separate gauges can be used, one beingbonded to the substrate along the axis of princi-pal strain while the other is mounted to anunstressed area of metal at the same tempera-ture. The bridge configuration now resemblesthat of a half-bridge, though under these con-ditions, the compensating gauge does not con-tribute to the signal. The output, therefore, isstill that of a quarter-bridge.
A much better method of temperature com-pensation is that of using a composite or ‘rosette’gauge, where two grids are made on the samebacking film, one being at right angles to theother (Figure 2.15). The method of manufactureensures that these double gauges are extremelywell matched, and as they are physically closetogether, they will be as nearly as possible at the same temperature. Additionally, the com-posite gauge provides an improved signalthrough the Poisson effect. In most applications,rosette gauges give the better temperature com-pensation for zero drift, though whichever gaugetype is chosen, one double or two singles, the
balanced wiring arrangement largely overcomesthe asymmetry of the quarter-bridge.
Gauge factor variation
We have previously noted that temperaturechanges not only affect the resistance of a straingauge but also alter its strain sensitivity or gaugefactor. One way of dealing with gauge factor vari-ation is to make the bridge self-compensating byincorporating further variable components. Forexample, it is possible to vary the bridge exci-tation voltage by using a thermistor in serieswith the power supply, the thermistor being con-trolled by a resistor network with shunt andseries elements that can be individually tuned tominimise these variations. In practice, tabletpresses and capsule fillers are not usuallyexposed to large variations in temperature, andfor many applications it may not be necessary tosqueeze the last decimal point out of themeasuring system.
Semiconductor bridge assemblies
We have already seen that it is possible to manu-facture very sensitive gauges from doped sili-con, and that they can be made to have positiveor negative characteristics, although their gauge
The measurement of force 35
Output
R3
R4
R2
R1
RL
RL
RL
Input
Figure 2.15 Compensating circuits are used to improve the thermal stability of the basic bridge. The half-bridge config-uration gives good symmetry: R1 and R2 can be one composite gauge.
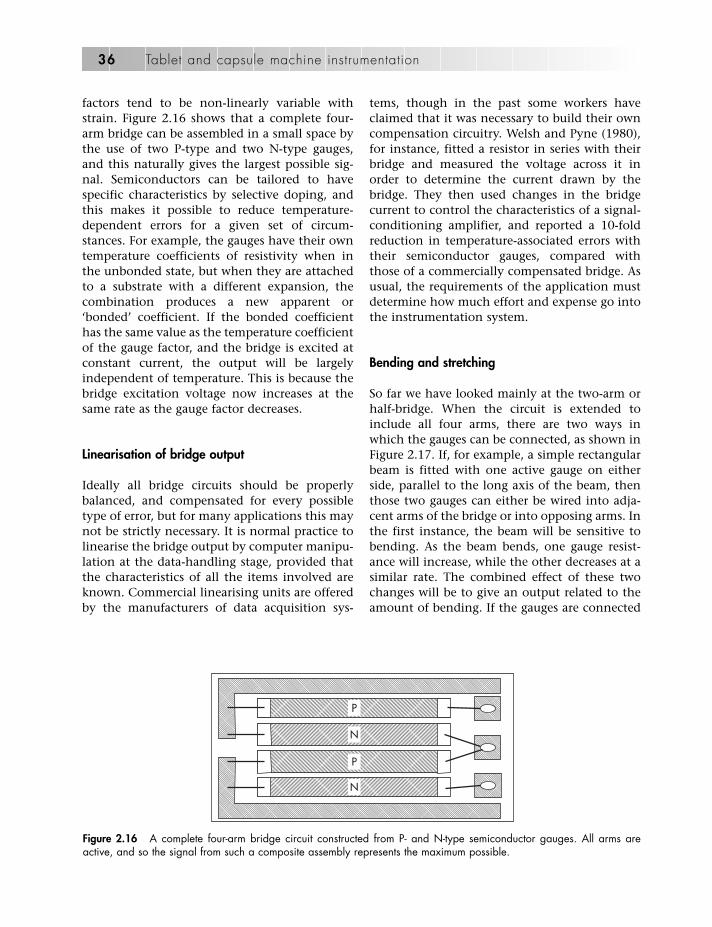
factors tend to be non-linearly variable withstrain. Figure 2.16 shows that a complete four-arm bridge can be assembled in a small space bythe use of two P-type and two N-type gauges,and this naturally gives the largest possible sig-nal. Semiconductors can be tailored to havespecific characteristics by selective doping, andthis makes it possible to reduce temperature-dependent errors for a given set of circum-stances. For example, the gauges have their owntemperature coefficients of resistivity when inthe unbonded state, but when they are attachedto a substrate with a different expansion, thecombination produces a new apparent or‘bonded’ coefficient. If the bonded coefficienthas the same value as the temperature coefficientof the gauge factor, and the bridge is excited atconstant current, the output will be largely independent of temperature. This is because thebridge excitation voltage now increases at thesame rate as the gauge factor decreases.
Linearisation of bridge output
Ideally all bridge circuits should be properlybalanced, and compensated for every possibletype of error, but for many applications this maynot be strictly necessary. It is normal practice tolinearise the bridge output by computer manipu-lation at the data-handling stage, provided thatthe characteristics of all the items involved areknown. Commercial linearising units are offeredby the manufacturers of data acquisition sys-
tems, though in the past some workers haveclaimed that it was necessary to build their owncompensation circuitry. Welsh and Pyne (1980),for instance, fitted a resistor in series with theirbridge and measured the voltage across it inorder to determine the current drawn by thebridge. They then used changes in the bridgecurrent to control the characteristics of a signal-conditioning amplifier, and reported a 10-foldreduction in temperature-associated errors withtheir semiconductor gauges, compared withthose of a commercially compensated bridge. Asusual, the requirements of the application mustdetermine how much effort and expense go intothe instrumentation system.
Bending and stretching
So far we have looked mainly at the two-arm orhalf-bridge. When the circuit is extended toinclude all four arms, there are two ways inwhich the gauges can be connected, as shown inFigure 2.17. If, for example, a simple rectangularbeam is fitted with one active gauge on eitherside, parallel to the long axis of the beam, thenthose two gauges can either be wired into adja-cent arms of the bridge or into opposing arms. Inthe first instance, the beam will be sensitive tobending. As the beam bends, one gauge resist-ance will increase, while the other decreases at asimilar rate. The combined effect of these twochanges will be to give an output related to theamount of bending. If the gauges are connected
36 Tablet and capsule machine instrumentation
P
N
P
N
Figure 2.16 A complete four-arm bridge circuit constructed from P- and N-type semiconductor gauges. All arms areactive, and so the signal from such a composite assembly represents the maximum possible.
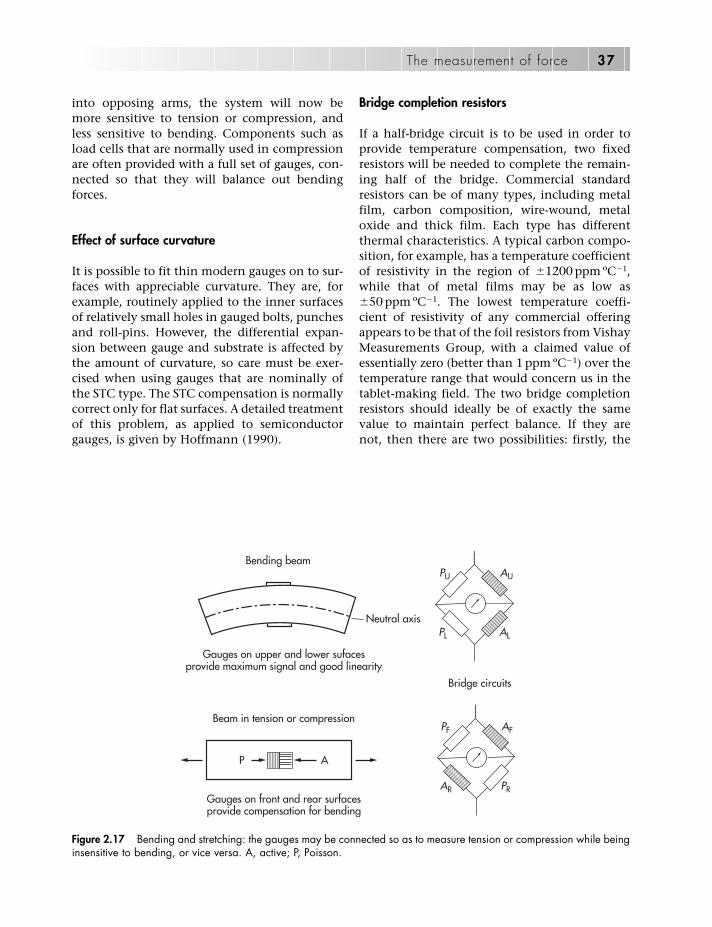
into opposing arms, the system will now bemore sensitive to tension or compression, andless sensitive to bending. Components such asload cells that are normally used in compressionare often provided with a full set of gauges, con-nected so that they will balance out bendingforces.
Effect of surface curvature
It is possible to fit thin modern gauges on to sur-faces with appreciable curvature. They are, forexample, routinely applied to the inner surfacesof relatively small holes in gauged bolts, punchesand roll-pins. However, the differential expan-sion between gauge and substrate is affected bythe amount of curvature, so care must be exer-cised when using gauges that are nominally ofthe STC type. The STC compensation is normallycorrect only for flat surfaces. A detailed treatmentof this problem, as applied to semiconductorgauges, is given by Hoffmann (1990).
Bridge completion resistors
If a half-bridge circuit is to be used in order toprovide temperature compensation, two fixedresistors will be needed to complete the remain-ing half of the bridge. Commercial standardresistors can be of many types, including metalfilm, carbon composition, wire-wound, metaloxide and thick film. Each type has differentthermal characteristics. A typical carbon compo-sition, for example, has a temperature coefficientof resistivity in the region of �1200 ppm ºC�1,while that of metal films may be as low as�50 ppm ºC�1. The lowest temperature coeffi-cient of resistivity of any commercial offeringappears to be that of the foil resistors from VishayMeasurements Group, with a claimed value ofessentially zero (better than 1 ppm ºC�1) over thetemperature range that would concern us in thetablet-making field. The two bridge completionresistors should ideally be of exactly the samevalue to maintain perfect balance. If they arenot, then there are two possibilities: firstly, the
The measurement of force 37
PU AU
PL AL
PF AF
AR PR
Bridge circuits
Gauges on upper and lower sufaces provide maximum signal and good linearity
Bending beam
Neutral axis
Beam in tension or compression
Gauges on front and rear surfaces provide compensation for bending
P A
Figure 2.17 Bending and stretching: the gauges may be connected so as to measure tension or compression while beinginsensitive to bending, or vice versa. A, active; P, Poisson.

slight imbalance may be ignored, and offset inthe data processing circuitry; secondly, addi-tional resistive elements may be wired in serieswith the existing resistors and these adjusted bycareful scraping. Scraping has the effect of reducing the cross-sectional area, and hence of increasing the resistance, so that accuratebalance can be achieved.
Bridge excitation voltage
It is always convenient to have a transducer thatprovides a relatively large signal, since it is easierto detect that signal in the presence of noise. Theoutput from a Wheatstone bridge is directly pro-portional to the input voltage, so there is a natu-ral temptation to apply a relatively high voltagefrom the power supply. Inevitably, the powersupplied to the bridge produces heat within thegauges and the bridge completion resistors, andthere are, therefore, conflicting interests betweenthe signal level and the errors introduced byheating.
The main source of heat loss in a typical straingauge installation is the substrate to which thegauges are attached, and the power that can beabsorbed varies according to the material ofwhich that substrate is constructed. A gauge ofhigh accuracy on a thick steel substrate understatic conditions can be run continuously at apower density in the range 1.6–3.1 kW m�2.About half this level would be acceptable on astainless steel substrate, while a thermally con-ductive material such as heavy copper or alu-minium could take twice that level. Theexperimental approach is, of course, to try arange of voltages and see what happens: raise theapplied voltage in small steps until some thermaldrift becomes apparent, then reduce the voltagebelow that level.
Taking the published figures as a guide, onecan reasonably suggest that a gauge with an areaof 10 mm2 on a steel substrate should not be runfor long periods at more than 3 V if the highestaccuracy is to be maintained. Modern high-resistance gauges can tolerate higher voltages,but again we would recommend the practicalmethod outlined above for any individualexample.
Load cells
Load cells are self-contained assemblies for themeasurement of applied forces. They are usuallyconstructed in physical forms that are welladapted for convenient incorporation into engin-eering structures. Consequently, they may havethe external characteristics of bolts, washers,beams, straight connectors or short cylinders.Internally, they contain some means of generat-ing a signal that is related to an applied force,and this may be piezoresistive, piezoelectric oreven magnetoelastic in character.
Load cells based on strain gauges
Load cells based on strain gauges comprise adeformable frame – the spring element – withstrain gauges bonded in suitable positions to reg-ister movement under load. The rated loading ofthe frame is designed to remain well within theelastic limit for its material, and it can reason-ably be assumed that the deformation is near tolinear with reference to the applied load.
Early load cells were usually of a simple con-figuration, such as that of a short column withgauges fitted symmetrically around it in a fullbridge circuit (Figure 2.18). It was intended thatthe symmetry of the system would compensatefor off-axis loading, but the compensation is notnecessarily perfect for these gauge elements incompressive duty. The load is, therefore, oftenapplied through a coupling device that willallow a certain amount of misalignmentbetween the column and the load. For example,a form of ball-and-socket joint may be used.Alignment problems are likely to be minimisedwhen the cell is to be used in tension, ratherthan in compression, although this may not be apractical option.
One characteristic of the simple gaugedcolumn load cell is that it can be mechanicallystiff. Typical cells of this form can have deflec-tions of approximately 0.025 mm or less at fullload so that they do not move through largedistances for an average range of forces.
Later work in this field seems to have been pri-marily concerned with the development of con-figurations that are more tolerant of off-axis
38 Tablet and capsule machine instrumentation
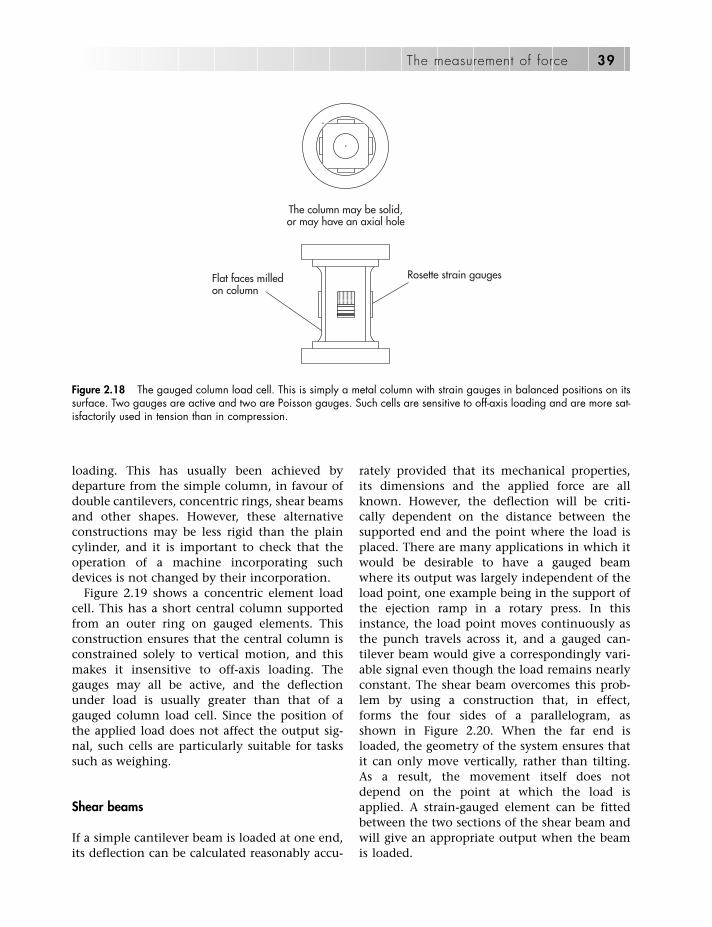
loading. This has usually been achieved bydeparture from the simple column, in favour ofdouble cantilevers, concentric rings, shear beamsand other shapes. However, these alternativeconstructions may be less rigid than the plaincylinder, and it is important to check that theoperation of a machine incorporating suchdevices is not changed by their incorporation.
Figure 2.19 shows a concentric element loadcell. This has a short central column supportedfrom an outer ring on gauged elements. Thisconstruction ensures that the central column isconstrained solely to vertical motion, and thismakes it insensitive to off-axis loading. Thegauges may all be active, and the deflectionunder load is usually greater than that of agauged column load cell. Since the position ofthe applied load does not affect the output sig-nal, such cells are particularly suitable for taskssuch as weighing.
Shear beams
If a simple cantilever beam is loaded at one end,its deflection can be calculated reasonably accu-
rately provided that its mechanical properties,its dimensions and the applied force are allknown. However, the deflection will be criti-cally dependent on the distance between thesupported end and the point where the load isplaced. There are many applications in which itwould be desirable to have a gauged beamwhere its output was largely independent of theload point, one example being in the support ofthe ejection ramp in a rotary press. In thisinstance, the load point moves continuously asthe punch travels across it, and a gauged can-tilever beam would give a correspondingly vari-able signal even though the load remains nearlyconstant. The shear beam overcomes this prob-lem by using a construction that, in effect,forms the four sides of a parallelogram, asshown in Figure 2.20. When the far end isloaded, the geometry of the system ensures thatit can only move vertically, rather than tilting.As a result, the movement itself does notdepend on the point at which the load isapplied. A strain-gauged element can be fittedbetween the two sections of the shear beam andwill give an appropriate output when the beamis loaded.
The measurement of force 39
The column may be solid,or may have an axial hole
Flat faces milledon column
Rosette strain gauges
Figure 2.18 The gauged column load cell. This is simply a metal column with strain gauges in balanced positions on itssurface. Two gauges are active and two are Poisson gauges. Such cells are sensitive to off-axis loading and are more sat-isfactorily used in tension than in compression.
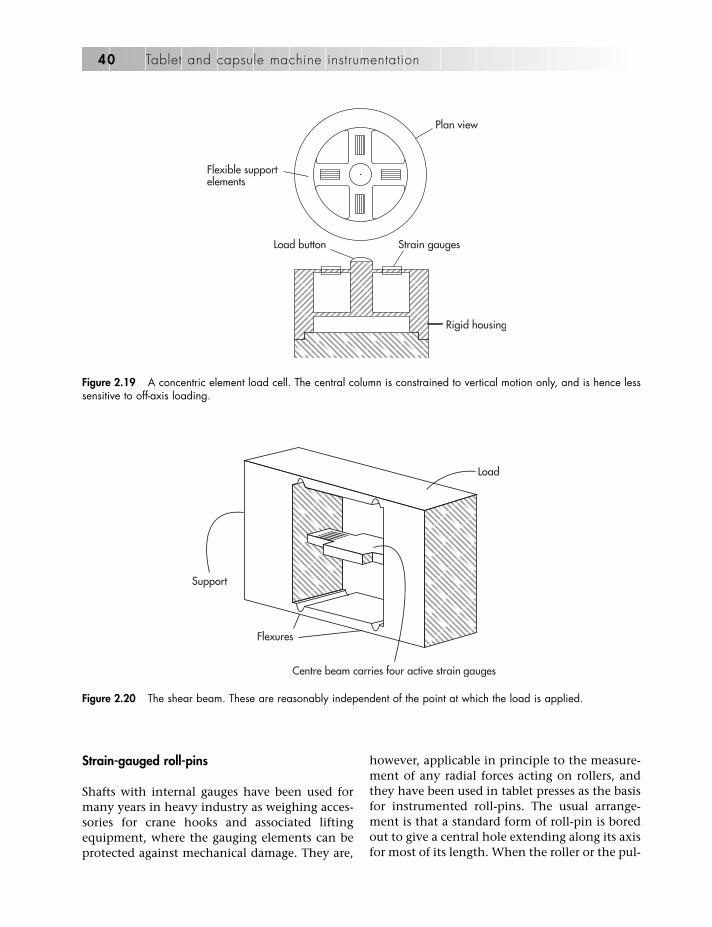
Strain-gauged roll-pins
Shafts with internal gauges have been used formany years in heavy industry as weighing acces-sories for crane hooks and associated liftingequipment, where the gauging elements can beprotected against mechanical damage. They are,
however, applicable in principle to the measure-ment of any radial forces acting on rollers, andthey have been used in tablet presses as the basisfor instrumented roll-pins. The usual arrange-ment is that a standard form of roll-pin is boredout to give a central hole extending along its axisfor most of its length. When the roller or the pul-
40 Tablet and capsule machine instrumentation
Plan view
Flexible supportelements
Load button Strain gauges
Rigid housing
Figure 2.19 A concentric element load cell. The central column is constrained to vertical motion only, and is hence lesssensitive to off-axis loading.
Support
Flexures
Load
Centre beam carries four active strain gauges
Figure 2.20 The shear beam. These are reasonably independent of the point at which the load is applied.

ley is in its normal position and is loaded radially,the central hole is subjected to shear forces at thepoints corresponding to the two sides of the roller(Figure 2.21). If shear-sensitive strain gauges arefitted inside the hole at these two points, theradial force can be measured as with any strain-gauged load cell. Of course, fitting gauges inexactly the right positions down the inside sur-face of a narrow hole is not something to be tack-led lightly, and as in other examples, we stronglyrecommend that this should be left to the pro-fessionals. However, this particular type of loadcell would appear to be a very useful accessory fora rotary press, since it requires little or no modifi-cation to the original machine and can simplyreplace the plain roll-pin supplied with the press.
Gauged bolts
The gauged roll-pin usually uses strain gauges inshear mode, but it is possible to fit internalgauges to other components in such a way as to respond to tension or compression. Thisapproach allows the production of strain-gaugedbolts. Fitting the gauges along the inside surfaceof a narrow bore can reduce the sensitivity of thedevice to bending, and at the same time affordsconsiderable protection against mechanicaldamage. A similar arrangement has been appliedto the internal gauging of punches.
Piezoelectric load cells
Certain non-conducting materials, usually crys-talline in nature, have the property of convert-ing mechanical energy directly into electrical
energy. If a crystal of quartz, for example, is sub-jected to physical pressure, electrical chargesdevelop across opposing faces of the crystal(Figure 2.22). The magnitude of the charges isaccurately related to that of the applied force.Barium titanate behaves similarly, and there areother piezoceramic materials such as lead zir-conate titanate (PZT), in which this effect is evenmore pronounced. Examples may be seen indomestic gas lighters, where a light impact generates a considerable spark.
The ‘piezoelectric’ effect is used as the basis fora range of force-measuring devices, which havethemselves been applied quite extensively in thefield of tablet machine instrumentation.Piezoelectric load cells are both compact andmechanically rigid; consequently, they have verylittle effect on the mechanical properties of anymachine to which they attached. A typical value
The measurement of force 41
Load
Crystal
Separation of charges~100 pC/mε: 4 pC/N
Figure 2.22 The piezoelectric effect. Force applied to theopposing faces of the piezoelectric material produces aseparation of electrical charges across the other faces. Thequantity of electricity involved is very small.
Figure 2.21 An internally gauged roll-pin with strain gauges fitted at two regions in order to sense the shear forcesapplied by the pressure roll. The roll-pin has an axial cavity; the shear-sensitive gauges are mounted inside the groovedregions in the cavity.

for deflection under load would be 1.0 lm per20 kN, while the corresponding sensitivity wouldbe approximately 4.2 pC/N. The thickness of aload cell may be as little as a few millimetres.
These cells are quite sensitive to side loads,and for that reason the surfaces between whichthey are compressed must be very accurately par-allel. This requirement would represent a prob-lem in machines that may only be fitted tomoderate degrees of flatness. It is, therefore, nor-mal practice to bolt the transducers against anested pair of part-spherical washers, which areable to take up errors in alignment (Figure 2.23).
Piezoelectric load cells usually have a resonantfrequency in the range 10–100 kHz, so theyrespond very rapidly to changes in applied force.
Advantages of piezoelectric transducers
The combination of high sensitivity, rapidresponse, small size and general rigidity seemsparticularly attractive; indeed, many workershave chosen piezoelectric transducers for usewith tablet presses. Sixsmith, in his 1977 reviewpaper, suggested that they had the followingadvantages:
• greater sensitivity• no bonding to machines• less temperature sensitivity: better than
0.01% ºC�1
• the signal caused by initial loading can becancelled out, simply by earthing.
Piezoelectric transducers, produced by Kistler,were used by Manesty Machines Ltd, in the firstversion of their ‘Tablet Sentinel’ weight-controlsystem. They have been recommended by vari-ous research workers since then, for example,Williams and Stiel (1984) and Hoblitzell andRhodes (1985). Schmidt and Koch (1991) com-pared piezoelectric force transducers with resist-ive strain gauges in a rotary tablet press, andCocolas and Lordi (1993) measured die wallpressure with piezoelectric force transducers.
Disadvantages of piezoelectric transducers
There is, inevitably, a practical disadvantage totheir use, which is that they are not well suitedto the measurement of static loads. Although thesignal output may represent many volts, it ismicroscopically small in terms of power, and it isonly generated by changes in the applied load. If
42 Tablet and capsule machine instrumentation
Force is applied to the load washerthrough the spherical washer pair
Plan view
Side view
Spherical washersLoad washer
Electrical connectionfor coaxial cable
The steel casing holds anannular piezoelectric crystal
The two hardened surfacescan move to accommodate
misalignment
Undercut confersflexibility
Figure 2.23 The piezoelectric load cell. They are very compact but are sensitive to uneven loading. It is, therefore, nor-mal practice to load them through hardened steel washers that can take up small amounts of angular misalignment.
the loading on the cell is maintained at a con-stant level, the signal tends to leak away, so thatit appears as if the applied load is decreasing.
The insulation resistance of the cell itself mustbe very high, a typical value being 1012 �. Similarconsiderations apply to any cables and connec-tions. In order to minimise the loss of signal, it isnecessary to use an amplifier with a correspond-ingly high insulation resistance at the input: aso-called ‘charge amplifier’. The input section ofthe charge amplifier usually contains a fieldeffect transistor, or FET, which has suitablecharacteristics, and there is an internal capaci-tive feedback loop that can be used to alter themeasuring range of the amplifier.
A further capacitor is connected across theinput terminals of the charge amplifier. Thechoice of this particular component affectsthe frequency response of the system, and itmust, therefore, be chosen carefully to suit therequirements of the work. An incorrect choiceof capacitor at this point may produce mislead-ing calibration curves. Compared with thestrain gauge amplifier circuitry, this system isappreciably less tolerant.
Integral charge amplifiers
The problems associated with the use of individ-ual cells, cables, connectors and charge ampli-fiers are generally recognised as seriousdisadvantages of the piezoelectric devices in cer-tain circumstances. However, developments inmicroelectronics have made it possible to reducethe physical size of the amplifier to such anextent that it can now be incorporated withinthe same housing as the load cell. Special inter-connecting cables become unnecessary withsuch an arrangement.
When forces are changing continuously, asthey do in production runs at normal machinespeeds, piezoelectric transducers are at their mostsuccessful. It is always important, however, toensure that some means is found to check thebaseline of the output signal from time to time, inorder to avoid the occurrence of a steady drift.Early versions of the Manesty Tablet Sentinelencountered the problem of zero drift and wereknown to register an apparent reduction in com-pression forces when those forces were in fact
increasing. Since then, the whole system has beenredesigned with conventional strain gauges.
In recent years, there has been considerableresearch interest in the study of compressionforces under static conditions, for example thetime-dependent decay of the stresses in a tabletwithin the die. For studies of this type, straingauges probably still represent the simplest andmost unambiguous means of measurement, par-ticularly since strain-gauged load washers havebecome available in sizes that approach those ofpiezoelectric washers. It must also be added thatmost of the major tablet press manufacturersseem to have adopted strain gauges for their owncommercial product lines.
Another consideration if an instrumented unitis to be set up is that the piezoelectric washersrequire a different signal amplifier from thatused for resistive strain gauges. There is much tobe said for having spare amplifiers available, andhaving gauges that all work in the same wayreduces the number of different units that mustbe kept in hand.
Magnetoelastic cells
Mechanical stresses can affect materials in a var-iety of ways. If a ferromagnetic material isstressed, for example, its magnetic propertiesmay be changed to a measurable extent. This principle has been used as the basis for athird type of load cell, described by Erdem(1982). In this construction, the body of thetransducer is a cube of a ferromagnetic material.It has four holes drilled through it, one near eachcorner of one face. Then two windings are fitteddiagonally through these holes, at right angles toeach other (Figure 2.24). When one winding isexcited with an AC input, the coupling betweenthat and the second winding is dependent onthe direction of the magnetic flux within theblock. This, in turn, is a function of any appliedforce across opposing faces. The cell is excited atmains frequency. Erdem quoted a repeatabilityof 0.02%, a non-linearity after compensation of �0.05% and a temperature coefficient ofapproximately �30 ppm °C�1.
The magnetoelastic cell is commercially avail-able under the name Pressductor Millmate from
The measurement of force 43

ABB, and has been described by Johannson(1981). It has been applied, inter alia, to measure-ment of the forces on the rollers in steel mills,but it does not appear to have advantages overthe strain-gauged load cell for applications ontablet and capsule-filling equipment.
The linear variable-differential transformerload cell
Since forces are generally inferred from the strainthat they produce, the distinction betweenforce- and displacement-measuring devices oftenbecomes blurred. Some ‘weighing’ cells areconstructed as frameworks that can be deflectedby the application of a load, while the deflec-tion is measured by means of a linear variable-differential transformer (LVDT; Figure 2.25).Clearly cells designed to give a large deflectionunder load have the potential capability ofproviding greater accuracy, but their stiffnessand frequency response become less suitable fortablet machine studies. Notes on this type of cellare given by Seippel (1983). The LVDT itself isdescribed in Chapter 4.
Advantages of load cells
The value of load cells in tablet machine instru-mentation lies in the fact that they are self-contained and portable. A load cell, unlike abonded strain gauge, can be removed at any timeand checked for accuracy. It can be calibrated inmany instances by dead-weight testing, and inthe unlikely event of failure, it can be replacedby a similarly calibrated unit.
Shear-beam load cells are now becomingwidely available, and as we have seen, these havethe useful property of providing an output thatis substantially independent of the point atwhich the load is applied. Their function is oftento act as weighing elements and to support plat-forms or scale-pans. Since the load cell is afactory-made device, it can be assembled andsealed under carefully controlled conditions andcan be tested before delivery.
These considerations do not normally apply tothe strain gauge bridges that are fitted by indi-vidual laboratories to existing machines. Theycan neither be calibrated before bonding nor canthey be removed without destruction of thegauges. However, bonded gauge installations can
44 Tablet and capsule machine instrumentation
A BInput
Output
Input
OutputB A
Current passing along theconductor A–A will not normallyaffect the conductor B–B atright angles to it Force acting on the
magnetoelastic platedistorts the magnetic fieldand provides inductive couplingbetween the two coils
Similarly, a current passed througheither of these coils would not usuallyinduce a current in the other coil
Force
Magnetoelastic plateFerromagnetic plate
Force
Figure 2.24 The magnetoelastic load cell. Forces applied to the opposite faces of the cell modify the coupling betweentwo pairs of coils.
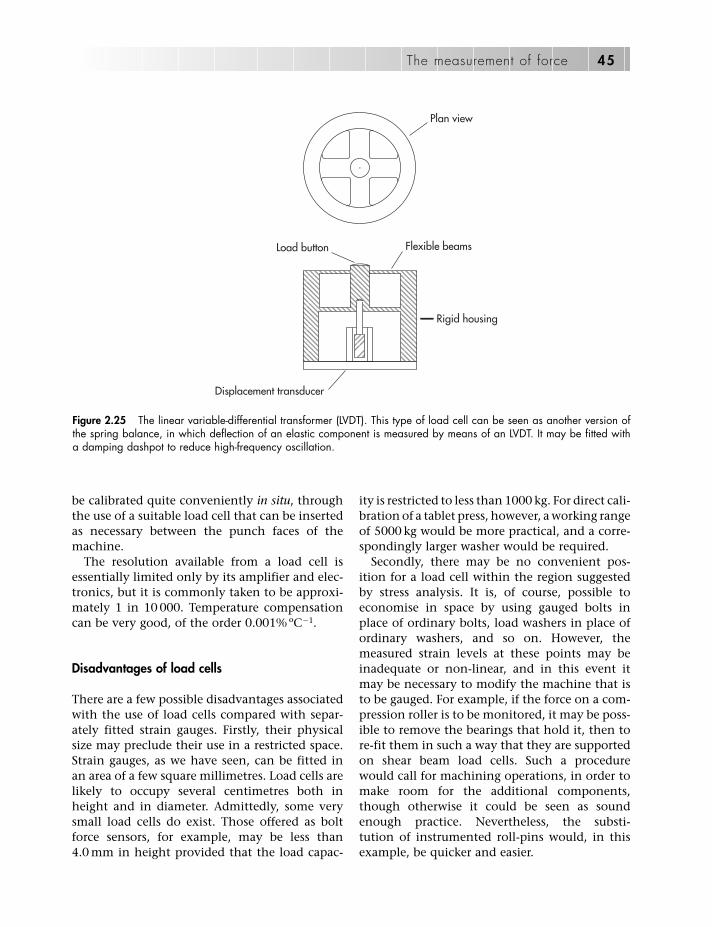
be calibrated quite conveniently in situ, throughthe use of a suitable load cell that can be insertedas necessary between the punch faces of themachine.
The resolution available from a load cell isessentially limited only by its amplifier and elec-tronics, but it is commonly taken to be approxi-mately 1 in 10 000. Temperature compensationcan be very good, of the order 0.001% ºC�1.
Disadvantages of load cells
There are a few possible disadvantages associatedwith the use of load cells compared with separ-ately fitted strain gauges. Firstly, their physicalsize may preclude their use in a restricted space.Strain gauges, as we have seen, can be fitted inan area of a few square millimetres. Load cells arelikely to occupy several centimetres both inheight and in diameter. Admittedly, some verysmall load cells do exist. Those offered as boltforce sensors, for example, may be less than4.0 mm in height provided that the load capac-
ity is restricted to less than 1000 kg. For direct cali-bration of a tablet press, however, a working rangeof 5000 kg would be more practical, and a corre-spondingly larger washer would be required.
Secondly, there may be no convenient pos-ition for a load cell within the region suggestedby stress analysis. It is, of course, possible toeconomise in space by using gauged bolts inplace of ordinary bolts, load washers in place ofordinary washers, and so on. However, themeasured strain levels at these points may beinadequate or non-linear, and in this event itmay be necessary to modify the machine that isto be gauged. For example, if the force on a com-pression roller is to be monitored, it may be poss-ible to remove the bearings that hold it, then tore-fit them in such a way that they are supportedon shear beam load cells. Such a procedurewould call for machining operations, in order tomake room for the additional components,though otherwise it could be seen as soundenough practice. Nevertheless, the substi-tution of instrumented roll-pins would, in thisexample, be quicker and easier.
The measurement of force 45
Plan view
Load button Flexible beams
Rigid housing
Displacement transducer
Figure 2.25 The linear variable-differential transformer (LVDT). This type of load cell can be seen as another version ofthe spring balance, in which deflection of an elastic component is measured by means of an LVDT. It may be fitted witha damping dashpot to reduce high-frequency oscillation.

Finally, we have already noted that some loadcells are mechanically stiff, while others havemore of a springy characteristic. It would beimportant to choose the more rigid variety ofcell for any situation in which the press per-formance might otherwise be altered. As we havenoted above, cells designed for weighing oftenhave a large displacement for a given load,though that is of no consequence in thatapplication.
The point may perhaps be emphasised bylooking again at the previous example. Load cellsat each end of the roll-pin could certainly pro-vide an accurate measure of the force on thecompression roller. However, any transmissionof force to the load cells must cause them to dis-tort, so the roller and the roll-pin will moveslightly more than usual. If the additional move-ment is appreciable, then the compression charac-teristics of the machine may be altered fromthose of the standard model. By contrast, it isclear that the attachment of bonded straingauges to the frame or the punches of a tabletpress should not alter its mechanical response inany measurable way.
The suppliers of load cells, load washers andthe like provide figures to show the mechanicaldeflection of their devices at full-scale load. Thismay be as little as 0.03 mm but can also be ashigh as 0.30 mm. The larger deflections usuallyseem to be associated with those load cells thatare designed for insensitivity to off-axis loading.The LVDT load cells also have inherently largerdeflections, which may be as much as 1.5 mm atfull load, since a greater deflection clearly gives amore open scale of measurement.
Miscellaneous methods
The text relating to surface preparation andstrain gauge bonding in Chapter 3 emphasisesthe fact that a high degree of cleanliness is essen-tial for this work, together with a careful atten-tion to detail. In general, the standardsdemanded for gauge bonding should readily beattainable in the laboratory, or in that of theoriginal machine manufacturer. However, ifgauges are to be retro-fitted to existing industrial
equipment, which may be continually exposedto surface contamination, then the task ofachieving those standards may be very difficult.
An example of a problem in this category isthat of fitting gauges to the support legs ofNorth Sea oilrigs. Although this may seem farremoved from tablet compression work, never-theless both areas have a need for gaugingmethods that can be used in the presence ofcontaminating materials with a minimum ofsurface preparation.
One way in which surface preparation can beminimised is by the use of gauged sub-assembliesthat can be attached quickly and easily to themain structure. These sub-assemblies mayembody electrical resistance strain gauges, orthey may operate on other principles.
Encapsulated gauges
Some commercial sub-assemblies are producedby the encapsulation of a normal gauge and itsconnecting leads. This approach is used, forexample, by HBM for their ‘Strain Transducers’DB1, DA2 and DA3. These are standard foilgauges in a weatherproof outer casing, whichcan be used under water or in other difficult con-ditions. Unless they are completely embedded,they can also be removed and re-used.
These encapsulated gauges are useful for inves-tigative work, particularly on large structures.However, they themselves are also large, andthey would be unsuitable for use in restrictedspaces. In general, any form of encapsulationleads to a reduction in the efficiency of straintransfer from the substrate to the gauge. Usinglong gauges helps to minimise the loss of signal.For example, some versions designed for embed-ment into concrete have an active length of asmuch as 150 mm.
Weldable gauges
A standard foil gauge is bonded, under cleanroom conditions, to a stainless steel foil (‘shim’)and is provided with suitable environmentalprotection to form a sealed package (Figure 2.26).The shim is then attached to the structure undertest by electrical spot-welding. Surface prep-
46 Tablet and capsule machine instrumentation
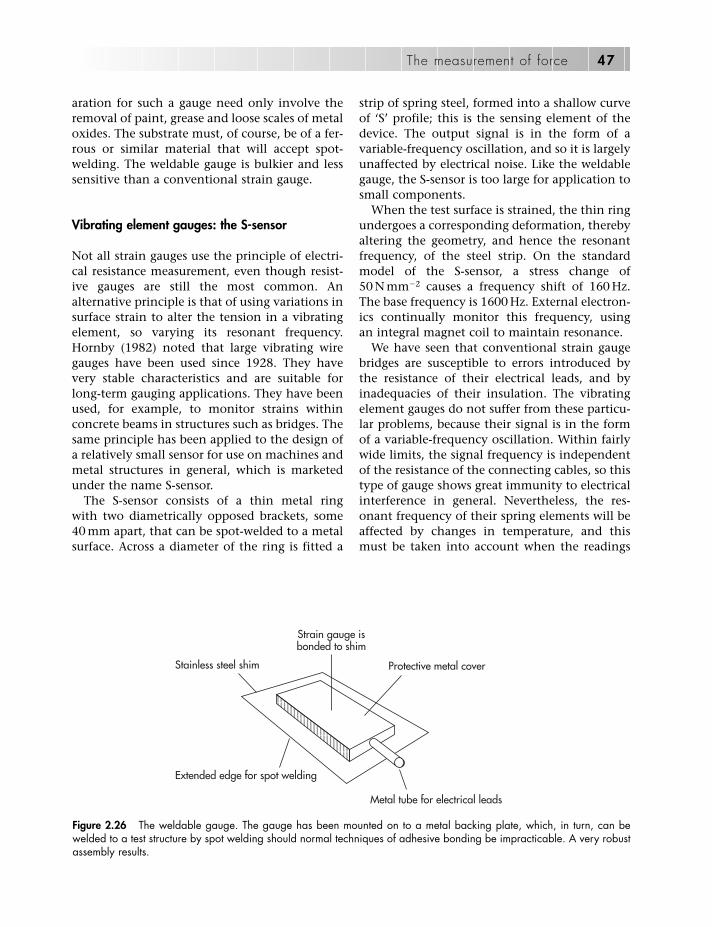
aration for such a gauge need only involve theremoval of paint, grease and loose scales of metaloxides. The substrate must, of course, be of a fer-rous or similar material that will accept spot-welding. The weldable gauge is bulkier and lesssensitive than a conventional strain gauge.
Vibrating element gauges: the S-sensor
Not all strain gauges use the principle of electri-cal resistance measurement, even though resist-ive gauges are still the most common. Analternative principle is that of using variations insurface strain to alter the tension in a vibratingelement, so varying its resonant frequency.Hornby (1982) noted that large vibrating wiregauges have been used since 1928. They havevery stable characteristics and are suitable forlong-term gauging applications. They have beenused, for example, to monitor strains withinconcrete beams in structures such as bridges. Thesame principle has been applied to the design ofa relatively small sensor for use on machines andmetal structures in general, which is marketedunder the name S-sensor.
The S-sensor consists of a thin metal ringwith two diametrically opposed brackets, some40 mm apart, that can be spot-welded to a metalsurface. Across a diameter of the ring is fitted a
strip of spring steel, formed into a shallow curveof ‘S’ profile; this is the sensing element of thedevice. The output signal is in the form of avariable-frequency oscillation, and so it is largelyunaffected by electrical noise. Like the weldablegauge, the S-sensor is too large for application tosmall components.
When the test surface is strained, the thin ringundergoes a corresponding deformation, therebyaltering the geometry, and hence the resonantfrequency, of the steel strip. On the standardmodel of the S-sensor, a stress change of50 N mm�2 causes a frequency shift of 160 Hz.The base frequency is 1600 Hz. External electron-ics continually monitor this frequency, usingan integral magnet coil to maintain resonance.
We have seen that conventional strain gaugebridges are susceptible to errors introduced bythe resistance of their electrical leads, and byinadequacies of their insulation. The vibratingelement gauges do not suffer from these particu-lar problems, because their signal is in the formof a variable-frequency oscillation. Within fairlywide limits, the signal frequency is independentof the resistance of the connecting cables, so thistype of gauge shows great immunity to electricalinterference in general. Nevertheless, the res-onant frequency of their spring elements will beaffected by changes in temperature, and thismust be taken into account when the readings
The measurement of force 47
Stainless steel shim
Extended edge for spot welding
Metal tube for electrical leads
Strain gauge isbonded to shim
Protective metal cover
Figure 2.26 The weldable gauge. The gauge has been mounted on to a metal backing plate, which, in turn, can bewelded to a test structure by spot welding should normal techniques of adhesive bonding be impracticable. A very robustassembly results.

from such a sensor are to be interpreted.Resonating sensors have been developed forquite a range of variables, including not onlyforce but also fluid flow, level, density and vis-cosity. The subject is covered in a review byLangdon (1985).
The S-sensor itself is hermetically sealed andcan withstand mechanical overloads of 10 timesits rated range; it can operate in conditions thatmight be unsuitable for more conventional typesof gauge. The rated range is equivalent to 250 le;the resolution is quoted as better that 0.01%,and the temperature stability better than�0.1% ºC�1. A device with these characteristicsmight not represent a first choice for researchwork and could not be fitted on to a small com-ponent such as a tablet punch. However, it couldbe applied to production monitoring, where itsrobustness and long-term stability would bevaluable.
Capacitance gauges
It is possible to use changes in capacitanceinstead of changes in resistance as the basis formeasuring quite small levels of strain. In prin-ciple, a capacitor is made up in such a way thatone of its plates is attached to some part of thetest structure, while the second plate is attachedto another part. Strain in the structure thenvaries the gap between the plates, producing achange of capacity.
If the points of attachment are widely spaced,then relatively large movements can be pro-duced at the gap between the plates. Variousconfigurations have been used, including rhom-bic frame and concentric tube systems: these canhave capacitances in the range 1–100 pF and canhave sensitivities of approximately 0.01–0.1% offull-scale displacement.
Capacitance gauges have been reviewed inan article by Procter and Strong (1982). Theiradvantages are generally related to their abil-ity to operate at very high temperatures, insome instances up to 1100ºC. Like the othergauged sub-assemblies, they require very littlesurface preparation at the point of attach-ment. Their disadvantages include a ratherhigh gauge-to-gauge scatter, a considerable
mechanical complexity, and some large ther-mal drift effects. While it is useful to knowthat these gauges exist, it does not seem thatthey are likely to replace conventional straingauges for tablet compression studies at ornear room temperature.
Magnetostrictive gauges
Yet another physical principle has been applied inthe magnetostrictive strain gauge described byWun-Fogle et al. (1987). Here the sensing elementis an amorphous ferromagnetic ribbon that hasbeen annealed in a magnetic field so that theresidual magnetic moment is at right angles to itslong axis. The application of an external mag-netic field produces dimensional changes in thisribbon; conversely compression or extensioncauses large changes in its magnetic permeability.
In the work described by these authors, trans-versely annealed amorphous ribbons (Metglas2605SC) were bonded to the upper and lowersurfaces of aluminium beams, while the per-meability of the material was measured via a set ofcoils operating at a frequency of 1 kHz. The beamwas subjected to cyclic loading at frequenciesranging from 0.01 to 1.0 Hz, and the resultantpermeability changes were plotted against strain.The equivalent ‘gauge factor’ appeared to bearound five orders of magnitude higher thanwould be expected for resistive strain gauges,and it was possible to obtain significant changesin permeability with strain levels below 10 le.
The fibre optic strain gauge
We have seen that forces are nearly always esti-mated indirectly by the strain that they producein a component. On this basis, any device that isable to measure displacement with a sufficientdegree of sensitivity and accuracy can also beemployed as a force gauge.
Changes in optical properties can also beemployed in the measurement of strain. Thedevelopment of fibre optic transducers, in fact,has probably started one of the most significanttrends in modern instrumentation. At one time,fibre optics merely represented a convenient
48 Tablet and capsule machine instrumentation

means of conveying light to otherwise inaccess-ible places. It is now able to provide the basis fora wide variety of intrinsic sensors, in which theproperties of the fibre are modified by its inter-action with the parameter that is to be measured.Fibre optics used in this way has given rise to arange of sensitive transducers that are totallyimmune to the effects of electrical interference.
Several designs of optical displacement trans-ducer have been reported. Probably those withthe greatest sensitivity, and the most suitabilityto strain gauge work, use the principle of theinterferometer. In such an arrangement, lightfrom a common source is split into two beams ofroughly equal intensity. The two beams aredirected along fibre optic elements, and are sub-sequently re-combined at the detector. If eitherof the optical paths is varied because of changesin the geometry of the fibre optic, phase changesbetween the two beams can be measured at thedetector. It is possible for one of the two fibresto be attached between two points on a surfaceso that strain in that surface is communicatedto the fibre. Then the fibre becomes anintrinsic strain sensor. Uttam et al. (1985) havedescribed a system that operates over the range0.1–1000 le, using a frequency modulationdetector arrangement run through a standardFM radio receiver that acts as a demodulator.When a helium–neon laser operating at 633 mmwas used as the light source, phase changes wereproduced at 11 radians m�1 �e�1. The applica-tions of fibre optic strain gauges have beendescribed by Culshaw (1983).
Laser speckle strain gauging
When an object is illuminated by laser light, itexhibits a characteristic ‘speckle’ pattern overits surface. The speckle pattern is produced byinterference between reflected rays of thecoherent light and is dependent on the finestructure of the object surface. If the surface isdeformed by strain, the speckle pattern is dis-placed accordingly, and so the speckle displace-ment can be used as a measure of surfacestrain. An automatic method of evaluating thespeckle displacement by a cross-correlationtechnique has been proposed by Yamaguchi
(1981). The suggested advantages of such amethod were that it involved no contact withthe test object and that, in principle, it couldbe used to measure punch strains without theusual problems of telemetry. Its perceived dis-advantage was that its sensitivity was believedto be only approximately 20 le.
References
Abramson N (1981). The Making and Evaluation ofHolograms. London: Academic Press.
Britten JR, Barnett MI, Armstrong NA (1995).Construction of an intermittent-motion capsulefilling machine simulator. Pharm Res 12: 196–200.
Burch JM, Forno C (1975). A high sensitivity moiré gridtechnique for studying deformation in largeobjects. Opt Eng 14: 178–185.
Chalmers GF (1982), Materials, construction, perfor-mance and characteristics. In Window AL, HolisterGS (eds), Strain Gauge Technology. London: ElsevierApplied Science, pp 1–38.
Cocolas HG, Lordi NG (1993). Axial to radial pressuretransmission of tablet excipients using a novelinstrumented die. Drug Dev Ind Pharm 19:2476–2497.
Culshaw B (1983). Optical systems and sensors formeasurement and control. J Phys E Sci Instrum 16:978–986.
Dudderar TD, Gilbert JA (1985). Real-time holographicinterferometry through fibre optics. J Phys E SciInstrum 18: 39–43.
Ennos AE, Thomas K (1978). Holographic measure-ment of distortion of plastics after injection mould-ing. Plastics Rubber Processing, December: 165–171.
Erdem U (1982). Force and weight measurement. J PhysE Sci Instrum 15: 857–872.
Forno C (1975). White-light speckle photography formeasuring deformation, strain and shape. OpticsLaser Technol 7: 217–221.
Frocht MM (1948). Photoelasticity. New York: JohnWiley.
Hoblitzell JR, Rhodes CT (1985). Recent developmentsin the use of instrumented tablet presses. Pharm Int6: 45–49.
Hoffman K (1990). How to Avoid or Minimize Errors inStrain Gauge Measurement. Darmstadt: HottingerBaldwin Messtechnik GmbH.
Hornby IW (1982). The vibrating wire strain gauge. InWindow AL, Holister GS (eds), Strain GaugeTechnology. London: Elsevier Applied Science, pp327–348.
The measurement of force 49

Johannson E (1981). Pressductor Force Transducers:Principle of Operation. [Pamphlet YM21–10E]Manchester, UK: ASEA.
Langdon RM (1985). Resonator sensors: a review. J PhysE Sci Instrum 18: 103–115.
Lee A (1981). The Tay Bridge. In The Innovative Engineer.London: Morgan-Grampian, pp 42–47.
Mansfield PH (1985). Electrical resistance strain gauges.Transducer Technol 8: No 1, 17–19; No 6, 9–11.
Mountain DS, Webber JMR (1978). Stress patternanalysis by thermal emission (SPATE). Proc SocPhoto-Opt Inst Eng 164: 189–196.
Neubert HKP (1975). Instrument Transducers, anIntroduction to their Performance and Design, 2nd edn.Oxford: Clarendon Press.
Pople J (1979). BSSM Strain Measurement Reference Book,Newcastle upon Tyne, UK: British Society for StrainMeasurement.
Procter E, Strong JT (1982). Capacitance strain gauges.In Window AL, Holister GS (eds), Strain GaugeTechnology. London: Elsevier Applied Science, pp291–326.
Ridgway K (1966). The use of photoelastic techniquesin the measurement of die wall stress in tabletting.J Pharm Pharmacol 18: 176S–181S.
Ridgway Watt P (1981). Holographic interferometry intablet relaxation measurement. J Pharm Pharmacol33: 114P.
Robertson ER, King W (1983). Holography and its appli-cations. In Luxmore AR (ed.), Optical Transducers andTechniques in Engineering Measurement. London:Elsevier Applied Science, pp 161–201.
Rowley DM (1979). A holographic interference camera.J Phys E Sci Instrum 12: 971–975.
Schmidt PC, Koch H (1991). Single punch instrumen-tation with piezoelectric transducers comparedwith a strain gauge on the level arm used forcompression force–time studies. Pharm Ind 53:508–511.
Seippel RG (1983). Transducers, Sensors, and Detectors.Reston, VA: Reston Publishing.
Sixsmith D (1977). Instruments for tablet technology.Mfg Chem Aerosol News 1: 17–21.
Uttam D, Culshaw B, Ward JD et al. (1985).Interferometric optical fibre strain measurement.J Phys E Sci Instrum 18: 290–293.
Weingartner I (1983). Holography: techniques andapplications. J Phys E Sci Instrum 16: 17–23.
Welsh BL, Pyne CR (1980). A method to improve thetemperature stability of semiconductor strain gaugetransducers. J Phys E Sci Instrum 13: 816–818.
Williams JJ, Stiel DM (1984). An intelligent tablet pressmonitor for formulation development. PharmTechnol 8: 26–38.
Wun-Fogle M, Savage HT, Clark AE (1987). Newmagnetostrictive strain gauge demonstrates highsensing potentials. InTech 34: 51–54.
Yamaguchi I (1981). A laser-speckle strain gauge. J PhysE Sci Instrum 14: 1270–1273.
Yeh C, Altaf SA, Hoag SW (1997). Theory of forcetransducer design optimisation for die wall stressmeasurement during tablet compaction. Opti-misation and validation of split web die usingfinite element analysis. Pharm Res 14: 1161–1170.
50 Tablet and capsule machine instrumentation

Introduction
Installing strain gauges is generally not difficult,but there are many possible pitfalls to consider.Meticulous cleanliness and attention to detailare essential to get accurate reliable data. A well-specified and executed installation should lastmany years of service, whereas a sloppy or hap-hazard approach could render any data invalid.
The installation process will be covered insome detail but it cannot cover every eventu-ality. It may require more research or advice fromyour strain gauge supplier for specialist orunusual applications. Many instructions areavailable from manufacturers, some of which arelisted in the bibliography.
This section starts with the assumption thatthe strain gauges, location and arrangement havealready been specified. The processes that mustbe followed are:
1. Surface preparation2. Adhesive bonding3. Leadwire attachment4. Protection.
However, before any of the processes areattempted, thought must be given to health andsafety considerations.
Health and safety considerations
The processes and especially the chemicals andmaterials used, are considered to be hazardous tohealth. In many cases, common sense willenable the installer to avoid obvious hazards
from exposure to toxic chemicals. This includesphysical protection for eyes and hands and goodventilation to avoid inhalation of fumes. Lessobvious are hazards by ingestion and from flam-mable compounds. Some materials, such asberyllium copper, are toxic if their particulatesare inhaled.
Good hygiene and cleanliness are essential,not only to protect the installation but also toavoid ingesting compounds (for example thelead in lead-based solder). It is obvious to avoideating, drinking and smoking in the workingarea as well as to provide ventilation andextraction.
Despite your best efforts, situations may occursuch as spillages that may require immediateaction. First aid facilities and eyewash stationsmust be provided. The chemicals and com-pounds used will be supported with MaterialSafety Data Sheets specifying the precautionsand actions in the case of accidental or excessiveexposure to the product. Additionally a COSHH(control of substances hazardous to health)assessment should be carried out before workcommences to ensure the risks are minimisedand that a suitable procedure is in place in caseof emergency.
Surface preparation
The strain gauges must be attached to the surfaceof the component as intimately as possible toaccurately reflect the movement of the substrate.A common problem with strain gauge instal-lations, and the obvious first problem when poor
3The installation of strain gauges
Anton Chittey
51

overall performance is experienced, is insuf-ficient understanding of what is meant bysurface preparation. The three aims of preparinga component for strain-gauge installation are toachieve a surface that is
• mechanically sound• chemically clean• chemically inert.
The first of these, mechanical soundness, is obvi-ous. The surface must be free from corrosionand visible surface finishes, including paint andplating. Removing surface plating is especiallyimportant, since plating may be considered agood surface for bonding as it can appear to besound. However, many plated finishes are not anintegral part of the base metal. Anyone who hasseen chrome plating peeling or flaking off aspanner will be witness to this fact.
To achieve ‘chemical cleanliness’ requires theremoval of all the invisible contamination pres-ent on all surfaces. Oil, grease, fingerprints andany other environmental contaminants must becompletely removed. It is not generally consid-ered sufficient to wipe the surface with a cleancloth or even to use detergent. This may some-times apparently work but will be inconsistentand may compromise the overall accuracy andstability. Considering the time spent on theoverall process, it is not prudent to take shortcuts.
Finally the surface can be left with anacidic pH from the previous process, so aneutraliser stage is necessary to give a neutralpH. Many adhesives will simply not adhereto an acidic surface, so failure at this finalstage can cause significant problems later on,from an obvious failure to bond to more subtleinstability problems once the installation hasbeen calibrated.
The process involved in achieving the above-mentioned surface criteria will now be describedin some detail.
Surface degreasing
Before proceeding further, the surface must bethoroughly degreased. This is to prevent greasebeing driven into the surface by later processes,
especially that of abrading. A range of degreaserscan be used, providing they are compatible withthe substrate material. Aerosol degreasers areespecially effective and have the advantage ofbeing in a one-way container, thus preventingcontamination. Less effective but considered safeon many materials including plastics are sol-vents such as isopropanol, but this is highlyflammable. Unsuitable degreasers include manyaqueous or citrus-based products.
Try to degrease the whole of the component.Failing this, degrease a much larger area than thegauge installation actually needs to prevent acci-dental contamination in later stages of theinstallation process.
Surface abrading
The surface must be abraded to remove obvioussigns of instability, such as plating, paint andcorrosion. Surface imperfections must also beremoved as many adhesive systems will not fill voids. A suitable finish is essential to ensure a good ‘key’ for the adhesive: too smooth isundesirable, too rough and the gauge and theadhesive may not perform adequately.
A variety of processes may be necessary toachieve the desired finish. Wire brushes can beuseful for the removal of paint and corrosion.Rotary brushes, driven by an angle grinder ordrill, are especially effective. For more seriousdefects, a flexible grinding disk or abrasive flapwheel can rapidly remove significant amounts or material and leave a good surface finish.However, they can also be quite aggressive if notused carefully. Hobbyist hand-held low-voltagedrills are available with a variety of miniatureattachments, making them useful in manysituations.
Files may be used but with great care in orderto avoid gouging the metal surface. So-called‘needle files’ are useful for areas with limitedaccess, such as the interior of holes.
Final surface abrading is normally manualusing silicon carbide paper of varying grades.Abrading should progress from working from acoarse grade to using finer grades until theabrasion marks from the previous grade are com-pletely covered. The 220 grit paper is quite
52 Tablet and capsule machine instrumentation

coarse, whereas 320 grit (for steel) or 400 grit (foraluminium) are ideal for final finishing. Wherethe surface material is compatible, an acidic con-ditioning solution should be used to aid the finalabrading process. This conditioner is normally amild phosphoric acid and helps to etch thesubstrate while removing contaminants.
Air abrading (grit blasting) is used in situationswhere lots of items must be prepared. 100–400grit alumina powder is ideal in combinationwith a clean air supply. However, a poor surfacecan be masked by this process, so you mustensure a flat, even surface is present beforeblasting.
Gauge location lines
The overall performance of the installationdepends in part on the accurate alignment of thegauges to the component to be gauged and toeach other, assuming a multiple-gauge layout.Clear, accurate, unambiguous alignment marksare essential and can easily be achieved with afew considerations.
Firstly, a line should not be scratched as thiscan be detrimental to the strain gauge, the adhe-sive and the component under test. Instead aburnished line enables accurate installation withno effect on the overall measurement. On alu-minium and other soft metals, a 4H graphitepencil can give good results, though care mustbe taken on high-strength alloys as graphite cancause embrittlement. On steel, an ink-free ball-point pen held normal to the surface is ideal:alternatively a brass rod with a rounded pointcan be used. Marking out will recontaminate thesurface and so this must be removed in the nextstep.
Surface conditioning
To remove all of the remaining contamination,the surface must be scrubbed with conditioningcompound (assuming compatibility with thesubstrate material) and a cotton-tipped appli-cator, until a clean tip is no longer discoloured.The conditioner must not be allowed to dry onthe surface: it must be removed with a clean
tissue or medical-grade gauze pad. The dryingprocess starts by wiping from the centre of theprepared area out to one edge. Then a freshgauze pad is used to wipe from the centre outtowards the opposite edge. At no stage shouldthe gauze pad be returned to the centre and usedagain as this will introduce contamination fromthe unprepared area. This conditioning stage isrepeated until further cotton-tipped applicatorsremain clean.
Neutralising
Many adhesives will not bond to an acidic sur-face. The previous section advises, where com-patibility can be ascertained, to use an acidicconditioning solution. Therefore, a further stageis necessary to bring the surface to an approxi-mately neutral pH (pH 7.5). To achieve this, aneutralising solution (weak ammonia solution)must be applied to the surface and scrubbedusing cotton-tipped applicators. Then the sol-ution must be dried in a similar way to thatdescribed in the last section by using a cleangauze pad to wipe from the centre of the pre-pared area to the edge and then again from thecentre to the opposite edge with a fresh gauzepad. The neutraliser must not be allowed to dry on the surface as this will recontaminate theprepared area.
The surface is now ready for bonding. To avoidfurther contamination, the adhesive bondingmust be carried out as soon as possible.Recommendations are available for differenttypes of material, but a period of more than anhour or so is undesirable. Apart from the obviousthreat of airborne contamination, the metal willstart to re-oxidise.
Bonding with adhesive
There are many types of adhesive available forvarious specialist applications, but the threemain adhesives can be grouped as follows.
• instant: cyanoacrylate adhesive, sometimescalled ‘superglue’
The installation of strain gauges 53
• cold-cure: 100% solids epoxy resin• heat cure: solvent thinned epoxy-phenolic.
Note that general-purpose adhesives are not nor-mally suitable, so a certified strain gauge adhe-sive must be used. It is tempting to use a low-costalternative, but the implications of savingmoney here are significantly offset by the overallcosts of installing and calibrating the transducer.
Each adhesive requires different treatmentduring installation and will have varying lifeexpectancy. More details will be given below aseach procedure is described.
Correct storage and usage is essential to ensurea reliable and repeatable installation. Some adhe-sives should be stored in a refrigerator beforeopening to ensure life expectancy up to themanufacturer’s ‘use-by’ date. However, it is notgenerally recommended to refrigerate openedcontainers. If the product is to be used onlyoccasionally, refrigeration is permitted. However,after removal from the refrigerator, the containermust be allowed to warm up to room tempera-ture before opening to avoid condensation inthe bottle.
As a reminder, before proceeding it is essentialto ensure meticulous cleanliness throughout thebonding process. The strain gauges will be cleanin their pack, and so further cleaning of them isnot required. Avoid manipulating the gauges byhand and ensure that any surfaces that theycome into contact with are degreased with asolvent, followed by neutralisation.
Gauge handling
Until this point, the strain gauges should be leftin their pre-sealed pack as this excludes contam-inants. The gauges can now be removed from thepack using a pair of pre-cleaned gauge-handlingtweezers and placed on a pre-cleaned gauge-handling area. A degreased and neutralised glassblock is ideal. The gauge can then be picked upwith a suitable adhesive tape for transfer to thepre-cleaned and marked surface: the positioningof the tape on the gauge and the type of tape issomewhat dependent on the adhesive beingused. The tape is merely for handling andenables accurate positioning of the gauge to the
alignment marks. As overall performance isaffected by accurate alignment, it is desirable tospend some time getting the gauge precisely onthe marks: a good-quality tape will enable repo-sitioning many times without leaving anyresidue.
While the gauge is being handled in this way,it is in a vulnerable position. Excessively roughhandling, such as creasing the gauge, canadversely affect its performance later on. Try tohold the gauge as flat as possible, especiallywhen lifting the gauge from the handling surfaceor when repositioning.
During the bonding process, it is desirable toposition a bondable terminal in a convenientlocation during the same process. Surface prep-aration and adhesive application should be identical to that of the gauges. While straintransmission is not required, a good anchor forthe main leadwire, which may be of heavygauge, is necessary to prevent failure.
Once positioned, the installation is ready forthe adhesive application.
Instant adhesive
Cyanoacrylates are sometimes considered to bean all-purpose solution for many applications.However, this not true for strain gauge instal-lations. This adhesive is really only suitable forshort-term evaluation (up to a year is a typicalrecommendation) as it is moisture, time andtemperature sensitive. It can, therefore, be usedfor ‘stress analysis’ applications and for evaluat-ing the suitability of a component for con-version into a transducer. In fact, the performanceof a cyanoacrylate certified for strain gauges isexcellent in the short term (a few days or weeks)and can, therefore, closely match the perform-ance of an installation designed for long-termuse. Do not be tempted to use general-purposecyanoacrylates (superglue) as this can seriouslycompromise the installation.
The benefits of this adhesive are many: it isclean, convenient, high performance and quick(instant) as well as being easy to remove.Commercial cyanoacrylate removers are avail-able. It does, however, also have its drawbacks. Ithas a relatively small temperature window: �25
54 Tablet and capsule machine instrumentation

to �65ºC long term. Many manufacturers willclaim a much wider temperature range but this isnot in relation to its ability to transmit strain.This will degrade with time, although the gaugewill not actually ‘fall off’ as some people expect.Further, the peel strength is low even though itsshear strength is very high. Do not be tempted totest the bond strength by trying to peel a gaugeoff the surface, as this will prove very easy.
Instant adhesive application
The gauge must be picked up with cellophanetape with the entire gauge inside the edges of the tape. Approximately 100 mm of 20 mm widetape is generally suitable and convenient. Oncepositioned, the tape is pulled gently up to exposethe back of the gauge and a catalyst appliedaccording to the manufacturer’s recommen-dation to the gauge only. One drop of the adhe-sive is applied to the tape–surface interface andthe tape is then held by the free end close to thesurface to enable the adhesive to spread to thewidth of the tape. A folded gauze pad is usedwith firm, even pressure to wipe through frombehind the adhesive all the way through andover the gauge. Finally the gauze is disposed ofand pressure is applied with the thumb on top ofthe gauge for 1 min.
After a further 2 min in normal circumstances,the tape can be removed by pulling one endright back over itself. If the adhesive is stillliquid, the thumb pressure should be applied fora little longer and a few more minutes ‘rest’allowed before attempting removal again.
There can be many reasons why a gauge doesnot bond, from insufficient or inappropriate sur-face preparation to low temperatures (below�20ºC) or low humidity, since cyanoacrylatesrequire a certain amount of humidity to polym-erise. If there should be a failure, a telephonecall to the strain gauge adhesive suppliers canhelp diagnosis.
Cold cure adhesive
Also called 100% solids epoxy, these adhesivesare not really ‘cold’ cure but are in fact roomtemperature curing. They have no solvents and
are a little more viscous than other types ofstrain gauge adhesive, so glue lines can be a bitthicker. This makes them suitable for fillingporous and uneven substrates. They are verystable and can be used for a service life of manyyears. Once again, general-purpose epoxysshould not be used: these are entirely unsuitablefor strain gauge installation, especially as theymay be very viscous. Instead use a certified straingauge adhesive.
These adhesives are not as quick or as con-venient as the instant adhesives. They must bethoroughly mixed in accurately defined ratios.This often leads to wastage as a minimum mixquantity, typically 10 g, must be made sincesmaller mixes can result in large mixing ratioerrors. To ensure accuracy, these adhesives aregenerally available in pre-weighed kits. Bulkquantities are available but require a weigh scaleaccurate to at least 0.1 g, calibrated pipettes, suit-able clean glass containers and plastic stirringand application rods.
Once mixed, they have a limited ‘pot life’ orworking time of around 15 min, depending onenvironment. They must be clamped for theduration of cure, typically 6 h at room tempera-ture (overnight is ideal) or shorter at slightly elev-ated temperatures. They will not generally cureat temperatures lower than 20ºC.
Cold cure adhesive application
The gauge must be picked up with cellophanetape with the entire gauge inside the edges of the tape. Approximately 100 mm of 20 mm widetape is generally suitable and convenient. Oncepositioned, the tape is pulled gently up to expose the back of the gauge ready for adhesive application.
The adhesive is mixed thoroughly accordingto the manufacturer’s recommendation; typi-cally 5 min of gentle stirring is necessary toensure even and essentially bubble-free mixing.Then the adhesive is smeared on both the gauge and the substrate using the stirring rod.The smearing action should move away from thetape–surface interface to remove any bubbles orother inclusions away from the gauge location.
Gently the tape and gauge are brought down tothe surface using a gentle wiping action with a
The installation of strain gauges 55
gauze pad. Then a small piece of silicone gum isplaced over the entire gauge and a small metalbacking plate contoured to the surface profile isplaced over the silicone pad; the assembly isthen clamped using a suitable spring clamp. Theclamping pressure should be within the rangerecommended by the strain gauge adhesive sup-plier. The system is left for the desired curingtime (overnight is preferable) and then theclamp assembly is removed and the tape peeledback.
Heat cure adhesive
There are many forms of adhesive that requirecuring at elevated temperatures. As mentionedbriefly above, a cold cure adhesive can have itscure time shortened by raising the temperature.Heat cure adhesives, by comparison, simply willnot cure at room temperature. While there aresome 100% solids epoxy adhesives requiring elevated temperature curing, this section is concerned with the solvent-thinned epoxyphenolics.
Adhesives in this group offer extremely thin,high-performance gluelines for extended lives of20–30 years or more. They are the first choice forprofessional transducer manufacturers and areused, for example, in commercial weigh scales in‘legal-to-trade’ situations.
Most but not all, are two component systems,so mixing is required. They will generally be sup-plied in two half-full bottles, one to be pouredinto the other and then shaken to mix. Afterstanding for 1 h, they are ready to be used.Owing to the elevated temperature cure require-ments, the pot life can be from 3 to 12 weeksdepending on specific formulation and storageconsiderations.
Cure times are dependent on temperatureand can be from 80°C for 4 h to 175°C for1 h. Curing must start in a cold oven and thetemperature must be raised slowly to avoidsolvent entrapment. Furthermore stringentclamping is required and a further post-cure
may also be necessary after removal of theclamps.
Heat cure adhesive application
Owing to the high curing temperature, cello-phane tape is not suitable. Instead a high-temperature alternative (Mylar) is required. Thisshould be placed across the terminals of the strain gauge to avoid solvent entrapment.Once positioned, the tape is peeled back toexpose the back of the gauge for adhesiveapplication.
Once the adhesive is mixed, it is applied toboth the back of the gauge and the surface bypainting it on with a small brush. This is oftensupplied as a brush integral to the cap of theadhesive bottle. The surfaces are allowed to air-dry for the recommended time and then the gauge and the tape are folded back on to thesubstrate.
Clamping is a little different as the gauge andthe adhesive are now exposed. A thin Teflon slip-sheet must be positioned to cover the area beforea silicone pad is applied plus a suitably con-toured metal backup plate. Clamping can bemore stringent, so careful attention should begiven to the manufacturer’s recommendations.Spring clamps are now essential, as raising thetemperature may cause a major change in clamp-ing pressure if mechanical clamps are used,owing to differential expansion between thecomponent and clamp materials.
The assembly is placed into a cold oven andthe oven is set to rise slowly to the required curetemperature. The component must have reachedthe desired temperature before the clock isstarted, as a large component may take sometime to get to temperature. Once a suitable timeand temperature have been reached, the oven isswitched off and allowed to cool down slowly.The clamps are removed and, if required, theassembly is post-cured according to the manu-facturer’s instructions. While not always necess-ary, post-curing is essential for best accuracyand repeatability.
56 Tablet and capsule machine instrumentation
Leadwire attachment
Soldering can be one of the most challengingparts of strain gauge installation, and yet, with aconsistent technique and appropriate tools, itcan be both quick and easy. Common mistakesmay easily be avoided: use a good-quality solder-ing iron (cheap irons are seldom suitable), usefresh solder every time a joint is touched up(fresh flux is actually what is needed) and try notto be too quick. The 2 s rule will ensure thatthere is enough heat in the joint without dangerof burning the gauges or the terminals.
Suitable solder and leadwires should be chosenfor the job. If these are too heavy, they will bedifficult to handle, and there will be a danger ofdamaging the gauges.
Finally, thorough cleaning and removal of theflux residue is of paramount importance toensure a stable output over time.
Intra-bridge wires
Generally fine single-conductor enamel insu-lated wires are used. Some have insulation thatcan be burnt off with a soldering iron and somemust be mechanically stripped. In some situ-ations, wire insulated with polyvinyl chloride orTeflon can be used, but this can be more difficultto work with.
Main leadwire
A multi-core cable, both twisted and shielded,is ideal for the main leadwire. For full bridgeinstallations, this can be either 4 or 6 core andcan be of any suitable thickness. In general, athicker cable should be used for longer leadruns, while a finer wire must be used if thecomponent is moving in order to maximiseflexibility and minimise chances of fatigue fail-ure. Some 4-core cables are available withdiameters of approximately 1 mm.
For quarter-bridge installations using a singlegauge for stress analysis, 3-core flat ribbon cablesare easy to work with.
Solder
Ideally, lead-based solder with a rosin (flux) coreof a small diameter (0.5 mm or less) should beused. However, as lead and rosin flux are bothtoxic, there are many lead-free and rosin-freeproducts available. General-purpose solders andfluxes should not be used as many of these canbe detrimental to the long-term stability of thestrain gauges.
Soldering station
A user-selectable temperature-controlled solder-ing iron with an iron-clad screwdriver tip isessential for achieving good connections to thestrain gauges and terminals. The iron must be setto the correct working temperature, some 30 to50ºC above the melting point of the solder, andthe tip kept meticulously clean. Using a wetsponge is not a good idea as this can cause thetip to oxidise rapidly.
Soldering technique
To avoid damage and excessive solder flow, paperdrafting tape is used to mask all but the smallarea where the wire is to be attached. This isespecially important on the strain gauge, as theterminal area can be much larger than needed.In general, the exposed area should be a third toa half that of the terminal.
All points must be tinned, which means apply-ing a small amount of solder to each wiringpoint. This is achieved by placing solder over theterminal, pressing the soldering iron firmly overthe terminal and holding for 2 s. Immediatelythe iron and solder are lifted simultaneouslyfrom the terminal. A small low-profile moundof solder should be present. If it is not, theprocedure is repeated.
The leads are prepared appropriately accordingto the type. Only a small amount of wire shouldbe free from insulation to avoid possible paths tothe substrate. The end of the wire is tinned thenpositioned over the terminal and secured usingdrafting tape. It is then soldered using the
The installation of strain gauges 57

same technique as above, remembering to usemore solder, as the flux core is essential toachieve good joints. The joint is pressed firmlyand held for 2 s. This is repeated if necessary.
The intra-bridge wires must be in close contactwith the substrate as they are routed. If they arenot, any small change in temperature will beshown as a rapid zero shift because of the lowthermal mass of the fine wires.
Cleaning
All signs of flux residue are removed using a suit-able solvent. A mixture of toluene and iso-propanol is a good method that can quicklydissolve the flux and also effectively remove anydrafting tape. As with any cleaning process, thesuspension of the contaminants must be blottedoff the surface using a gauze pad. The solventshould not be allowed to evaporate as this willredistribute the flux on to the installation.
Protection of the installation
Some form of protective coating must be appliedto the installation. This is to provide bothenvironmental and mechanical protection andshould cover the gauges, leads and the adhesive.
Suitable compounds must be used as recom-mended by the strain gauge supplier. General-purpose compounds must not be used. Forexample, silicone rubber (RTV) is a good productbut must be free from corrosive ingredients. Thetype used as a kitchen and bathroom sealantis based on acetic acid and will destroy theinstallation in minutes. Many other compoundsare slightly conductive and can, therefore,compromise the installation.
There are many products available, and theseare selected according to the required level ofmechanical and environmental protection, aswell as the length of time the installation mustsurvive. Some examples are listed below.
Paint-on (air-drying) products. Acrylic andpolyurethane varnishes are convenientsingle-component products. Painted on inthin layers, they generally air-dry in 20 min
but must be allowed to fully cure for 24 h iffurther coatings are to be applied. If used ontheir own, they are only suitable for low-humidity laboratory conditions and provideno mechanical protection as they form only a thin layer. They are very useful foranchoring the intra-bridge wires.
Silicone rubber. This is a convenient coatingthat offers good moisture and mechanicalprotection. There are both self-levelling andnon-drip varieties. Applied in 2–3 mm layers, it cures in approximately 6 h.
Microcrystalline wax. This is an excellentmoisture barrier and is used by many profes-sional transducer manufacturers. It has obvi-ous temperature limit issues as it meltsaround 65°C and offers little mechanicalprotection.
Polysulphide rubber. This two-componentcoating offers excellent mechanical andmoisture protection, including for immer-sion in water. It is conductive and is normallyused in conjunction with an insulating layersuch as bondable Teflon sheet or a paint-oncoating as described above. If used with anair-drying coating, this must be allowed tofully cure before applying the polysulphide.Otherwise there can be an interactionbetween the two.
Inspection and testing
To ensure a good installation, a continuousinspection process should take place throughoutthe installation procedure. This starts with visualinspection and, in later stages, includes electricaltesting.
The adhesive
The first inspection should take place immedi-ately after bonding. The gauges should be accu-rately positioned to the alignment marks, within0.4 to 0.5 mm is realistic. Furthermore, the glueline should not have any voids (seen as lighterareas) or inclusions (lumps) under the grid. Thebond cannot be checked by attempting to peel
58 Tablet and capsule machine instrumentation
the gauge as some adhesives have very low peelstrength.
Solder and leadwires
The intra-bridge leads should be neat andundamaged. The tinned end should entirelyoverlap the edges of the gauge and terminals toavoid the possibility of shorting to the substrate.Main leads should be similarly positioned andthe insulation must be free from burning fromthe soldering iron. This is especially commonwhen polyvinyl chloride (vinyl) leads are used.
Solder joints are becoming more difficult toinspect. Lead-based solders are easy to work withand easily produce beautiful joints. An idealjoint should be bright and shiny, with a low pro-file (more like a small bump than a ball) and befree from spikes and holes. Joints made fromlead-free solder must meet most of the above cri-teria, but there is one big difference. Generallythey produce a slightly dull ‘crystalline’ finish.This makes it more difficult to differentiate agood joint from a ‘dry’ one.
Electrical tests
The installation may fail despite rigorous visualinspection and so must be tested electrically.These tests must be performed both before andafter applying a protective coating to ensure thatthe coating or its application have not affectedor damaged the installation and to permit earlyrectification of faults.
Basic continuity is the first check. Are all thewires connected? Is there a short circuit?Judgements can be made knowing the gaugeresistance as to whether everything is in order.For single gauge (quarter-bridge) installations, itis obvious that the resistance should be close tothe gauge resistance shown on the packet thegauges came from, typically 120 or 350 �. Forfull-bridge installations, the resistance betweenthe two power leads or the two signal leadsshould equal the resistance of one arm. Betweenany power and any signal lead, there will bethree-quarters the resistance of one arm. Thusfor a typical four-gauge bridge with 350 �
gauges, the resistance across power leads shouldbe 350 � and the resistance between any powerlead and any signal lead should be approxi-mately 262 �. These values are approximatesince they do not take lead resistances andtolerances in the gauge resistance into account.
Finally, the installation should be checked forisolation from the substrate. This cannot beeffectively measured with a multimeter in theohmic range as this instrument is simply notsensitive enough. A purpose-built insulationtester must be used. The test voltage must beadjustable to a low setting; 25 V is typical but testvoltages of over 100 V should never be used asthis can cause the insulation of a perfectly soundinsulation to fail. Before protection, it should bepossible to achieve a resistance of 2 � 1010 �(20 G�) and this should not reduce to below1 � 1010 � after protection.
Load tests
After performing all the above testing andinspection, there is still no absolute way toguarantee the installation. The only way to dothis is to connect it to a suitable instrument,apply and then remove a reasonable load andmonitor the output. A good installation will bestable at the initial zero, will be stable at loadand then return back to the original zero point.Instability can indicate voids under the grid,ineffective surface preparation or poor adhesiveapplication and curing. Further tests can becarried out for a full bridge as it will normallybe desirable to calibrate it to a known load.When checking calibration, the load is normallyapplied and removed incrementally to ascertainlinearity, repeatability and lack of hysteresis.
Specialist applications
There are many applications that require addi-tional information, skills, tooling and ingenuity.For example, there may be restricted access tothe gauging area: perhaps in a narrow slot, aninternal bore or a small hole. Higher tempera-tures or unusual substrate materials need special
The installation of strain gauges 59
attention, and in some installation environ-ments, there may be other suitable techniquesand products such as weldable gauges.
Leadwire attachment to unbonded gauges
It is obvious that after gauges have been installedin holes or small gaps and channels, the gaugesmay not be accessible to solder the leads. On alarge bore with gauges close to one end, there isnot really a problem, but smaller bores and gapswill require the gauges to be pre-leaded. Gaugescan either be purchased with leads alreadyattached or fine wires can be pre-attached usingnormal solder procedures with some slight modi-fication. The main terminal can either beinstalled in a more convenient and access-ible location elsewhere on the component orimmediately inside the bore for easy access.
The leadwire used should be perhaps 34AWGmaximum to avoid damaging the gauge duringhandling; enamel-insulated solid copper wire isideal. Firstly, a flat smooth-surfaced aluminiumplate is cleaned using degreaser and neutraliser.The gauge is taped to the aluminium plate withpaper drafting tape and the procedure describedabove is followed. The solder flux residue mustbe thoroughly cleaned away and the taperemoved using rosin solvent. The top of thegauge must be clean before it is turned over, withthe leads held, so that the back can be cleanedwith more rosin solvent. The gauge should begently blotted dry. Finally a cotton-tipped appli-cator dampened in neutraliser is gently used towipe the back of the gauge. The gauge is placedback into its packaging to protect it until it isinstalled.
Gauge positioning
The problem is that gauges down a hole or boremust be installed ‘blind’, so accurate positioningcan be a challenge. The leaded gauges must betemporarily attached to a flexible carrier such asMylar film. Double-sided tape or rubber glue issufficient as it must be removable. This carriershould be longer than the distance from the edgeof the hole to the desired location so that the
carrier can be marked with a line. It can then berolled back, inserted to the line and secured withtape to the edge of the hole.
Clamping
This is the most difficult part of the process andmay require the building of custom clampingrigs.
For larger holes, a rubber bung with a holethrough the middle can be machined, the bungbeing slightly smaller than the bore. The centralhole has a bolt inserted with washers at each endof this ‘cotton reel’ so that the rubber bung willbarrel out when the bolt is tightened and soclamp the gauge.
For smaller holes, a narrow silicone tube,blocked at one end and then pressurised, can be adequate. Alternatively, a round bar can beinserted and then pushed in the opposite direc-tion to the gauge location; this does not giveeven pressure over the gauge and so must beused with caution.
For other situations a custom rig can be built,with arms that can be moved by a cam con-nected to a threaded bar or bolt similar to anadjustable reamer. As the bolt is turned, the armsmove outwards to apply pressure. The custom rigrequires some ingenuity to design and build andit can be expensive. For obvious reasons, thissolution should only be pursued if there aremany installations of the same type or if there issimply no other way.
High-temperature installations
Conventionally bonded strain gauges can beused up to 260ºC for extended periods and up to400ºC for special or short-term applications.Careful selection of adhesives, leadwires andsolders is necessary to ensure survival. Beyond400ºC, the conventional gauge can no longer beused.
For temperatures up to perhaps 1000ºC, free-filament gauges are available. These are basicallya special strain gauge with a temporary ‘strip-pable’ backing or fibreglass carrier. The film isbonded using ceramic slurry or flame-sprayed
60 Tablet and capsule machine instrumentation
ceramic. Leads are attached by spot-welding. Ahigh degree of operator skill is necessary and sothis task is best left to specialists.
Weldable strain gauges
For some applications, it is possible to spot-welda gauge to a surface. The weldable strain gaugeconsists of a carrier (stainless steel or Inconel)with a gauge attached with epoxy–phenolicadhesive or ceramic cement. A capacitive–discharge spot-welder is then used to run a seriesof miniature welds around the edge of the shim.
This offers advantages in some situations. Thenecessary surface preparation is limited to basicgrinding and degreasing and the installation timeis greatly reduced. Many weldable gauges are pre-leaded and some are even pre-protected, so theyrequire no further installation time after welding.
The disadvantages are obvious. Hithertoemphasis has been laid on mounting a gaugewith a thin adhesive line, but we have nowadded a shim perhaps 0.1 mm thickness. Thiscan reduce the sensitivity of the installation andreinforce thin sections. Further, it is only suitablefor ferrous substrates. Gauges of this type aremainly used for stress analysis applications onlarge structures such as bridges, rails and oilrigs.
Special materials
Some materials need special treatment duringsurface preparation to ensure the bond will besuccessful and that the substrate will not bedamaged.
Titanium must be heat treated to 175ºC threetimes and degreased at each return to room tem-perature. Failure to follow this regimen hasresulted in reports of the gauge falling off.
Copper and some copper alloys should notcome into contact with ammonia, so the neu-traliser stage should be replaced with thoroughcleaning with distilled water.
Porous materials including cast iron should belocally warmed with a heat gun after surfacepreparation as some of the chemicals may still be in the surface layer and compromise the long-term stability of the installation.
Plastics and composites can be sensitive to sol-vents and so compatibility must be established.Unfortunately these materials may also be con-taminated with silicone-release agents duringmanufacture and so the degreasing stage cannotbe ignored. Isopropanol is a good choice fordegreasing, followed by a thorough cleansingwith conditioner solution that has been heatedto 65ºC. Some plastics, most notably polyethyl-ene, are completely resistant to cyanoacrylateadhesives so epoxy adhesives must be used.
There are many other materials that needspecial attention, but the above examples aregiven to demonstrate common pitfalls. If thereis any doubt, then the strain gauge suppliershould be able to advise on surface preparationprocedures and adhesive compatibility.
Tools and installation accessories
Some tools necessary for successful strain gaugeinstallation can be found in a general-purposetoolkit, but many are specific to strain gaugingand fine electrical work. Some general-purposetools, especially some soldering irons, are simplynot suitable for use in this environment.
Consumables
Chemicals
A form of degreasant is required, ideally in anaerosol container to avoid contamination of thecontents. Isopropanol is an effective productthat is safe on many plastics.
Surface conditioner is normally a weak phos-phoric acid solution for effective contaminantremoval.
Surface neutraliser for final surface preparationis usually a weak ammonia solution.
Rosin solvent is used for flux removal aftersoldering. Aqueous solutions are unsuitable forthis, but a mixture of toluene and isopropanol isideal.
There is a wide choice of adhesives (around 30from one manufacturer alone), but a shortlistcan generally be made with advice from thestrain gauge supplier.
The installation of strain gauges 61

Abrasives
Surfaces can be ground, filed, polished, grit-blasted or hand abraded. Files are acceptable for removing large amounts of material but notfor the final polishing stages. Here are someother recommendations.
Silicon carbide papers can be used wet or dry.Usually they are used wet to avoid clogging andto assist in the cleaning process. Conditioner isrecommended as the wetting medium wherecompatibility has been ascertained. Variousgrades are available from coarse to fine, and gen-erally three grades (220, 320 and 400) are usefulfor a variety of materials and surface finishes.
Grinders of many descriptions are available,ranging from angle grinders and drill attach-ments to hobbyists’ tools. The larger tools aresuitable for large rough structures but can betoo aggressive. Hobbyists’ drills, normally small12 V powered hand-held devices, are availablecheaply and have many attachments, rangingfrom small wire brushes and hard grindingwheels to abrasive flap wheels and flexibledisks.
Cleaning materials
The chemicals used in installation will require,at various stages, to be dried from the surfaceor applied vigorously (described as ‘scrub-bing’). Clean tissues from a box can be suf-ficient, but gauze pads from medical suppliersare ideal. Cotton-tipped applicators are usedextensively for scrubbing and should be of thewooden-handled variety.
Leadwires
A range of wire types is necessary for differentapplications. Solid copper enamel-insulatedwire, 34AWG, is ideal for intra-bridge wires.Main leads should ideally be 4- or 6-core twistedand screened in either polyvinyl chloride orTeflon insulation for full bridge installations.When installing quarter-bridges, three-leadribbon cable is convenient to use.
Solder
Solder is preferred to be of low melting point,normally lead based (60% lead, 40% tin, some-times called ‘60/40’) with a flux (rosin) core.Lead-free solders have a higher melting tempera-ture (greater than 220ºC compared with 183ºCfor 60/40) and require greater skill to use. Soldersof smaller diameter are easier to work with:0.5 mm is ideal for most if not all strain gaugework. Larger diameters are not generally requiredor recommended.
Terminals
All strain gauge installations require an interimterminal between the gauge and the main lead-wires, though some gauges are already fittedwith an integral terminal. Terminals are nor-mally in a ‘dog-bone’ shape and can also be ina ‘Y–I’ configuration for three-lead quarter-bridge installations. They are available in manysizes, and can be cut to suit the application asthey come in strips of eight or more. Theymust be bonded in a similar way to the straingauges, usually during the same bondingprocess.
Gauge-handling materials
Suitable gauge-handling tape comprises cello-phane for room temperature curing or Mylar forelevated temperature curing. The tapes must beof good quality and preferably from the straingauge supplier to ensure they do not react withthe adhesive or leave a mastic residue behindduring gauge placement.
Paper drafting tape (low tack) is used foranchoring leads during soldering and other situ-ations where temporary fixing is required.Masking tape is not recommended as this has ahigh tack and can leave residues on removal.
Clamping consumables include Teflon film,silicone gum (2–3 mm thick) and some form ofbackup plate such as 1 mm aluminium plate thatcan be formed easily by hand.
62 Tablet and capsule machine instrumentation

Gauge protection
A couple of protection materials can be useful tohave available for general applications. Air-drying polyurethane or acrylic varnish is con-venient and dries in approximately 20 min.Corrosion-free silicone rubber (RTV) is a single-component room temperature coating offeringgood mechanical protection. For more specialistapplications, the strain gauge supplier will giveadvice.
Tools
Tweezers
Small tweezers are useful for handling at variousstages of the installation process. The mostobvious requirement is for gauge handling.Tweezers must be round-nosed, flat (i.e. unser-rated) and undamaged. This is to ensure easycleaning and that they will not damage thegauge during handling. Finer needle-pointtweezers can be used for intra-bridge wiring, ascan locking tweezers, but they must be usedwith care to avoid scratching or damaging theenamel insulation.
Layout marking tools
Once the position of the gauges has beendecided, clear unambiguous lines must bemarked on the surface. Ball-point pens that haverun out of ink are good, as are 4H pencils. Tolocate the lines, a surface table with a heightgauge, ‘V’ blocks and a dividing head is ideal, butvernier callipers and a steel rule are useful,though with a lower accuracy.
Cutters
Diagonal or end (flush) cutters are used for lead-wires. These can be used for wire stripping butpurpose-made strippers are preferable to avoiddamaging the conductors. Surgical scalpels aregood for trimming and scraping operations ifnecessary.
Soldering
A good-quality temperature-controlled iron witha 1.5 mm iron-clad screwdriver tip is essential.The tip temperature must be adjustable by theoperator for a variety of situations. General-purpose ‘hobbyist’ soldering irons are notrecommended as the tip temperature can beextremely high. Fixed temperature controlledirons are usually unsuitable as the hysteresis(temperature variation) can be excessive.Portable gas irons should never be used.
Other hand tools
Miniature snipe-nosed pliers, small scissors (sur-gical shears) and dental picks can be useful ad-ditions to the toolbox as are spatulas, smallcamel-hair brushes and, for clamping duringadhesive curing, a variety of spring clamps. Aheat gun may also be useful when leads need to be spliced and protected with heat-shrinktubing.
Complete kits
For the dedicated strain gauge installer, completekits are available that contain all the tools andaccessories required in a variety of situations.These will generally also include adhesives, lead-wires, protective coatings and a high-quality soldering station.
Professional assistance
Strain gauge installation can be daunting butthere are many resources available to assist.The costs to set up strain gauge installationscan be significant and it may not be economicfor only one or two installations. Therefore,there are many professional companies whocan offer the full service, from recommendingthe products and gauge arrangement to provid-ing a complete service from specification to aworking product.
The installation of strain gauges 63
If installation is part of a continuous pro-gramme, there are training courses provided byboth strain gauge suppliers and independentorganisations. The British Society for StrainMeasurement (BSSM) provides programmes aswell as a certification scheme that gives evidenceof competence in strain gauging. AdditionallyBSSM provide a s handbook showing many com-mon types of installation (Pople, 1979) and aCode of Practice booklet detailing standard pro-cedures for ensuring quality and consistency(British Society for Strain Measurement, 1992).
References
British Society for Strain Measurement (1992). Code ofPractice for the Installation of Electrical ResistanceStrain Gauges CP1. Newcastle upon Tyne, UK:British Society for Strain Measurement.
Pople J (1979). BSSM Strain Measurement Reference Book,Newcastle upon Tyne, UK: British Society for StrainMeasurement.
Further reading
Adlington J, Mordan G, Chittey A (1996). ResistanceStrain Gauge Load Cells. London: EAL Publications.
Vishay Measurements Group. Application Note B-129–8:Surface Preparation for Strain Gage Bonding.Basingstoke, UK: Vishay Measurements Group.
Vishay Measurements Group. Application Note TT-603:The Proper Use Of Bondable Terminals In Strain GageApplications. Vishay Measurements Group.
Vishay Measurements Group. Application Note TT-608:Techniques for Attaching Leadwires to Unbonded StrainGages. Basingstoke, UK: Vishay MeasurementsGroup.
Vishay Measurements Group. Application Note TT-609:Strain Gage Soldering Techniques. Basingstoke, UK:Vishay Measurements Group.
Vishay Measurements Group. Application Note TT-610:Strain Gage Clamping Techniques. Basingstoke, UK:Vishay Measurements Group.
Vishay Measurements Group. Application Note VMM-15: Quality Control of Strain Gage Installations.Basingstoke, UK: Vishay Measurements Group.
Vishay Measurements Group. Instruction Bulletin B-127–14: Strain Gage Installations with M-Bond 200Adhesive. Basingstoke, UK: Vishay MeasurementsGroup.
Vishay Measurements Group. Instruction Bulletin B-130:Strain Gage Installations with M-Bond 43–B, 600 and610 Adhesive Systems. Basingstoke, UK: VishayMeasurements Group.
Vishay Measurements Group. Instruction Bulletin B-137:Strain Gage Applications with M-Bond AE-10, AE-15and GA-2 Adhesive Systems. Basingstoke, UK: VishayMeasurements Group.
Vishay Measurements Group. Strain Gage BasedTransducers: Their Construction and Design.Basingstoke, UK: Vishay Measurements Group.
64 Tablet and capsule machine instrumentation
Introduction
Displacement, in the context of tablet pressinstrumentation, generally involves such actionsas the movement of a punch into a die or therotation of a machine component. It may, there-fore, be a linear movement of a few millimetresor perhaps an angular movement of somedegrees. Such movements as these can bemeasured quite accurately in a variety of wayswith commercially available transducers. Thereare, in fact, many types of displacement trans-ducer on the commercial market, and it is poss-ible to classify them in a variety of ways, but forthe purposes of this chapter they have beengrouped into those that generate an analoguesignal and those that give a direct digital output.
In general, those in the first group provide asignal that is directly related to the position inspace of some movable sensing element. Theoutput may be described as ‘absolute’ in thesense that it uniquely defines that position, evenif power to the device is interrupted and thenreconnected. The conventional sliding poten-tiometer, used as a volume control in amplifiersystems, has just such a characteristic.
In the second group are those transducers thatgenerate a direct digital output rather than ananalogue voltage. Some of these, like the ana-logue devices in the previous group, also provideabsolute positional information. However, thesimpler digital devices do not do this but onlygive incremental signals as they are moved. Thuseach pulse of the output signal represents a givendisplacement of the sensing element from itsprevious position. Although the incrementaltype of digital transducer is generally much less
expensive than the absolute type, it must be re-set whenever its power supply has been interrupted.
Both these forms of transducer measure theposition of some sensing element in relation to aparticular reference point. However, there is analternative possibility of inferring the sensorposition indirectly, and that is from continuousmeasurements of its velocity or acceleration dur-ing a known time. Some dynamic measurementsof this kind have been reported in the generalliterature of tablet compression studies. Forexample, laser Doppler velocimetry was used byDepraetère et al. (1978) to study punch move-ment in a tablet press. Punch travel itself tendsto be limited by the mechanics of the press torelatively short distances, seldom exceeding50 mm. Transducers for that particular rangewere reviewed in 1979 by Garratt. In practice,the range of particular interest for compressionstudies is likely to be even more limited and willonly involve those few millimetres in which thepunches are in contact with the powder bed.Short-range, or micro-displacement transducerswere discussed in 1972 by Sydenham in a paperthat contains much useful information.
Displacement transducers with analogueoutput
The linear variable-differential transformer
The linear variable-differential transformer(LVDT) is probably the most widely used form ofdisplacement transducer with tablet presses. As
4The measurement of displacement
Peter Ridgway Watt
65

the name implies, the LVDT is a transformer. Itis, however, one of special construction, with astraight tubular body that carries three sets ofinductive windings (Figure 4.1). The windingscomprise one central primary coil and two sym-metrically disposed secondary coils, all in fixedpositions. Along the axis of the system, withinthe tubular body, runs a guide rod that holds ashort ferromagnetic core. It is the position of thismovable core relative to the secondary windingsthat determines the variable differential fromwhich the LVDT derives its name. When the coreis precisely central with reference to the primarywinding, the inductive coupling from that pri-mary to the two secondaries is balanced. If theprimary winding is energised by an AC wave-form of a suitable voltage and frequency, thevoltages generated in the two secondaries will becorrespondingly equal and can be balancedagainst each other in a detector circuit.
The output signal itself may be considered asbeing of essentially infinite resolution and is
likely to have a value of around 5 V rms (rootmean squared) at the full-scale displacement ofthe core. The sensitivity and accuracy of the sys-tem as a whole must, nevertheless, depend onthe external means used to detect that outputsignal. Using a modern digital AC carrier ampli-fier, it should be possible to achieve a sensi-tivity corresponding to better than 1 ppm of thetotal full-scale displacement. An analysis of theinductive sensor has been given by Hugill(1982).
The relation between signal and displacementis reasonably linear over the rated displacementrange of the transducer, with an increasing non-linearity at each end of the scale. It is, therefore,important to check that the LVDT is installedcorrectly, with its mechanical and electrical zeropoints in reasonable coincidence. The maximumdeparture from true linearity within the specifiedrange of movement depends on the form, thesize and the cost of the device, but it is usuallybetween 0.1% and 0.5%.
66 Tablet and capsule machine instrumentation
Actuator
Armature
OscillatorAC bridge
Figure 4.1 The linear variable-differential transformer (LVDT). The mechanism comprises three coaxial coils with a mov-able ferromagnetic core. The position of the core determines the distribution of the signal between the two outer coils.

Zero setting
In principle, there will be zero output when thearmature is central, and the system preciselysymmetrical. In practice, it is possible to adjustthe zero point by offsetting the associated detec-tor and amplifier, and this has the advantageof making it unnecessary to position themechanical components with absolute accuracy.Sydenham (1972) has pointed out that a devicecapable of sensing to 0.1 nm need only be set tothe nearest 20 lm.
Good-quality LVDTs with a range of a few mil-limetres are expected to have a measuringrepeatability of the order 0.1 lm, and it is import-ant to realise that repeatability may well bemore critical than linearity. In modern systems,a departure from strict linearity can be correctedby the use of appropriate computing routines.Many articles on this can be found in the litera-ture (e.g. Bolk, 1985). Lack of repeatability, how-ever, cannot be treated in the same way. Itrequires a programme of successive measure-ments that can then be subjected to statisticalanalysis.
Thermal effects
Changes in temperature inevitably introduceerrors into LVDT measurements, especially if thesymmetry of the device is affected, for exampleby uneven expansion. The thermal drift of the zero point is likely to be of the order of0.01% of total stroke for every degree centigrade.At the same time, there may be a change in sen-sitivity of about the same general magnitude.Although these error figures do not appear to beparticularly large, it is worth remembering thatthe associated amplifiers, power supplies andmeasuring circuitry may themselves also have anelement of temperature dependence.
Since the moving core that constitutes thesensing element does not need to be in physicalcontact with any part of the transducer body, themovement itself does not generate frictionalheat. Nor does it absorb power from the mech-anism being investigated. However, it is useful to remember that the coils themselves willinevitably dissipate some heat from the ACinput, and that thermal expansion of the central
armature rod could possibly introduce an errorunless all parts of the system have reachedconstant temperature. When accurate measure-ments are to be made with an LVDT, it is, there-fore, good practice to ensure that the wholemeasuring system is switched on well in advanceand allowed to reach a steady equilibriumtemperature.
Gauging transducers
There are some varieties of LVDT in which thecore runs on linear bearings within the trans-ducer body and is spring loaded to one end of itsrange of movement. These are called gaugingtransducers and are widely used in manufactur-ing practice to check the dimensions of mechan-ical components. As a rule, gauging transducersoperate over a relatively short range of displace-ments, mostly from 0.5 to 5.0 mm. By compari-son, the normal free-armature forms of LVDTmay extend to displacements of 600 mm.Gauging transducers are designed for operationin hostile environments and are usuallyequipped with elastomeric gaiter seals thatexclude dust or liquid contaminants.
If negligible operating forces, coupled withvery high operating rates, are needed, then thefree-armature transducers would be preferable.In case of doubt, it would be advisable to checkwith the transducer manufacturer.
Dimensions
When an LVDT is to be installed in some pieceof experimental equipment, it is naturallyimportant to have information about its lengthand diameter so that it can be allocated ad-equate space. As a very rough rule, transducersin the displacement range of a few centimetrestend to have a body length that is perhaps threeor four times their measuring range, althoughthe ratio of measuring length to body length isgenerally less for gauging transducers than forthe free-armature types.
The diameters of these devices have tradition-ally been derived from Imperial sizes, and mostof the free-armature models have been either of0.75 inch (19 mm) or 1.0 inch (25.4 mm) gauge.The gauging transducers are often smaller, and
The measurement of displacement 67
here the most common size is 0.375 inches(9.5 mm).
There are, naturally, many exceptions to thesesimple rules; not surprisingly, the lower limits ofdiameter have been extended over the years. Theminiature series transducers offered by Sigma,for example, are only 6.0 mm in diameter; how-ever, at this size the measuring range is restrictedto 1.0 mm. Some even smaller versions havebeen produced, although is it unlikely that theywould be required for use with a relatively largemachine such as a tablet press. Units in the‘XS-B’ series from Schaevitz Engineering, forexample, have a coil assembly with an outsidediameter of only 4.76 mm: the overall lengthof these very small LVDTs is from 10.16 to38.1 mm, depending on the measuring range,while the maximum measurable displacementis �6.35 mm.
Excitation
Since the LVDT is a transformer, it requires anoscillator circuit that will provide an alternatingvoltage to excite the primary winding. In gen-eral, the excitation signal has a frequency withinthe range 1–50 kHz – although exceptions exist –and is only a few volts. Ideally, the optimum fre-quency for the signal is one at which there isnegligible phase shift between the waveforms inthe primary and the secondary windings. Underthese conditions, the system is most stable totemperature changes. A commonly used value isaround 5 kHz; the power level is small and isrepresented by some 3–10 V at approximately10–35 mA.
Demodulation
Apart from the oscillator, the LVDT also needs tohave a demodulator unit that will accuratelyturn the AC output into DC levels for display oranalysis. Certain types of LVDT have both theoscillator and the demodulator built directlyinto their housing, giving a very compactconstruction. They provide a DC output from asuitable DC input and, therefore, have thedescription of ‘DC–DC’ transducers. These self-contained DC–DC transducers are undoubtedlyconvenient and may be of good stability and
sensitivity. They are inevitably less adaptable tothe miniature format, however, and so are notusually offered in diameters below the industrystandard of 19 mm. If space is at a premium, itmay be necessary to use a conventional AC–ACtransducer with an external oscillator anddemodulator.
Virtually all the LVDTs with diameters of lessthan 19 mm are of the AC–AC pattern. Apartfrom the sub-miniature devices mentionedabove, both the spring-loaded, sealed, gaugingtransducers and the free-armature versions areavailable with body diameters of 9.5 mm or less.The SM series from Sangamo Schlumberger, forexample, are of this diameter: the length of theSM1 body is 15 mm, and the moving coreweighs only 200 mg. At this size, the total dis-placement range is �1.0 mm, while the linearitymay be either 0.3% or 0.5% of the total stroke,depending on the grade of the device.
The linear inductive displacementtransducer
We have seen that the classical LVDT has threesets of windings; one primary and two sec-ondary. It is however, possible to omit the cen-tral winding so that only the two symmetricalsecondaries remain. The physical disposition ofthe components is then otherwise almost exactlyas in the conventional LVDT, but the mode ofoperation is slightly different. In this instance,the two windings form adjacent arms of an ACmeasuring bridge, which is energised from anexternal oscillator and may be balanced byadjustment of the other two bridge arms in thenormal way. After the bridge has been balanced,any change in the position of the iron core willde-tune the circuit, generating an output signalthat is proportional to the displacement of thecore. Some commercial transducers of this typehave trimming controls with which their sensi-tivity can be adjusted. In effect, these form a sec-ond movable core that alters the inductance ofwindings in series with the main measuringcoils. If an installation contains several suchtransducers, the adjustment facility can be usedto set each one to the same level of sensitivity. Insome instances, this two-coil construction has
68 Tablet and capsule machine instrumentation

given an improved operating range for a givenbody length.
A useful discussion of the different approachesto inductive transducer design may be found inthe 1975 textbook by Neubert.
The variable turns-ratio transformer
A low-cost device for displacement measurementhas been described by Dann (1984). In this,single-layer coils of copper wire were wound onto rigid plastics tubes of different diameters, sothat one coil could be moved axially within theother. The inner coil, used as a primary, wasexcited with a sinusoidal signal at a frequency of1 kHz, while the resultant signal was measuredfrom the outer coil with an AC voltmeter. It wasfound that the output was linearly related to theposition of the inner coil to within better than1%. Clearly, this does not approach the per-formance of a standard commercial transducer,but the interest here lay in the very high pro-portion of useful range to body length, wherethe device described had a length of 1080 mmand could apparently give an output atdisplacements up to 1000 mm.
The linear variable capacitor
In the LVDT and its half-bridge variant, move-ment of a ferromagnetic core alters the relativeinductance of windings along a non-magneticformer. The same general principle can beextended, by appropriate constructional modifi-cations, to provide changes in other electricalproperties. For example, if cylindrical electrodesare used instead of wire-wound coils, the axialdisplacement of a third, smaller electrode canbe used to vary the relative capacitances of thefirst two electrodes in a reproducible manner.Sensors using this principle were compared withinductive devices in a review by Hugill (1982).
Variable capacitance transducers are commer-cially available. One type, from AutomaticSystems Laboratories Ltd, is sold under the name‘Super-linear variable capacitor’ or SLVC. Likethe LVDT, the SLVC is of infinite resolution. Itcan also be capable of an accuracy (defined in
this case as the maximum departure from anideal straight-line calibration) of better than�0.00065 mm. The system non-linearity, takingboth transducer and signal conditioner together,may be better than 0.04% of full scale for thebest grade of SLVC.
The physical size of these transducers is some-what less than that of their inductive counter-parts, and the ratio of working range to bodylength may also be favourable. For example,the ASL model 3074 has a quoted range of0–100 mm for a body length of only 220 mm.
The stability and general accuracy of SLVCs isvery good indeed in most applications. A tend-ency to seize in use was reported by Clabburn(1983), but this was in a specialised field wherethe transducer had been required to follow thedeflection of some explosively deformed plates.There are few devices in this field that willrespond reliably at such speeds and, of course,that response would not usually be required intablet compression studies.
A general account of the development ofcapacitive measuring devices for displacementup to some 10�2 mm was given by Jones andRichards (1973). The ranges involved werequite short in terms of tablet punch move-ment, but the article itself makes interestingreading, showing how sensitive capacitancetransducers can be, since some of the devicesdescribed were stated to detect movements ofless than 10�10 mm.
The linear magnetoresistive transducer
There are some materials that, in the presence ofa magnetic field, exhibit appreciable changes ofresistivity: this is the so-called ‘magnetoresistive’effect. The effect can be maximised in certainsemiconductors by appropriate doping. Forexample, indium antimonide, doped withtellurium, shows the effect quite well. Theincrease in resistance, produced by the presenceof the magnetic field, is proportional to thesquare of the field intensity.
We have discussed above how the LVDT andthe SLVC can be constructed as semifrictionlesssystems. The magnetoresistive effect can beused as the basis of an analogous form of
The measurement of displacement 69

displacement transducer, in which electricalresistance is the variable quantity. In thisdevice, two similar resistors of semiconductormaterial form adjacent arms of a Wheatstonebridge. They are mounted in line and are sym-metrically within the magnetic field of a smallannular magnet attached to the moving plungerof the transducer. If the plunger is displaced,the magnetic field becomes correspondinglyasymmetrical; the two magnetoresistive ele-ments change in resistance, and the bridge isunbalanced.
Linear transducers operating on this principleare commercially available: the Blue Pot™ range,from Midori Inc., for example, covers displace-ment ranges from 0.60 to 8 mm. A typical mid-range unit, the LP-5 UYW, has an output ofapproximately 1.0 V per 1.0 mm displacement,with a linearity within 1% of full scale. The maxi-mum sticking friction is approximately 0.06 N.
In general, most of the devices that depend onmagnetic field effects tend to show rather non-linear characteristics. However, they can be bothsensitive and repeatable, so their output signalscan be linearised in the data handling circuitry.
The Hall effect transducer
We have seen that certain transducers, such asthe LVDT, require no physical contact betweentheir fixed components and their moving ele-ment. A transducer of this type can be regardedas being essentially frictionless, provided thatthere is no ingress of particulate matter betweenthe moving parts. However, since the internalclearances are often very small, maintenance ofthe original frictionless state requires much careand attention to detail.
Some transducers are much less demanding intheir environmental requirements, since theyoperate remotely and have no moving parts tobe affected by dust, grit or moisture. One suchdevice is the Hall effect transducer, which hasfound various industrial applications in recentyears. The Hall effect is produced when a current-carrying conductor passes through a magneticfield. Lorentz forces deflect the charge carriersin a direction at right angles to both the currentand the magnetic field vectors, and a voltagedevelops across the width of the conductor(Figure 4.2). In commercial devices, the con-
70 Tablet and capsule machine instrumentation
Current flow
+N
Magnetic field
As current flows, a voltagedevelops across oppositefaces of the material.
Semiconductor−
SMagnetic field
Figure 4.2 The Hall effect. In the presence of a suitable magnetic field, a current passing in one direction generating avoltage signal in a transverse direction.

ductor itself is usually made from a suitablydoped semiconductor material, such as indiumantimonide, in which the voltage output is aslarge as possible.
In order to utilise the Hall effect for displace-ment measurement, it is necessary to have ameans whereby relative movement between twocomponents gives a reproducible change in mag-netic field at the site of the conducting element.This can be achieved by using a permanent mag-net on one component, and a soft iron armatureon another, provided that relatively short dis-tances are involved. If a magnet is attached to arotating component in a machine, a non-contactHall effect switch can be used to generate a pulseat each revolution to establish the rotationalspeed.
The linear variable resistor
If a material of uniform resistivity is formed intoa straight track, the addition of a sliding contactproduces a potential divider, or potentiometer.Linear potentiometers have been known for verymany years and can be of low cost; however, theearly models were not suitable for use as accuratedisplacement-measuring devices on account oftheir poor electrical and mechanical properties.The resistive element was either in the form of awire winding – which limited the available res-olution of the system – or was a carbon compo-sition, which was both electrically noisy andphysically abrasive.
The development of improved resistive materi-als has made it possible for linear potentiometersto be produced specifically for displacementmeasurement. Usually, these devices have ele-ments made from conductive plastics on aninsulated backing such as Kapton polyimidefilm. The sliding contacts are of precious metaland are divided into several flexible sections inorder to ensure a sound, continuous electricalconnection. The toughness and grain-free charac-ter of the conductive plastics film are probablyits main advantages over the earlier compositionelements, since its electrical properties often stilldepend on the use of carbon.
The conductive plastics film provides infiniteresolution; additionally, it has a long working
life and does not damage the sliding contacts.Some devices of this construction are rated forup to 100 million operating cycles, which rep-resents a comparatively long time in researchand development, although a large productiontablet press could run through this in 100 h ofoperation.
The temperature coefficient of resistivity of aconductive plastics film element is in theregion of �400 ppm ºC�1. That of a moderncarbon composition resistor is approximately�1200 ppm ºC�1, while good-quality resistancewire materials have a much lower value, whichmay be as little as �20 ppm ºC�1; a typicalcermet resistor would have an average value of�100 ppm ºC�1. Thermal variations of this pre-dictable form may not affect the function of apotentiometer that is energised at constantvoltage, providing that the temperature changescausing them are uniform over the resistiveelement. Localised changes would naturallyintroduce considerable errors into the inferredposition of the slider.
Linear potentiometers are available in anextensive range of sizes: the electrical travel maybe as little as a few millimetres or as much as2.0 m, and even with the larger potentiometers,the claimed repeatability can be better than0.0125 mm. The acceptable stroke velocity variesfrom make to make, but it is usually of the orderof 1.0 m s�1; special models can be supplied foroperation at approximately 3.0 m s�1.
On these various grounds, the resistive deviceswould appear to be closely competitive with theLVDT and the SLVC. However, there is an import-ant characteristic of the resistive potentiometersthat must be taken into account during thechoice of a displacement transducer: each ofthem requires a substantial axial force to movethe shaft that carries the sliding contact. Apartfrom a few of the smaller units, most linearmotion potentiometers are rated at 4.0 to 7.0 N.Although a force of this magnitude wouldscarcely affect the operation of a heavy tabletpress, it will most certainly produce frictionalheat. If the transducer is to be used for quasi-static measurements, the generation of frictionalheat can probably be ignored. However, if it isintended that the device should be a permanentfeature of a press used at production rates, then
The measurement of displacement 71

there is much to be said for the choice of aninherently frictionless transducer such as thefree-armature LVDT.
Apart from the generation of unwanted fric-tional heat, there is a second problem for anysliding transducer that is permanently con-nected to a cyclically moving component suchas a tablet punch: this is the repetitive nature ofthe movement. The production of a batch oftablets, even on an experimental basis, involvesthe punch in successive movements over whatis, in effect, exactly the same range of travel foreach compression. If the transducer is of such atype that there is physical contact between theactuator and the stationary components, thenthe track wear will be at its worst under theseconditions.
The strain gauge conversion transducer
There is a second type of linear transducer inwhich the stationary and the moving com-ponents are in contact with one another, but inthis instance frictional losses are kept to anacceptable minimum by the use of precisionball races. The housing of this transducer con-tains a pair of beams, cantilevered from one endof the system. The beams are provided with afour-arm bridge, comprising four foil gauges of350 � nominal value. Down the axis of thedevice runs an actuator shaft that carries pre-
cision ball races in contact with the beamsurfaces (Figure 4.3).
When the actuator moves, the ball races causesmall deflections of the twin beams, so unbal-ancing the bridge and giving the familiar electri-cal output. Accuracy of these transducers isclaimed to be good; they are commercially avail-able with a non-linearity of �0.05% of full scale,and a repeatability of �0.02 of full scale. Onceagain, this is a system with infinite resolution.The rated effect of temperature changes on zeroand span is typically �0.005% ºC�1.
One useful consideration in relation to the useof the strain gauge conversion transducer is thatit requires exactly the same external electronics –power supplies, bridge circuitry, and so on – asdo the strain gauges used for force measurement.
The remote inductive transducer
Linear transducers such as the LVDT can be bothsensitive and accurate, and they have beeninvaluable in fundamental research under lab-oratory conditions. However, if it becomesnecessary to use displacement transducers in thepresence of dust, grit or corrosive chemicals,there may well be problems in ensuring that themoving components continue to slide freely andthat accuracy is maintained.
Some commercial transducers have no movingcomponents and may be sealed in stainless steel
72 Tablet and capsule machine instrumentation
Strain-gauged beam
Strain-gauged beam
Ball races
Plunger
Figure 4.3 The strain gauge conversion transducer. Movement of the plunger causes controlled bending in one or morethin elastic beams. The amount of bending is monitored by strain gauges on the beams.

shells, and so these are well adapted to operationin hostile environments. One such device is theremote inductive proximity transducer. Thisusually comprises a resin-encapsulated coil as-sembly within a chemical-resistant outer case. Itmay be either an inductive half-bridge with twocoils, or a quarter-bridge with a single coil, and itwill be powered from an oscillator at a frequencyin the range 5–150 kHz. The presence of an elec-trically conductive metal surface near to the coilassembly affects the impedance of one or bothcoils and gives rise to an output signal. In someversions of this device, the signal results from animbalance between two inductances, while inthe single-coil units, it is the generation of eddycurrents in the metal target that provides thenecessary variation. Other associated designsmay operate on the principle of magnetic reluc-tance, in which displacement of a ferromagneticplate changes the air gap in a high-permeabilitymagnetic circuit. The principles involved inthese different forms have been discussed byHugill (1982).
Inductive transducers of this kind have in-herently non-linear characteristics by comparisonwith laboratory devices such as the LVDT.However, after the signal has been demodulated,linearised and amplified, the final output signalcan be entirely satisfactory. Taking, as anexample the ‘multi NCDT’ system offered byMicro-Epsilon Messtechnik, linearity is betterthan 0.2%, temperature stability is better than0.02% ºC�1 and, since there are no moving parts,there is a frequency response up to 100 kHz.Sensors from this manufacturer are available formeasuring ranges that extend in 12 models,from 0.5 to 80 mm: the smallest units of thesehave a body diameter of only 2.0 mm. Units ofthis type are completely unaffected by dust, oil,water and general dirt.
The remote capacitive transducer
While the inductive proximity detector measureschanges in the electromagnetic properties of oneor more coils, the capacitive transducer monitorschanges in the capacitance of an electrode sys-tem. The two devices perform more or less simi-lar functions, and both are suitable for use in
hostile environments. There is one notable dif-ference, however; whereas the inductive devicesdepend on the presence of conductive metal tar-gets, the capacitive device is affected by a widerrange of materials including glass, ceramics,water and many plastics. It is, of course, necess-ary to shield the electrode system against straycapacitances, to check the physical condition ofthe electrode surfaces from time to time and, asbefore, to linearise the output signal. Apart fromthese points, the capacitance transducers can bevery sensitive over fairly small measuring ranges.Industrially, both the inductive and the capaci-tive systems find their widest use in remoteswitching rather that in measurement, whentheir inherent non-linearities can then beignored.
The magnetostrictive transducer
The displacement transducers that we have con-sidered so far have generally operated over arestricted range of movement. Indeed, for force–displacement measurements within a tabletpress, a maximum of 8–10 mm would probablybe more than adequate. However, outside the dieitself there could be movements of much greateramplitude that, at some time, might need aconvenient means of measurement.
These comments are by way of introduction toan interesting form of displacement transducerwith a particularly long measuring range: themagnetostrictive device.
Just as the presence of a magnetic field altersthe electrical resistance of certain materials, so itmay affect their physical properties. If a voltageis applied for a very short time across the ends ofa ferromagnetic conductor, a pulse of currentflows along the conductor. In the presence of alocalised magnetic field around part of the con-ductor, the current pulse gives rise to mechanicalstress as it passes the field boundary, and acorresponding shock wave passes along theconductor from the boundary region at sonicspeed.
In a practical embodiment of these consider-ations (Figure 4.4), the conducting element is alength of nickel–iron wire, which exhibits themagnetostrictive effect well. The alloy wire is
The measurement of displacement 73
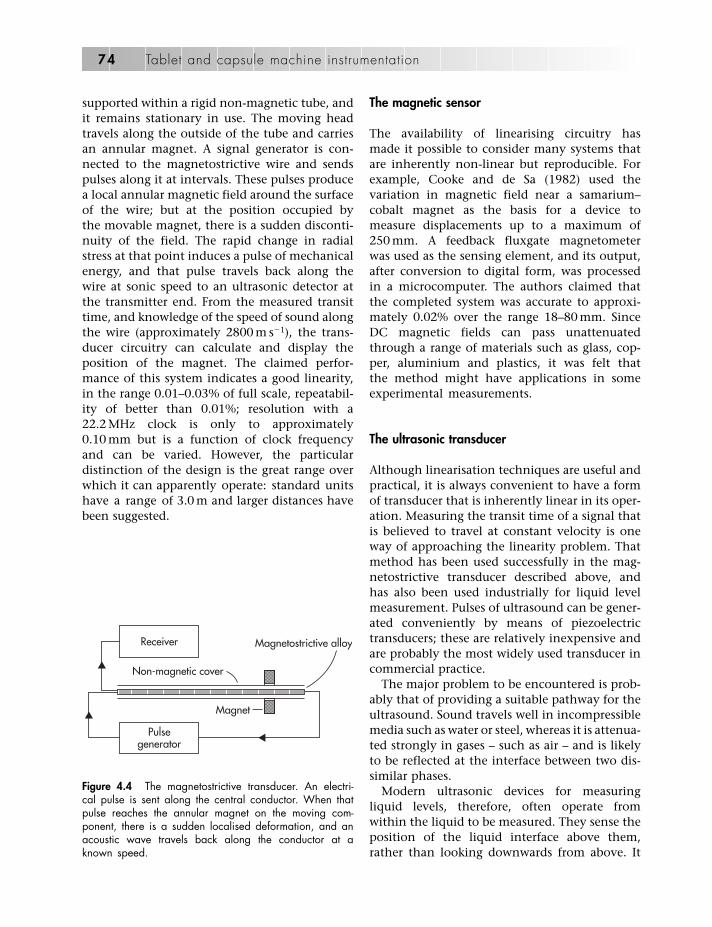
supported within a rigid non-magnetic tube, andit remains stationary in use. The moving headtravels along the outside of the tube and carriesan annular magnet. A signal generator is con-nected to the magnetostrictive wire and sendspulses along it at intervals. These pulses producea local annular magnetic field around the surfaceof the wire; but at the position occupied by the movable magnet, there is a sudden disconti-nuity of the field. The rapid change in radialstress at that point induces a pulse of mechanicalenergy, and that pulse travels back along thewire at sonic speed to an ultrasonic detector atthe transmitter end. From the measured transittime, and knowledge of the speed of sound alongthe wire (approximately 2800 m s�1), the trans-ducer circuitry can calculate and display theposition of the magnet. The claimed perfor-mance of this system indicates a good linearity,in the range 0.01–0.03% of full scale, repeatabil-ity of better than 0.01%; resolution with a22.2 MHz clock is only to approximately0.10 mm but is a function of clock frequencyand can be varied. However, the particulardistinction of the design is the great range overwhich it can apparently operate: standard unitshave a range of 3.0 m and larger distances havebeen suggested.
The magnetic sensor
The availability of linearising circuitry hasmade it possible to consider many systems thatare inherently non-linear but reproducible. Forexample, Cooke and de Sa (1982) used thevariation in magnetic field near a samarium–cobalt magnet as the basis for a device tomeasure displacements up to a maximum of250 mm. A feedback fluxgate magnetometerwas used as the sensing element, and its output,after conversion to digital form, was processedin a microcomputer. The authors claimed thatthe completed system was accurate to approxi-mately 0.02% over the range 18–80 mm. SinceDC magnetic fields can pass unattenuatedthrough a range of materials such as glass, cop-per, aluminium and plastics, it was felt thatthe method might have applications in someexperimental measurements.
The ultrasonic transducer
Although linearisation techniques are useful andpractical, it is always convenient to have a formof transducer that is inherently linear in its oper-ation. Measuring the transit time of a signal thatis believed to travel at constant velocity is oneway of approaching the linearity problem. Thatmethod has been used successfully in the mag-netostrictive transducer described above, andhas also been used industrially for liquid levelmeasurement. Pulses of ultrasound can be gener-ated conveniently by means of piezoelectrictransducers; these are relatively inexpensive andare probably the most widely used transducer incommercial practice.
The major problem to be encountered is prob-ably that of providing a suitable pathway for theultrasound. Sound travels well in incompressiblemedia such as water or steel, whereas it is attenua-ted strongly in gases – such as air – and is likelyto be reflected at the interface between two dis-similar phases.
Modern ultrasonic devices for measuringliquid levels, therefore, often operate fromwithin the liquid to be measured. They sense theposition of the liquid interface above them,rather than looking downwards from above. It
74 Tablet and capsule machine instrumentation
Magnetostrictive alloy
Magnet
Non-magnetic cover
Receiver
Pulsegenerator
Figure 4.4 The magnetostrictive transducer. An electri-cal pulse is sent along the central conductor. When thatpulse reaches the annular magnet on the moving com-ponent, there is a sudden localised deformation, and anacoustic wave travels back along the conductor at aknown speed.

might seem possible to fit such a level sensor ina tube, partly filled with liquid, and to attach anarrow plunger to the moving component inorder to produce an identifiable echo from itsend. However, the currents induced in the liquiditself by the vertical movement of the rod wouldcertainly affect the signal.
Ultrasonic ‘sonar’ methods can, in fact, beused in air, provided that the distances involvedare small (a few tens of metres). The practicallimit is the unknown air temperature, whichchanges the speed of sound and leads to poten-tial errors. Otherwise, ultrasonics will travel over30 m and back. The ultrasonic ‘tape measure’ isan example of the use of this method.
The principles and methods involved aredescribed in some detail by Crecraft (1983).
The fibre optic transducer
Over the years, there has been a progressiveincrease in electrical noise levels, both withinindustrial premises and also within the electricalmain supplies themselves. As a result of this,microprocessor-based systems tend to be at riskfrom spurious signals or high-voltage ‘spikes’ inthe supply lines. Any system that can help toavoid these effects is likely to receive carefulattention, and at present it seems that opticalmeasurements hold out much promise.
There appear to be many areas in which opti-cal transducers could replace the conventional
devices that we have been considering in thischapter. One experimental device uses a com-posite fibre optic bundle, formed into a ‘Y’ shape.If the light is sent along one arm of the Y, it willemerge at the junction point; but if there is areflecting surface close to the end face, a propor-tion of that light will return and travel along theother arm, where it can be detected with a suit-able photosensitive element. Under appropriateconditions, the intensity of the reflected light canbe used as a measure of the distance between thereflector and the fibre optic surface (Figure 4.5).
It is understood that this principle has beenused in the construction of a fibre optic trans-ducer with better resolution than that of anLVDT; but, as yet, such devices appear to havebeen made only as research tools. A paper byGiles et al. (1985) described a technique for bal-ancing the losses inherent in the fibre optic leadsin any intensity-based remote optical sensor,making use of an optical equivalent of theWheatstone bridge.
In another design of optical transducer, thefixed and the moving component are rep-resented by two toothed blocks that are clampedon either side of a fibre optic cable. If the blocksare brought towards each other, they deform theoptical fibre from its original straight configur-ation into a more or less sinusoidal form. Thishas the effect of inducing transmission lossesalong the cable at points where the radius ofcurvature is small, and the measured loss can beused to infer the distance between the blocks.
The measurement of displacement 75
Fibre optic 'Y' bundleHousingLinear bearing
PlungerDisk with reflective surface
Detector
Light source
Figure 4.5 The fibre optic reflective transducer. Light is transmitted along one arm of a fibre optic ‘Y’ piece to a reflect-ing surface near the other end. A varying proportion of the light returns along the fibre bundle to a detector on the otherarm, and the position of the reflector can be measured by measurement of the detector output.

An interesting discussion on the basic prin-ciples of fibre optic sensing is to be found inCulshaw (1983) and is to be recommended forgeneral reading on this topic.
The optical wedge
Optical wedges are probably among the earliestforms of non-contact displacement transducer,having long been applied to the movement ofisolated muscle strips in physiological labora-tories. The moving component is usually a smallglass plate whose optical density varies fromone end to the other in a near-linear fashion;the stationary component is a fork sensor, witha light source and detector positioned on eachside of the narrow gap through which the platemoves. Once again, this represents a frictionlesssystem with good tolerance to misalignment.However, some care must be taken to ensurethat the source and detector are not subjectedto temperature variations, since these are likelyto produce drift and instability in a single-beamarrangement of this kind.
If improved stability is essential, this can beachieved by the use of a differential absorptiontechnique. In effect, the transmission of thewedge is measured at two wavelengths where itsabsorption is substantially different. The tworeadings provide the effect of a reference chan-nel, thereby eliminating many of the fluctu-ations inherent in a single-beam system. Adisplacement transducer using this principle hasbeen described by Theocharous (1985). Operatedover the range 0–2.6 mm, the transducer had ameasured resolution of �2.9 lm.
The optical potentiometer
Devices such as the optical wedge are usefuladditions to the range of frictionless displace-ment transducers and can be run at quite highspeeds without the generation of frictional heat.However, the moving components still haveappreciable inertia.
For some purposes, it may be essential tohave a minimum inertial mass in the movingparts of the transducer, and one approach to
this problem is through the light-sensitivepotentiometer. This has two parallel elements,of which one is resistive and one is conduct-ing, the space between the two being occupiedby a photoconductive material. A voltage isapplied across the ends of the resistiveelement. If the two elements are bridged by anarrow beam of light, the resistance of thatmaterial is locally reduced and the image ofthe light beam acts as a conducting but fric-tionless slider. The electrical potential of theconducting element can thus be varied withoutphysical contact. Surface sweep speeds up toabout 0.5 m s�1 may be used with this particu-lar device, and it is claimed it can resolvemovements down to 1.0 lm.
Displacement transducers with a digitaloutput
The optical grating transducer
Most of the transducers with analogue outputhave essentially infinite resolution; as a resulttheir smallest resolvable increment is as muchdependent on the signal-conditioning systemsas on the transducer itself. Their output will,moreover, always be subject to some degree ofamplifier drift.
Changing to digital operation provides atrade-off between sensitivity and stability. Thesmallest detectable increment now depends onthe transducer and is almost independent of theassociated electronics. Of course, the outputfrom analogue transducers can always be dis-played digitally through the use of an analogue-to-digital converter, but it is not actuallyproduced in that way.
Once generated, the digital signal is in theform of pulses; they may represent a simplesquare wave, where the voltage is either ‘on’ or‘off’, or alternatively, the signal may changebetween two voltage levels. In either case, thevoltages employed can be chosen to be readilydistinguishable from the ambient electricalnoise. Digital transducers, as a group, have beenreviewed by Woolvet (1982). They can takemany different forms. By way of an example, we
76 Tablet and capsule machine instrumentation
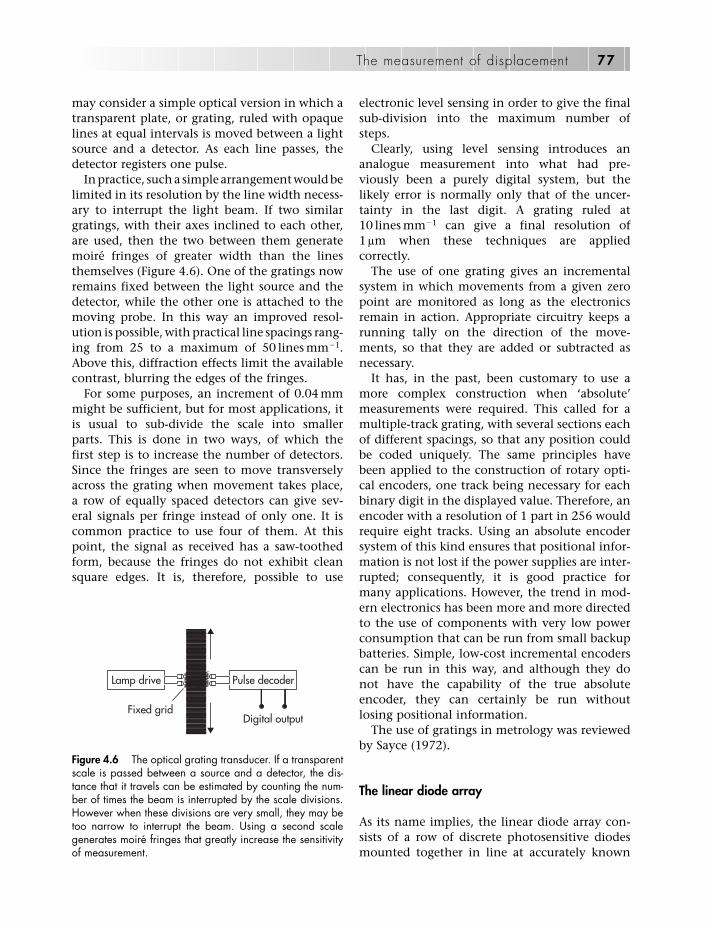
may consider a simple optical version in which atransparent plate, or grating, ruled with opaquelines at equal intervals is moved between a lightsource and a detector. As each line passes, thedetector registers one pulse.
In practice, such a simple arrangement would belimited in its resolution by the line width necess-ary to interrupt the light beam. If two similargratings, with their axes inclined to each other,are used, then the two between them generatemoiré fringes of greater width than the linesthemselves (Figure 4.6). One of the gratings nowremains fixed between the light source and thedetector, while the other one is attached to themoving probe. In this way an improved resol-ution is possible, with practical line spacings rang-ing from 25 to a maximum of 50 lines mm�1.Above this, diffraction effects limit the availablecontrast, blurring the edges of the fringes.
For some purposes, an increment of 0.04 mmmight be sufficient, but for most applications, itis usual to sub-divide the scale into smallerparts. This is done in two ways, of which thefirst step is to increase the number of detectors.Since the fringes are seen to move transverselyacross the grating when movement takes place,a row of equally spaced detectors can give sev-eral signals per fringe instead of only one. It iscommon practice to use four of them. At thispoint, the signal as received has a saw-toothedform, because the fringes do not exhibit cleansquare edges. It is, therefore, possible to use
electronic level sensing in order to give the finalsub-division into the maximum number ofsteps.
Clearly, using level sensing introduces ananalogue measurement into what had pre-viously been a purely digital system, but thelikely error is normally only that of the uncer-tainty in the last digit. A grating ruled at10 lines mm�1 can give a final resolution of1 lm when these techniques are appliedcorrectly.
The use of one grating gives an incrementalsystem in which movements from a given zeropoint are monitored as long as the electronicsremain in action. Appropriate circuitry keeps arunning tally on the direction of the move-ments, so that they are added or subtracted asnecessary.
It has, in the past, been customary to use amore complex construction when ‘absolute’measurements were required. This called for amultiple-track grating, with several sections eachof different spacings, so that any position couldbe coded uniquely. The same principles havebeen applied to the construction of rotary opti-cal encoders, one track being necessary for eachbinary digit in the displayed value. Therefore, anencoder with a resolution of 1 part in 256 wouldrequire eight tracks. Using an absolute encodersystem of this kind ensures that positional infor-mation is not lost if the power supplies are inter-rupted; consequently, it is good practice formany applications. However, the trend in mod-ern electronics has been more and more directedto the use of components with very low powerconsumption that can be run from small backupbatteries. Simple, low-cost incremental encoderscan be run in this way, and although they donot have the capability of the true absoluteencoder, they can certainly be run withoutlosing positional information.
The use of gratings in metrology was reviewedby Sayce (1972).
The linear diode array
As its name implies, the linear diode array con-sists of a row of discrete photosensitive diodesmounted together in line at accurately known
The measurement of displacement 77
Digital output
Pulse decoderLamp drive
Fixed grid
Figure 4.6 The optical grating transducer. If a transparentscale is passed between a source and a detector, the dis-tance that it travels can be estimated by counting the num-ber of times the beam is interrupted by the scale divisions.However when these divisions are very small, they may betoo narrow to interrupt the beam. Using a second scalegenerates moiré fringes that greatly increase the sensitivityof measurement.

spacings in a standard integrated circuit package.The diodes usually have their own associated cir-cuitry, which can interrogate them one by oneand can transmit information from them tosome external processing device. Linear diodearrays have many applications, and one that isrelevant to displacement measurement is that ofoptical triangulation (Figure 4.7). In this tech-nique, the image of an illuminated slit is pro-jected at an oblique angle on to the surface ofthe object. The reflected image, having passedthrough a suitable lens system, is allowed to fallon a diode array. The height of the reflecting sur-face determines the position of the slit image,and hence which diode has the greatest illumi-nation. This system will continue to follow sub-sequent changes as rapidly as the diodes andtheir circuitry can respond.
The resolution of this arrangement dependsprimarily on the number of diodes in the array– which could be anything from 2 to 4096 –while its sensitivity depends on the associatedoptics. The diodes in the array always showsome variation in sensitivity, so the use ofclean, sharp-edged images minimises positionaluncertainty. It is also possible to use interp-olation of the signal from adjacent diodes togain further resolution. The light source incurrent models is usually a laser diode running
at 675 nm, which gives a spot size of approxi-mately 1.0 mm in diameter and a claimedresolution of 0.01 mm.
If only two diodes are used, the arrangementcan be run as an analogue device, giving a con-tinuously varying signal. A sensor using thisprinciple was described by Tanwar andKunzmann (1984).
Inductive element transducers
The optical transducers mentioned above areused extensively in industry for measurement invarious gauging devices and some micrometers,though it is, of course, important to ensure thatglass scales do not become contaminated withoils or other materials that might spoil theirtransparency. For some applications where thismight be difficult, another approach is that ofhaving a linear array of small ferromagnetic barelements, embedded in a chemical-resistantmatrix, in place of the optical components. Thebars are detected by their magnetic properties,and interpolation is used as before to giveenhanced resolution. This is a common con-struction for the sliding scales used in workshopcallipers and machine tools, where resolutions inthe range 0.01–0.001 mm are normal.
78 Tablet and capsule machine instrumentation
Digital output
Linear diode array
Light beam
Reflective surface
2h tanθ
h
q
Figure 4.7 The linear diode array. The moving component carries a small reflector, which sends a sharp-edged beamof light towards the row of diodes. The vertical height of the reflector determines how many of the diodes are lit by thebeam.

Optical interferometers
The principles of optical interferometry are wellestablished, and models were constructed duringthe nineteenth century by Michelson. They arestill capable of very accurate measurement andnowadays are able to take advantage of suchcomponents as the solid-state laser and fibreoptics to provide a compact construction. Corkeet al. (1984) commented that a modern interfer-ometer can be used to detect displacements thatmay be as small as 10�14 m.
The basic concept of the interferometer issimple. Light from a suitable source passes into abeam-splitter and is divided into two separatebeams. The two beams take different opticalpaths and are directed by mirrors or prisms toa second beam-splitter, where they are re-combined and passed to a detector. If the twobeams are in phase when they reach the detec-tor, an output signal will be produced; if theyare precisely out of phase, there will be nosignal. For conditions in between, there will bea proportional signal from which the phaserelationship can be calculated (Figure 4.8).
To use such a system for measurement, it isnecessary to arrange that the path length of onebeam will be modified by the parameter to bemeasured. One of the most sensitive ways of
measuring displacement is one in which one ofthe mirrors moves in a direction normal to itsreflecting surface; movement of the mirror thenproduces a double change in path length.
If a light source with a wavelength of 633 nmis used – this would be that of a helium–neonlaser – then a half wavelength displacement ofthe mirror would produce one complete cycle atthe detector for a movement of approximately316 nm. In fact, very much less than one cyclecan be detected with modern equipment, hencethe sensitivity of better than 10�14 m quoted byCorke et al. (1984).
The limiting factor tends to be the frequencystability of the light source, since that is whatprovides the effective measuring standard. Witha normal helium–neon laser, stabilities toapproximately 1 part in 106 may be expected,although some specially arranged lasers areclaimed to be stable to within 1 part in 1012.
Dynamic measuring devices
The accelerometer
When a mass is allowed to hang freely from aspring, the spring extends and assumes an
The measurement of displacement 79
Moving part
Fixed part
Detector
Beam-splitter
Laser
Corner cube reflector
Corner cube reflector
Figure 4.8 The interferometer. Light from a fixed source is split into two beams: one takes a path of constant length whilethe other takes a path of variable length before the two beams are recombined. The signal at the detector depends onthe relative phase angles of the two combined beams. A displacement of one-quarter of a wavelength takes the signalfrom minimum to maximum.
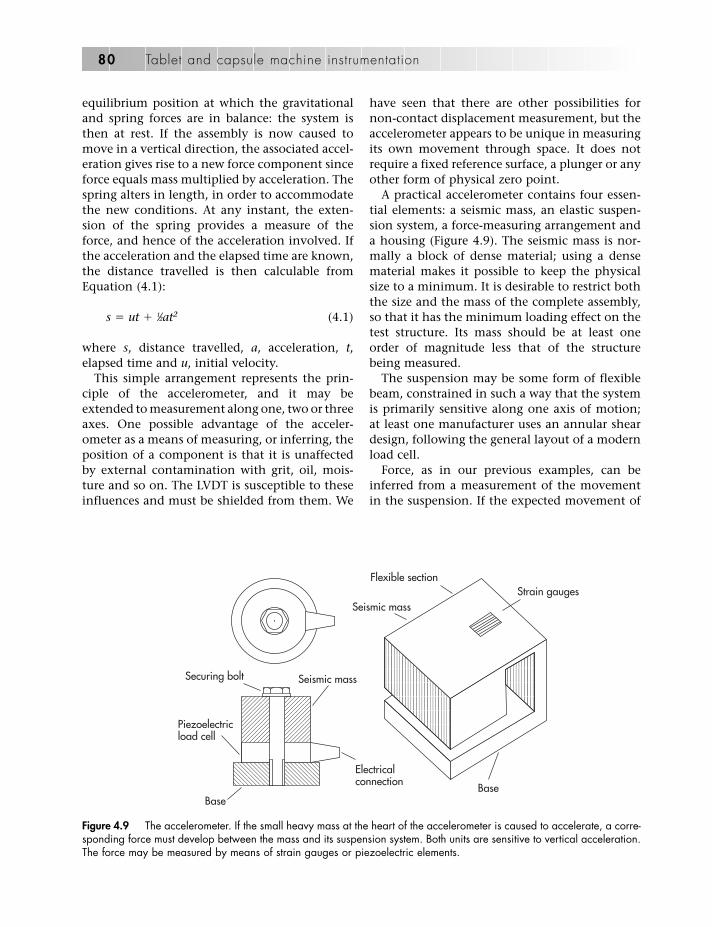
equilibrium position at which the gravitationaland spring forces are in balance: the system isthen at rest. If the assembly is now caused tomove in a vertical direction, the associated accel-eration gives rise to a new force component sinceforce equals mass multiplied by acceleration. Thespring alters in length, in order to accommodatethe new conditions. At any instant, the exten-sion of the spring provides a measure of theforce, and hence of the acceleration involved. Ifthe acceleration and the elapsed time are known,the distance travelled is then calculable fromEquation (4.1):
s � ut � 1⁄2at2 (4.1)
where s, distance travelled, a, acceleration, t,elapsed time and u, initial velocity.
This simple arrangement represents the prin-ciple of the accelerometer, and it may beextended to measurement along one, two or threeaxes. One possible advantage of the acceler-ometer as a means of measuring, or inferring, theposition of a component is that it is unaffectedby external contamination with grit, oil, mois-ture and so on. The LVDT is susceptible to theseinfluences and must be shielded from them. We
have seen that there are other possibilities fornon-contact displacement measurement, but theaccelerometer appears to be unique in measuringits own movement through space. It does notrequire a fixed reference surface, a plunger or anyother form of physical zero point.
A practical accelerometer contains four essen-tial elements: a seismic mass, an elastic suspen-sion system, a force-measuring arrangement anda housing (Figure 4.9). The seismic mass is nor-mally a block of dense material; using a densematerial makes it possible to keep the physicalsize to a minimum. It is desirable to restrict boththe size and the mass of the complete assembly,so that it has the minimum loading effect on thetest structure. Its mass should be at least oneorder of magnitude less that of the structurebeing measured.
The suspension may be some form of flexiblebeam, constrained in such a way that the systemis primarily sensitive along one axis of motion;at least one manufacturer uses an annular sheardesign, following the general layout of a modernload cell.
Force, as in our previous examples, can beinferred from a measurement of the movementin the suspension. If the expected movement of
80 Tablet and capsule machine instrumentation
Flexible section
Seismic mass
Seismic massSecuring bolt
Piezoelectricload cell
Base
Electricalconnection
Base
Strain gauges
Figure 4.9 The accelerometer. If the small heavy mass at the heart of the accelerometer is caused to accelerate, a corre-sponding force must develop between the mass and its suspension system. Both units are sensitive to vertical acceleration.The force may be measured by means of strain gauges or piezoelectric elements.
the mass, relative to its housing, is more than afew micrometres, then it is possible to make thismeasurement with an LVDT. However, manycommercial accelerometers are built aroundpiezoelectric load cells, since this approach canprovide a compact device with good frequencyresponse. A third approach is that of using aservo-driven force balance; this is the methodapplied in some Schaevitz transducers.
The housing is designed to facilitate attach-ment of the accelerometer to the test structure; itmay either be in the form of a block with a cen-tral bolt-hole or have a machined flange withseveral such holes.
Accelerometers of the piezoelectric variety,such as those from Kistler Instruments Ltd andEntran Ltd, can be very small and light: boththese suppliers provide units with an all-upweight of less than 0.5 g. The upper limit of theirfrequency response is usually in the region20–30 kHz, full-scale output is approximately250 mV, while the charge sensitivity may bearound 20 pC g�1, where g is the accelerationfrom gravity. This can in the best circumstancesgive a maximum signal of 1 V g�1: the measure-ment ranges are from approximately 0–5 g tosome 100 000 g.
Servo-force balance accelerometers, althoughlarger and heavier, are more sensitive. Minimumranges are as little as �0.25 g, and full-scaleoutput �5.0 V DC.
Piezoelectric accelerometers, like other piezo-electric devices, must normally be connected toa charge amplifier. Much care must be takenwith the cable runs, and with the insulationresistance of all connections. If the mass of thedevice is not critical, it may be convenient to fitan integral amplifier within the transducer hous-ing. This arrangement gives a low-impedanceoutput and eliminates some of the problemsassociated with piezoelectric devices. Units inthe 1010 series from Precision VarionicsInternational contain a hybrid electronics pack-age and provide a signal of some 25 mV g�1; theyweigh approximately 50 g.
Most of these transducers have a practicallyinfinite resolution, limited only by the associ-ated circuitry. The commercial display devices,sold for use with accelerometers, are scaled toread in units that are as small as 0.001 g, but the
rated linearity of the transducers is not usuallybetter that 1.0%. For the most accurate work, itwould be desirable to calibrate the transducer ona suitable test rig.
Integrated micro electro mechanical systems
Integrated micro electro mechanical systems(abbreviated to iMEMS) is a form of acceler-ometer in which a silicon mass is micro-machined on to the surface of a silicon chip.Analog Devices Inc make one-, two-, and three-axis sensors for the automotive market, and over200 million have been produced to date. Theymake sensors for both low and high g values.Examples of sensors for low g are the ADXL203(two-axis) and ADXL330 (three-axis). The latterdevice is in a package 4 mm � 4 mm � 1.45 mm,has three analogue outputs of 300 mV g�1 withan accuracy of �10%, works over a range of �3 gand has a bandwidth of 1.6 kHz. Power con-sumption is a miserly 180 �A at 1.8 V. A largerange of devices is available, covering a range ofboth g values and accuracies up to �4%.
Velocity transducers
Optical velocity transducers
There may be times when it is useful to be ableto measure such quantities as the angular vel-ocity of the main shaft in a tablet press. It is rela-tively simple to make this measurement byoptical means, using the intermittent interrup-tion of a light beam. This was done by RidgwayWatt (1983) to measure the starting character-istics of a Manesty Betapress. A printed adhesivetape was applied as a complete band around theturret of the press. This tape has narrow blacksegments separated by narrow transparent bars.As the turret rotates, the surface of the patternedtape provides intermittent reflection of the light,and a stream of pulses can be detected.
Inductive velocity transducers
Inductively coupled devices are often used inindustrial practice to estimate angular velocity oracceleration in machines where the absence of
The measurement of displacement 81
any electrical contacts may be desirable. If sometoothed ferromagnetic component – such as agearwheel – is conveniently accessible, a smallinductive pick-up can be fixed in such a positionthat the teeth pass near to the pole-piece of thedevice while the machine runs. Each passingtooth varies the inductance of the pick-up coiland generates a roughly sinusoidal voltage acrossit. Some units nowadays incorporate integralelectronics, in the form of a Schmitt trigger cir-cuit, in order to provide a direct digital outputthat is largely immune to extraneous noise.
In this application, the inductive devicemerely acts as a switch: it has no linear measur-ing capability and depends upon the presence ofthe ferrous teeth on the gear wheel. There are,however, other forms of inductive velocity trans-ducer that can provide a speed-related signal: forexample, those in which a bar magnet movesaxially inside two coils. An improved form ofthis was described by Cranshaw et al. (1976),who modified the central magnetic core by theaddition of a narrow air gap at its centre. Themodified device was said to have a constantsensitivity within 0.1% for displacements up to4.5 mm.
Capacitive velocity transducers
Angular velocities can be measured with capaci-tive devices, just as they can by optical or induc-tive means. Rehman and Murti (1980) have useda construction in which a thin, slotted alu-minium disk, attached to the machine undertest, rotates within the air gap of a three-terminalcapacitor. The periodical change in capacitance,introduced by the passage of the slots, is detectedwith a double-wound transformer ratio-armbridge.
Laser Doppler-shift measurement
We have already seen that the laser has achievedwide application in the field of measurement,one reason being that it has good frequency stab-ility. Using a laser as light source for an inter-ferometer makes it possible to measureextremely small changes in the path length ofone of the beams; however, the same equipmentcan equally well be used at constant path length
to detect small changes in frequency. If one ofthe beams is used to illuminate a movingcomponent, the scattered light from it willexhibit a Doppler frequency shift as a result ofthe movement, and the velocity of the objectcan be determined from the measured shift.
The techniques involved in laser Doppler shiftmeasurement have been described in detail in amonograph by Drain (1980).
Smeets and George (1981) used theDoppler-shift principle in the construction of avelocity-measuring device that incorporated aphase-stabilised Michelson interferometer. Theoperation of the system is interesting. A point onthe surface of the moving object is illuminated bythe beam from a laser, so that the scattered lightfrom that point exhibits a Doppler frequencyshift. Some of the light, at its shifted frequency, istaken along an optical fibre to the interferometer,which is arranged to hold a constant phase at itstwo detectors. The constant phase is achieved bycircuitry that applies a variable voltage across aPockels cell. If the phase changes, the voltagechanges within a microsecond and restores thebalance. Monitoring the voltage across thePockels cell then provides a direct measure ofthe velocity at the measuring point.
Miscellaneous methods of displacementmeasurement
Laser speckle photography
The transducers described above are, generally,capable of measuring displacements along asingle axis. They could, for example, be used tomeasure the movements of a punch in the gen-eration of accurate force–displacement curves.Sometimes, the requirements of research call fora different kind of displacement measurement.It may, for example, be of interest to know howthe surface of a tablet, or a component, movesin three-dimensional space. Measurements ofthis kind must often be made in a non-invasiveway, since the object of interest may not beaccessible to conventional transducer elements;in such cases it may well be more practical touse photographic methods.
82 Tablet and capsule machine instrumentation
Using the phenomenon of laser speckle is oneway of approaching the problem of measuringvery small displacements, strains or distortionsin more than one dimension. This may be doneby simple double exposure to show movementafter a given time delay or, more interestingly, inreal time so that the movement can be observedas it takes place.
The speckle pattern itself is an effect causedby random interference between wavefronts,scattered from the surface of an object that isilluminated with coherent light. At any point inspace where the fronts are in phase, there isreinforcement, or constructive interference.Where they are in antiphase, there is destructiveinterference. The net result of these randomvariations in phase and amplitude is that theilluminated object appears grainy or speckled:the intensity variations over the surface showno periodicity and have a generally similarappearance everywhere. If the speckle pattern isviewed through a lens system, the apparent sizeof the speckles is inversely related to the aper-ture used; consequently, a large f-number giveslarge speckles.
Although the speckle pattern is of a generallyuniform quality, it is nevertheless derived fromthe structure of the surface on which it appears:if the surface moves, or is distorted, the specklepattern moves with it. The mathematicalinterpretation of speckle patterns is beyond thescope of these notes, but even without a detailedanalysis, they can be used in the assessment ofsmall movements.
A practical method for displacement measure-ment was suggested by Leendertz (1970). For thistechnique, a half-silvered, inclined plane mirrorwas used to superimpose the images of two scat-tering surfaces; the composite image was thenfocused on to a high-contrast photographicplate. The plate was developed and then replacedcarefully in its original position so that it actedas a shadow filter. If one of the two original sur-faces then showed displacement or distortion,the local variations of phase shift resulted in thedevelopment of light and dark fringes over theimage plane, which could be observed in realtime through a suitable viewing lens.
Leendertz showed that it was possible toarrange the optics of the system in different ways
in order to detect either normal or in-planemovements of the test surface. The methodappeared to have some advantages over conven-tional holographic interferometry in terms of itsrelative ease of operation and its capability toeliminate the effects of normal movement whennecessary. It is, of course, possible to carry outholographic interferometry in real time, pro-vided that the hologram itself can be processedwithout movement from its original position:the so-called ‘instant’ holography systems pro-vide this facility, but at a considerable expense.Speckle pattern photography is less demandingin its positional requirements and could, inprinciple, be carried out at moderate cost.
A review article with numerous references waspublished by May (1977).
Flash photography
In general, the laser speckle technique tends tobe restricted to the measurement of very smalldisplacements, which may be considered to beon a par with the movements detected by theuse of strain gauges. When relatively large three-dimensional movements are to be analysed, itmay be more practical to use conventional photo-graphic methods. Quite frequently, the subjectof interest may be large enough to see, but mov-ing too fast for the eye to follow; here, the use ofa standard electronic flash system may providethe necessary short exposure time to ensure theproduction of clear, sharp images. An electronicflash-gun provides exposure times that rangedownwards from approximately 1.0 ms – theexact exposure usually being dependent on the amount of light required for the prevailingconditions – and should be satisfactory for mostwork in this field.
Since the tablet press carries out repetitivecycles of movement, the action of some rotatingpart can often be used to trigger the flash at aselected moment in the cycle. For this purpose,the reed switch and magnet form a useful com-bination in which the gun may be fired by clos-ure of the reed switch. The magnet wouldnormally be sited at some point on the tabletmachine, while the reed switch is supported ona stationary holder at a short distance away. The
The measurement of displacement 83

switch then closes once for each cycle of themachine. One advantage of this simple arrange-ment is that it is easy to make small adjustmentsto the triggering point by corresponding changesin the position of either the magnet or theswitch. It is, therefore, possible to make succes-sive ‘stroboscopic’ exposures that represent someoperation of interest, taken over as many framesas may be needed for a detailed study of themovements involved.
For some purposes, this can be a practicaland low-cost alternative to the use of a con-ventional high-speed cine camera. Further-more, it is not limited to any particular formator film size. By comparison with the 8 mm or16 mm cine format, the square ‘still’ frame in35 mm or 60 mm format can hold a greatdeal of information. A typical black-and-white film such as Kodak Plus X or IlfordFP4 is capable of a resolution in the range100–125 line-pairs mm�1 under good condi-tions; so, in principle, a standard negativemeasuring approximately 24 mm by 35 mmcould hold well over 2000 line-pairs.
The possible significance of the quoted resolu-tion is that it gives a rough guide to the size ofsingleparticles thatmightbe identified inaphoto-graph, with a given lens at a given distance.Successive single photographs on conventionalfilm have been used by the writer to study themovement of particles as the punch entered the mouth of the die of a rotary tablet press. Theexpulsion of air from the die is seen to lift arotating toroidal cloud of powder that then rollsup the outside surface of the punch. The effect isnot visible to the naked eye.
In practice, digital cameras have almostreplaced those using film for many photographicapplications, but when equipment is to bechosen for a particular purpose, it is still worthconsidering what resolution will be required. If,for instance, the subject occupies a reasonableproportion of the visible frame, then in mostinstances it would seem quite satisfactory to usea run-of-the-mill digital camera of four mega-pixel resolution, but for the study of dust clouds,for instance, something better may be required.
The stroboscopic system outlined above canbe most useful but it does have the disadvan-tage of showing different events on each indi-
vidual exposure, rather than different phases ofthe same event. If this should be inadequatefor some application, a reasonable compromisemay be found in three-colour flash. For thisprocedure, Ridgway Watt and Harwood (1984)positioned three separate flash tubes in a com-mon housing with a single exit aperture. Infront of each tube was a colour filter, thecolours being, respectively, red, green and blue.These colours can be fired in sequence by aprogrammable control unit. With this system,each frame of colour film is exposed to thethree colours in rapid succession. Any station-ary object appears normal, since the coloursgive white light by addition, but any objectthat moves is shown as three separate colouredimages. As the images are all on the same pieceof film, which remains stationary between thethree exposures, the separation between themcan be taken as a reliable indication of move-ment during the selected time period, both inmagnitude and direction. The system was usedto study the movement of small particles inpowder clouds.
References
Bolk WT (1985). A general digital linearising methodfor transducers. J Phys E Sci Instrum 18: 61–64.
Clabburn EJ (1983). An inexpensive fast response dis-placement transducer. J Phys E Sci Instrum 16:248–250.
Cooke M, de Sa A (1982). A new method of non-con-tact measurement of linear displacement. J Phys ESci Instrum 15: 843–847.
Corke M, Kersey AD, Jackson DA (1984). Temperaturesensing with single-mode optical filters. J Phys E SciInstrum 17: 988–993.
Cranshaw TE, Lang G, Placido F (1976). A linearvelocity transducer. J Phys E Sci Instrum 9: 9–10.
Crecraft DI (1983). Ultrasonic instrumentation: prin-ciples, methods, and applications. J Phys E SciInstrum 16: 181–189.
Culshaw B (1983). Optical systems and sensors formeasurement and control. J Phys E Sci Instrum 16:978–996.
Dann MS (1984). A linear displacement transducer. J Phys E Sci Instrum 17: 184–185.
Depraetère P, Seiller M, Puisieux F (1978). Lasermeasurements of velocities of tablet punches. In
84 Tablet and capsule machine instrumentation

Proceedings of the International Conference on PowderTechnology and Pharmacy, Basel.
Drain LE (1980). The Laser Doppler technique. New York:Wiley.
Garratt JD (1979). Survey of displacement transducersbelow 50 mm. J Phys E Sci Instrum 12: 563–573.
Giles IP, McNeill S, Culshaw B (1985). A stable remoteintensity based optical fibre sensor. J Phys E SciInstrum 18: 502–504.
Hugill AL (1982). Displacement transducers based inreactive sensors in transformer ratio bridge circuits.J Phys E Sci Instrum 15: 597–606.
Jones RV, Richards JCS (1973). The design and someapplications of sensitive capacitance micrometers. J Phys E Sci Instrum 6: 589–600.
Leendertz JA (1970). Interferometric displacementmeasurement on scattering surfaces using speckleeffect. J Phys E Sci Instrum 3: 214–218.
May M (1977). Information inferred from theobservation of speckles. J Phys E Sci Instrum 10:849–864.
Neubert HKP (1975). Instrument Transducers, 2nd edn.London: Oxford University Press.
Rehman M, Murti VGK (1980). A new capacitancespeed transducer. J Phys E Sci Instrum 13: 655–657.
Ridgway Watt P (1983). Measurement of accelerationin a rotary tablet machine. J Pharm Pharmacol 35:746.
Ridgway Watt P, Harwood N (1984). A novel photo-graphic system for process machine analysis. J Pharm Pharmacol 36: 91P.
Sayce LA (1972). Gratings in metrology. J Phys E SciInstrum 5: 193–198.
Smeets G, George A (1981). Michelson spectrometerfor instantaneous Doppler velocity measurements. J Phys E Sci Instrum 14: 838–845.
Sydenham PH (1972). Microdisplacement transducers.J Phys E Sci Instrum 5: 721–733.
Tanwar LS, Kunzmann H (1984). An electro-opticalsensor for microdisplacement measurement andcontrol. J Phys E Sci Instrum 17: 864–866.
Theocharous E (1985). Differential absorptiondisplacement transducer. J Phys E Sci Instrum 18:253–255.
Woolvet GA (1982). Digital transducers. J Phys E SciInstrum 15: 1271–1280.
The measurement of displacement 85


Introduction
In earlier chapters of this book, we have con-sidered the application of various transducers tomeasure force and displacement, and it isimportant to ensure that the information pro-duced by the transducers can be used to thebest advantage. This may involve manipulationof the signals received from one or more trans-ducers so that some critical parameter may beavailable in real time for the operation of acontrol system; or it may be sufficient to havecompaction data stored for record purposes.Regardless of how the transducer signals are tobe applied, there will be two essential require-ments. Firstly, that of providing appropriatepower supplies to each transducer unit and, sec-ondly, that of transferring the output signalsfrom each one, without distortion, to the dataprocessing system.
Most transducers require an electrical supplyand correspondingly generate an electrical signalin the form of a continuously varying voltage: inother words, an analogue output, although theremay be some exceptions to this generalisation.In any event, the first problem is that of bringingthe electrical supply to the transducer.
Gauge excitation level
Strain gauge bridges – Wheatstone bridges – areusually powered with a low-voltage DC. We haveseen in Chapter 2 that the output signal from atypical bridge circuit is very small, and it is a lin-ear function of the applied or input voltage.
Raising the applied voltage, therefore, gives acorrespondingly increased signal, though at thesame time it also increases the inherent self-heating that results from the current flowingthrough the circuit. It is clearly undesirable toraise the temperature of the gauge elements toany great extent; however, the heat generated iscontinuously conducted away into the substrateto which the gauge is attached; consequently, an equilibrium temperature is reached. The rateof heat loss depends on the area of the gauge, the thermal conductivity of the substrate andthe thickness of the glue line. A good glue lineshould be as thin as possible: within the range2.5 to 7.5 lm. Not only does this maximise thethermal transfer from the gauge, it also con-tributes to efficient transmission of strain.Nevertheless, the thermal conductivity of thesubstrate is the most critical factor, and there canbe a 100-fold variation between that of conduc-tive metals such as copper, on the one hand, andsome insulating plastics on the other. An accept-able power loading for a gauge applied to aheavy steel substrate would be in the region of1.6–3.1 kW m�2, where the area concerned is thatof the gauge grid. A mid-range value of 2.0 kW m�2
would be equivalent to 20 mW per 10 mm2: halfthat would be acceptable on stainless steel, andtwice that on copper or aluminium.
Modern strain gauge practice has made it pos-sible to apply gauges of a few millimetres inlength if this should be necessary, but where theavailable space imposes no limitation, there isclearly some advantage in using gauges with asomewhat larger area, perhaps in the region of20–30 mm2, since this will keep self-heating tolower values.
5Power supplies and data acquisition
Peter Ridgway Watt
87
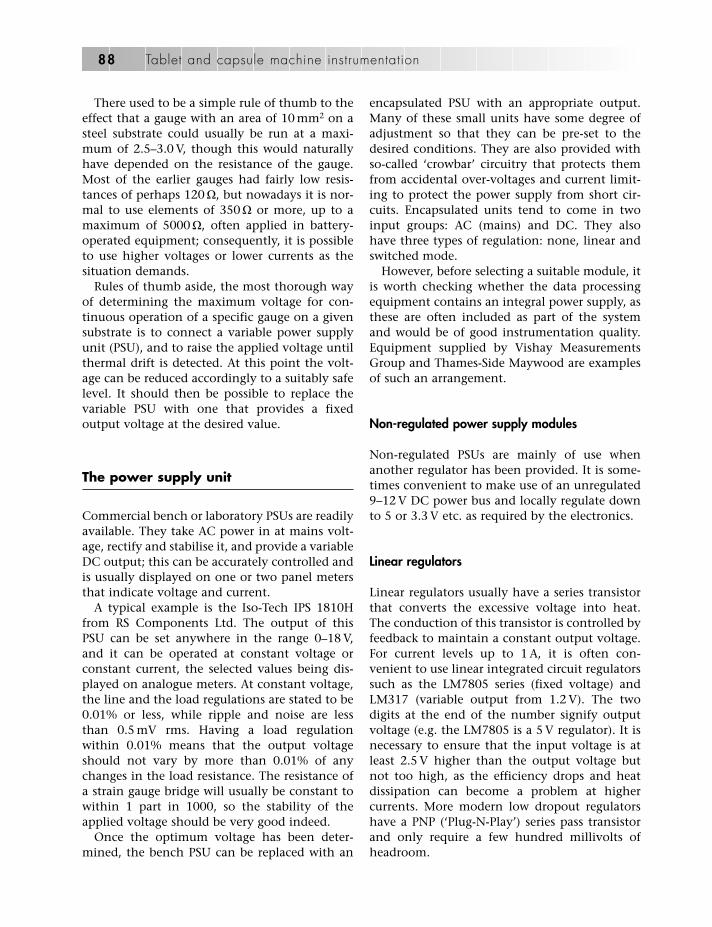
There used to be a simple rule of thumb to theeffect that a gauge with an area of 10 mm2 on asteel substrate could usually be run at a maxi-mum of 2.5–3.0 V, though this would naturallyhave depended on the resistance of the gauge.Most of the earlier gauges had fairly low resis-tances of perhaps 120 �, but nowadays it is nor-mal to use elements of 350 � or more, up to amaximum of 5000 �, often applied in battery-operated equipment; consequently, it is possibleto use higher voltages or lower currents as thesituation demands.
Rules of thumb aside, the most thorough wayof determining the maximum voltage for con-tinuous operation of a specific gauge on a givensubstrate is to connect a variable power supplyunit (PSU), and to raise the applied voltage untilthermal drift is detected. At this point the volt-age can be reduced accordingly to a suitably safelevel. It should then be possible to replace thevariable PSU with one that provides a fixedoutput voltage at the desired value.
The power supply unit
Commercial bench or laboratory PSUs are readilyavailable. They take AC power in at mains volt-age, rectify and stabilise it, and provide a variableDC output; this can be accurately controlled andis usually displayed on one or two panel metersthat indicate voltage and current.
A typical example is the Iso-Tech IPS 1810Hfrom RS Components Ltd. The output of thisPSU can be set anywhere in the range 0–18 V,and it can be operated at constant voltage orconstant current, the selected values being dis-played on analogue meters. At constant voltage,the line and the load regulations are stated to be0.01% or less, while ripple and noise are lessthan 0.5 mV rms. Having a load regulationwithin 0.01% means that the output voltageshould not vary by more than 0.01% of anychanges in the load resistance. The resistance ofa strain gauge bridge will usually be constant towithin 1 part in 1000, so the stability of theapplied voltage should be very good indeed.
Once the optimum voltage has been deter-mined, the bench PSU can be replaced with an
encapsulated PSU with an appropriate output.Many of these small units have some degree ofadjustment so that they can be pre-set to thedesired conditions. They are also provided withso-called ‘crowbar’ circuitry that protects themfrom accidental over-voltages and current limit-ing to protect the power supply from short cir-cuits. Encapsulated units tend to come in twoinput groups: AC (mains) and DC. They alsohave three types of regulation: none, linear andswitched mode.
However, before selecting a suitable module, itis worth checking whether the data processingequipment contains an integral power supply, asthese are often included as part of the systemand would be of good instrumentation quality.Equipment supplied by Vishay MeasurementsGroup and Thames-Side Maywood are examplesof such an arrangement.
Non-regulated power supply modules
Non-regulated PSUs are mainly of use whenanother regulator has been provided. It is some-times convenient to make use of an unregulated9–12 V DC power bus and locally regulate downto 5 or 3.3 V etc. as required by the electronics.
Linear regulators
Linear regulators usually have a series transistorthat converts the excessive voltage into heat.The conduction of this transistor is controlled byfeedback to maintain a constant output voltage.For current levels up to 1 A, it is often con-venient to use linear integrated circuit regulatorssuch as the LM7805 series (fixed voltage) andLM317 (variable output from 1.2 V). The twodigits at the end of the number signify outputvoltage (e.g. the LM7805 is a 5 V regulator). It isnecessary to ensure that the input voltage is atleast 2.5 V higher than the output voltage butnot too high, as the efficiency drops and heatdissipation can become a problem at highercurrents. More modern low dropout regulatorshave a PNP (‘Plug-N-Play’) series pass transistorand only require a few hundred millivolts ofheadroom.
88 Tablet and capsule machine instrumentation
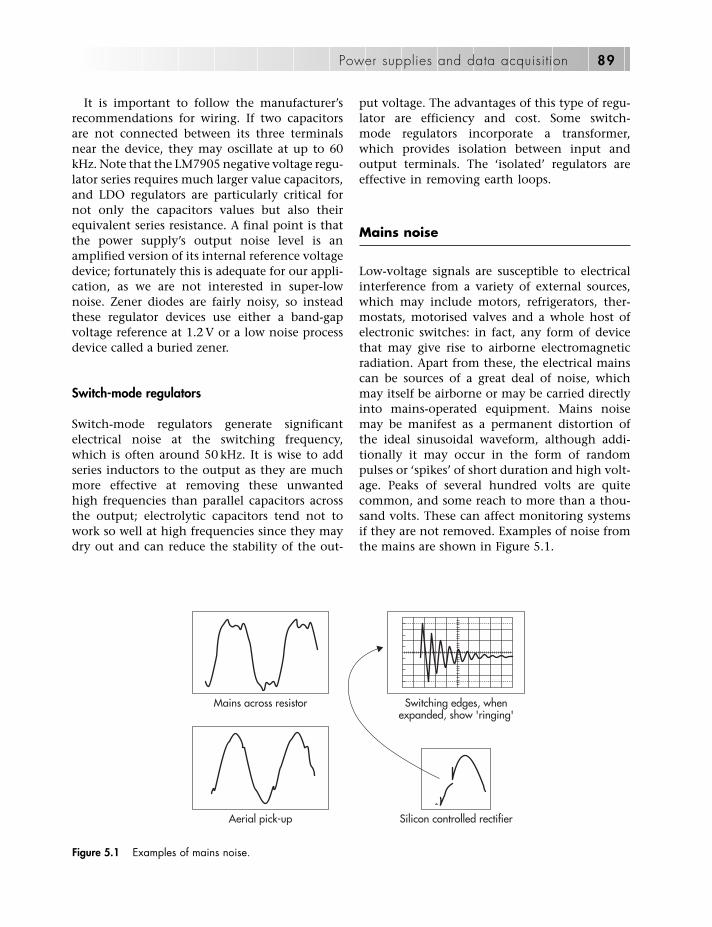
It is important to follow the manufacturer’srecommendations for wiring. If two capacitorsare not connected between its three terminalsnear the device, they may oscillate at up to 60kHz. Note that the LM7905 negative voltage regu-lator series requires much larger value capacitors,and LDO regulators are particularly critical fornot only the capacitors values but also theirequivalent series resistance. A final point is thatthe power supply’s output noise level is anamplified version of its internal reference voltagedevice; fortunately this is adequate for our appli-cation, as we are not interested in super-lownoise. Zener diodes are fairly noisy, so insteadthese regulator devices use either a band-gapvoltage reference at 1.2 V or a low noise processdevice called a buried zener.
Switch-mode regulators
Switch-mode regulators generate significantelectrical noise at the switching frequency,which is often around 50 kHz. It is wise to addseries inductors to the output as they are muchmore effective at removing these unwantedhigh frequencies than parallel capacitors acrossthe output; electrolytic capacitors tend not towork so well at high frequencies since they maydry out and can reduce the stability of the out-
put voltage. The advantages of this type of regu-lator are efficiency and cost. Some switch-mode regulators incorporate a transformer,which provides isolation between input andoutput terminals. The ‘isolated’ regulators areeffective in removing earth loops.
Mains noise
Low-voltage signals are susceptible to electricalinterference from a variety of external sources,which may include motors, refrigerators, ther-mostats, motorised valves and a whole host ofelectronic switches: in fact, any form of devicethat may give rise to airborne electromagneticradiation. Apart from these, the electrical mainscan be sources of a great deal of noise, whichmay itself be airborne or may be carried directlyinto mains-operated equipment. Mains noisemay be manifest as a permanent distortion ofthe ideal sinusoidal waveform, although addi-tionally it may occur in the form of randompulses or ‘spikes’ of short duration and high volt-age. Peaks of several hundred volts are quitecommon, and some reach to more than a thou-sand volts. These can affect monitoring systemsif they are not removed. Examples of noise fromthe mains are shown in Figure 5.1.
Power supplies and data acquisition 89
Mains across resistor
Aerial pick-up
Switching edges, whenexpanded, show 'ringing'
Silicon controlled rectifier
Figure 5.1 Examples of mains noise.

An interesting example of the effects that elec-trical noise can cause was encountered by one ofthe editors during an early attempt to interfacean eccentric tablet press with a microcomputer(Armstrong and Abourida, 1980). As only limitedcomputer memory was available at that time, itwas decided to record the output of the upperpunch force transducer only when the signalfrom it exceeded a small positive value.Otherwise the computer memory would mainlybe filled with zeroes, since for much of the com-pression cycle, the upper punch was not in con-tact with the contents of the die, and hencethere would be no detectable force. The com-puter was instructed to monitor the signal fromthe upper punch and to commence collectingdata when this exceeded the threshold and tocontinue doing so until the signal fell backbelow the threshold. The tablets were to be madesingly, with the die filled by hand and only onecompaction event was to be recorded.
This arrangement worked perfectly when thepress was rotated by hand. But when the presswas driven by its motor, no data were collected.When the transducer output was viewed on anoscilloscope, it was noted with some surprisethat when the ‘start’ button of the press was acti-vated, a large electrical spike of very short dura-tion was generated. The computer interpretedthis spike both as the signal to start collectingdata and also the signal to stop, so when the realcompaction event occurred, no data were col-lected since the computer was programmed tocollect data from only one event. It provedimpossible to eradicate the noise from the ‘start’button. The problem was circumvented by build-ing a delay into the software so that data collec-tion commenced only if the signal was still abovethe threshold some 20 ms after the thresholdhad been exceeded. In that time, the signalcaused by the spike would have disappeared.
When a heavy inductive load such as an elec-tric motor is switched on, the voltage across itsterminals is temporarily reduced since the mainscables have a finite resistance. When the motoris switched off, the inductive energy storedbecomes converted to a high voltage that will arcacross the switch contacts, thus generatingairborne radiofrequency noise and very highvoltage peaks on the mains.
Computer switch-mode power supplies, unlessof the power factor correction design, distort themains by taking all their current at the peak ofthe mains sinusoid.
The effects of radiated noise can usually beminimised if the cables carrying the signal arescreened with an external layer of conductivecopper braiding, earthed at one end or possiblyboth ends. Electromagnetic interference suppres-sion ferrites, manufactured by companies such asSteward, Chomerics, and Fair-Rite, are very use-ful in preventing high-frequency noise fromentering a screened electronics enclosure. Thecables are fed through ferrite rings or split ringsare snapped over the cable to increase the cable’sinductance. Clip-on flat ferrites are used with flatribbon cables. PC video cables often have a bulgeat each end, which is where the cable is fedthrough a ferrite tube to reduce radiation.
Ideally all signals should be sent and receiveddifferentially, so that common-mode voltagescancel out. Signal cables should always be kept asshort as possible and laid well away from powercables supplying large motors. Earthing a cableat both ends may have undesired effects if thetwo ends are connected to local but separatemains earth points. If these two ‘earths’ shouldhave a potential difference of, say, 1 V, and thecable’s braid has a resistance of 1 �, then 1 A will flow and this can obviously cause a majorproblem.
As an example, this can happen if a motordoes not have equal currents in its windings: anyimbalance tends to flow through the bearingsinto the motor frame, which is itself connectedto earth. Some variable-speed AC motor driveswere designed to ‘chop’ the current at high fre-quency, and this technique led to premature fail-ure of motor bearings, so more modern motordrives generate three-phase variable-frequencyAC without the damaging high-frequencycomponent.
Mains filters
Noise from the mains can be reduced consider-ably by the use of electrical filter networks. Theseare commercially available units that are con-nected between the mains supply and the mains-
90 Tablet and capsule machine instrumentation

driven equipment. The simplest varieties containa number of capacitors connected between thelive, neutral and earth. The more elaborate onesalso have inductive components in series withthe supply. The characteristics of the simpler fil-ters are detailed in British Standard BS613: theyusually provide an attenuation of some 30 dB inthe frequency range 600 kHz to 100 MHz, whilehaving little effect on the 50 Hz base frequency.
In spite of the presence of input filter net-works, high-voltage spikes may still pass throughinto mains-driven power supplies, emergingwith the low-voltage DC output. Not only maythey corrupt the signal output of the systempowered by the PSU, but they may even destroycertain sensitive components such as CMOSdevices, integrated circuits, and so on.
Transient suppressors
Solid-state transient suppressors may be used.These are PN silicon devices and are connectedacross the output terminals of the PSU. They arenormally non-conducting at the rated voltage ofthe PSU, but at higher voltages they pass veryrapidly into a conducting state. Their speed ofresponse is measured in millionths of a microsec-ond, and they are able to shunt the excess powerbefore serious damage results.
Battery power
So far, we have concentrated on permanentmains-operated supplies. In recent years, therehave been alternative systems on the commer-cial market, running on batteries of varioustypes. Using battery power enables short-termmeasurements of force and displacement onrotary presses to be made without the compli-cation of introducing power from externalsources.
In systems of this type, there have usuallybeen on-board signal-conditioning electronics,so that data from the transducers could be trans-mitted by telemetry either continuously or as ashort burst of stored data to a stationary receiver.The electronics also have the capability to stabil-ise the battery voltage, thereby avoiding some
of the problems associated with mains-drivenpower supplies.
The disadvantage of the earlier battery-powered systems lay in their size, since it wasnecessary to occupy several die stations with therather bulky components: the battery box, theelectronics, the displacement transducer, and soon. Later versions improved on this to someextent by taking the electronics unit out of thedie station and mounting it separately, reducingbattery size by using lithium button cells, and soon. Even more recently it has been possible tominiaturise the complete system so that it can becontained inside an instrumented punch (seeChapter 6).
Power supply to and data acquisitionfrom tablet presses
The supply of power to transducers fitted to aneccentric press usually presents few problems,and neither should data acquisition. Punchesmove in one vertical dimension and no diffi-culties should be encountered provided theelectrical leads are given adequate support. Thesituation with rotary presses is different. Herethe punches move in three dimensions, and the rotation of the turret precludes a fixed linkbetween the power supply and the transducers,and also between the transducers and the dataacquisition system. There are several approachesto solving this problem, but irrespective of themethod that is chosen, attention must be paid tothe electrical connections.
When punches are instrumented in the moretraditional way, the gauged area passes into thepunch guides during part of the machine cycle.The guides have sharp edges and it is importantto ensure that the wires are not sheared off at theedge of the guide. The wires are often cementedinto a shallow groove in the punch body so thatthey can be taken out from the end of the bodyin relative safety, though an axially drilled holewould probably be better.
Whatever means are used to lead the wires outfrom the punch, careful attention must be paidto the resident hazards around the turret. Thereare various fixed components on the press that
Power supplies and data acquisition 91
can easily become entangled with the wiringfrom a moving punch, and it is worth spendingsome little time turning the machine by hand inorder to check what is there. In our own instru-mented Betapress, the wires were taken out atthe end near to the punch tip, and were pro-vided with ‘Lemo’ miniature locking plugs sothat they could be connected to our rotary slip-ring unit. Using a Lemo plug reduced the risk ofdisconnection through centrifugal force as theturret rotates. Alternatively, the wires could havebeen taken out at the end near to the punchhead: there are perhaps fewer obstructions at thisend, but it is important to see that there is stillsufficient clearance between the punch head andthe punch guide at maximum compression.
Slip-rings
An apparently simple solution is to fit slip-ringgear to the press, using this both to supply powerto the transducers and to take data out. Thisapproach was reported by Ridgway Watt andRue in 1979. The method itself was very satis-factory but was possible because it was usedwith a brand new Betapress that had beenmodified by the provision of an extended mainshaft. The shaft was carried vertically upwardsbeyond the normal level and was machined withan internal cavity to accept electrical cables.Co-axially above the upper end of the shaft, a12-element integrated slip-ring assembly ofinstrument quality (type PM-12-01-TC fromIDM Electronics Ltd) was fitted that ran on itsown bearings to ensure that it would not gener-ate unacceptable levels of electrical noise. It hadseveral brushes per ring and was loosely coupledto the Betapress shaft by means of an ‘Essex’coupling so that the two rotated together butwere mechanically separate (Figure 5.2). Holeswere drilled obliquely through the turret andinto the hollow shaft from points adjacent tothe strain-gauged punches, both upper andlower, while corresponding holes were providednear the associated displacement transducers.Signal cables were then run up inside the centralshaft and connected to the slip-rings above(Figure 5.3).
It had previously been suggested that slip-ringgear would not be suitable for such a problembecause of the poor signal-to-noise ratios thatmight be expected. Sidor (1983) commented that‘slip-rings are far from reliable, and practicallyuseless for permanent installation’. Indeed, thiswould have certainly been the case had anattempt been made to fit slip-rings to the mainshaft itself, but using a separate self-containedunit of appropriate quality provided an entirelyacceptable solution. The recorded noise level ofthis system after installation was 5 lV per 1 mA,at a rotation rate of 3000 rpm, and this was feltto be satisfactory for the application.
Slip-rings represent one of the very few sys-tems that can be operated on a completely con-tinuous basis, with power going in and signalscoming out without interruption.
Mercury seals
The widespread albeit inaccurate notion thatslip-rings are useless for permanent installationhas led several workers to look for alternativerotary contact systems, and arrangements usingmercury as a liquid contact medium have beendescribed by Marshall (1983) and by Walter andAugsburger (1986). This system was also used ininstrumented capsule-filling equipment by Smalland Augsburger (1977). In each case, one ormore annular channels were machined into theupper surface of an insulating disk fitted con-centrically above the turret head of the tabletpress. The channels were partially filled withmercury and were electrically connected to thetransducers below by means of metal screws letinto the under side of each channel. Above therotating channels was a stationary arm of insu-lating material that supported a set of conductingpins. As the pins dipped into the mercury, con-tact was established with the transducers below.
A major drawback to the use of mercury in thisway is that its vapour is poisonous, and the useof stationary pins in a rotating mercury poolwill, naturally, result in continuous renewal ofthe exposed surface. Even at room tempera-ture, this would nowadays be considered anunacceptable hazard.
92 Tablet and capsule machine instrumentation
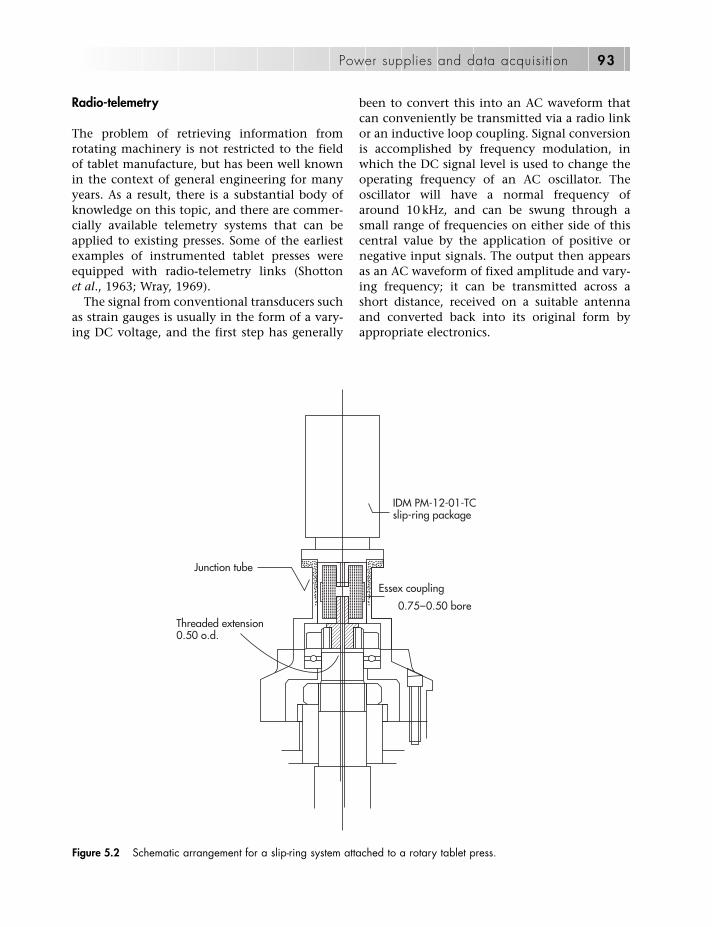
Radio-telemetry
The problem of retrieving information fromrotating machinery is not restricted to the fieldof tablet manufacture, but has been well knownin the context of general engineering for manyyears. As a result, there is a substantial body ofknowledge on this topic, and there are commer-cially available telemetry systems that can beapplied to existing presses. Some of the earliestexamples of instrumented tablet presses wereequipped with radio-telemetry links (Shotton et al., 1963; Wray, 1969).
The signal from conventional transducers suchas strain gauges is usually in the form of a vary-ing DC voltage, and the first step has generally
been to convert this into an AC waveform thatcan conveniently be transmitted via a radio linkor an inductive loop coupling. Signal conversionis accomplished by frequency modulation, inwhich the DC signal level is used to change theoperating frequency of an AC oscillator. Theoscillator will have a normal frequency ofaround 10 kHz, and can be swung through asmall range of frequencies on either side of thiscentral value by the application of positive ornegative input signals. The output then appearsas an AC waveform of fixed amplitude and vary-ing frequency; it can be transmitted across ashort distance, received on a suitable antennaand converted back into its original form byappropriate electronics.
Power supplies and data acquisition 93
IDM PM-12-01-TCslip-ring package
Essex coupling
Threaded extension0.50 o.d.
Junction tube
0.75–0.50 bore
Figure 5.2 Schematic arrangement for a slip-ring system attached to a rotary tablet press.

One disadvantage of the early telemetry sys-tems was physical size. It was common practiceto occupy one position in the turret for aninstrumented punch, then to fit the signal-conditioning electronics into an adjacent pos-ition, and finally to use a third position for thebattery pack that powered the whole system.Clearly, this meant that it was not possible to usethe full complement of punches, and this mightwell have resulted in correspondingly abnormalbehaviour of the press. For example, using fewerpunches could lead to over-filling of the feedframe. This, in turn, could give rise to cyclic vari-ations in tablet weight, because the fingers of thefeed frame pass over the top of the die during the
weight-setting operation and may produce ameasure of extra compaction as they pass(Ridgway Watt and Rue, 1980).
Since then, the rapid development of micro-electronics has resulted in smaller and smallerdevices with greatly increased ability andreduced power requirements. Voltage-to-frequency converters, for example, have beenavailable as integrated circuits for many years:first as dual-in-line devices, later as surface-mounted packages. It is no longer necessary tooccupy several stations with the telemetry equip-ment, which can be built into a block of mini-mum dimensions. Even the battery, once a fairlylarge component, can be replaced by one or
94 Tablet and capsule machine instrumentation
Main shaft
Turntable
0.312
Centraldrilling
0.25, 30°
Precompression roller
Counterbore forLEMO socket120 mm × 1.00 mm
Die
Figure 5.3 Schematic arrangement of drillings for signal cables involved in fitting a slip-ring to a rotary tablet press (notco-planar with the punches).

more lithium button cells. It is also possible touse an inductive coupling to introduce powerinto a rotating device. A stationary coil on theoutside, fed with AC, induces corresponding cur-rents in a coil on the rotating component, thetwo forming a rotary transformer. The current sogenerated is then rectified and smoothed asnecessary so that it can be used with the straingauge amplifiers or displacement transducercircuits on the press.
Optical linkage
An alternative to radio-telemetry is to use apulsed light beam to transmit information indigital form. Using frequencies within theinfrared part of the spectrum reduces the inter-ference that might be caused by daylight, butnevertheless provides a large capability for datatransmission. One practical approach is that ofusing on-board electronics to operate a suitablelight-emitting diode – an infrared LED – and togenerate a stream of pulses that represent a digi-tised version of the transducer signals. This gen-erally involves the use of an analogue-to-digitalconverter, a standard integrated circuit. Then theresulting data stream can be sent along a flexiblefibre optic to a point in line with the main shaftof the rotating system, where the digital data canbe read by a stationary photodiode.
Another method that has been used in com-mercial practice is that of storing the com-paction data temporarily within the electronicsblock, which is mounted somewhere near theassociated transducers. Then, as the turret rotatespast an optical sensing head, the informationthat has been collected is sent out in a very shortburst. When data from more than one trans-ducer have been stored, their separate signals canbe sent out in very rapid succession. Switchingfrom one to another is known as ‘multiplexing’and this is the method used, for example, tosend many telephone messages simultaneouslyalong a single cable.
A commercial system using this principle wasavailable from Puuman Oy in Finland, under thename ‘Portable Press Analyser’. As the name sug-gested, it was designed to be sufficiently smalland light to be taken from one machine to
another, so that the performance of eachmachine could be compared with others of asimilar type. Indeed, it could be used with anymachine employing the same type of punch,and facilities were provided for measurementboth of punch force and displacement. Theassociated punch was made in two parts so thatthe strain gauges could be mounted internally,and this gave the gauges some measure of pro-tection in use. The requirement for displacementmeasurement meant that one position in theturret was occupied by the instrumented punch,while the adjacent position held the LVDT trans-ducer. A diagram of the Puuman Oy system isshown in Figure 6.19.
Signal display
With the increased availability of cheap comput-ing power, the output of transducers fitted totablet presses is now almost invariably fed into acomputer for storage, display and arithmeticalmanipulation. This is discussed in detail inChapter 8. Nevertheless, it is often advantageousto have some alternative means of displayingand recording the signal from a transducer, espe-cially in the early stages of an investigation, andfor calibration and checking purposes.
The method chosen for the display of a vari-able is likely to depend on the rate at which thatvariable may change. The time during which thepunches of a tablet press are in contact with thedie contents is of the order of 0.1 s. The inertia ofa mechanical pen recorder is sufficiently highthat the pen cannot follow the fluctuations ofthe signal. Neither can a digital voltmeter beused, since the eye cannot follow the rapidlychanging digits. Nevertheless both pen recordersand digital voltmeters have been used in situ-ations in which the signal changes more slowly,such as in the measurement of tablet-crushingstrength.
Devices in common use for the display of vari-ables at normal tabletting speeds include theoscilloscope and the high-speed ultravioletrecorder. Each of these produces a display in ‘realtime’, that is to say as the event happens. It isalso possible to produce a display in retrospect
Power supplies and data acquisition 95

by the use of digital storage and subsequentretrieval. The data will of course pass into thestore in real time; however, they can be retrievedat a much slower rate if necessary. The outputfrom the data store can then be printed on achart recorder, or an x–y plotter, to provide ahard copy of good quality.
The oscilloscope
If an oscilloscope is coupled to the output of thetransducer amplifier, and is correctly set up, itwill display the changing signal as a bright lineon the screen. The duration of a single tabletevent is short, and it is impossible to follow themoving spot by direct observation, so meanshave to be found to extend the time over whichthe trace can be viewed. One such means, oftenused in the early days of tablet press instrumen-tation, is that of photographing the trace as itappears with an oscilloscope camera.
In order to ensure that the oscilloscope trace isin a suitable position on the screen, it is necess-ary to have a triggering signal that will start thespot moving across the screen just before thecompression event. This can be done with a reedswitch, the contacts of which close when amagnet is brought near them. The reed switch isconnected to the triggering contacts of the oscillo-scope, while the actuating magnet is attachedto some accessible part of the tablet press. Therelative positions of the reed switch and themagnet are then adjusted until there is contactclosure just as the punch begins to descend intothe die. Reed switches and their magnets areoften contained in a glass or plastic envelopeand so are well protected against dust and dirt.
Some, but not all, oscilloscopes have anautotriggering facility, whereby the time basecan be caused to start across the screen as soon asthe signal to the y axis exceeds a set level. In thistype, external triggering is not necessary,although some portion of the signal below thethreshold may be lost.
The digital storage oscilloscope
Visualisation of the signal waveform is muchsimplified if the oscilloscope is of the storagetype where the trace can be retained for someappreciable time after the event. Modern storage oscilloscopes are often equipped withdigital storage systems, which represent a con-siderable advance over the earlier forms of ana-logue storage. The trace always remains clear andcan be moved on the screen after the event. Thismakes it possible to study a waveform in greatdetail and to move it backwards or forwardsacross the screen.
Most of the oscilloscopes designed for seriouslaboratory work nowadays are of the digitalstorage type. Very-high-speed analogue-to-digitalconverters send data into memory, from whichthey are displayed on a cathode ray tube or LCDscreen. The more expensive models use a colourdisplay so that traces can be displayed on top ofeach other with no likelihood of confusion.
Data are fed continuously into the store untila trigger condition is detected. This causes acounter to count down from typically 50% ofthe store’s sample size. Storing ends when thecounter reaches zero. This means that it is nowpossible to see what happened before the trigger;this is known as ‘pre-triggering’. Some digitalstorage oscilloscopes allow pre-triggering of 10,50 or 90% of the store size, and have a variabletime delay. For PAL/NTSC video signals, a digitalstorage oscilloscope can be set up to trigger on agiven line or frame. Reed switch triggering, asdescribed above, is no longer necessary.
The display is refreshed at a constant rate, sothe brightness of the trace is constant and doesnot gradually fade away. Photographing a trace issimple, and many digital storage oscilloscopeshave a floppy disk drive or memory card socketto copy data. Some have a much larger storememory and the stored waveform can be bothshifted and expanded in the time axis.
Digital storage oscilloscopes have a compre-hensive set of cursor functions that can measure
96 Tablet and capsule machine instrumentation
voltage, time and frequency. Unlike older ana-logue instruments, the digital storage oscillo-scope has an ‘autoset’ button that simplifiesset-up.
A further development has led to the mixed sig-nal oscilloscope, which combines two analoguechannels with a logic analyser. A good example ofthis type of instrument is the HP 54645D. Thishas two 100 MHz analogue channels and 16 digi-tal channels. One special feature is called MegaZoom. Each trace has 1 Mbyte of memory thoughonly 500 points are displayed. This gives the userthe opportunity to zoom in and shift the storedwaveform to a considerable extent.
The ultraviolet recorder
Whereas mechanical pen recorders are usuallylimited by the inertias of their components to afull-scale traverse time of approximately 1 s,ultraviolet recorders – or oscillographs – are notlimited to the same extent. They use a movingultraviolet light beam instead of a pen and pro-duce a trace on photosensitive paper at writingspeeds that are sufficiently high to record signalsfrom the compression event. The movement ofthe light beam is controlled inside the instru-ment by means of a small mirror galvanometer.It is possible to select galvanometer movementswith different characteristics to suit specificapplications.
Because the duration of the compression eventis so short, it is necessary to run the ultravioletrecorder at a correspondingly fast paper speed;otherwise the whole event will be compressedinto an unreadably small space. Modern ultra-violet recorders can consume paper at a surprisingrate, having a range of speeds from a few mil-limetres per second to several metres per second.In order to avoid a considerable waste of recorderpaper, it is desirable to have a control systemthat will limit the paper run to the event beingmonitored. The ultraviolet recorder itself willoften have an on-board timer that controls theduration of the run and is set to a value justexceeding the compression time.
In our own laboratories, we have once againemployed the reed switch and magnet arrange-ment to generate a contact closure at therequired moment. In a similar way, D’Stefan et al.(1985) used a magnet and a Hall effect switch tosignal to their data acquisition system.
Once obtained, the traces from the ultravioletrecorder are usually reasonably clear to read;however, they may fade with age. For long-termrecord keeping, it may be useful to photographthe traces and store the photographs instead.Alternatively, spraying the trace with a suitablelacquer gives a record that does not fade formany years.
References
Armstrong NA, Abourida NMAH (1980). Compressiondata registration and manipulation by microcom-puter. J Pharm Phamacol 32: 86P.
D’Stefan DA, Leesman GD, Patel MR, Morehead WT(1985). Computer interfaced instrumentation of arotary tablet press. Drug Dev Ind Pharm 11: 83–100.
Marshall K (1983). Instrumentation of tablet andcapsule-filling machines. Pharm Tech 6: 68–82.
Ridgway Watt P, Rue PJ (1979). The design and con-struction of a fully instrumented tablet machine. InProceedings of the International Conference ofPharmacy Technology and Production Manufacturers,Copenhagen.
Ridgway Watt P, Rue PJ (1980). Tablet weight and den-sity variation in a rotary press. J Pharm Pharmacol32: 22P.
Shotton E, Deer JJ, Ganderton D (1963). The instru-mentation of a rotary tablet machine. J PharmPharmacol 15: 106T–114T.
Sidor T (1983). Simple and accurate strain gauge signal-to-frequency converter. J Phys E Sci Instrum 16:253–255.
Small LE, Augsburger LL (1977). Instrumentation of anautomatic capsule-filling machine. J Pharm Sci 66:504–509.
Walter JT, Augsburger LL (1986). A computerizedforce–displacement instrumentation system for arotary tablet press. Pharm Technol 9: 26–34.
Wray P (1969). The instrumented rotary tabletmachine. Drugs Cosmetic Ind 105: 58B–68B, 158–160.
Power supplies and data acquisition 97


Introduction
There are many ways in which force and dis-placement can be measured, and Chapters 2 and4 covered a selection from the methods currentlyavailable. Some of the published work in tablet-ting has already been covered quite extensivelyin these chapters. The purpose of this chapter isto take some examples of instrumental methodsapplied to tablet presses of various types in orderto look at some specific points in more detail,and to attempt to suggest possible future devel-opments. Inevitably, this approach results insome repetition of detail here and there, but this has seemed justifiable on the grounds that itprovides better continuity within each topic.
Measurement of punch forces
All tablet presses, of whatever design, embody atleast one punch and die set, powered usuallyfrom a motor but occasionally by hand. Inbetween the power source and the punch, thereis a train of mechanical components throughwhich the power is transmitted. Variations in thepunch force will appear as corresponding vari-ations in the transmitted force through each ofthe components, so any one of them could beconsidered, at least in principle, as a potentialsite for a measuring device of some sort.
To some extent, the choice of site for forcemeasurements will depend on the purpose ofthe measurement to be made. This, in turn, willinfluence the degree of accuracy that isrequired, and the cost that can be justified bythe measuring system.
Requirements of accuracy
In a research laboratory concerned with thephysics of tablet compression, it is likely thatpunch force measurements will be needed attheir most precise; say to 1 part in 10 000 orbetter. For much formulation work, a 12-bitaccuracy – or 1 part in 4096 – is often quiteacceptable, and this allows for convenientmanipulation of the data by fairly simple com-puter systems. In a production area, concernedwith the maintenance of tablet quality from agroup of commercial tablet presses, a consider-ably lower standard, perhaps 1 part in 512, maywell be acceptable. Finally, at the least accurateend of the measurement scale, would come rou-tine monitoring of the tablet press as a check onits mechanical condition. Here, an appreciabledeparture from the normal power loading, forexample, might be taken as a warning of a needto clean the punches and guides, or for generalmaintenance work on the equipment.
To put these considerations into perspective, itis probably useful to examine two stylised tabletpresses, one eccentric and one rotary, and to lookat the merits of various gauging areas in broadterms. On a real tablet press, these areas could beinvestigated in more detail by stress analysis anda specific gauging site could then be selectedaccurately.
The eccentric press
In the eccentric press, the upper punch is held ina sliding block that moves up and down above
6Instrumented tablet presses
N Anthony Armstrong and Peter Ridgway Watt
99

the stationary die. The block travels in a verticalslide-way and is driven from an eccentric at theend of the main shaft. The die and the lowerpunch remain in nominally fixed positions dur-ing the compression of a tablet. After the tablethas been compressed, the lower punch is thenraised in order to eject the tablet through theupper end of the die. The whole system is usuallypowered from an electric motor, probablycoupled through a flexible belt and pulley.
Measurement of the upper punch force
If the upper punch is considered first, we can seethat its applied force is transmitted from themotor, through the drive belt, the main shaft,the upper eccentric, the upper arm, the punchholder and, finally, through the length of thepunch itself. There will be corresponding reac-tions in the machine frame that will tend toseparate the upper and lower punch faces aspressure is applied between them. Measurementsrelated to punch force can be made at almost anyof these sites, but the errors involved becomeprogressively larger as the site becomes moreremote from the punch.
The motor
Changes in the power absorbed by a machine aresometimes useful, if only very approximate,guides to the need for lubrication and mechani-cal maintenance work. If the power absorbed byan AC drive motor is to be checked for any rea-son, it is good practice to make the measurementwith a sensitive wattmeter rather than a simpleammeter. Because of the inductive nature of themotor windings, the instantaneous values of cur-rent and voltage do not generally remain inphase with each other – the current usually lagsbehind the voltage – so that readings taken withammeter and voltmeter may be misleading.Moreover, the amount of lag is not constant,since it is a function of the mechanical load onthe motor. Variations from the normal, as dis-tinct from absolute measurements, are more eas-ily detected if the meter is provided with anelectronic ‘offset’ facility so that it can be set toread zero under standard running conditions.
In some processes, such as wet granulation ormixing, the power consumption may be a goodindication of correct running conditions and ofthe progress of the process. However, therequirements of tablet production are morefinely critical, and measurement of absorbedpower by itself is not a substitute for accuratedetermination of punch forces.
The drive belt
Variations in the mechanical resistance of amachine will induce corresponding variations intorque within the whole of the drive system.They will also be seen as changes in the tensionof the drive belt, and these can be used to actu-ate simple warning devices if an overload shoulddevelop. For example, the belt tension can besensed by means of a spring-loaded jockeypulley, which, in turn, can move against a micro-switch if the tension rises above an acceptablelevel.
The main shaft and eccentric
The main shaft and eccentric both rotate whenthe press is in operation. Torque measurementstaken from them would, therefore, have to betransmitted by slip-rings, or by some form oftelemetry link. The possible advantage of suchan area for gauging would be its facility for con-venient total enclosure, away from dust and gen-eral exposure. Its disadvantages include the costand complication of the telemetry link, togetherwith the inaccuracies introduced by friction inthe bearings and the slides. On balance, thesedisadvantages would usually outweigh theadvantage of using this area.
The machine frame
Early instrumentation systems were designed toavoid the problems of telemetry by concentrat-ing on those components that did not move. In1954, Higuchi et al. applied Baldwin SR-4 straingauges to the stationary frame of their Stokesmodel A-3 press in a system intended to provideforce measurements within �2% accuracy overthe range 0–3000 lb (0–14 kN). The strain gaugeswere used in an AC bridge configuration running
100 Tablet and capsule machine instrumentation
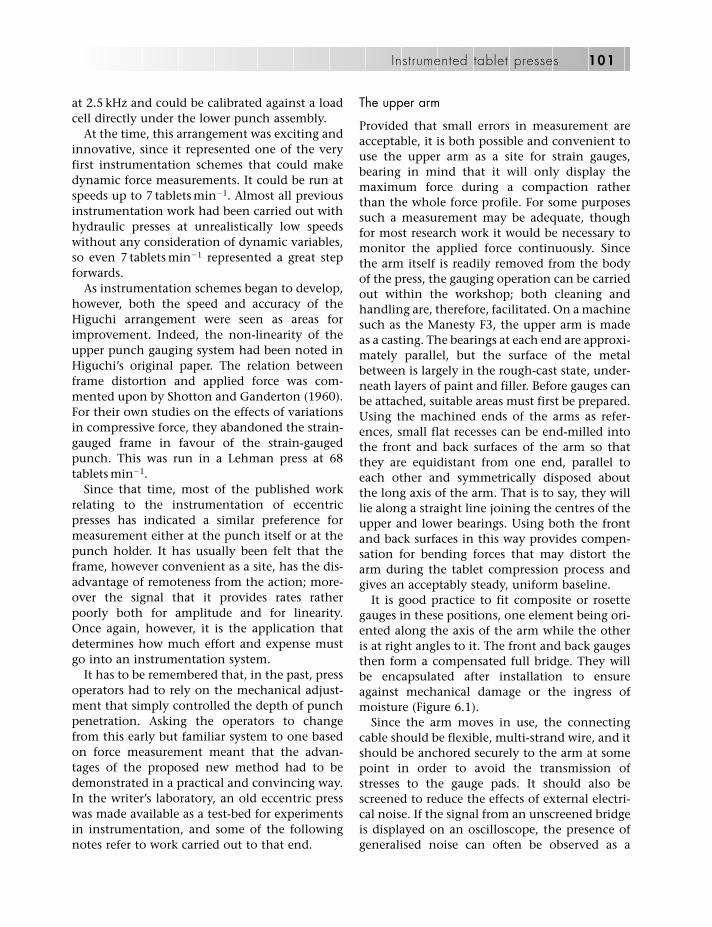
at 2.5 kHz and could be calibrated against a loadcell directly under the lower punch assembly.
At the time, this arrangement was exciting andinnovative, since it represented one of the veryfirst instrumentation schemes that could makedynamic force measurements. It could be run atspeeds up to 7 tablets min�1. Almost all previousinstrumentation work had been carried out withhydraulic presses at unrealistically low speedswithout any consideration of dynamic variables,so even 7 tablets min�1 represented a great stepforwards.
As instrumentation schemes began to develop,however, both the speed and accuracy of theHiguchi arrangement were seen as areas forimprovement. Indeed, the non-linearity of theupper punch gauging system had been noted inHiguchi’s original paper. The relation betweenframe distortion and applied force was com-mented upon by Shotton and Ganderton (1960).For their own studies on the effects of variationsin compressive force, they abandoned the strain-gauged frame in favour of the strain-gaugedpunch. This was run in a Lehman press at 68tablets min�1.
Since that time, most of the published workrelating to the instrumentation of eccentricpresses has indicated a similar preference formeasurement either at the punch itself or at thepunch holder. It has usually been felt that theframe, however convenient as a site, has the dis-advantage of remoteness from the action; more-over the signal that it provides rates ratherpoorly both for amplitude and for linearity.Once again, however, it is the application thatdetermines how much effort and expense mustgo into an instrumentation system.
It has to be remembered that, in the past, pressoperators had to rely on the mechanical adjust-ment that simply controlled the depth of punchpenetration. Asking the operators to changefrom this early but familiar system to one basedon force measurement meant that the advan-tages of the proposed new method had to bedemonstrated in a practical and convincing way.In the writer’s laboratory, an old eccentric presswas made available as a test-bed for experimentsin instrumentation, and some of the followingnotes refer to work carried out to that end.
The upper arm
Provided that small errors in measurement areacceptable, it is both possible and convenient touse the upper arm as a site for strain gauges,bearing in mind that it will only display themaximum force during a compaction ratherthan the whole force profile. For some purposessuch a measurement may be adequate, thoughfor most research work it would be necessary tomonitor the applied force continuously. Sincethe arm itself is readily removed from the bodyof the press, the gauging operation can be carriedout within the workshop; both cleaning andhandling are, therefore, facilitated. On a machinesuch as the Manesty F3, the upper arm is madeas a casting. The bearings at each end are approxi-mately parallel, but the surface of the metalbetween is largely in the rough-cast state, under-neath layers of paint and filler. Before gauges canbe attached, suitable areas must first be prepared.Using the machined ends of the arms as refer-ences, small flat recesses can be end-milled intothe front and back surfaces of the arm so thatthey are equidistant from one end, parallel toeach other and symmetrically disposed aboutthe long axis of the arm. That is to say, they willlie along a straight line joining the centres of theupper and lower bearings. Using both the frontand back surfaces in this way provides compen-sation for bending forces that may distort thearm during the tablet compression process andgives an acceptably steady, uniform baseline.
It is good practice to fit composite or rosettegauges in these positions, one element being ori-ented along the axis of the arm while the otheris at right angles to it. The front and back gaugesthen form a compensated full bridge. They willbe encapsulated after installation to ensureagainst mechanical damage or the ingress ofmoisture (Figure 6.1).
Since the arm moves in use, the connectingcable should be flexible, multi-strand wire, and itshould be anchored securely to the arm at somepoint in order to avoid the transmission ofstresses to the gauge pads. It should also bescreened to reduce the effects of external electri-cal noise. If the signal from an unscreened bridgeis displayed on an oscilloscope, the presence ofgeneralised noise can often be observed as a
Instrumented tablet presses 101
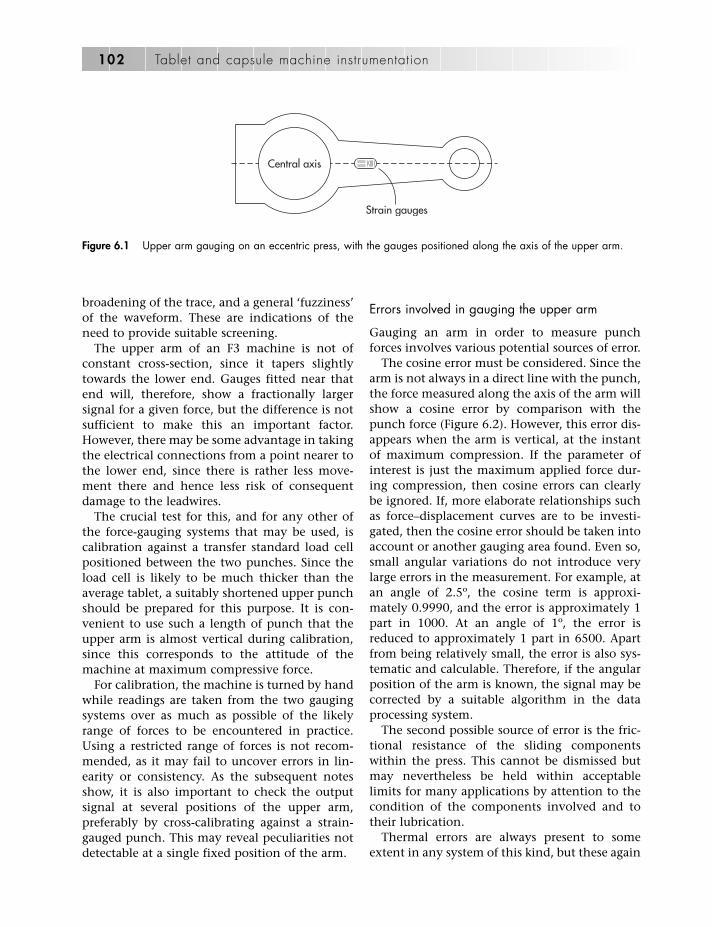
broadening of the trace, and a general ‘fuzziness’of the waveform. These are indications of theneed to provide suitable screening.
The upper arm of an F3 machine is not ofconstant cross-section, since it tapers slightlytowards the lower end. Gauges fitted near thatend will, therefore, show a fractionally largersignal for a given force, but the difference is notsufficient to make this an important factor.However, there may be some advantage in takingthe electrical connections from a point nearer tothe lower end, since there is rather less move-ment there and hence less risk of consequentdamage to the leadwires.
The crucial test for this, and for any other ofthe force-gauging systems that may be used, iscalibration against a transfer standard load cellpositioned between the two punches. Since theload cell is likely to be much thicker than theaverage tablet, a suitably shortened upper punchshould be prepared for this purpose. It is con-venient to use such a length of punch that theupper arm is almost vertical during calibration,since this corresponds to the attitude of themachine at maximum compressive force.
For calibration, the machine is turned by handwhile readings are taken from the two gaugingsystems over as much as possible of the likelyrange of forces to be encountered in practice.Using a restricted range of forces is not recom-mended, as it may fail to uncover errors in lin-earity or consistency. As the subsequent notesshow, it is also important to check the outputsignal at several positions of the upper arm,preferably by cross-calibrating against a strain-gauged punch. This may reveal peculiarities notdetectable at a single fixed position of the arm.
Errors involved in gauging the upper arm
Gauging an arm in order to measure punchforces involves various potential sources of error.
The cosine error must be considered. Since thearm is not always in a direct line with the punch,the force measured along the axis of the arm willshow a cosine error by comparison with thepunch force (Figure 6.2). However, this error dis-appears when the arm is vertical, at the instantof maximum compression. If the parameter ofinterest is just the maximum applied force dur-ing compression, then cosine errors can clearlybe ignored. If, more elaborate relationships suchas force–displacement curves are to be investi-gated, then the cosine error should be taken intoaccount or another gauging area found. Even so,small angular variations do not introduce verylarge errors in the measurement. For example, atan angle of 2.5º, the cosine term is approxi-mately 0.9990, and the error is approximately 1part in 1000. At an angle of 1º, the error isreduced to approximately 1 part in 6500. Apartfrom being relatively small, the error is also sys-tematic and calculable. Therefore, if the angularposition of the arm is known, the signal may becorrected by a suitable algorithm in the dataprocessing system.
The second possible source of error is the fric-tional resistance of the sliding componentswithin the press. This cannot be dismissed butmay nevertheless be held within acceptablelimits for many applications by attention to thecondition of the components involved and totheir lubrication.
Thermal errors are always present to someextent in any system of this kind, but these again
102 Tablet and capsule machine instrumentation
Strain gauges
Central axis
Figure 6.1 Upper arm gauging on an eccentric press, with the gauges positioned along the axis of the upper arm.

can be kept to low values, corresponding tobetter than 0.4 �e ºC�1, by the use of compositeSTC (self temperature compensating) gauges inmatched pairs.
We have previously noted that a well-usedeccentric press, a Manesty F3, had been madeavailable for experimental work in the writer’slaboratory. In an initial experiment, we fitted arosette strain gauge to the upper arm of themachine, gauging only its front surface and soproducing a half-bridge. The gauged arm wasthen calibrated at the National PhysicalLaboratory in an accurate transfer standardcompression-test machine. The calibrationproved to be remarkably good and did not showany obvious departures from linearity whenplotted out on graph paper. In other words, itwould certainly have been within �1%.
In order to check on the continued accuracy ofthe gauged arm, a transfer standard load cell(Type HS1, Graham and White Ltd) wasobtained. An externally gauged punch withstrain gauges in a balanced configuration wasalso prepared. Readings from both the arm and
the punch could be compared against each otherduring the compression of a tablet, while corre-sponding readings could be taken from thetransfer standard under static conditions.Compression curves produced from this arrange-ment were of normal appearance, and the maxi-mum readings from both arm and punch were inagreement. The demonstration proved entirelyconvincing, and we were consequently asked toapply the same arrangement to a second butconsiderably newer press of the same type.
In this next experiment, the arm of the newerpress was gauged exactly as before. Calibrationagainst the load cell, in a more or less fixed pos-ition, again appeared to be satisfactory. However,when signals from the arm were compared withthose from the instrumented punch through acomplete cycle of punch travel, a different pic-ture emerged. This time, the output signal fromthe arm showed what appeared to be a sine wavesuperimposed on the expected line (Figure 6.3).To investigate this unexpected result, the armwas disconnected completely from the punchholder and was allowed to hang freely from theupper drive eccentric. It was found that evenwith the arm completely unloaded in this way,slow rotation of the drive shaft nevertheless pro-duced a sinusoidal signal from the strain gauges.It became apparent that there was a very slightlack of parallelism between the main shaft andthe eccentric. This was rocking the upper end ofthe arm at each revolution and consequently itbent under its own weight. The effect was onlyapparent on a machine with reasonably well-fitting bearings. The looser bearings of the olderpress had been able to tolerate the misalignment.
The solution of this problem was quite sim-ply to be found in the use of correct gaugingmethods. When both front and rear surfaces ofthe arm were gauged symmetrically, as theyshould have been at the outset, bending effectswere cancelled out and the error disappearedcompletely.
In a third experiment, the upper arm of apractically new machine was fitted with straingauges as before, the gauges being carefully bal-anced again so that there would be no errorsresulting from out-of-plane bending. However,when the arm was tested against an instru-mented punch, a new set of errors came to
Instrumented tablet presses 103
Crank
F : F cos q
GuagesOutput : Fg
F3 Upper arm
F
Cosine error0.1% at 2.5°
q
Figure 6.2 The cosine error resulting from the use ofgauges mounted on the upper arm of an eccentric press ifthe arm is not vertical. The error is relatively small.
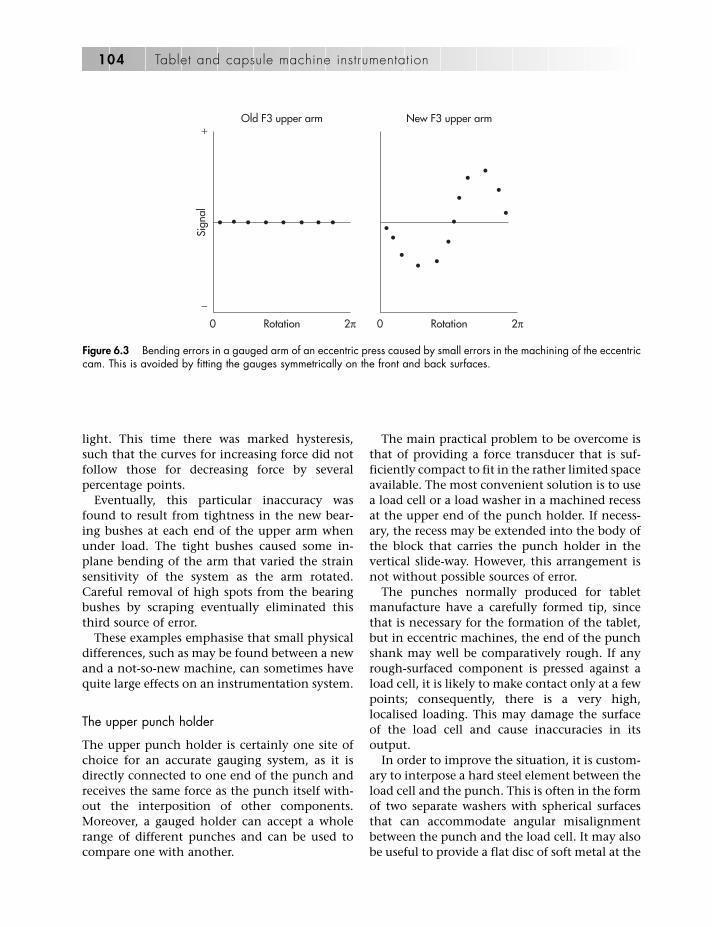
light. This time there was marked hysteresis,such that the curves for increasing force did notfollow those for decreasing force by severalpercentage points.
Eventually, this particular inaccuracy wasfound to result from tightness in the new bear-ing bushes at each end of the upper arm whenunder load. The tight bushes caused some in-plane bending of the arm that varied the strainsensitivity of the system as the arm rotated.Careful removal of high spots from the bearingbushes by scraping eventually eliminated thisthird source of error.
These examples emphasise that small physicaldifferences, such as may be found between a newand a not-so-new machine, can sometimes havequite large effects on an instrumentation system.
The upper punch holder
The upper punch holder is certainly one site ofchoice for an accurate gauging system, as it isdirectly connected to one end of the punch andreceives the same force as the punch itself with-out the interposition of other components.Moreover, a gauged holder can accept a wholerange of different punches and can be used tocompare one with another.
The main practical problem to be overcome isthat of providing a force transducer that is suf-ficiently compact to fit in the rather limited spaceavailable. The most convenient solution is to usea load cell or a load washer in a machined recessat the upper end of the punch holder. If necess-ary, the recess may be extended into the body ofthe block that carries the punch holder in thevertical slide-way. However, this arrangement isnot without possible sources of error.
The punches normally produced for tabletmanufacture have a carefully formed tip, sincethat is necessary for the formation of the tablet,but in eccentric machines, the end of the punchshank may well be comparatively rough. If anyrough-surfaced component is pressed against aload cell, it is likely to make contact only at a fewpoints; consequently, there is a very high,localised loading. This may damage the surfaceof the load cell and cause inaccuracies in itsoutput.
In order to improve the situation, it is custom-ary to interpose a hard steel element between theload cell and the punch. This is often in the formof two separate washers with spherical surfacesthat can accommodate angular misalignmentbetween the punch and the load cell. It may alsobe useful to provide a flat disc of soft metal at the
104 Tablet and capsule machine instrumentation
0
−
+
Rotation
Old F3 upper arm New F3 upper arm
Sign
al
2π 0 Rotation 2π
Figure 6.3 Bending errors in a gauged arm of an eccentric press caused by small errors in the machining of the eccentriccam. This is avoided by fitting the gauges symmetrically on the front and back surfaces.

shank end of the punch to act as a cushion forany small, hard, high spots there. Brass orannealed copper is a suitable material for thispurpose.
The punch securing screw may also cause dif-ficulties. On simple presses such as the ManestyF3, the punch holder carries a securing screwthat is tightened directly on to the shank of thepunch. A small inclined flat area is machined atthat point in order to provide a suitable bearingsurface for the end of the securing screw, and theinclination of this flat area helps to lock thepunch in its correct place. The screw system isentirely satisfactory for its normal purpose, but itcan cause problems in an instrumented press,since it alters the local distribution of stresses.Therefore, if the punch is secured in this manneragainst a load cell in the punch holder, the force on the punch tip will not all be transferredto the load cell. Some will be directed throughthe screw and the body of the holder.
Apart from this, each change of punchinvolves the loosening and re-tightening of thesecuring screw. After every such operation, a dif-ferent proportion of the punch force passes tothe load cell. Marshall (1983) suggested that thepunch-securing screws should be tightenedwhile the punches are under load, with a tabletor a plastic plug between them. However, eventhis precaution may not overcome person-to-person variations in the tightening force that isapplied. To some extent, the applied force on thescrew can be standardised if it is tightened witha torque wrench, but the screw itself is a veryimprecise component, and the torque on thescrew head is not accurately related to the axialthrust that it produces.
Müller et al. (1982) reported on the same prob-lem and showed that the output of their piezo-electric load cell was substantially dependent onthe torque used to tighten the punch-securingscrew, even though the screw itself had beenmade from brass. Calibration was restored whenthe depression in the punch was opened out toadmit some movement, and the brass screw was replaced with one made from Makrolon(polycarbonate).
Lindberg (1972) fitted a flanged punchthrough the centre of an annular load cell(Kistler type 902 A), and held the shank end of
the punch with an inclined securing screw. He commented that the screw had to allow somevertical movement of the punch within theholder.
In the author’s opinion, it is desirable to have a means whereby the force transferred tothe load cell remains completely independent ofthe way in which the punch is secured in itsholder, unless there is to be a re-calibration aftereach change of punch.
One possibility is that of machining out thepunch holder so that its central recess is appreci-ably larger than usual, and then fitting a sepa-rate inner housing into the enlarged recess. Thepunch is held within the inner housing bymeans of the usual securing screw, while thehousing is retained against the load cell withinthe punch holder by an annular fastener thatmay itself be spring-loaded. Variations in thetightness of the punch-securing screw then haveno effect on the way in which the inner housingbears against the load cell. It is, naturally, import-ant to ensure that the inner housing cannotrotate with respect to the outer punch holder,since the punch will probably not be concentricwith the axis of rotation. Apart from this, theassembly may well need to be used with punchesthat are not themselves round.
This approach was used by Jungersen andJensen (1970) in the instrumentation of a DiafTM 20 eccentric machine. In this instance, theupper punch was mounted at the lower end ofa hollow steel holder that had been fitted withfoil strain gauges (Figure 6.4). Somewhat simi-lar arrangements were reported by Poldermanet al. (1969) and by Duchêne et al. (1972). Thelatter group retained their punch by means ofan annular cover, which fitted over it as far asthe end flange and was itself screwed to thestrain-gauged cylinder above.
Load cells, as already described, may either beof the strain-gauged variety or may be piezoelec-tric devices. At one time, it was difficult to findstrain-gauged load cells that were small enoughto fit into an upper punch holder; consequently,many laboratories elected to use piezoelectriccells. Apart from being compact, these cells havebeen claimed to be more sensitive, more rugged,more linear and less affected by temperaturechanges than their strain-gauged equivalents.
Instrumented tablet presses 105

But as noted above, some piezoelectric devicesare less suitable for the measurement of static orslowly changing loads. Eccentric presses areoften used for quasi-static compression studies,and in such cases, the possibilities of errorthrough leakage of the charge must be borne inmind. This being said, the availability of piezo-electric load cells with integrated amplifiers hasimproved the capabilities of this transducer,although these cells have to be slightly larger toaccommodate the internal electronics.
Marshall (1972) commented that strain gauges‘require a change in linear dimension of themember to which they have been bonded’. Thisis an interesting point, since it appears to implythat the piezoelectric load cells deform to a lesserextent under load. In fact, there often seems tobe less difference between the two types of trans-ducer than Marshall’s comment would suggest. Ifwe take a miniature piezoelectric cell in theKistler range (type 9211) for example, its heightis some 6 mm, while its quoted stiffness isapproximately 400 N lm�1 and its measuringrange is 0–2500 N. On this basis, the devicewould contract by some 6.25 lm at full load,which represents approximately 1000 le. Going
next to a cell of much larger capacity, the M 195Q/300 piezoelectric force washer from theMeclec Company has a quoted stiffness of more than 15 kN �m�1, a height of 15 mm and a range of 0–300 kN. Here the contraction under full load would be 20 lm, or 1330 le.Conventional foil or semiconductor gauges canbe successfully operated at this general strainlevel, and 1000 le at full load would be a gooddesign target for a transducer system.
From these figures it would appear that therecan be an almost equal stiffness for someexamples of the two types of transducer, and thatthis parameter by itself would not be sufficientto justify the use of a piezoelectric device.
The punch
From some points of view, the punch itself rep-resents the best site for measurements of punchforce. It is completely direct in its associationwith those forces, and it is independent of anyshortcomings in the tablet press as a whole. Theinstrumented punch, like the load cell, can beremoved from the press at any time, andmeasurements can be compared on similar
106 Tablet and capsule machine instrumentation
Upper punch holder
Machine frame
Upper punch is held instrain-gauged steel insert
Strain guages
Figure 6.4 The upper punch assembly of the Diaf TM 20 eccentric press showing measurement of upper punch forceusing a system designed to overcome the asymmetrical effect of the punch-securing screw (Jungersen and Jensen, 1970).
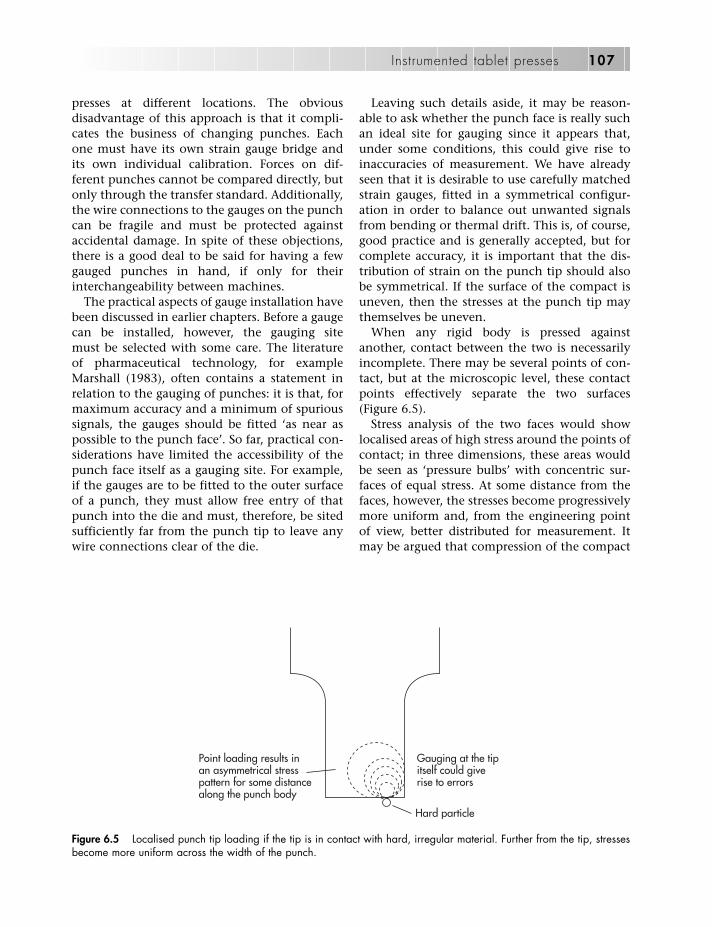
presses at different locations. The obviousdisadvantage of this approach is that it compli-cates the business of changing punches. Eachone must have its own strain gauge bridge andits own individual calibration. Forces on dif-ferent punches cannot be compared directly, butonly through the transfer standard. Additionally,the wire connections to the gauges on the punchcan be fragile and must be protected againstaccidental damage. In spite of these objections,there is a good deal to be said for having a fewgauged punches in hand, if only for theirinterchangeability between machines.
The practical aspects of gauge installation havebeen discussed in earlier chapters. Before a gaugecan be installed, however, the gauging site must be selected with some care. The literatureof pharmaceutical technology, for exampleMarshall (1983), often contains a statement inrelation to the gauging of punches: it is that, formaximum accuracy and a minimum of spurioussignals, the gauges should be fitted ‘as near aspossible to the punch face’. So far, practical con-siderations have limited the accessibility of thepunch face itself as a gauging site. For example,if the gauges are to be fitted to the outer surfaceof a punch, they must allow free entry of thatpunch into the die and must, therefore, be sitedsufficiently far from the punch tip to leave anywire connections clear of the die.
Leaving such details aside, it may be reason-able to ask whether the punch face is really suchan ideal site for gauging since it appears that,under some conditions, this could give rise toinaccuracies of measurement. We have alreadyseen that it is desirable to use carefully matchedstrain gauges, fitted in a symmetrical configur-ation in order to balance out unwanted signalsfrom bending or thermal drift. This is, of course,good practice and is generally accepted, but forcomplete accuracy, it is important that the dis-tribution of strain on the punch tip should alsobe symmetrical. If the surface of the compact isuneven, then the stresses at the punch tip maythemselves be uneven.
When any rigid body is pressed againstanother, contact between the two is necessarilyincomplete. There may be several points of con-tact, but at the microscopic level, these contactpoints effectively separate the two surfaces(Figure 6.5).
Stress analysis of the two faces would showlocalised areas of high stress around the points ofcontact; in three dimensions, these areas wouldbe seen as ‘pressure bulbs’ with concentric sur-faces of equal stress. At some distance from thefaces, however, the stresses become progressivelymore uniform and, from the engineering pointof view, better distributed for measurement. Itmay be argued that compression of the compact
Instrumented tablet presses 107
Hard particle
Point loading results inan asymmetrical stresspattern for some distancealong the punch body
Gauging at the tipitself could giverise to errors
Figure 6.5 Localised punch tip loading if the tip is in contact with hard, irregular material. Further from the tip, stressesbecome more uniform across the width of the punch.

will spread the loading across the whole face ofthe punch, so that point contacts no longerexist. This is, of course, true to some extent; butthe act of compression alone does not necess-arily result in a completely even distribution ofthe forces across the punch face, or of the mater-ial within the resultant tablet. If the originalmaterial is unevenly packed in the die beforecompression, there will be at least some residualtraces of a corresponding unevenness in thecompleted tablet. After compression, these tracesmay be reflected as variations in the amount ofrelaxation in the surface of the tablet.
The magnitude of any such effect must dependon the nature of the original material, its particlesize, its surface hardness and its uniformity offilling. Nevertheless, such effects do exist, and inthe opinion of the writer they should not beentirely ignored during the search for measure-ment techniques of greater and greater sensi-tivity. It has been suggested that the use of agauging site near to the punch tip will minimiseinaccuracies that result from longitudinal distor-tion of the punch during compression. In prin-ciple, that distortion should be constant over theparallel section of the punch. Moreover, if inac-curacies do exist, they should be determinable atthe calibration stage.
From the engineering point of view, it wouldappear to be sound practice to mount the straingauges well back from the punch face, at a pos-ition where the stresses in the metal have becomelargely uniform over the cross-section of thepunch.
One of the best ways of reducing the effects ofasymmetrical loading in a rod that is to be usedas a transducer is to gauge along its neutral axis. This is the technique adopted in the com-mercial manufacture of strain-gauged bolts andclevis pins, and it involves the installation ofgauges on the inside of a relatively narrow holemachined along the centre of the rod. Clevispins are usually fitted with gauges that sense theshear forces produced by the two sides of a roller,whereas gauged bolts are arranged to measuretensile or compressive loads. The same tech-nique can be used in the instrumentation of apunch. A punch of this kind is normally made intwo parts, the tip section being gauged beforethe head end is fitted. A slightly more complex
system was described by Schmidt et al. (1986),who constructed a two-part punch that carried a central axial strain-gauged element but alsoincorporated a miniature piezoelectric forcewasher. It was used in a Fette P2 press.
Mounting the gauges internally, along an axialcavity, has the double merit of allowing thegauged area to be as near to the tip as is consid-ered optimal, while providing the greatest poss-ible protection for the gauges themselves.Naturally, the connecting leads still represent apotentially weak point, as they must remainundamaged during the compression cycle.Neutral axis gauging has been utilised in the‘Portable Press Analyser’ that was sold byPuuman Oy in Finland and by ‘The Punch’ soldby SMI Incorporated. Both of these systems aredescribed later in this chapter.
Measurement of the lower punch force
The general considerations that we have notedin relation to the upper punch will, to a largeextent, also apply to the lower punch.However, there are two points of difference,namely the range of measurement, and thephysical configuration.
Firstly, the gauging system must not only beable to measure compression forces in the range,which may be tens of kilonewtons, but must alsobe sufficiently sensitive to measure the muchsmaller forces, perhaps only a few hundrednewtons, involved in ejecting the finishedtablet.
Secondly, though the upper and lowerpunches themselves may be quite similar, thereis somewhat more room for instrumentationaround the area of the lower punch. This facili-tates the provision of a suitably gauged punchholder, so making it less necessary to have largenumbers of gauged punches.
The lower punch holder
There have been three basic approaches to theproblem of measuring forces at the lower punchholder.
One method has been that of applying straingauges to the outer surface of the holder, at a
108 Tablet and capsule machine instrumentation
level below that of the punch. This was doneby Shotton and Ganderton (1960) in theirstudies on tablet strength, and illustrations of asimilar nature have appeared in various sub-sequent papers, for example Schwartz (1981).The punch holder is machined with an annu-lar groove at the gauging level so that thereduced cross-section provides improved sensi-tivity as well as some physical protection forthe gauges. As usual, gauges are applied in asymmetrical configuration in order to minimisespurious signals from bending: Shotton andGanderton, for example, fitted three gauges,equally spaced around the holder. The threegauges were connected in series and formed anactive quarter-bridge.
A second approach has been that of using anexternal load cell underneath the lower end ofthe punch holder. This method was used in someof the earliest work, such as that of Higuchi et al.(1954). Using a commercially available load cellin this way enabled Higuchi’s group to makeforce measurements quickly and easily. The cellcould itself be removed for deadweight cali-bration at any time, and there was no immediatenecessity for the group to acquire the skills ofprecise strain gauge installation. The lowerpunch holder had to be modified, but the modi-fication was simply in the form of an extensionrod that transmitted vertical thrust from theholder to the button of the Baldwin load cell.
Small load cells have been inserted within thepunch holder itself, in direct contact with thepunch shank. Williams and Stiel (1984) removeda portion of their holder and interposed a sealedpiezoelectric element, together with an integralamplifier, between the two halves. Using an inte-gral amplifier goes some way to overcoming thelow-speed characteristics of the piezoelectricdevices. Piezoelectric load cells were also used,for example, by Müller et al. (1982) and Graffneret al. (1985).
The engineering techniques used for theinstallation of a piezoelectric load cell are them-selves equally applicable to load cells of thestrain-gauged type. However, some care may benecessary in the selection of a sufficiently com-pact unit, since, in general, strain-gauged cellsare slightly larger.
Of these three approaches, that of using the
external load cell is probably the least satisfac-tory. Although it is convenient to employ a stan-dard commercial unit in this way, the adaptationof the press is such that it no longer runs in anormal manner. The instrumentation of a pressshould always be ‘transparent’ in the sense thatthere is no change of operation or behaviour,otherwise any conclusions drawn from its usewill be suspect.
Strain gauging the punch holder is more satis-factory, but may give a fairly low sensitivitybecause of the large cross-sectional area of theregion that can be gauged. For that reason, it isworthwhile considering the use of semiconduc-tor gauges. There may also be some doubt, just asthere may be with the upper punch holder, as tothe way in which stress distribution is affectedby the tightness of the punch-securing screw.
The inserted load cell has once again theadvantage of being a standard commercial unit,and it should give good results if care is takenwith its installation. Clearly, if the whole upperpart of the punch holder is mounted on top ofthe load cell, then effects from the securingscrew will not be of any great significance. If thecell is fitted inside the punch recess, then meansmust be found to ensure that the punch can beclamped in a reproducible manner.
Jungersen and Jensen (1970), also recognisingthe possibility of uneven stress distribution, useda strain-gauged metal cylinder as a load cell andfitted it axially inside the body of their lowerpunch holder between two hard steel balls. Theupper of the two balls remained in direct contactwith the lower end of the punch and transmittedcompressive forces from it to the load cell. Thisarrangement prevented any tendency to sideloading (Figure 6.6).
A compromise is possible by constructing areplacement punch holder that is made in twoparts: the inner portion carries strain gauges andacts as an integral load cell (Ridgway Watt,1983a). As with most other eccentric presses, theManesty F3 has a lower punch holder that is inthe form of a substantial metal cylinder, around210 mm in overall length. Its outer surface isthreaded so it may be positioned with appropri-ately threaded collars in the lower arm of themachine; at its upper end there is a machinedrecess to hold the punch. Our construction
Instrumented tablet presses 109

reproduced the standard form (Figure 6.7) but itnow consisted of two components that fittedtelescopically, one inside the other. The innercolumn was 22 mm in diameter and was a slid-ing fit inside the threaded body. It carried apunch holder of normal dimensions at its upperend and had a full, symmetrical, strain-gaugedbridge, centred at a height of some 50 mm fromits lower end. The inner column was beddeddown on a soft annealed copper washer andsecured by means of three M3 screws. The elec-trical leads from the strain gauge bridge weretaken along a slot in the wall of the outer com-ponent, and then brought out at the lower endof the assembly.
The advantages of this arrangement were thatit provided improved sensitivity for the gauges,since they were on a column of reduced diam-eter, that it positioned the gauges in a regionwhere the stresses were uniform, and that it gave
very good protection against accidental damagesince the gauges were within the steel body ofthe holder. We found that it was convenient inpractice to retain the usual concentric drillingfor the punch ejector rod, and to do so at itsnormal diameter of some 8.0 mm.
It is also worthwhile emphasising two pointsin relation to the materials of construction. Moststeels have a very similar Young’s modulus ofelasticity, E. Whether the steels are mild, alloyedor stainless of various grades, they will usuallyhave an E value somewhere in the region of21 � 1010 N m�2. The lowest value for a standardsteel would probably appear in type 316 stain-less, while the highest might be in achrome–vanadium alloy; but there is not morethan approximately 10% difference betweenthese. By comparison, both the elastic limit andthe yield point can vary by as much as 10-foldfrom one steel to another. In designing a com-ponent for strain gauging, therefore, it is mostimportant to check that the material chosen will
110 Tablet and capsule machine instrumentation
Strain-gauged cylinder
Supporting block
Steel balls
Lower punch
Figure 6.6 The lower punch assembly of the Diaf TM 20eccentric press showing measurement of lower punchforce. A load cell is loaded between two steel balls toprevent off-axis loading (Jungersen and Jensen, 1970).
Copper washer
Gauges
Figure 6.7 Measurement of lower punch force using atwo-piece punch holder (Ridgway Watt, 1983a).
not only give the required strain rate per unitload but also that it will stand up to the largestpredictable load without permanent defor-mation or catastrophic failure. It is usual to allowa safety factor of at least two: in other words, themaximum stress should not take the componentmore than half way to its elastic limit. In anunguarded moment, the writer once calculatedthe required cross-section necessary in a lowerpunch holder in order to provide a good signalfrom the ejection force, failing to remember thatit would also have to stand the full force of compression. The result of this failure was a cor-responding failure of the component itself,which slowly buckled under load and had to bere-constructed with a larger cross-section.
The lower punch
The procedure for gauging a lower punch will bevirtually thesameas that foranupperpunch,apartfrom the need for measurement of ejection forces.In order to provide the necessary improved capa-bility for handling small signals, one can con-veniently use semiconductor gauges in thisapplication. Their greatly increased sensitivity, bycomparison with that of foil gauges, makes themvery suitable for use with lower punches. Theirincreased cost is trifling when seen in relation tothat of the installation as a whole, and theirthermal characteristics nowadays can comparewell with those of foil gauges. Their dynamicrange can extend to well over 100 000 to 1, sincethe lower end of their practical scale is likely to besomewhere around 0.01 le, while the upper endwill be well over 11 000 le. For a rough estimationof what this means in practice, let us assume apunch area of 1 cm2 and a Young’s modulus ofapproximately 21 � 1010 N m�2. The proportionalchange in length foragivenforcecanbecalculatedfrom the expression strain � 1/E � force (in new-tons per metre squared). A force of 1 N should thenresult in a dimensional change of approximately0.05 �e: 2 tonnes would produce 1000 �e. Themaximum recommended load for a flat, shallowor normal concave punch of that cross-sectionalarea is approximately 8 tonnes, though it isunlikely that such a large force would normally beused in practice.
Rotary tablet presses
Almost all commercial tablet production is car-ried out on rotary presses, some of which canturn out as many as one million tablets per hour.The rotary press achieves these high productionrates by the use of many punch and die sets, fit-ted round the periphery of a turret. The dies arefilled at one or more points on the machine,and, as the turret rotates, the punch heads arebrought, in turn, between pairs of stationarymetal rollers. Passing between the rollers, thepunch heads are forced together, and exert acompressive force on the granulation in the diesbetween them.
The action of the rotary press differs fromthat of the eccentric press in several ways. Inthe former, both punches move into the dietogether as the tooling passes through therollers, whereas in the latter, it is only the upperpunch that moves to any extent. Furthermorethe two machines have different force–time andforce–displacement characteristics, since one isdriven by rollers while the other uses aneccentric.
Because both these characteristics can be crit-ical in the formation of a satisfactory tablet,materials will not necessarily perform equallywell in the two types of machine. Furthermore,though it is somewhat easier to instrument aneccentric press, the formulator must be able towork with a machine that represents pro-duction equipment. This means solving anumber of instrumentation problems, mostwhich are associated either with the rotationitself or with the large numbers of punch-and-die sets.
We have previously noted the train of com-ponents that runs in the eccentric machinebetween the drive motor and the punch. Therotary machine has an analogous train, whichincludes the machine frame, the roller supportshafts or ‘roll-pins’, the rollers themselves, andthe punches. There are, of course, no separatepunch holders in this type of press. Once again,all these components have been used as gaugingareas, and are worth examination from thatpoint of view.
Instrumented tablet presses 111

The machine frame
When a rotary press is operated, the punchheads pass between the upper and lower com-pression rollers, exerting a force between them.This force is resisted by the frame, which isdesigned to maintain the rollers at a constantseparation, and varying amounts of strain arethereby induced within the elements that con-stitute the frame. Measurement of these strainshas quite frequently been used as a means ofinferring the forces at the punch tips, althoughthe relation between the two quantities is notalways straightforward.
One of the earliest studies in rotary pressinstrumentation was that by Knoechel et al.(1967), who worked on a Stokes model 540-35and a modified Stokes model BB2-27. The designrequirements for their system included the facil-ity to use any punches and dies, the measure-ment of individual punch forces and the abilityto transfer measurements from one machine toanother. On the first two grounds, they electedto work with the machine frame as they felt thatit was desirable to have detachable transducers.One solution was to take out some of the exist-ing screws and bolts in the machine and toreplace them with strain-gauged versions. Bothsemiconductor and foil gauges were used,according to the available strain levels at thepoints of measurement. The upper punch forcewas measured on the Stokes 540-35 press andthe lower punch force on the Stokes BB2-27press (Figure 6.8).
As the measurement was indirect, the valuesobtained included errors represented by the fric-tion in the punch guides and in the overloadmechanism, but the authors considered these tobe negligible. However, the accuracy of measure-ment was limited by the fact that the output signals were read from the screen of an oscillo-scope, on a scale of approximately 0.6 mm kN�1,so errors from friction in the mechanism couldeasily have escaped notice.
Additionally, it is perhaps worth noting thatthe compressive force on the BB2-27 press wasonly measured at the lower punch, on theassumption that the upper and lower punchforces would be equal. More sensitive methodshave subsequently established that the forces on
the upper and lower punches are not necessarilythe same.
In the following year, Goodhart et al. (1968)published an account of work on the instrumen-tation of a Manesty 45-station Rotapress. In thisstudy, various sites were tested for signalstrength, uniformity and freedom from extrane-ous noise (Figure 6.9). Out of six sites evaluated,the authors concluded that the most satisfactorywas the upper end of the compression column,just below the pin supporting the upper roll car-riage. The surface of the column at this point wasbrought to a mirror finish, and strain gaugeswere then bonded directly to each side, in a bal-anced configuration. Even so, the measured levelsat this point were only in the region of 20–40 le,which corresponded to approximately one-tenthof the force at the punch tip. Other sites werefound to produce poor or noisy signals.
The adjusting wheel eye-bolts, which supportthe lower roll carriers on the Stokes BB2 press,were also used by Wray (1969) and later bySalpekar and Augsburger (1974). The tie rod,which joins the upper and lower roll carriages,has been a popular site for instrumentation. Sotoo, in some machines, has been the end of thecompression column. In this last position, loadwashers can be used under the securing nuts.
The problem of locating the best site forgauges is underlined by these studies. As far asthe magnitude of the signal is concerned, stressanalysis of the machine frame could have ident-ified suitable areas at an early stage. A techniquesuch as SPATE could have provided, had it beenavailable in those days, a full picture of the stressdistribution. It would not necessarily haveshown up high-frequency noise, though thiswould have been detected by the use ofexploratory strain gauging. The noise itself mayresult from ‘ringing’ in the structure when onepart strikes another – for example, when a punchhead strikes the pressure roll – and may, in someinstances, produce resonances in the overloadspring system.
When the strain level in a component undertension is too low to provide a really adequatesignal, there is always a temptation to considerincreasing the strain by thinning the com-ponent. Marshall (1983) commented that if atie rod is to be strain gauged, it must be ‘necked
112 Tablet and capsule machine instrumentation

(a) (b)
Strain-gauged bolt
Loading beam
Oscillations in thecompression springmay produce a noisysignal
This type of gauging could becarried out relatively easily.It was, however, remote fromthe punches and gave smallsignals which were not alwaysaccurately linear
Upper punch
Lower punch
Lower compression roll
Strain-gaugedeye-bolt
Tension springhousing
As before, this arrangementis simple to fit, but itsresponse depends on thecondition of the pivots
Figure 6.8 Measurement of force in two rotary presses using bolts fitted with external strain gauges. (a) Upper punch force measured on a Stokes 540-35 press;(b) lower punch force measured on a Stokes BB2-27 press (Knoechel et al., 1967).

down’ to improve the sensitivity of measure-ment. Necking down, or thinning, in this way,results in a locally increased strain in proportionto the change of cross-sectional area, and henceto a larger signal. However, in some componentsit will alter the mechanical response of themachine and may, therefore, be thought inadvisable.
Where the component is relatively long, a poss-ible alternative solution may be to introduce astrain shunt by attaching a bar of similar metalby the side of it, welding at two well-separatedpoints, as shown in Figure 6.10. If that added bar is itself necked-down at its centre, there willbe a local concentration of stress there when the main component stretches. A gauge at thethinned region will thus give an appropriatelyincreased signal but will cause little change in the mechanical stiffness of the heavycomponent.
One problem with the early instrumentationsystems was the relative crudity of their associ-ated data-handing and read-out equipment.Measurement from a Polaroid photograph of an
oscilloscope trace was an imprecise operation bymodern standards, and it was often not too clearwhether the basic procedure was giving adequateaccuracy or linearity. Certainly, Ridgway (1982)has commented that ‘easily-obtainable measure-ments can be made on the main frame or thepressure-roll carrier; these tend to lack accuracy.’
What these pioneering experiments do seemto show is that the careful selection of a gaugingsite can make an appreciable difference in signalquality. One would no longer expect to use theoscilloscope trace as the sole means of accuratemeasurement, but it is still a valuable indicatorof noise on the signal and is certainly worthusing from the diagnostic point of view.
The precise measurement of the forces them-selves is, of course, likely to be achieved throughmicroprocessor electronics that can handle sig-nals of fairly low amplitude and linearity. In thatcontext, measurements taken from the machineframe are still being used. Moller-Sonnergardand Kristensen (1978) used this approach intheir instrumentation of a Kilian Prescoter, fit-ting semiconductor strain gauges to the surface
Instrumented bolton pull-down cam
Load washer underejection ramp
D
C
A
B
20–30 microstrainin normal use
Figure 6.9 Measurement of force in a rotary press, using sites remote from the punches. A, top pressure link above eye;B, bottom pressure link at the narrowest point; C, upper section of compression column; D, lower section of column abovetable (Goodhart et al., 1968).
114 Tablet and Capsule Machine Instrumentation
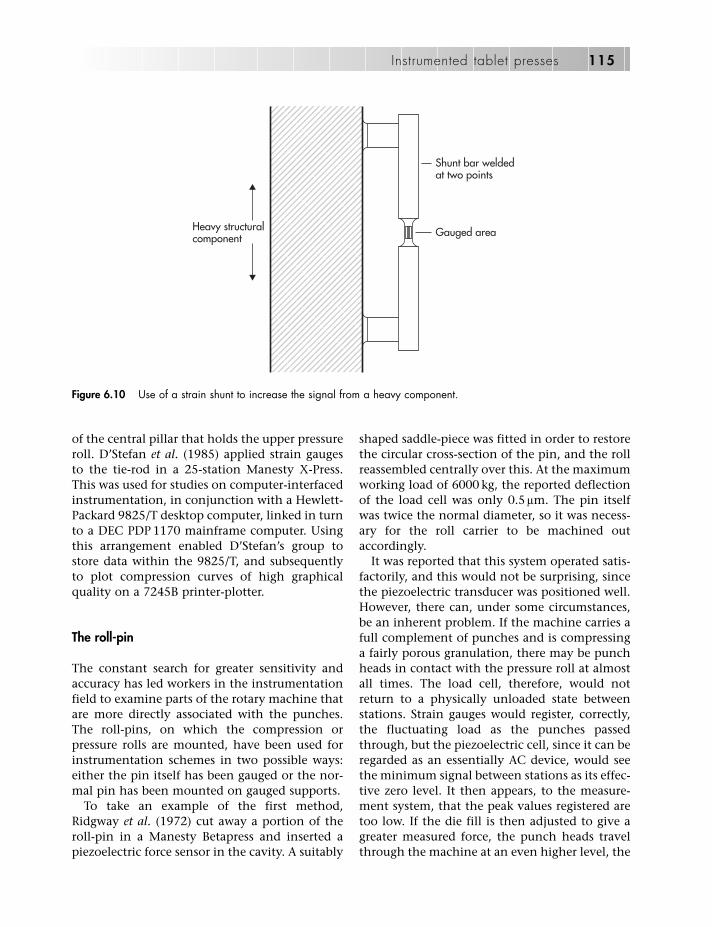
of the central pillar that holds the upper pressureroll. D’Stefan et al. (1985) applied strain gaugesto the tie-rod in a 25-station Manesty X-Press.This was used for studies on computer-interfacedinstrumentation, in conjunction with a Hewlett-Packard 9825/T desktop computer, linked in turnto a DEC PDP 1170 mainframe computer. Usingthis arrangement enabled D’Stefan’s group tostore data within the 9825/T, and subsequentlyto plot compression curves of high graphicalquality on a 7245B printer-plotter.
The roll-pin
The constant search for greater sensitivity andaccuracy has led workers in the instrumentationfield to examine parts of the rotary machine thatare more directly associated with the punches.The roll-pins, on which the compression orpressure rolls are mounted, have been used forinstrumentation schemes in two possible ways:either the pin itself has been gauged or the nor-mal pin has been mounted on gauged supports.
To take an example of the first method,Ridgway et al. (1972) cut away a portion of theroll-pin in a Manesty Betapress and inserted apiezoelectric force sensor in the cavity. A suitably
shaped saddle-piece was fitted in order to restorethe circular cross-section of the pin, and the rollreassembled centrally over this. At the maximumworking load of 6000 kg, the reported deflectionof the load cell was only 0.5 lm. The pin itselfwas twice the normal diameter, so it was necess-ary for the roll carrier to be machined outaccordingly.
It was reported that this system operated satis-factorily, and this would not be surprising, sincethe piezoelectric transducer was positioned well.However, there can, under some circumstances,be an inherent problem. If the machine carries afull complement of punches and is compressinga fairly porous granulation, there may be punchheads in contact with the pressure roll at almostall times. The load cell, therefore, would notreturn to a physically unloaded state betweenstations. Strain gauges would register, correctly,the fluctuating load as the punches passedthrough, but the piezoelectric cell, since it can beregarded as an essentially AC device, would seethe minimum signal between stations as its effec-tive zero level. It then appears, to the measure-ment system, that the peak values registered aretoo low. If the die fill is then adjusted to give agreater measured force, the punch heads travelthrough the machine at an even higher level, the
Instrumented tablet presses 115
Heavy structuralcomponent
Shunt bar weldedat two points
Gauged area
Figure 6.10 Use of a strain shunt to increase the signal from a heavy component.

error is compounded, and the system drives itselfto destruction.
For some time, the piezoelectric sensingmethod was used by Manesty Machines as abasis for the automatic control of tabletweight. However, the problems of zero driftwere such that the Manesty system, the ‘TabletSentinel’, was eventually redesigned usingstrain gauge sensors. Other tablet machinemanufacturers, almost without exception, nowalso use strain gauges for choice in their ownforce measurement and control systems.
It has been said that hindsight is always‘twenty–twenty’, and there is no doubt thatlooking back, one can often see that instrumen-tation schemes have not always gone accordingto plan. However, it can be instructive to examine past errors and to learn from them. Forexample, at one time we ourselves had theopportunity to acquire a completely new 16-station Manesty Betapress and to equip it with acomprehensive measuring system (Ridgway Wattand Rue, 1979). It seemed good practice to takeforce measurements from the compression andpre-compression rollers, and we were advised touse piezoelectric load washers for this purpose,since at that time the problem of zero drift wasnot widely appreciated. The upper and lowerroll-pins were modified so that the bronze bear-ing bush at one end fitted into a steel block,mounted between two side pieces that con-strained it to move only in the vertical plane.Each block was spring-loaded against a Kistler902A piezoelectric load washer so as to maintaincontinuous contact between the two. In practice,the other end of the roll-pin was found to move,if only slightly, in its bronze bush; consequently,the effective length of the pin was not definable.It was, however, possible to overcome this par-ticular problem by splitting the bush and thenclamping it tightly around the roll-pin.
The pre-compression roller assemblies weremounted on vertical rods. Each was intendedto be a sliding telescopic fit in an outer blockthat held a further load washer, and as before,the rod and the washer were spring-loadedtogether.
When the system was tested, one problembecame apparent at once: the pre-compressionrollers did not give the expected signals. As
noted above, the physical movement required toprovide full-scale output from a piezoelectricload washer is extremely small. That movementwas not sufficient to overcome the sticking fric-tion between the sliding parts, and a proportionof the force consequently failed to reach thewasher. When the telescopic arrangement wasreplaced with one in which the rollers weremounted on a bending beam, using straingauges to monitor the bending forces, muchmore satisfactory results were obtained.
If we were to carry out this exercise again, wewould probably opt for the use of a commer-cially made load cell. This could be of the shearbeam type, with the roller support block bolteddirectly on to it. Not only would this provide avirtually frictionless movement for the rollerblock, but it could be removed for easy cali-bration. Alternatively, an internally gauged clevispin could be used in place of the plain roll-pin.As with the main compression rollers, thismethod has the particular advantage of requir-ing no engineering work on the press itself, sincethe original plain pins can be replaced directlywith gauged pins of the same diameter.
In order to verify the performance of the maincompression roller system, a strain-gaugedpunch was first prepared to establish that it hada reliable and linear output when measuredagainst a transfer standard load cell. When thesignal from the punch was compared with thatfrom the load washer, however, a curious factemerged. The calibration curve from one oper-ator was reasonably linear, while that from asecond operator was not. Investigation showedthat one of the two took readings quickly, whilethe other took more time over them, and in thattime the charge was leaking away. No such prob-lems were ever encountered with the strain-gauged components and their associatedamplifiers, all of which gave consistent results.
Under steady running conditions, correspond-ing to those of industrial production, the piezo-electric load cells also gave consistent results,and other workers appear to have come to thesame conclusions. A review by Moldenhaueret al. (1980) made the same point. Müller et al.(1982) worked with both strain gauges andpiezoelectric transducers. They favoured thepiezoelectric transducers and published compara-
116 Tablet and capsule machine instrumentation

tive curves that certainly demonstrated a nois-ier trace from the strain gauges. However, in ourown laboratories we have seen widely differingnoise levels from otherwise identical trans-ducers. In these instances, the source of the noisewas traced using an oscilloscope and was recti-fied by appropriate screening. Of course, theconnections between a piezoelectric transducerand its associated charge amplifier must alwaysbe of the highest electrical quality, since thesignal is of such low power. The cable must,therefore, be of a low-loss type with completescreening. The wiring between a strain gaugebridge and the bridge amplifier must take powerin, as well as a signal out, and is perhaps moresusceptible to extraneous noise. It may notalways be realised that care in the screening ofthese leads can be just as important as with anyother type of transducer.
No doubt the controversy over the relativemerits of piezoelectric cells and strain gauges willcontinue. But for an experimental or semi-experimental press, to be used either dynami-cally or statically, in research or development,we would prefer to use strain gauges at allmeasurement points.
It will be apparent that the system outlinedabove had disadvantages for use in staticmeasurements, though it also involved majormodifications to the Betapress itself. A mechan-ically simpler approach would have been tosubstitute internally gauged roll-pins for theoriginal solid ones, and very little engineeringwork would have been necessary. Strain gaugesare fitted at two regions in order to sense theshear forces applied by the pressure roll, asshown in Figure 6.11.
This approach is, in fact, used by some tabletpress manufacturers for original equipment; it isthe method adopted by Frogerais, Korsch andothers. Apart from this, there are other advan-tages to be gained by using strain-gauged trans-ducers, in so far as it is then possible tostandardise on one type of signal amplifierinstead of two.
The pressure roll
The difficulties that were experienced in thedevelopment of the early frame-gauging arrange-ments led to investigations of the roll-pin and itssupports as alternative transducer sites. Work hasalso been directed to instrumentation of theroller itself. Deer et al. (1968) designed a modi-fied pressure roll that was partly cut away toallow for some amount of distortion under load.In essence, the roll was divided into a stationaryinner hub section, with two horizontal spokes,and a rotating outer rim: between the two was aSkefco 7.5 inch roller-race, which allowed freerotation of the outer part. When a load wasapplied to the pressure roll, the flexible spokesdeflected and allowed the whole outer portionto lift through a short distance: the actualdeflection was quoted as being 0.0025 inches(0.06 mm) per ton, and this movement couldbe detected optically by means of a moiré grid,or by the use of strain gauges. The modifiedroller was used on a Manesty D3 machine.
With regard to this particular device, Thacker(1979) commented that ‘while this offered anexcellent research tool, it was not sufficientlyrobust for use under production conditions’. It
Instrumented tablet presses 117
Figure 6.11 The internally gauged roll-pin, with strain gauges fitted to two regions to sense the shear forces applied bythe pressure roll. The roll-pin has an axial cavity in which are fitted shear-sensitive strain gauges. These are mounted insidethe grooved regions shown.

would also be true to say that the modified rollerwas inevitably more springy than its productioncounterparts, and it might, therefore, haveproduced slightly different results on the com-pression of some materials. At any rate, theinstrumented roller was eventually overtaken bythe instrumented roll-pin.
Another point to consider in relation to theconstruction is that ball and roller races doneed to be provided with rotary seals if theyare to be run in a dusty environment. Underthe right conditions they are remarkably good,but grit can destroy them fairly quickly. If gritcannot be excluded, then ‘plain’ bearings, suchas bronze bushes, tend to have better lastingproperties than those of an unprotected rollerrace.
The punch
As with the eccentric press, strain gauge instru-mentation of one or more punches of a rotarypress provides a very direct means of assessingforces at the punch tip. Even if the basicmeasurement is usually to be taken from the roll-pin, it is extremely useful to have at least onegauged punch for the purposes of calibrationunder running conditions.
Working with the rotary press, however, car-ries some additional complications. Since thepunch now travels in a guide that is not com-pletely frictionless, the gauges must be fitted insuch a position that they are clear of the guideduring compression, that is between points Aand B in Figure 6.12. Even more attention mustbe paid to accurate balancing of the appliedgauges to compensate for bending forces, and itmust be possible to run the press without dam-aging the strain gauges, or ripping the wires offthe punch.
The first problem should present no real diffi-culty, since it is merely a matter of measuring theheight of the punch guide above the die, andfitting the gauges at some point within thatdistance from the punch tip.
Gauging the punch at its tip diameter shouldgive the largest signal, but from the point of viewof protection, it has been usual practice toprovide an area of reduced diameter in the main
body of the punch so that the installed gaugescan be covered with a substantial layer of epoxyresin (Figure 6.13). After machining, the recessedsection can be milled with four accurately pos-itioned flats to receive the gauges, as this canfacilitate good compensation for bendingmoments. We have noted, in relation to theeccentric press, the need to effect this compen-sation, and also to gauge at a point where thestresses are relatively uniform, since the surfaceof the die contents may not be completely flat.The situation in the rotary press is similar, butmay be more critical since centrifugal forces can
118 Tablet and capsule machine instrumentation
Direction of rotation
A
B
Figure 6.12 The strain-gauged punch. Since the punch issubject to sliding friction within its guide, gauges areapplied to the region that will be exposed whencompaction takes place (between points A and B in thefigure).
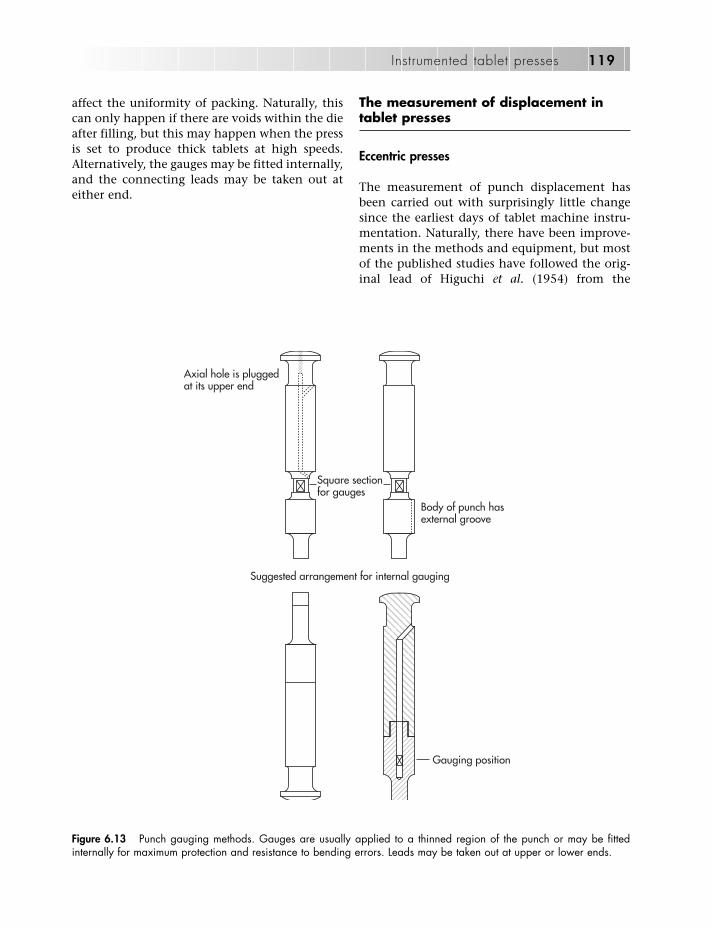
affect the uniformity of packing. Naturally, thiscan only happen if there are voids within the dieafter filling, but this may happen when the pressis set to produce thick tablets at high speeds.Alternatively, the gauges may be fitted internally,and the connecting leads may be taken out ateither end.
The measurement of displacement intablet presses
Eccentric presses
The measurement of punch displacement hasbeen carried out with surprisingly little changesince the earliest days of tablet machine instru-mentation. Naturally, there have been improve-ments in the methods and equipment, but mostof the published studies have followed the orig-inal lead of Higuchi et al. (1954) from the
Instrumented tablet presses 119
Gauging position
Axial hole is pluggedat its upper end
Square sectionfor gauges
Body of punch hasexternal groove
Suggested arrangement for internal gauging
Figure 6.13 Punch gauging methods. Gauges are usually applied to a thinned region of the punch or may be fittedinternally for maximum protection and resistance to bending errors. Leads may be taken out at upper or lower ends.

University of Wisconsin. Higuchi and colleaguesadapted a Stokes Model A-3 eccentric press tomeasure upper punch displacement through theaddition of a linear variable-differential trans-former (LVDT; Schaevitz Model 500S-L). Thebody of the LVDT was attached to the frame ofthe press in a brass mounting assembly; the corewas similarly linked to the upper punch holderthrough a cross-arm that projected over theLVDT body.
The design requirement for the measurementof punch travel in this set-up was that it shouldbe accurate to within 0.002 inches (0.05 mm).Even in those days, it is probable that the LVDTitself would have been capable of much betteraccuracy and resolution than this, but the read-out systems available then were of limited capa-bility. In this instance, the transducer signal wastaken to a strain gauge amplifier, and thence toan oscillograph. The trace from the latter wasscaled to show 10 mm for 0.44 mm of punch dis-placement, so fine distinction would have beendifficult.
Clearly, the movement of the armature would be influenced by distortion of themachine frame, and by the elastic deformationof the punches themselves. In order to makeallowance for these factors, the Wisconsin groupbrought the punches face to face, applied vary-ing loads and observed the apparent displace-ment from the LVDT. With flat-faced punches of0.375 inches (9.5 mm) diameter, the correctionwas found to be approximately 0.02 mm kN�1 oflower punch force; only the lower punch forcewas, in fact, measurable.
Of course, with no powder in the die, theupper and lower punch forces would have beenvirtually identical. Had a tablet been produced,the upper and lower forces would have beenappreciably different as a result of die-wall fric-tion and the correction would, therefore, be lessaccurate. Modern data handling systems, unlikethe oscillograph, would have been able todisplay this difference in legible terms.
Since 1953, the LVDT has been widely used forthe measurement of punch displacement, andthere have been only minor changes in physicallayout. As we have seen, the modern LVDT iscapable of giving readings that, in some examples,are reproducible to better than 0.1 lm. The
device itself is of essentially infinite resolution,and therefore its ultimate accuracy is dependenton its power supply, amplifier and read-out facili-ties. It should be possible to resolve the outputsignal to better than 1 part in 20 000 or more.One implication of this is that there is a trade-off between resolution and scale length.Consequently, it is desirable to select a trans-ducer that just covers the particular range ofinterest without any unnecessary extensionbeyond that.
Choice of scale length
In the example of the eccentric tablet press, theupper punch itself may have a vertical travel ofseveral centimetres; indeed, it must have, on theone hand, at least sufficient movement to clearthe feed shoe on each machine cycle. On theother hand, the part of that movement thatrequires precise measurement is likely to be themuch shorter distance over which the punch isin contact with the powder bed. Using an LVDTwith the reduced scale length of just those fewmillimetres will give a correspondingly largersignal for a given displacement. For example,an AC-energised LVDT with a nominal linearrange of �2.5 mm can have an output of180 mV/V mm�1; a similar unit with a linearrange of �10 mm has an output of only36 mV/V mm�1. The larger signal will providebetter linear resolution.
If a short-scale transducer is used to providethe best resolution, reasonable care has to betaken with the alignment of its two components.The total travel of the punch may well be morethan the length of the body of the LVDT, and ifthis is so, the armature may pass completely outof the body at one end of its stroke. When itreturns, it must also re-enter without touchingthe sides, or it will cause damage. Fortunately,the modern LVDT is available in versions with afairly wide radial clearance between armatureand body. In the Schaevitz HR range, for example,the internal diameter of the body is 9.5 mm,while the outside diameter of the core is 6.35 mm.The radial core-to-bore clearance is consequentlyapproximately 1.6 mm. Such a tolerance shouldbe well within the machining capabilities of alaboratory workshop, although it is also necess-
120 Tablet and capsule machine instrumentation

ary to ensure that the armature support rod willnot vibrate excessively when the tablet machineis running.
For some very demanding conditions, it isnow possible to buy types of LVDT with anincreased radial clearance. Within the Schaevitzrange, for example, units in the XS-A series havea bore diameter of 38.1 mm for a core diameterof 6.35 mm. Such a large radial clearance, 10times that of the standard HR model, has itsapplication in areas where the core and the bodyneed to be isolated from each other by somenon-magnetic carrier such as glass or Teflon tub-ing. Surprisingly enough, the output signal iswithin 20% of that from the normal LVDT.
If a transducer with a fairly close core-to-boreclearance is used, it is important to ensure thatthe gap does not become blocked with depositsof powder. In dirty industrial conditions, dis-placement measurements are often made withthe sealed, spring-loaded type of LVDT; the so-called ‘gauging transducer’. Such a device can bemounted on a machine in such a way that itsprobe makes intermittent contact with somepart of the moving component, and it willremain hermetically sealed. It is necessary, how-ever, to check carefully that the conditions of usedo not give rise to ‘contact bounce’, whichwould superimpose oscillations on the outputsignal.
Requirements of accuracy
The Wisconsin group were able to define theirown need for accuracy in displacement measure-ment as being within 0.05 mm. It would bemuch more difficult to produce a correspondingdefinition nowadays, since the purpose of mea-surement is often to generate force–displacementplots that show the work done in tabletting or tomeasure tablet thickness and hence calculatein situ porosity. The inherent problem is that,as compression proceeds, the force on the punch increases sharply; at the same time, the punch displacement decreases towards zero.Multiplying the one parameter by the other, inorder to estimate the work done, is open toappreciable error if the value of either one is indoubt. The best that can be said in this respect isthat the signal itself can be read to approxi-
mately 1 part in 20 000 (�9999 to �9999) in astandard four digit display. Its ultimate accuracymust then depend on the accuracy of thecorrections applied to it.
Problems with machine distortion
When it became apparent that much usefulinformation could be obtained from an instru-mented press, many laboratories decided tobuild their own systems. Since there were diffi-culties associated with the instrumentation of arotary press, such systems were usually based onan eccentric machine. In some cases, only punchforces were measured, but in others, the facilityto measure the movement of the punches wasincluded. This enabled the relationship betweenpunch movement and applied force to be inves-tigated, leading, among other developments, tothe construction of force–displacement curvesand the measurement of tablet porosity whilethe force was being applied.
There are many examples of such develop-ments in the literature, such as Moldenhaueret al. (1980), Armstrong and Blundell (1985)and Ragnarsson and Sjögren (1985). In principle,these have usually followed more or less similargeneral schemes for the measurement of dis-placement. Punch displacement was measuredwith an LVDT, one component of which wasjoined to the punch holder and the other to the machine frame; relatively long arms wereused so that the integrity of the die table couldbe maintained.
A typical example is illustrated in Moldenhaueret al. (1980), who commented that ‘an inductivedisplacement transducer can be easily attachedto the punch guide’. From the mechanical engi-neering point of view, no doubt it can; however,the apparently simple may well conceal somepossible sources of error.
While Moldenhauer and his colleagues werepreparing their own paper, Ho et al. (1979) pub-lished a most interesting communication. Theymounted an LVDT on a Manesty E2 eccentricpress in three different ways (Figure 6.14).
For the mounting system A, the casing of theLVDT was bolted to the machine frame, whilethe armature was operated by a bracket bolted tothe sliding top punch carrier. For system B, the
Instrumented tablet presses 121
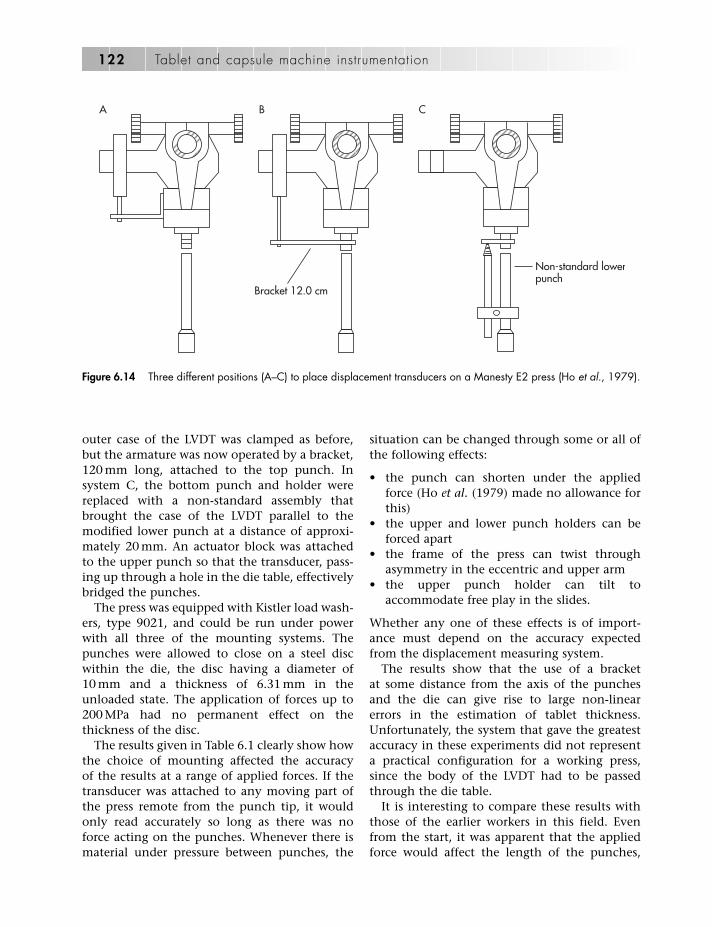
outer case of the LVDT was clamped as before,but the armature was now operated by a bracket,120 mm long, attached to the top punch. Insystem C, the bottom punch and holder werereplaced with a non-standard assembly thatbrought the case of the LVDT parallel to themodified lower punch at a distance of approxi-mately 20 mm. An actuator block was attachedto the upper punch so that the transducer, pass-ing up through a hole in the die table, effectivelybridged the punches.
The press was equipped with Kistler load wash-ers, type 9021, and could be run under powerwith all three of the mounting systems. Thepunches were allowed to close on a steel discwithin the die, the disc having a diameter of10 mm and a thickness of 6.31 mm in theunloaded state. The application of forces up to200 MPa had no permanent effect on thethickness of the disc.
The results given in Table 6.1 clearly show howthe choice of mounting affected the accuracyof the results at a range of applied forces. If thetransducer was attached to any moving part ofthe press remote from the punch tip, it wouldonly read accurately so long as there was noforce acting on the punches. Whenever there ismaterial under pressure between punches, the
situation can be changed through some or all ofthe following effects:
• the punch can shorten under the appliedforce (Ho et al. (1979) made no allowance forthis)
• the upper and lower punch holders can beforced apart
• the frame of the press can twist throughasymmetry in the eccentric and upper arm
• the upper punch holder can tilt toaccommodate free play in the slides.
Whether any one of these effects is of import-ance must depend on the accuracy expectedfrom the displacement measuring system.
The results show that the use of a bracket at some distance from the axis of the punchesand the die can give rise to large non-linearerrors in the estimation of tablet thickness.Unfortunately, the system that gave the greatestaccuracy in these experiments did not representa practical configuration for a working press,since the body of the LVDT had to be passedthrough the die table.
It is interesting to compare these results withthose of the earlier workers in this field. Evenfrom the start, it was apparent that the appliedforce would affect the length of the punches,
122 Tablet and capsule machine instrumentation
A B C
Bracket 12.0 cm
Non-standard lowerpunch
Figure 6.14 Three different positions (A–C) to place displacement transducers on a Manesty E2 press (Ho et al., 1979).
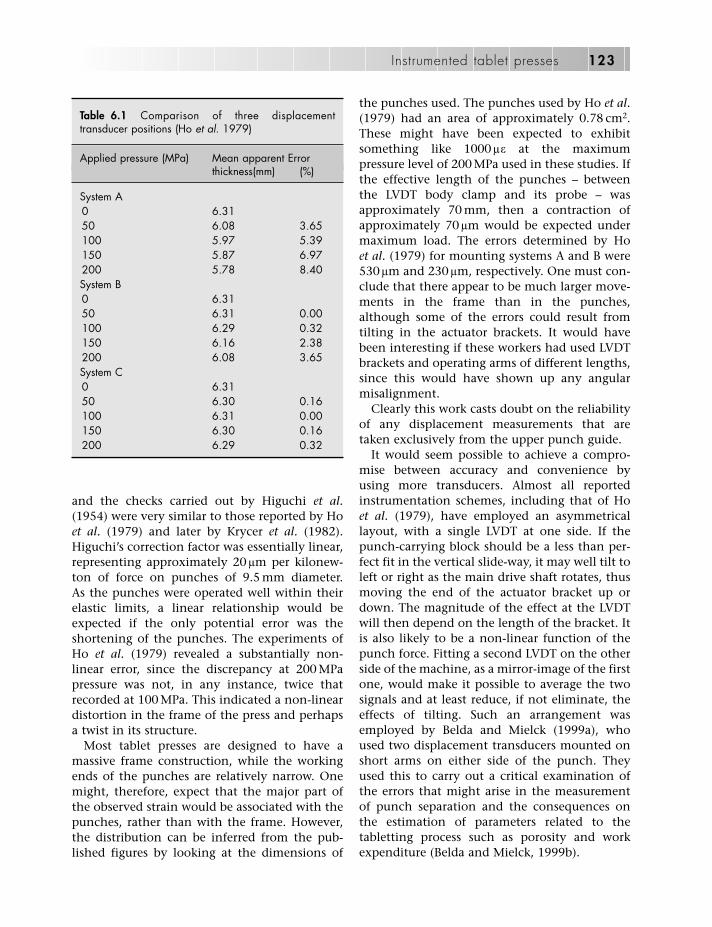
and the checks carried out by Higuchi et al.(1954) were very similar to those reported by Hoet al. (1979) and later by Krycer et al. (1982).Higuchi’s correction factor was essentially linear,representing approximately 20 lm per kilonew-ton of force on punches of 9.5 mm diameter. As the punches were operated well within theirelastic limits, a linear relationship would beexpected if the only potential error was theshortening of the punches. The experiments ofHo et al. (1979) revealed a substantially non-linear error, since the discrepancy at 200 MPapressure was not, in any instance, twice thatrecorded at 100 MPa. This indicated a non-lineardistortion in the frame of the press and perhapsa twist in its structure.
Most tablet presses are designed to have amassive frame construction, while the workingends of the punches are relatively narrow. Onemight, therefore, expect that the major part ofthe observed strain would be associated with thepunches, rather than with the frame. However,the distribution can be inferred from the pub-lished figures by looking at the dimensions of
the punches used. The punches used by Ho et al.(1979) had an area of approximately 0.78 cm2.These might have been expected to exhibitsomething like 1000 le at the maximum pressure level of 200 MPa used in these studies. Ifthe effective length of the punches – betweenthe LVDT body clamp and its probe – wasapproximately 70 mm, then a contraction ofapproximately 70 lm would be expected undermaximum load. The errors determined by Hoet al. (1979) for mounting systems A and B were530 lm and 230 lm, respectively. One must con-clude that there appear to be much larger move-ments in the frame than in the punches,although some of the errors could result fromtilting in the actuator brackets. It would havebeen interesting if these workers had used LVDTbrackets and operating arms of different lengths,since this would have shown up any angularmisalignment.
Clearly this work casts doubt on the reliabilityof any displacement measurements that aretaken exclusively from the upper punch guide.
It would seem possible to achieve a compro-mise between accuracy and convenience byusing more transducers. Almost all reportedinstrumentation schemes, including that of Hoet al. (1979), have employed an asymmetricallayout, with a single LVDT at one side. If thepunch-carrying block should be a less than per-fect fit in the vertical slide-way, it may well tilt toleft or right as the main drive shaft rotates, thusmoving the end of the actuator bracket up ordown. The magnitude of the effect at the LVDTwill then depend on the length of the bracket. Itis also likely to be a non-linear function of thepunch force. Fitting a second LVDT on the otherside of the machine, as a mirror-image of the firstone, would make it possible to average the twosignals and at least reduce, if not eliminate, theeffects of tilting. Such an arrangement wasemployed by Belda and Mielck (1999a), whoused two displacement transducers mounted onshort arms on either side of the punch. Theyused this to carry out a critical examination ofthe errors that might arise in the measurementof punch separation and the consequences onthe estimation of parameters related to thetabletting process such as porosity and workexpenditure (Belda and Mielck, 1999b).
Instrumented tablet presses 123
Table 6.1 Comparison of three displacementtransducer positions (Ho et al. 1979)
Applied pressure (MPa) Mean apparent Error thickness(mm) (%)
System A0 6.3150 6.08 3.65100 5.97 5.39150 5.87 6.97200 5.78 8.40System B0 6.3150 6.31 0.00100 6.29 0.32150 6.16 2.38200 6.08 3.65System C0 6.3150 6.30 0.16100 6.31 0.00150 6.30 0.16200 6.29 0.32

By the same token, a similar system could beapplied to the lower punch holder. In this way,both punch movements could be referred to acommon reference, such as the surface of the dietable, and it would still be possible to use stan-dard punches. The extent of machine distortionwill to some extent depend on the type of pressbeing used. It might be expected to be greater inthose presses such as the E2 that have an openfront, and less in those with a more closed con-struction. In either case, one would expect themaximum distortion to be in the plane of theslide-way.
The accuracy of the system could be checkedin the same way as before. If residual errors canbe established to be repeatable and reasonablyinvariant, it may be acceptable to apply appro-priate corrections by software for the sake ofretaining an otherwise normal tablet press withinterchangeable punches and dies. Those correc-tions, additionally, will vary in detail frompunch to punch, according to the cross-sectionused and the force applied.
Cook et al. (1988) followed up the pioneeringwork of Ho and colleagues. They sought to fit adisplacement transducer to an eccentric presswhile retaining the latter’s normal mode of oper-ation. In their system, the displacement trans-ducer was mounted close to the upper punch. Itsarmature passed through a small hole drilled inthe die table and made contact with a set screwclamped to the lower punch ejection heightadjustment screw. This enabled the press to oper-ate in its normal way, and tablet thickness couldbe measured from the relative positions of thetwo punches. The actual movement of eachpunch could not be measured. Cook et al. (1988)found that at forces in excess of around 5 kN, alinear error in punch displacement wasobtained.
Other displacement transducers
The LVDT has been by far the most widely usedtype of displacement transducer in tablet pressinstrumentation, but there are certain disadvan-tages in its application to eccentric presses suchas the Manesty F3. Ideally, the displacementtransducer would be fitted as closely as possibleto the axis of the punch and its holder to mini-
mise bending errors, but the problem here is thatthe feed mechanism sweeps across the die tableat each operating cycle of the press and woulddamage any transducer element standing in itsway. For this reason, it has been customary tomount the displacement transducer at a safe dis-tance from the moving parts, and some workershave chosen to fit the LVDT on extended arms ofquite considerable length. It will be apparentthat any errors introduced by tilting of thepunch holder and distortion of the machineframe will be exaggerated by this construction.Nowadays there are several types of remote dis-placement transducer that could be used in prin-ciple to overcome the problem of the feedmechanism, since they do not require actuatorrods or other projecting components.
Laser Doppler measurement is one possibility.If a laser beam, which is at a fixed frequency, isreflected from a moving surface, the reflectedbeam undergoes a change in frequency accord-ing to the well-known Doppler principle. Suchan arrangement was reported by Depraetère et al.(1978).
There are two reasons for using this means ofmeasuring movement in tablet punches. One isthat the reflector, mounted on the moving com-ponent, can be of very small mass and small size.The mechanical effect on the machine is, there-fore, minimal while the theoretically attainableprecision is high. Of course, like all such systems,the laser Doppler method only provides infor-mation on the relative movement between twoelements; in this case, the light source and thereflector. Once again, the choice of positions forthe optical components is critical, and, as withany optical system, it will be important to ensurethat the light path is not obscured by dust fromthe material being compacted.
The second is that, unlike the LVDT, theDoppler system provides a measure of speed,rather than of instantaneous position. Therefore,because the signal is proportional to punchspeed, it can be used without differentiation toproduce plots that display the integral of thedeformation energy.
It is common practice nowadays to use low-power lasers as sources of narrow, focusedbeams that can be used in levelling devices, cut-ting equipment and various other workshop
124 Tablet and capsule machine instrumentation

applications. If such a beam is directed at anangle on to a reflective surface, the position ofthe reflected beam will depend on the relativeheight of the surface in relation to the source,and this can be measured by allowing the beamto impinge on a linear array of photodiodes.These arrays are available with large numbers ofelements, and the accuracy of measurement canbe extended beyond that of individual diodesby well-established interpolation techniques.
Velocity transducers might also be used. If itappears useful to plot deformation energy inte-grals, one can also measure velocity by electro-magnetic means. Velocity transducers generatea voltage that is proportional to the speed of asmall permanent magnet moving axially alongthe centre of a uniform coil. This type ofdevice is externally similar to the LVDT andcan be mounted in the same way. Such a trans-ducer was used by Müller et al. (1982) for com-pression studies with a Fette Exacta 1 eccentricpress. It does not, however, overcome the needfor some form of actuator rod as a means ofmoving the magnet in relation to the outerwinding.
The two following devices do not need anyexternal components. The first is the acceler-ometer. One way of determining the position ofa body in space is that of measuring its acceler-ation over a known time. Compact acceler-ometers are commercially available and usuallycontain a small dense element that is mountedon a flexible support of some kind. If the deviceis caused to accelerate in the direction of its axis,the inertia of this dense element causes it to lagbehind. The relative movement between themoving element and the outer body can thenprovide a signal that can be interpreted asmovement of the assembly. Some miniatureaccelerometers achieve this by the use of pow-ered coils surrounding the moving element, as inthe LVDT. Others are built around lead zirconatetitanate sensors that generate their own signal,providing that the acceleration is alternating andnot static. Such a device, fitted in close proxim-ity to the punch holder, could provide infor-mation about its position without compromisingthe feed system.
The second device is the remote inductivetransducer. The nomenclature relating to dis-
placement transducers is not always used in aspecific way; thus the LVDT itself is sometimesdescribed as an inductive transducer – which, ina sense, it is – but in manufacturers’ literature,the term is more likely to be applied to one ofthose transducers that operates by eddy currentlosses in the presence of a ferromagnetic, orsometimes a non-magnetic, target. Inductivetransducers operate without physical contact,and they will work perfectly well under a coatingof dust, so they have certain qualifications fortablet compression studies. In terms of resol-ution, these non-contact devices compare wellwith the more conventional LVDT. For example,the units made by Micro-Epsilon MesstechnikGmbH have static resolutions that go down to50 nm in their smaller models. Their frequencyresponse is static up to 50 kHz (the 3 dB point),and their temperature shift is approximately 1.0 ppmºC�1. Some space must be providedbetween the inductive probe and other closelyadjacent ferromagnetic materials, but usually aclearance of some two probe diameters should besufficient for normal linear operation. The diam-eter of the probes in this series depends on theirmeasuring range, but as an example, a probe witha range of 2 mm has a body diameter of 12 mm.It would seem quite practical to use these trans-ducers on a tablet press, perhaps employing thedie table as the ferromagnetic target; neverthe-less, we have not so far seen them mentioned inthe tabletting literature.
Measurement of displacement in rotarytablet presses
The majority of the published reports on rotarypress instrumentation have been concerned withthe measurement of force or pressure, ratherthan displacement. Those that have includeddisplacement transducers have tended todescribe rather similar arrangements, since thelayout is partly forced by the machine design.
As a rule, one of the punches is fitted with ashort arm that can actuate the armature of atransducer, which is mounted in or near to theadjacent punch guide and is connected to a suit-able telemetry system (Figure 6.15). An exampleof this approach was described by Walter and
Instrumented tablet presses 125
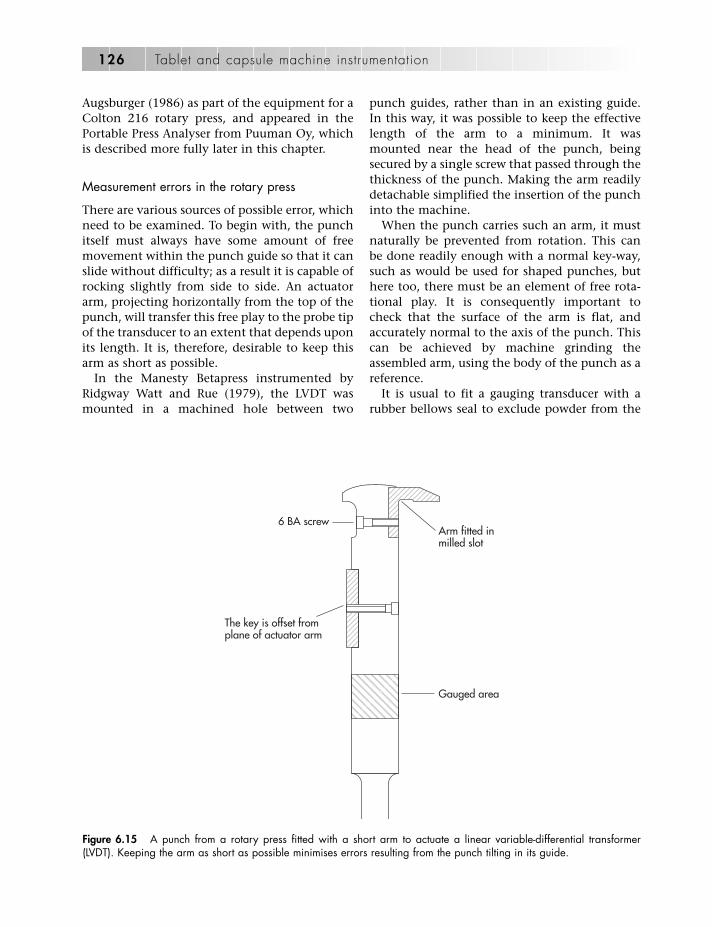
Augsburger (1986) as part of the equipment for aColton 216 rotary press, and appeared in thePortable Press Analyser from Puuman Oy, whichis described more fully later in this chapter.
Measurement errors in the rotary press
There are various sources of possible error, whichneed to be examined. To begin with, the punchitself must always have some amount of freemovement within the punch guide so that it canslide without difficulty; as a result it is capable ofrocking slightly from side to side. An actuatorarm, projecting horizontally from the top of thepunch, will transfer this free play to the probe tipof the transducer to an extent that depends uponits length. It is, therefore, desirable to keep thisarm as short as possible.
In the Manesty Betapress instrumented byRidgway Watt and Rue (1979), the LVDT wasmounted in a machined hole between two
punch guides, rather than in an existing guide.In this way, it was possible to keep the effectivelength of the arm to a minimum. It wasmounted near the head of the punch, beingsecured by a single screw that passed through thethickness of the punch. Making the arm readilydetachable simplified the insertion of the punchinto the machine.
When the punch carries such an arm, it mustnaturally be prevented from rotation. This canbe done readily enough with a normal key-way,such as would be used for shaped punches, buthere too, there must be an element of free rota-tional play. It is consequently important tocheck that the surface of the arm is flat, andaccurately normal to the axis of the punch. Thiscan be achieved by machine grinding theassembled arm, using the body of the punch as areference.
It is usual to fit a gauging transducer with arubber bellows seal to exclude powder from the
126 Tablet and capsule machine instrumentation
6 BA screwArm fitted inmilled slot
Gauged area
The key is offset fromplane of actuator arm
Figure 6.15 A punch from a rotary press fitted with a short arm to actuate a linear variable-differential transformer(LVDT). Keeping the arm as short as possible minimises errors resulting from the punch tilting in its guide.

mechanism, since the armature has to run inlinear bearings. Here, as in the eccentric press,the problem is merely that of ensuring that thespring-loaded probe remains in contact with the actuator arm during measurement over thewhole range of machine speeds and tablet thick-nesses. If the signal from the device is free from‘steps’, or obviously superimposed vibrations, itis likely to be in satisfactory contact. Our presscarried a Schaevitz model D400, with a linearrange of �5 mm from its central position. Thisgave an output of 2000 mV for a mechanical dis-placement of 5.0 mm. The spring-loaded corehad a mass of 1.0 g. Both upper and lower punchmovements were monitored with exactly similarsystems. Power to the two LVDTs was led in via a12-way slip-ring assembly, and signals weretaken out in the same way.
It might be necessary to retain balance in theturret to compensate for the mass of metalremoved to provide a hole for the transducer.This can be achieved by drilling another holediametrically opposite the first of such a size asto restore dynamic balance.
Measurement of ejection forces
In principle, the relatively small force needed toeject a finished tablet from the die can bemeasured in two ways: using a strain-gaugedpunch or using a gauged ejection ramp.
The strain-gauged punch
A gauged lower punch is normally used tomeasure compaction forces, but if it is providedwith reasonably sensitive gauges, it should alsobe capable of measuring ejection forces to asufficient degree of accuracy.
However, there are two important practicalobjections to this. One is that strain gaugesdeliberately fitted in such a way as to clear thepunch guides will only register the force neededto push the tablet from the die. They will notindicate the additional force needed to impel thepunch along the guide. It may well be desirablein a production machine to ensure that neither
the guides nor the die have become sticky. Theassessment of punch pull-up or pull-down forcesis discussed later in this chapter.
The second objection is that ejection forcemeasurements are likely to be required from allthe sets of tooling in the press, since they willnot be identical, whereas there is only likely tobe one gauged punch. On these grounds, mostworkers have opted to measure ejection forcesvia the ramp or the ejection cam. The strain-gauged punch then becomes invaluable as astandard against which the ramp transducersmay be calibrated.
The ejection ramp
Knoechel et al. (1967) approached the problemby using strain-gauged bolts to support theejection ramp on their Stokes 540-35 rotarypress. They fitted a substantial steel bracketdirectly underneath the ramp and held thelower ends of two gauged bolts in this. Theupper ends passed upwards through clearanceholes in the base of the machine and werescrewed against the underside of the ramp. Theexisting holding-down bolts were slackened offjust sufficiently to ensure that the ramp wassupported on the upper ends of the strain-gauged bolts, some 0.05 mm above its normalposition (Figure 6.16). A similar system, butwith only one gauged bolt, was applied to theBB2-27 press.
These two systems certainly gave signals;nevertheless, they were quite difficult to inter-pret, because as the punch head moved alongthe ejection track, its loading on the gaugedbolts varied continuously. A load of approxi-mately 100 kg applied at the leading edge of theramp on the BB2-27 produced a signal of 2 mVfrom the bridge circuit, whereas the same load,applied directly over the gauged bolt, producedonly 1 mV. Apart from this, at any one timethere were several punch heads in simultaneouscontact with the ramp, so the electrical outputrepresented a rather complex summation offorces.
In most later work where the ramp has beenretained as a single component, it has beensupported on three, widely spaced transducers
Instrumented tablet presses 127
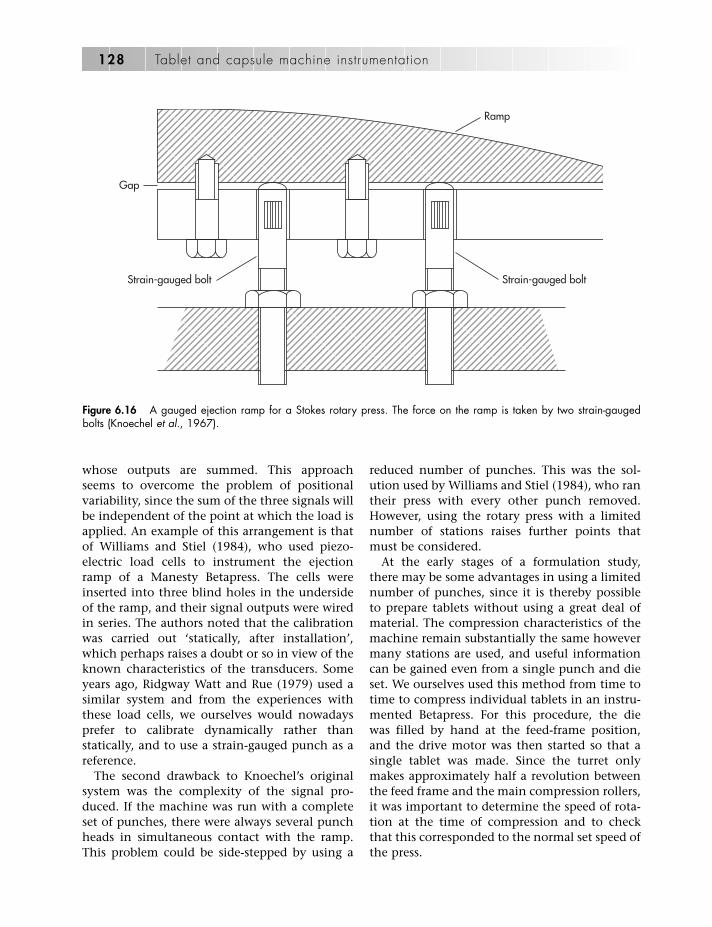
whose outputs are summed. This approachseems to overcome the problem of positionalvariability, since the sum of the three signals willbe independent of the point at which the load isapplied. An example of this arrangement is thatof Williams and Stiel (1984), who used piezo-electric load cells to instrument the ejectionramp of a Manesty Betapress. The cells wereinserted into three blind holes in the undersideof the ramp, and their signal outputs were wiredin series. The authors noted that the calibrationwas carried out ‘statically, after installation’,which perhaps raises a doubt or so in view of theknown characteristics of the transducers. Someyears ago, Ridgway Watt and Rue (1979) used asimilar system and from the experiences withthese load cells, we ourselves would nowadaysprefer to calibrate dynamically rather thanstatically, and to use a strain-gauged punch as areference.
The second drawback to Knoechel’s originalsystem was the complexity of the signal pro-duced. If the machine was run with a completeset of punches, there were always several punchheads in simultaneous contact with the ramp.This problem could be side-stepped by using a
reduced number of punches. This was the sol-ution used by Williams and Stiel (1984), who rantheir press with every other punch removed.However, using the rotary press with a limitednumber of stations raises further points thatmust be considered.
At the early stages of a formulation study,there may be some advantages in using a limitednumber of punches, since it is thereby possibleto prepare tablets without using a great deal ofmaterial. The compression characteristics of themachine remain substantially the same howevermany stations are used, and useful informationcan be gained even from a single punch and dieset. We ourselves used this method from time totime to compress individual tablets in an instru-mented Betapress. For this procedure, the diewas filled by hand at the feed-frame position,and the drive motor was then started so that asingle tablet was made. Since the turret onlymakes approximately half a revolution betweenthe feed frame and the main compression rollers,it was important to determine the speed of rota-tion at the time of compression and to checkthat this corresponded to the normal set speed ofthe press.
128 Tablet and capsule machine instrumentation
Gap
Strain-gauged bolt Strain-gauged bolt
Ramp
Figure 6.16 A gauged ejection ramp for a Stokes rotary press. The force on the ramp is taken by two strain-gaugedbolts (Knoechel et al., 1967).

In fact, measurements showed that theBetapress, run with only one station of tooling,reached its full speed within considerably lessthan half a revolution (Ridgway Watt, 1983b). Itseems safe to conclude that the punch velocitieswould correspond to those of steady runningconditions.
For our own work on single tablets, the die wasfilled by hand. If the machine is run continu-ously, hand filling becomes impractical and sothe die must then be filled via the feed frame inthe normal way. However, when only a fewstations are in use, less powder than usual istaken from the feed frame and as a result, theframe may overfill. When the lower punchtravels up the weight-setting ramp at the fillingstage, it expels the excess powder back into theframe underneath the rotating fingers of thefeeder paddle. As the fingers pass one by one overthe top of the moving dies, they partly obstructthe return flow of the powder and induce a smallamount of pre-compression within the die. Thiscan lead to cyclic variation in tablet weight, aneffect that disappears when a full set of tooling isused (Ridgway Watt and Rue, 1980).
Modified ejection ramp designs
For many purposes, it is desirable to have aninstrumented machine that can be operatedunder normal production conditions with allstations working. Ejection forces may themselvesbe measurable on single tablets, but it may takea comparatively long run to establish whether,for instance, the granulation is likely to build upon the working surfaces during production oftablets in commercial quantities.
The split ramp offers an alternative approachfor obtaining readily interpretable ejection forcereadings. The design of the gauged ramp isaltered so that only one punch head can possiblytouch it at any one time. The generally acceptedsolution to the problem has been simply toreduce the width of the gauged section so that itbecomes narrower than the distance betweentwo adjacent punches. Wray (1969) described anearly example of an arrangement in which partof the normal ramp was replaced with a toolsteel cantilever beam, supported on an outriggerbracket and instrumented with foil strain gauges.
Systems of this type are now quite commonlyused, although there is always a slight problemof signal linearity. Since the punch travels in acircular path around the machine, the appliedload runs at varying distances from the supportof the cantilever. The induced stress is corre-spondingly variable, just as in Knoechel’s origi-nal device. Marshall, in his review article of1983, suggested that the ramp may be sectionedinto three parts, each independently mountedon load washers (Figure 6.17). This makes it poss-ible to measure the whole ejection force profile,from initiation to final ejection, at any setting ofthe lower punch heights.
A possibility that does not seems to have triedso far is that of mounting the individual rampsections on shear force load cells instead of canti-lever beams. These would provide a constantsignal, independent of the point of loading. Yetanother method is that of linearising the canti-lever output signal by reference to the knownposition of the punch head: this has beenapplied by D’Stefan et al. (1985) in the instru-mentation of their Manesty X-Press. D’Stefanand his colleagues removed a segment from thestandard ejection cam, or ramp, and constructeda cantilever beam from flat ground die steel to fitin the gap. The cantilever was held securely at itsouter end and was gauged with Constantan strain gauges of the stacked rosette pattern (MicroMeasurements CEA-06-061WT-350) on the topand bottom surfaces. It was arranged to deflect by0.38 mm under a maximum force of 2 kN, and itwas calibrated by dead-weight loading. Loading atdifferent points around the locus of the punchgave variable signals, from which a correctioncurve could be constructed and then applied tothe raw data from the strain gauges.
Measurement of punch pull-up and pull-down forces
After a tablet has been compressed, the upperpunch must be withdrawn completely from thedie to allow for ejection of the tablet and for thenext cycle of die filling. So that this withdrawalmay be conveniently achieved, the punch headis arranged to slide within a stationary ramp that
Instrumented tablet presses 129
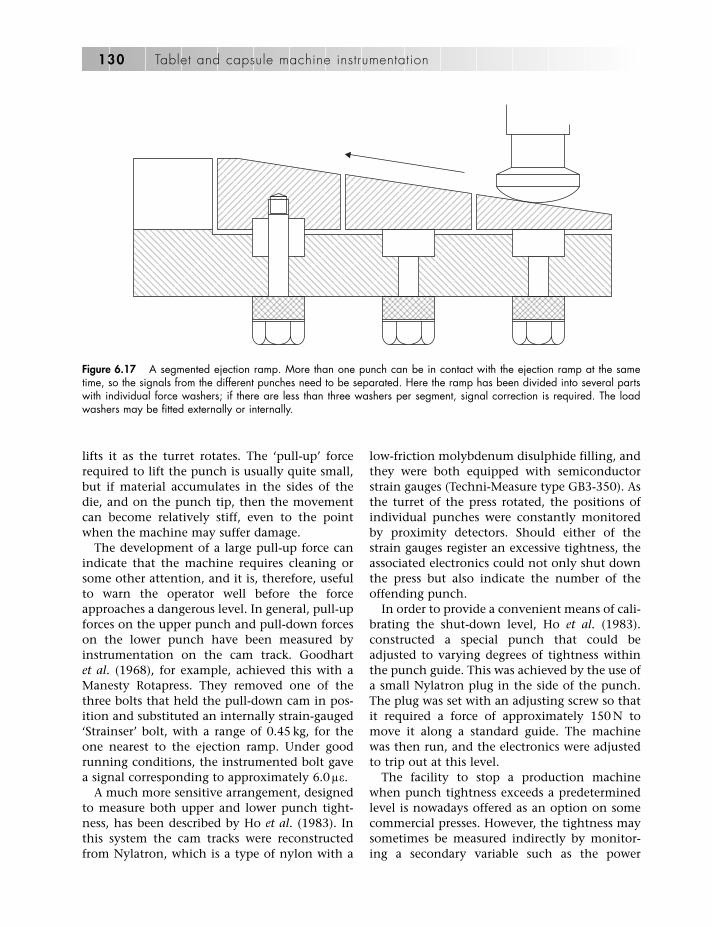
lifts it as the turret rotates. The ‘pull-up’ forcerequired to lift the punch is usually quite small,but if material accumulates in the sides of thedie, and on the punch tip, then the movementcan become relatively stiff, even to the pointwhen the machine may suffer damage.
The development of a large pull-up force canindicate that the machine requires cleaning orsome other attention, and it is, therefore, usefulto warn the operator well before the forceapproaches a dangerous level. In general, pull-upforces on the upper punch and pull-down forceson the lower punch have been measured byinstrumentation on the cam track. Goodhartet al. (1968), for example, achieved this with aManesty Rotapress. They removed one of thethree bolts that held the pull-down cam in pos-ition and substituted an internally strain-gauged‘Strainser’ bolt, with a range of 0.45 kg, for theone nearest to the ejection ramp. Under goodrunning conditions, the instrumented bolt gavea signal corresponding to approximately 6.0 le.
A much more sensitive arrangement, designedto measure both upper and lower punch tight-ness, has been described by Ho et al. (1983). Inthis system the cam tracks were reconstructedfrom Nylatron, which is a type of nylon with a
low-friction molybdenum disulphide filling, andthey were both equipped with semiconductorstrain gauges (Techni-Measure type GB3-350). Asthe turret of the press rotated, the positions ofindividual punches were constantly monitoredby proximity detectors. Should either of thestrain gauges register an excessive tightness, theassociated electronics could not only shut downthe press but also indicate the number of theoffending punch.
In order to provide a convenient means of cali-brating the shut-down level, Ho et al. (1983).constructed a special punch that could beadjusted to varying degrees of tightness withinthe punch guide. This was achieved by the use ofa small Nylatron plug in the side of the punch.The plug was set with an adjusting screw so thatit required a force of approximately 150 N tomove it along a standard guide. The machinewas then run, and the electronics were adjustedto trip out at this level.
The facility to stop a production machinewhen punch tightness exceeds a predeterminedlevel is nowadays offered as an option on somecommercial presses. However, the tightness maysometimes be measured indirectly by monitor-ing a secondary variable such as the power
130 Tablet and capsule machine instrumentation
Figure 6.17 A segmented ejection ramp. More than one punch can be in contact with the ejection ramp at the sametime, so the signals from the different punches need to be separated. Here the ramp has been divided into several partswith individual force washers; if there are less than three washers per segment, signal correction is required. The loadwashers may be fitted externally or internally.
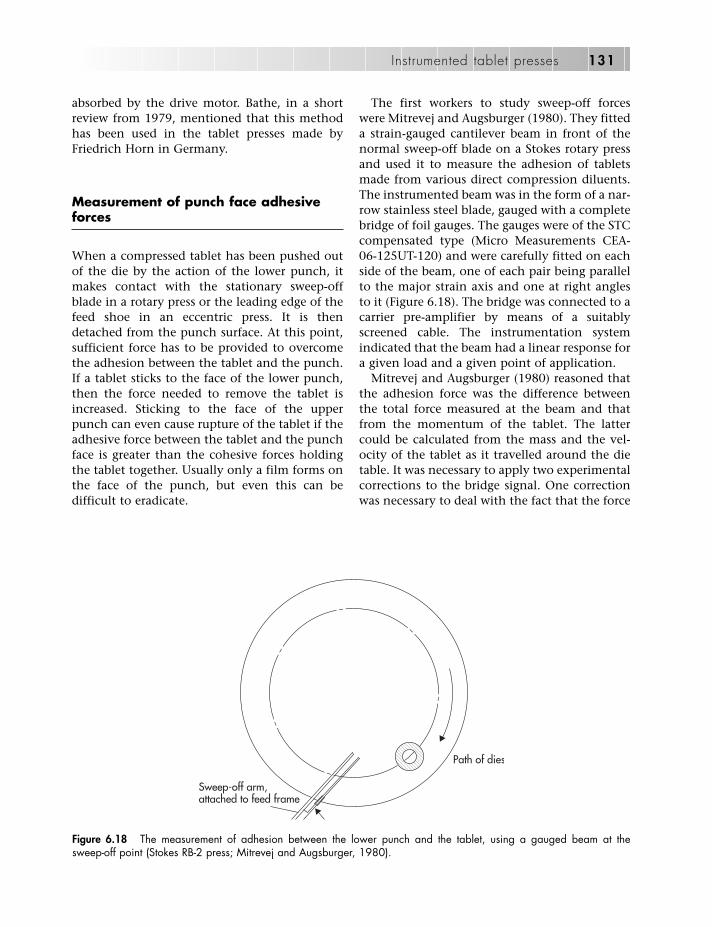
absorbed by the drive motor. Bathe, in a shortreview from 1979, mentioned that this methodhas been used in the tablet presses made byFriedrich Horn in Germany.
Measurement of punch face adhesiveforces
When a compressed tablet has been pushed outof the die by the action of the lower punch, itmakes contact with the stationary sweep-offblade in a rotary press or the leading edge of thefeed shoe in an eccentric press. It is thendetached from the punch surface. At this point,sufficient force has to be provided to overcomethe adhesion between the tablet and the punch.If a tablet sticks to the face of the lower punch,then the force needed to remove the tablet isincreased. Sticking to the face of the upperpunch can even cause rupture of the tablet if theadhesive force between the tablet and the punchface is greater than the cohesive forces holdingthe tablet together. Usually only a film forms onthe face of the punch, but even this can bedifficult to eradicate.
The first workers to study sweep-off forceswere Mitrevej and Augsburger (1980). They fitteda strain-gauged cantilever beam in front of thenormal sweep-off blade on a Stokes rotary pressand used it to measure the adhesion of tabletsmade from various direct compression diluents.The instrumented beam was in the form of a nar-row stainless steel blade, gauged with a completebridge of foil gauges. The gauges were of the STCcompensated type (Micro Measurements CEA-06-125UT-120) and were carefully fitted on eachside of the beam, one of each pair being parallelto the major strain axis and one at right anglesto it (Figure 6.18). The bridge was connected to acarrier pre-amplifier by means of a suitablyscreened cable. The instrumentation systemindicated that the beam had a linear response fora given load and a given point of application.
Mitrevej and Augsburger (1980) reasoned thatthe adhesion force was the difference betweenthe total force measured at the beam and thatfrom the momentum of the tablet. The lattercould be calculated from the mass and the vel-ocity of the tablet as it travelled around the dietable. It was necessary to apply two experimentalcorrections to the bridge signal. One correctionwas necessary to deal with the fact that the force
Instrumented tablet presses 131
Path of dies
Sweep-off arm,attached to feed frame
Figure 6.18 The measurement of adhesion between the lower punch and the tablet, using a gauged beam at the sweep-off point (Stokes RB-2 press; Mitrevej and Augsburger, 1980).
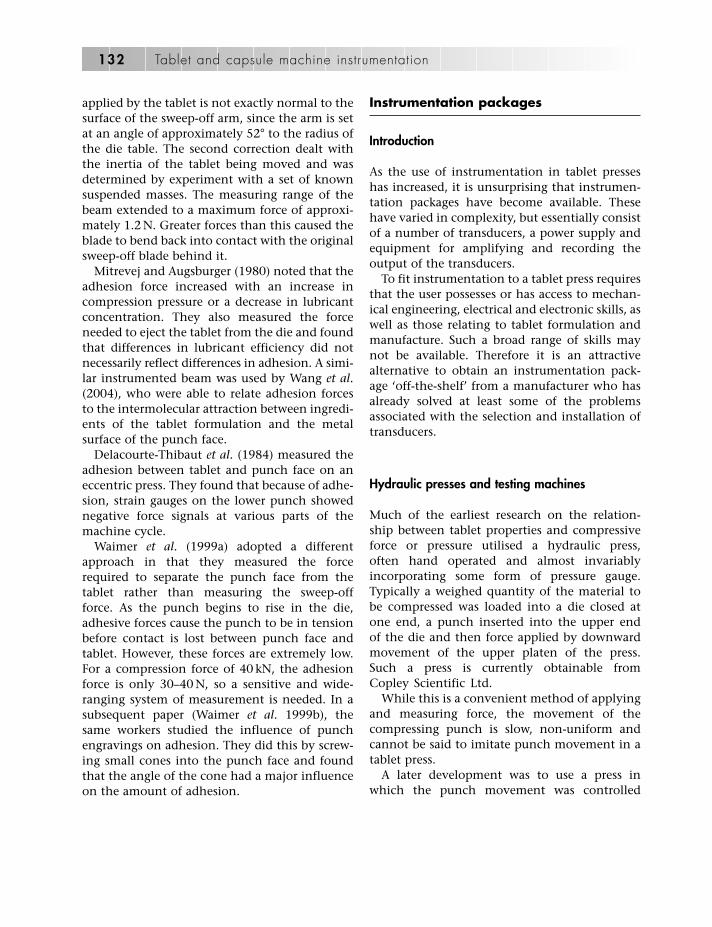
applied by the tablet is not exactly normal to thesurface of the sweep-off arm, since the arm is setat an angle of approximately 52° to the radius ofthe die table. The second correction dealt withthe inertia of the tablet being moved and wasdetermined by experiment with a set of knownsuspended masses. The measuring range of thebeam extended to a maximum force of approxi-mately 1.2 N. Greater forces than this caused theblade to bend back into contact with the originalsweep-off blade behind it.
Mitrevej and Augsburger (1980) noted that theadhesion force increased with an increase incompression pressure or a decrease in lubricantconcentration. They also measured the forceneeded to eject the tablet from the die and foundthat differences in lubricant efficiency did notnecessarily reflect differences in adhesion. A simi-lar instrumented beam was used by Wang et al.(2004), who were able to relate adhesion forcesto the intermolecular attraction between ingredi-ents of the tablet formulation and the metalsurface of the punch face.
Delacourte-Thibaut et al. (1984) measured theadhesion between tablet and punch face on aneccentric press. They found that because of adhe-sion, strain gauges on the lower punch showednegative force signals at various parts of themachine cycle.
Waimer et al. (1999a) adopted a differentapproach in that they measured the forcerequired to separate the punch face from thetablet rather than measuring the sweep-offforce. As the punch begins to rise in the die,adhesive forces cause the punch to be in tensionbefore contact is lost between punch face andtablet. However, these forces are extremely low.For a compression force of 40 kN, the adhesionforce is only 30–40 N, so a sensitive and wide-ranging system of measurement is needed. In asubsequent paper (Waimer et al. 1999b), thesame workers studied the influence of punchengravings on adhesion. They did this by screw-ing small cones into the punch face and foundthat the angle of the cone had a major influenceon the amount of adhesion.
Instrumentation packages
Introduction
As the use of instrumentation in tablet presseshas increased, it is unsurprising that instrumen-tation packages have become available. Thesehave varied in complexity, but essentially consistof a number of transducers, a power supply andequipment for amplifying and recording theoutput of the transducers.
To fit instrumentation to a tablet press requiresthat the user possesses or has access to mechan-ical engineering, electrical and electronic skills, aswell as those relating to tablet formulation andmanufacture. Such a broad range of skills maynot be available. Therefore it is an attractivealternative to obtain an instrumentation pack-age ‘off-the-shelf’ from a manufacturer who hasalready solved at least some of the problemsassociated with the selection and installation oftransducers.
Hydraulic presses and testing machines
Much of the earliest research on the relation-ship between tablet properties and compressiveforce or pressure utilised a hydraulic press,often hand operated and almost invariablyincorporating some form of pressure gauge.Typically a weighed quantity of the material tobe compressed was loaded into a die closed atone end, a punch inserted into the upper endof the die and then force applied by downwardmovement of the upper platen of the press.Such a press is currently obtainable fromCopley Scientific Ltd.
While this is a convenient method of applyingand measuring force, the movement of thecompressing punch is slow, non-uniform andcannot be said to imitate punch movement in atablet press.
A later development was to use a press inwhich the punch movement was controlled
132 Tablet and capsule machine instrumentation
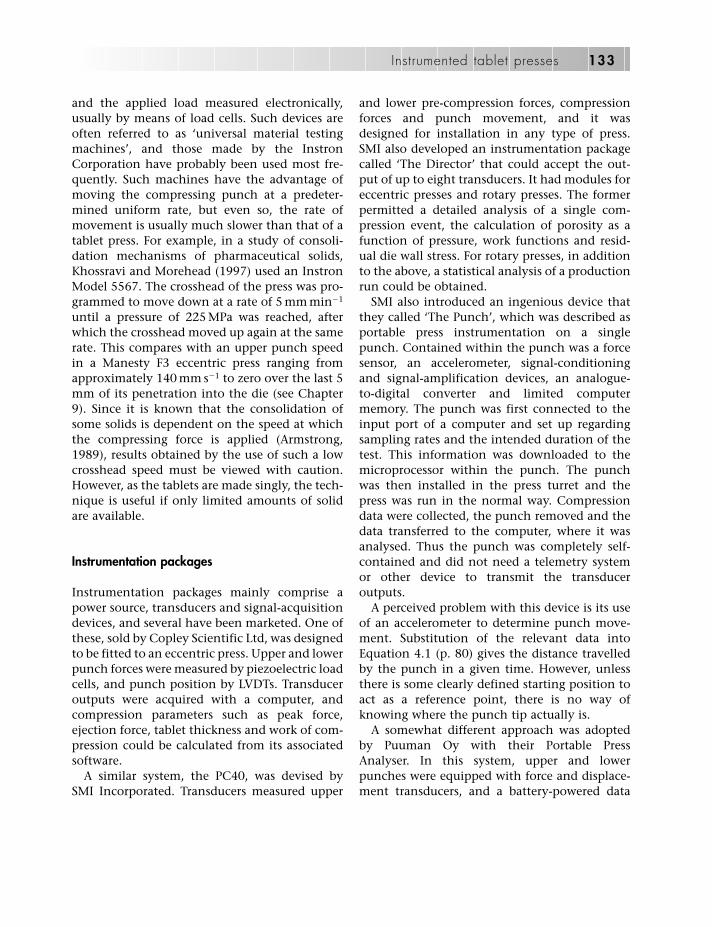
and the applied load measured electronically,usually by means of load cells. Such devices areoften referred to as ‘universal material testingmachines’, and those made by the InstronCorporation have probably been used most fre-quently. Such machines have the advantage ofmoving the compressing punch at a predeter-mined uniform rate, but even so, the rate ofmovement is usually much slower than that of atablet press. For example, in a study of consoli-dation mechanisms of pharmaceutical solids,Khossravi and Morehead (1997) used an InstronModel 5567. The crosshead of the press was pro-grammed to move down at a rate of 5 mm min�1
until a pressure of 225 MPa was reached, afterwhich the crosshead moved up again at the samerate. This compares with an upper punch speedin a Manesty F3 eccentric press ranging fromapproximately 140 mm s�1 to zero over the last 5mm of its penetration into the die (see Chapter9). Since it is known that the consolidation ofsome solids is dependent on the speed at whichthe compressing force is applied (Armstrong,1989), results obtained by the use of such a lowcrosshead speed must be viewed with caution.However, as the tablets are made singly, the tech-nique is useful if only limited amounts of solidare available.
Instrumentation packages
Instrumentation packages mainly comprise apower source, transducers and signal-acquisitiondevices, and several have been marketed. One ofthese, sold by Copley Scientific Ltd, was designedto be fitted to an eccentric press. Upper and lowerpunch forces were measured by piezoelectric loadcells, and punch position by LVDTs. Transduceroutputs were acquired with a computer, andcompression parameters such as peak force,ejection force, tablet thickness and work of com-pression could be calculated from its associatedsoftware.
A similar system, the PC40, was devised bySMI Incorporated. Transducers measured upper
and lower pre-compression forces, compressionforces and punch movement, and it wasdesigned for installation in any type of press.SMI also developed an instrumentation packagecalled ‘The Director’ that could accept the out-put of up to eight transducers. It had modules foreccentric presses and rotary presses. The formerpermitted a detailed analysis of a single com-pression event, the calculation of porosity as afunction of pressure, work functions and resid-ual die wall stress. For rotary presses, in additionto the above, a statistical analysis of a productionrun could be obtained.
SMI also introduced an ingenious device thatthey called ‘The Punch’, which was described asportable press instrumentation on a singlepunch. Contained within the punch was a forcesensor, an accelerometer, signal-conditioningand signal-amplification devices, an analogue-to-digital converter and limited computermemory. The punch was first connected to theinput port of a computer and set up regardingsampling rates and the intended duration of thetest. This information was downloaded to themicroprocessor within the punch. The punchwas then installed in the press turret and thepress was run in the normal way. Compressiondata were collected, the punch removed and thedata transferred to the computer, where it wasanalysed. Thus the punch was completely self-contained and did not need a telemetry systemor other device to transmit the transduceroutputs.
A perceived problem with this device is its useof an accelerometer to determine punch move-ment. Substitution of the relevant data intoEquation 4.1 (p. 80) gives the distance travelledby the punch in a given time. However, unlessthere is some clearly defined starting position toact as a reference point, there is no way ofknowing where the punch tip actually is.
A somewhat different approach was adoptedby Puuman Oy with their Portable PressAnalyser. In this system, upper and lowerpunches were equipped with force and displace-ment transducers, and a battery-powered data
Instrumented tablet presses 133

transmission and amplification units, a computerinterface and associated software were also pro-vided. The instrumented punches could be sub-stituted for normal punches in a rotary press.The punches had short arms that activated theLVDTs. Transducer outputs were transmitted byan infrared data link to a data acquisition con-troller and from there transferred to a computer.The system was described by Paronen et al.(1994) and a diagram of the Portable PressAnalyser is shown in Figure 6.19.
Matz et al. (1999) have evaluated the PortablePress Analyser. They found that force measure-ment was precise, but displacement measure-ment was affected by tilting of the puncheswhen force was applied. If punch tilting was notconsidered, a deviation of displacement occurredof up to 110 lm from its true value. They alsofound that the deformation of the machine andthe punches differed in dynamic or static con-ditions, and they suggested that correction forelastic deformation should be made from
dynamic conditions. Errors from tilting could bereduced to approximately 18 lm by puttingadditional displacement transducers in adjacentturret positions.
Compaction simulators
Compaction simulators are designed to mimicthe exact compression cycle of any tablettingpress in real time and to record all the importantparameters during that cycle. In 1972, Rees et al.described a device that used a mechanical tabletpress to simulate the double-ended compressioncycle of a rotary press. However, this could notsimulate the compression cycle in real time.
The first true simulator was reported by Hunteret al. (1976) of ICI Pharmaceuticals Division. Thisdevice consisted of a frame supporting twohydraulic activators that were connected to ahigh-pressure hydraulic power pack. The acti-vators could independently move punches within
134 Tablet and capsule machine instrumentation
Triggering device
Microprocessor baseddata acquisition controller(Master microprocessor)& PC-interface
Batteries
Batteries
Lower signal conditioner &IR- transmitter/receiver(slave microprocessor)
Optical fibres
Optical fibres
IR-data link
IR-data link
Upper displacementtransducer
Strain-gaugedlower punch
Lower displacementtransducer
Upper signal conditioner &IR-transmitter/receiver(slave microprocessor)
Strain-gaugedupper punch
software
Figure 6.19 The Portable Press Analyser (Courtesy of Puuman Oy).
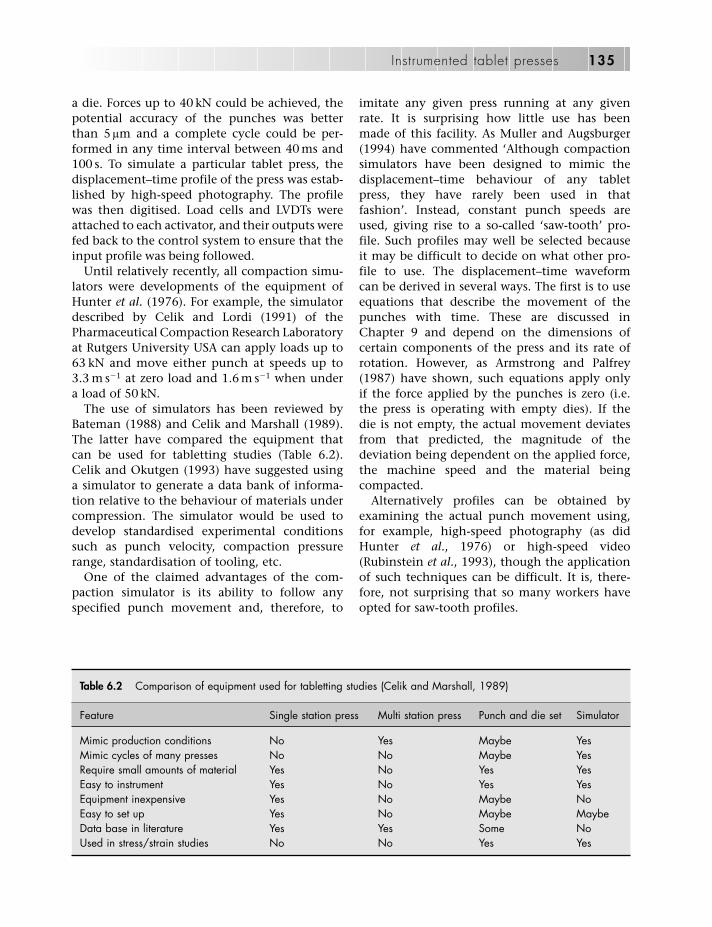
a die. Forces up to 40 kN could be achieved, thepotential accuracy of the punches was betterthan 5 lm and a complete cycle could be per-formed in any time interval between 40 ms and100 s. To simulate a particular tablet press, thedisplacement–time profile of the press was estab-lished by high-speed photography. The profilewas then digitised. Load cells and LVDTs wereattached to each activator, and their outputs werefed back to the control system to ensure that theinput profile was being followed.
Until relatively recently, all compaction simu-lators were developments of the equipment ofHunter et al. (1976). For example, the simulatordescribed by Celik and Lordi (1991) of thePharmaceutical Compaction Research Laboratoryat Rutgers University USA can apply loads up to63 kN and move either punch at speeds up to3.3 m s�1 at zero load and 1.6 m s�1 when undera load of 50 kN.
The use of simulators has been reviewed byBateman (1988) and Celik and Marshall (1989).The latter have compared the equipment thatcan be used for tabletting studies (Table 6.2).Celik and Okutgen (1993) have suggested usinga simulator to generate a data bank of informa-tion relative to the behaviour of materials undercompression. The simulator would be used todevelop standardised experimental conditionssuch as punch velocity, compaction pressurerange, standardisation of tooling, etc.
One of the claimed advantages of the com-paction simulator is its ability to follow anyspecified punch movement and, therefore, to
imitate any given press running at any givenrate. It is surprising how little use has beenmade of this facility. As Muller and Augsburger(1994) have commented ‘Although compactionsimulators have been designed to mimic thedisplacement–time behaviour of any tabletpress, they have rarely been used in thatfashion’. Instead, constant punch speeds areused, giving rise to a so-called ‘saw-tooth’ pro-file. Such profiles may well be selected becauseit may be difficult to decide on what other pro-file to use. The displacement–time waveformcan be derived in several ways. The first is to useequations that describe the movement of thepunches with time. These are discussed inChapter 9 and depend on the dimensions ofcertain components of the press and its rate ofrotation. However, as Armstrong and Palfrey(1987) have shown, such equations apply onlyif the force applied by the punches is zero (i.e.the press is operating with empty dies). If thedie is not empty, the actual movement deviatesfrom that predicted, the magnitude of thedeviation being dependent on the applied force,the machine speed and the material beingcompacted.
Alternatively profiles can be obtained byexamining the actual punch movement using,for example, high-speed photography (as didHunter et al., 1976) or high-speed video(Rubinstein et al., 1993), though the applicationof such techniques can be difficult. It is, there-fore, not surprising that so many workers haveopted for saw-tooth profiles.
Instrumented tablet presses 135
Table 6.2 Comparison of equipment used for tabletting studies (Celik and Marshall, 1989)
Feature Single station press Multi station press Punch and die set Simulator
Mimic production conditions No Yes Maybe YesMimic cycles of many presses No No Maybe YesRequire small amounts of material Yes No Yes YesEasy to instrument Yes No Yes YesEquipment inexpensive Yes No Maybe NoEasy to set up Yes No Maybe MaybeData base in literature Yes Yes Some NoUsed in stress/strain studies No No Yes Yes

In recent years, a different type of simulatorhas become available. This is known as thePresster™ and is marketed by MetropolitanComputing Corporation. This acts as a high-speed single-station press, but it uses punches,compression rolls and pre-compression rolls thatare identical to those of the press being simu-lated. A pair of punches and a die move linearlyalong a track, passing between the sets of rolls.The speed of the press is simulated by the speedat which the punches move along the track.Since the actual punches and rolls are used, theappropriate waveform of the press is followedand there is no need to make assumptions aswith other simulators. The apparatus has beendescribed by Levin (2004).
References
Armstrong NA (1989). Time-dependent factorsinvolved in powder compression and tabletmanufacture. Int J Pharm 49:1–13.
Armstrong NA, Blundell LP (1985). The effect ofmachine speed on the compaction of some directlycompressible tablet diluents. J Pharm Pharmacol 37:28P.
Armstrong NA, Palfrey LP (1987). Punch velocities dur-ing the compaction process. J Pharm Pharmacol 39:497–501.
Bateman S (1988). High speed compaction simulatorsin tabletting research. Pharm J 240: 632–633.
Bathe P (1979). Recent developments in tablettingtechnology. Mfg Chem Aerosol News, 50: 33–41.
Belda PM, Mielck JB (1999a). The tabletting machine asan analytical instrument: qualification of thetabletting machine and the instrumentation withrespect to the determination of punch separationand validation of the calibration procedures. Eur JPharm Biopharm 47: 231–245.
Belda PM, Mielck JB (1999b). The tabletting machineas an analytical instrument: consequences of uncer-tainties in punch force and punch separation dataon some parameters describing the course of thetabletting process. Eur J Pharm Biopharm 48:157–170.
Celik M, Lordi NG (1991). The PharmaceuticalCompaction Research Laboratory and InformationCenter. Pharm Technol 15: 112–116.
Celik M, Marshall K (1989). Use of a compaction simu-lator in tabletting research. Drug Dev Ind Pharm 15:759–800.
Celik M, Okutgen E (1993). A feasibility study for thedevelopment of a prospective compaction func-tionality test and the establishment of a com-paction data bank. Drug Dev Ind Pharm 19:2309–2334.
Cook GD, Duffield PJ, Oliver A (1988). Mounting aninductive displacement transducer on a singlepunch tablet machine. J Pharm Pharmacol 40: 119P.
Deer JJ, Ridgway K, Rosser PH, Shotton E (1968). Amodified pressure wheel for the instrumentation ofrotary tablet machines. J Pharm Pharmacol 20: 162S.
Delacourte-Thibaut A, Bleuze P, Leterme P, Guyot JC(1984). Étude du grippage et du collage, a l’aided’une machine a comprimer instrumentée. Labo-Pharma Probl Tech 32: 673–681.
Depraetère P, Seiller M, Puisieux F (1978). Lasermeasurements of velocities of tablet punches. InProceedings of the International Conference of PowderTechnology and Pharmacy, Basel.
D’Stefan DA, Leesman GD, Patel MR, Morehead WT(1985). Computer interfaced instrumentation of arotary tablet press. Drug Dev Ind Pharm 11: 83–100.
Duchêne D, Djiane A, Altglas F et al. (1972). Étude descomprimés. 5: Equipement d’une machine a com-primer alternative pour la determination des forcesintervenant lors de la compression. Ann PharmFrancaises 30: 127–138.
Goodhart FW, Mayorga G, Mills M, Ninger FC (1968).Instrumentation of a rotary tablet machine. J PharmSci 57: 1770–1775.
Graffner C, Johnstone ME, Nicklasson M, Nyquist H(1985). Preformulation studies in a drug develop-ment program for tablet formulation. J Pharm Sci74: 16–20.
Higuchi T, Nelson E, Busse LW (1954). The physics oftablet compression. 3: Design and construction ofan instrumented tablet machine. J Am Pharm AssnSci Ed 43: 344–348.
Ho AYK, Barker JF, Spence J, Jones TM (1979). Acomparison of three methods of mounting a linearvariable displacement transducer on an instru-mented tablet machine. J Pharm Pharmacol 31:471–472.
Ho AYK, Milham A, Lockwood L, Jones TM (1983). Asystem to prevent damage to rotary tablet machinescaused by the tightening up of punches duringtablet production. J Pharm Pharmacol 35: 112P.
Hunter BM, Fisher DG, Pratt RM, Rowe RC (1976). Ahigh speed compression simulator. J PharmPharmacol 28: 65P.
Jungersen O, Jensen VG (1970). Studies on tablet com-pression. 1: Construction of an instrumentedtabletting machine. Dansk Tidsskr Farm 44: 39–47.
Khossravi D, Morehead WT (1997). Consolidationmechanisms of pharmaceutical solids. A multi-
136 Tablet and capsule machine instrumentation

compression cycle approach. Pharm Res 14:1039–1048.
Knoechel EL, Sperry CC, Ross HE, Lintner CJ (1967).Instrumented rotary tablet machines. 1: Design,construction, and performance as pharmaceuticalresearch and development tools. J Pharm Sci 56:109–115.
Krycer I, Pope DG, Hersey JA (1982). An evaluation ofthe techniques employed to investigate powdercompaction behaviour. Int J Pharm 12: 113–134.
Levin M (2004). Tablet press instrumentation. InSwarbrick J, Boylan JC (eds), Encyclopaedia ofPharmaceutical Technology, 2nd edition suppl. NewYork: Taylor & Francis, pp 455–480.
Lindberg NO (1972). Instrumentation of a singlepunch tablet machine. Acta Pharm Suec 9: 135–140.
Marshall K (1972). Some observations on the elucida-tion and control of the compaction processes. InProceedings of the International Conference onCompaction and Consolidation of Particulate Matter,Brighton.
Marshall K (1983). Instrumentation of tablet andcapsule filling machines. Pharm Technol 7: 68–82.
Matz C, Bauer-Brandl A, Rigassi T, et al. (1999). On theaccuracy of a new displacement instrumentationfor rotary tablet presses. Drug Dev Ind Pharm 25:117–130.
Mitrevej A, Augsburger LL (1980). Adhesion of tabletsin a rotary tablet press. I: Instrumentation and pre-liminary study of variables affecting adhesion. DrugDev Ind Pharm 6: 331–337.
Moldenhauer H, Kala H, Zessin G, Dittgen M (1980).Zur pharmazeutischen Technologie der Tablet-tierung. Pharmazie, 35: 714–726.
Moller-Sonnegaard J, Kristensen HG (1978).Instrumentation of a rotary tablet machine. PharmInd 40: 269–273.
Muller FX, Augsburger LL (1994). The role of thedisplacement–time waveform in the determinationof Heckel behaviour under dynamic conditions ina compaction simulator and a fully instrumentedrotary tablet press. J Pharm Pharmacol 46: 468–475.
Müller BW, Steffens KJ, List PN (1982). Drugs Made inGermany 25: 53.
Paronen P, Ilkka J, Wihervaara M et al. (1994).Application of portable rotary press instrumenta-tion and compaction simulator to tablet develop-ment. In Proceedings of the 13th PharmaceuticalTechnology Conference, Strasbourg, vol 1, pp641–648.
Polderman J, de Blaey CJ, Braakman DR, Burger H(1969). Het gebruik van rekstrookjes in de farma-ceutische technologie. Pharm Weekblad 104:575–582.
Ragnarsson G, Sjögren J (1985). Force–displacementmeasurements in tabletting. J Pharm Pharmacol37:145–150.
Rees JE, Hersey JA, Cole ET (1972). Simulation devicefor preliminary tablet compression studies. J PharmSci 61: 1313–1315.
Ridgway K (1982). Pharmaceutical tablet making.Chemical Engineer, May: 169–173.
Ridgway K, Deer JJ, Finlay PL, Lazarou C (1972).Automatic weight-control in a rotary tablettingmachine. J Pharm Pharmacol 24: 203–210.
Ridgway Watt P (1983a). Tablet press instrumentation2. Manuf Chem 54: 42–45.
Ridgway Watt P (1983b).Measurement of acceleration ina rotary tablet machine. J Pharm Pharmacol 35: 746.
Ridgway Watt P, Rue PJ (1979). The design and con-struction of a fully instrumented rotary tabletmachine. In Proceedings of the InternationalConference of Pharmacy Technology and ProductManufacture, Copenhagen.
Ridgway Watt P, Rue PJ (1980). Tablet weight and den-sity variation in a rotary press. J Pharm Pharmacol32: 22P.
Rubinstein MH, Petersen MA, Bateman SD, Stetsko G(1993). Measuring punch-time displacement pro-files on a rotary tablet machine using a high-speedvideo system. Pharm Tech Int 5: 24–33.
Salpekar, AM, Augsburger LL (1974). Magnesium laurylsulphate in tableting: effect on ejection force andcompressibility. J Pharm Sci 63: 289–292.
Schmidt PC, Tenter U, Hocke J (1986). Force and dis-placement characteristics of rotary tablettingmachine. 1: Instrumentation of a single punch forforce measurements. Pharm Ind 48: 1546–1553.
Schwartz JB (1981). The instrumented tablet press: usesin research and production. Pharm Technol 5:102–132.
Shotton E, Ganderton D (1960). The strength of com-pressed tablets. 1: The measurement of tabletstrength and its relation to compression forces.J Pharm Pharmacol 12: 87T–92T.
Thacker HS (1979). Instrumentation of tablet machines.In Proceedings of a Conference on Compaction ofParticulate Solids, University of Bradford.
Waimer F, Krumme, Danz P et al. (1999a). A novelmethod for the detection of sticking of tablets.Pharm Dev Technol 4: 359–367.
Waimer F, Krumme M, Danz P et al. (1999b). The influ-ence of engravings on the sticking of tablets.Investigations with an instrumented upper punch.Pharm Dev Technol 4: 369–375.
Walter JT, Augsburger LL (1986). A computerisedforce/displacement instrumentation system for arotary tablet press. Pharm Technol 1986: 26–36.
Instrumented tablet presses 137

Wang JJ, Guillot MA, Bateman SD, Morris KM (2004).Modelling of adhesion in tablet compression. 2:Compaction studies using a compaction simulatorand an instrumented tablet machine. J Pharm Sci93: 407–417.
Williams JJ, Stiel DM (1984). An intelligent tablet pressmonitor for formulation development. PharmTechnol 8: 26–38.
Wray P (1969). The instrumented rotary tabletmachine. Drugs Cosmetic Ind 105: 58B–68B, 158–160.
138 Tablet and capsule machine instrumentation

Introduction
If an instrumentation system is to be of value, itmust provide accurate measurements and must continue to do so in a reliable manner.Appropriate calibration procedures are, there-fore, essential, both at the assembly stage and atintervals during the subsequent operation of thesystem.
An important consideration in this respect isthat practically all present-day transducersdepend on a chain of electronic sub-assembliesto manipulate and display their signals, so thatthere is no obvious or ‘commonsense’ relation-ship between the measured variable and its indi-cated value. In earlier times, the weights on abalance, or the graduations on a foot-rule, couldbe associated directly with the quantity beingmeasured, but nowadays we have lost thatdirectness. One consequence of this is that thedigital read-out has acquired an aura of infalli-bility and will be believed implicitly even whenthe equipment behind it is manifestly on fire. Ifindirect measuring systems are to be used withconfidence, they must be seen to give repeatablereadings under known conditions, and re-calibration should be such a simple matter thatit becomes a normal routine. It should also bepossible to relate the transducer output to someform of absolute standard from time to time asnecessary.
Fundamental standards
In the SI system, now more or less universallyadopted, there are seven basic units from which
all others can be derived. These base quantities,with their units and symbols, have beendescribed and defined in Chapter 1. Such vari-ables as displacement, time and temperature canbe referred in principle to the base units of the SIsystem. Variables, for example force, that are notamong those seven fundamentals must bederived from base units taken in combination.
In practice, the base units are not equallyaccessible for everyday use; some of them canonly be verified by the use of specialised equip-ment. It is, therefore, normal to approach thesethrough the use of agreed sub-standards orderived units.
Practical standards
In the laboratory, economic considerations dic-tate that the equipment used for measurementsshould not be more complicated or expensivethan necessary. The end result must justify theinitial expenditure, and it is obviously importantto assess the accuracy that will be acceptable forthe work. In general, this implies measurementsthat are several stages removed from the funda-mental standards noted above, and an extensiveuse of the methods that have become commonin engineering practice.
The basic standards themselves are usuallymaintained in national institutions such as theNational Physical Laboratory in the UK, theNational Bureau of Standards in the USA and the corresponding bodies in other countries. Aswe have noted, these standards are, with theexception of that of mass, no longer physicalobjects but are quantities that, in principle,
7Calibration of transducer systems
Peter Ridgway Watt
139

could be established by direct measurementanywhere in the world.
The same institutions also hold secondarystandards, which are more likely to have a physi-cal existence and can be used for comparison.Laboratory measuring systems can be checkedagainst these secondary standards; those, inturn, may be validated by reference to the fun-damental units. The following notes show howthis process may be extended to the calibrationof a transducer in a practical environment.
Force
The first problem in calibrating a force trans-ducer is that of generating a precisely knownforce for comparison. Such a force can be pro-duced, for most practical purposes, by a knownmass in the Earth’s gravitational field: that is tosay, by a known weight.
Direct calibration
It is often convenient to have some removablecomponents of the tablet press equipped withstrain gauges so that they become force trans-ducers in their own right. Gauged punches, forexample, are useful in this respect for at least tworeasons. Firstly, they can be transferred from onemachine to another; secondly, they can be used during compaction, either dynamically orstatically.
Generally, such components are detachableand portable; in this case, they can be taken tobe calibrated by weight loading in a suitablemetrology laboratory. There is a large dead-weight testing machine at the National PhysicalLaboratory at Teddington, UK, for example, andthis is operated by their calibration service forwork of this kind.
The component is set up within the jaws of thetest machine and is progressively loaded withaccurately known masses up to the maximumexpected force. Output readings are taken, firstwith increasing load and then with decreasingload in order to check for hysteresis. Ideally, the
whole set of readings should be repeated after aninterval to establish if there are thermal effects ormeasurable drift either in the component or in itspower supplies and amplifiers.
Of course, the measured signal is alwaysdependent on its associated electronics, and it isalso desirable that they should be used in thedeadweight test whenever possible. However, itmay be difficult to move the electronics from theinstrumented machine. In this event, it may bemore satisfactory to calibrate a separate load cellfor use as an indirect, or transfer, standard. Theload cell, complete with its own electronics, canthen be taken from place to place, or machine tomachine.
Indirect calibration
Almost all the forces measured in an instru-mented tablet press are related in some way tothe forces at the punches. Consequently, it is auseful first step to obtain an independent instru-ment that can be used to measure the forcebetween the punch tips, and which can itself bere-calibrated easily as a transfer standard.
A comparison load cell, with a range equiv-alent to that of the tablet press, is ideal for thispurpose. Such a cell will be considerably thickerthan the average tablet and cannot convenientlybe interposed between the tips of standardpunches. However, it is worthwhile shorteningone or more punches – old or worn ones can beused economically here – to make room for thecell between them.
Most ordinary cylindrical load cells aredesigned for axial loading and may give inac-curate readings if the applied force is allowed torun off-axis. It is worth taking some trouble inthe production of a suitable cell holder that willcentralise the punches and the cell along thesame straight line. The transfer standard load cellis of such a diameter that it will slide within anormal die cavity. It has a central hole intowhich various hemispherical heads can be fitted,and it is supported on a special lower punch witha spigotted upper end. A modified upper punch,with a concave end, ensures that the load cell isnot subjected to off-axis loading (Figure 7.1).
140 Tablet and capsule machine instrumentation

When the force transducers on the machineitself are to be checked, a die, the shortenedupper punch and the cell in its holder are fittedcarefully in place. The electronics are switchedon and allowed to reach steady conditions. Thepress, whether eccentric or rotary, is then turnedcautiously by hand in small increments, andsimultaneous readings are taken from the twoseparate transducer systems.
As in the example of the deadweight testingprocedure, all sets of readings should be takenwith increasing and then with decreasing load,to check for hysteresis. From time to time, theload cell itself can be taken for separatedeadweight calibration.
Potential sources of error
Ignoring, for the moment, inaccuracies in theload cell, we can see that the procedureindicated above may show errors under somecircumstances. Some eccentric presses, forexample, may have a strain-gauged upper armas a means of sensing compression force. It wasnoted in Chapter 6 that this gives rise to acosine error when the arm itself is not upright.
However, the reading of maximum forceremains correct: whether the error is of import-ance, therefore, depends entirely on the purposeof the instrumentation.
In a press that has been fitted with piezoelec-tric load cells, there is a certain possibility oferror through signal leakage during this particu-lar calibration procedure. Since the machinemust be turned by hand and is stopped for eachreading, its rotation is slow by comparison withnormal running, so caution is advised in theinterpretation of results under these conditions.
In the author’s opinion, it is prudent to acquirea pair of strain-gauged punches for use withpresses that have piezoelectric load cells. Thepunches are first calibrated outside the tabletpress, either by deadweight test or by use of atransfer standard load cell. The calibratedpunches are then fitted into the press in thenormal way, acting as the transfer standard loadcell did before. This time, unlike the load cell,they are capable of being driven at machinespeed and of compressing a tablet. Admittedly,the introduction of another link in the calibra-tion chain puts the tablet press instrumentationat one further stage away from the fundamentalstandard, but the advantage of being able
Calibration of transducer systems 141
Calibration load cell
Press rotated by hand
Modified lower punch
Modified punch with concave endConvex plug withair release hole.
Figure 7.1 Force calibration in a rotary tablet press. The transfer standard load cell is of such a diameter that it will slidewithin the die cavity. It has a central hole into which hemispherical heads can be fitted, and the upper punch has a match-ing concave end to ensure the load cell is not subject to off-axis loading. As the press is rotated by hand, readings aretaken simultaneously from the load cell and the instrumented pressure roll.

to make static, quasi-static and dynamic calibra-tions well outweighs the slight reduction inaccuracy.
Telemetry
Using instrumented punches at machine speedsinvolves making some provision for the signalsthat they generate. In the eccentric press, wherethe punches only move up and down, a cableconnection can be used. The rotary press pre-sents more of a problem unless it has a slip-ringsystem or a radio-telemetry link, although moreand more such machines now exist. Many work-ers have found it satisfactory to have the instru-mented punch connected to a small transmitterthat will fit into an adjacent punch guide, whilea fixed antenna outside the turret picks up theradiated signal.
Other force calibrations
An instrumented tablet machine may havetransducers arranged to measure not only com-pression but also ejection forces, die-wall stressand punch pull-up force. The calibration of allthese variables is facilitated, as before, by the useof the instrumented punch. Of course, ejectionforces are likely to be small compared with nor-mal compression forces, and it may be desirableto have the lower punch equipped with semi-conductor strain gauges for extra sensitivity.Many schemes for ejection force measurementon rotary presses give outputs that vary as thepunch moves along the ramp, since its leverageis not constant in all positions. Calibrationunder these conditions then involves the con-struction of a suitable curve, from which all read-ings must be corrected by the data handlingsystem.
Die-wall stress calibration is a much more con-troversial area. As a rule, gauged dies have beenfilled with some material that behaves as a liquidunder pressure, and known forces have then beenapplied to the punches. The problem with themeasurement itself usually seems to be a markeddependence of the signal on punch position, andthis point is discussed in Chapter 9.
Displacement
Here we are concerned with the measurement oflength, and of changes in length. There is abroad gulf between what can be attained in thestandards laboratory – 1 part in 1010 – and whatis normal in engineering workshop practice – say1 part in 104. Turned components, for example,might typically be machined to tolerances ofaround 25 lm. The displacement transducer,often in the form of an LVDT, can in fact achieverealistic resolutions down to approximately0.1 lm.
At this level of accuracy, probably themost widely used measurement device is theinterferometer.
The interferometer
The principle of the interferometer has been out-lined in Chapter 4; suffice it to say that it canbe used to determine changes in optical pathlength to a maximum sensitivity of approxi-mately one thousandth of a wavelength of theradiation employed. The light source is usuallya frequency-stabilised laser, operating in theregion around 600 nm, but even so, its stabilityis not perfect, and the uncertainty associatedwith the measurement is of the order 1 in 108. Ingeneral, it is a physical laboratory instrument,and its most practical application in tablet stud-ies is probably that of checking the dimensionsof gauge blocks, which are discussed below.
Gauge blocks
Gauge blocks move away from complex instru-mentation and into the area more directlyapplicable to transducer calibration. These aresimply sets of hard, dimensionally stable blockswith flat faces of defined surface finish and par-allelism. A complete set may have between tenand a hundred or so pieces, and they can be usedto make up various lengths as required by the useof one or more blocks together. The blocks mayalso be described as ‘slip gauges’, and they areused in engineering practice for a variety of pur-
142 Tablet and capsule machine instrumentation
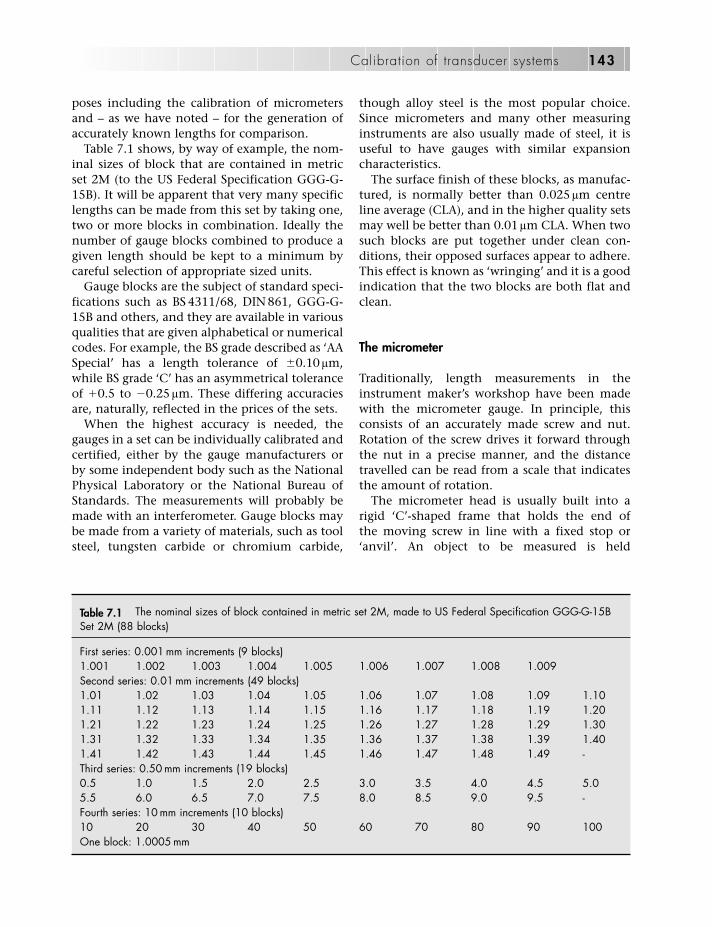
poses including the calibration of micrometersand – as we have noted – for the generation ofaccurately known lengths for comparison.
Table 7.1 shows, by way of example, the nom-inal sizes of block that are contained in metricset 2M (to the US Federal Specification GGG-G-15B). It will be apparent that very many specificlengths can be made from this set by taking one,two or more blocks in combination. Ideally thenumber of gauge blocks combined to produce agiven length should be kept to a minimum bycareful selection of appropriate sized units.
Gauge blocks are the subject of standard speci-fications such as BS 4311/68, DIN 861, GGG-G-15B and others, and they are available in variousqualities that are given alphabetical or numericalcodes. For example, the BS grade described as ‘AASpecial’ has a length tolerance of �0.10 lm,while BS grade ‘C’ has an asymmetrical toleranceof �0.5 to �0.25 lm. These differing accuraciesare, naturally, reflected in the prices of the sets.
When the highest accuracy is needed, thegauges in a set can be individually calibrated andcertified, either by the gauge manufacturers orby some independent body such as the NationalPhysical Laboratory or the National Bureau ofStandards. The measurements will probably bemade with an interferometer. Gauge blocks maybe made from a variety of materials, such as toolsteel, tungsten carbide or chromium carbide,
though alloy steel is the most popular choice.Since micrometers and many other measuringinstruments are also usually made of steel, it isuseful to have gauges with similar expansioncharacteristics.
The surface finish of these blocks, as manufac-tured, is normally better than 0.025 lm centreline average (CLA), and in the higher quality setsmay well be better than 0.01 lm CLA. When twosuch blocks are put together under clean con-ditions, their opposed surfaces appear to adhere.This effect is known as ‘wringing’ and it is a goodindication that the two blocks are both flat andclean.
The micrometer
Traditionally, length measurements in theinstrument maker’s workshop have been madewith the micrometer gauge. In principle, thisconsists of an accurately made screw and nut.Rotation of the screw drives it forward throughthe nut in a precise manner, and the distancetravelled can be read from a scale that indicatesthe amount of rotation.
The micrometer head is usually built into arigid ‘C’-shaped frame that holds the end ofthe moving screw in line with a fixed stop or‘anvil’. An object to be measured is held
Calibration of transducer systems 143
Table 7.1 The nominal sizes of block contained in metric set 2M, made to US Federal Specification GGG-G-15BSet 2M (88 blocks)
First series: 0.001 mm increments (9 blocks)1.001 1.002 1.003 1.004 1.005 1.006 1.007 1.008 1.009Second series: 0.01 mm increments (49 blocks)1.01 1.02 1.03 1.04 1.05 1.06 1.07 1.08 1.09 1.101.11 1.12 1.13 1.14 1.15 1.16 1.17 1.18 1.19 1.201.21 1.22 1.23 1.24 1.25 1.26 1.27 1.28 1.29 1.301.31 1.32 1.33 1.34 1.35 1.36 1.37 1.38 1.39 1.401.41 1.42 1.43 1.44 1.45 1.46 1.47 1.48 1.49 -Third series: 0.50 mm increments (19 blocks)0.5 1.0 1.5 2.0 2.5 3.0 3.5 4.0 4.5 5.05.5 6.0 6.5 7.0 7.5 8.0 8.5 9.0 9.5 -Fourth series: 10 mm increments (10 blocks)10 20 30 40 50 60 70 80 90 100One block: 1.0005 mm

against the anvil, and the screw is turned bymeans of a knob or ‘thimble’ at one end untilits end face touches lightly against the otherface of the object. At this point, the thicknessof the object may be read from a scale on therotating thimble. In some constructions, thehead may be mounted through a metal blockfor the measurement of depth or height.
Simple mechanical micrometers of this typeare capable, at best, of reading the dimensionsof rigid objects to the nearest 0.001 mm.Mechanical considerations limit the fineness ofthe screw thread that can be used to somethingin the region of two threads per millimetre (40threads per inch in Imperial units), and thismeans that the practical sensitivity of the gaugewill be limited by the scale on the thimble. It isnot easy to read such a scale if it is divided intomore than 50 parts, and at that level eachgraduation would correspond to a movement of0.01 mm.
Greater sensitivity can be achieved by theaddition of a vernier scale to the thimble, or byincreasing its diameter. However, it is not easy toensure that each measurement is being carriedout at exactly the same pressure. Slight changesin pressure will cause variable amounts of distor-tion, both in the object being measured and inthe frame of the micrometer. It is, therefore,common practice for the thimble to be fittedwith a light friction clutch that, to some extent,limits and equalises the force that can be appliedto the screw.
Nowadays, micrometers are available in ver-sions with digital display. This may read fromthe rotation of the screw as in the mechanicalmicrometer, or it may run from a completelyindependent optical scale. In either case, esti-mation of the scale reading is greatly facilitated.Moreover, if the encoding system is digitalthroughout, it will not be affected by drift in theassociated amplifiers. For digital micrometers inwhich the display operates from rotation of thescrew, the limit of practical resolution stillremains at approximately 0.001 mm, because theinherent errors in the feed screw are themselvesof this order. The independent linear encodercould be made to a better accuracy but is, again,limited by the problems of variable pressure andtemperature.
In work on tablet presses, micrometers areconvenient for checking dimensions of punches,where accuracy to 0.001 mm may be thoughtmore than adequate for the application. At thislevel of sensitivity, cleanliness is very important.The measuring faces must be kept free from dirt,moisture and particulate matter, and it is goodpractice to close them on to a clean lint-free tis-sue just before use. Care should also be taken toavoid holding the frame more than is necessary,since the warmth of the hand will induce localexpansion.
Micrometer errors
From time to time, a micrometer should bechecked against a known standard: it is con-venient to use a gauge block for this purpose.Naturally, the screw pitch may be expected toremain constant over the working life of theinstrument, but two sources of error maydevelop. Firstly, wear between the screw and thenut may give rise to some free play in the mech-anism. In this event it is usually possible toremove the thimble, adjust a clamping ring thatsurrounds the nut section, and hence take upany free play. Secondly, the micrometer mayindicate a departure from true zero when theanvil and the face are brought together. Thissituation can be remedied by careful adjustmentof the thimble position, using a special toolprovided by the manufacturers.
Calibration of displacement transducers
In order to calibrate a displacement transducersystem, it is necessary to have some means ofeffecting a known amount of movement at thesensing point. Commercial transducers are gen-erally supplied with a test certificate from themanufacturers, but it is naturally important tocheck that the original performance has notvaried. Checks can be made on the bench, andon the tablet machine itself.
Displacement measurements are best carriedout on some form of rigid, dimensionally stablesurface that can hold the components in a fixedrelation. In the toolroom, it is normal practice touse a heavy, flat slab of material known as a sur-
144 Tablet and capsule machine instrumentation

face plate. Surface plates may be made of variousmaterials, including granite, glass and metal,though there are advantages in the traditionalcast-iron plate since it will conveniently holdmagnetic clamping devices and V-blocks.
If the body of the transducer is held verticallyand securely over the surface plate, its armaturecan be brought down so that it makes contactwith the surface plate at some point near thecentre of its travel, where its scale is at maximumlinearity. Then slip gauges can be interposedbetween the armature and the plate, eithersingly or in combination, to check as manypoints on the transducer output characteristic asmay be thought necessary.
It may be difficult to remove a displacementtransducer for calibration once it has beeninstalled in the tablet press. In this event, a tech-nique must be found that facilitates some simpletest that can be carried out in situ. There are twofairly straightforward procedures. In the first ofthese, the moving armature of the transducercan be displaced, as in the bench test, by theinsertion of slip gauges. This method would beapplicable where the transducer is of the ‘gaug-ing’ variety and is lightly spring-loaded againstan actuator bracket. The slip gauge may be pos-itioned squarely between the actuator and thegauge head, or between the punch head and thecompression roller. If the transducer is built intothe sliding mechanism – as it might be in aneccentric press – and is itself inaccessible, it willbe necessary to displace the whole punch holderassembly by inserting spacers between thepunch faces. At this stage it may be important todistinguish between two problems: firstly, that ofcalibrating the transducer itself, and secondly,that of calibrating the whole system.
Calibration problems
As a general rule, calibration procedures of thekind outlined above are expected to providereassurance that all is well with the system;nevertheless, there may be occasions whenthey reveal trouble. Both mechanical and elec-tronic areas may have problems, and it is use-ful to develop a systematic approach to their
solution. Some possible fault conditions arenoted here.
No signal
Assuming that the system has in fact beenswitched on, the most likely cause will be a bro-ken connection, probably at some componentthat is subject to vibration. Next may be a blownfuse in the transducer power supply: check foroutput voltage. Less likely will be a failure in thedata collection circuitry, but it is as well to havea spare transducer amplifier and a spare datainput module that can be interchanged as acheck.
Low signal
There may be a high resistance in either theinput or the output lines of the transducerbridge, reducing the working voltage. This couldresult from corrosion in a soldered joint throughthe presence of residual flux. The voltagesshould be checked with an electronic voltmetersuch as one of the Fluke portable instruments,first at the transducer and again directly fromthe power supply module. As before, the ampli-fier and input modules can be replaced in orderto establish if conditions are thereby changed.
Strain gauges, if attached to a substrate byadhesive, may become wholly or partlydetached. This may not be easy to see, but it isworth examining the area with a �10 hand lens.
Signal clipping
What appears to be a normal calibration curvemay flatten out at one end and the output signalwould reach a maximum value even though themeasured variable continues to increase. Theremay be several reasons for this effect, somemechanical and some electrical or electronic.Taking, as an example, the displacement trans-ducer; it is possible for the body of this device towork loose in its housing through vibration fromthe operation of the press. If the armature itselfremains connected, then the transducer signal
Calibration of transducer systems 145

will fall to low levels over part of its travel. Thiscan be checked readily by inspection.
Signal clipping can take place in strain-gauged assemblies as a result of some disconti-nuity in the stress–strain relations of the parts.For example, a gauged component deformslinearly over a certain range, but then makescontact with another component. Now the twomust move together, and the gauge output islikely to be reduced. In the experience of oneof the editors, a worn bearing on a tablet presscaused a problem of this sort, resulting in aforce transducer calibration curve with twodistinct linear portions. This type of fault canusually be checked by careful observation,although the movement concerned will, ofcourse, be very small.
Electrical clipping is less easy to identify butcan happen in an analogous way if the controlson the signal amplifier have been incorrectlyadjusted. Most amplifiers have the facility to off-set a signal so the amplifier output can be broughtto an electrical zero. Ideally, the mechanical and
electrical zero points would be the same, but it iseasier to carry out the fine tuning electrically. Thesystem may, therefore, have been set near thevery limits of its working range. In this event itcan only provide a small change in output beforeit reaches the end of its electrical travel.
Non-linearity
Some transducer systems inevitably generatenon-linear signals, which must be corrected bythe data handling equipment; examples hereinclude some types of instrumented ejectionramp, and certain non-contact displacementtransducers. In other systems, non-linearity mayrepresent a fault condition. The charge ampli-fiers used to handle the very small signals from apiezoelectric load cell, for instance, are quitesusceptible to variations in their input capaci-tance. A poor quality connecting cable, or anaccidental splash of water, may give rise todistorted calibration curves.
146 Tablet and capsule machine instrumentation
Introduction
This chapter will discuss the various methodsthat can be employed to take meaningful infor-mation from a sensor and pass it into a com-puter. Each sub-system will be designed under aset of engineering compromises; therefore, inorder to obtain accurate information about theprocess under investigation, the investigator willneed to be able to check that each sub-systemwill meet its specific requirements. If one sectiondoes not have a sufficiently high bandwidth, forexample, some of the information will be lostand the final data analysis could lead to incor-rect conclusions, popularly described as ‘garbagein, garbage out’.
It would be fair to say that there have not beenmany new electronics devices introduced sincethe early 1980s, but the modern devices havebeen improved very considerably. They are nowgenerally faster, more accurate, cooler, cheaperand smaller, with much reduced power con-sumption. These factors have allowed funda-mental changes in the method of dataacquisition; for example, small surface-mountcomponents to analyse, store and forward datamay be placed much nearer the sensor than waspreviously possible.
Nowadays the typical computer has a Pentium4 or AMD 64 processor, running under aWindows XP operating system. This is ideal fordata analysis and the colour display may be usedto advantage. Windows is not a real-time oper-ating system, and problems may arise if data arecontinually streamed into the computer becausethe central processor unit does not give that task100% of its attention. However, on the positive
side, it comes with the Excel spreadsheetprogram, which is useful for both analysis anddisplay of data.
Sampling system theory
Aliasing
Sensors typically generate an analogue signalthat varies continuously as a function of the sen-sor’s input. However, computer processing nor-mally calls for the signal to be represented innumerical form as a stream of digital data.Consequently, it is necessary to have a means ofconverting one to the other. In order to achievethis, the varying signal must be sampled at regu-lar discrete intervals, and those intervals must becarefully chosen in order to avoid a specificproblem, generally known as ‘aliasing’. A famil-iar example of aliasing is the observation thatwagon wheels in old Western cinema filmsappear to slow down, stop and then rotate back-wards as the wagon accelerates. When the spokesmove by exactly one position at the frame rate ofthe movie camera, or multiples thereof, rotationof the wheel apparently ceases. Another exampleof aliasing is the use of a stroboscope to appar-ently freeze the motion of a rotating machine;the frequency of the flashing light exactlymatches the speed of rotation of the machine. Inthese extreme examples, the effective samplingrate is that of the varying signal, and the ‘frozen’image tells us nothing about the movement as awhole.
8Data handling
Alister P Ridgway Watt
147
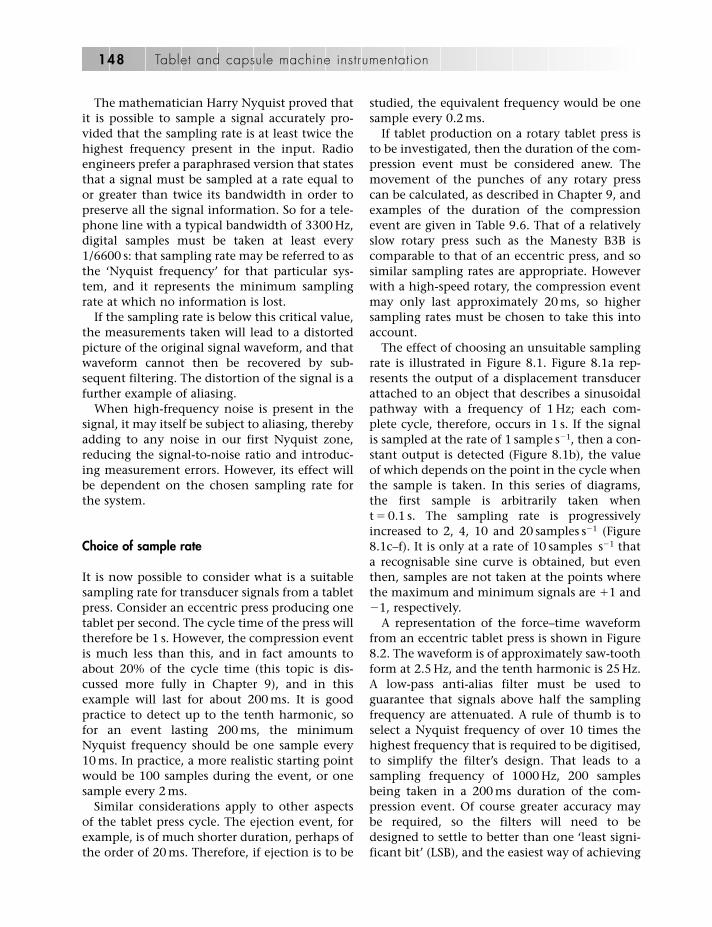
The mathematician Harry Nyquist proved thatit is possible to sample a signal accurately pro-vided that the sampling rate is at least twice thehighest frequency present in the input. Radioengineers prefer a paraphrased version that statesthat a signal must be sampled at a rate equal toor greater than twice its bandwidth in order topreserve all the signal information. So for a tele-phone line with a typical bandwidth of 3300 Hz,digital samples must be taken at least every1/6600 s: that sampling rate may be referred to asthe ‘Nyquist frequency’ for that particular sys-tem, and it represents the minimum samplingrate at which no information is lost.
If the sampling rate is below this critical value,the measurements taken will lead to a distortedpicture of the original signal waveform, and thatwaveform cannot then be recovered by sub-sequent filtering. The distortion of the signal is afurther example of aliasing.
When high-frequency noise is present in thesignal, it may itself be subject to aliasing, therebyadding to any noise in our first Nyquist zone,reducing the signal-to-noise ratio and introduc-ing measurement errors. However, its effect willbe dependent on the chosen sampling rate forthe system.
Choice of sample rate
It is now possible to consider what is a suitablesampling rate for transducer signals from a tabletpress. Consider an eccentric press producing onetablet per second. The cycle time of the press willtherefore be 1 s. However, the compression eventis much less than this, and in fact amounts toabout 20% of the cycle time (this topic is dis-cussed more fully in Chapter 9), and in thisexample will last for about 200 ms. It is goodpractice to detect up to the tenth harmonic, sofor an event lasting 200 ms, the minimumNyquist frequency should be one sample every10 ms. In practice, a more realistic starting pointwould be 100 samples during the event, or onesample every 2 ms.
Similar considerations apply to other aspectsof the tablet press cycle. The ejection event, forexample, is of much shorter duration, perhaps ofthe order of 20 ms. Therefore, if ejection is to be
studied, the equivalent frequency would be onesample every 0.2 ms.
If tablet production on a rotary tablet press isto be investigated, then the duration of the com-pression event must be considered anew. Themovement of the punches of any rotary presscan be calculated, as described in Chapter 9, andexamples of the duration of the compressionevent are given in Table 9.6. That of a relativelyslow rotary press such as the Manesty B3B iscomparable to that of an eccentric press, and sosimilar sampling rates are appropriate. Howeverwith a high-speed rotary, the compression eventmay only last approximately 20 ms, so highersampling rates must be chosen to take this intoaccount.
The effect of choosing an unsuitable samplingrate is illustrated in Figure 8.1. Figure 8.1a rep-resents the output of a displacement transducerattached to an object that describes a sinusoidalpathway with a frequency of 1 Hz; each com-plete cycle, therefore, occurs in 1 s. If the signalis sampled at the rate of 1 sample s�1, then a con-stant output is detected (Figure 8.1b), the valueof which depends on the point in the cycle whenthe sample is taken. In this series of diagrams,the first sample is arbitrarily taken whent � 0.1 s. The sampling rate is progressivelyincreased to 2, 4, 10 and 20 samples s�1 (Figure8.1c–f). It is only at a rate of 10 samples s�1 thata recognisable sine curve is obtained, but eventhen, samples are not taken at the points wherethe maximum and minimum signals are �1 and�1, respectively.
A representation of the force–time waveformfrom an eccentric tablet press is shown in Figure8.2. The waveform is of approximately saw-toothform at 2.5 Hz, and the tenth harmonic is 25 Hz.A low-pass anti-alias filter must be used toguarantee that signals above half the samplingfrequency are attenuated. A rule of thumb is toselect a Nyquist frequency of over 10 times thehighest frequency that is required to be digitised,to simplify the filter’s design. That leads to asampling frequency of 1000 Hz, 200 samplesbeing taken in a 200 ms duration of the com-pression event. Of course greater accuracy maybe required, so the filters will need to bedesigned to settle to better than one ‘least signi-ficant bit’ (LSB), and the easiest way of achieving
148 Tablet and capsule machine instrumentation

Data handling 149
1
0.8
0.6
−1
−0.8
−0.6
−0.4
−0.2
0
0.2
0.4
0.2 0.4 0.6 0.8 1 1.2 1.4 1.6 1.8 20
Time (s)(a)
1
0.8
0.6
0.4
0.2
00 0.5 1 1.5
Time (s)
(b)
2 2.5
Figure 8.1 The effect of sampling a sinusoidal curve at a range of sampling rates. (a) Original sine curve with afrequency of 1 Hz; (b–f) sampling frequencies of 1, 2, 4, 10 and 20 samples s�1, respectively.
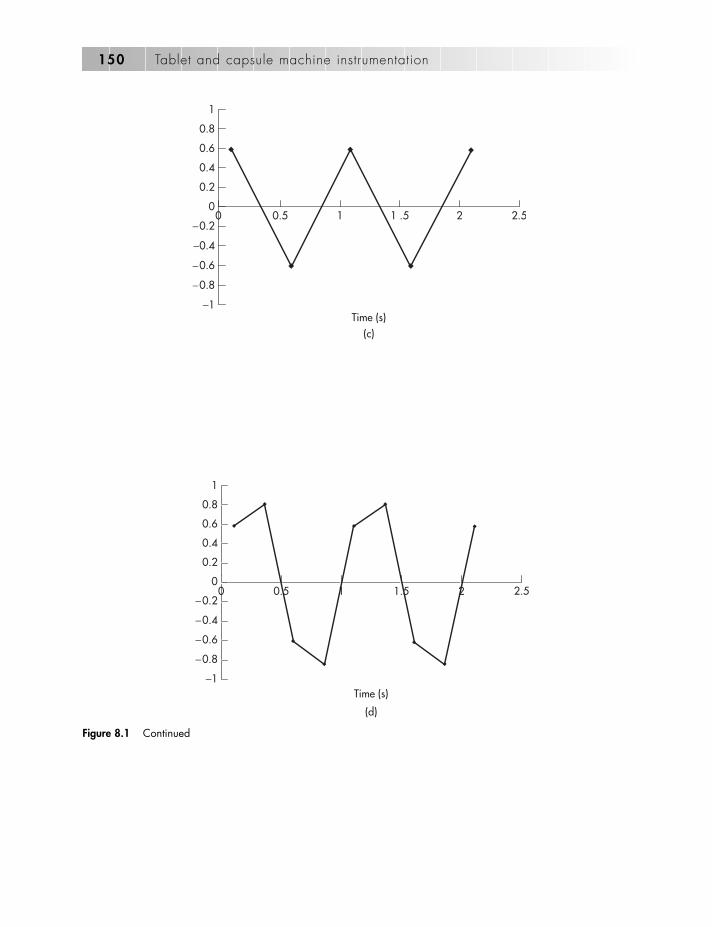
150 Tablet and capsule machine instrumentation
1
0.8
0.6
0.4
0.2
−0.2
−0.4
−0.6
−0.8
−1
02.521 .510.50
Time (s)(c)
1
0.8
0.6
0.4
0.2
0
−0.2
−0.4
−0.6
−0.8
−1
2.521.510.50
Time (s)
(d)
Figure 8.1 Continued

Data handling 151
−0.8
−0.6
−0.4
−0.2
0
0.2
0.4
0.6
0.8
1
−1
2.521.510.50
Time (s)
(e)
1
0.8
0.6
0.4
0.2
0
−0.2
−0.4
−0.6
−0.8
−1
2.521.510.50
Time (s)(f)
Figure 8.1 Continued

this is to raise the sampling rate again, as will beseen below.
If, however, we are going to build an embed-ded system that stores one or several cycles, ahigh sampling rate will require a correspond-ingly large memory, so a compromise must bereached between accuracy and size. One effect oflow-pass filtering is that a moving average func-tion of the data is obtained. This is also shown inFigure 8.2 and clearly demonstrates that a sam-pling rate of one every 10 ms is far too low, as thepeak reading has fallen by 10%.
One way to determine the optimum samplerate is to digitise the sensor’s waveform on aninstrument of much higher specification thanmight otherwise be thought necessary. The digi-tised information can then be fed into a Fouriertransform that generates either an amplitude–frequency or power–frequency bar chart. Anamplitude–frequency chart has both real andimaginary levels, so phase differences may berecovered. As phase is not of interest, the twolevels are converted into power. Imaginary levelsare often denoted by i or j. An Excel macro,
� IMABS (column)^2, performs the conversionfunction.
Often the terms fast Fourier transform (FFT), dis-crete Fourier transform and discrete cosine trans-form are used in this context. If the input samplebuffer length is 2N, where N is an integer, then theFFT algorithm may be used. The FFT removes alarge number of duplicated calculations; hence itis called ‘fast’.
Resolution
The analogue-to-digital converter (ADC) con-verts an analogue input voltage to a number.There is a range of analogue input voltages thatoutput the same code number, as a result ofquantisation, and this number represents thewidth of the LSB. Assuming a full-scale inputrange of 5 V, Table 8.1 lists the LSB width ofvarious size ADCs and output number range.
An N-bit converter outputs numbers from 0 to2N � 1, so an 8-bit converter outputs a range ofbinary numbers from 0 to 255, and resolution
152 Tablet and capsule machine instrumentation
50 100
True dataMoving average data
0 350 400300250200150
60
100
90
80
70
50
40
30
20
10
0
Time (ms)
Forc
e (%
max
imum
)
Figure 8.2 Force–time waveform from an eccentric tablet press, showing the original waveform and the averaging effectof low-pass filtering.
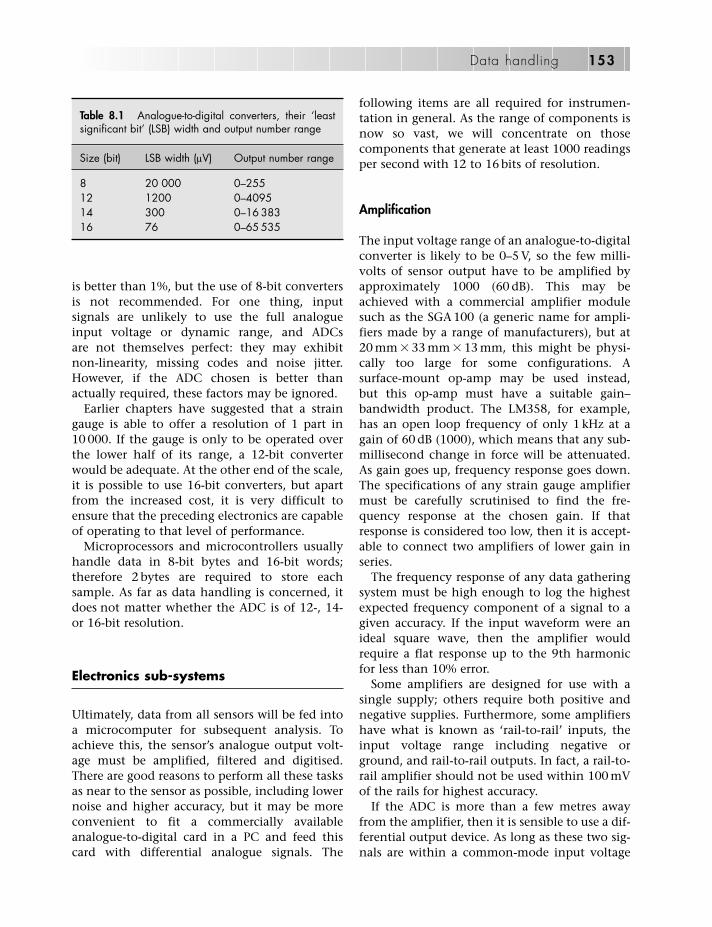
is better than 1%, but the use of 8-bit convertersis not recommended. For one thing, inputsignals are unlikely to use the full analogueinput voltage or dynamic range, and ADCsare not themselves perfect: they may exhibitnon-linearity, missing codes and noise jitter.However, if the ADC chosen is better thanactually required, these factors may be ignored.
Earlier chapters have suggested that a straingauge is able to offer a resolution of 1 part in10 000. If the gauge is only to be operated overthe lower half of its range, a 12-bit converterwould be adequate. At the other end of the scale,it is possible to use 16-bit converters, but apartfrom the increased cost, it is very difficult toensure that the preceding electronics are capableof operating to that level of performance.
Microprocessors and microcontrollers usuallyhandle data in 8-bit bytes and 16-bit words;therefore 2 bytes are required to store eachsample. As far as data handling is concerned, itdoes not matter whether the ADC is of 12-, 14-or 16-bit resolution.
Electronics sub-systems
Ultimately, data from all sensors will be fed intoa microcomputer for subsequent analysis. Toachieve this, the sensor’s analogue output volt-age must be amplified, filtered and digitised.There are good reasons to perform all these tasksas near to the sensor as possible, including lowernoise and higher accuracy, but it may be moreconvenient to fit a commercially availableanalogue-to-digital card in a PC and feed thiscard with differential analogue signals. The
following items are all required for instrumen-tation in general. As the range of components isnow so vast, we will concentrate on thosecomponents that generate at least 1000 readingsper second with 12 to 16 bits of resolution.
Amplification
The input voltage range of an analogue-to-digitalconverter is likely to be 0–5 V, so the few milli-volts of sensor output have to be amplified byapproximately 1000 (60 dB). This may beachieved with a commercial amplifier modulesuch as the SGA 100 (a generic name for ampli-fiers made by a range of manufacturers), but at20 mm � 33 mm � 13 mm, this might be physi-cally too large for some configurations. Asurface-mount op-amp may be used instead,but this op-amp must have a suitable gain–bandwidth product. The LM358, for example,has an open loop frequency of only 1 kHz at again of 60 dB (1000), which means that any sub-millisecond change in force will be attenuated.As gain goes up, frequency response goes down.The specifications of any strain gauge amplifiermust be carefully scrutinised to find the fre-quency response at the chosen gain. If thatresponse is considered too low, then it is accept-able to connect two amplifiers of lower gain inseries.
The frequency response of any data gatheringsystem must be high enough to log the highestexpected frequency component of a signal to agiven accuracy. If the input waveform were anideal square wave, then the amplifier wouldrequire a flat response up to the 9th harmonicfor less than 10% error.
Some amplifiers are designed for use with asingle supply; others require both positive andnegative supplies. Furthermore, some amplifiershave what is known as ‘rail-to-rail’ inputs, theinput voltage range including negative orground, and rail-to-rail outputs. In fact, a rail-to-rail amplifier should not be used within 100 mVof the rails for highest accuracy.
If the ADC is more than a few metres awayfrom the amplifier, then it is sensible to use a dif-ferential output device. As long as these two sig-nals are within a common-mode input voltage
Data handling 153
Table 8.1 Analogue-to-digital converters, their ‘leastsignificant bit’ (LSB) width and output number range
Size (bit) LSB width (lV) Output number range
8 20 000 0–25512 1200 0–409514 300 0–16 38316 76 0–65 535
range, external influences on the signal will tendto cancel out.
At this point it is useful to consider feedingany bridge reference voltages of the sensor toanother ADC, again differentially.
Low-pass filter
The low-pass filter is also known as a basebandanti-aliasing filter. It should be fitted as near tothe ADC’s input as possible. This filter has tworoles: removing any high-frequency noise pickedup and, more importantly, attenuating anysignal component above the Nyquist frequency.
Because a low-pass filter’s attenuation aboveits cut-off frequency rises at 6 dB per octave perpole, and it is difficult to design extensive multi-pole filters, an engineering compromise must bemade between circuit complexity, maximumuseful frequency and sampling rate. The simplestdesign, the one-pole RC filter, is just a seriesinput resistor and a capacitor to ground. Morecomplicated optimised filter designs exist; someutilise operational amplifier systems (op-amps),capacitors and resistors, in which the com-ponent values are chosen to optimise parameterssuch as pass-band ripple, cut-off slope and finalattenuation; others are switched-capacitor filters.
The problem with op-amp filters is that asmore poles are added, the components need tohave greater accuracy and temperature stability,otherwise the filter is likely to become unstableand may oscillate.
Switched-capacitor filters are available in sur-face-mount or dual-in-line integrated circuitpackages, in various optimised filter configur-ations and need clock signals at typically 100times the required cut-off frequency. These opti-mised filter designs include those described asButterworth, elliptic and Chebychev, accordingto their particular characteristics.
In the Butterworth design, also known as ‘maxi-mally flat’, the gain–frequency response curve isflattest at frequencies below the cut-off frequency;in other words, the filter exhibits less gain vari-ation as a function of frequency than do the otherconfigurations. This will produce the most accu-rate results from dynamic signals whose frequencycomponents lie within the pass band.
The elliptic configuration exhibits a bettertransient response at the expense of more grad-ual attenuation above the cut-off frequency,while the Chebychev design (also speltTchebychev) has the steepest attenuation abovethe cut-off frequency.
It is preferable to choose a sampling frequencybetween 10 and 100 times the highest significantfrequency in order to simplify the filter design.The choice of too high a frequency leads notonly to greater ADC cost but also involves farmore data to transfer, store and analyse.
Texas Instruments offers a free op-amp activefilter design programme called FilterPro™. As astarting point, the user should select a gain of 1,a cut-off frequency of 1 kHz and a Butterworth-type response. If the sampling frequency is 100kilosamples every second (100 kSa s�1), then theNyquist frequency will be 50 kHz; FilterPro™will then show the design’s attenuation at thatfrequency and will indicate that a simple single-stage circuit is adequate to give 20–40 dB ofattenuation.
The attenuation required is dependent on themaximum expected frequency componentsfrom the sensor, the electrical noise level andthe ADC resolution. If a commercial PC-compatible analogue-to-digital card is used,then it is important to check if anti-aliasingfilters are supplied on the card, and if so, whattheir characteristics are.
Analogue multiplexer
It is possible to multiplex several analogue chan-nels into a single ADC so that sequential conver-sion can be achieved. The multiplexer is ananalogue switch that is controlled by the system.Sufficient time for a sample/hold circuit tocharge up to a given accuracy must be allowedbefore a conversion can start. This reduces thetime the converter can be producing valid data.It is difficult to design a multiplexed systemcapable of much better than 12-bit performance.Signals from one channel can influence otherchannels, the multiplexer’s ‘on’ resistance varieswith input voltage, and this makes fault-findingdifficult. Designing such a sub-system fromscratch is not recommended.
154 Tablet and capsule machine instrumentation

Some ADCs already incorporate an inputmultiplexer; these have been specificallymatched to the ADC section and are capable ofgood performance.
Sample and hold
The filtered signal is now ready for the ADCsub-system. The ADC typically chosen for aninstrumentation application requires that itsinput voltage does not vary by more than 1 bitequivalent voltage during the conversionprocess. If a 12-bit converter has an input volt-age range of 0–5 V, then a change of input volt-age of 5/4096 (roughly 1.0 mV) will change theoutput signal by one bit. A sinusoidal wave ofmore than 10 Hz will exceed this if the conver-sion time is more than 8 ls, and so for ourapplications, a ‘sample and hold’ must be used.The term ‘track and hold’ is more accurate butis not used as often.
A sample and hold comprises a CMOS (com-plimentary metal oxide semiconductor) ana-logue switch and a capacitor. The capacitor ischarged to the input voltage when the switchis closed. The switch is opened by a logic sig-nal for the duration of the conversion process;the capacitor then holds its original voltage toallow the conversion process to generate thecorrect output. The capacitor must be largeenough that its voltage will not drop bythe 1-bit equivalent voltage as a result of thecurrent passing into the ADC. However, thevalue must not be too great, otherwise it wouldnot charge up fully because of the series resist-ance of the analogue switch and the previouscircuit’s current drive capability. In fact, theseries resistance and capacitor act as a single-poleRC filter.
It is possible to combine the anti-alias filterand sample-and-hold sections by using aswitched-capacitor low-pass filter such as theMF10 (a generic device made by a number ofmanufacturers) and arranging the clock tostop during conversion time. Most modernADCs have the sample-and-hold circuitrybuilt in.
Analogue to digital converters
ADCs may be grouped into three simplifiedgroups that convert an analogue voltage to adigital output by completely different methods.They are described in order of conversion speed.
Dual-slope integrating devices
Dual-slope ADCs are ideal for converting a straingauge signal in devices such as weighing scales;their advantages including very low cost and aresolution of up to 24 bits. The fact that they canonly convert at around 10 Sa s�1 rules out theiruse in the applications discussed here, for whichat least 1000 Sa s�1 is needed.
Successive approximation register devices
Successive approximation register devicesdepend on an algorithm first suggested byTartaglia, a mathematician, in 1556. The devicetakes one clock pulse per bit of resolution, so a12-bit converter requires 12 clock pulses to per-form one conversion. This limits their effectivespeed to a range of 100 kSa s�1 to 3 MSa s�1. Theyhave two types of output: serial and parallel.Serial outputs are synchronous, that is they con-sist of a clock signal and serial data, with poss-ibly a couple of signals to facilitate devices to bedaisy-chained. The protocols used vary slightly;hence we have inter-integrated circuit (I2C) andserial peripheral interface (SPI) as two examples.The SPI clock frequency is typically 10 MHz, so16 bits of data may be transferred in less than2 ls. Many microcontrollers have a built-in serialinterface and so are easy to connect with what isreferred to as ‘glue-less’ logic.
Parallel-output ADCs have eight or more datapins. Their disadvantage is that they have ahigher pin count, and hence are larger, and theircost is greater. If they have only eight data pinsand higher resolution, they will have high- andlow-byte-enable pins as well.
The first device to achieve industry-standardstatus was the 574AJD (Figure 8.3c), made byAnalog Devices Inc. and which was introducedin 1978. It had a resolution of 12 bits and a 35 ls
Data handling 155
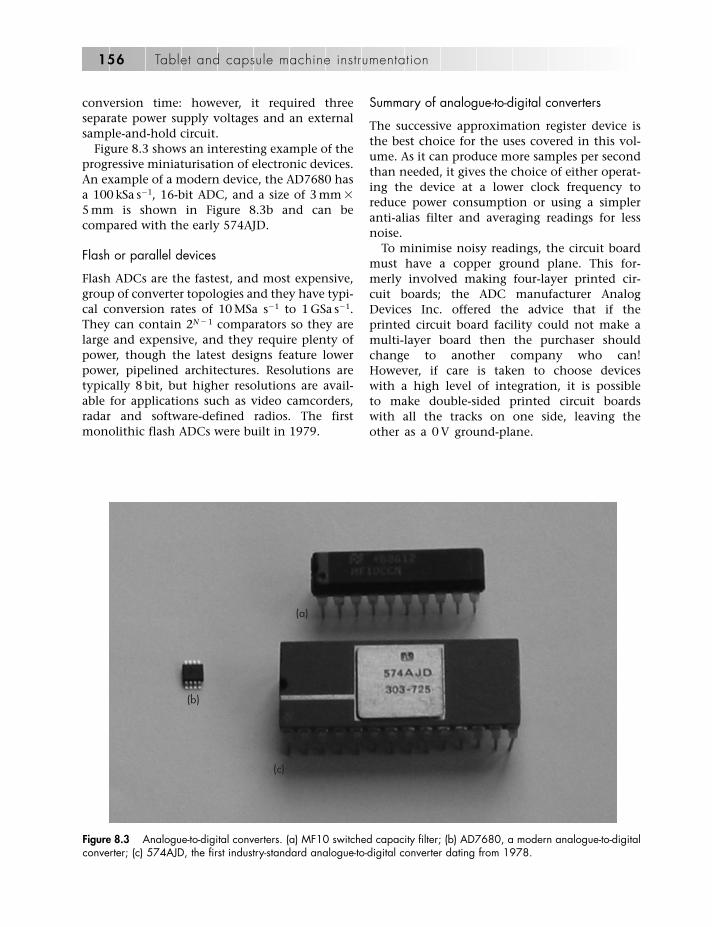
conversion time: however, it required threeseparate power supply voltages and an externalsample-and-hold circuit.
Figure 8.3 shows an interesting example of theprogressive miniaturisation of electronic devices.An example of a modern device, the AD7680 hasa 100 kSa s�1, 16-bit ADC, and a size of 3 mm �
5 mm is shown in Figure 8.3b and can becompared with the early 574AJD.
Flash or parallel devices
Flash ADCs are the fastest, and most expensive,group of converter topologies and they have typi-cal conversion rates of 10 MSa s�1 to 1 GSa s�1.They can contain 2N � 1 comparators so they arelarge and expensive, and they require plenty ofpower, though the latest designs feature lowerpower, pipelined architectures. Resolutions aretypically 8 bit, but higher resolutions are avail-able for applications such as video camcorders,radar and software-defined radios. The firstmonolithic flash ADCs were built in 1979.
Summary of analogue-to-digital converters
The successive approximation register device isthe best choice for the uses covered in this vol-ume. As it can produce more samples per secondthan needed, it gives the choice of either operat-ing the device at a lower clock frequency toreduce power consumption or using a simpleranti-alias filter and averaging readings for lessnoise.
To minimise noisy readings, the circuit boardmust have a copper ground plane. This for-merly involved making four-layer printed cir-cuit boards; the ADC manufacturer AnalogDevices Inc. offered the advice that if theprinted circuit board facility could not make amulti-layer board then the purchaser shouldchange to another company who can!However, if care is taken to choose deviceswith a high level of integration, it is possibleto make double-sided printed circuit boardswith all the tracks on one side, leaving theother as a 0 V ground-plane.
156 Tablet and capsule machine instrumentation
Figure 8.3 Analogue-to-digital converters. (a) MF10 switched capacity filter; (b) AD7680, a modern analogue-to-digitalconverter; (c) 574AJD, the first industry-standard analogue-to-digital converter dating from 1978.
(a)
(c)
(b)

Some two-channel ADCs are designed forstereo audiofrequency use. They are not rec-ommended for instrumentation use, as theytend not to have good DC specifications.
It may be necessary to supply a voltage ref-erence, though the supply voltage can often beused. If the sensor’s excitation voltage is fedinto another ADC channel, any change in thereference voltage will affect both signals, andsubsequent data processing can cancel outthese problems. This technique allows theuse of non-regulated voltage on a Wheatstonebridge.
Embedded systems
As electronics become smaller, signal-processingcircuitry can be positioned closer to the sensor;in this case the computer interface may be digi-tal and the outgoing data may be calibrated andcorrected for temperature before transmission.Clearly, this requires some local processingpower so that analogue-to-digital conversionsare scheduled at the sampling rate, while thedata may be pre-processed to reduce noise byaveraging and filtered, scaled and transmitted asa part of a packet.
An embedded system is a microcontroller withits own memory, program and input/outputports. The program itself is often quite simple: itwill initiate ports and interfaces then loop roundcontinually reading the inputs and either storingthe data or forwarding it to another device. Theinput/output ports may or may not be physicallyin the microcontroller package.
To apply digital filtering to tablettingprocesses, a digital signal processor chip can beused. This chip is similar to a microcontroller butalso has a multiplier, accumulator register andtwo data address generators. Texas Instrumentsand Analog Devices are the world leaders in thedesign of digital signal processors.
Microchip Technology’s dsPIC series of digitalsignal microcontrollers (programmable input–output controllers (PIC)) are ideal for thepurposes described in this volume. A surface-mounted package, 12 mm � 11 mm in dimen-sions, provides an 8-channel analogue input
multiplexer, 12-bit 200 kSa s�1 ADC, digitalsignal processor core, 16-bit central processorunit, programme memory, 2 kbyte data mem-ory, clock generator, timers, serial interface anddebug port. The digital signal processor coremay be used for post-conversion filtering,decimation and averaging, while the microcon-troller section can assemble data into a packetfor transmission either immediately or later.
The dsPIC series operate with a supply voltagebetween 2.7 and 5 V at currents ranging from 20to 40 mA. However, if a particular application isintended to run on small coin cells, anotherapproach is to use a micropower PIC chip and anexternal ADC of very low power. Current con-sumption would be reduced to the order of 100lA. The PIC has an 8-bit internal data bus andonly one register and, therefore, requires moreeffort to write programs.
Many of the dsPIC series processors are avail-able in both surface mount as well as plastic DIPpackages, so that prototype circuits may beeasily constructed on 0.1 inch pitch Veroboard.Most other manufacturers no longer offer DIPcomponents. The dsPIC contains electricallyerasable memory, so the program may be alteredas required during the debugging process, andeven subsequently changed for a completely dif-ferent application. Microchip Technology supplya free assembler and simulator called MPLAB®: a‘C’ compiler and USB ICD2 programmer areavailable at reasonable cost.
Computer interfacing
There are many interfaces available asstandard in the modern PC. This section willdiscuss each interface’s relevance to instrumen-tation. The choice of interface depends onmany factors. If the data-logging system isbuilt into a punch and relies on an infraredwindow to pass data to the outside, then itmakes sense to ensure it follows the InfraredData Association (IrDA) standard so it maysimply be held near a laptop, or IrDA-equipped PC, and interrogated. Conversely if acommercial PCI ADC card is used, thendifferential analogue interfacing would be
Data handling 157
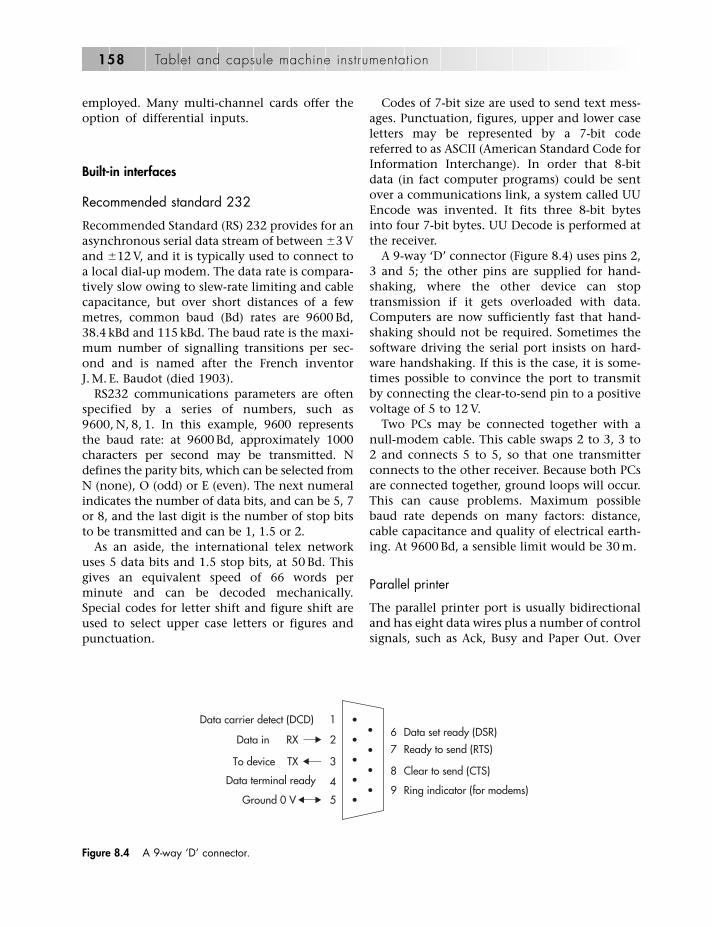
employed. Many multi-channel cards offer theoption of differential inputs.
Built-in interfaces
Recommended standard 232
Recommended Standard (RS) 232 provides for anasynchronous serial data stream of between �3 Vand �12 V, and it is typically used to connect toa local dial-up modem. The data rate is compara-tively slow owing to slew-rate limiting and cablecapacitance, but over short distances of a fewmetres, common baud (Bd) rates are 9600 Bd,38.4 kBd and 115 kBd. The baud rate is the maxi-mum number of signalling transitions per sec-ond and is named after the French inventor J. M. E. Baudot (died 1903).
RS232 communications parameters are oftenspecified by a series of numbers, such as 9600, N, 8, 1. In this example, 9600 representsthe baud rate: at 9600 Bd, approximately 1000characters per second may be transmitted. Ndefines the parity bits, which can be selected fromN (none), O (odd) or E (even). The next numeralindicates the number of data bits, and can be 5, 7or 8, and the last digit is the number of stop bitsto be transmitted and can be 1, 1.5 or 2.
As an aside, the international telex networkuses 5 data bits and 1.5 stop bits, at 50 Bd. Thisgives an equivalent speed of 66 words perminute and can be decoded mechanically.Special codes for letter shift and figure shift areused to select upper case letters or figures andpunctuation.
Codes of 7-bit size are used to send text mess-ages. Punctuation, figures, upper and lower caseletters may be represented by a 7-bit codereferred to as ASCII (American Standard Code forInformation Interchange). In order that 8-bitdata (in fact computer programs) could be sentover a communications link, a system called UUEncode was invented. It fits three 8-bit bytesinto four 7-bit bytes. UU Decode is performed atthe receiver.
A 9-way ‘D’ connector (Figure 8.4) uses pins 2,3 and 5; the other pins are supplied for hand-shaking, where the other device can stoptransmission if it gets overloaded with data.Computers are now sufficiently fast that hand-shaking should not be required. Sometimes thesoftware driving the serial port insists on hard-ware handshaking. If this is the case, it is some-times possible to convince the port to transmitby connecting the clear-to-send pin to a positivevoltage of 5 to 12 V.
Two PCs may be connected together with anull-modem cable. This cable swaps 2 to 3, 3 to2 and connects 5 to 5, so that one transmitterconnects to the other receiver. Because both PCsare connected together, ground loops will occur.This can cause problems. Maximum possiblebaud rate depends on many factors: distance,cable capacitance and quality of electrical earth-ing. At 9600 Bd, a sensible limit would be 30 m.
Parallel printer
The parallel printer port is usually bidirectionaland has eight data wires plus a number of controlsignals, such as Ack, Busy and Paper Out. Over
158 Tablet and capsule machine instrumentation
Data carrier detect (DCD)Data set ready (DSR)
Data in RX 2
16
Ready to send (RTS)7
Clear to send (CTS)8
Ring indicator (for modems)9
To device
Data terminal ready
TX 3
4
Ground 0 V 5
Figure 8.4 A 9-way ‘D’ connector.
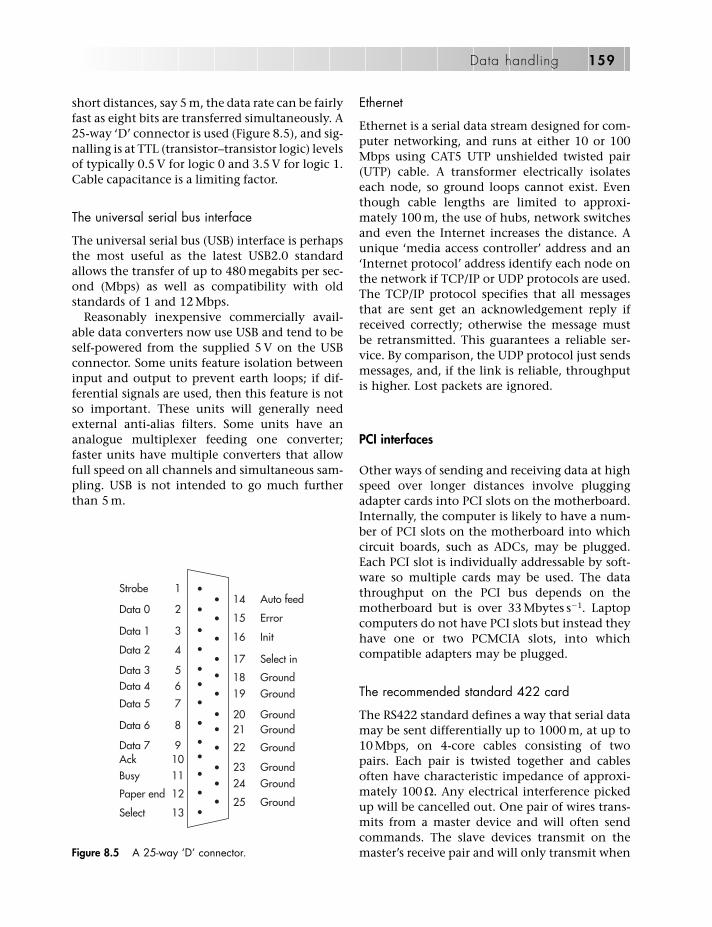
short distances, say 5 m, the data rate can be fairlyfast as eight bits are transferred simultaneously. A25-way ‘D’ connector is used (Figure 8.5), and sig-nalling is at TTL (transistor–transistor logic) levelsof typically 0.5 V for logic 0 and 3.5 V for logic 1.Cable capacitance is a limiting factor.
The universal serial bus interface
The universal serial bus (USB) interface is perhapsthe most useful as the latest USB2.0 standardallows the transfer of up to 480 megabits per sec-ond (Mbps) as well as compatibility with oldstandards of 1 and 12 Mbps.
Reasonably inexpensive commercially avail-able data converters now use USB and tend to beself-powered from the supplied 5 V on the USBconnector. Some units feature isolation betweeninput and output to prevent earth loops; if dif-ferential signals are used, then this feature is notso important. These units will generally needexternal anti-alias filters. Some units have ananalogue multiplexer feeding one converter;faster units have multiple converters that allowfull speed on all channels and simultaneous sam-pling. USB is not intended to go much furtherthan 5 m.
Ethernet
Ethernet is a serial data stream designed for com-puter networking, and runs at either 10 or 100Mbps using CAT5 UTP unshielded twisted pair(UTP) cable. A transformer electrically isolateseach node, so ground loops cannot exist. Eventhough cable lengths are limited to approxi-mately 100 m, the use of hubs, network switchesand even the Internet increases the distance. Aunique ‘media access controller’ address and an‘Internet protocol’ address identify each node onthe network if TCP/IP or UDP protocols are used.The TCP/IP protocol specifies that all messagesthat are sent get an acknowledgement reply ifreceived correctly; otherwise the message mustbe retransmitted. This guarantees a reliable ser-vice. By comparison, the UDP protocol just sendsmessages, and, if the link is reliable, throughputis higher. Lost packets are ignored.
PCI interfaces
Other ways of sending and receiving data at highspeed over longer distances involve pluggingadapter cards into PCI slots on the motherboard.Internally, the computer is likely to have a num-ber of PCI slots on the motherboard into whichcircuit boards, such as ADCs, may be plugged.Each PCI slot is individually addressable by soft-ware so multiple cards may be used. The datathroughput on the PCI bus depends on themotherboard but is over 33 Mbytes s�1. Laptopcomputers do not have PCI slots but instead theyhave one or two PCMCIA slots, into whichcompatible adapters may be plugged.
The recommended standard 422 card
The RS422 standard defines a way that serial datamay be sent differentially up to 1000 m, at up to10 Mbps, on 4-core cables consisting of twopairs. Each pair is twisted together and cablesoften have characteristic impedance of approxi-mately 100 �. Any electrical interference pickedup will be cancelled out. One pair of wires trans-mits from a master device and will often sendcommands. The slave devices transmit on themaster’s receive pair and will only transmit when
Data handling 159
StrobeAuto feed
114
Error15
Init16
Select in17
Ground18Ground19
Ground20Ground21
Ground22
Ground23Ground24
Ground25
Data 0 2
Data 1 3
Data 2 4
Data 3 5Data 4 6
Data 5 7
Data 6 8
Data 7 9Ack 10Busy 11
Paper end 12
Select 13
Figure 8.5 A 25-way ‘D’ connector.

asked. If there is more than one slave device,each slave transmitter must have tri-state con-trol. Tri-state control effectively disconnects thetransmitter from the cable.
Receivers have a common-mode input voltagerange of at least �7 V; provided that each unit’searth is within the 7 V range, a direct low-impedance connection between the two units isnot necessary. Therefore ground loops do notcause problems.
Signalling voltages are similar to TTL level, butcurrents are higher, so each pair can be resistivelyterminated with matching resistors to absorbreflections. A 9-way D connector is often used,but there is no single wiring standard, so a dataanalyser is the most efficient tool for successfulRS422 interface work. To further confuse theengineer, each pin’s nomenclature varies fromdevice to device: terms such as RX�, RX�, TX�,TX�, A, B, X and Y are often found (Figure 8.6).
The recommended standard 485 card
RS485 is a two-wire version of RS422. Again, it isdifferential, with signalling states of 0 V, 5 V andtri-state control. Up to around 32 devices may beconnected to the single data pair; software mustcontrol each transmitter if data collisions are tobe avoided. Data rates of 10 Mbps are achievableto 10 m, at 9600 Bd, over 1 km.
HP-IB
HP-IB is a parallel bus able to connect to plotters,data-loggers, etc. It is also known as GP-IB andIEEE-488. Connectors are 24-pin Amphenol.Units may be daisy-chained together so a PCmay control many instruments. Distances arelimited to 20 m.
IrDA
Most laptops have an infrared port, called IrDA,which is a serial data interface using infraredpulses. It is possible to purchase IrDA adaptersfor desktop PCs. Common IrDA data rates are upto 115 kbps, though UFIR (Ultra Fast IR) operatesat 16 Mbps: 100 Mbps is under development.The range is 1 m. Ground loops do not exist, asthe IrDA interface is electrically isolated.
Radiofrequency interfaces
Several licence-free bands have been allocatedfor ISM (Industrial, Scientific, and Medical) pur-poses: modules, integrated circuits, antennae,etc. are commercially available. Each band hasits own characteristics with regard to bandwidth,range and duty cycle. The standards are con-stantly evolving, and manufacturers are addingproprietary modulation methods to raise datarates, although this can limit interoperability.
160 Tablet and capsule machine instrumentation
(a)
1
RX A 2
TX B 3
4
5
(b)
6
7
8
9
TX D − (A) 1
TX D + (B) 2
RX D + (B) 3
RX D − (A) 4
5
(c)
6
7
8 TX −
9 TX +
1
2
3
RX − 4
RX + 5
6
7 RX B
8 TX A
9
Figure 8.6 Wiring standards for RS422 cards using 9-way D connectors: (a) Sony wiring standard, (b) Moxa wiringstandard, (c) Radamec wiring standard.
433 MHz. Modules are available for thisband, but the possibility of interferencefrom other users, including wireless carkey-fobs and 70 cm amateur radio, rules outserious use of this frequency. Both AM(amplitude modulation) and FM (frequencymodulation) are common. AM is sometimesknown as ‘on–off keying’.
868 MHz. A range of up to 300 m (outdoors)may be expected, and the data rate is up to9600 bps. A segment of this small bandallows low duty-cycle operation only.Addlink (part of Adcon Telemetry GmbH)make a one-channel transceiver modulewith 10-bit analogue channels and serialdata interface. The frequency is fixed, so ifmore than one pair is within range ofanother, they should be organised to operatein separate time slots in order to avoid inter-ference. Mantracourt Electronics offer a sim-ilar module measuring 35 mm � 42 mm �
14 mm with a built-in 24-bit resolution con-verter and strain gauge interface. It has 36channels, but at only 10 Sa s�1, it is far tooslow for our application.
915 MHz. This is the American equivalent ofthe European 868 MHz band.
ZigBee™/IEEE 802.15.4. This standard oper-ates on the 2.4 GHz band and offers data ratesof 250 kbps, at a range of up to 20 m. ZigBeeis designed for very-low-power operation,with a battery life of at least a year. Becausethe 2.4 GHz band is quite wide, it is possibleto replace the modulation method byorthogonal frequency-division multiplexing(OFDM), in which many carrier frequenciesare utilised. Some of these may be cancelledout if multi-path reflections from variousobjects arrive at the receiver’s antennaexactly out of phase. OFDM sends extrainformation to enable the receiver to correctfor this condition. Chipcon design integratedcircuits for this standard such as the 7 mm �
7 mm CC2430. Their latest device, theCC2500, is only 4 mm � 4 mm. The voltagecontrolled oscillator components are inte-grated into the package. These devices areavailable from Texas Instruments.
Wireless Ethernet 802.11. This standard is typi-cally used to network together computers
such as laptops, and is ideal for sending largequantities of data in short bursts. Data ratesvary dynamically to enable reliable through-put and the standard is being improvedevery year with a higher maximum data ratedenoted by the suffix letter. Currently, datarates are 11, 54 and 125 Mbps: the band is at2.4 GHz. Two relatively large integratedcircuits are required for this implemen-tation. Wireless Ethernet is not designed forlow-power operation.
Commercially available analogue-to-digitalcards
A vast range of commercially available cardsexists, so just three will be covered here to givean idea of what is current practice.
USB analogue converter
One of the advantages of USB devices is thatthey may be hot-swapped, that is they maybe connected and disconnected while the PCis running. A typical USB ADC is DataTranslation’s DT9800. It is available in both12- and 16-bit versions and has 16 channelsthat may be used as eight differential channels.One converter operates at 100 kSa s�1; therefore,the sample rate per channel is this rate dividedby the numbers of channels being used. A512-entry ‘first in, first out’ (FIFO) memory isused to reduce the likelihood of data loss by thehost computer. To prevent earth loops, this unithas built-in isolation.
PCI analogue card
Many vendors sell PCI plug-in ADC cards. ThePCI bus has superseded the old PC-ISA bus. ThePCI bus is faster and also independently address-able, so each card does not have to be individu-ally set up with DIP switches. An example of thistype of card is the PCI 260�. It can sample at500 kSa s�1 with 16-bit resolution and has 16single-ended inputs, which may be reconfiguredas eight differential inputs. Because the inputsare multiplexed into a single ADC chip, the sam-pling rate per channel reduces as more channels
Data handling 161
are selected. Differential inputs should be used ifpossible for highest accuracy if the signals haveto travel from one board to another. Some formof anti-alias filtering will have to be used unlessthere is no energy in the input signals above theNyquist frequency.
The card has a FIFO memory, so the hostprocessor can temporarily ignore the card with-out loss of data; an internal timer fills the FIFOwith data at a constant sample rate.
Plug-in cards have their total data throughputlimited by the amount of time the PC’s centralprocessor unit devotes to copying the FIFO’s con-tents on to a hard drive. The operating systemcan absorb a large percentage of the availableprocessing time, often when least convenient for incoming data streams. PCI cards are not hot-swappable!
PCI analogue card (intelligent)
One particular card that deserves a mention isthe MicroStar iDSC 1816 real-time anti-alias fil-ter card, available from Amplicon Liveline Ltd.Resolution is 16 bits, and the card has 16 Mbytesof memory. This card accepts up to 16 single-ended or eight differential analogue inputs fromoptional strain gauge amplifiers and includeseverything required for data acquisition at up to153 kSa s�1 simultaneously. This performance is aconsequence of an on-board 100 MHz 486processor and two 100 MHz digital signal proces-sors. ‘Brick wall’ anti-alias filters are included,which means they have a very steep, almostvertical, attenuation curve.
At these sampling rates, data are very likely tobe lost if the host computer is not running anefficient real-time operating system, so either alarge FIFO memory or an on-board processorand memory must be used. FIFO memory depthis of the order of a few thousand bytes in size,which is not large enough to store, say, one sec-ond’s worth of data. The design of this card uses16 Mbytes of random access memory (RAM)that easily stores that quantity of data. Fastestsample time is 7 ls, which is one or two ordersof magnitude faster than is needed for thehypothetical tablet press under consideration;frequencies of up to 50 kHz should be digitisedaccurately.
Of course, this powerful card is not inexpen-sive; it comes at a price that is approximately 10times the cost of the PCI 260�.
Software
Commercial ADC boards intended for computerinterfacing are normally provided with a certainamount of software. The simplest examples havethe basic ability to store incoming data as a textfile, while more elaborate versions may have fullanalysis and display capability. Once data havebeen stored in the computer’s memory, it is thenpossible to process the information, and one ofthe easiest ways is to use a spreadsheet programsuch as Excel.
Excel is reasonably ‘intelligent’ in that if onetries to open a text file, it will ask if the text fileis space, comma or tab delimited. If the interfacesoftware is able to store the incoming infor-mation in delimited format, Excel will fill in thespreadsheet’s cells automatically.
The next step is to normalise bridge readings.Each reading can be divided by the bridge’s exci-tation voltage, provided that the advice givenabove has been taken.
Temperature readings can also be used tomake corrections if any sensors are temperaturedependent. Excel allows a mathematical equationto apply over an entire column, with the resultsgenerating a new column as in normal spread-sheet practice.
Once temperature and bridge excitation volt-age compensations have been applied, variablessuch as force may be calculated in absolute unitsif each sensor can be calibrated. A column, or apart column, can be highlighted by two clicks ofthe computer’s mouse. The highlighted regioncan then be displayed as a graph and expandedas necessary to show areas of interest in moredetail. One click on the bar chart icon brings upthe graph menu. If the first column is arrangedto be an incrementing sample number, then thexy scatter graph should be chosen.
A data-analysis menu provides a selection ofcommands including the Fourier transform. Thiscommand uses the FFT algorithm because it willindicate if the sample length is not 2N, or over
162 Tablet and capsule machine instrumentation

4096. Output is a column of half the inputcolumn’s size where each cell is split into realand imaginary floating-point numbers. A macro(a small program) converts these two numbersinto a single, positive power.
It is recommended that a brief search on theInternet is the best way of finding out how toperform various calculations in Excel.
Data backup
The final results will be a set of graphs displayingforce against time and possibly the variation ofpeak force over a set of tablets. These graphs maybe printed out and possibly used to adjust thepress for consistent results. It may also be necess-ary to store the raw sampled data in order thatthe performance of a press can be checked fromtime to time for gradual wear and tear. It is oftensaid that the data stored in a computer are worthfar more than the computer itself. We shall listsome methods of data storage.
Hard drive
Hard drives are fairly reliable but when they dofail, there is either a catastrophic failure or agradual degradation of the surface. Hard drivesare inexpensive on a cost per gigabyte basis, so itis common practice to have removable harddrives for archival purposes. One disadvantage isthat the hardware interface is a moving target.Hard drives have evolved through differentstandards: ST506, IDE, SCSI (several standards)and now SATA; therefore, finding a compatiblecomputer in years to come may prove difficult.
Different ways of organising the file allocationtables such as FAT12, FAT16, FAT32 and NTFSetc. may also cause complications for retrieval inthe future.
Floppy disk
Historically, there have been three successfulstandards, 8, 5.25 and 3.5 inch, but only the 3.5inch 1.44 Mb disk remains in use. Floppy disks
are not very reliable, and most current PCs nolonger provide a 3.5 inch drive as standard.
Zip drive
The Zip drive is a more robust version of thefloppy disk and also has a considerably greatercapacity. The first Zip disks held 100 Mb; now-adays this has been increased to 250 Mb, andalso 750 Mb. This storage medium is relativelyexpensive. Even though the case is substantialand should protect the disk inside, some usershave reported mechanical failure.
Tape drives
Magnetic tape has been used as a storagemedium for computer data for a long time. ForPC use, the tape is held in a cartridge of somedescription, so manual threading is not necess-ary. Recording density has increased over theyears through improvements in the magneticproperties of the tape and the use of smaller tapeheads. Tape width and cartridge size havechanged with these improvements. Figure 8.7shows a selection of different cartridges, roughlyin date order. It was considered important to re-tension tapes from time to time to preventmagnetic feed-through if tapes are stored in anarchive, as opposed to being used in a cyclicbackup regime. As with the hard disk, differentindex schemes are used, so not only must acompatible drive be used but also the correctsoftware.
Compact disks
Compact disks CD-R, CD-RW etc. allow storageof up to 700 Mbytes at an economical cost. Asthis technology is relatively new, it is too early topredict long-term reliability; however, therehave been reports of failures in mass-producedCDs caused by ink gradually seeping into thecentral layers, and sunlight also may erase data.CD-R and CD-RW disks generate smaller signallevels when being read; these levels may be toolow for older CD-ROM drives.
Data handling 163

Digital versatile disks (DVDs) may also bewritten to in the same way, but storage capacityis 4.7 Gbytes for a single-sided disk. DVD-RAMdisks may be rewritten up to 100 000 timesbut are not compatible with all drives; data areorganised in 2048 byte sectors similar tothose of hard disks. An ‘Archive Gold’ CD-Rdesigned specifically for long-term storage,when carefully stored, has an expected life of100–300 years.
Magneto optical (MO) disks
Magneto optical (MO) disks were designed forlong-term archival storage, where a read/writeCD disk is protected by a plastic cartridge.When a data bit is to be written, a spot on the
surface is heated above its Curie point by asmall laser beam. Then, a ‘write’ pulse is fedinto the relatively large magnetic write head.The magnetic field only affects the state of thehot material. In this way, the recording densityis far higher than could be achieved by conven-tional magnetism alone. MiniDisks operate onthe same principle.
Write speed is slow, because every sector iscompared against the buffer on the next rotationof the disk. The cartridge is twice as thick as a 3.5inch floppy disk, but otherwise is of the samelength and width. Lack of compatibility, expens-ive media and drives, and slow write speeds haveso far prevented widespread acceptance of whatmay be the most reliable backup device. Disks of128, 230 and 640 Mbyte capacity are available.All of these are the same size.
164 Tablet and capsule machine instrumentation
(a)
(b)
(c)
(d)(e)
(f)
Figure 8.7 A selection of magnetic tape cartridges. (a) DY600A, 60 Mbytes quarter inch cartridge (QIC); (b) QD2120,120 Mbytes, also quarter inch tape, but the cartridge is much smaller; (c) Travan TR-1, 400 Mbytes, 8 mm tape width, (d)QW2GB, 1 Gbyte, 8 mm tape width; (e) HS-4/120S, 4 Gbytes, DDS2 for rotating digital audio tape; (f) DLT tape IV,40 Gbytes, 12.5 mm tape width.

Flash solid-state memory
Flash memory relies on storing electrical chargeon the gate of a transistor. The gate to sourceresistance is so high that it would take manyyears for the charge to leak away. Flash mem-ory integrated circuits are the basis of CompactFlash, and other size memory cards. Somememory cards plug into PCMCIA sockets andothers USB. Sizes range from 8 Mbytes to 2Gbytes. There is a limit on how many timeseach block of memory can be erased: from
10 000 to 1 000 000 times, depending on thetechnology used.
Further reading
Kosler W (ed) (2004). Analog–Digital Conversion.Norwood, NJ: Analog Devices Inc.
Williams T (2007). EMC for Product Designers, 4th edn.Oxford: Newnes.
Data handling 165


Introduction
There are three principal areas in which tabletpress instrumentation is used. The first of theseis the automatic control of tablet weight. Thisdepends on the relationship between the com-pression force and the tablet weight. The forceused to compress material into a tablet is pro-portional to the density of the tablet. Hence, if itcan be assumed that the volume of the tablet isconstant, then force is proportional to weight.Consequently, by linking the transducer used tomeasure force to the device for adjusting tabletweight, automatic control of tablet weight in a production environment becomes feasible.Many presses are fitted with automatic weight-control equipment, and this topic is dealt withmore fully in Chapter 11.
The second main application of press instru-mentation is to establish the relationshipbetween compression force and tablet properties.Virtually all tablet properties, such as crushingstrength, tensile strength, friability, disinte-gration time and dissolution time, are dependenton the force that was applied during the forma-tion of the tablet. It follows, therefore, thatknowledge of that force is essential if these prop-erties are to be studied in a meaningful manner.The instrumentation that is needed for this is rela-tively simple, since only the maximum punchforce needs to be measured. If the transduceroutput is linked to some form of visual recorder,then measurement of the peak height of theupper punch trace followed by reference to acalibration curve is perfectly adequate.
Figure 9.1 shows a series of outputs of trans-ducers fitted to the upper punch of an eccentric
press. The output is linked to a recorder, and theheight of the trace is a function of both theapplied force and the degree of amplification ofthe transducer output, the former being con-trolled, in turn, by the setting of the eccentriccam of the press. Alternatively if the transduceroutput is interfaced with a computer, then themaximum output is detected, a calibration factorapplied and the maximum force calculated.
There are numerous applications describedin the literature in which compression forcemeasurements have been used to evaluate theeffects of changes in formulation and processingvariables on tablet properties. For example, Duand Hoag (2003) characterised the properties ofmulti-vitamin tablets with respect to force ofcompression. The influence of compression forceon the properties of tablets made from new directcompression excipients were investigated byArmstrong (1998) and Olmo and Ghaly (1999).Information such as that shown in Figure 9.1 canalso be used as an indication of the uniformitywith which the formulation flows into the die.Since the compression force is proportional to theweight of material in the die, any variation in thelatter will be reflected by an irregular trace height.Billardon et al. (1987) used an instrumentedtablet press to devise optimal tablet formulations,employing the principles of factorial design andresponse surface methodology.
The third major application of instrumentedtablet presses is to try to establish the underlyingprinciples whereby a particulate mass is turnedinto a tablet. This, in turn, can be used to charac-terise the behaviour of solids under compressionand perhaps predict the ease with which theycan be transformed into tablets.
9Applications of tablet press instrumentation
N Anthony Armstrong
167

Punch displacement–time profiles
The output of transducers fitted to tablet pressesare usually obtained as a function of time. If theinstrumentation is linked to some form of chartrecorder, then a trace is obtained with the trans-ducer output as the ordinate and time as theabscissa. The detail shown on the trace will bedependent on the chart speed. A very slow chartspeed will give the output as a vertical line, theheight of which is proportional to the maximumvalue of that output, as shown in Figure 9.1. Anincrease in chart speed will stretch out the timeaxis, thereby showing in more detail how thetransducer output changes with time.
If the transducer output is interfaced with acomputer, then the sampling speed of the latterwill govern the amount of information collected.It should be noted that a measurement of trans-ducer output might not coincide with the maxi-mum value of the output, and therefore themaximum value would not be recorded. A rapidsampling rate will avoid this possibility (seeChapter 8).
The two parameters of principal interest intablet presses are force and punch displacement,and both of these are obtained as a function oftime. Displacement–time profiles will be con-sidered first. In theory at least, these can beobtained in two ways. They can be predicted byknowledge of the dimensions of some compo-
nents of the press or they can be obtained byrecording the variation with time of the outputof a displacement transducer that records punchmovement. The shape of the force–time profile,by comparison, is strongly influenced by theproperties of the substance being compressedand cannot be reliably predicted.
The patterns of punch movement with respectto time differ markedly between eccentric pressesand rotary presses.
Displacement–time profiles of eccentricpresses
Figure 9.2 represents the drive shaft, eccentricsheave, eccentric strap, lower bearing and upperpunch holder of an eccentric press. The positionof any component below the lower bearing, forexample the tip of the upper punch, is given byEquation (9.1), which was derived by Armstronget al. in 1983.
y � a � r sin(90 � �t) � �l2 � r2 cos2(90 � �t) (9.1)
where y is the position of the punch tip, a is thedistance between the centre of the lower bearingand the punch tip (a constant), l is the length ofthe eccentric strap, r is the radius of the eccentricsheave, t is time and � is the angular velocity ofthe shaft of the press. As the eccentric rotates,
168 Tablet and capsule machine instrumentation
Time
Peakheight
Cam = 26Amp = 4
Cam = 25Amp = 4
Cam = 24Amp = 4
Cam = 23Amp = 4
Cam = 22Amp = 5
Figure 9.1 Upper punch force transducer output at several force settings on an eccentric press. Cam, setting of theeccentric cam of the press; Amp, amplifier setting.
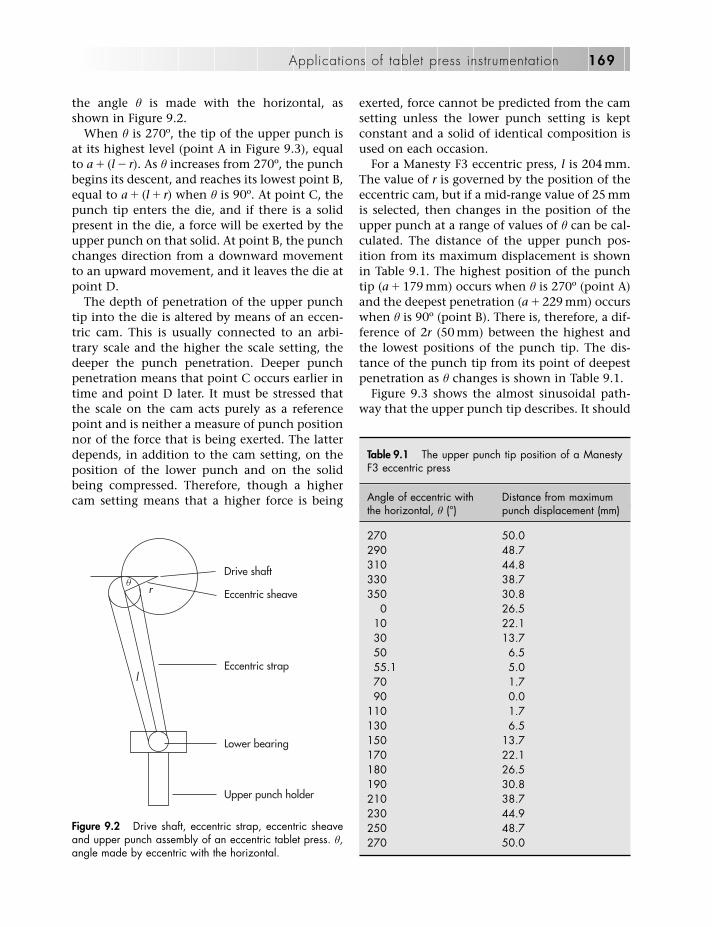
the angle � is made with the horizontal, asshown in Figure 9.2.
When � is 270º, the tip of the upper punch isat its highest level (point A in Figure 9.3), equalto a � (l � r). As � increases from 270º, the punchbegins its descent, and reaches its lowest point B,equal to a � (l � r) when � is 90º. At point C, thepunch tip enters the die, and if there is a solidpresent in the die, a force will be exerted by theupper punch on that solid. At point B, the punchchanges direction from a downward movementto an upward movement, and it leaves the die atpoint D.
The depth of penetration of the upper punchtip into the die is altered by means of an eccen-tric cam. This is usually connected to an arbi-trary scale and the higher the scale setting, thedeeper the punch penetration. Deeper punchpenetration means that point C occurs earlier intime and point D later. It must be stressed thatthe scale on the cam acts purely as a referencepoint and is neither a measure of punch positionnor of the force that is being exerted. The latterdepends, in addition to the cam setting, on theposition of the lower punch and on the solidbeing compressed. Therefore, though a highercam setting means that a higher force is being
exerted, force cannot be predicted from the camsetting unless the lower punch setting is keptconstant and a solid of identical composition isused on each occasion.
For a Manesty F3 eccentric press, l is 204 mm.The value of r is governed by the position of theeccentric cam, but if a mid-range value of 25 mmis selected, then changes in the position of theupper punch at a range of values of � can be cal-culated. The distance of the upper punch pos-ition from its maximum displacement is shownin Table 9.1. The highest position of the punchtip (a � 179 mm) occurs when � is 270º (point A)and the deepest penetration (a � 229 mm) occurswhen � is 90º (point B). There is, therefore, a dif-ference of 2r (50 mm) between the highest andthe lowest positions of the punch tip. The dis-tance of the punch tip from its point of deepestpenetration as � changes is shown in Table 9.1.
Figure 9.3 shows the almost sinusoidal path-way that the upper punch tip describes. It should
Applications of tablet press instrumentation 169
l
rq
Drive shaft
Eccentric sheave
Eccentric strap
Lower bearing
Upper punch holder
Figure 9.2 Drive shaft, eccentric strap, eccentric sheaveand upper punch assembly of an eccentric tablet press. �,angle made by eccentric with the horizontal.
Table 9.1 The upper punch tip position of a ManestyF3 eccentric press
Angle of eccentric with Distance from maximumthe horizontal, � (°) punch displacement (mm)
270 50.0290 48.7310 44.8330 38.7350 30.8
0 26.510 22.130 13.750 6.555.1 5.070 1.790 0.0
110 1.7130 6.5150 13.7170 22.1180 26.5190 30.8210 38.7230 44.9250 48.7270 50.0

be noted that the displacement trace is sym-metrical about its axis at � of 90º. The graph alsohas a smooth curve in that as soon as the punchstops descending, it commences its ascent.Consequently, punch speed is zero only for thatinstant when reversal of direction takes place. Inthe above discussion, the position of thepunches is defined in terms of the angle � and sois independent of the rate at which the pressoperates (i.e. its output).
If the rate of rotation of the press is known,then the units of the abscissa in Figure 9.3 can bechanged from ‘degrees’ to ‘time’, since 360ºequals the time taken for the press to completeone cycle. Figure 9.3 now becomes a plot of dis-tance against time, and hence the slope of theline is a measure of punch speed at that point.This aspect will be considered in more detaillater in this chapter.
In an eccentric press, compression takes placeentirely via the downward movement of theupper punch, the lower punch remainingstationary as compression occurs. When theupper punch is at its highest level, the lower
punch has already fallen to its lowest position(point E). This is defined by the volume in thedie above the lower punch tip that is needed toaccommodate the amount of solid that will inturn give a tablet of the required weight. Aftermaximum upper punch penetration hasoccurred, the upper punch rises, and shortlyafterwards, the lower punch also begins to rise(point F) until its tip is level with the top surfaceof the die (point G). This movement ejects thetablet from the die. When the tablet has beenswept away by the leading edge of the feed shoe,the lower punch commences its descent (pointH) to its former low level.
The duration of the several stages of punchmovement is controlled by the rate at which thepress operates (i.e. its output). Thus at an outputof 60 tablets min�1, the whole cycle takes 1 s. Ifthe output is reduced to 30 tablets min�1, thenthe duration of each stage is doubled. The timeinterval between points C and D depends bothon the speed of rotation of the press and on therequired depth of penetration of the upperpunch into the die. If a value for the latter of
170 Tablet and capsule machine instrumentation
Upper punch displacement
Top surfaceof die
A
G
BE F
H
50
40
30
20
10
0
5
0 90 180 270270
Dis
tanc
e fro
m m
axim
um u
pper
pun
ch p
enet
ratio
n (m
m)
Lower punch displacement
q (°)
A
C D
Figure 9.3 The change in the positions of the upper and lower punches over time in an eccentric tablet press. � is theangle the eccentric makes with the horizontal. Upper punch: A, the tip of the upper punch is at its highest level; B, low-est point of the punch where it changes direction from a downward movement to an upward movement; C, punch tipenters the die; D, punch leaves the die. Lower punch: E, lowest position; F, initiation of rise in lower punch; G, tip of lowerpunch level with the top surface of the die: H, recommencement of punch descent.

5.0 mm is arbitrarily chosen, this is achievedwhen � is 55.1º. Therefore C to D represents arotation of 2 � (90 � 55.1) � 69.8º, which isapproximately 19% of the whole cycle. Hence ata rate of 60 tablets min�1, the upper punch tip iswithin the die for a period of approximately0.19 s per cycle.
Charlton and Newton (1984) also derived anequation describing the movement of the upperpunch tip of an eccentric press. Their mathe-matical treatment differed from that used byArmstrong et al. (1983), notably in their defini-tion of �. Hence their equation differs fromEquation (9.1) but gives identical results.
Displacement–time profiles of rotarypresses
The movement of a punch tip in a rotary press ismore complicated than that of an eccentricpress, and it differs from the latter in two import-ant respects. Firstly, compression in an eccentricpress is exerted solely by the downward move-ment of the upper punch, the passive lowerpunch remaining stationary until after the com-pressive event has been completed. In a rotarypress, compression is achieved by the simult-aneous downward movement of the upperpunch and the upward movement of the lowerpunch, so that the tablet is compressed fromboth faces. Secondly, the punches of an eccentricpress move in only a vertical dimension, whereasin a rotary press, the punches move in threedimensions – vertically but also in two horizon-tal dimensions as the die table rotates.
Equations describing the movement of thepunches of a rotary press as they pass betweenthe pressure rolls have been described by Rippieand Danielson (1981) and Charlton and Newton(1984). Though the equations derived by thesetwo sets of workers appear dissimilar, the meth-ods used in their derivation are almost identical.Charlton and Newton pointed out that theanalysis of the compression process in a rotarypress is complicated by the relative movementsof the two punches. Calculations were simplifiedby the assumption that both punches moveequal amounts in opposite directions. However,since the position of the upper pressure roll is
fixed, and that of the lower roll can be changed,since it forms the mechanism for changing thecompression pressure, this assumption is notnecessarily true in practice.
Figures 9.4 and 9.5 show the spatial relation-ships between punch head, pressure roll and dietable of a rotary tablet press from above andfrom the side, respectively. The radius of thepressure roll is r1, and that of the circle on the dietable in which the dies rotate is r3. The punchhead is initially considered to be a hemisphere ofradius of curvature r2.
The horizontal movement of the punches isstraightforward, in that they describe a circularmotion, the radius of which is r3. Movement in avertical dimension is more complex. The upperpunch is lowered by coming into contact with acam track. If a force is exerted at all on the diecontents at this stage, its magnitude is only thatof the weight of the punch and can be ignored.Then when angle � becomes small enough, thepunch head comes into contact with the press-ure roll and active compression begins. Punchmovement is now controlled by the radii ofcurvature of the pressure roll and the punchhead. A line joining the centres of curvature ofthese two components will always pass throughthe point of contact between them. The verticaldisplacement of the punch (z) is given byEquation (9.2).
z � �[(r1 � r2)2 � x2] (9.2)
where x is the horizontal distance between thecentre line of the pressure roll and the point ofcontact between the roll and the punch head.The distance between the centre line of thepressure roll and the centre line of the punch(x1), can be calculated from Equation (9.3).
x1 � 2r3 sin u/2 (9.3)
when u is the angle between the punch axis andthe vertical centreline of the pressure roll. Whenu is small, Equation (9.3) reduces to
x1 � r3 sin u (9.3a)
Combination of Equations (9.2) and (9.3) givesEquation (9.4)
Applications of tablet press instrumentation 171

172 Tablet and capsule machine instrumentation
Pressure roll(radius r1)
Die table(radius r3)
Punch head
x j
Figure 9.4 Spatial relationships between punch head, pressure roll and die table of a rotary tablet press, viewed fromabove.
Figure 9.5 Spatial relationships between punch head, pressure roll and die table of a rotary tablet press, side view.
x1
Die table(radius r3)
Punch head(radius r2)
Pressure roll(radius r1)

z � �[(r1 � r2)2 � (r3 sin u � x2)2] (9.4)
Vertical punch movement is described byEquation (9.4) provided the punch head has aradius of curvature of r2. However, the over-whelming majority of punches have a flat area ofradius r4 on their heads and a curved peripheryof radius of curvature of r2 as before. The pressureroll will come into contact with the flat area ofthe punch head when r3sinu � r4 (Figure 9.6).Punch displacement is now constant while thepressure roll passes across a flat surface of diam-eter 2r4. During this period, the centre line of thepunch passes beneath the centre line of thepressure roll.
There is no fixed connection between thepressure roll and the punch head, so after com-pression has ceased, the punch will remain incontact with the tablet until it comes into con-tact with another cam. This actively lifts thepunch from the die. Thus unlike an eccentricpress, the punches of a rotary press do notnecessarily have displacement curves that aresymmetrical about the point of maximumcompression.
The pattern of upper punch movement can begenerated for any rotary press provided the fol-
lowing dimensions are known: r1, the radius ofthe pressure roll; r2, the radius of curvature of thepunch head; r3, the radius of the circle in whichthe punches and dies rotate; r4, the radius of theflat area on the top of the punch head. For aManesty B3B 16-station press, the relevantdimensions are as follows: r1 � 102 mm; r3 �
120 mm. The punch head dimensions areassumed to be r2 � 12 mm and r4 � 3 mm. Punchmovement using these dimensions is shown inFigure 9.7 and Table 9.2. The flat area of thepunch head is reached when r3sinu � 3 mm, uthen being equal to 1.43º.
The depth in the die to which the lowerpunch of a rotary tablet press descends is con-trolled by the weight-adjusting cam. After thedie has been filled, rotation of the die tablecauses the head of the lower punch to come intocontact with the lower pressure roll. The punchrises, and there then follows a period when nofurther upward movement of the punch occursas the flat portion of its head comes into contactwith the pressure roll. Then the punch fallsslightly under the influence of its own weightuntil it is moved upwards by the ejection cam.This upward movement continues until thelower punch tip is level with the top of the die.
Applications of tablet press instrumentation 173
Pressure roll(radius r1)
Flat area of punch head(radius r4)
Punch head(radius of
curvature r2)
Die table(radius r3)
Figure 9.6 Spatial relationships between upper punch head, pressure roll and die table of a rotary tablet press; sideview showing the flat area on the punch head.

The tablet is removed by the sweep-off arm andthen the punch descends for the die to berefilled.
The factors that control the movement ofthe lower punch are the same as those thatapply to the upper punch. The axes of the twopressure rolls may not be precisely verticallyopposed to each other because, although theforce-adjustment control of a rotary press raisesor lowers the lower punch, in addition itslightly moves the pressure roll in a horizontaldirection. Therefore, the start and end of thecompression event may differ a little betweenthe upper and lower punches. However, theduration will be the same provided the geo-metries of the upper and lower punch headsare identical.
With some rotary presses, the contents of eachdie are compressed twice since the press has twosets of compression rolls. The additional pair ofrolls is called the pre-compression rolls, and thepatterns of punch movement as the punchespass them are controlled by the same factors asdiscussed above.
The period over which the displacement of thepunches in a rotary press remains constant istermed the dwell time. There is no dwell time inan eccentric press since displacement is onlyconstant for the instant when punch movementchanges from a downward to an upward direc-tion. For any given rotary press operating at aspecified frequency, the duration of the dwelltime is directly proportional to the diameter ofthe flat area on the punch head. This can differbetween different punch manufacturers. Alsowith some punch manufacturers, the punchlength is brought into specification by grindingdown the punch head, so in theory at least, thedwell time can vary within a set of punches madeby the same manufacturer. For a Manesty B3Brotary press rotating at its maximum frequencyof 44 rpm, and with a punch head flat of radius3 mm, the duration of the dwell time is 10.8 ms.
Though the overall patterns of punch move-ment in a given rotary press is independent ofthe frequency of rotation of the turret of thepress, the latter controls the duration of eachevent in the compression cycle.
174 Tablet and capsule machine instrumentation
7
6
5
4
3
2
1
0
20 17.7 10 0 101.43 1.43
f (°)
Dis
tanc
e fro
m m
axim
um p
unch
dis
plac
emen
t (m
m)
Figure 9.7 The pattern of upper punch movement of a Manesty B3B 16-station rotary tablet press.

Punch shortening and press distortionduring compression
It must be stressed that the calculations of punchmovement described above are based solely onmachine dimensions. They are not obtained byactual displacement measurements and are validonly when the dies are empty. If a solid is presentin the die, then compression forces will be gen-erated. These will have the effect of shorteningthe punches and also stretching the machineframe; both these will alter theoretically derivedpatterns of punch displacement. Twisting of thepress can also occur in those presses, such as theManesty F3, where there is only one connectionbetween upper and lower punches via the frame
of the press. Presses with symmetrical connec-tions, including some eccentric presses and all rotary presses, are less prone to this type ofdistortion.
It is instructive to calculate the extent towhich punches are subjected to shortening dur-ing compression. Figure 9.8 represents the lowerpunch of a rotary press and its dimensions. Forconvenience, the punch can be divided into twocylinders, representing the punch body and thepunch tip, and the deformation of each part con-sidered separately. A maximum load of 4 tonnes(40 kN) is assumed, and a realistic value ofYoung’s modulus for the steel from which thepunch is made is 21 � 1010 N m�2.
Stress is force per unit area and strain iselongation per unit length. Young’s modulus is defined as stress/strain, and therefore strain isstress divided by Young’s modulus.
The diameter of the punch body is 19 mm and,therefore, the cross-sectional area is 283.5 mm2
or 283.5 � 10�6 m2. Therefore the strain is 4 � 104/[(283.5 � 10�6) � (21 � 1010)] or 6.72 �
10�4 strain (672 microstrain). Multiplying this bythe length of the punch body (101.4 mm) gives aresultant change in length of approximately 68.1 lm. A similar calculation for the punch tip gives a deformation of approximately 83.1 lm.Therefore the total deformation of the wholepunch is (68.1 � 83.1) � 151.2 lm, an amountthat is of a similar order of magnitude to some ofthe punch displacements shown in Table 9.2.
A deformation of this size will involve a corre-sponding error in the measurement of punch tipposition if this were to be estimated from geo-metrical considerations alone. There will also bea similar error in estimating the position of thetip of the lower punch, and a further errorcaused by deformation of components of thepress itself. However, the extent of all thesedeformations is proportional to the appliedforce, and so a knowledge of the latter can becombined with the appropriate value of Young’smodulus to apply a correction factor to thepunch tip displacement measurements. Altafand Hoag (1995) carried out a comprehensivereview of deformation occurring in a Stokes B2rotary press. All deformations were found to beelastic, and their magnitudes could be predictedby use of the appropriate Young’s modulus.
Applications of tablet press instrumentation 175
Table 9.2 Punch tip position of a Manesty B3B 16station rotary tablet press
u(°) Distance from maximum punch displacement (mm)
20.0 6.5019.0 5.8218.0 5.1717.7 5.0017.0 4.5716.0 4.0015.0 3.4714.0 2.9713.0 2.5112.0 2.0911.0 1.7110.0 1.36
9.0 1.068.0 0.797.0 0.556.0 0.365.0 0.204.0 0.093.0 0.012.0 0.01
1.43 0.001.00 0.000.00 0.001.00 0.001.43 0.00
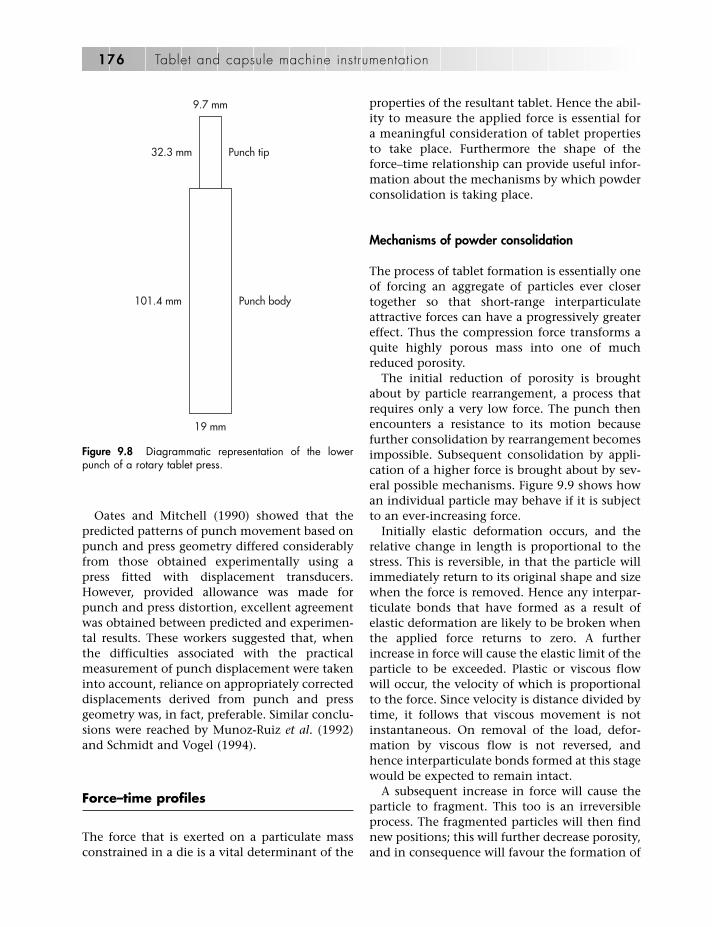
Oates and Mitchell (1990) showed that thepredicted patterns of punch movement based onpunch and press geometry differed considerablyfrom those obtained experimentally using apress fitted with displacement transducers.However, provided allowance was made forpunch and press distortion, excellent agreementwas obtained between predicted and experimen-tal results. These workers suggested that, whenthe difficulties associated with the practicalmeasurement of punch displacement were takeninto account, reliance on appropriately correcteddisplacements derived from punch and pressgeometry was, in fact, preferable. Similar conclu-sions were reached by Munoz-Ruiz et al. (1992)and Schmidt and Vogel (1994).
Force–time profiles
The force that is exerted on a particulate massconstrained in a die is a vital determinant of the
properties of the resultant tablet. Hence the abil-ity to measure the applied force is essential fora meaningful consideration of tablet propertiesto take place. Furthermore the shape of theforce–time relationship can provide useful infor-mation about the mechanisms by which powderconsolidation is taking place.
Mechanisms of powder consolidation
The process of tablet formation is essentially oneof forcing an aggregate of particles ever closertogether so that short-range interparticulateattractive forces can have a progressively greatereffect. Thus the compression force transforms aquite highly porous mass into one of muchreduced porosity.
The initial reduction of porosity is broughtabout by particle rearrangement, a process thatrequires only a very low force. The punch thenencounters a resistance to its motion becausefurther consolidation by rearrangement becomesimpossible. Subsequent consolidation by appli-cation of a higher force is brought about by sev-eral possible mechanisms. Figure 9.9 shows howan individual particle may behave if it is subjectto an ever-increasing force.
Initially elastic deformation occurs, and therelative change in length is proportional to thestress. This is reversible, in that the particle willimmediately return to its original shape and sizewhen the force is removed. Hence any interpar-ticulate bonds that have formed as a result ofelastic deformation are likely to be broken whenthe applied force returns to zero. A furtherincrease in force will cause the elastic limit of theparticle to be exceeded. Plastic or viscous flowwill occur, the velocity of which is proportionalto the force. Since velocity is distance divided bytime, it follows that viscous movement is notinstantaneous. On removal of the load, defor-mation by viscous flow is not reversed, andhence interparticulate bonds formed at this stagewould be expected to remain intact.
A subsequent increase in force will cause theparticle to fragment. This too is an irreversibleprocess. The fragmented particles will then findnew positions; this will further decrease porosity,and in consequence will favour the formation of
176 Tablet and capsule machine instrumentation
9.7 mm
19 mm
32.3 mm
101.4 mm
Punch tip
Punch body
Figure 9.8 Diagrammatic representation of the lowerpunch of a rotary tablet press.
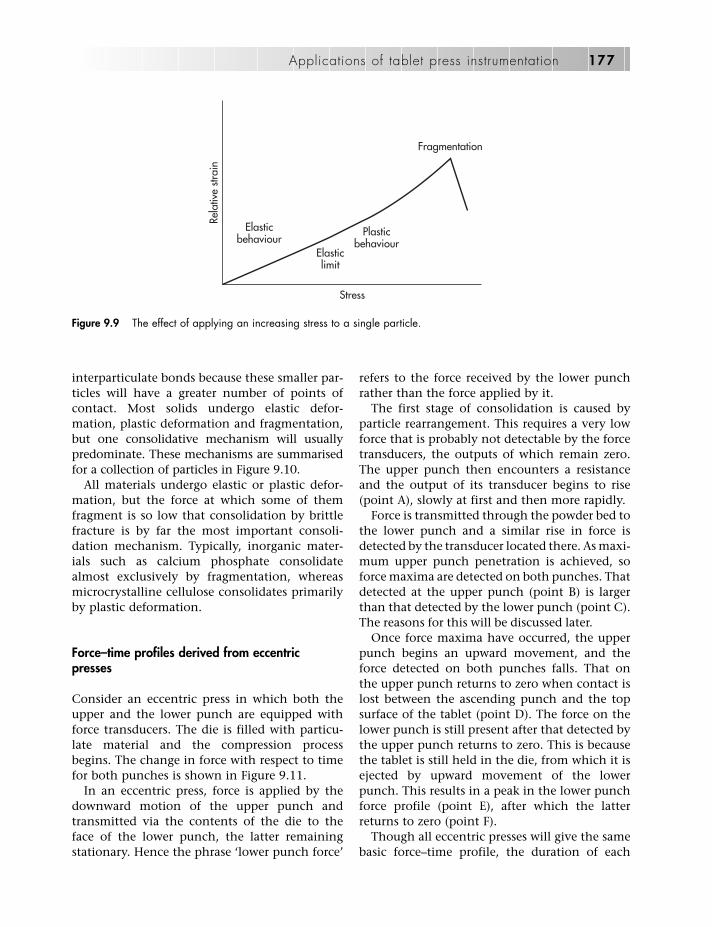
interparticulate bonds because these smaller par-ticles will have a greater number of points ofcontact. Most solids undergo elastic defor-mation, plastic deformation and fragmentation,but one consolidative mechanism will usuallypredominate. These mechanisms are summarisedfor a collection of particles in Figure 9.10.
All materials undergo elastic or plastic defor-mation, but the force at which some of themfragment is so low that consolidation by brittlefracture is by far the most important consoli-dation mechanism. Typically, inorganic mater-ials such as calcium phosphate consolidatealmost exclusively by fragmentation, whereasmicrocrystalline cellulose consolidates primarilyby plastic deformation.
Force–time profiles derived from eccentricpresses
Consider an eccentric press in which both theupper and the lower punch are equipped withforce transducers. The die is filled with particu-late material and the compression processbegins. The change in force with respect to timefor both punches is shown in Figure 9.11.
In an eccentric press, force is applied by thedownward motion of the upper punch andtransmitted via the contents of the die to theface of the lower punch, the latter remainingstationary. Hence the phrase ‘lower punch force’
refers to the force received by the lower punchrather than the force applied by it.
The first stage of consolidation is caused byparticle rearrangement. This requires a very lowforce that is probably not detectable by the forcetransducers, the outputs of which remain zero.The upper punch then encounters a resistanceand the output of its transducer begins to rise(point A), slowly at first and then more rapidly.
Force is transmitted through the powder bed tothe lower punch and a similar rise in force isdetected by the transducer located there. As maxi-mum upper punch penetration is achieved, soforce maxima are detected on both punches. Thatdetected at the upper punch (point B) is largerthan that detected by the lower punch (point C).The reasons for this will be discussed later.
Once force maxima have occurred, the upperpunch begins an upward movement, and theforce detected on both punches falls. That on the upper punch returns to zero when contact islost between the ascending punch and the topsurface of the tablet (point D). The force on thelower punch is still present after that detected bythe upper punch returns to zero. This is becausethe tablet is still held in the die, from which it isejected by upward movement of the lowerpunch. This results in a peak in the lower punchforce profile (point E), after which the latterreturns to zero (point F).
Though all eccentric presses will give the samebasic force–time profile, the duration of each
Applications of tablet press instrumentation 177
Rela
tive
strai
n
Fragmentation
Elasticbehaviour
Plasticbehaviour
Elasticlimit
Stress
Figure 9.9 The effect of applying an increasing stress to a single particle.

stage will depend on the speed of rotation of thepress. The magnitude of the peak force is gov-erned by the depth of penetration of the upperpunch into the die.
Force–time profiles derived from rotarypresses
The force transducer outputs from a rotary pressare somewhat different to those from an eccen-
178 Tablet and capsule machine instrumentation
Compressiveload applied
Particlesdeformunderload
Particlesfragment
underload
Particlesremain
fragmented
Compressive load removed
Plastic deformation; particlesremain deformed; cohesionretained
Elastic deformation; particlesreturn to former shape;cohesion lost
Figure 9.10 Mechanisms of consolidation of a collection of particles contained in a die and exposed to a compressiveforce.
Upper punch force
Lower punch force
E
FDA
C
B
Time
Forc
e
Figure 9.11 Force–time profiles for upper and lower punches of an eccentric tablet press. See text for details.

tric press since both upper and lower punchesare in motion during the compression stage. Thismeans that the particles in the die are beingcompressed from both top and bottom at thesame time, rather than the lower punch havingthe passive role that it does in an eccentric press.Force adjustment in a rotary press is achieved bymoving the lower pressure roll. Upward move-ment of this causes a consequent deeper upwardpenetration by the lower punch within the die,and an increased force is exerted in this direc-tion. Hence the force detected by the lowerpunch transducer is not necessarily lower thanthat detected by transducers on the upperpunch.
During the dwell time, when there is a periodof no punch movement, the compressive forcewould also be expected to be constant. This isnot necessarily the case, and this point will bediscussed further below. Forces generated by thetablet being retained in the die, followed by ejec-tion owing to upward movement of the lowerpunch, are essentially the same as in an eccentricpress.
The shape of the force–time profile
The upper punch profile shown in Figure 9.11 isnot symmetrical about its peak. It might intuit-ively be expected that after the maximum punchpenetration has been achieved, the upper punchwould begin to withdraw from the die and con-tact between the tablet and the punch facewould immediately be lost. This would result inthe ‘decompression’ curve being a line extendingvertically downwards from point B. This behav-iour would be expected from a solid that hadundergone fragmentation or purely plastic defor-mation. In both these cases, the tablet wouldretain a constant thickness on removal of thecompressive force. However, if there has beenany elastic deformation, then as the punchbegins to move upwards, the tablet will expandin a vertical direction and will push against thepunch face as this ascends in the die. A forcewill be detected for as long as the tablet remainsin contact with the face of the punch, and aperfectly elastic body such as a rubber plugwould be expected to give a force–time profile
that was symmetrical about the maximum forceaxis.
When elastic expansion is complete, or whenthe punch is ascending quicker than the tabletcan expand, contact will be lost and so the forcedetected on the upper punch will fall to zero(point D). This lack of symmetry about the maxi-mum force suggests a means of distinguishingbetween plastic and elastic behaviour. This willbe further explored below.
In an eccentric press, the maximum forceapplied by the active upper punch is alwaysgreater than that detected by the passive lowerpunch. As a force F is applied to particles in apowder bed, the topmost layer of particles willreceive the force coming down in a verticaldirection (Figure 9.12).
Consider the two particles labelled A and B inthe figure. Particle A is not vertically above par-ticle B and particle B is in contact with the diewall. Particle A receives the applied force andtransmits it to B, the angle between the centresof A and B with the vertical being �. The trans-mitted force can be resolved into vertical andhorizontal components, which are Fcos� andFsin�, respectively.
If the angle of contact (�) had been zero (i.e.the two particles had been vertically opposed),then Fcos� would equal F, and Fsin� would bezero. If however, � exceeds zero, then Fcos� willbe less than F, and Fsin� will be greater thanzero. Therefore, the force diminishes as it istransmitted downwards through the powderbed, and, consequently, the force received by thelower punch would be less than that applied bythe upper punch, accounting for the differencesin peak heights B and C in Figure 9.11.Furthermore, if Fsin� exceeds zero, a force will beexerted horizontally on the die wall. This givesrise to a frictional force between the die wall andthe edge of the tablet.
The treatment shown in Figure 9.12 has beenconsiderably simplified. However, a rigorousmathematical treatment by Train (1956) hasshown that differences in vertical and horizontalforce transmission can have a profound effect onthe porosity of tablets and their resultant physi-cal strength. The data also conform to theShaxby–Evans equation (Shaxby and Evans,1923), which predicts that the force applied by
Applications of tablet press instrumentation 179
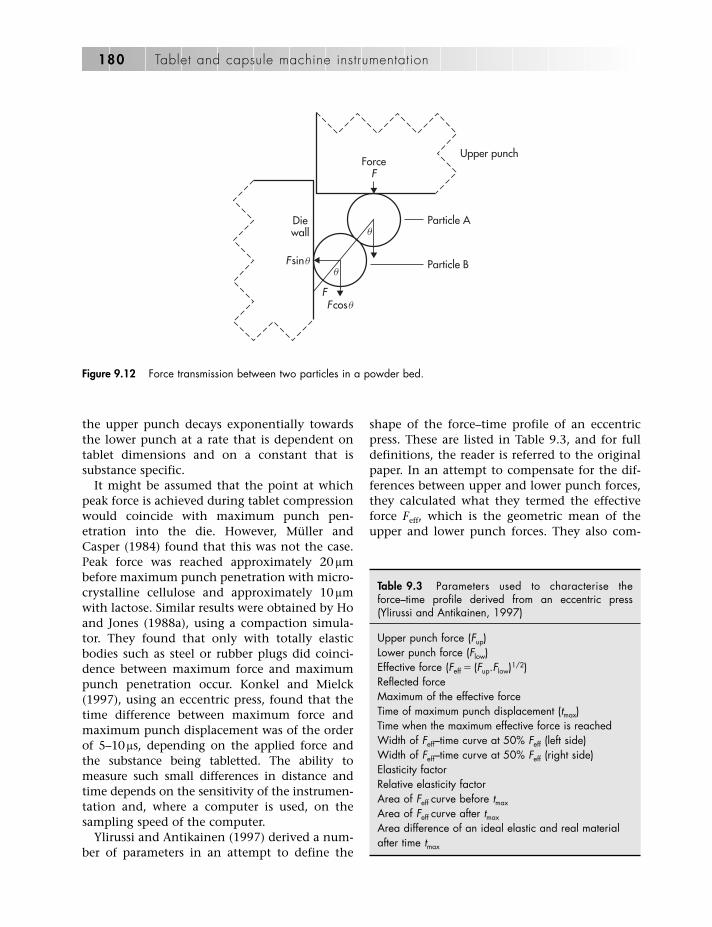
the upper punch decays exponentially towardsthe lower punch at a rate that is dependent ontablet dimensions and on a constant that issubstance specific.
It might be assumed that the point at whichpeak force is achieved during tablet compressionwould coincide with maximum punch pen-etration into the die. However, Müller andCasper (1984) found that this was not the case.Peak force was reached approximately 20 lmbefore maximum punch penetration with micro-crystalline cellulose and approximately 10 lmwith lactose. Similar results were obtained by Hoand Jones (1988a), using a compaction simula-tor. They found that only with totally elasticbodies such as steel or rubber plugs did coinci-dence between maximum force and maximumpunch penetration occur. Konkel and Mielck(1997), using an eccentric press, found that thetime difference between maximum force andmaximum punch displacement was of the orderof 5–10 ls, depending on the applied force andthe substance being tabletted. The ability tomeasure such small differences in distance andtime depends on the sensitivity of the instrumen-tation and, where a computer is used, on thesampling speed of the computer.
Ylirussi and Antikainen (1997) derived a num-ber of parameters in an attempt to define the
shape of the force–time profile of an eccentricpress. These are listed in Table 9.3, and for fulldefinitions, the reader is referred to the originalpaper. In an attempt to compensate for the dif-ferences between upper and lower punch forces,they calculated what they termed the effectiveforce Feff, which is the geometric mean of theupper and lower punch forces. They also com-
180 Tablet and capsule machine instrumentation
Upper punch
Particle ADiewall
Particle B
Fcosq
ForceF
Fsinqq
q
F
Figure 9.12 Force transmission between two particles in a powder bed.
Table 9.3 Parameters used to characterise theforce–time profile derived from an eccentric press(Ylirussi and Antikainen, 1997)
Upper punch force (Fup)Lower punch force (Flow)Effective force (Feff � (Fup.Flow)1/2)Reflected forceMaximum of the effective forceTime of maximum punch displacement (tmax)Time when the maximum effective force is reachedWidth of Feff–time curve at 50% Feff (left side)Width of Feff–time curve at 50% Feff (right side)Elasticity factorRelative elasticity factorArea of Feff curve before tmax
Area of Feff curve after tmax
Area difference of an ideal elastic and real materialafter time tmax

pared the compression and decompressionforce–time profiles and surmised that the decom-pression curve of a perfectly elastic substancewould be the mirror image of the compressioncurve. They then derived a list of parameterssimilar to those listed in Table 9.3 based on thedifferences between this hypothetical decom-pression curve and that actually obtained.
There have been several attempts to charac-terise the shape of the force–time curve of arotary tablet press. Probably the most compre-hensive have been that carried out by Schmidtand co-workers at the University of Tübingenand Mielck and his colleagues at the Universityof Hamburg.
Vogel and Schmidt (1993) considered that the force–time curve could be divided into threephases: the compression phase in which thepunches approach each other, the dwell timewhen the flat portions of the punch heads are incontact with the pressure rolls, and the relax-ation phase in which the punches move awayfrom each other.
With reference to Figure 9.13, the compressionphase can be characterised both by the area A1,the area under the curve during the compressionphase, and the slope SlC. This is the slope of thestraight line joining the points at which 20%and 80% of the maximum force is achieved.Using these limits of 20% and 80% avoids the curved regions at the extremities of theforce–time profile. This is a similar parameter tothe rise time originally proposed by Ho andJones (1988b), who defined the rise time as the
time interval between initiation of compressionand the point of maximum compression, using astandard force of 15 kN at a constant rate of forceapplication.
It would intuitively be expected that punchdisplacement and applied force would remainconstant during the dwell time, but this is notnecessarily true. If the material being com-pressed undergoes stress relaxation, then plasticflow will lead to a thinner tablet. Hence the forcewill fall and, in turn, the punches will penetratefurther into the die and some of the elastic stresswithin the press will be recovered. Schmidt andVogel (1994) quantified this behaviour by divid-ing the dwell time into two equal parts, the areasunder the force–time profile for these two halvesbeing A2 and A3, respectively. A horizontal linewas then drawn through the minimum forceobtained during the dwell time. The areabetween this horizontal and the force–time pro-file up to the midpoint of the dwell time was A5
and that after the midpoint was A6; A5 and A6
formed parts of A2 and A3, respectively. A lowvalue of the area ratio A6/A5 indicated a highdegree of stress relaxation. This ratio is similar inconcept to a suggestion by Dwivedi et al. (1991)that particle behaviour under load could bedefined by the peak offset time, which is the dif-ference in time between the achievement ofmaximum force and the midpoint of the dwelltime. Finally the relaxation phase could be charac-terised by the area under the decompressionforce–time profile (A4) and the decompressionslope SlD. The latter is the slope of the straight
Applications of tablet press instrumentation 181
A1 A2 A3 A4
A5 A6
Time
80
20
60
40
Forc
e (%
of c
ompr
essi
on m
axim
um)
Force (% of decom
pression maxim
um)
Figure 9.13 Force–time diagram from a rotary tablet press. A, area under the curve.

line connecting the points where 60% and 40%of the minimum force achieved during the dwelltime are reached. These workers found that thecompaction load decreased during the dwelltime by plastic flow, and that brittle behaviourcould be easily distinguished from plastic defor-mation (Vogel and Schmidt, 1993; Schmidt andLeitritz, 1997).
Dietrich and Mielck (1984, 1985) attempted tocharacterise the variation of applied pressurewith time during the compression event. Theypointed out that the asymmetry of thepressure–time curve characterises the ability of amaterial to undergo fragmentation under load,and they quantified this asymmetry by means ofa modified Weibull function (Equation 9.5):
� t(y�x) �(tb)
�
P(t) � __. ____.e (9.5)b b
This is a mathematical model in which the valueof the constant c describes the skewness of acurve. If c � 1, then an exponential curve isdescribed, and c � 3.3 describes a perfectly sym-metrical curve. Dietrich and Mielck found that alower value of c correlated with a greater extentof irreversible deformation, and they concludedthat use of the Weibull function could charac-terise the pressure–time function using only themeasurement of the applied pressure, ratherthan both this and the more difficult measure-ment of punch displacement. Konkel and Mielck(1997) later extended the use of the Weibullfunction to force–time relationships obtainedfrom an eccentric tablet press.
Force–porosity relationships
Introduction
When a force is applied to particulate matterconstrained in a die, consolidation occurs andporosity decreases. As described above, only alow force is needed to cause particle rearrange-ment, but further densification, via particle frag-mentation and/or deformation, requires a muchhigher force. Particles are thrust into ever-closer
contact with each other, interparticulate bondsform and a coherent structure results. Therefore,an essential stage in the formation of a tablet isthe progressive reduction in the volume occu-pied by the powder particles in the die, resultingin a decrease in porosity.
Tablet porosity or pore fraction can bemeasured in two ways. The first is based on thedimensions of the tablet after it has been ejectedfrom the die. Consider a solid of apparent par-ticle density �T, this usually being measured bygas pycnometry. This is sometimes called the‘true’ density of the solid, but this is incorrect,since if there are any closed pores, these cannotbe accessed by the gas. This solid is compressedinto a cylindrical tablet of weight w, diameter dand thickness t. The volume of this tablet ispd2t/4 and its apparent density �A is 4w/pd2t. Therelative density (�rel) is the fraction of the volumeof the tablet that is occupied by solid, and isequal to �A/�T. The pore fraction e is that part ofthe tablet volume that is not occupied by solid.Hence e � (1 � �rel) and is given by Equation (9.6).
4we � 1 � ______ (9.6)pd2t�T
This is called the ‘out-of-die’ or ‘zero pressure’porosity. However, unless the tablet is made fromtotally non-elastic materials, the tablet will haveexpanded when the compressive force wasremoved. This expansion, by increasing t andperhaps d, will have led to an increase in porosity.
The second method by which porosity can bemeasured is to employ press instrumentation. Ifdisplacement transducers are fitted to bothupper and lower punches, then the distance sep-arating the faces of the punches can be calcu-lated (see Figure 9.3). If both punches are incontact with the tablet, then the distancebetween punch faces is equal to the thickness ofthe tablet. Hence porosity can be measured whilethe force is still being applied and before anyelastic expansion can occur. This is termed the‘in situ’, ‘in die’ or ‘at pressure’ porosity. Thein situ porosity includes densification caused byboth elastic and non-elastic deformation. By thetime the ‘out-of-die’ porosity is measured, elasticrecovery will be complete, and only densifi-cation caused by plastic deformation and frag-
182 Tablet and capsule machine instrumentation

mentation will be assessed. The differencebetween the ‘in situ’ porosity and the ‘out-of-die’porosity is thus a measure of the elastic expansionthat the tablet undergoes after the compressingforce is removed.
The relationship between force andporosity
A typical relationship between force and porosityis shown in Figure 9.14.
This is not an easy relationship to representmathematically. If it is assumed that the limitingporosity is zero, then the curve will approach theabscissa asymptotically, zero porosity beingattained with an infinitely high force. If the lim-iting porosity is other than zero, then that valuetoo will be reached at infinite force. In otherwords, the abscissa will not be crossed. However,the curve will definitely cross the ordinate, sincewhen the force is zero, the porosity will have aspecific value related to the bulk density of thesolid by Equation (9.7).
4w(1�e)qT � (9.7)
pd2
The upper limiting value of the pore fractionmust be less than one.
Compression equations
Notwithstanding the difficulty of representingFigure 9.14 in mathematical form, several com-pression equations have been devised thatattempted to represent the relationship betweenforce and porosity. It is important to realise thatthese equations are attempts to find a satisfac-tory model of experimental data and that theymay not in themselves have any underlyingscientific foundation.
The Heckel equation
Among the equations that have been devised todescribe the consolidation process, that ofHeckel (1961) has received most attention in the pharmaceutical field. In the InternationalPharmaceutical Abstracts database up to the endof 2006, there were 100 references to the Heckelequation, more than 10 times the number of ref-erences to all other compression equations puttogether.
Applications of tablet press instrumentation 183
1
0
Pore
frac
tion
Force
Figure 9.14 Generalised relationship between force and pore fraction.

Heckel considered the compaction of powdersto be analogous to a first-order chemical reactionin which the pores were the reactant and densi-fication was the product. Therefore, the ‘kinetics’of the process could be described by a pro-portionality between the change in density withpressure and the pore fraction, giving Equation(9.8).
dD––– � k(1�D) (9.8)dP
where D is the relative density of the powdermass (hence e � (1 � D)); P is the pressure and kis a constant.
Integration of Equation (9.8) gives Equation(9.9), the Heckel equation.
1ln _____ � kP � A (9.9)(1�D)
where A is another constant.If this equation is valid, then a plot of
ln 1/(1 � D) against P should give a straight lineof slope k and with an intercept of A on the ordi-nate (Figure 9.15). In his original work, Heckel(1961) found that these plots were curved atlow pressures, and he suggested that constant Awas a consequence of consolidation that had
occurred during die filling and particlerearrangement before fragmentation and/ordeformation had taken place. Slope k, he sug-gested, gave a measure of the ease with whichthe solid underwent plastic deformation. Thegreater the slope, the greater the plasticity.Hersey and Rees (1971) suggested that thereciprocal of k was numerically equal to the yieldstress of the powder, and this suggestion wastaken further by Rowe and Roberts (1996). Thelatter workers pointed out that the reciprocal ofk was the mean deformation stress whether itwas a plastic deformation stress for materialsthat deform plastically, a fracture stress forfragmenting materials or a combination of both. Rowe and Roberts quoted the yield stressesof a number of solids often used in tabletformulation.
The Kawakita equation
The Kawakita equation relates the reduction involume of a column of powder to the appliedpressure. It can be represented as Equation (9.10)(Kawakita and Ludde, 1970).
(V0�V) abP� (9.10)
V0 (1�bP)
where V0 is the initial volume of the powdercolumn and V is the volume at pressure P. Hencethe degree of volume reduction C is (V0 � V)/V0,and a and b are constants.
C can be expressed in terms of porosity asEquation (9.11)
(e0�eP)C � (9.11)(1�eP)
where e0 and eP are the initial porosity and theporosity at pressure P, respectively. Equations(9.10) and (9.11) can be rearranged to giveEquation (9.12).
P P 1� � (9.12)
C a ab
If P/C is plotted as the ordinate and P as theabscissa, then a straight line of slope 1/a shouldresult, with an intercept of 1/ab on the ordinate.
184 Tablet and capsule machine instrumentation
In 1
/(1–
D)
Pressure
Figure 9.15 Pressure–pore fraction diagram representedby the Heckel equation (Equation 9.9).
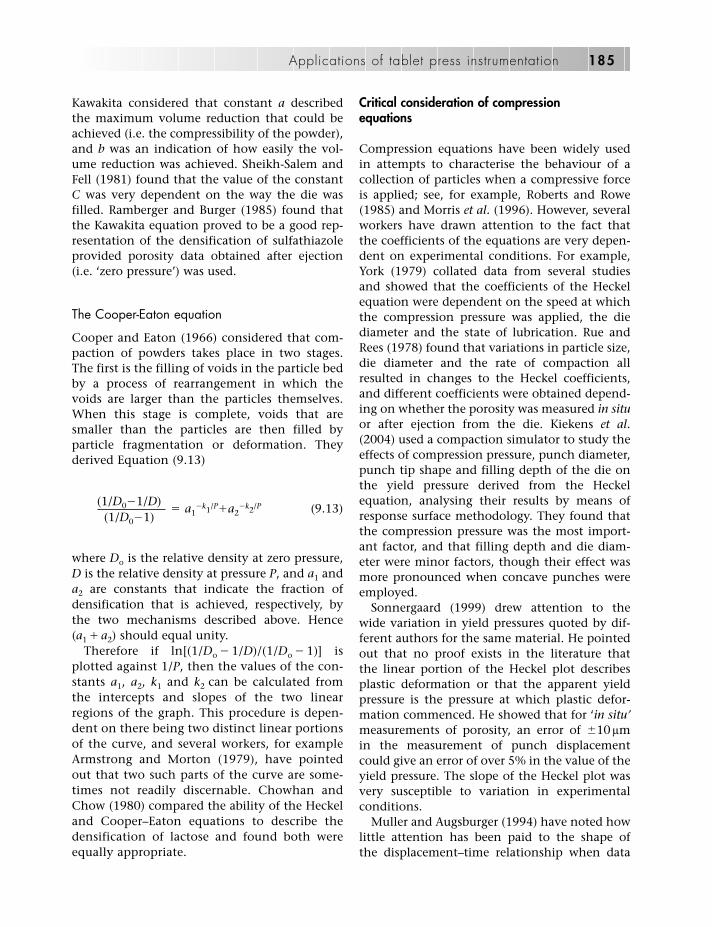
Kawakita considered that constant a describedthe maximum volume reduction that could beachieved (i.e. the compressibility of the powder),and b was an indication of how easily the vol-ume reduction was achieved. Sheikh-Salem andFell (1981) found that the value of the constantC was very dependent on the way the die wasfilled. Ramberger and Burger (1985) found thatthe Kawakita equation proved to be a good rep-resentation of the densification of sulfathiazoleprovided porosity data obtained after ejection(i.e. ‘zero pressure’) was used.
The Cooper-Eaton equation
Cooper and Eaton (1966) considered that com-paction of powders takes place in two stages.The first is the filling of voids in the particle bedby a process of rearrangement in which thevoids are larger than the particles themselves.When this stage is complete, voids that aresmaller than the particles are then filled byparticle fragmentation or deformation. Theyderived Equation (9.13)
(1/D0�1/D)� a1
�k1/P�a2�k2/P (9.13)
(1/D0�1)
where Do is the relative density at zero pressure,D is the relative density at pressure P, and a1 anda2 are constants that indicate the fraction ofdensification that is achieved, respectively, bythe two mechanisms described above. Hence(a1 � a2) should equal unity.
Therefore if ln[(1/Do � 1/D)/(1/Do � 1)] isplotted against 1/P, then the values of the con-stants a1, a2, k1 and k2 can be calculated fromthe intercepts and slopes of the two linearregions of the graph. This procedure is depen-dent on there being two distinct linear portionsof the curve, and several workers, for exampleArmstrong and Morton (1979), have pointedout that two such parts of the curve are some-times not readily discernable. Chowhan andChow (1980) compared the ability of the Heckeland Cooper–Eaton equations to describe thedensification of lactose and found both wereequally appropriate.
Critical consideration of compressionequations
Compression equations have been widely usedin attempts to characterise the behaviour of acollection of particles when a compressive forceis applied; see, for example, Roberts and Rowe(1985) and Morris et al. (1996). However, severalworkers have drawn attention to the fact thatthe coefficients of the equations are very depen-dent on experimental conditions. For example,York (1979) collated data from several studiesand showed that the coefficients of the Heckelequation were dependent on the speed at whichthe compression pressure was applied, the diediameter and the state of lubrication. Rue andRees (1978) found that variations in particle size,die diameter and the rate of compaction allresulted in changes to the Heckel coefficients,and different coefficients were obtained depend-ing on whether the porosity was measured in situor after ejection from the die. Kiekens et al.(2004) used a compaction simulator to study theeffects of compression pressure, punch diameter,punch tip shape and filling depth of the die onthe yield pressure derived from the Heckelequation, analysing their results by means ofresponse surface methodology. They found thatthe compression pressure was the most import-ant factor, and that filling depth and die diam-eter were minor factors, though their effect wasmore pronounced when concave punches wereemployed.
Sonnergaard (1999) drew attention to thewide variation in yield pressures quoted by dif-ferent authors for the same material. He pointedout that no proof exists in the literature thatthe linear portion of the Heckel plot describesplastic deformation or that the apparent yieldpressure is the pressure at which plastic defor-mation commenced. He showed that for ‘in situ’measurements of porosity, an error of �10 lmin the measurement of punch displacementcould give an error of over 5% in the value of theyield pressure. The slope of the Heckel plot wasvery susceptible to variation in experimentalconditions.
Muller and Augsburger (1994) have noted howlittle attention has been paid to the shape ofthe displacement–time relationship when data
Applications of tablet press instrumentation 185

derived from the Heckel equation have been gen-erated. Using a series of differing displacement–time waveforms generated on a tablet presssimulator, they obtained Heckel constants andcompared them with those obtained from aninstrumented tablet press. They found that forall the materials they studied, the relationshipbetween pressure and volume was affected bythe shape of the waveform. The found that asawtooth profile (i.e. a constant punch speed)was better for Heckel analysis, but pointed out that this is not representative of punchmovement in a rotary press.
It must also be borne in mind that the orig-inators of the Heckel, Kawakita and Cooper–Eaton equations were using powders that arevery much harder than those used in pharma-ceuticals, and there may be a threshold materialhardness below which these equations are notapplicable. Sun and Grant (2001) were of theview that the Heckel equation does not accu-rately describe the compaction of pharmaceuti-cal powders at high pressure, and data obtainedwhen the pore fraction is less than 0.05 must beinterpreted with caution.
Virtually all compression equations endeav-our, by mathematical manipulation, to trans-form a curved line into one that is straight, atleast over part of its length. Identifying thisstraight section is not easy and is often subjec-
tive. In earlier studies, in which perhaps lessthan 10 combinations of pressure and porosityformed the graph, it was relatively easy to ident-ify a straight portion of the graph. However, ifthe instrumented tablet press is linked to acomputer, a curve can be obtained with manymore points, the number being determined bythe sampling frequency of the computer. It is theauthor’s experience that the more points thereare on the compression curve, the more difficultit is to identify the straight-line portion.
It may be that as more data become available,more appropriate equations will be derived. Analternative approach might be to measure thechange in porosity brought about by a specificchange in pressure with no underlying assump-tions as to the physical significance of its con-stants. For example Equation (9.14) is a relativelysimple equation that describes data that give aline that is asymptotic to both axes or linesparallel to them.
(F � a)(e � b) � C (9.14)
where F is the force, e is the pore fraction, anda, b and C are constants. A graphical represen-tation of this equation is shown in Figure 9.16.The equation does not demand that porosityapproaches zero at very high pressures. It acceptsthat a limiting porosity greater than zero can
186 Tablet and capsule machine instrumentation
1
a
0b
Force
Pore
frac
tion
Figure 9.16 Force–pore fraction diagram representing Equation (9.14).

occur, and even a porosity less than zero can beaccommodated, such situations arising whenhollow particles are compressed.
The force–displacement curve
Introduction
The formation of a coherent tablet from aparticulate mass involves an input of energy,provided as mechanical energy by the movingpunch(es). This energy is used in a variety ofways, the relative importance of which dependson the nature of the solid.
1. Moving particles within the die to fill voidsduring the consolidation process, when inter-particulate frictional forces and frictionbetween particles and the die wall must beovercome
2. Deforming particles, either elastically or plas-tically, and also deformation of the punchesand other components of the press
3. Breaking particles when the energy is trans-formed into surface energy as the surface areaincreases
4. Formation of bonds between particles.
After compression is complete, then energy usedfor elastic expansion will be released, and part ofthat will be delivered back to the punches. Otherenergy will be released as heat. Immediately afterbeing compressed, tablets are warm to the touch.
Because the energy needed to compress agiven solid will depend on its propensity toundergo elastic deformation, plastic deformationand fragmentation, it might be thought that thetabletting properties of a solid could be charac-terised by measuring the amount of energyexpended in making tablets from it. This is thebasis of the force–displacement curve.
Figures 9.3 and 9.11 show, respectively, thechanges in upper punch displacement and upperpunch force in an eccentric press with time. Ifthe force is plotted against the displacement,then a force–displacement curve is obtained(Figure 9.17). Conventionally, force is plotted asthe ordinate and punch displacement as theabscissa, with downward movement of the
punch represented by movement to the rightalong the abscissa.
At a displacement of D0, the upper punch,having previously entered the die, first exerts adetectable force on the particles. Force increasesto a maximum (Fmax) at displacement Dmax. Ifthe powder were totally non-elastic in behav-iour, then as soon as the punch begins to rise inthe die after maximum penetration, the forcewould immediately fall to zero, and theforce–displacement curve would be completedby a vertical line to the abscissa at Dmax. Atotally elastic material would retrace the wholecurve back to its origin. In practice, there willalways be some elastic recovery, and so thepunch retreats to a point somewhere betweenDmax and D0 before contact with the tablet islost and the force then becomes zero.
A significant feature of the force–displacementcurve is that the area under it (i.e. the areabounded by D0, Fmax and Dmax) has the units offorce (newtons) multiplied by distance (metres)and this is dimensionally equal to work orenergy (newton.metres or joules). Therefore, thearea under the force–displacement curve can begiven by Equation (9.15):
Applications of tablet press instrumentation 187
D0 Dmax
Fmax
Upp
er p
unch
forc
e (N
)
Upper punch displacement (m)
Figure 9.17 A diagram of force plotted against punchdisplacement. D, displacement; F, force.

Dmax
Area � ∫ FdD (9.15)
D0
In other words, the area under the force–displacement curve will be equivalent to thework expended to produce the tablet, and assuch has a physical significance. However, therehas been some controversy regarding how theforce and displacement data are to be treated,and precise measurements, particularly ofpunch movement, are especially important ifmeaningful information is to be obtained.
Calculation of the area under theforce–displacement curve
Nelson et al. (1955) were the first workers todescribe the construction and significance of theforce–displacement curve. However, it was notuntil the 1970s that a group led by Polderman atthe University of Leiden in the Netherlandsmade a detailed study. Their work is of added sig-nificance in that it is the first published report ofan instrumented tablet press being directlylinked to a computer (de Blaey and Polderman,1971). Like most studies in this area, they usedan eccentric press fitted with force transducerson both punches and displacement transducersthat enabled the distance between upper andlower punch tips to be measured.
De Blaey and Polderman recognised thatthough Equation (9.15) represented the input ofwork into the particulate mass, it included workneeded to overcome friction and also workrecovered from the tablet after elastic expansion.To estimate frictional work, de Blaey (1972)adopted the suggestion that, at any point in thecompression cycle, the difference between theforce applied by the upper punch and thatreceived by the lower punch is attributable tofriction and he calculated the work required toovercome friction using Equation (9.16).
Dmax
FW � ∫ (UPF � LPF)dD (9.16)
D0
where FW is the work required to overcome fric-tion; UPF and LPF are the upper and lower punch
forces, respectively; D0 is the displacement of theupper punch when the force rises above zero;and Dmax is the maximum displacement of theupper punch.
Jarvinen and Juslin (1971) tried to derive anestimate for the work of friction that was basedon the movement of particles in contact withthe die wall rather than the force and displace-ment of the upper punch. They derived Equation(9.17), which gives a value of FW of about halfthat predicted by de Blaey and colleagues.
Dmax (UPF�LPF)FW � ∫ {UPF �(____________)}dD
D0ln(UPF/LPF)
(9.17)
Experimental support for the suggestion thatEquation (9.17) was valid was provided byRagnarsson and Sjögren (1985). A consequenceof this approach is that rather than calculatingFW separately, the mean of the upper and lowerpunch forces can be used as a measure of thecompression force that is independent of fric-tion. To be precise, the geometric mean ratherthan the arithmetic mean should be used, but inpractice, this change has little effect.
The force transmitted to the upper punch bythe tablet during the decompression phase is aconsequence of elastic expansion of the tablet inan axial direction. However, de Blaey andPolderman (1970) recognised that this force fallsto zero when the punch face and the tablet ceaseto be in contact with each other and elasticrecovery might not be completed at this point.They, therefore, modified their press so that eachtablet was compressed twice without it beingejected from the die. Their reasoning was that bythe time the second compression occurred, elas-tic expansion would be complete, and the workexpended on the second compression would bethat required to re-impose elastic deformation.Thus the net work of compression would beequal to the area under the compression curve ofthe first compression minus the area under thecompression curve of the second compression.
If the work of the second compression didonly represent that needed to reverse the elasticexpansion of the tablet, then logically it wouldfollow that work expenditure of the third and
188 Tablet and capsule machine instrumentation

subsequent compressions all ought to be ident-ical to the second. Armstrong et al. (1982) com-pressed tablets up to 13 times without ejectionand found that the maximum force achieved ateach compression changed, the magnitude ofthe change being dependent on the forceapplied, the time interval between successivecompressions and also on the substance beingcompressed. For example, dicalcium phosphatedihydrate showed a progressive decrease in maxi-mum force, indicative of further fragmentationof the particles. Microcrystalline cellulose, whencompressed repeatedly at short time intervals,showed a rise in maximum force, believed to bethe result of the development of a structure thatwas progressively more difficult to consolidate.Armstrong et al. (1982) concluded that energywas being expended at the second and sub-sequent compressions in ways in addition toovercoming elasticity, probably by furtherfragmentation of the particles.
Ragnarsson (1996) considered that since thetrue work of expansion is itself small, then theerror introduced by ignoring all expansion otherthan that detected on the first compression isnegligible. He asserted that more importantsources of error are associated with measurementand data registration. This is particularly true ofdisplacement. Already in this text, reference hasbeen made to errors caused by inappropriate sit-ing of displacement transducers, and also uncer-tainties caused by punch and press deformationand distortion (Chapter 6). Such errors are par-ticularly important in calculating the area undera force–displacement curve owing to the shapeof the curve. The total area under the curve is thesum of a series of ‘slices’ of thickness dD, and the largest contribution made to the area will beby those ‘slices’ obtained at the highest forcewhen punch and press deformation are also at amaximum. If any error in the measurement of displacement occurs with these ‘slices’, it willhave a major impact on the overall workmeasurement.
A further complication in the evaluation of aforce–displacement curve is that it has beenshown, as described above, that peak force is notnecessarily achieved at the same time as maxi-mum punch penetration into the die. Ho andJones (1988a) have shown that peak force is
recorded before the punch has fully penetratedinto the die for many solids of pharmaceuticalinterest, and they attributed this to viscoelasticbehaviour. This gives a force–displacement curveas shown in Figure 9.18, in which the sharp peakis replaced by a more rounded shape. If acomputer is connected to the instrumentedtablet press, then the observed shape of theforce–displacement curve near the maximumforce is very dependent on the sampling speed ofthe computer. When this is high, more detail isobtained and greater deviation from theexpected shape can be detected.
All the work on force–displacement curvesdescribed up to now has been carried out oneccentric presses. The use of a rotary press ismore complex, since both punches are inmotion and, therefore, imparting energy to thetablet. An interesting approach was adopted byOates and Mitchell (1989), who found that byconsidering the dimensions of certain com-ponents of a rotary press, and by makingallowances for punch and press distortion, theycould predict punch displacement more accu-rately than they could measure it. They then
Applications of tablet press instrumentation 189
D0 Dmax
Fmax
Upp
er p
unch
forc
e (N
)
Upper punch displacement (m)
Figure 9.18 A force–displacement curve showing theeffect of non-coincidence of maximum punch displacementand maximum force.

went on to use these predicted values tocalculate work of compaction.
Antikainen and Yliruusi (1997) have suggestedthat a closer consideration of parts of theforce–displacement curve may give rise to agreater understanding of the compression event.For example, they characterised the shape of thecurve by measuring the displacement at 25, 50,75 and 100% of the maximum force, both for the compression and the decompressioncurves, and related this information to tabletproperties such as crushing strength. While such studies may be of value, they, and all othersusing force–displacement curves, are dependenton accurate measurement of force anddisplacement, especially the latter.
Attempts have been made to compare theenergy used to compress a tablet as measuredwith a force–displacement curve with the heatcontent of the tablet. Coffin-Beach andHollenbeck (1983) used calorimetric techniques.They found that the tablet after compression wasin a lower energy state and this was attributed toa dissipation of surface energy. A smaller re-duction in energy occurred if weak tablets wereformed. Similar findings were made by Rowlingset al. (1995), who pointed out that a loss in sur-face energy ought to be reflected in a reducedinternal surface area of the tablet, but they foundthat this was not the case. Both these sets ofworkers used a hydraulic press rather than atablet press, and so compression was slow and norealistic examination of the decompression stagecould be made. Hoag and Rippie (1994) carriedout a thermodynamic analysis of tablets duringthe decompression stage using a Colton 216rotary press. They concluded that the workrepresented by the area under the force–displacement curve was only a small fraction ofthe total energy exchange.
Punch velocity
Introduction
The outputs from force and displacement trans-ducers are usually recorded as a function of time.Therefore, if the basis of the time measurement
is known (the chart speed of a chart recorder, thesampling rate of a computer), then the durationof various events in the tabletting or encapsu-lation process can be calculated. Also the rate ofchange of force and/or displacement can bemeasured. The latter is particularly important, asit enables the punch speed to be calculated, aproperty that can have a major influence ontablet properties, since some formulations aresensitive to changes in punch speed.
It is important when dealing with tabletpresses or capsule-filling equipment to dist-inguish between ‘speed’ and ‘speed of produc-tion’. The latter is the same as ‘output’ and ismeasured as the number of tablets or capsulesproduced in unit time. This might range from afew thousands of tablets per hour produced on asimple eccentric press to a million or more perhour from a modern multi-punch rotary tabletpress. ‘Speed’ is the distance moved in unit timeand refers to components of the equipment, forexample. the punches of a tablet press. As thedirection of movement of a particular com-ponent at a given time is known, strictly speak-ing it is the vector ‘velocity’ rather than thescalar ‘speed’ that is being considered here.
For a given piece of equipment, there is adirect proportionality between ‘output’ and‘velocity’. If the output of a press is doubled,then all its components move twice as fast andtwice as many tablets will be produced in a giventime. However, this proportionality does notoccur when two different types of press are con-sidered or when presses from different manufac-turers are compared. A change of press may welloccur during scale-up from a trial formulation toproduction scale, or when formulations devel-oped at one site in a multinational company aretransferred to other sites. If the formulation isspeed sensitive, a change in press can haveprofound effects on tablet quality.
Scientific studies on the effect that punchvelocity can have on the compaction processonly began in the 1980s, but there was an earlierawareness that it may affect product quality. Forexample, Smith (1949) commented that ‘withsome intractable tablets, the trouble may beovercome by reducing the speed of themachine’. In the first textbook on tabletting,written by Little and Mitchell in 1963, there is
190 Tablet and capsule machine instrumentation

the statement ‘increased speed of productionmay necessitate modification to formulae’though it was accepted that ‘many formulae canbe compressed at high speeds without anychange in the formulation being required’. So itwas already recognised that some formulationswere speed sensitive and some were not.
The underlying reason for such differences isthe mechanism by which consolidation occurs.If the predominating mechanisms are fragmen-tation or elastic deformation, on the one hand,then because these are virtually instantaneousprocesses, they should be independent of therate at which the compression force is applied.On the other hand, the particles can behaveplastically and plastic deformation is not instan-taneous but takes a finite time. If the speed atwhich the force is applied does not make suf-ficient time for this, then consolidation will beincomplete and product quality will suffer.
Punch velocity in an eccentric press
Punch velocities can be measured in two ways.Firstly, they can be measured by the rate ofchange of the output of a displacement trans-ducer connected to the punch. Secondly, theycan be estimated if the dimensions of certaincomponents of the press are known plus its rateof rotation.
The movement of the upper punch in aneccentric tablet press is described by Equation(9.1). Differentiation of this equation givesEquation (9.18) (Armstrong et al., 1983).
dy r sin �� �r cos � [1� ] (9.18)dt �(l2�r2 cos2 �)
where y is the position of the punch tip, l is thelength of the eccentric strap, r is the radius of theeccentric sheave, t is time, � is the angular vel-ocity of the shaft of the press and � is the anglemade with the horizontal, as shown in Figure 9.2.
Therefore, provided the necessary dimensionsof the press and its rate of rotation are known,then the velocity of the tip of the punch at anypoint in its up and down path can be calculated.Taking the Manesty F3 press as an example, asthe eccentric rotates (i.e. � changes), the distance
of the punch tip from its point of maximumpenetration into the die varies as shown in Table9.1; if it is assumed that the press is rotating at itsmaximum rate (85 tablets min�1), the corre-sponding velocities can be calculated. These areshown in Table 9.4, downward motion beingdesignated as positive.
To facilitate comparison with other presses,the punch velocity when the punch is 5.0 mmfrom its lowest point is shown. With theManesty F3 press, this occurs when � equals55.1º, at which point the punch tip is movingdownwards at approximately 140 mm s�1. Figure9.19 shows the variation in punch tip velocitywith changes in �.
Punch velocity in a rotary press
The horizontal velocity (VH) of a punch in arotary press is given by Equation (9.19).
VH � 2r3f (9.19)
where f is the frequency of rotation of the turret,r3 is the radius of the circle on the die table inwhich the dies rotate and u is the angle betweenthe axis of the punch and the vertical centreline of the pressure roll; a change of 1º in u is,therefore, 1/360f.
The vertical velocity VV at any particular valueof u can be calculated from Equation (9.4). Thisequation gives vertical displacement as a func-tion of angle u. However, the time interval rep-resented by u is also a function of f in that theturret of the press will rotate through uº in u/360fseconds. As both displacement and time areknown, the vertical velocity can be calculated.
For a Manesty B3B 16 station press with thedimensions quoted earlier, vertical punch vel-ocities are shown in Figure 9.20 and Table 9.5,the turret rotating at its maximum rate of 44 rpm(equivalent to approximately 700 tablets min�1)The flat area of the punch head is reached whenr3sinu � 3 mm, u then being equal to 1.43º. Atthis point, the vertical velocity of the punch iszero.
When the punch is 5.0 mm from its deepestpenetration into the die, the vertical punchvelocity is approximately 160 mm s�1. This is not
Applications of tablet press instrumentation 191

192 Tablet and capsule machine instrumentation
0 20 40 55.1 80 10090 120 140 160 180
50
250
200
150140
100
0
Angle of eccentric with horizontal, q (°)
Punc
h ve
loci
ty (m
m s
−1)
Figure 9.19 Velocity profile of the upper punch tip of a Manesty F3 eccentric press producing its maximum output of85 tablets min�1.
Table 9.4 The punch tip position and the punch velocity for a Manesty F3 eccentric press when rotating at itsmaximum rate of 85 revolutions minute�1
Angle of eccentric with Distance from maximum Punch tip the horizontal, � (°) punch displacement (mm) velocity (mms�1)
270 50.0 0.0290 48.7 67.3310 44.8 129.6330 38.7 180.9350 30.8 214.5
0 26.5 222.610 22.1 223.930 13.7 204.650 6.5 156.555.1 5.0 140.270 1.7 84.990 0.0 0.0
110 1.7 �84.9130 6.5 �156.5150 13.7 �204.6170 22.1 �223.9180 26.5 �222.6190 30.8 �214.5210 38.7 �180.9230 44.9 �129.6250 48.7 �67.3270 50.0 0.0

Applications of tablet press instrumentation 193
01.435
100
0101520
162
200
Punc
h ve
loci
ty (m
m s
−1)
φ (°)
Figure 9.20 Velocity profile of the upper punch of a Manesty B3B rotary press rotating at its maximum rate of 44 rpm;u is the angle between the axis of the punch and the vertical centre line of the pressure roll.
Table 9.5 Punch tip position and punch tip velocity for a Manesty B3B 16 station rotary tablet press operating at itsmaximum rate of rotation of 44 rpm
Angle between axis of punch and vertical Distance from maximum Punch tip velocity (mm s�1)centre line of pressure roll, (o) punch displacement (mm)
20.0 6.50 183.919.0 5.82 174.318.0 5.17 164.717.7 5.00 161.917.0 4.57 155.116.0 4.00 145.415.0 3.47 135.614.0 2.97 125.813.0 2.51 116.012.0 2.09 106.111.0 1.71 96.210.0 1.36 86.3
9.0 1.06 76.38.0 0.79 66.37.0 0.55 56.36.0 0.36 46.25.0 0.20 36.14.0 0.09 26.03.0 0.01 15.92.0 0.01 5.81.43 0.00 0.01.00 0.00 0.00.00 0.00 0.01.00 0.00 0.01.43 0.00 0.0

too dissimilar to the punch speed at this point ina Manesty F3 eccentric press. Hence for speed-sensitive formulations, a change from an F3eccentric press to a B3B rotary press would not beexpected to cause major problems. Furthermoreit should be noted that, although the output of arotary press is much greater than that of aneccentric press, it does not necessarily followthat punch speeds are significantly different.
Provided that the appropriate press and punchdimensions are known, punch velocity at anygiven point and the duration of events such asthe dwell time can be calculated for any rotarytablet press. Using the same assumptions of presshead geometry (r2 � 12 mm, r3 � 3 mm), Table9.6 shows such data for a series of Manesty tabletpresses, using the actual press dimensions for r1
and r3 for the rotary presses.A graphical representation of these data is
shown in Figure 9.21.The Manesty B3B is a relatively ‘slow’ press, and
if velocity data from this are compared with thosefrom a press such as the Manesty Novapress, thediffering environments are striking. When theupper punch of the latter is 5 mm from its pointof deepest penetration into the die, it is travel-ling at approximately 700 mm s�1 and dwell timelasts only approximately 2 ms. Schmidt et al.(1986) have performed similar calculations forthe Fette F2, Fette P1000, Kilian LX28 andKorsch PG343 rotary presses. For any given press,punch velocity is directly proportional to thepress rotation rate. Therefore, if the presses listedin Table 9.6 are operating at half their maximumrate, velocities are also halved and events lasttwice as long. The radius of curvature of thepunch has only a minor effect on punch vel-ocity. For example, using punch heads with radii
of curvature of 6, 12 and 24 mm on a ManestyNovapress, punch velocities of 727, 720 and680 mm s�1, respectively, are obtained 5 mmfrom the point of deepest die penetration.
Measurement of the speed dependency oftablet formulations
Since the quality of tablets produced by someformulations depends on the punch velocity, itis obviously of interest to ascertain if suchdependency can be predicted.
Using a compaction simulator in which a widerange of punch velocities could be achieved,Roberts and Rowe (1985) studied the relationshipbetween applied pressure and tablet porosity attwo punch velocities, 0.033 and 300 mm s�1. Thecalculation of tablet porosity contained appropri-ate corrections for punch and instrument distor-tion. They based their study on the Heckelequation (9.9), which they plotted for each sub-stance at the two velocities. They measured theslopes of these plots, using a mathematicallyrigorous method for identifying the linear portionof the Heckel plot, and then calculated yield stressas the reciprocal of this slope. They derived a para-meter that they termed ‘strain rate sensitivity’(SRS) using Equation (9.20).
Py2�Py1SRS � ––––––– �100 (9.20)Py2
where Py1 and Py2 are the yield pressures at 0.033and 300 mm s�1, respectively.
Their results are shown in Table 9.7. The mater-ials that were more strain-rate sensitive werethose whose main mechanism of consolidation
194 Tablet and capsule machine instrumentation
Table 9.6 Velocity-related data for some Manesty tablet presses, all operating at their maximum production rates
Press Production rate Time for punch to Punch speed at Dwell time per die (tablets min�1) descend last 5 mm (ms) first contact (mm s�1) duration (ms)
Manesty F3 85 68.6 140 0.00Manesty B3B 44 61.4 162 10.84Manesty Express 100 26.7 416 3.94Manesty Unipress 121 19.1 485 3.16Manesty Novapress 100 10.0 720 2.14

was plastic deformation. Materials that areknown to consolidate by fragmentation showedlittle change in yield pressure when punchvelocity was increased.
A further attempt to quantify velocity depen-dency was the introduction by Armstrong et al.(1983) of the concept of power of compaction.The unit of power, the watt, is defined as thepower dissipated when one joule is expended for
one second. For the tabletting process, this canbe defined in two ways that are dimensionallyequivalent.
Firstly the area under the force–displacementcurve can be divided by the time over which theforce is applied as shown in Equation (9.21).
D2 D3
Power � [∫ F.dD�∫ F.dD]t�1 (9.21)D1 D2
where F is the applied force, t is time, D1 is thedisplacement when the force deviates from zero,D2 is the maximum punch displacement and D3
is punch displacement when the force returns tozero.
Secondly, the power expended equals the forceapplied by the punch multiplied by the punchvelocity at the time that force is being applied.Punch velocity is calculated as described earlier.Thus
Work � force � distance
Power � work/time � (force � distance)/time
or
Power � force � (distance/time)
which is equivalent to force � punch velocity.
Applications of tablet press instrumentation 195
X X
X
X X
X
Dis
tanc
e fro
m m
axim
um p
unch
dis
plac
emen
t (m
m)
Time (ms)
0.5
0.4
0.1
0201010 020
0.2
0.3
0.6
Figure 9.21 Punch movement as a function of time for three types of press. Manesty F3 eccentric press (•); Manesty B3Brotary press (■); Manesty Novapress (�).
Table 9.7 Values of strain-rate sensitivity of somematerials used in tabletting (Roberts and Rowe, 1985)
Material Strain-rate sensitivity (%)
Calcium phosphate –Calcium carbonate –Heavy magnesium carbonate –Paracetamol DC 1.8Paracetamol 10.6Lactose 16.2Tablettose 19.2Anhydrous lactose 20.3Avicel PH101 38.9Sodium chloride 39.9Mannitol 46.4Maize starch 49.3Corvic 54.1

The practical importance of the sensitivity ofsome materials to changes in punch velocity wasshown by Armstrong and Palfrey (1989). Theytabletted four direct compression diluents at twopress outputs (24 and 160 tablets min�1) usingthe same eccentric press in each case. They thencompared the crushing strength of the resultanttablets. Their results are shown in Table 9.8.Tablets made from an inorganic material showedlittle change in strength as output was increased,whereas tablets made from directly compressiblestarch lost almost 40% of their strength.
These workers also examined a range of par-ticle sizes of lactose and found that, althoughcrushing strength was reduced as punch velocitywas increased, the degree of reduction was notdependent on particle size; that is, the effect ofchange of velocity was dependent on thesubstance but not its physical state.
Die wall stress
Introduction
Probably one of the least well-characterisedmeasurements in the area of tablet compressionstudies has been that of die wall stress. It is usu-ally possible to assess such variables as punchforce and displacement without much modifica-tion to the normal mechanical operations of thetablet press, but it has proved much more diffi-cult to estimate die wall stress without such alter-ations. The main reason for this is that the stress
levels at the outer edge of the die are too low togive adequate signals from foil strain gauges,and so it is necessary to produce modified dieswith local concentrations of stress. Removingsome of the metal from the die is one way ofachieving this, and strain gauges applied to thethinned regions are then able to provide largersignals.
The first published work in this area, like somuch in tablet press instrumentation, wascarried out at the University of Wisconsin andwas reported by Nelson in 1955. Nelson’sapparatus was more a simulator than a tabletpress. It contained a stationary punch and dieassembly and used a slow acting hydraulicpress to apply the necessary compressive forceto produce single tablets. The time required tomake one compression was between 25 and45 min.
The die had a rectangular aperture in the side,and this was closed by a third punch, the tip ofwhich was shaped to match the curvature ofthe die wall. A commercial load cell wasmounted at the rear end of the third punch andregistered any forces exerted on it by the com-pressed granulation. A more or less linear rela-tionship was obtained between punch pressureand die wall pressure, with approximately 30% of the punch pressure appearing as diewall pressure. Addition of magnesium stearateincreased this percentage. The technique couldbe criticised on the grounds that the measuredsignal at the die wall was, in part, dependent onthe extrusion properties of the material undercompression.
196 Tablet and capsule machine instrumentation
Table 9.8 The effect of press output on the tensile strength of tablets made from directly compressible diluents(Armstrong and Palfrey, 1989)
DiluentsDicalcium phosphate Microcrystalline Spray-dried Pregelatinised dihydrate cellulose lactose starch
Tensile strength (MPa) for press output (tablets min�1)24 0.59 6.6 0.98 0.42160 0.56 5.9 0.82 0.26Reduction in tensile strength (%) 5.1 10.6 16.3 38.1

The segmented die
The segmented die has proved to be the mostpopular method of investigating die wall stress.It was introduced by Windheuser et al. (1963),also of the University of Wisconsin, who avoidedthe problems of extrusion by leaving the bore ofthe die intact, but cutting away a segment of theouter wall to provide a site for strain gauges. Twostrain gauges were fitted to the modified die.One was bonded to the thinned segment andhad its axis at right angles to the die bore, andthe other was bonded to the unaltered portion ofthe die, parallel to the bore, as a temperature-compensating element (Figure 9.22). They tooused a hydraulic press rather than a tabletmachine.
Windheuser and colleagues used plugs of softrubber to calibrate the die, since this materialwas believed to have the properties of a liquidwhen under pressure. The upper punch force wasmeasured with a load cell and was plottedagainst the strain gauge bridge output at press-ures up to approximately 130 MPa. They foundthat the calibration was linear over the rangetested, but that it was also dependent on thethickness of the rubber ‘tablet’ in the die. In allsubsequent measurements, Windheuser and col-leagues used a fixed lower punch position and afinal tablet thickness of 5 mm, each charge ofmaterial being weighed out individually in orderto produce a tablet of this thickness.
When tested on various types of granulation,the die gave response curves that differedappreciably in shape from material to material,being most non-linear for the alkali halides andclosest to a straight line for potassium carbonate.From these curves, Windheuser and colleaguesconcluded that materials which achieved a goodconversion of normal pressure to lateral pressuretended to form good tablets. The tablet heightand its position in the die were both critical tothe measurement, which gave average valuesover a considerable area of the die wall pressure.
Dies from which one or more segments of the outer wall have been removed have formedthe basis of most experimentation on die wallstress. The principle was used by Leigh et al.(1967), working with a Manesty E2 tablet press,who thinned a 12.7 mm die at two diametricallyopposed regions to a wall thickness of 3.17 mm.Semiconductor strain gauges, forming oppositearms of the measuring bridge, were attached tothe two thinned portions of the die, and the cut-away segments were then filled with siliconerubber. There was no temperature compensationin this arrangement, since the two gaugesformed opposite rather than adjacent arms ofthe Wheatstone bridge circuit. Data were viewedon an ultraviolet recorder. Calibration waseffected by sealing the ends of the die cavity andpressurising the interior space with water. Asbefore, the strain gauge signal was dependent onthe height of the pressurised section, and it wasthus necessary to keep to a particular tabletthickness in all subsequent work.
Drawing on an earlier mathematical treatmentby Long (1960), Leigh et al. (1967) identifiedthree types of relationship between axial andradial forces, as shown in Figure 9.23. These arecalled compression cycles.
Figure 9.23a represents the behaviour of a per-fectly elastic body or a body exposed to a forcebelow its elastic limit. As the axial force isincreased, particles are rearranged and thenbegin to undergo elastic deformation. A radialforce is generated, the magnitude of which is theproduct of the axial force and the Poisson ratio.The compression and decompression curves aresuperimposable, and when the axial force istotally removed, the radial force also becomeszero.
Applications of tablet press instrumentation 197
Figure 9.22 The segmented die. (After Windheuser et al.,1963.)

If the elastic limit is exceeded, then one of twotypes of compression cycle can be obtained,dependent on the behaviour of the materialunder load. Firstly, it can exhibit constant yieldin stress, in which the relationship between axialforce and radial force (i.e. the slope of AB) isunity (Figure 9.23b). Secondly, it can behave as aMohr’s body, in which the yield stress is relatedto the normal stress across the shear plane; herethe slope of AB is not necessarily unity (Figure9.23c). Constant yield materials are associatedwith plastic deformation and Mohr’s bodies tendto undergo brittle fracture.
After maximum force has been applied, bothaxial and radial forces now fall. For constantyield materials, changes are now again linked tothe Poisson ratio, and slope BC is equal to theslope of OA. Yield then takes place and con-tinues until the axial force returns to zero. At thispoint, there is still a residual radial stress, whichis large in the case of Mohr’s bodies. Therefore,for both constant yield materials and for Mohr’sbodies, the compression and decompressioncurves cannot be superimposed, and a hysteresisloop or compression cycle is obtained. It hasbeen suggested that analysis of these cycles canpredict whether or not satisfactory tablets will beobtained (Leigh et al., 1967; Obiorah, 1978).
The major problem with the segmented dietechnique is that the calibration may often onlybe relevant to tablets of a fixed thickness. Thiswas investigated in 1979 by Hölzer and Sjögren.Using a symmetrically segmented die, the authors
fitted pairs of foil gauges (Kyowa type KFC-03–C1, 120 �) to each side. In each case, thecompensating gauges were aligned vertically andwere positioned some 13 mm from the upperend of the die. The active gauges were alignedhorizontally. Several rubber-like materials weretested as calibration standards, but many ofthese were found to show marked hysteresisbetween increasing and decreasing forces. Themost satisfactory was a blend of polyvinyl chlor-ide and nitrile rubber, sold as Breon Polyblend503 (BP Chemicals). Molybdenum disulphidewas used as a lubricant.
The relationship between punch force andstrain gauge output was then checked for differ-ent compact heights, at seven positions of thelower punch. In all, around 650 observationswere made. It was found that for a given gaugearrangement, the output signal was reasonablyproportional to the height of the compact. If thelower punch was kept at a fixed height of 10.2 mm from the upper end of the die, then theratio of signal to the cross-sectional area of thecompact was practically independent of the com-pact height. It was, therefore, possible to estimatethe die wall pressure from the regression line ofthe signal per unit cross-sectional area versusapplied punch pressure. This relationship hasbeen used since then by other groups includingKrycer et al. (1982) and Carstensen et al. (1981).
Huckle and Summers (1985) took the problemof calibration even further, working with bothfull and half-bridges on two similar dies.
198 Tablet and capsule machine instrumentation
Axial force (N)
Radi
al fo
rce
(N)
Axial force (N)
CB
A
Axial force (N)
C
B
A
(c)(b)(a)
O O
Figure 9.23 Compression cycles from a completely elastic solid (a), a solid that exhibits constant yield stress in shear (b)and a Mohr’s body (c). See text for details. (After Leigh et al.,1967.)

Paradoxically these authors observed that the diewall signal from a full bridge was at a minimumwhen the site of compression was close to thegauges, but it increased as the site was movedaway. If a half-bridge was used, the situationwas completely reversed. It appeared that thevertically orientated temperature-compensatinggauges, used in the full bridge, were beingstrained rather unexpectedly at the level of thecompact. Hence the bridge signal was reduced towell below its predicted value. The authors com-mented that this effect had not been reported byprevious workers, but there may be a logicalexplanation for this. The die used by Hölzer andSjögren had been cut away to a wall thickness of5.0 mm over a fairly narrow angle. However,Huckle and Summers had reduced the wall thick-ness to only 3.0 mm over what, from their illus-tration, seems to be an angle of 90°. Thedifferences in the wall thickness and widthmight be important. Clearly, the internal press-ure of the Polyblend plug would tend to distortthe wall of the die towards a spherical form,since that represents the shape with a minimumsurface area. The deflection of a uniformlyloaded plate is inversely proportional to the cubeof its thickness and to the square of its width. Sodoubling the thickness and halving the widthreduces the deflection to approximately 3% of itsoriginal value. The thinner and wider the diewall, the more likely it is that the area aroundthe plug will bulge outwards in three dimen-sions, hence affecting the compensating gauges.
Apart from this, Huckle and Summers (1985)found that the best gauge configuration was thatin which several horizontally aligned gaugeswere fitted side by side over the whole surface ofthe thinned area to form a large assembly. Theupper and lower gauges on each side were con-nected as half-bridges, and no vertically alignedgauges were used. The signals from the systemwere almost independent of the lower punchposition.
The original cutaway die described byWindheuser and colleagues had only one seg-ment removed, but most segmented dies usedsince then have been cut away on both sides togive a symmetrical form. It has been suggestedthat the effect of compressing a powder withinsuch a die will be to produce a non-circular cross-
section, because the thinned sections are free toexpand outwards. The parts that have not beenthinned will be drawn in and might in some cir-cumstances bind on the punch. Ho and Jones(1979) studied the distortion both of punchesand of dies under load and found that a die wallsignal could be produced even in an empty die ifthe die itself was secured rigidly in the press. Thesignal disappeared when the die was allowed to‘float’ freely around the punch and it was con-cluded that it had been produced by the punchpressing on the die wall. The maximum signaldetected in this way represented nearly 4000 N,and this could introduce appreciable error into ameasurement.
In 1981, Rippie and Danielson reported theuse of an instrumented die on a Colton 216rotary tablet machine. Their die comprised threelayers. The upper and lower layers were in con-ventional circular forms, and the cutawayportion formed the centre of the ‘sandwich’. Thecentre layer was only 1.5 mm in thickness andhad been reduced to a wall thickness of 3.2 mmfor half its circumference. It was gauged with oneactive element (Micro Measurement type CEA-06-125WT-350) and a second compensatinggauge was mounted on the flat surface of thelower section. Plots of the die wall signal versuspunch signal were linear.
A similar die was used by Khossravi andMorehead (1997), who repeatedly compressedthe same tablet without ejecting it between com-pressions. They found that materials that con-solidated by plastic deformation have similarcompression cycles for the first and subsequentcompression cycles. For brittle materials, brittlefracture occurs in first cycle and subsequentcycles gave no further yield. However, this workwas carried out on an Instron tester with a punchspeed of only 5 mm min�1.
Yeh et al. (1997) also used a die with a narrowmiddle section fitted to a Stokes B2 press. Usingfinite element analysis, they calculated the cut-ting angle of the segments of the die wall thatwere to be removed and also the optimum diewall thickness. The ejection cam of the press wasremoved to allow measurement of residual diewall stress, and lower punch stress was measuredby means of an instrumented compression roller-pin. Rubber plugs were used for calibration. They
Applications of tablet press instrumentation 199

found that the measured die wall stress was lin-ear and independent of the height and positionof the tablet. They constructed compressioncycles for sodium chloride and microcrystallinecellulose.
Other die constructions
One of the objections raised against Nelson’soriginal transverse piston design was that it gavereadings that were at least partly dependent onthe extrusion properties of the granulation. In1972, Lindberg made a further attempt to usethis method of measurement, but unlike Nelsonhe left the inner surface of the die intact. Hethen milled a ‘flat’ across the outer portion ofthe die so that the wall was reduced to 2.0 mm atits thinnest part. A steel piston was fitted withone end against the thinned wall of the die andits other end against a piezoelectric load washer(Kistler 901A), so that the expansion of the diewall was transmitted to the load washer. In prac-tice, the alignment of the components proveddifficult.
A somewhat similar arrangement was used byHiestand et al. (1977). Because the studiesinvolved some rather slow changes of theapplied pressure, a piezoelectric load cell wouldhave been unsuitable. They, therefore, fitted adiaphragm type strain gauge load cell (Entranmodel EPS-122S).
In a subsequent development, Amidon et al.(1981) took the basic idea of the flexible die wallelement several stages further. Instead of con-structing the die purely as a measuring device,this group proposed to use the flexible die wall asa novel production tool in a rotary press. Inessence, the die was made of a thin-walled tube,positioned inside a conventional cylindricalhousing. The space between the die and thehousing was completely filled with a rubbercompound that could transmit pressure changesin the manner of a fluid, and a horizontal pistonwas arranged to communicate with the rubber-filled space. During compression of a powder,the piston was forced into the die space, therebycontracting the bore of the die by a smallamount. After compression the piston wasreleased, allowing the die to expand away from
the completed tablet. The ‘triaxial compression’system was intended to produce improvedtablets from formulations that were prone tosticking or capping on conventional presses.
Cocolas and Lordi (1993) devised a novel diefor use with a compaction simulator. In this, a spi-ral groove was cut around the outside of the die,into which were fitted four piezoelectric trans-ducers at approximately 60° intervals. The centrelines of these transducers were roughly 5, 8, 11and 14 mm from the top of the die, as such anarrangement gave an output that was not depen-dent on lower punch position nor tablet height. Afurther advance was the use of high-density poly-ethylene granules for calibration, since theseformed a zero porosity compact at pressures ofapproximately 100 MPa. Data were collected bycomputer and viewed on an oscilloscope.
Like all experimental techniques, the predic-tive use of compression cycles is governed bythe quality of the data that are collected. Earlierin this chapter, the problems of accuratelymeasuring die wall force have been discussed,particularly with regard to siting the transducersin the die wall. A further problem arises withthe quantity of data that is generated. In earlierstudies, only a relatively small number of pairsof axial and radial force data was generated, andpoints on the compression cycle could bejoined up by straight lines to produce the con-vincing parallelograms shown in Figure 9.23b,c.However, if transducer outputs are linked to acomputer, then many more pairs of data pointsare available, and the successive linear segmentsof the cycle cannot be discerned so readily.There is an analogy here to the apparent lack oflinearity in graphs showing the relationshipbetween force and tablet porosity that havemany data points.
Nevertheless, compression cycles can be usedto investigate mechanisms of consolidation ofsolids. For example, Cocolas and Lordi (1993)constructed compression cycles for six pharma-ceutical excipients. They found for all of themthat the slope of that segment of the compres-sion cycle approached unity after the yield pointhad been exceeded but was not linear.
Khossravi (1999) measured the manner inwhich the area of the hysteresis loop changed asthe axial force was increased. He found that for
200 Tablet and capsule machine instrumentation
plastically deforming materials, the relationshipbetween the axial force and the hysteresis looparea was rectilinear, whereas for brittle materials,the relationship was quadratic. This implies thatwith increasing axial force, not only does theloop get longer, but it also gets wider at roughlythe same rate (see Figure 9.23b,c). A furtherpoint of interest in Khossravi’s work was that hecompressed each tablet five times and found thatfor wholly plastic materials such as polyethyleneglycol, the five compression cycles were virtuallysuperimposible, but those of fragmenting mater-ials changed significantly with every successivecompression.
It is interesting to note that Carstensen andTouré (1980) found similar effects when theyplotted the change in force received by the lowerpunch against that transmitted by the upperpunch of an eccentric tablet press. Here, too,compression cycles were obtained whose shapewas governed by the consolidation mechanismof the solid.
Applications of press instrumentation tolubrication studies
Introduction
A lubricant is an essential component of almostall tablet formulations, and of many formu-lations that are to be packed into hard gelatincapsules. A lubricant has two functions that arereally quite distinct, but they are often includedin the overall term ‘lubrication’. The true lubri-cant function is to facilitate movement betweentwo surfaces that are in close contact with eachother (i.e. friction must be overcome). Thisoccurs when the tablet is being ejected from thedie, the two surfaces being the die wall and theedge of the tablet, and relative movement isresisted by die wall friction. In contrast, thelubricant function that should properly be called‘anti-adherence’ applies when the tablet sticks tothe face of one or both punches. Since the tabletface and the punch do not move relative to oneanother while contact between them is main-tained, overcoming friction is not involved inthis case.
As most effective lubricants are water repel-lent, tablet lubrication is usually a compromisesituation: enough lubricant is needed to over-come friction but not so much as to seriouslyinhibit water penetration into the tablet andhence affect the release of the active ingredient.Weakening of the tablet structure is also often aconcomitant of lubricant action. The presence ofa lubricant film around each particle weakensinterparticulate bonds, especially if the particlesconsolidate by deformation rather thanfragmentation.
Instrumentation has facilitated studies intoboth qualitative and quantitative aspects oflubrication.
Measurement of lubricant action
As with so many aspects of tabletting research,studies on lubricant activity were initiated byHiguchi’s group at the University of Wisconsin.Using their instrumented eccentric tablet press,they noted that the force applied by the upperpunch was higher than that transmitted to thelower punch (Strickland et al., 1960). Theyexplained this by postulating that some of theapplied force was transferred to the die wall.This, in turn, generated die wall friction that hadto be overcome before the tablet could be ejectedfrom the die (Figure 9.12). Strickland and col-leagues termed the ratio between the lowerpunch force and the upper punch force the ‘R’value. This ratio can never exceed unity, and thenearer the R value is to one, the better the stateof lubrication. The R value has been widely usedin the assessment of lubricants (e.g. Miller andYork, 1988) but suffers from some limitations.The ratio between lower punch force and upperpunch force is not constant throughout the com-pression cycle (Figure 9.11), and so the actualvalue of R depends on the force applied by theupper punch. Furthermore, the loss of transmit-ted force and hence the generation of die wallfriction is not solely a function of the lubricantbut also depends on the Poisson ratio of theoverall formulation. Müller et al. (1982) haveshown that if the formulation is already ade-quately lubricated, then slight improvements inlubrication cannot be detected by changes in the
Applications of tablet press instrumentation 201

R value. Nevertheless, for a given formulationcompressed at a uniform maximum force, the Rvalue has proved a useful measure of lubricantefficacy. Alkali metal stearates usually have Rvalues between 0.9 and 0.95.
A more direct method of measuring lubricantaction is to measure the force required to ejectthe tablet from the die. With an eccentric press,this is achieved by fitting force transducers tothe lower punch assembly; for a rotary press,transducers are usually attached to the ejectionramp (Chapter 6). Hölzer and Sjögren (1977)reviewed four methods for evaluating frictionduring tabletting: the ratio of lower punch forceto upper punch force (the R value), the differ-ence between upper and lower punch forces,the force detected by the lower punch beforeejection and the force needed to eject the tablet.They found that the compression force had aninfluence on all four techniques, and so a cor-rection for the area of contact between the tabletand the die wall was applied. When the ejectionforce was corrected in this way, a straight-linerelationship was obtained between it and thecompression force. Lubricants reduced theslope of this line, the degree of reductiondepending on the nature of the lubricant andits concentration.
Using an eccentric press fitted with force trans-ducers on upper and lower punches, Delacourteet al. (1993) attempted to measure the value ofthe upper punch force that caused the press tojam. They gradually increased the upper punchforce until tablet production for 3 min was notpossible without ejection problems such as agrinding noise, scratches on the tablet edge ordisturbance of the lower punch force signal.They used a standard mixture of lactose anddicalcium phosphate dihydrate mixed with arange of lubricants.
Measurement of adhesion to punch faces
If a tablet sticks to the lower punch of a press,then the force required to sweep off the tabletafter ejection is increased. Sticking to the upperpunch can even cause rupture of the tablet if theadhesive force between the tablet and the punchface is greater than the cohesive forces within
the tablet. Usually only a film forms on thetablet face, but even this can be difficult andexpensive to eradicate.
The first workers to study sweep-off forceswere Mitrevej and Augsburger (1980). They fitteda strain-gauged cantilever beam to the feedframe of a Stokes B2 rotary press, the beam beingin front of the sweep-off blade. They reasonedthat the adhesion force was the differencebetween the total force measured at the beamand that owing to the momentum of the tablet.The latter could be calculated from its mass andits velocity as it travelled around the die table.They noted that the adhesion force increasedwith a rise in compression pressure or a decreasein lubricant concentration. Mitrevej andAugsburger also measured the force needed toeject the tablet from the die and found that dif-ferences in lubricant efficiency did not necess-arily reflect differences in adhesion. A similarinstrumented beam was used by Wang et al.(2004), who were able to relate adhesion forcesto the intermolecular attraction between ingredi-ents of the tablet formulation and the metalsurface of the punch face.
Waimer et al. (1999a) adopted a differentapproach in that, rather than determining thesweep-off force, they measured the forcerequired to separate the punch face from thetablet. As the punch begins to rise in the die,adhesive forces cause the punch to be in tensionbefore contact is lost between punch face andtablet. However, these forces are extremely low.For a compression force of 40 kN, the adhesionforce is only 30–40 N, so a sensitive and wide-ranging system of measurement is needed. In asubsequent paper (Waimer et al. 1999b), thesame workers studied the influence of punchengravings on adhesion by screwing small conesinto the punch face. They found that the angleof the cone had a major influence on theamount of adhesion.
References
Altaf SA, Hoag SW (1995). Deformation of the StokesB2 rotary tablet press: quantitative influence ontablet compaction. J Pharm Sci 84: 337–343.
202 Tablet and capsule machine instrumentation

Amidon GE, Smith DP, Hiestand EN (1981). Rotarypress utilizing a flexible die wall. J Pharm Sci 70:613–617.
Antikainen OK, Yliruusi JK (1997). New parametersderived from tablet compression curves. 2:Force–displacement curve. Drug Dev Ind Pharm 23:81–93.
Armstrong NA (1998). Direct compression character-istics of granulated lactitol. Pharm Tech Europe 10:42–45.
Armstrong NA, Morton FSS (1979). An evaluation ofthe compression characteristics of some magnesiumcarbonate granulations. Pharm Weekblad Sci Ed 114:1450–1459.
Armstrong NA, Palfrey LP (1989). The effect ofmachine speed on the consolidation of four directlycompressible tablet diluents. J Pharm Pharmacol 41:149 – 151.
Armstrong NA, Abourida NMAH, Gough AM (1983). Aproposed consolidation parameter for powders. J Pharm Pharmacol 35: 320–321.
Armstrong NA, Abourida NMAH, Krijgsman L (1982).Multiple compression of powders in a tablet press. J Pharm Pharmacol 34: 9–13.
Billardon P, Ozil P, Guyot JC (1987). Planning exper-iments using an instrumented tablet machine informulation. Drug Dev Ind Pharm 13: 2477–2493.
Carstensen JT, Touré P (1980). Compression cycles intabletting. Powder Technol 26: 199–204.
Carstensen JT, Touré P, Duchêne D, Puisieux F (1981).Correlation between hysteresis loop areas of lowerpunch and of die pressures versus upper punchpressures. Drug Dev Ind Pharm 7: 645–648.
Charlton B, Newton JM (1984). Theoretical estimationof punch velocities and displacements of singlepunch and rotary tablet machines. J PharmPharmacol 36: 645–651.
Chowhan ZT, Chow YP (1980). Compression behaviorof pharmaceutical powders. Int J Pharm 5: 139–148.
Cocolas HG, Lordi NG (1993). Axial to radial pressuretransmission of tablet excipients using a novelinstrumented die. Drug Dev Ind Pharm 19:2473–2497.
Coffin-Beach DP, Hollenbeck RG (1983).Determination of the energy of tablet formationduring compression of selected pharmaceuticalpowders. Int J Pharm 17: 313–324.
Cooper AR, Eaton LE (1980). Compaction behavior ofseveral ceramic powders. J Am Ceram Soc 45: 97–101.
de Blaey CJ (1972). Compression of pharmaceuticals. 6:Quantitative determination of the friction duringcompression in terms of the work involved. PharmWeekblad 107: 233–242.
de Blaey CJ, Polderman J (1970). Compression ofpharmaceuticals. 1: The quantitative interpretationof force–displacement curves. Pharm Weekblad 105:241–250.
de Blaey CJ, Polderman J (1971). Compression ofpharmaceuticals. 2: Registration and determinationof force–displacement curve using a small digitalcomputer. Pharm Weekblad 106: 57–65.
Delacourte A, Predella P, Leterme P et al. (1993). Amethod for quantitative evaluation of the effective-ness of lubricants used in tablet technology. DrugDev Ind Pharm, 19: 1047–1060.
Dietrich R, Mielck JB (1984). Parameterization of thetime course of compression in tabletting by means of a modified Weibull function. 1: Idea andexperimental design. Pharm Ind 46: 863–869.
Dietrich R, Mielck JB (1985). Parameterization of thetime course of compression in tabletting by meansof a modified Weibull function. 2: Statistical evalu-ation and interpretation of results. Pharm Ind 47:216–220.
Du J, Hoag SW (2003). Characterisation of excipientand tabletting factors that influence folic acid dis-solution, friability and breaking strength of oil andwater-soluble multivitamin and mineral tablets.Drug Dev Ind Pharm 29: 1137–1147.
Dwivedi SK, Oates RJ, Mitchell AG (1991). Peak offsettime as an indication of stress relaxation duringtabletting on a rotary tablet press. J PharmPharmacol 43: 673–678.
Heckel RW (1961). Density-pressure relationships inpowder compaction. Trans Metal Soc AIME 221:671–675.
Hersey JA, Rees JE (1971). Deformation of particlesduring briquetting. Nature 230: 96–98.
Hiestand EN, Wells JE, Peot CB, Ochs JF (1977). Physicalprocesses of tableting. J Pharm Sci 66: 510–519.
Ho AYK, Jones TM (1979). The effect of punch:diedistortion on the measurement of radial die wallforce during compaction. In Proceedings of theInternational Conference of Pharmacy Technology andProduction Manufacture, Copenhagen.
Ho AYK, Jones TM (1988a). Punch travel beyond peakforce during tablet compression. J Pharm Pharmacol40: 75P.
Ho AYK, Jones TM (1988b). Rise time: a new index oftablet compression. J Pharm Pharmacol 40:74P.
Hoag SW, Rippie EG (1994). Thermodynamic analysisof energy dissipation by pharmaceutical tabletsduring stress unloading. J Pharm Sci 83: 903–908.
Hölzer AW, Sjögren J (1977). Comparison of methodsfor evaluation of friction during tabletting. DrugDev Ind Pharm 3: 23–37.
Applications of tablet press instrumentation 203

Hölzer AW, Sjögren J (1979). Instrumentation and cali-bration of a single-punch press for measuring theradial force during tabletting. Int J Pharm 3:221–230.
Huckle PD, Summers MP (1985). The effect of strain-gauge size and configuration on radial stress mea-surement during tabletting. J Pharm Pharmacol 37:722–725.
Jarvinen MJ, Juslin MJ (1971). Studies on energyexpenditure by compressing tablets with aneccentric tablet machine. 1: Determination ofmechanical energy. Farm Aikak. 80: 242–248.
Kawakita K, Ludde K-H (1970). Some considerations onpowder compression equations. Powder Technol 4:61–68.
Khossravi D (1999). Compaction properties of pow-ders: the relationship between compression cyclehysteresis areas and maximally applied punchpressures. Drug Dev Ind Pharm 25: 885–895.
Khossravi D, Morehead WT (1997). Consolidationmechanisms of pharmaceutical solids: a multicom-pression cycle approach. Pharm Res 14: 1039–1045.
Kiekens F, Debunne A, Vervaet C et al. (2004).Influence of punch diameter and curvature on yieldpressure of microcrystalline cellulose compacts dur-ing Heckel analysis. Eur J Pharm Sci 22: 117–126.
Konkel P, Mielck JB (1997). Association of parameterscharacterising the time course of the tablettingprocess on a reciprocating and on a rotary tablet-ting machine for high speed production. Eur J Pharm Biopharm 44: 289–301.
Krycer I, Pope DG, Hersey JA (1982). An evaluation ofthe techniques employed to investigate powdercompaction behaviour. Int J Pharm 12: 113–134.
Leigh S, Carless JE, Burt BW (1967). Compressioncharacteristics of some pharmaceutical materials. J Pharm Sci 56: 888–893.
Lindberg NO (1972). Instrumentation of a singlepunch tablet machine. Acta Pharm Suec 9: 135–140.
Little A, Mitchell KA (1963). Tablet Making, 2nd edn.Liverpool, UK: Northern.
Long WM (1960). Radial pressures in powdercompaction. Powder Metal 6: 73–86.
Miller TA, York P (1988). Pharmaceutical tabletlubrication. Int J Pharm 41: 1–9.
Mitrevej A, Augsburger LL (1980). Adhesion of tabletsin a rotary tablet press. I: Instrumentation and pre-liminary study of variables affecting adhesion. DrugDev Ind Pharm 6: 331–337.
Morris LE, Moore JC, Schwartz JB (1996).Characterisation and performance of a new directcompression excipient for chewable tablets:Xylitab. Drug Dev Ind Pharm 22: 925–932.
Müller BW, Steffens K-J, List PH (1982). Tribologicallaws and findings in tablet technology. 5: On meth-ods for determining the tribological properties ofsolid lubricants in tablet manufacture. Pharm Ind44: 636–640.
Müller F, Caspar U (1984). Viskoelastische Phänomenewährend der Tablettierung. Pharm Ind 46:1049–1056.
Muller FX, Augsburger LL (1994). Role of thedisplacement-time waveform in the determi-nation of Heckel behaviour under dynamic con-ditions in a compaction simulator and a fullyinstrumented tablet machine. J Pharm Pharmacol46: 468–475.
Munoz-Ruiz A, Jiminez-Castellanos MR, CunninghamJC et al. (1992). Theoretical estimation of dwell andconsolidation times in rotary tablet machines. DrugDev Ind Pharm 18: 2011–2028.
Nelson E (1955). The physics of tablet compression. 8:Some preliminary measurements of die wall pres-sure during tablet compression. J Am Pharm AssocSci Ed 44: 484–497.
Nelson E, Busse LW, Higuchi T (1955). The physics oftablet compression. 7: Determination of energyexpenditure in the tablet compression process. J AmPharm Assoc Sci Ed 44: 223–226.
Oates RJ, Mitchell AG (1989). Calculation of punch dis-placement and work of powder compaction on arotary tablet press. J Pharm Pharmacol 41: 517–523.
Oates RJ, Mitchell AG (1990). Comparison of calcu-lated and experimentally determined punch dis-placement on a rotary tablet press using bothManesty and IPT punches. J Pharm Pharmacol 42:388–396.
Obiorah BA (1978). Possible prediction of compressioncharacteristics from pressure cycle plots. Int J Pharm1: 249–255.
Olmo IG, Ghaly ES (1999). Compressional character-ization of two dextrose-based directly compressibleexcipients using an instrumented tablet press.Pharm Dev Technol 4: 221–231.
Ragnarsson G (1996). Force–displacement and network measurements. In Alderborn G, Nystrom C(eds), Pharmaceutical Powder Compaction Technology.New York: Marcel Dekker, pp 77–97.
Ragnarsson G, Sjögren J (1985). Force–displacementmeasurements in tabletting. J Pharm Pharmacol 37:145–150.
Ramberger R, Burger A (1985). On the application ofthe Heckel and Kawakita equations to powdercompaction. Powder Technol 43: 1–9.
Rippie EG, Danielson DW (1981). Viscoelasticstress–strain behaviour of pharmaceutical tablets:
204 Tablet and capsule machine instrumentation

analysis during unloading and postcompressionperiods. J Pharm Sci 70: 476–482.
Roberts RJ, Rowe RC (1985). The effect of punch vel-ocity on the compaction of a variety of materials.J Pharm Pharmacol 37: 377–384.
Rowe RC, Roberts RJ (1996). Mechanical properties. InAlderborn G, Nystrom C (eds), PharmaceuticalPowder Compaction Technology, New York: MarcelDekker, pp 283–322.
Rowlings CE, Wurster DE, Ramsey PJ (1995).Calorimetric analysis of powder compression. 2:The relationship between energy terms measuredwith a compression calorimeter and tablettingbehaviour. Int J Pharm 116: 191–200.
Rue PJ, Rees JE (1978). Limitations of the Heckelequation for predicting powder compactionmechanisms. J Pharm Pharmacol 30: 642–643.
Schmidt PC, Leitritz M (1997). Compression force/timeprofiles of microcrystalline cellulose, dicalciumphosphate dihydrate and their binary mixtures – acritical consideration of experimental parameters.Eur J Pharm Biopharm 44: 303–313.
Schmidt PC, Vogel PJ (1994). Force–time curves of amodern rotary tablet machine. 1: Evaluation tech-niques and characterisation of deformation behav-ior of pharmaceutical substances. Drug Dev IndPharm 20: 921–934.
Schmidt PC, Tenter U, Hocke J (1986). Force–displacement characteristics of rotary tablettingmachines. 1: Installation of a single punch for forcemeasurements Pharm Ind 48: 1546–1553.
Shaxby JH, Evans JC (1923). The variation of pressurewith depth in columns of powders. Trans FaradaySoc 19: 60–72.
Sheikh-Salem M, Fell JT (1981). The influence of initialpacking on the compression of powders. J PharmPharmacol 33: 491–494.
Smith AN (1949). Compressed tablets. 1: resistance towear and tear. Pharm J 163: 194–195.
Sonnergaard JM (1999). A critical evaluation of theHeckel equation. Int J Pharm 193: 63–71.
Strickland WA, Higuchi T, Busse LW (1960). Thephysics of tablet compression. 10: Mechanism ofaction and evaluation of lubricants. J Am PharmAssoc Sci Ed 49: 35–40.
Sun C, Grant DJW (2001). Influence of elastic defor-mation of particles on Heckel analysis. Pharm DevTechnol 6: 193–200.
Train D (1956). An investigation into the compactionof powders. J Pharm Pharmacol 8: 745–761.
Vogel PJ, Schmidt PC (1993). Force–time curves of amodern rotary tablet machine. 2: Influence of com-pression force and tabletting speed on deformation
mechanisms of pharmaceutical substances. DrugDev Ind Pharm 19: 1917–1930.
Waimer F, Krumme M, Danz P et al. (1999a). A novelmethod for the detection of sticking of tablets.Pharm Dev Technol 4: 359–367.
Waimer F, Krumme M, Danz P et al. (1999b). The influ-ence of engravings on the sticking of tablets.Investigations with an instrumented upper punch.Pharm Dev Technol 4: 369–375.
Windheuser JJ, Misra J, Eriksen SP, Higuchi T (1963).Physics of tablet compression. 13: Development ofdie-wall pressure during compression of variousmaterials. J Pharm Sci 52: 767–770.
Yeh C, Altaf SA, Hoag SW (1997). Theory of force trans-ducer design optimisation for die wall stressmeasurement during tablet compaction.Optimisation and validation of split web die usingfinite element analysis. Pharm Res 14: 1161–1170.
Ylirussi JK, Antikainen OK (1997). New parametersderived from tablet compression curves. 1:Force–time curve. Drug Dev Ind Pharm 23: 69–79.
York P (1979). A consideration of experimentalvariables in the analysis of powder compactionbehaviour. J Pharm Pharmacol 31: 244–246.
Further reading
Armstrong NA (1989). Time-dependent factorsinvolved in powder compression and tabletmanufacture. Int J Pharm 49: 1–13.
Bolhuis GK, Hölzer AW (1996). Lubricant sensitivity. InAlderborn, G., Nystrom, C (eds), PharmaceuticalPowder Compaction Technology, New York: MarcelDekker, pp 517–560.
Carstensen JT, Marty J-P, Puisieux F, Fessi H (1981).Bonding mechanisms and hysteresis areas incompression cycle plots. J Pharm Sci 70: 222–223.
Celik M (1992). Overview of compaction data analysistechniques. Drug Dev Ind Pharm 18: 767–810.
Kottke MK, Rudnic EM (2002). Tablet dosage forms. InBanker GS, Rhodes CT (eds), Modern Pharmaceutics,New York: Marcel Dekker, pp 333–391.
Doelker E, Massuelle D (2004). Benefits of die wallinstrumentation for research and development intabletting. Eur J Pharm Biopharm 58: 427–444.
Heckel RW (1961). An analysis of powder compactionphenomena. Trans Metall Soc AIME 221: 1001–1008.
Hoblitzell JR, Rhodes CT (1990). Instrumented tabletpress studies on the effect of some formulation andprocessing variables on the compaction process.Drug Dev Ind Pharm 16: 469–507.
Applications of tablet press instrumentation 205

Morehead WT (1992). Viscoelastic behaviour of phar-maceutical materials during compaction. Drug DevInd Pharm 18: 659–675.
Müller F (1996). Viscoelastic models. In Alderborn G,Nystrom C (eds), Pharmaceutical Powder CompactionTechnology. New York: Marcel Dekker, pp 99–132.
Paronen P, Ilkka J (1996). Porosity-pressure functions.In Alderborn G, Nystrom C (eds), PharmaceuticalPowder Compaction Technology, New York: MarcelDekker, pp 55–75.
206 Tablet and capsule machine instrumentation
Introduction
The hard-shell capsule is a commonly useddosage form, and it has been estimated thatapproximately 60 billion capsule shells are usedannually for pharmaceutical products (Podczeck,2004). The product essentially consists of a hardshell, usually gelatin based, that is almost alwaysfilled with a particulate solid. Among the advan-tages claimed for the hard-shell capsule com-pared with tablets are enhanced bioavailabilityowing to the highly porous nature of the fill,less-demanding requirements for powder flowand the ability to fill formulations into a capsuleshell that are not compressible to the extentneeded for tablet manufacture. However, Jones(2001) has pointed out the fallacy of the beliefthat ‘powder filled capsules are a very simpleproduct that does not need much skill toprepare’. The requirements of formulations to be filled into hard shells can be quite complex,and understanding the filling process has been greatly facilitated by fitting appropriateinstrumentation to the filling equipment.
There are several similarities between instru-mentation for a tablet press and that of capsule-filling equipment. Tablet making and capsuleshell filling involve compressing a particulatemass and so in both types of instrumentation, theparameters of most interest are force (pressure)and distance, both almost invariably recorded asa function of time. The transducers that havebeen used to measure these in tablet presses –various types of strain gauge and displacementtransducer – have been used in capsule-filling
equipment, and an instrumentation system forcapsule-filling equipment requires the same com-ponents as for an instrumented tablet press,namely a power supply, suitably calibrated trans-ducers, amplification circuitry and devices forrecording and manipulating the amplified outputsof the transducers. Many of the approaches thathave been used in the instrumentation of tabletpresses have also been used to instrument capsule-filling equipment, and the use of simulators hasbeen particularly successful.
However, there are important differences. Theforces used in the compression of the contents ofhard-shell capsules are much lower – of the orderof tens of newtons – whereas in tablet manufac-ture, forces of tens of kilonewtons are needed.Hence a sensitive measuring system that is capa-ble of distinguishing a signal of this magnitudefrom background noise is required to study cap-sule filling. Earlier chapters in this book havestressed the importance of the correct siting oftransducers and this is just as important withcapsule-filling machinery. Indeed there is a par-ticular problem in this case. To give a stable andmeaningful output, the transducer must beattached to a massive and secure component ofthe equipment. Suitable sites are readily avail-able in a tablet press but are not so available incapsule-filling equipment.
The uses made of instrumented capsule-fillingmachines parallel those of instrumented tabletpresses: the effect of compression force on plugproperties such as physical strength, dispersionand dissolution have been studied, together withthe lubricant requirements of the formulation.
10The instrumentation of capsule-filling machinery
N Anthony Armstrong
207

Capsule-filling equipment
Though there are two types of tablet press –eccentric and rotary – the way in which theyoperate is essentially the same in that a particu-late mass is constrained in a die and compressedbetween an upper and a lower punch. In con-trast, there are several types of capsule-fillingequipment, each with its own modus operandi.The fill material is treated in different ways ineach case, and hence the challenges of fittinginstrumentation also differ.
The two most popular types of capsule-fillingequipment are those based on a tamping mech-anism into a dosating disk and those that makeuse of a dosating tube. Both types have beenfully described by Jones (2001) and Podzceck(2004), but a brief description of their operatingprinciples is necessary here.
Dosating disk machines
The dosating disk machine, shown diagrammati-cally in Figure 10.1, in some ways resembles atablet press. The dosating disk has a number ofholes bored through it, all except one beingclosed off by a base plate. Powder flows into the
first hole and is compressed by tamping pin 1.This hole is then moved to position two; furtherpowder flows in and is compressed again, thistime by tamping pin 2. This is repeated until thelast hole is reached when, after excess powderhas been scraped off, the dosating disk positionsthe plug of powder over a capsule body. The plugis then ejected by a piston, and the upper part ofthe shell is fitted. The overall arrangement isanalogous to the die cavity of a tablet press thatis progressively filled and the contents repeat-edly consolidated. The several filling positionsare usually arranged in a circle.
The tamping pins are spring loaded to avoidthe application of an excessive force. The result-ant plugs are fragile and of high porosity andhence dispersion and dissolution of the contentsafter ingestion are facilitated. This type ofmachine is exemplified by those made by Höfliger& Karg (now part of the Bosch Group) and HarroHöfliger.
Dosating nozzle machines
In dosating nozzle machines, the dosator con-sists of a tube, open at one end, within which isa moveable piston. The dosator is plunged into abed of particulate solid contained in a hopper.
208 Tablet and capsule machine instrumentation
Powder bed
Dosating disk
Base plate
Capsule body
Ejection pin
54
32
1
Tamping pins
Figure 10.1 A dosating disk capsule-filling machine.
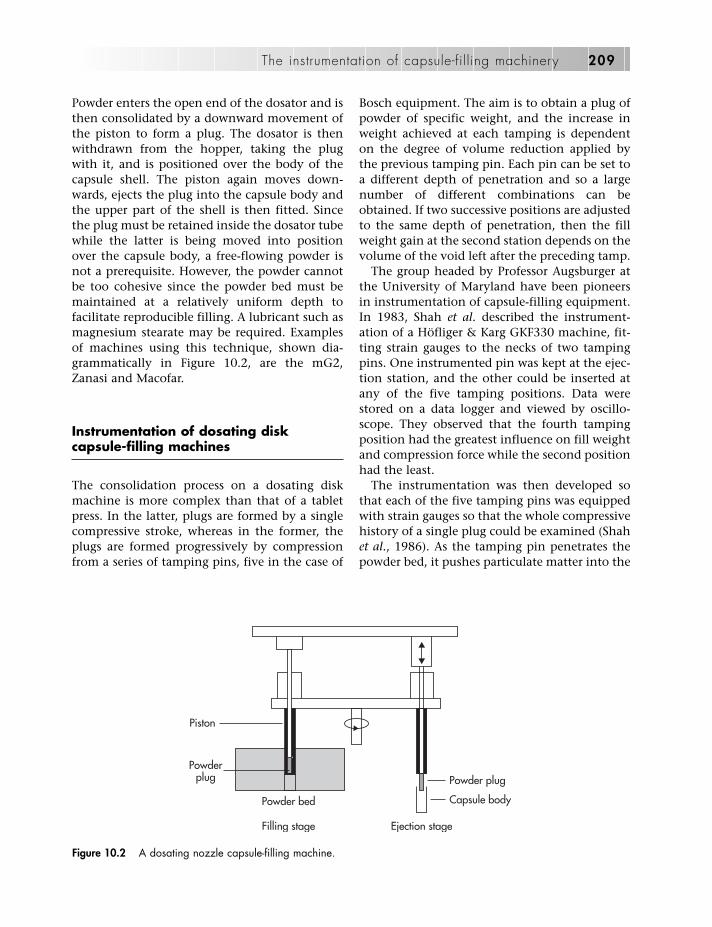
Powder enters the open end of the dosator and isthen consolidated by a downward movement ofthe piston to form a plug. The dosator is thenwithdrawn from the hopper, taking the plugwith it, and is positioned over the body of thecapsule shell. The piston again moves down-wards, ejects the plug into the capsule body andthe upper part of the shell is then fitted. Sincethe plug must be retained inside the dosator tubewhile the latter is being moved into positionover the capsule body, a free-flowing powder isnot a prerequisite. However, the powder cannotbe too cohesive since the powder bed must bemaintained at a relatively uniform depth tofacilitate reproducible filling. A lubricant such asmagnesium stearate may be required. Examplesof machines using this technique, shown dia-grammatically in Figure 10.2, are the mG2,Zanasi and Macofar.
Instrumentation of dosating diskcapsule-filling machines
The consolidation process on a dosating diskmachine is more complex than that of a tabletpress. In the latter, plugs are formed by a singlecompressive stroke, whereas in the former, theplugs are formed progressively by compressionfrom a series of tamping pins, five in the case of
Bosch equipment. The aim is to obtain a plug ofpowder of specific weight, and the increase inweight achieved at each tamping is dependenton the degree of volume reduction applied bythe previous tamping pin. Each pin can be set toa different depth of penetration and so a largenumber of different combinations can beobtained. If two successive positions are adjustedto the same depth of penetration, then the fillweight gain at the second station depends on thevolume of the void left after the preceding tamp.
The group headed by Professor Augsburger atthe University of Maryland have been pioneersin instrumentation of capsule-filling equipment.In 1983, Shah et al. described the instrument-ation of a Höfliger & Karg GKF330 machine, fit-ting strain gauges to the necks of two tampingpins. One instrumented pin was kept at the ejec-tion station, and the other could be inserted atany of the five tamping positions. Data werestored on a data logger and viewed by oscillo-scope. They observed that the fourth tampingposition had the greatest influence on fill weightand compression force while the second positionhad the least.
The instrumentation was then developed sothat each of the five tamping pins was equippedwith strain gauges so that the whole compressivehistory of a single plug could be examined (Shahet al., 1986). As the tamping pin penetrates thepowder bed, it pushes particulate matter into the
The instrumentation of capsule-filling machinery 209
Powder plug
Powder bed
Filling stage
Capsule body
Ejection stage
Piston
Powderplug
Figure 10.2 A dosating nozzle capsule-filling machine.
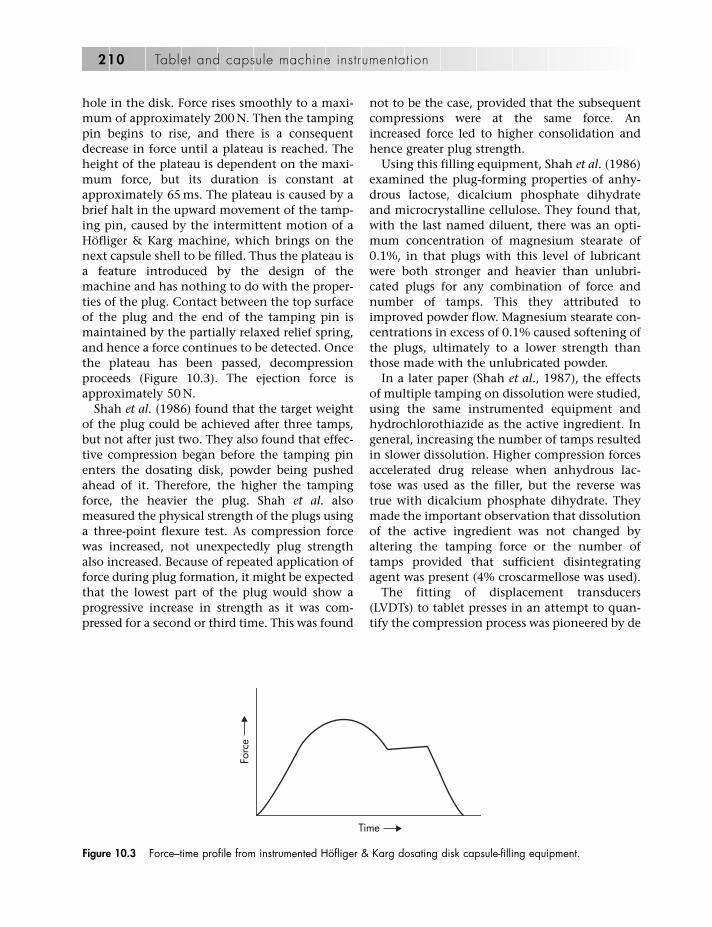
hole in the disk. Force rises smoothly to a maxi-mum of approximately 200 N. Then the tampingpin begins to rise, and there is a consequentdecrease in force until a plateau is reached. Theheight of the plateau is dependent on the maxi-mum force, but its duration is constant atapproximately 65 ms. The plateau is caused by abrief halt in the upward movement of the tamp-ing pin, caused by the intermittent motion of aHöfliger & Karg machine, which brings on thenext capsule shell to be filled. Thus the plateau isa feature introduced by the design of themachine and has nothing to do with the proper-ties of the plug. Contact between the top surfaceof the plug and the end of the tamping pin ismaintained by the partially relaxed relief spring,and hence a force continues to be detected. Oncethe plateau has been passed, decompressionproceeds (Figure 10.3). The ejection force isapproximately 50 N.
Shah et al. (1986) found that the target weightof the plug could be achieved after three tamps,but not after just two. They also found that effec-tive compression began before the tamping pinenters the dosating disk, powder being pushedahead of it. Therefore, the higher the tampingforce, the heavier the plug. Shah et al. alsomeasured the physical strength of the plugs usinga three-point flexure test. As compression forcewas increased, not unexpectedly plug strengthalso increased. Because of repeated application offorce during plug formation, it might be expectedthat the lowest part of the plug would show aprogressive increase in strength as it was com-pressed for a second or third time. This was found
not to be the case, provided that the subsequentcompressions were at the same force. Anincreased force led to higher consolidation andhence greater plug strength.
Using this filling equipment, Shah et al. (1986)examined the plug-forming properties of anhy-drous lactose, dicalcium phosphate dihydrateand microcrystalline cellulose. They found that,with the last named diluent, there was an opti-mum concentration of magnesium stearate of0.1%, in that plugs with this level of lubricantwere both stronger and heavier than unlubri-cated plugs for any combination of force andnumber of tamps. This they attributed toimproved powder flow. Magnesium stearate con-centrations in excess of 0.1% caused softening ofthe plugs, ultimately to a lower strength thanthose made with the unlubricated powder.
In a later paper (Shah et al., 1987), the effectsof multiple tamping on dissolution were studied,using the same instrumented equipment andhydrochlorothiazide as the active ingredient. Ingeneral, increasing the number of tamps resultedin slower dissolution. Higher compression forcesaccelerated drug release when anhydrous lac-tose was used as the filler, but the reverse wastrue with dicalcium phosphate dihydrate. Theymade the important observation that dissolutionof the active ingredient was not changed byaltering the tamping force or the number oftamps provided that sufficient disintegratingagent was present (4% croscarmellose was used).
The fitting of displacement transducers(LVDTs) to tablet presses in an attempt to quan-tify the compression process was pioneered by de
210 Tablet and capsule machine instrumentation
Forc
e
Time
Figure 10.3 Force–time profile from instrumented Höfliger & Karg dosating disk capsule-filling equipment.
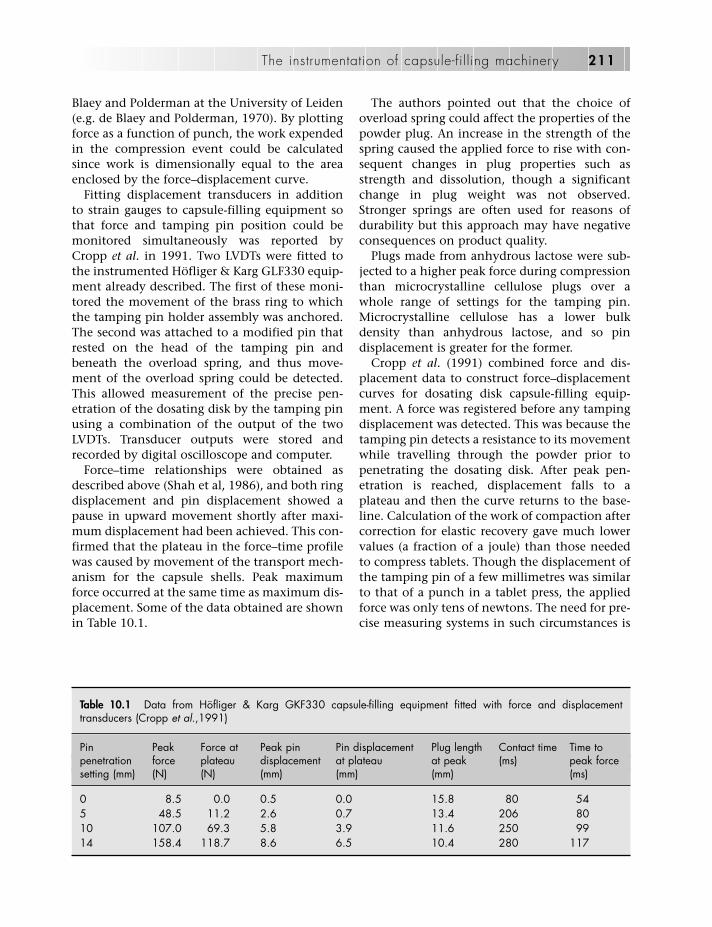
Blaey and Polderman at the University of Leiden(e.g. de Blaey and Polderman, 1970). By plottingforce as a function of punch, the work expendedin the compression event could be calculatedsince work is dimensionally equal to the areaenclosed by the force–displacement curve.
Fitting displacement transducers in additionto strain gauges to capsule-filling equipment sothat force and tamping pin position could bemonitored simultaneously was reported byCropp et al. in 1991. Two LVDTs were fitted tothe instrumented Höfliger & Karg GLF330 equip-ment already described. The first of these moni-tored the movement of the brass ring to whichthe tamping pin holder assembly was anchored.The second was attached to a modified pin thatrested on the head of the tamping pin andbeneath the overload spring, and thus move-ment of the overload spring could be detected.This allowed measurement of the precise pen-etration of the dosating disk by the tamping pinusing a combination of the output of the twoLVDTs. Transducer outputs were stored andrecorded by digital oscilloscope and computer.
Force–time relationships were obtained asdescribed above (Shah et al, 1986), and both ringdisplacement and pin displacement showed apause in upward movement shortly after maxi-mum displacement had been achieved. This con-firmed that the plateau in the force–time profilewas caused by movement of the transport mech-anism for the capsule shells. Peak maximumforce occurred at the same time as maximum dis-placement. Some of the data obtained are shownin Table 10.1.
The authors pointed out that the choice ofoverload spring could affect the properties of thepowder plug. An increase in the strength of thespring caused the applied force to rise with con-sequent changes in plug properties such asstrength and dissolution, though a significantchange in plug weight was not observed.Stronger springs are often used for reasons ofdurability but this approach may have negativeconsequences on product quality.
Plugs made from anhydrous lactose were sub-jected to a higher peak force during compressionthan microcrystalline cellulose plugs over awhole range of settings for the tamping pin.Microcrystalline cellulose has a lower bulkdensity than anhydrous lactose, and so pin displacement is greater for the former.
Cropp et al. (1991) combined force and dis-placement data to construct force–displacementcurves for dosating disk capsule-filling equip-ment. A force was registered before any tampingdisplacement was detected. This was because thetamping pin detects a resistance to its movementwhile travelling through the powder prior topenetrating the dosating disk. After peak pen-etration is reached, displacement falls to aplateau and then the curve returns to the base-line. Calculation of the work of compaction aftercorrection for elastic recovery gave much lowervalues (a fraction of a joule) than those neededto compress tablets. Though the displacement ofthe tamping pin of a few millimetres was similarto that of a punch in a tablet press, the appliedforce was only tens of newtons. The need for pre-cise measuring systems in such circumstances is
The instrumentation of capsule-filling machinery 211
Table 10.1 Data from Höfliger & Karg GKF330 capsule-filling equipment fitted with force and displacementtransducers (Cropp et al.,1991)
Pin Peak Force at Peak pin Pin displacement Plug length Contact time Time to penetration force plateau displacement at plateau at peak (ms) peak forcesetting (mm) (N) (N) (mm) (mm) (mm) (ms)
0 8.5 0.0 0.5 0.0 15.8 80 545 48.5 11.2 2.6 0.7 13.4 206 8010 107.0 69.3 5.8 3.9 11.6 250 9914 158.4 118.7 8.6 6.5 10.4 280 117
apparent. Owing to the greater pin displacementwith microcrystalline cellulose, work expendedin compressing this substance was about doublethat used for compressing anhydrous lactose.
Further development of the same machine wascarried out by Davar et al. (1997), who fittedeach station with instrumented tamping pins.LVDTs were added to measure tamping pin pen-etration, pin displacement at peak pressure andthe movement of the brass guide block. Using sixformulations containing either lactose or micro-crystalline cellulose, the relationships betweencompressing force and plug properties such asphysical strength and density were investigated.
A totally different approach to instrumen-tation of tamping disk capsule-filling equipmenthas been described by Podczeck (2000, 2001). Inthe first of these papers, Podczeck pointed outthat advances in instrumentation in tablet manu-facture have led to feedback mechanisms thatcan be used to control tablet weight automati-cally (Chapter 11), but such developments incapsule filling had yet to be achieved. One possi-bility of changing fill weight was by altering thetamping distance of one or more of the tampingpins, but Podczeck and Newton (1999) demon-strated that only modest changes of a few mil-ligrams could be achieved in this way. Largerchanges in fill weight could be brought about byexchanging the springs inside the tamping fin-gers. However, changing springs and adjustmentof penetrative depth can only be carried outwhen the equipment is stationary and so neithermethod lends itself to a feedback mechanism.For weight adjustment to take place when themachine was running, some form of electrical orelectronic control was required.
Podczeck used a Bosch GKF 400S machine. Inthis equipment, there are five tamping stationseach fitted with three tamping pins. In the onetamping block that was instrumented, thesprings were removed and replaced with dash-pots and a chamber filled with compressed air.The latter was in contact with a piezoelectricforce transducer. By this arrangement, the pointat which the springs were deflected could bealtered continuously, and hence the volumeavailable in the hole of the dosating disk wasalso changed. Force rapidly rose to a maximum,was maintained virtually constant for a time and
then fell to a plateau level. It then remained con-stant for a further period before returning tozero. The change of force between maximumand plateau was attributed to deflection of thespring in the tamping pin, which in this case was simulated by air pressure. The plateau wasnot detected at tamping forces of less thanapproximately 60 N.
In practice, it was found that the pneumatichead was able to control fill weight but couldonly change it in small increments. If largerchanges were needed, then the tamping pins hadto be adjusted or the powder bed depth had to bealtered. A significant finding in this work wasthat most of the powder that ultimately formedthe plug entered the holes of the dosating diskby flow under gravity as the disk rotated. Only aminor portion of the plug came from powderpushed in by the tamping pins. It follows, there-fore, that the ultimate plug weight is largelydependent on the flow properties of the powdersrather than the force exerted by the tampingpins.
In a further study using this apparatus(Podczeck, 2001), the station bearing the instru-mented head was varied so that the contributionof each station to plug formation could beassessed. It was found that the plug achieved itsfinal length and density at station four, and sothe best way to control plug weight would be toposition the instrumented head at this station.Podczeck suggested that a feedback device couldbe achieved with the instrumented head atstation four and a non-instrumented pneumatichead at station three. The internal pressure of the latter would be controlled by electricalsignals from the former.
An important finding in this work was that,for any given plug, each successive tamp causedfurther densification. It will be recalled that Shahet al. (1986) reported that the density of eachsegment of the plug did not increase despitemultiple applications of tamping force. Podczeckexplained these contradictory results with refer-ence to the consolidation mechanisms of thesolids involved. Shah and colleagues had usedlactose and dicalcium phosphate dihydrate intheir studies. Both of these undergo consoli-dation by particle fracture, and since the forcesinvolved in plug formation are well below the
212 Tablet and capsule machine instrumentation

yield points of such substances, it is unlikely thatthese particles would undergo fragmentation.However, Podczeck used microcrystalline cellu-lose and pregelatinised starch. Both of these areductile materials and are readily deformed bylow forces. Hence progressive consolidation canbe anticipated.
The simulation of dosating disk capsule-filling machines
A disadvantage of conventional tablet pressesand capsule-filling equipment is that severalhundred grams or even kilograms of particulatematerial may be needed for them to operate effi-ciently or even at all. In some circumstances, thisquantity may not be available, and even if itwere, considerable wastage would be unavoid-able. It was primarily for this reason that tabletpress simulators were introduced in the 1970s.These are hydraulic presses fitted with a die andtwo punches, the movement of the punchesbeing precisely controlled. The die is usuallyfilled manually and individual tablets are madeand examined. A further advantage of tabletpress simulators is that by adjusting the rate ofmovement of the punches to conform to a pre-determined pattern, the speed of compression aswell as the applied force can be controlled.Hence one versatile simulator can, in theory atleast, imitate the mode of operation of any tabletpress.
Though the advantages of economy and versa-tility can apply equally to simulation of capsule-filling equipment, there are other considerationsthat require a different emphasis. As alreadydiscussed, there are fewer suitable points ofattachment for transducers to capsule-fillingmachinery without major modifications of theequipment. Hence a simulator can be designedso that it has the sufficiency of robust fixingpoints for the transducers that would not beavailable on the equipment itself. A further fea-ture is that they are usually somewhat cheaper toconstruct and operate than their tablet counter-parts. As mentioned above, tablet press simu-lators are hydraulic presses, and much of theirexpense arises from the need to move large vol-umes of hydraulic fluid rapidly and precisely at
high pressures. Since capsule-filling simulatorsapply much lower forces than tablet presses,their control systems are less demanding and,therefore, cheaper. For example, the simulatordescribed by Britten et al. (1995) is operatedpneumatically from a commercial compressedair cylinder.
Any simulator must be capable of exerting theforces and reproducing the patterns of com-ponent movement of the equipment that it isdesigned to imitate. Since equations have beenderived to predict punch movement of bothrotary and eccentric presses (Chapter 9), a ‘uni-versal’ simulator for tablet presses is at leasttheoretically possible. Not so with capsule-fillingequipment, since each manufacturer has a differ-ent mechanism for inducing component move-ment. Consequently, movement is simulatedeither by using isolated parts of the equipment(e.g. Jolliffe et al., 1982) or by measuring com-ponent movement on an actual machine with atransducer and incorporating this knowledgeinto the design of the simulator (e.g. Brittenet al., 1995). The latter method, of course, dependson the measuring device being properly sited,and lack of such siting points is one of thereasons for using a simulator in the first place.
The earliest attempts to simulate plug forma-tion by tamping were not intended to imitatecapsule filling per se, but to produce plugs undercontrolled conditions for dissolution studies. Forexample, Lerk et al. (1979) used a hand-operatedpress fitted with a plunger and die to produceplugs at a known constant force. This force wasmeasured by a load cell fitted to the top of theplunger.
A device designed by Höfliger and Karg toselect the correct dosating disk for a given for-mulation was used by Jones (1988, 1998) as asimulator. The device had one tamping pin, theforce exerted by which could be measured with aload cell. Movement could also be detected, fromwhich plug length could be calculated. Davaret al. (1997) used an Instron testing machine forthe same purpose and confirmed their results byusing the instrumented capsule-filling apparatusdescribed above.
As stated above, the production of powderplugs by dosating disk machines is somewhatanalogous to the compression of tablets. In their
The instrumentation of capsule-filling machinery 213

paper describing pin displacement measurementson dosating disk machines, Cropp et al. (1991)pointed out that if tamping pin displacement wasknown it should be possible to make a com-paction simulator that could mimic the com-ponent movement and the low forces involved inplug formation. This development was reportedby Heda et al. in 1999, using a Mand tabletcompaction simulator so that both force andtamping pin movement could be independentlycontrolled.
Since powder plugs for capsule fills have agreater height-to-diameter ratio than tablets, itwas necessary to use a die that was much deeperthan normal. A diameter of 5.71 mm was chosen,this being the same diameter as the tamping pinused to prepare a plug for a number 1 size cap-sule. In this, plugs of heights up to 12 mm couldbe prepared. Anhydrous lactose, microcrystallinecellulose and pregelatinised starch were used,and the die was lubricated by hand with a satur-ated solution of magnesium stearate in acetone.Forces up to around 400 N were used.
A feature of tablet press simulators is that theycan be operated at a range of punch speeds, andHeda et al. (1999) studied plug formation at con-stant punch speeds of 1, 10 and 100 mm s�1,using a saw-tooth waveform. The last speed isslightly greater than that of the tamping pins ina Bosch GKF 330 capsule-filling machine, andconsiderably higher than speeds encountered ina dosating piston machine such as the ZanasiLZ64.
These authors discovered that force trans-mission through the length of the plug was verydependent on plug length, as measured by theratio of force detected at the lower punch to thatapplied by the upper punch. This they attributedto the large difference in packing densitiesbetween the two ends of the plug, which, inturn, leads to poor axial force transmission.Nevertheless, they found that their data could befitted to the Shaxby–Evans equation (Shaxbyand Evans, 1923), which predicts that forceapplied by the upper punch decays exponen-tially towards the lower punch at a rate depen-dent on plug dimensions and a constant that issubstance specific. They also found that theHeckel (1961) and Kawakita (Kawakita andLudde, 1970/71) equations, which have been
applied to the study of tablet compression, applyequally well to the low-force environments ofplug formation. Punch speed had no effect onthe properties of plugs made from lactose, butwith microcrystalline cellulose and pregel-atinised starch, peak forces were at a maximumat a punch speed of 10 mm s�1, again confirmingfindings in tablet preparation. As plug lengthwas decreased, the forces that were generatedalso decreased through diminution of the totalresistance to compression.
The authors pointed out that, though theinformation gained in this study is more obvi-ously applicable to dosating disk machines,consolidation also occurs in dosating tubeequipment and the same low-force powderphysics could well apply to those machines too.
Instrumentation of dosating nozzlecapsule-filling machines
The first published reports of instrumented cap-sule-filling equipment of the dosating nozzletype were made by Cole and May (1972, 1975),using a Zanasi LZ64 machine. Foil strain gauges(120 �) were mounted on flat surfaces ground onto opposing sides of the dosator piston shank,and the wiring from the strain gauges was ledout through a hole drilled along the length of the piston to an amplifier and a recordingoscillograph. Compression forces were thusmeasured along the axis of the dosator piston.Since the dosator on this type of machine con-stantly rotates during operation, Cole and Maywere faced with a problem similar to thatencountered by users of instrumented rotarytablet presses, namely how to prevent twistingand rupture of the electrical cables leading toand from the transducers. They overcame this byfitting a planetary gear to the dosator head,which caused the dosator to make a completeclockwise rotation for each anticlockwise revolu-tion of the dosator support arm.
Using this device, Cole and May were for thefirst time able to record the compression andejection forces generated during plug formationand transfer for plugs made from lactose, micro-crystalline cellulose and pregelatinised starch.
214 Tablet and capsule machine instrumentation

These powders were used either unlubricated orafter the addition of 0.5% magnesium stearate.Cole and May noted that the low magnitude ofthe forces (typically 20–30 N) made measurementdifficult, since a high degree of signal amplifi-cation was needed, with attendant problemscaused by the signal-to-noise ratio. They reportedthat up to four regions could be distinguished onthe oscillograph trace:
1. A force, tens of newtons in magnitude, repre-sented the compression force generated as thedosator was pushed into the powder bed. It isworth noting that the compressive force in atablet press would be of the order of tens ofkilonewtons.
2. A force of a few newtons, termed the reten-tion force, was detected while the dosator wasbeing raised from the powder bed and pos-itioned over the empty capsule shell. Thepresence of a retention force proved that the plug remained in contact with the face ofthe piston during transfer.
3. An ejection force occurred when the plug waspushed out of the dosator into the capsuleshell. This force was very dependent on lubri-cation. For example, with unlubricated lac-tose, it could progressively rise to severalhundred newtons, but the addition of 0.5%magnesium stearate virtually abolished it.
4. A ‘drag force’ resisted the full retraction of thedosator piston after ejection of the plug wascomplete, indicating that the dostor rod wasin tension. The drag force, the magnitude ofwhich was also dependent on the degree oflubrication, was attributed to particles lodg-ing between the sides of the dosator rod andthe inner surface of the nozzle. It was mostmarked with pregelatinised starch, which hadthe smallest particle size of the powders stud-ied, and thus would be expected to showgreatest penetration beyond the tip of thedosator piston.
Shortly after the full publication of the pion-eering work of Cole and May, further workdescribing the instrumentation of a ZanasiLZ64 machine was published by Small andAugsburger (1977). This was the first part of amajor body of work in the field of instrumentedcapsule-filling machines to come from a group
led by Professor Augsburger at the University ofMaryland.
One of the aims of Small and Augsburger wasto modify the original equipment as little as poss-ible. Four foil strain gauges (120 �) were bondedto flattened areas of the middle piston shank togive a complete Wheatstone bridge. They facedthe same problem as Cole and May in getting theelectrical supply to the transducer and the signalsout while the dosator heads was rotating. Theysolved this by using a mercury contact swivelbetween the instrumentation and the amplifier.Signals were then fed into an oscilloscope or arecorder.
Small and Augsburger (1977) detected the com-pression, retention, ejection and drag forcesreported by Cole and May. Additionally, theyshowed that the compression event itself could bedivided into two stages. The first stage occurred asthe dosator plunged into the powder bed. Noforce was detected until the dosator had pen-etrated to a depth equal to the height of the pis-ton in the dosator. Then, a force built up as thedosator continued downwards, the maximumforce coinciding with maximum penetration.This they termed pre-compression. Then themain compression event took place, caused bydownward movement of the piston inside thedosator, the body of the dosator remainingstationary. The adjustable movement of the pis-ton is a feature of the Zanasi design but was notcommented upon by Cole and May in their work.
Retention forces were not observed with lubri-cated powders, and the authors surmised thatthis was because the lubricant had allowed theplug to slip inside the dosator, contact betweenthe plug and the piston tip thereby being lost.The negative force after ejection that beenreported by Cole and May was also noted bySmall and Augsburger, and attributed to thesame cause.
Thus from the work of Cole and May (1975)and Small and Augsburger (1977), the sequenceof changes in force that occur when a plug isformed in a dosating nozzle machine can beenvisaged (Figure 10.4). The instrumentationconsisted of force transducers mounted on thepiston shank. It must be borne in mind thatFigure 10.4 shows all the events that can occur.The magnitude of these events will depend on
The instrumentation of capsule-filling machinery 215

the formulation, especially the degree oflubrication, and some events might not bedetectable at all.
Point A. The dosating nozzle descends intothe powder bed. Powder enters the tube andcomes into contact with the piston tip,where a force is detected.
Point B. The dosating nozzle continues todescend, and hence an increasing force isdetected at the piston tip. There is no relativemovement between the piston tip and theend of the dosating nozzle. At B, the nozzledescends no further, and a constant force –the pre-compression force – is detected.
Points C–E. The piston now moves down thedosating nozzle, compressing the powder init. Force increases to a maximum at D, afterwhich it decreases rapidly as the dosator isdrawn out of the powder bed. However, forcedoes not drop to zero if the plug remains incontact with the piston tip (point E).
Between points E and F. The dosator assemblyis rotated so that the nozzle containing theplug is positioned over the body of an emptycapsule shell.
Points F and G. The piston moves down-wards, thereby ejecting the plug from thedosator nozzle. The magnitude of the
ejection force (point G) is very dependenton the concentration of lubricant in theformulation.
Point H. After the plug has been ejected,there is now no contact between it and thepiston tip. Hence force should fall to zero,but in fact it may fall below zero. This meansthat an extensive stress rather than a com-pressive stress is detected by the transducers.This has been termed the ‘drag force’ and isattributed to powder on the inside of thedosator tube preventing full retraction of thepiston.
In a subsequent study, Small and Augsburger(1978) examined the effects of powder bedheight, piston height, lubricant type, lubricantconcentration and compression force on theforce needed to eject the plug from the dosator,using three fillers (microcrystalline cellulose,pregelatinised starch and anhydrous lactose). Asmight be expected, ejection force increased withcompression force. However, ejection force wasalso directly proportional to powder bed heightand piston height. As these two factors areincreased, the plug length is also increased andhence there is a greater area of contact betweenthe sides of the plug and the inside of thedosator tube. It follows from this work that con-
216 Tablet and capsule machine instrumentation
Compressionforce
Precompressionforce
Retentionforce
Ejectionforce
Dragforce
Dosatorpiston
Dosatornozzle
Forc
e
A B C D E F G H
Time
Figure 10.4 Force–time profile from instrumented dosating nozzle capsule-filling equipment. See text for details.

sistency in both powder bed height and pistonsettings is necessary for reproducible plugproperties.
Ejection force minima were achieved with 1%magnesium stearate for anhydrous lactose, 0.5%for microcrystalline cellulose and 0.1% for pre-gelatinised starch. It is interesting to note that,despite the much lower forces used for compres-sion, the ejection forces were comparable tothose encountered in tablet presses and therequired levels of lubricant were very similar tothose needed for tablet formulations containingthese three diluents.
Properties of the powder plug such as physicalstrength and release characteristics that aredependent on the compression force were inves-tigated by Mehta and Augsburger (1981a), usingthe instrumented machine described above.They studied the effect of magnesium stearateconcentration on plug strength and dissolutionof active ingredient (hydrochlorothiazide) at aconstant compressing force of 15 kg (approxi-mately 150 N). They measured the physicalstrength of plugs by a three-point bending testand found that this could be correlated with dis-solution rate. With microcrystalline cellulose,the strength of the plugs decreased markedly asthe magnesium stearate concentration wasincreased. A similar reduction has been notedwith microcrystalline cellulose tablets lubricatedwith magnesium stearate (Bolhuis and Hölzer,1996).
The effect on release characteristics was morecomplex. At low lubricant concentrations, thereduction in physical strength of the plugspermitted easier water penetration, but as thelevel of lubricant was raised, increased hydro-phobicity inhibited drug release. With lactose,strength was not significantly reduced, and onlythe retarding effect on dissolution was noted.This too has parallels in tablet formulation.
The instrumented Zanasi LZ64 filling appar-atus was modified by Botzolakis et al. (1982),who replaced the potentially hazardous mercuryswivel contact with slip-rings, an approach thathad been used with rotary tablet presses byRidgway Watt and Rue (1979). They studied theeffect of disintegrating agents on capsule fillscontaining hydrochlorothiazide and paracet-amol (acetaminophen) and pointed out that the
capsules had been hand-filled in many previousstudies on the release of active ingredient fromhard-shell capsules, with a resulting high poros-ity. It was therefore, not surprising that disinte-grating agents appeared to have little effect,since there was no structure for them to pressagainst, and hence wettability and water pen-etration would be the more important factors.Botzolakis et al. (1982) were able to keep pistonheight, powder bed height and compressionforce constant while they examined the effectsof a range of disintegrating agents on capsulefills made from dicalcium phosphate dihydratelubricated with magnesium stearate. All disinte-grating agents improved the release of activeingredient, with cross-linked sodium carboxy-methyl cellulose being the most effective andcross-linked polyvinylpyrollidone being the leasteffective.
In a more elaborate study, Botzolakis andAugsburger (1984) used hydrochlorothiazidemixed with either dicalcium phosphate dihy-drate or anhydrous lactose in a three-factor, two-level factorial design, the three factors beingdisintegrant concentration, lubricant concen-tration and compression force. The responseswere physical strength, disintegration time anddissolution rate. They found that disintegrationtimes did not always have the same rank order asdissolution rates, but that all three factors andtheir interactions had significant effects, themagnitude of which differed according to thesolubility of the filler in water.
Fitting LVDTs to dosating nozzle capsule-filling equipment was first reported by Mehtaand Augsburger (1980). They monitored move-ment of the instrumented piston described bySmall and Augsburger (1977), a task complicatedby the rotation of the piston during operation.This was overcome by threading a spring-loadedrod on to the core of the LVDT, which, in turn,was kept in contact with a bracket fixed to thedosator housing. Cables for all transducers wereconnected to the mercury swivel assemblydescribed above.
The force and displacement traces obtained byMehta and Augsburger (1980) confirmed sugges-tions made earlier. When the dosator enters thepowder bed, pre-compression force developswithout piston movement. After the dosator has
The instrumentation of capsule-filling machinery 217

descended fully, the piston moves downwards,exerting the compression force. Mehta andAugsburger reported that the maximum com-pression force preceded the point of maximumpiston displacement by approximately 40 msand attributed this to the action of the overloadspring. However, a similar non-coincidence offorce and displacement maxima has been notedin the force–displacement curve for tablets andthis has been linked to viscoelastic behaviour ofthe powder particles (Ho and Jones, 1988). At theejection stage, downward movement of the pis-ton results in a rise in the force detected at thepiston tip, and this rapidly falls away as the fric-tional forces holding the plug in the nozzle areovercome. Though the authors signified theirintention to calculate work expenditure duringplug formation by calculating areas under the force–displacement curves (Mehta andAugsburger, 1981b), few results seem to havebeen published. Since forces are so low, the workexpended will consequently also be low. Theaccuracy of the results would be highly depen-dent on accurate measurement of displacementand this would undoubtedly be complicated bythe presence of the return spring in the dosator.
Teams of workers other than Augsburger’sgroup have fitted instrumentation to dosatingnozzle capsule-filling equipment. For example,Mony et al. (1977) fitted piezoelectric load wash-ers to the ends of the pistons of a Zanasi RV59machine. With this arrangement, a force canonly be detected during the compression andejection events when the piston is beingdepressed and so pre-compression, retention andresidual forces cannot be studied. These workersinvestigated the effect of magnesium stearateand talc on compression and ejection forces. Asimilar study was carried out by Maury et al.(1986), using load washers mounted not on thepistons but on the compression and ejectionplatens. Again only compression and ejectioncan be studied. Rowley et al. (1983) attached aload washer to the ejection knob of a ZanasiLZ64, and this arrangement can only be used tostudy the ejection event.
An instrumented Zanasi LZ64 was used byHauer et al. (1993) to examine the formulationvariables of a mixture of microcrystalline cellu-lose – a viscoelastic material – and anhydrous
lactose – a brittle material. They found that thebetter the powder flow the more variable the fillweight, as the mixture was more difficult to den-sify. Magnesium stearate proved to be a superiorlubricant to stearic acid, but the concentrationwas shown to be critical in each case.
The simulation of dosating nozzle capsule-filling equipment
An important development in capsule machineinstrumentation came with the publication byJolliffe et al. in 1982 of details of the construc-tion of a dosating tube simulator based on anmG2 model G36 machine. The problems ofconnecting electrical wiring to a rotating com-ponent have been discussed above. In conven-tional mG2 machines, the filling turret rotatesand the powder hopper beneath it is stationary.In this simulator, these roles were reversed sothat the turret to which the transducers wereconnected was stationary and the powder hop-per rotated around the dosator. There was norelative movement between the feed tray and thenozzle at the moment when the dosator enteredthe powder bed. Four semiconductor straingauges were mounted on the dosator piston in aWheatstone bridge configuration to measurestress, and displacement transducers monitoredthe vertical movements of the piston and thedosator nozzle. In this way, the movement of thewhole dosator and the relative movement ofdosator and piston could be followed. A forcecould be applied in two ways. A pre-compressionforce was exerted by adjusting the height of thepiston in the nozzle, and this was found to beparticularly useful to consolidate beds of lowbulk density. Compression force was exerted bymovement of the piston when the nozzle was inthe powder bed and was altered by raising orlowering the compression cam, the precise posi-tion of which was recorded by the piston move-ment transducer.
A considerable body of work carried out onthis simulator has been published. Newton andhis colleagues were particularly interested inelucidating those factors that contributed touniformity of plug weight. They found that finelactose particles gave acceptable uniformity over
218 Tablet and capsule machine instrumentation
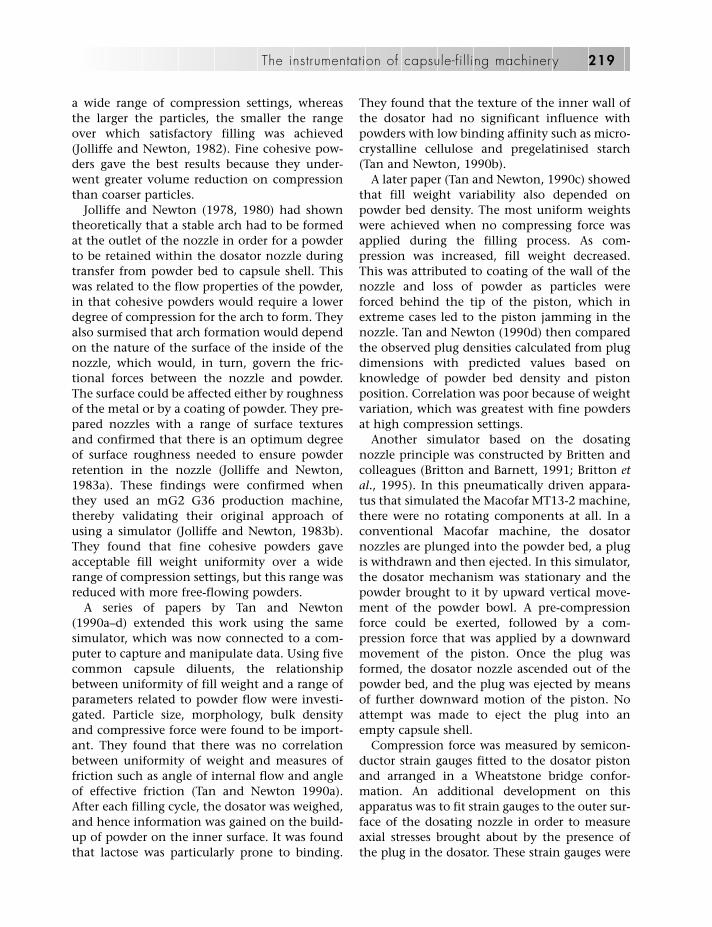
a wide range of compression settings, whereasthe larger the particles, the smaller the rangeover which satisfactory filling was achieved(Jolliffe and Newton, 1982). Fine cohesive pow-ders gave the best results because they under-went greater volume reduction on compressionthan coarser particles.
Jolliffe and Newton (1978, 1980) had showntheoretically that a stable arch had to be formedat the outlet of the nozzle in order for a powderto be retained within the dosator nozzle duringtransfer from powder bed to capsule shell. Thiswas related to the flow properties of the powder,in that cohesive powders would require a lowerdegree of compression for the arch to form. Theyalso surmised that arch formation would dependon the nature of the surface of the inside of thenozzle, which would, in turn, govern the fric-tional forces between the nozzle and powder.The surface could be affected either by roughnessof the metal or by a coating of powder. They pre-pared nozzles with a range of surface texturesand confirmed that there is an optimum degreeof surface roughness needed to ensure powderretention in the nozzle (Jolliffe and Newton,1983a). These findings were confirmed whenthey used an mG2 G36 production machine,thereby validating their original approach ofusing a simulator (Jolliffe and Newton, 1983b).They found that fine cohesive powders gaveacceptable fill weight uniformity over a widerange of compression settings, but this range wasreduced with more free-flowing powders.
A series of papers by Tan and Newton(1990a–d) extended this work using the samesimulator, which was now connected to a com-puter to capture and manipulate data. Using fivecommon capsule diluents, the relationshipbetween uniformity of fill weight and a range ofparameters related to powder flow were investi-gated. Particle size, morphology, bulk densityand compressive force were found to be import-ant. They found that there was no correlationbetween uniformity of weight and measures offriction such as angle of internal flow and angleof effective friction (Tan and Newton 1990a).After each filling cycle, the dosator was weighed,and hence information was gained on the build-up of powder on the inner surface. It was foundthat lactose was particularly prone to binding.
They found that the texture of the inner wall ofthe dosator had no significant influence withpowders with low binding affinity such as micro-crystalline cellulose and pregelatinised starch(Tan and Newton, 1990b).
A later paper (Tan and Newton, 1990c) showedthat fill weight variability also depended onpowder bed density. The most uniform weightswere achieved when no compressing force wasapplied during the filling process. As com-pression was increased, fill weight decreased.This was attributed to coating of the wall of thenozzle and loss of powder as particles wereforced behind the tip of the piston, which inextreme cases led to the piston jamming in thenozzle. Tan and Newton (1990d) then comparedthe observed plug densities calculated from plugdimensions with predicted values based onknowledge of powder bed density and pistonposition. Correlation was poor because of weightvariation, which was greatest with fine powdersat high compression settings.
Another simulator based on the dosatingnozzle principle was constructed by Britten andcolleagues (Britton and Barnett, 1991; Britton etal., 1995). In this pneumatically driven appara-tus that simulated the Macofar MT13-2 machine,there were no rotating components at all. In aconventional Macofar machine, the dosatornozzles are plunged into the powder bed, a plugis withdrawn and then ejected. In this simulator,the dosator mechanism was stationary and thepowder brought to it by upward vertical move-ment of the powder bowl. A pre-compressionforce could be exerted, followed by a com-pression force that was applied by a downwardmovement of the piston. Once the plug wasformed, the dosator nozzle ascended out of thepowder bed, and the plug was ejected by meansof further downward motion of the piston. Noattempt was made to eject the plug into anempty capsule shell.
Compression force was measured by semicon-ductor strain gauges fitted to the dosator pistonand arranged in a Wheatstone bridge confor-mation. An additional development on thisapparatus was to fit strain gauges to the outer sur-face of the dosating nozzle in order to measureaxial stresses brought about by the presence ofthe plug in the dosator. These strain gauges were
The instrumentation of capsule-filling machinery 219
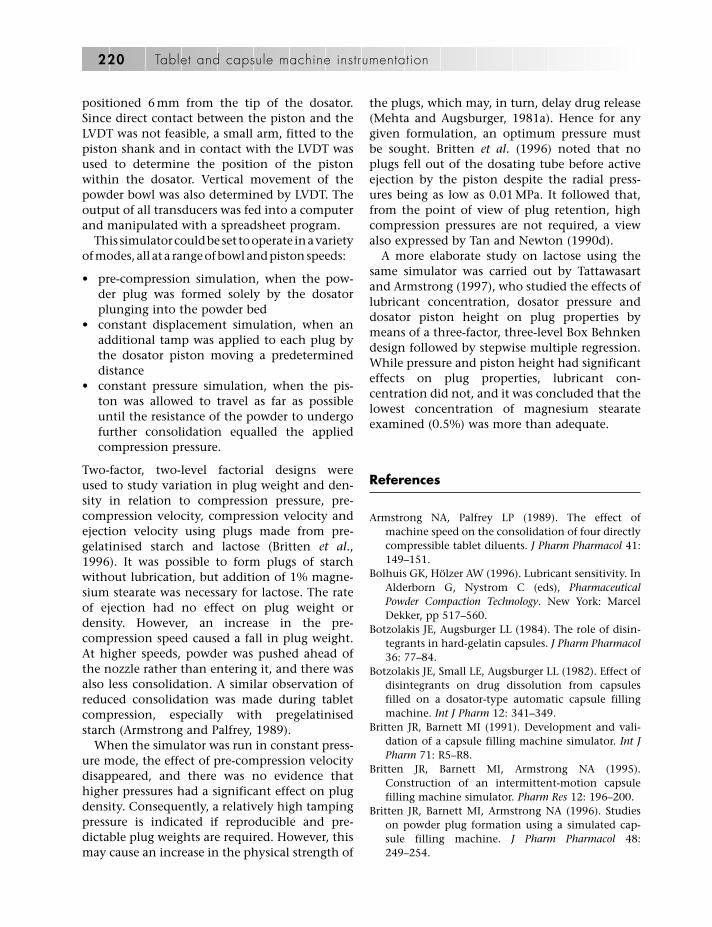
positioned 6 mm from the tip of the dosator.Since direct contact between the piston and theLVDT was not feasible, a small arm, fitted to thepiston shank and in contact with the LVDT wasused to determine the position of the pistonwithin the dosator. Vertical movement of thepowder bowl was also determined by LVDT. Theoutput of all transducers was fed into a computerand manipulated with a spreadsheet program.
This simulatorcouldbeset tooperate inavarietyofmodes, all at a rangeofbowlandpistonspeeds:
• pre-compression simulation, when the pow-der plug was formed solely by the dosatorplunging into the powder bed
• constant displacement simulation, when anadditional tamp was applied to each plug bythe dosator piston moving a predetermineddistance
• constant pressure simulation, when the pis-ton was allowed to travel as far as possibleuntil the resistance of the powder to undergofurther consolidation equalled the appliedcompression pressure.
Two-factor, two-level factorial designs were used to study variation in plug weight and den-sity in relation to compression pressure, pre-compression velocity, compression velocity andejection velocity using plugs made from pre-gelatinised starch and lactose (Britten et al.,1996). It was possible to form plugs of starchwithout lubrication, but addition of 1% magne-sium stearate was necessary for lactose. The rateof ejection had no effect on plug weight ordensity. However, an increase in the pre-compression speed caused a fall in plug weight.At higher speeds, powder was pushed ahead ofthe nozzle rather than entering it, and there wasalso less consolidation. A similar observation ofreduced consolidation was made during tabletcompression, especially with pregelatinisedstarch (Armstrong and Palfrey, 1989).
When the simulator was run in constant press-ure mode, the effect of pre-compression velocitydisappeared, and there was no evidence thathigher pressures had a significant effect on plugdensity. Consequently, a relatively high tampingpressure is indicated if reproducible and pre-dictable plug weights are required. However, thismay cause an increase in the physical strength of
the plugs, which may, in turn, delay drug release(Mehta and Augsburger, 1981a). Hence for anygiven formulation, an optimum pressure mustbe sought. Britten et al. (1996) noted that noplugs fell out of the dosating tube before activeejection by the piston despite the radial press-ures being as low as 0.01 MPa. It followed that,from the point of view of plug retention, highcompression pressures are not required, a viewalso expressed by Tan and Newton (1990d).
A more elaborate study on lactose using thesame simulator was carried out by Tattawasartand Armstrong (1997), who studied the effects oflubricant concentration, dosator pressure anddosator piston height on plug properties bymeans of a three-factor, three-level Box Behnkendesign followed by stepwise multiple regression.While pressure and piston height had significanteffects on plug properties, lubricant con-centration did not, and it was concluded that thelowest concentration of magnesium stearateexamined (0.5%) was more than adequate.
References
Armstrong NA, Palfrey LP (1989). The effect ofmachine speed on the consolidation of four directlycompressible tablet diluents. J Pharm Pharmacol 41:149–151.
Bolhuis GK, Hölzer AW (1996). Lubricant sensitivity. InAlderborn G, Nystrom C (eds), PharmaceuticalPowder Compaction Technology. New York: MarcelDekker, pp 517–560.
Botzolakis JE, Augsburger LL (1984). The role of disin-tegrants in hard-gelatin capsules. J Pharm Pharmacol36: 77–84.
Botzolakis JE, Small LE, Augsburger LL (1982). Effect ofdisintegrants on drug dissolution from capsulesfilled on a dosator-type automatic capsule fillingmachine. Int J Pharm 12: 341–349.
Britten JR, Barnett MI (1991). Development and vali-dation of a capsule filling machine simulator. Int JPharm 71: R5–R8.
Britten JR, Barnett MI, Armstrong NA (1995).Construction of an intermittent-motion capsulefilling machine simulator. Pharm Res 12: 196–200.
Britten JR, Barnett MI, Armstrong NA (1996). Studieson powder plug formation using a simulated cap-sule filling machine. J Pharm Pharmacol 48:249–254.
220 Tablet and capsule machine instrumentation

Cole GC, May G (1972). Instrumentation of a hard shellencapsulation machine. J Pharm Pharmacol 24: 122P.
Cole GC, May G (1975). The instrumentation of aZanasi LZ/64 capsule filling machine. J PharmPharmacol 27: 353–358.
Cropp JW, Augsburger LL, Marshall K (1991).Simultaneous monitoring of tamping force and pindisplacement (F–D) on an Höfliger-Karg capsulefilling machine. Int. J. Pharm 71: 127–136.
Davar N, Shah R, Pope DG, Augsburger LL (1997). Theselection of a dosing disk on a Höfliger-Kargcapsule-filling machine. Pharm Technol 21: 32–48.
de Blaey CJ, Polderman J (1970). Compression ofpharmaceuticals. 1: The quantitative interpretationof force–displacement curves. Pharm Weekblad 105:241–250.
Hauer B, Remmele T, Züger O, Sucker H (1993).Rational development and optimisation of capsuleformulations with an instrumented dosator capsulefilling machine. 1: Instrumentation and influenceof the filling material and the machine parameters.Pharm Ind 55: 509–515.
Heckel RW (1961). Density-pressure relationships inpowder compression. Trans Metal Soc AIME 221:671–675.
Heda PK, Muller FX, Augsburger LL (1999). Capsule fill-ing machine simulation. 1: Low force powder com-paction physics relevant to plug formation. PharmDev Tech 4: 209–219.
Ho AYK, Jones TM (1988). Punch travel beyond peakforce during tablet compression. J Pharm Pharmacol40: 75P.
Jolliffe IG, Newton JM (1978). Powder retention withina capsule dosator nozzle. J Pharm Pharmacol 30: 41P.
Jolliffe IG, Newton JM (1980). The effect of powdercoating on capsule filling with a dosator nozzle.Acta Pharm Technol 26: 324–326.
Jolliffe IG, Newton JM (1982). An investigation of therelationship between particle size and compressionduring capsule filling in an mG2 simulator. J PharmPharmacol 34: 415–419.
Jolliffe IG, Newton JM (1983a). The effect of dosatorwall texture on capsule filling with the mG2simulator. J Pharm Pharmacol 35: 7–11.
Jolliffe IG, Newton JM (1983b). Capsule filling studiesusing an mG2 production machine. J PharmPharmacol 35: 74–78.
Jolliffe IG, Newton JM, Cooper D (1982). The designand use of an instrumented mG2 capsule fillingmachine simulator. J Pharm Pharmacol 34: 230–235.
Jones BE (1988). Powder formulations for capsulefilling. Mfg Chem 59: 28–30, 33.
Jones BE (1998). New thoughts on capsule filling. STPPharmacol 3: 777–783.
Jones BE (2001). The filling of powders into two-piecehard capsules. Int J Pharm 227: 5–26.
Kawakita K, Ludde KH (1970/71). Some considerationson powder compression equations. Powder Technol4: 61–68.
Lerk CF, Lagas M, Lie-A-Huen L et al. (1979). In vitroand in vivo availability of hydrophilised phenytoinfrom capsules. J Pharm Sci 68: 634–638.
Maury M, Heraud P, Etienne A et al. (1986).Measurement of compression during the filling ofcapsules. In Proceedings of the 4th InternationalConference on Pharmaceutical Technology, Paris, pp384–388.
Mehta AM, Augsburger LL (1980). Simultaneousmeasurement of force and displacement in anautomatic capsule filling machine. Int J Pharm 4:347–351.
Mehta AM, Augsburger LL (1981a). A preliminarystudy of the effect of slug hardness on drug dissol-ution from hard gelatin capsules filled on an auto-matic capsule-filling machine. Int J Pharm 7:327–334.
Mehta AM, Augsburger LL (1981b). Quantitative evalu-ation of force–displacement curves in an automaticcapsule-filling operation. In 30th National Meeting ofthe American Association of Pharmaceutical Scientists,St Louis.
Mony C, Sambeat C, Cousins C (1977). The measure-ment of compression during the formulation andfilling of capsules. In Proceedings of the 1stInternational Conference on PharmaceuticalTechnology, Paris, pp 98–108.
Podczeck F (2000). The development of an instru-mented tamp-filling capsule machine. 1:Instrumentation of a Bosch GKF 400S machine andfeasibility study. Eur J Pharm Sci 10: 267–274.
Podczeck F (2001). The development of an instru-mented tamp-filling capsule machine. 2:Investigations of plug development and tampingpressure at different filling stations. Eur J Pharm Sci12: 515–521.
Podczeck F (2004). Dry filling of hard capsules. InPodczeck F, Jones BE (eds), Pharmaceutical Capsules2nd edn. London: Pharmaceutical Press, 119–138.
Podczeck F, Newton JM (1999). Powder filling intohard gelatine capsules on a tamp filling machine.Int J Pharm 185: 237–254.
Ridgway Watt P, Rue PJ (1979). The design and con-struction of a fully instrumented tablet machine. InProceedings of the International Conference ofPharmacy Technology and Product Manufacture,Copenhagen.
Rowley D, Hendry R, Ward MD, Timmins P (1983). Theinstrumentation of an automatic capsule filling
The instrumentation of capsule-filling machinery 221

machine for formulation design studies. InProceedings of the 3rd International Conference onPharmaceutical Technology, Paris, pp 287–291.
Shah KB, Augsburger LL, Small LE, Polli GP (1983).Instrumentation of a dosing disk automatic capsulefilling machine. Pharm Tech 7: 42–54.
Shah KB, Augsburger LL, Marshall K (1986). An inves-tigation of some factors influencing plug formationand fill weight in a disk-type automatic capsulefilling machine. J Pharm Sci 75: 291–296.
Shah KB, Augsburger LL, Marshall K (1987). Multipletamping effects on drug dissolution from capsulesfilled on a dosing disk type automatic capsule fillingmachine. J Pharm Sci 76: 639–645.
Shaxby JH, Evans JC (1923). The variation of pressurewith depth in columns of powders. Trans FaradaySoc 19: 60–72.
Small LE, Augsburger LL (1977). Instrumentation of anautomatic capsule-filling machine. J Pharm Sci 66:504–509.
Small LE, Augsburger LL (1978). Aspects of the lubri-cation requirements for an automatic capsule fillingmachine. Drug Dev Ind Pharm 4: 345–372.
Tan SB, Newton JM (1990a). Powder flowability as anindicator of capsule filling performance. Int J Pharm61: 145–155.
Tan SB, Newton JM (1990b). Capsule filling perform-ance of powders with dosator nozzles of differentwall texture. Int J Pharm 66: 207–211.
Tan SB, Newton JM (1990c). Influence of compressionsetting ratio on capsule fill weight and weightvariability. Int J Pharm 66: 273–282.
Tan SB, Newton JM (1990d). Observed and expectedpowder plug densities obtained by a capsule dosatornozzle system. Int J Pharm 66: 283–288.
Tattawasart A, Armstrong NA (1997). The formation oflactose plugs for hard shell capsule fills. Pharm DevTechnol 2: 335–343.
Further reading
Augsburger LL (1988). Instrumented capsule fillingmachines. Methodology and application to productdevelopment. STP Pharma 4: 116–122.
Hardy IJ, Fitzpatrick S, Booth SW (2003). Rationaldesign of powder formulations for tamp fillingprocesses. J Pharm Pharmacol 55: 1593–1599.
222 Tablet and capsule machine instrumentation
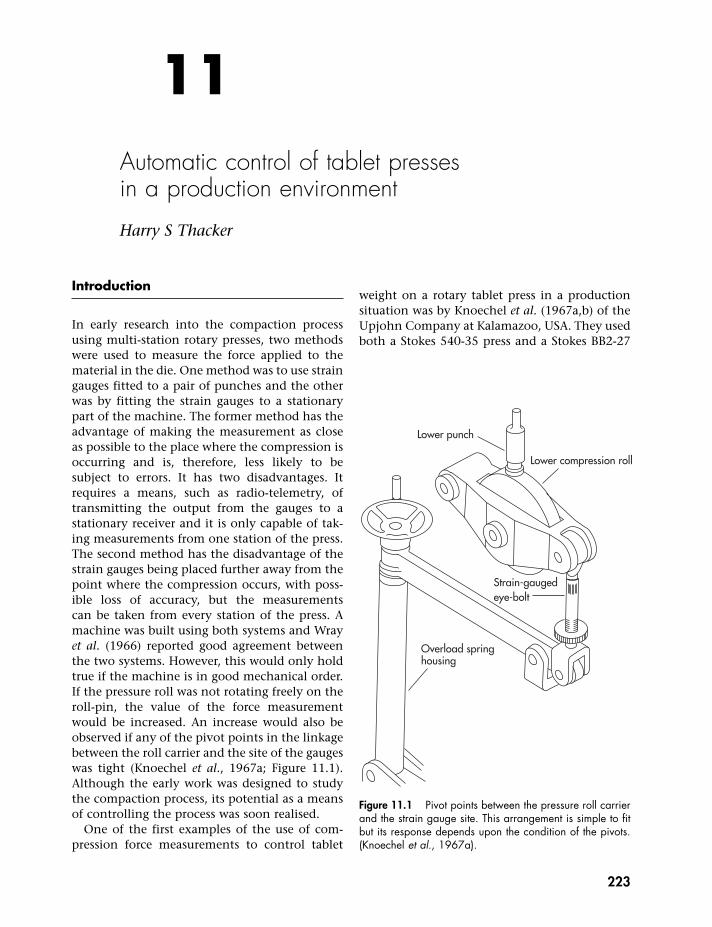
Introduction
In early research into the compaction processusing multi-station rotary presses, two methodswere used to measure the force applied to thematerial in the die. One method was to use straingauges fitted to a pair of punches and the otherwas by fitting the strain gauges to a stationarypart of the machine. The former method has theadvantage of making the measurement as closeas possible to the place where the compression isoccurring and is, therefore, less likely to besubject to errors. It has two disadvantages. Itrequires a means, such as radio-telemetry, oftransmitting the output from the gauges to astationary receiver and it is only capable of tak-ing measurements from one station of the press.The second method has the disadvantage of thestrain gauges being placed further away from thepoint where the compression occurs, with poss-ible loss of accuracy, but the measurements can be taken from every station of the press. Amachine was built using both systems and Wrayet al. (1966) reported good agreement betweenthe two systems. However, this would only holdtrue if the machine is in good mechanical order.If the pressure roll was not rotating freely on theroll-pin, the value of the force measurementwould be increased. An increase would also beobserved if any of the pivot points in the linkagebetween the roll carrier and the site of the gaugeswas tight (Knoechel et al., 1967a; Figure 11.1).Although the early work was designed to studythe compaction process, its potential as a meansof controlling the process was soon realised.
One of the first examples of the use of com-pression force measurements to control tablet
weight on a rotary tablet press in a productionsituation was by Knoechel et al. (1967a,b) of theUpjohn Company at Kalamazoo, USA. They usedboth a Stokes 540-35 press and a Stokes BB2-27
11Automatic control of tablet presses in a production environment
Harry S Thacker
223
Lower punch
Lower compression roll
Strain-gaugedeye-bolt
Overload springhousing
Figure 11.1 Pivot points between the pressure roll carrierand the strain gauge site. This arrangement is simple to fitbut its response depends upon the condition of the pivots.(Knoechel et al., 1967a).

press, both fitted with compaction force measur-ing systems. The strain gauges were fitted toparts of the overload systems of the press and thesignal obtained was displayed on an oscillo-scope. By observing the trace on the oscilloscopeand adjusting the die fill accordingly, the pressoperators obtained improved tablet weight con-sistency when compared with the conventionalsystem of sampling and weighing at fixed timeintervals. It was a comparatively short step fromthis system to the development of an automaticmethod for controlling tablet weight.
The force–weight relationship
If the force used to make a tablet is to be the basisof a system for controlling the tablet weight, therelationship between compression force andtablet weight must be considered. The force usedto compress material into a tablet is proportionalto the density of the tablet. For the variations inthat force to be proportional to the variations intablet weight, the volume of each tablet must beconstant. This is not normally true for tabletsmade on a conventional tablet press for thefollowing reasons.
1. The punches are not all of the same length,and the varying lengths will give rise to vari-ations in the thickness of the tablet. Even fora new set of tooling, the lengths will varywithin manufacturing tolerances. This varia-tion will increase with use, as the punches areunlikely to wear at the same rate. However,the amount of wear that will occur over thetime needed to produce a batch of tablets isnot normally significant unless the materialbeing compressed is highly abrasive.
2. In the case of punches that are not flat faced,the geometry of the punch tip will vary forthe same reasons as those given for thevariation in punch lengths.
3. The size of the die bore and consequently thediameter of the tablets will vary for the samereasons as the variations in the punches.
4. The pressure rolls on the machine are unlikelyto be perfectly concentric and this will affectthe thickness of the tablets. The thickness will
vary depending upon which part of the roll is in contact with the punch head when thetablet is compressed. In addition, wear in thebearings in the centre of the roll will alter the effective radius of the roll, giving furthervariations in tablet thickness.
These factors only vary within fixed limits. Thepunch lengths and the other factors are not con-tinually changing, at least not during the pro-duction of a single batch of tablets. However,this does indicate that if machine is fitted with a tablet weight control system based on com-paction force, it is good practice to check thetooling for wear after each batch of tablets isproduced and to ensure that the machine is ingood mechanical condition.
A pair of punches does not move from onedie to another and, therefore, all possible com-binations of punch length, tip geometry anddie diameter will have been encountered inone revolution of the turret. After a few furtherrevolutions, all combinations of the longestand shortest punches with the minimum andmaximum radius of the pressure roll will alsohave occurred. This means that even thoughthe forces used to compress individual tabletsare not necessarily proportional to the weightof the tablet, the mean compaction force isproportional to the average tablet weight.
When the tablet is at the point of compressionand the force to compress it is measured, theamount of material in the die and hence thetablet weight is already fixed. This is another rea-son why it is not possible to control the weightof individual tablets by force measurements.However, adjusting the die fill for subsequenttablets in response to changes in the mean com-paction force can control the mean tabletweight, as was shown by Knoechel et al. (1977b).
Other factors that affect the force–weightrelationship are tight punches (i.e. where there isexcessive friction between the punch and itsguide) and changes in the bulk density of thefeed material. These should also be taken intoaccount when a tablet weight-control system isin use. Excessive friction between the punch andits guide can result from insufficient lubricationor from fine particles of the material being com-pressed when entering the punch guide and mix-
224 Tablet and capsule machine instrumentation

ing with the lubricant. This increased frictionalforce will be measured in addition to the com-pression force, thereby giving a false reading. Ina more sophisticated control system, the fric-tional force on the punch can be monitored andthe press stopped when friction rises above a pre-set value. Variations in the bulk density of thefeed material are quite rare, but where material isbeing fed from a bulk hopper, slight vibration ofthe hopper can cause segregation of its contentswith the smaller particles percolating to the bot-tom. As the hopper empties, the mixture beingfed to the press contains a greater proportion ofcoarse particles and has a lower bulk density.Modern control systems can normally cope withthis problem, but it can be observed that thecontrol system gradually increases the die filltowards the end of the batch to maintain tabletweight.
A further factor that needs careful attention isthe overload system that is fitted to most rotarytablet presses. It is designed to protect thepunches from being used at forces greater thantheir design will accommodate. The overloadsystem is normally set at or below the maximumallowable force for the set of tooling being used,so that in the event of the die containing anexcess of material, resulting in an abnormallyhigh compression force, the tooling will not bedamaged by the machine attempting to com-press it to the set thickness. Overload systems forrotary presses are shown in Figures 11.1 and11.2. If the press is operating with compressionforces very near to overload limit, it is possiblethat system will not be rigid enough to allowaccurate force measurements to be obtained andthe control system will not function correctly.
All the above factors are important in ensuringthat the control system operates efficiently, butmany modern computer-based systems are ableto monitor these factors and either report vari-ations or stop the press if they are likely to resultin loss of control.
Monitoring systems
The simplest form of control system is one thatmonitors the compaction force, indicates the
variations in the mean compaction force andstops the machine if the mean force exceedseither the upper or the lower preset limit. Asthere is no direct correlation between the com-paction force and the tablet weight, all controlsystems based on force measurement need to beset up by first adjusting the machine to maketablets of the correct weight, thickness and hard-ness or crushing strength. When these par-ameters are within the required limits, the meanforce can be set. The unit will then indicate anyvariation in the mean force. On early electro-mechanical control systems, this was by meansof a centre zero meter. The meter was set to zerowhen the press was making tablets of the correctweight, thickness and crushing strength, andany increase or decrease in the mean com-paction force was indicated by the pointer onthe meter moving away from its zero position.By adjusting the die fill until the meter againindicated zero, the operator was able to achievea tablet weight consistency that was better thanthat achieved with the normal method ofsampling and weighing tablets at fixed intervals.
One reason for the success of these simple sys-tems was that small increases in the weight ofthe tablets give rise to quite large increases in thecompaction force. The ratio of the increase inforce to the increase in tablet weight will varyfrom one formulation to another, but a 1%increase in tablet weight can typically give rise toa 10% increase in compression force.
Control systems
Linking a motor to the tablet weight adjustmentenabled simple automatic control systems to bedeveloped. These used a feedback loop to adjustthe die fill in order to maintain the compressionforce within a set range. As computer controlgradually replaced electromechanical control, itbecame possible to display the values of theforces on a screen, and a better system of controlbased on the individual force measurementscould then be devised. Although the forcemeasurements from individual tablets do notrelate directly to individual tablet weights, theindividual measurements can be used to give
Automatic control of tablet presses in a production environment 225

better control than that obtained from a systemthat simply returns the mean force to a fixedvalue every time it deviates. A more rapidlyreacting method of control is shown in Figure11.3. The screen shows a graph where the crossesrepresent the peak force from individual tablets.The lines show the required mean force, the con-trol limits and the reject limits. The system is setby arranging the control limits so that approxi-mately an equal number of tablets exceed theupper and the lower limit. Any change in themean force will cause more tablets to give rise toforces exceeding one limit and to fewer exceed-ing the other. The control system simply countsthe number of tablets exceeding each limit andadjusts the die fill to restore the balance. This
system keeps the mean force at the required levelrather than between limits.
Reject systems
It is possible to reject an individual tablet if theforce required to compress it is abnormally highor low. This does not guarantee that all rejectedtablets are outside a particular weight limit.However, an abnormally high or low com-paction force means that the weight of thattablet is at least suspect and it could be rejectedon those grounds. The limits could be set toguarantee that all accepted tablets were within
226 Tablet and capsule machine instrumentation
Depth of fill
Open to atmosphere(no pressure)
Air under pressure
Accumulator
1. Overload cyclinder2. Overload microswitch
Over load force gaugeand warning lamp
3. Strain gauged tie bar
36 KN
Tablet thickness
1
2
3
Presscontrol system
Lower roll carrier assembly
Upper roll carrier assembly
Figure 11.2 The overload system of a rotary press. Manesty control system.

the set weight limits but this, in turn, wouldmean that some of the rejected tablets may alsobe of acceptable weight. If the product were oflow value, the rejected tablets could be dis-carded; if the product had a high value, then therejects could be weighed individually and thetablets that were within specification recovered.
As the compaction force is measured when thetablet is in the die at the compression position, adevice is required that ‘remembers’ the suspecttablet and operates a reject mechanism whenthat tablet reaches the ejection position. A rejectsystem of this type can also be used to takesample tablets for weighing.
Weighing systems
As the relationship between compaction forceand tablet weight is not perfect, a system basedon weighing tablets as well as measuring com-paction force is likely to be more reliable. It isnot possible with present technology to weighevery tablet. However, a system that weighssample tablets, calculates the mean tabletweight and uses this information to adjust theforce-measuring system to compensate for vari-
ations in the force–weight relationship hasadvantages over a system based on forcemeasurements alone. In this method, everytablet is checked by force measurement, sus-pect tablets are rejected and samples of thegood tablets are checked for weight. Such a sys-tem was made possible by the development ofa high-speed reject gate that can remove oneknown tablet from a machine producing thou-sands of tablets per minute and also with theintroduction of automatic balances.
Various sampling routines can be used, butone in which samples are successively takenfrom each station ensures that every station ismonitored. The fastest rate at which tablets canbe weighed occurs when the balance calls foranother tablet as soon as it has stabilised andrecorded the weight of the previous tablet. Usingthis method continuously would remove toomany tablets from the batch.
Most pharmacopoeias have essentially thesame standard for uniformity of tablet weight. Asample of 20 tablets is taken; the tablets areweighed individually and the mean weight is cal-culated. Two limits are set. The weight of notmore than 2 tablets in a sample of 20 is permit-ted to deviate from the mean by a given per-centage, the size of which is governed by the
Automatic control of tablet presses in a production environment 227
Figure 11.3 A control system for monitoring the weight of individual tablets. X, peak force from individual tablets; upperand lower limits, control limits; outer limits, reject limits.

mean weight. This is often termed the ‘A’ limit.No tablets are permitted to deviate in weightfrom the mean by more than double thispercentage. This is the ‘B’ limit.
Individual companies will often set more strin-gent in-house limits than those published inpharmacopoeias. In these, the permitted per-centage deviations from the mean weight aresmaller, but the overall structure of the test is thesame.
One method of automatic sampling weighs 20tablets from successive stations and then waitsfor a fixed period before weighing the next groupof 20. The weights of the 20 tablets can be thenbe checked against the relevant ‘A’ and ‘B’ limits.If any tablet is found to be outside the ‘B’ limit,or more than two tablets are outside the ‘A’ limit,the press is stopped. If one or two tablets are out-side the ‘A’ limits, the press is allowed to con-tinue but the time, station number and thetablet weight are reported. This system can alsocollect weight data for batch records.
Because the tablets forming the sample are sep-arated from the main batch as each individualtablet leaves the die, they will not pass throughthe tablet-dedusting system on their route to thebalance. To obtain an accurate tablet weight, thesystem should incorporate some form of dedust-ing for the individual tablet, this being situatedbetween the press and the balance.
The display for the weighing system normallyshows the weights of tablets being producedstation by station. This display can be eithergraphic or numeric. In the graphical form, thedisplay shows station number on the x axis andweight on the y axis (Figure 11.4), and is similarto the force display. Each tablet that has beenweighed is represented by a dot and the dotsgradually build up into a line for each station.The length of the line represents the range oftablet weights being produced by a particularstation of the press. An individual dot appearingon the line represents the weight of the lasttablet sampled from that station. The upper andlower limits can be displayed on the graph ashorizontal lines, so it can be observed whether ornot tablets are well within the limits or if anystation is producing tablets near to one of thelimits. In the numerical mode (Figure 11.5), thedisplay shows a list of, say, 10 stations (or what-
ever number is convenient to display on thescreen). After each station number, the displayshows the mean weight and the maximum andminimum weight of the tablets weighed fromthat station. The remaining stations can be dis-played by either scrolling the display or on ascreen-by-screen basis.
Weighing systems can be extended to includeautomatic measurement of tablet thickness and crushing strength. Feedback to the pressbecomes more complicated when all threemeasurements are used, as the parameters areinterrelated and one cannot be altered while theothers remain constant. Most control systemsuse feedback for only one parameter.
Computer-controlled systems
Current computer-based control systems arecapable of providing the machine operator withvery detailed information on the operation ofthe press and of the performance of the product.Modern press design, which must provide foreasy cleaning, has resulted in the elimination ofmanual controls. As the press can now be set upand operated remotely, the process control sys-tem and the press operation system have beencombined into one unit. A modern control unitcan set up the press, monitor and control theprocess, record data and events, and producerecords.
A control system of this type will be describedwith reference to that used to control Manestypresses (Figure 11.6). Force measurement isnormally made using a strain-gauged roll-pin.
The system is operated via a range of computerscreens. Data can be entered either via the touchsensitive screen or via a keyboard. The mainscreen (Figure 11.7) is used for setting theoperating parameters.
The following parameters can be reset fromthe main screen.
1. The mean compression force. This can be for the main compression event or for pre-compression or both, depending upon what isavailable on the machine and the require-ment of the product. If two stages are used,
228 Tablet and capsule machine instrumentation

either one can be controlled but the other isonly monitored.
2. The tablet thickness at each stage of the com-pression. This is shown as the distance separ-ating the upper and lower punch tips. For
tablets made with concave punch tips, thetrue tablet thickness will be greater because ofthe depth of the concavities.
3. The depth of fill. This is the distance of the tipof the lower punch from the top of the die at
Automatic control of tablet presses in a production environment 229
Figure 11.4 A graphical representation of tablet weights.
Figure 11.5 A numerical representation of tablet weights.
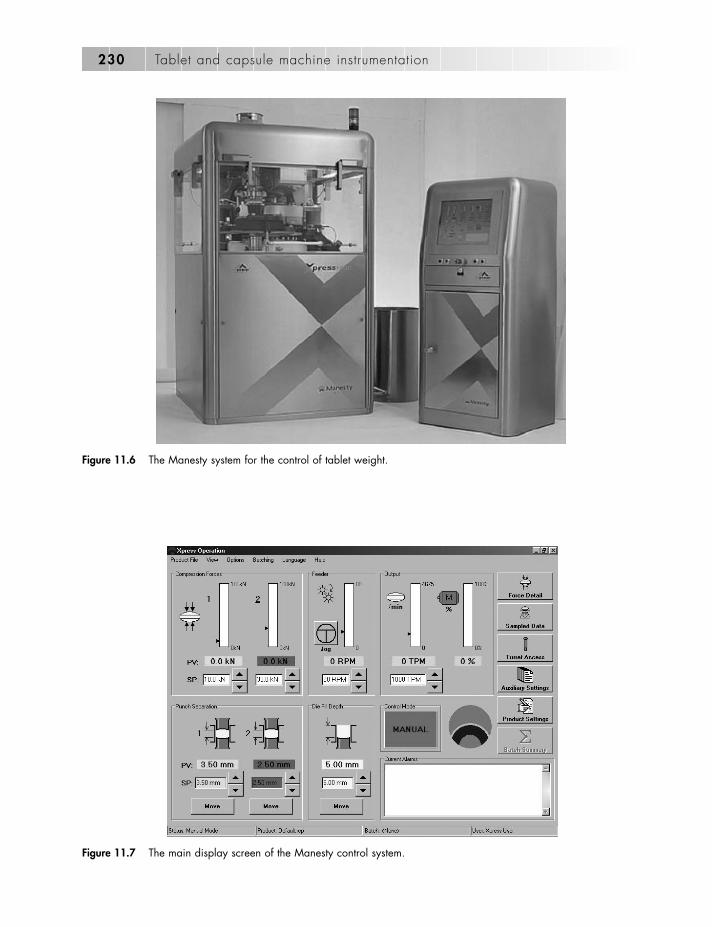
230 Tablet and capsule machine instrumentation
Figure 11.7 The main display screen of the Manesty control system.
Figure 11.6 The Manesty system for the control of tablet weight.

the position where the excess of fill material isscraped off.
4. The speed of the feeder. This is given by therevolutions per minute of the main paddle.
5. The machine speed. This is the output intablets per minute.
When the machine is started, the actual valuesof the peak compression force for the first andsecond stages of compression, the feeder paddlespeed, the tablet output and the percentage offull load power being used by the motor are allindicated both graphically and numerically. Fora product that has not been previously madeusing the control system, the die fill and tabletthickness can be varied until a satisfactory tabletis obtained. The present value (PV) readingsthat are shown on the screen at this time can be used to enter the set points (SP). Although thevalues for the set points are entered on thescreen, these are not activated until the ‘move’button is selected.
When the move button is selected, the punchpositions for the tablet thickness and depth offill are adjusted by means of stepping motorsthat are linked to rotary encoders. The feedbackloop between the motor and the encoder ensuresvery accurate positioning of the punches.
When the machine is switched to automaticmode, the control system will adjust the press tomaintain the compaction force and hence themean tablet weight. Any tablets outside specifi-cation will be rejected and the machine stoppedif the set criteria are exceeded. The criteria thatcan be set for stopping the machine are either afixed number of reject tablets per revolution ofthe press or a fixed number from a particularstation.
Once the operating conditions for a particularproduct have been established, they can bestored for future use. Additional informationsuch as the description of the tooling and thetarget values for the weight, thickness and hard-ness (crushing strength) for the product can beentered via an additional screen (Figure 11.8).The data stored on the product can be accessedat any time and modified if necessary by appro-priately authorised personnel (Figure 11.9).Recalling this file and using it to reset themachine for a further batch of that product willgive exact reproducibility of the operating par-ameters. This, in turn, will give a much moreconsistent product than can be achieved bymanually setting up the machine for each batch.It will also reduce the machine set-up time.
Automatic control of tablet presses in a production environment 231
Figure 11.8 The product setting screen display of the Manesty control system.

Further screens giving more detailed infor-mation on the operating conditions can beaccessed from the main screen via speed buttonsor drop down menus.
Force screens
There are three force screens available that givedetails of the forces from individual stations, themean force for each revolution of the turret anddetails of the force profile from an individualcompression.
In the Individual Station Forces Screen (Figure11.10), each station of the press is represented bya vertical line that extends from the minimumacceptable force to the maximum acceptableforce. The peak force resulting from the lasttablet made on a particular station is displayed asa small square. If the tablet is within specifi-cation, the square will be on the line and leavesa history trail when it is replaced by the nextsquare. This enables the range of forces actuallyoccurring to be compared with the acceptancelimits. If the tablet is out of specification, thesquare will be off the line and the tablet will be rejected if the system is in automatic mode.
The screen also gives a numerical display of the maximum, minimum and mean forces forthe last revolution of the turret together with thecoefficient of variation (CV), which is the stan-dard deviation as a percentage of the mean. Thecoefficient of variation gives an indication of theconsistency of the die filling. The optimumfeeder paddle speed can be established by vary-ing the speed until a minimum value of the CVis obtained. The acceptance limits, which areexpressed as a percentage of the mean force, canalso be adjusted from this screen. Figure 11.10shows only the first stage of compression in thegraphical display, but the mean values for bothstages are shown in the numerical panel at thebottom of the display.
The Mean Force History Screen displays a bargraph of the mean force from the first andsecond stages of compression for a number ofrevolutions of the turret (Figure 11.11). Thescreen will update automatically, but there is anoption to hold a set of values for more detailedexamination.
The Station Force Profile Screen gives details ofthe compaction profile of an individual tablet(Figure 11.12). Up to 70 force readings are takenduring the compression of a tablet and this
232 Tablet and capsule machine instrumentation
Figure 11.9 The product setting list display of the Manesty control system.
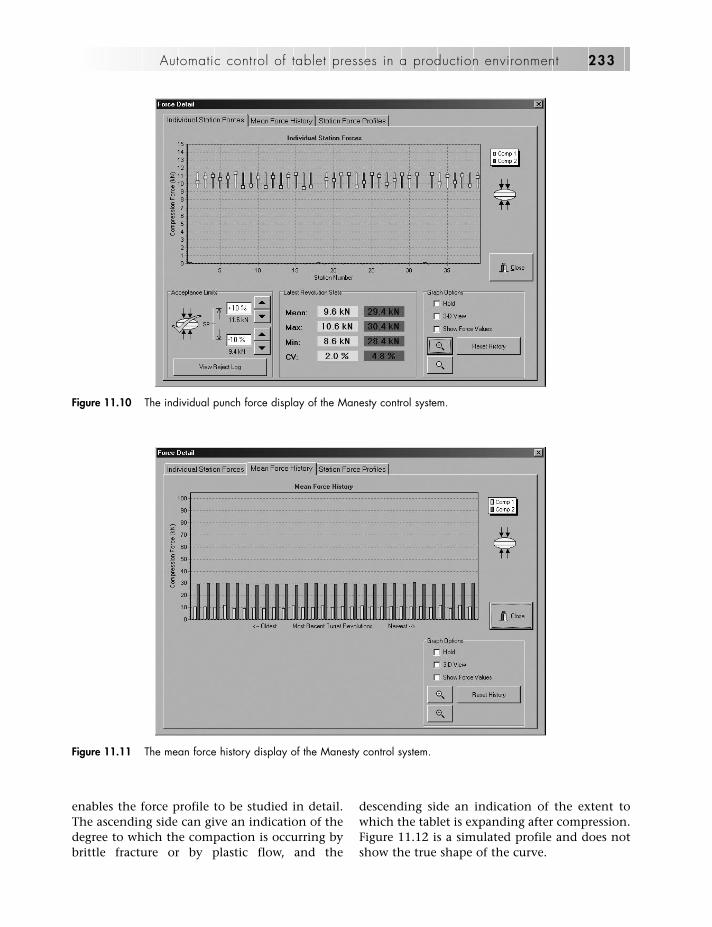
enables the force profile to be studied in detail.The ascending side can give an indication of thedegree to which the compaction is occurring bybrittle fracture or by plastic flow, and the
descending side an indication of the extent towhich the tablet is expanding after compression.Figure 11.12 is a simulated profile and does notshow the true shape of the curve.
Automatic control of tablet presses in a production environment 233
Figure 11.10 The individual punch force display of the Manesty control system.
Figure 11.11 The mean force history display of the Manesty control system.

The system keeps a log of any tablets thathave been rejected because the compactionforce was outside the acceptance limits (Figure11.13). It shows the time, station number, com-paction force and the error (i.e. the percentagedeviation from the mean value and whetherthis deviation was positive or negative).
Information screens
Additional screens are available if a unit tomeasure weight, thickness, hardness (WTH unit)is attached to the press (Figure 11.14). The unitmust first be configured and this includes settingthe number of tablets in each group of tablets to
234 Tablet and capsule machine instrumentation
Figure 11.13 The reject log display of the Manesty control system.
Figure 11.12 The force–time waveform of an individual tablet, as displayed on the Manesty control system.
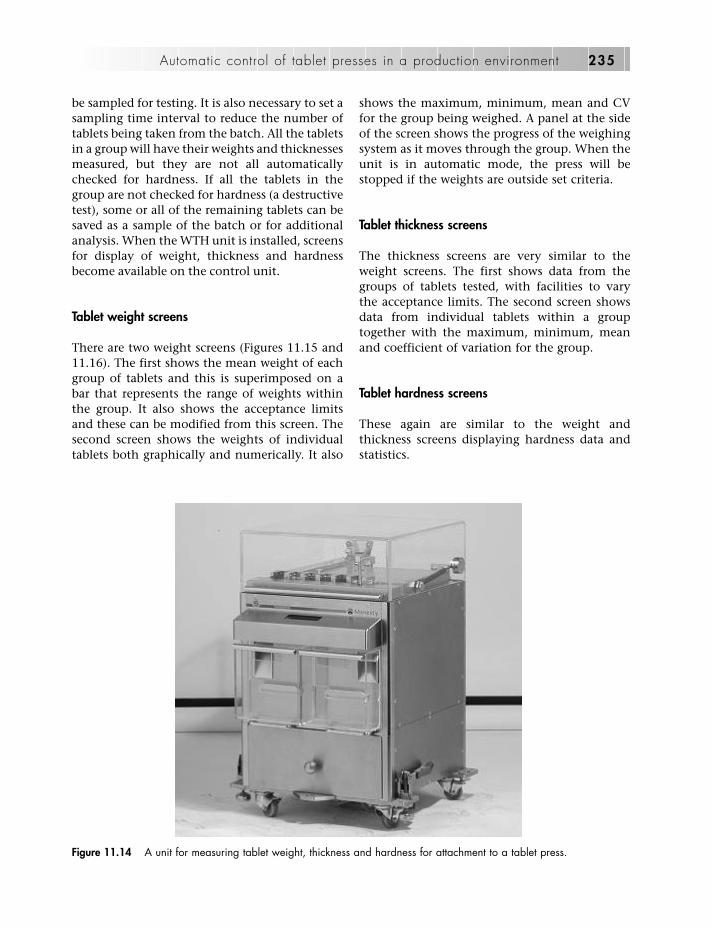
be sampled for testing. It is also necessary to set asampling time interval to reduce the number oftablets being taken from the batch. All the tabletsin a group will have their weights and thicknessesmeasured, but they are not all automaticallychecked for hardness. If all the tablets in thegroup are not checked for hardness (a destructivetest), some or all of the remaining tablets can besaved as a sample of the batch or for additionalanalysis. When the WTH unit is installed, screensfor display of weight, thickness and hardnessbecome available on the control unit.
Tablet weight screens
There are two weight screens (Figures 11.15 and11.16). The first shows the mean weight of eachgroup of tablets and this is superimposed on abar that represents the range of weights withinthe group. It also shows the acceptance limitsand these can be modified from this screen. Thesecond screen shows the weights of individualtablets both graphically and numerically. It also
shows the maximum, minimum, mean and CVfor the group being weighed. A panel at the sideof the screen shows the progress of the weighingsystem as it moves through the group. When theunit is in automatic mode, the press will bestopped if the weights are outside set criteria.
Tablet thickness screens
The thickness screens are very similar to theweight screens. The first shows data from thegroups of tablets tested, with facilities to vary the acceptance limits. The second screen showsdata from individual tablets within a grouptogether with the maximum, minimum, meanand coefficient of variation for the group.
Tablet hardness screens
These again are similar to the weight andthickness screens displaying hardness data andstatistics.
Automatic control of tablet presses in a production environment 235
Figure 11.14 A unit for measuring tablet weight, thickness and hardness for attachment to a tablet press.

Screen associated with the weight,thickness, hardness unit
A final screen associated with the WTH unit(Figure 11.17) shows numerical data from thegroup of samples being tested.
In cases where a WTH unit is not in use, thecontrol system has facilities for taking samplesthat can be tested manually or on an automatictest unit not linked to the machine. This enableseither individual tablets or groups of tablets to besampled. In the individual mode, the samples
236 Tablet and capsule machine instrumentation
Figure 11.15 The tablet weight display of the Manesty control system, showing data for a group of tablets.
Figure 11.16 The tablet weight display of the Manesty control system, showing data for individual tablets.

can be taken from any particular station of thepress and a time interval can be set betweensamples. In the group mode, the number oftablets in the group can be set, together with thetime interval between groups. As the measuringsystem is not linked to the press, the data mustbe entered manually.
When the WTH unit is available, data are storedas the batch of tablets progresses. A series ofsummary screens then becomes available, cover-ing the compression force, weight, thickness andhardness. The summary screen for compressionforce is shown in Figure 11.18, and the screens forthe other parameters are similar. The system hasextensive data storage facilities. The data arenormally stored on a batch by batch basis, butsub-batches are allowed and can be used forcollecting samples at intervals throughout thebatch. At the end of the batch or sub-batch, aprinted report can be generated containing any ofthe data that have been recorded. The amount ofdata stored electronically is very large and it isnormal to print only those parts that are specifi-cally required. The remaining information can bemore efficiently stored on disk. The information
contained in the report is selected from the reportgenerator screen. This will consist of a basic batchreport plus a number of other sets of informatione.g. initial settings, system events, user adjust-ments, data relating to rejected tablets, and manyothers. An example of the first page of a report isshown in Figure 11.19.
The system has a number of other useful fea-tures. These include event logs that automati-cally record all actions taken during theproduction of a batch of tablets. The event logcan be printed but to ensure accuracy of therecord, it cannot be amended (Figure 11.20).Another feature is that instead of all the trans-ducers, motors, encoders, etc. being wired to thecontrol unit, the system uses a computer bus tolink all the components. This simplifies thewiring of the system. Facilities are provided tocalibrate the position encoders (Figure 11.21)and for removing any zero offset on the load cells(Figure 11.22). Two other features that are essen-tial in a system of this type are an uninterruptiblepower supply to ensure all data are saved in theevent of a power failure and that the method ofchecking signatures is 21CFR part 11 compliant.
Automatic control of tablet presses in a production environment 237
Figure 11.17 The tablet weight display of the Manesty control system, showing numerical data for individual tablets.

There have been considerable developmentsin the instrumentation of presses over recentdecades and it will be interesting to see whatthe future holds. At the present time, tablet
press output is restricted by the ability of thematerials to undergo compression at highpunch speeds, rather than being limited bythe mechanical speed of the press. Using the
238 Tablet and capsule machine instrumentation
Figure 11.19 The first page of a sample report.
Figure 11.18 Batch summary display of compression force.

latest instrumetation systems, the mechanismof the compaction process can be studiedunder actual production conditions and thismay lead to advances in the formulation oftablets that will allow even higher outputs tobe obtained.
References
Knoechel EL, Sperry CT, Ross HE, Lintner CJ (1967a).Instrumented rotary tablet machines. 1: Design,construction and performance as pharmaceuticalresearch and development tools. J Pharm Sci 56:109–115.
Automatic control of tablet presses in a production environment 239
Figure 11.20 An events log.
Figure 11.21 The encoder calibration display.

Knoechel EL, Sperry CT, Lintner CJ (1967b).Instrumented rotary tablet machines. 2: Evaluationand typical applications in pharmaceuticalresearch, development and production studies. J Pharm Sci 56: 116–130.
Wray PE, Vincent JG, Moller SW, Jackson GJ (1966).Design and construction of an instrumented rotarytablet press. A Ph A Annual Meeting, Dallas.
Further reading
Murray FJ (1996). Tablet press automation: a modularapproach to fully integrated production. Drug DevInd Pharm 22: 35–43.
Wray PE (1992). The physics of tablet compactionrevisited. Drug Dev Ind Pharm 18: 627–658.
240 Tablet and capsule machine instrumentation
Figure 11.22 The load cell calibration display.

Appendix
Suppliers of materials and services
241
Suppliers of force-measuring equipment
ABB LtdDaresbury ParkWarrington WA4 4BTUK�44 (0)1925 714111www.abb.co.uk
Amber Instruments LtdDunston HouseDunston RoadChesterfieldDerbyshire S41 9QDUK�44 (0)1246 260250www.amberin.clara.net
Applied Measurements Ltd3 Mercury HouseCalleva ParkAldermastonBerkshire RG7 8PNUK�44 (0)118 9817339www.appmeas.co.uk
Control Transducers LtdNorth Lodge25 Kimbolton RoadBedford MK40 2NYUK�44 (0)1234 217704www.controlt.co.uk
Entran Ltd4 Thames ParkLester WayWallingfordOxfordshire OX10 9TAUK�44 (0)1491 893999www.entran.co.uk
Graham and White Instruments Ltd137a Hatfield RoadSt AlbansHerts AL1 4LZUK�44 (0)1727 844323www.sensorsuk.com
Some suppliers of equipment and services for the measurement of force and displacement are listedbelow, but this is by no means a definitive list.

Hottinger Baldwin Messtechnik (HBM)HBM United Kingdom Ltd1 Churchill Court58 Station RoadNorth HarrowMiddlesex HA2 7SAUK�44 (0)208 5156100www.hbm.com
Kistler Instruments Ltd13 Murrel Green Business ParkLondon RoadHookHants RG27 9GR UK�44 (0)1256 741550www.kistler.com
Kulite Sensors LtdKulite HouseStroudley RoadKingsland Business ParkBasingstokeHants RG24 0UGUK�44 (0)1256 461646www.kulite.co.uk
LCM Systems LtdUnit 15 Newport Business ParkBarry WayNewportIsle of Wight PO30 5GYUK�44 (0)1983 249264www.lcmsystems.com
L H Transducers Ltd25 Perry HillSandhurstBerkshire GU47 8HSUK�44 (0)1252 890900www.acamltd.co.uk
Microsensors Division of Howard A SchaevitzTechnologies Inc7300 US Route 130 NorthBuilding 22PennsaukenNJ 08110–1541USA�1 856 662 8000www.microsensors.com
National Instruments Corporation (UK) LtdMeasurement HouseNewbury Business ParkLondon RoadNewburyBerkshire RG14 2PSUK�44 (0)1635 523545www.ni.com
Proctor & Chester Measurements LtdChester HouseDalehouse LaneKenilworthWarwickshire CV8 2UEUK�44 (0)1926 864444www.pcm-uk.com
RS Components LtdBirchington RoadPO Box 99CorbyNorthants NN17 9RSUK�44 (0)845 8509922rswww.com
Scientific Electro Systems Ltd1 Rose WayPurdeys Industrial EstateRochfordEssex SS4 1LYUK�44 (0)1702 530174www.sesystems.co.uk
242 Tablet and capsule machine instrumentation

Strainstall UK Ltd9–10 Mariners WayCowesIsle of Wight PO31 8PDUK�44 (0)1983 203600www.strainstall.com
Straintek Precision ServicesParsonage SideOtterhamptonBridgwaterSomerset TA5 2PTUK�44 (0)1278 652062www.straintek.com
Stresscoat Inc1334 North Benson AvenueUnit AUplandCA 91786USA�1 909 981 7444www.stresscoat.com
Techni Measure LtdAlexandra Buildings59 Alcester RoadStudleyWarwickshire B80 7NJUK�44 (0)1527 854103www.techni-measure.co.uk
Thames-Side-Maywood Ltd2 Columbus DriveSummit AvenueSouthwoodFarnboroughHants GU14 0NZUK�44 (0)1252 555811www.thames-side-maywood.com
TSM LtdSensor HouseWrexham Technology ParkWrexhamFlintshire LL13 7YPUK�44 (0)1978 291800www.esrtec.com
Vishay Measurements Group UK LtdStroudley RoadBasingstokeHants RG24 8FWUK�44 (0)1256 462131www.measurementsgroup.co.uk
Strain gauge application services
Proctor & Chester Measurements LtdChester HouseDalehouse LaneKenilworthWarwickshire CV8 2UEUK�44 (0)1926 864444www.pcm-uk.com
Straintek Precision ServicesParsonage SideOtterhamptonBridgwaterSomerset TA5 2PTUK�44 (0)1278 652062www.straintek.com
The Strain Gauging Company LtdRookery LodgeCollege LaneEllisfieldHants RG25 2QEUK�44 (0)1256 381006www.tsgcltd.co.uk
Appendix 243

TSM LtdSensor HouseWrexham Technology ParkWrexhamFlintshire LL13 7YPUK�44 (0)1978 291800www.esrtec.com
Vishay Measurements Group UK LtdStroudley RoadBasingstokeHants RG24 8FWUK�44 (0)1256 462131www.measurementsgroup.co.uk
Suppliers of displacement transducersand accelerometers
Analog Devices Inc.One Technology WayNorwoodMA 02062USA�1 781 329 4700www.analog.com
Automatic Systems Laboratories Ltd40 Tanners DriveBlakelandsMilton KeynesBucks MK14 5BNUK�44 (0)1908 440666www.aslltd.co.uk
Entran Ltd4 Thames ParkLester WayWallingfordOxfordshire OX10 9TAUK�44 (0)1491 893999www.entran.co.uk
Graham and White Instruments Ltd137a Hatfield RoadSt AlbansHerts AL1 4LZUK�44 (0)1727 844323www.sensorsuk.com
IDM Electronics LtdUnit 30Suttons Park AvenueSuttons Industrial ParkReadingBerkshire RG6 1AWUK�44 (0)118 9666044www.idmelectronics.co.uk
Kistler Instruments Ltd13 Murrel Green Business ParkLondon RoadHookHants RG27 9GR UK�44 (0)1256 741550www.kistler.com
Micro-Epsilon UK LtdDorset HouseWest Derby RoadLiverpool L6 4BQUK�44 (0)151 2609800www.micro-epsilon.co.uk
Midori Inc2555E Chapman Avenue State 400FullertonCA 92831USA�1 714 449 0999www.midoriamerica.com
Monitran LtdMonitor House33 Hazelmere RoadPenn
244 Tablet and capsule machine instrumentation

High WycombeBucks HP10 8ADUK�44 (0)1494 816569www.monitran.co.uk
Penny and Giles Controls Ltd15 Airfield RoadChristchurchDorset BH23 3TJUK�44 (0)1202 409409www.pennyandgiles.com
Positek LtdManor Farm Industrial EstateAndoversfordCheltenhamGloucestershire GL52 4LBUK�44 (0)1242 820027www.positek.com
Precision Varionics InternationalSensor HouseLangley RoadSwindonWiltshire SN5 5WBUK�44 (0)1793 879879www.pvi.co.uk
RS Components LtdBirchington RoadPO Box 99CorbyNorthants NN17 9RSUK�44 (0)845 8509922rswww.com
Sensors (UK) Ltd137a Hatfield RoadSt AlbansHerts AL1 4LZUK�44 (0)1727 844323www.sensorsuk.com
Sensortronic Ltd45 Leaver RoadHenley on ThamesOxfordshire RG4 1UWUK�44 (0)1491 412055www.sensortronic.com
Techni Measure LtdAlexandra Buildings59 Alcester RoadStudleyWarwickshire B80 7NJUK�44 (0)1527 854103www.techni-measure.co.uk
Variohm EuroSensorWilliams BarnTiffield RoadTowcesterNorthants NN12 6HPUK�44 (0)1327 351004www.variohm.com
Vishay Measurements Group UK LtdStroudley RoadBasingstokeHants RG24 8FWUK�44 (0)1256 462131www.measurementsgroup.co.uk
Suppliers of instrumentation packages
Astech Electronics LtdForge Industrial EstateThe StreetBinstedAltonHants GU34 4PFUK�44 (0)1420 22689www.astechelectronics.com
Appendix 245

Copley Scientific LtdColwick Quays Business ParkNottingham NG4 2JUUK�44 (0)115 9616229.www.copleyscientific.co.uk
Instron LtdCoronation RoadHigh WycombeBucks HP12 3SYUK�44 (0)1494 456815www.instron.co.uk
Korsch AGBreitenbach Strasze13509 BerlinGermany�49 30 435760www.korsch.deu
Metropolitan Computing Corporation6 Green Meadow LaneEast HanoverNJ 07936USA�1 973 887 7800www.mcc-online.com
Puuman OySammonkatu 670501 KuopioFinland�358 17 288 1222www.puuman.com
SMI IncorporatedPO Box 356LebanonNJ 08833USA�1 908 534 1500www.smitmc.com
Miscellaneous
AddlinkAdcon Telemetry GmbHInkustrasze 24KlosterneubergA-3400 Austria�43 2243 382800www.adcon.at
Amplicon Liveline LtdCentenary Industrial EstateHollingdean RoadBrightonSussex BN2 4AWUK�44 (0)1273 570215www.amplicon.uk
Analog Devices IncOne Technology WayNorwoodMA 02062USA�1 781 329 4700www.analog.com
Data Translation Inc100 Locke DriveMarlboroMA 01752 1192USA�1 508 481 3700www.data_translation.com
Mantracourt Electronics LtdThe DriveFarringdonExeter EX5 2JBUK�44 (0)1395 232020www.mantracourt.co.uk
246 Tablet and capsule machine instrumentation

Metglas Inc440 Allied DriveConwaySC 29526USA�1 800 581 7654www.metglas.com
Microchip Technology Inc2355 West Chandler BoulevardChandlerAZ 85224 6199USA�1 480 792 7200www.microchip.com
Newport Spectra Physics LtdLight HouseNewbury Business ParkLondon RoadNewburyBerkshire RG14 2PZUK�44 (0)1635 521757www.newport.com
Texas Instruments Inc12500 TI BoulevardDallasTX 75243 4136USA�1 800 336 5236www.ti.com
Appendix 247


abrading of surface for strain gauges, 52–53abrasives, 62AC waveform, 93AC–AC transducers, 68accelerometer, 79–81, 125
components, 80piezoelectric, 81punch movement, 133servo-force balance, 81suspension, 80–81
acrylic varnish, 58, 63actuators, 72adhesion force, punch, 131–132, 202adhesive bonding
inspection, 58–59strain gauges, 53–56, 58–59
adhesives, 61cold cure, 54, 55–56heat cure, 54, 56instant, 53, 54–55storage, 54types, 53–54
air abrading, 53aliasing, 147–148ammonia, weak solution, 53, 61amplifiers, integral charge, 43analogue multiplexer, 154–155analogue-to-digital cards, commercially available,
161–162analogue-to-digital converter (ADC), 152–153,
155–157flash devices, 156multiplexer, 154–155parallel devices, 156parallel output, 155sub-system, 155voltage reference, 157
annealing, 25auxetics, 13
base units, 4–5bending, bridge circuit, 36–37bolts, strain-gauged, 41, 108, 130
ejection ramp, 127bonded coefficient, 36British Society for Strain Measurement (BSSM), 64
brittle lacquer technique, 30Brockedon press, 1Butterworth filters, 154
calibrationdie, 197, 198die-wall stress, 142, 197, 198direct, 140displacement measurement, 142–145displacement transducers, 144–145encoder, 237, 239force, 140–142fundamental standards, 139indirect, 140–141load cells, 102, 103
display, 237, 240force, 140, 141indirect, 140
micrometer gauge, 143–144practical standards, 139–140problems, 145–146punch, 140, 141secondary standards, 140signal problems, 145–146strain gauges, 59transducer systems, 139–146
capacitance changes, 48capacitative velocity transducers, 82capacitors, 89
linear variable, 69piezoelectric load cells, 43
capsule(s), 207history, 1
capsule-filling machinery, 3compression force, 207dosating disk machines, 208
instrumentation, 209–214dosating nozzle machines, 208–209
instrumentation, 214–220instrumentation, 3–4, 7–8, 207–220
packages, 8parameters for measurement, 3–4types, 208–209
casting polymers, 24Chebychev filters, 154cleaning materials, 62
Index
Page numbers in italic refer to figures, those in bold refer to tables.
249

clevis pins, 108coefficient of variation (CV), 232cold cure adhesives, 54, 55–56cold curing, 54compact disks (CDs), 163–164compaction
data storage for tablet presses, 95power of, 195punch velocity, 190–191
compaction force measurement, 227compaction simulators, 134–136
die-wall stress, 200complimentary metal oxide semiconductor (CMOS),
155composite gauges, 35composite materials, 61compression
behaviour of solids, 167capsule-filling machinery, 207dosating disk machines, 210energy state of tablet, 190equations, 183–187events, 182, 190force–displacement curve, 188–189phase of force–time profile, 181punch shortening, 175–176stages, 215tablet press distortion, 175–176triaxial system, 200
compression curves, 197–198tablet presses, 103
compression cycles, 197–198axial force, 198, 200plastic deformation, 199predictive use, 200
compression forcecapsule-filling machinery, 207computer-controlled systems, 231, 238dosating nozzle machinery, 214–215, 217–218,
219–220feedback loop to maintain with die fill, 225relationship with tablet properties, 167static conditions, 43tablet weight control, 222–225
compression pressure measurement, 2computer instrumentation, 8computer interfacing, 157–162
built-in, 158–159computer switch-mode power supplies, 90computer-controlled tablet presses, 228–229, 230,
231–239, 240data storage, 237encoder calibration, 237, 239event log, 237, 239information screens, 234–235operating condition storage, 231, 232weight, thickness, hardness unit, 234–239, 240
conductive plastics film, temperature coefficient ofresistivity, 71
consolidation process, dosating disk machines, 209,212–213
Constantan, 14, 17gauge life, 19measuring range, 18
Cooper–Eaton equation, 185, 186copper/copper alloys, 61cosine error, 102, 103cutters, 63cyanoacrylate adhesives, 53, 54–55
D connector, 158, 159data acquisition
frequency response, 153Hall effect transducer, 97mains noise, 90signal display, 95–97tablet presses, 91–95
data handling, 147–164backup, 163–164computer interfacing, 157–162electronics sub-systems, 153–157embedded systems, 157sampling system theory, 147–148, 149–151,
152–153software, 162–163
data-logging system, 157–158DC–DC transducers, 68decompression curves, 179, 197–198degreasing of surface for strain gauges, 52, 61Denisyuk method, 27densification, dosating disk machines, 212–213die
calibration, 197, 198cutaways, 197, 199cylindrical housing, 200dosating disk machines, 214flexible, 200force required to eject tablet, 202layered, 199segmented, 197–200strain gauge attachment, 197
die fill, feedback loop to maintain compression force,225
die table, 171, 172, 173die-wall stress, 196–201
calibration, 142, 197, 198strain gauges, 198–200wall thickness/width, 199
digital signal processor chip, 157digital versatile disks (DVDs), 164diodes, photosensitive, 77–78displacement, 65
dosating nozzle machinery, 217–218force relationship, 187–190rate of change, 190–191
displacement measurement, 65–84accuracy, 121calibration, 142–145dynamic, 79–82errors, 189flash photography, 83–84
250 Index

laser speckle photography, 82–83machine distortion, 121–124punch, 121punch tilting, 134tablet presses, 119–127
rotary, 125–127transducers, 65–79
displacement transducers, 65analogue output, 65–76calibration, 144–145digital output, 76–79fitting to dosating disk machines, 210–211LVDT, 122–124non-contact, 146positioning, 122, 123
displacement–time profileseccentric tablet presses, 168–171Heckel equation, 185–186
displacement–time waveform, 135dissolution, dosating disk machines, 210dosating disk machines, 208
compression, 210consolidation process, 209, 212–213densification, 212–213dies, 214dissolution, 210fill weight control, 212force–displacement curves, 211–212force–time relationships, 211instrumentation, 209–214LVDT fitting, 210–211peak maximum force, 211plug formation, 210, 213–214simulation, 213–214tamping pins, 209–210, 212
dosating nozzle machines, 208–209compression force, 214–215, 217–218, 219–220displacement, 217–218ejection force measurement, 215, 216–217, 218fill weight, 219force, 217–218instrumentation, 214–220LVDT attachment, 217, 220plug
density, 220formation, 215–216
powder bed density, 219pre-compression force, 217–218, 219simulation, 218–220
double-weighing, 11dual-slope integrating devices, 155
eccentric presses, 7–8, 99–111compression, 170displacement measurement, 119–125displacement–time profiles, 168–171force–time profiles, 177–178, 180–181machine distortion, 121–124punch, 122–124
upper, 168–169
velocity, 191sample rate choice, 148, 152scale length, 120–121
ejection event, 148ejection force measurement, 127–129
dosating nozzle machines, 215, 216–217, 218force calibration, 142
ejection ramp, 127–129cantilever beams, 129modified designs, 129non-contact, 146piezoelectric load cells, 128shear force load cell mounting, 129split, 129
elastic deformation, powder consolidation, 176elastic expansion, 188–189electromagnetic interference suppression ferrites, 90electronics sub-systems, 153–157
amplification, 153–154analogue multiplexer, 154–155analogue-to-digital converters, 155–157dual-slope integrating device, 155low-pass filter, 154sample and hold, 155successive approximation register devices, 155–156
elliptic filters, 154embedded systems, 157encoder calibration, 237, 239energy
SI unit, 5–6state of tablet after compression, 190tablet formation, 187
epoxy resins, 54, 55–56epoxy-phenolics, solvent-thinned, 54, 56Ethernet, 159Excel spreadsheet program, 162excitation voltage, 33, 38
fast Fourier transform (FFT), 152, 162–163ferrites, 90fiber optic transducers, 75–76fibre optic strain gauges, 48–49field effect transistor (FET), 43FIFO memory, 162files, 62
abrading of surface for strain gauges, 52fill depth, computer-controlled systems, 229, 231fill weight
control by dosating disk machines, 212dosating nozzle machines, 218, 219
filtersdesign, 154mains, 90–91switched-capacitor, 154, 156
finite element analysis, 22die-wall stress, 199–200
flash photography, 83–84three-colour, 84
floppy disks, 163flow properties of powders, 218
Index 251

force, 6accelerometer, 80–81axial, 198, 200computer screens, 232–234dosating nozzle machinery, 217–218effective, 181measurement, 11–49peak
maximum for dosating disk machines, 211punch penetration, 180, 189–190
powder consolidation, 176–178rate of change, 190–191required to eject tablet from die, 202servo-driven balance, 81SI units, 5stress analysis, 31sweep-off, 202transmission between particles, 179–180see also compression force; punch force
force calibration, 140–142error sources, 141–142telemetry, 142
force transducers, 140–141force–displacement curves, 121, 187–190
area under, 188–190, 195dosating disk machines, 211–212
force-measuring equipment suppliers, 241–243force–porosity relationships, 182–186, 186
compression equations, 183–187, 186force–time profiles, 176–187
compression phase, 181dosating disk machines, 211dwell time, 181eccentric tablet presses, 148, 152, 177–178, 180–181phases, 181relaxation phase, 181rotary tablet presses, 178–179, 181shape, 179–182waveforce, 148, 152, 234
force–weight relationship, 224–225Fourier transform (FT), 152, 162–163frictional force, 224–225frictional resistance of sliding components, 102
gauge blocks, transducer calibration, 142–143gauge factor, 13
temperature variation, 17variation, 35
gauged punches, force transducers, 140gauging transducers, 67, 121
fitting, 126–127gratings, multiple-track, 77grinders, 62grit blasting, 53grit paper, 62
abrading of surface for strain gauges, 52–53
half-bridge, 33, 35completion resistors, 37–38
Hall effect transducer, 70–71, 97
hard drives, 163health and safety, strain gauges, 51heat curing, 54, 56Heckel coefficients, 185Heckel equation, 183, 186holographic camera, 27holographic interferometry, 26–27
real-time, 27, 83holography, 26–28
white light, 27Hooke’s law, 12HP-IB parallel bus, 160hydraulic presses, 132–133hysteresis
eccentric tablet press, 104loop area, 200–201
inductive transducers, 78remote, 125
inductive velocity transducers, 81–82Infrared Data Association (IrDA) standard, 157infrared port, 160instrumentation of capsule-filling machinery, 8,
207–220dosating disk machines, 209–214dosating nozzle machines, 214–220
instrumentation of presses, 3–4, 6–7, 8applications, 167–203die wall stress, 196–201force calibration, 142force–displacement curves, 187–190force–porosity relationships, 182–186, 186force–time profiles, 176–182lubrication studies, 201–202packages, 8, 132–136punch displacement–time profiles, 168–171, 172,
173–176punch velocity, 190–196
instrumentation packagessuppliers, 245–246tablet presses, 8, 132–136
instrumented systems, 2–4components, 4
integral charge amplifiers, 43integrated micro electro mechanical systems (iMEMS),
81interferometers
displacement measurement, 142Michelson, 82optical, 79
interferometry, holographic, 26–27real-time, 27, 83
IrDA port, 160isopropanol, 61
K-alloy, 15, 17Kawakita equation, 184–185, 186
laserholography, 27
252 Index

moiré grid technique, 28laser Doppler velocimetry, 65, 82
tablet punches, 124–125laser Doppler-shift measurement, 82laser speckle photography, 82–83laser speckle strain gauges, 49layout marking tools, 63lead zirconate titanate (PZT), 41leadwire(s)
intra-bridge, 57, 58main, 57tablet presses, 91–92, 94
leadwire attachment to strain gauges, 57–58, 59, 62high-temperature installations, 61unbonded, 60
length, base unit, 4–5light-emitting diode (LED), 95linear diode array, 77–78linear inductive displacement transducer, 68–69linear magnetoresistive transducer, 69–70linear regulators, 88–89linear variable capacitor, 69linear variable resistor, 71–72linear variable-differential transformer (LVDT), 65–68
construction, 65demodulation, 68dimensions, 67–68displacement transducer, 122–124dosating disk machines, 210–211dosating nozzle machines, 217, 220eccentric tablet press, 120excitation, 68gauging transducers, 67load cell, 44, 45, 46machine distortion, 121–123output signal, 65punch, 126repeatability, 66scale length, 120–121spring-loaded, 121, 127thermal effects, 67zero setting, 66
load cells, 32, 38–46advantages, 44–45based on strain gauges, 38–39calibration
against, 103comparison for indirect, 140display, 237, 240force, 140, 141against transfer standard, 102
concentric element, 39, 40disadvantages, 45–46ejection ramp mounting, 129force calibration, 140, 141force transfer, 105linear variable-differential transformer, 44, 45, 46lower punch holder, 109magnetoelastic, 43–44piezoelectric, 41–43, 105, 106, 109
accelerometer, 81ejection ramp, 128force calibration, 141
resolution, 45rigidity, 46rotary tablet presses, 115, 116shear force, 129shear-beam, 44strain-gauged, 105, 106strain-gauged metal cylinder, 109temperature compensation, 45
load testing, strain gauges, 59load washers, 42
piezoelectric, 43, 116, 218strain-gauged, 43
lubricants, actions, 201–202lubrication, tablet press instrumentation, 201–202
machine distortioneccentric tablet presses, 121–124punch force measurement, 122–123
magnetic sensors, 74magneto optical (MO) disks, 164magnetoelastic cells, 43–44magnetoresistive effect, 69–70magnetorestrictive transducer, 73–74magnetostrictive strain gauges, 48mains filters, 90–91mains noise, 89–91
transient suppressors, 91upper arm, 102–103
Manesty control system, 226, 230, 231, 232, 233, 234,236, 237
Manesty F3 press, 2masked aperture camera, 28mass, base unit, 5mercury seals, tablet presses, 92Michelson interferometer, 82microcrystalline wax, 58micrometer gauge, 143–144modulus compensation, 17, 34–35Mohr’s bodies, 198, 198moiré grid technique, 27–28monitoring systems, tablet presses, 225multiple-track grating, 77multiplexing, 95
necking down, 112, 114neutralising solutions, 53, 61null-modem cable, 158Nylatron, 130Nyquist frequency, 154
optical grading transducers, 76–77optical interferometers, 79optical linkage, tablet presses, 95optical potentiometers, 76optical transducers, 75–76optical velocity transducers, 81optical wedge, 76
Index 253

oscillographs, 97oscilloscopes, 95–97
digital storage, 96–97mixed signal, 97rotary tablet press, 114
output of equipment, 190overload system, 225, 226
particle density, 182particle fragmentation, powder consolidation, 176PCI analogue card, 161–162
(intelligent), 162PCI interfaces, 159Perspex, 24, 25photoelastic film measurement, 25photoelastic models, 22–24, 25piezoceramic materials, 41piezoelectric accelerometer, 81piezoelectric effect, 41–42piezoelectric load cells, 41–43
accelerometer, 81ejection ramp, 128force calibration, 141lower punch holder, 109upper punch holder, 105, 106
piezoelectric load washers, 43, 116, 218piezoelectric transducers, 41–43
rotary tablet presses, 116–117plastic deformation, 198
compression cycles, 199powder consolidation, 176
plastics, 61annealing, 25commercial sheet, 24, 25
plugdensity, 220length, 214, 215properties with dosating nozzle machinery, 217,
220weight, 220
plug formationdosating disk machines, 210, 213–214dosating nozzle machines, 214–215, 215–216packing density, 214punch speed, 214
Poisson effect, 35Poisson gauge, 16, 33–34Poisson ratio, 13, 16polarised light, stress analysis, 23polysulphide rubber, 58polyurethane varnish, 58, 63pore fraction, 182–186porosity
compression equations, 183–187force relationships, 182–186measurement, 121out-of-die, 182powder consolidation, 176–177punch velocity, 194–195in situ, 183
Portable Press Analyser, 95, 108, 133–134potentiometers
linear, 71optical, 76resistive, 71–72
powder, flow properties, 218powder bed density, 219powder consolidation, 176–177
eccentric tablet presses, 177–178power, SI unit, 6power supplies, 87, 88–95
battery, 91computer switch-mode, 90mains noise, 89–91tablet presses, 91–95
power supply unit (PSU), 88–89linear regulators, 88–89non-regulated, 88
pre-compression force, dosating nozzle machinery,217–218, 219
pre-compression rollers, 43pressure, 6
conversion of normal to lateral, 197SI unit, 5
pressure roll, 171, 172rotary tablet presses, 117–118, 173
pressure–time curve asymmetry, 182pre-triggering, 96printer port, parallel, 158–159product setting, 231, 232programmable input–output controllers, 157punch, 106–108
adhesion force, 131–132, 202adhesion measurement, 202adjustable, 130calibration, 140, 141dimension measurement, 144displacement
measurement, 121time, 174
displacement–time profiles, 168–171, 172, 173–176eccentric tablet presses, 122–124gauged, 140gauging methods, 119instrumentation packages, 133laser Doppler velocimetry, 124–125lower, 111
force ratio to upper, 202movement, 174tip, 170tip position, 176
maximum penetration and peak force, 180,189–190
points of contact, 107–108positions, 231rotary tablet presses, 116, 118–119, 171, 172,
173–175shortening during compression, 175–176strain-gauged, 116, 127, 141tightness, 130–131
254 Index

tilting, 134upper
force ratio to lower, 202force–displacement curve, 187–188, 189movement, 173–174, 191tip, 169–171tip velocity, 191–195
velocity, 169, 190–196, 214eccentric tablet presses, 191horizontal, 191porosity, 194–195rotary tablet presses, 191–194sensitivity of materials, 196tablet formulation dependency, 194–196tablet press simulators, 214vertical, 191–194
punch face adhesive forces, 131–132punch force
ratio to upper to lower, 202strain-gauge output, 198
punch force measurement, 99accuracy, 99linear variable-differential transformer, 120lower, 108–111, 112, 113, 120machine distortion, 122–123pull-up/pull-down, 129–131upper, 100–108, 112, 113, 120
punch force transducer, 140punch heads
dwell time, 174rotary tablet press, 115, 171, 172, 173
punch holder, lower, 108–111materials, 110–111two-piece, 109–110
punch holder, upper, 104–106punch movement, 65, 169, 170, 173–175
accelerometer measurement, 133examination, 135predicted, 176stages, 169, 170
punch securing screw, 105punch tip
deformation, 175lower, 170, 176measurement error, 176upper, 169–171
quarter-bridge, 33, 34quartz crystals, 41
radiofrequency interfaces, 160–161radio-telemetry, tablet presses, 93–95Recommended Standard (RS) 232 card, 158Recommended Standard (RS) 422 card, 159–160Recommended Standard (RS) 485 card, 160reed switch and magnet, 83–84reject log, 234reject systems, tablet presses, 226–227remote capacitative transducer, 73remote inductive transducer, 72–73, 125
repeatability, linear variable-differential transformer,66
resistivity, temperature coefficient, 36, 37resistors, linear variable, 71–72roll-pins
rotary tablet presses, 111, 115–117strain-gauged, 40–41, 45
rosette gauges, 35, 101rosin solvent, 61rotary presses, 8, 111–112, 113, 114–119
action, 111die table, 171, 172, 173displacement measurement, 125–127displacement–time profile, 171, 172, 173–175distortion during compression, 175–176force measurement, 114–115force–time profiles, 178–179, 181load cells, 115, 116machine frame, 112, 113, 114–115measurement errors, 126–127piezoelectric transducers, 116–117pre-compression rollers, 43pressure roll, 117–118, 171, 172, 173punch, 118–119, 171, 172, 173–175punch force, 112, 113punch heads, 115, 171, 172punch velocity, 191–194roll carriers, 112roll-pins, 111, 115–117sample rate choice, 148strain gauges
semiconductor, 114–115siting, 112, 114
strain-gauged punch, 116tie rods, 112wheel eye-bolts, 112, 113
sample and hold, 155sample rate
aliasing, 148choice, 148, 149–151, 152
sampling system theory, 147–148, 149–151, 152–153aliasing, 147–148resolution, 152–153sample rate choice, 148, 149–151, 152
self temperature compensating (STC) gauges, 18,34–35
curvature compensation, 37semiconductor(s), 20–21, 35–36semiconductor bridges, 35–36semiconductor strain gauges, 20–21, 106, 130
rotary tablet presses, 114–115sensors, waveform digitisation, 152Shaxby–Evans equation, 179–180shear beams, 39, 40shear force load cells, ejection ramp mounting, 129shear-beam load cells, 44sheet plastics, commercial, 24
annealing, 25SI units, 5, 139
Index 255

signal clipping, 145–146signal display, tablet presses, 95–96silicon, doped, 20–21, 35–36silicon carbide papers, 62silicone rubber, 58, 63slip gauges, 142–143, 145slip-ring gear, 92
tablet presses, 93, 94soldering
flux removal, 59, 61leadwire attachment to strain gauges, 57–58, 59, 62,
63speckle pattern analysis, 28–29
see also laser speckle photography; laser specklestrain gauges
sputtered thin-film technology, 21S-sensor, 47–48steel, elasticity, 110strain, 175
apparent, 18, 19definition, 12measurement, 11–32
strain gauges, 2, 11–12, 13–32abrading of surface, 52–53abrasives, 62AC bridge configuration, 100–101active, 33adhesive bonding, 53–56, 58–59, 61application services, 243–245attachment, 2
to die, 197backing, 15bonding with adhesive, 53–56bridge configurations, 33calibration, 59capacitance, 48clamping, 60compensation, 18composite, 35, 101conditioning of surface, 53configuration, 15–17construction, 14–15degreasing of surface, 52, 61die-wall stress, 199–200eccentric tablet presses, 102, 103–104electrical characteristics, 17electrical resistance, 13–14, 32–33electrical testing, 59encapsulated, 46excitation level, 87–88fibre optic, 48–49grid elements, 16–17handling, 54, 62health and safety considerations, 51high-temperature installations, 60–61installation, 51–64, 107, 108
accessories, 61–63kits, 63professional assistance, 63–64protection, 58
insulation, 15internal mounting, 108investigative, 25–26laser speckle, 49leadwire attachment, 57–58, 62
high-temperature installations, 61inspection, 59
life, 19linearity of response, 17load testing, 59location lines, 53lower punch holder, 108–109magnetostrictive, 48materials, 14, 15, 17, 18measuring range, 18–19metal foil, 14, 15, 18, 19, 106modulus compensation, 17, 34–35neutralising surface, 53, 61operating cycles, 19output relationship with punch force, 198passive, 33positioning, 60protective coating, 58, 63quarter-bridge configuration, 33, 34resistance, 20, 33
non-linearity, 17resistive, 16resonating sensors, 47–48rosette, 35, 101segmented die attachment, 197semiconductor, 20–21, 106
punch force measurement, 130rotary tablet presses, 114–115
shear-sensitive, 41signal, 93siting, 22–32, 107, 108
rotary tablet presses, 112, 114soldering, 57–58, 59, 61, 62, 63special materials, 61specialist applications, 59–61sputtered thin-film, 21stress analysis, 22–30sub-assemblies, 31–32surface
curvature, 37preparation, 51–53, 62
tablet press automatic control, 223–224temperature coefficient, 17–18terminals, 62thermal drift, 34–35, 38, 43tools, 61, 63unbonded and leadwire attachment, 60vibrating element, 47–48weldable, 46–47, 61zero drift, 34–35, 43
strain rate sensitivity, 194–195strain shunts, 112, 114strain-gauge conversion transducer, 72strain-gauged bolts, 41, 108, 130
ejection ramp, 127
256 Index

strain-gauged load washers, 43strain-gauged punch, 116, 127, 141strain-gauged roll-pins, 40–41stress, 175
mechanical, 12time-dependent decay, 43see also die-wall stress
stress analysis, 22–30annealing, 25brittle lacquer, 30direct methods, 25–30force, 31holography, 26–28modelling methods, 22–25moiré grid technique, 27–28resins for modelling, 24–25speckle pattern, 28–29thermoelastic, 29–30
stress pattern analysis by thermal emission (SPATE),29–30
stretching, bridge circuit, 36–37stroboscopic systems, 84
aliasing, 147successive approximation register devices, 155–156superglue see cyanoacrylate adhesivessuper-linear variable capacitor (SLVC), 69surface conditioner, 61surface strain measurement, 11–12sweep-off force, 202switched-capacitor filters, 154, 156switch-mode regulators, 89
tablet(s)adhesion to punch measurements, 202compression force relationship with properties, 167compression pressure, 2computer-controlled systems, 229, 231, 235–239forces, 2
required to eject from die, 202hardness, 235–239history, 1particulate mass forming, 167porosity, 182–186properties, 1–2punch face separation force, 202speed dependency of formulations, 194–196thickness, 229, 231, 235–239
tablet presses, 1, 2, 3applied force, 101automatic control, 223–239, 240calibration, 102, 103compaction data storage, 95compaction simulators, 8compression characteristics, 128compression curves, 103compression cycle simulation, 134–136computer-controlled systems, 228–229, 230,
231–239, 240control systems, 225–226, 227cosine error, 102, 103
crossheads, 133cycle, 148, 170data acquisition, 91–95displacement measurement, 119–127drive belt, 100force–displacement characteristics, 111force–time characteristics, 111force–weight relationship, 224–225frame distortion, 101frictional resistance of sliding components, 102gauged arm, 103hydraulic, 132–133instrumented, 99–136leadwires, 91–92, 94machine frame, 100–101main shaft, 100mercury seals, 92monitoring systems, 225motor, 100optical linkage, 95output, 190overload system, 225, 226parameters for measurement, 3–4power supplies, 91–95radio-telemetry, 93–95reject systems, 226–227rotation speed, 128–129, 169–170signal display, 95–97simulators, 214slip-ring gears, 92, 93, 94thermal errors, 102–103upper arm, 101–104
errors in gauging, 102–104waveform, 136weighing systems, 227–228see also computer-controlled tablet presses; eccentric
presses; instrumentation of presses; punch;rotary presses
tablet weightcomputer-controlled systems, 229, 230, 235–239,
236control
automatic, 167using compression force measurement, 223–225
uniformity, 227–228weighing systems, 227–228
tamping pins, 209–210instrumented, 212
tape drives, 163tapes for handling strain gauges, 62telemetry, force calibration, 142temperature, thermodynamic, 5temperature coefficient of resistivity, 36, 37
conductive plastics film, 71temperature compensation, load cells, 45terminals, strain gauges, 62thermal drift, 34–35, 38, 43thermal output, 18, 19thermoelastic stress analysis, 29–30tie rods, 112, 114
Index 257

time, SI unit, 5titanium, 61transducers, 3, 4
AC–AC, 68calibration, 139–146
gauge blocks, 142–143capacitative, 73DC–DC, 68displacement, 123
linear inductive, 68–69fiber optic, 75–76force indirect calibration, 140–141gauging, 67, 121
fitting, 126–127Hall effect, 70–71inductive, 72–73, 125inductive element, 78linear inductive displacement, 68–69linear magnetoresistive, 69–70magnetorestrictive, 73–74non-linear signals, 146optical, 75–76optical grading, 76–77optical velocity, 81piezoelectric, 41–43remote capacitative, 73remote inductive, 72–73, 125short-scale, 120signal, 93strain-gauge conversion, 72ultrasonic, 74–75variable capacitance, 69velocity, 81–82, 125see also displacement transducers
transformervariable turns-ratio, 69see also linear variable-differential transformer
(LVDT)transient suppressors, solid-state, 91
triaxial compression system, 200tweezers, 63
ultrasonic transducers, 74–75ultraviolet recorders, high-speed, 95–96, 97units of measurement, 4–6
derived, 5–6universal serial bus (USB) interface, 159USB analogue converter, 161USB interface, 159
variable turns-ratio transformer, 69velocity, 6velocity transducers, 81–82, 125
capacitative, 82inductive, 81–82optical, 81
vernier scale, 144
waveform fuzziness, 102Weibull function, 182weighing
force measurement, 11tablet press systems, 227–228see also tablet weight
Wheatstone bridge circuit, 32–38bending, 36–37completion resistors, 37–38excitation level, 87–88excitation voltage, 33, 38output linearisation, 36quarter-bridge configuration, 33, 34stretching, 36–37zero drift, 34–35
work, SI unit, 5–6
Young’s modulus, 12–13, 110, 111, 175
zero drift, 34–35, 43zip drives, 163
258 Index


![fileFish Oil &Flaxseed Oil (Tablet]capsule form:) Glucosamine (Tablet]capsule form') Gold Bond (Medicated powder:Soft plastic container only. 20 oz. max.) Guaifenesin (Expectorant](https://static.fdocuments.in/doc/165x107/5e0f755b4f385423697f04ac/oil-flaxseed-oil-tabletcapsule-form-glucosamine-tabletcapsule-form.jpg)


