Tableau in The BI Survey 12 · Oracle OBIEE (5) Information Builders (4) MicroStrategy (3) Average...
14
1 Tableau in THE BI SURVEY 12 Tableau in THE BI SURVEY 12ashboards THE BI SURVEY The Customer Verdict The world’s largest survey of business intelligence software users 12 11 This document is a specially produced summary by BARC of the headline results for Tableau This document is not to be shared, distributed or reproduced in any way without first purchasing licensing rights and the express prior permission of BARC.
Transcript of Tableau in The BI Survey 12 · Oracle OBIEE (5) Information Builders (4) MicroStrategy (3) Average...
1 Tableau in THE BI SURVEY 12 Tableau in TH
E BI SU
RVEY
12ashboards
THE
BI SURVEY 11 SURVEY
The Customer Verdict The world’s largest survey of business intelligence software users
1211
This document is a specially produced summary by BARC of the headline results for Tableau
This document is not to be shared, distributed or reproduced in any way without first purchasing licensing rights and the express prior permission of BARC.
2 Tableau in THE BI SURVEY 12
Table of Contents
Tableau in THE BI SURVEY 12 ............................................................................................... 3
Tableau overview ................................................................................................................ 3
Tableau customer responses .............................................................................................. 3
Product usage ................................................................................................................... 4
Customer demographics ................................................................................................... 4
Product penetration .......................................................................................................... 4
Number of users ............................................................................................................... 4
Peer Groups ............................................................................................................................. 5
KPI Results for Tableau in Peer Group “Large International vendor” .................................. 6
Summary ................................................................................................................................ 13
Marketing Statements ............................................................................................................ 13

3 Tableau in THE BI SURVEY 12
Tableau in THE BI SURVEY 12 Tableau overview Tableau is a business analytics company with data visualization at its core. The company was founded in 2003. Tableau is growing extremely quickly with revenues increasing by over one hundred percent in 2010 and 2011. It now has over 300 employees. The core products use an underlying technology called VizQL that was invented by Tableau’s co-founders in the late nineties at Stanford University. VizQL is a patented query language that translates visual, drag-and-drop actions into a database query and then expresses the response graphically. Tableau is one of the most popular visual exploration products in the world. Tableau is geared to business users with simple data management tools and installation. The company also offers a server product that can be used to distribute interactive analytics, dashboards and reports but does not provide any additional authoring tools.
Tableau customer responses This is the second year that Tableau features in The BI Survey. It appeared this year with a healthy sample of 76 users. Two thirds of respondents reported that they were using Tableau 7, with the rest stating they were running Tableau 6.
4 Tableau in THE BI SURVEY 12
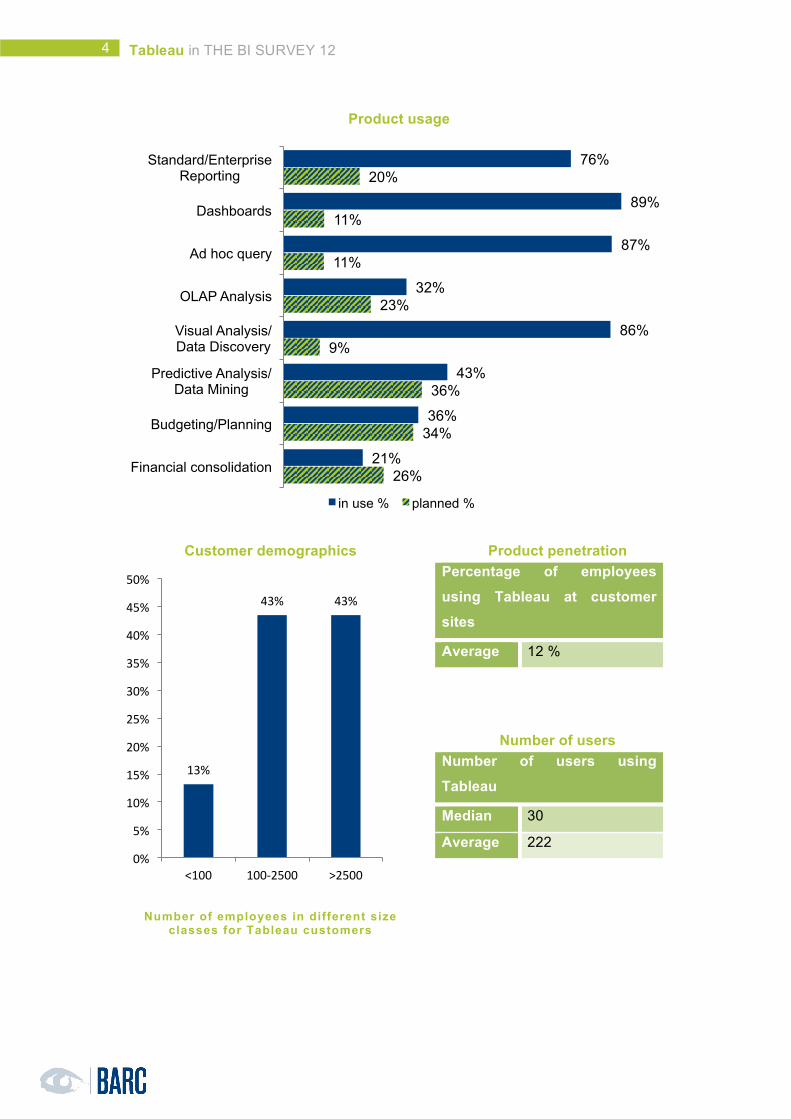
Product usage
Customer demographics
Number of employees in different size classes for Tableau customers
Product penetration Percentage of employees
using Tableau at customer
sites
Average 12 %
Number of users Number of users using
Tableau
Median 30
Average 222
76%
89%
87%
32%
86%
43%
36%
21%
20%
11%
11%
23%
9%
36%
34%
26%
Standard/Enterprise Reporting
Dashboards
Ad hoc query
OLAP Analysis
Visual Analysis/ Data Discovery
Predictive Analysis/ Data Mining
Budgeting/Planning
Financial consolidation
in use % planned %
13%
43% 43%
0%
5%
10%
15%
20%
25%
30%
35%
40%
45%
50%
<100 100-‐2500 >2500

5 Tableau in THE BI SURVEY 12
Peer Groups
Peer groups are used to ensure similar products are compared against each other both in fairness to the vendor and for the benefit of the customer. The groups are essential to allow fair and useful comparisons of products that are likely to compete. The peer groups are primarily data-driven and are based on how customers say they use the product. Tableau features in the following peer group:
- Large International vendor
For more details on the KPIs see the ‘KPIs and Dashboards’ document.

6 Tableau in THE BI SURVEY 12
KPI Results for Tableau in Peer Group “Large International vendor”
Top ranked Large International vendor in business benefits achieved
Top ranked Large International vendor in goal achievement
0.7282
0.75
0.82
0.93
0.98
1.00
1.00
1.14
0.71
SAP BO WebI (8)
Oracle OBIEE (7)
IBM Cognos BI (6)
Microsoft SSRS (5)
Information Builders (4)
MicroStrategy (3)
Average
QlikTech (2)
Tableau (1)
1.15 max
min
1.00
1.00
0.82
0.83
0.90
0.91
0.93
1.02
1.06
1.09
0.81
Oracle OBIEE (8)
IBM Cognos BI (7)
SAP BO WebI (6)
Microsoft SSRS (5)
MicroStrategy (4)
Average
QlikTech (3)
Information Builders (2)
Tableau (1)
1.10 max
min
1.00
1.00

7 Tableau in THE BI SURVEY 12
Top ranked Large International vendor in business achievement
Significantly, Tableau easily beats QlikTech in this category. This is a good result as BARC would expect Tableau to compete with QlikTech regularly in projects to support end users in visual data exploration.
Top ranked Large International vendor in variety of data types
Tableau supports a broad range of data types and allows end users to combine and analyze all relevant information within a company. Tableau is used heavily to support such scenarios.
0.79
0.81
0.82
0.92
0.96
1.01
1.02
1.11
0.78
Oracle OBIEE (8)
SAP BO WebI (7)
IBM Cognos BI (6)
Microsoft SSRS (5)
MicroStrategy (4)
Average
QlikTech (3)
Information Builders (2)
Tableau (1)
1.12 max
min
1.00
1.00
0.76
0.88
0.96
1.00
1.02
1.04
1.13
1.15
1.30
0.75
Information Builders (8)
MicroStrategy (7)
SAP BO WebI (6)
Average
IBM Cognos BI (5)
Microsoft SSRS (4)
QlikTech (3)
Oracle OBIEE (2)
Tableau (1)
1.31 max
min
1.00
8 Tableau in THE BI SURVEY 12
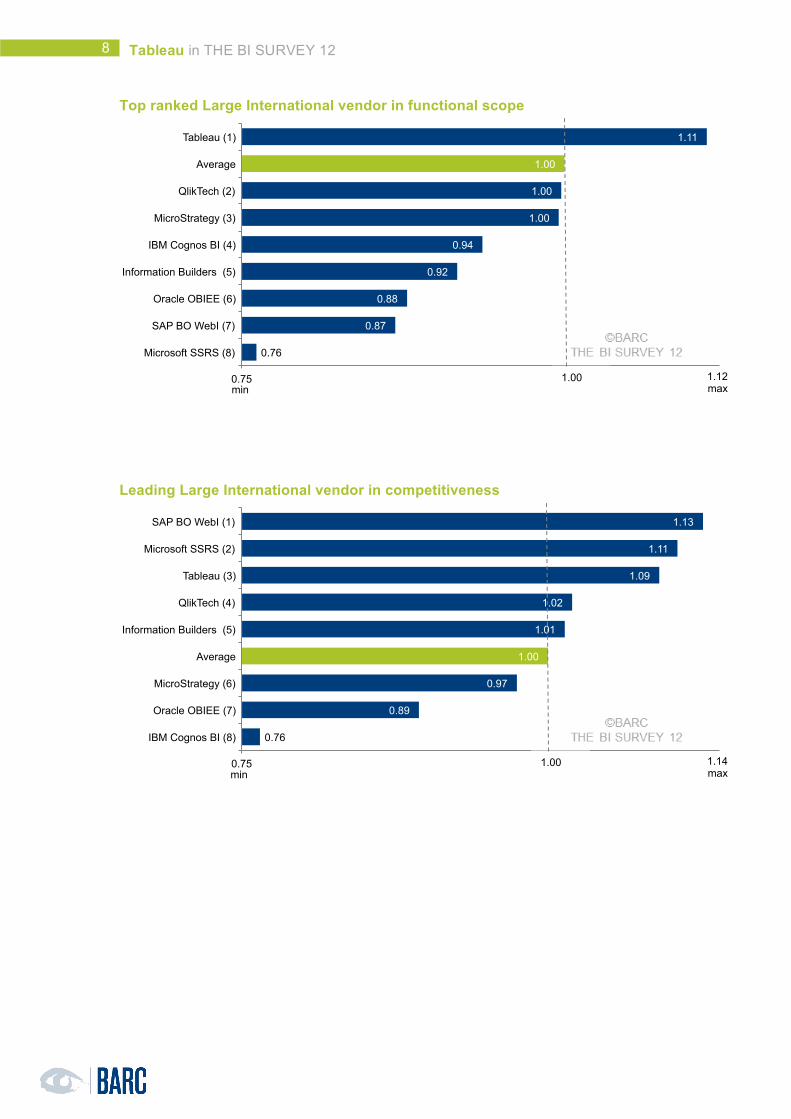
Top ranked Large International vendor in functional scope
Leading Large International vendor in competitiveness
0.76
0.87
0.88
0.92
0.94
1.00
1.00
1.00
1.11
0.75
Microsoft SSRS (8)
SAP BO WebI (7)
Oracle OBIEE (6)
Information Builders (5)
IBM Cognos BI (4)
MicroStrategy (3)
QlikTech (2)
Average
Tableau (1)
1.12 max
min
1.00
0.76
0.89
0.97
1.00
1.01
1.02
1.09
1.11
1.13
0.75
IBM Cognos BI (8)
Oracle OBIEE (7)
MicroStrategy (6)
Average
Information Builders (5)
QlikTech (4)
Tableau (3)
Microsoft SSRS (2)
SAP BO WebI (1)
1.14 max
min
1.00

9 Tableau in THE BI SURVEY 12
Top ranked Large International vendor user recommendation
Feedback from this year’s survey participants reveals that Tableau is highly recommended for supporting customer requirements. BARC’s field experiences corroborate this result.
Top ranked Large International vendor in collaboration
One of the major market trends of 2012 is the support of workflows and collaboration between users. Tableau achieves great results here and is one of the best products in this important category.
0.87
0.94
0.95
1.00
1.00
1.03
1.04
1.05
1.05
0.86
SAP BO WebI (8)
IBM Cognos BI (7)
Oracle OBIEE (6)
Average
Microsoft SSRS (5)
Information Builders (4)
QlikTech (3)
MicroStrategy (2)
Tableau (1)
1.06 max
min
1.00
0.49
0.49
0.54
0.65
0.67
0.80
0.88
1.00
1.43
0.48
Oracle OBIEE (8)
MicroStrategy (7)
IBM Cognos BI (6)
SAP BO WebI (5)
Microsoft SSRS (4)
Information Builders (3)
QlikTech (2)
Average
Tableau (1)
1.44 max
min
1.00

10 Tableau in THE BI SURVEY 12
Top ranked Large International vendor in visual analysis
Tableau wins this key functional category for this peer group, beating all its competition. A good win for Tableau.
Top ranked Large International vendor in innovation
Tableau’s outstanding visual analysis functions and innovative collaboration features are the major reasons for its top ranking in the ‘innovation’ KPI.
0.31
0.42
0.46
0.55
0.67
0.74
1.00
1.78
2.20
0.30
Microsoft SSRS (8)
IBM Cognos BI (7)
SAP BO WebI (6)
Oracle OBIEE (5)
MicroStrategy (4)
Information Builders (3)
Average
QlikTech (2)
Tableau (1)
2.21 max
min
1.00
0.38
0.38
0.51
0.80
0.81
1.00
1.00
1.38
1.52
0.37
Microsoft SSRS (8)
SAP BO WebI (7)
IBM Cognos BI (6)
Oracle OBIEE (5)
Information Builders (4)
MicroStrategy (3)
Average
QlikTech (2)
Tableau (1)
1.53 max
min
1.00
11 Tableau in THE BI SURVEY 12
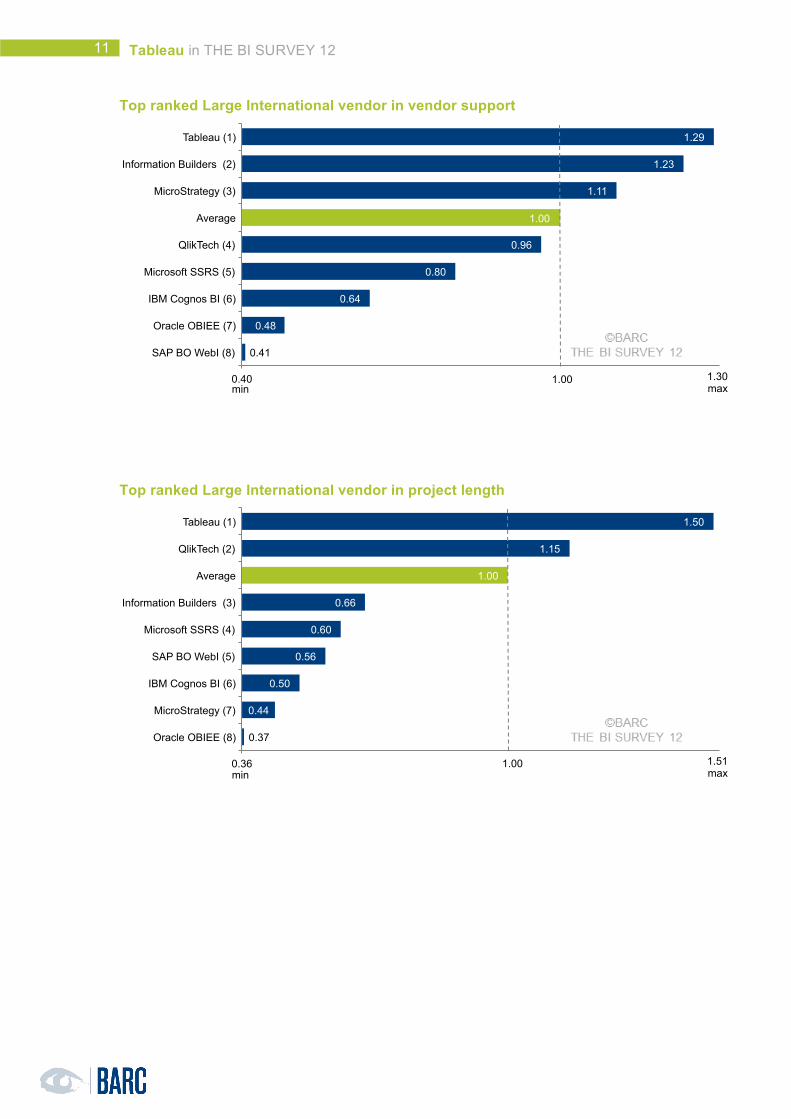
Top ranked Large International vendor in vendor support
Top ranked Large International vendor in project length
0.41
0.48
0.64
0.80
0.96
1.11
1.23
1.29
0.40
SAP BO WebI (8)
Oracle OBIEE (7)
IBM Cognos BI (6)
Microsoft SSRS (5)
QlikTech (4)
Average
MicroStrategy (3)
Information Builders (2)
Tableau (1)
1.30 max
min
1.00
1.00
0.37
0.44
0.50
0.56
0.60
0.66
1.00
1.15
1.50
0.36
Oracle OBIEE (8)
MicroStrategy (7)
IBM Cognos BI (6)
SAP BO WebI (5)
Microsoft SSRS (4)
Information Builders (3)
Average
QlikTech (2)
Tableau (1)
1.51 max
min
1.00

12 Tableau in THE BI SURVEY 12
Top ranked Large International vendor in self service
In 2012 self service has become one of the most important areas for BI Vendors. Companies are striving for more agile environments and need technology that supports the self service approach. Tableau shows itself to be a leader in this area.
Top ranked Large International vendor in agility
End users have responded well to Tableau’s high usability and flexibility, resulting in a top score in the ‘agility’ category.
0.94
0.94
0.95
0.97
0.97
0.98
0.99
1.13
0.93
SAP BO WebI (8)
MicroStrategy (7)
Microsoft SSRS (6)
Oracle OBIEE (5)
QlikTech (4)
IBM Cognos BI (3)
Information Builders (2)
Average
Tableau (1)
1.14 max
min
1.00
1.00
0.67
0.69
0.74
0.75
0.77
0.82
1.00
1.06
1.31
0.66
Oracle OBIEE (8)
MicroStrategy (7)
IBM Cognos BI (6)
SAP BO WebI (5)
Microsoft SSRS (4)
Information Builders (3)
Average
QlikTech (2)
Tableau (1)
1.32 max
min
1.00

13 Tableau in THE BI SURVEY 12
Summary
Tableau is one of the market leaders in data visualization and agile data exploration and supports a broad range of user requirements. Both small and larger companies rate Tableau as one of the best solutions in these areas. Customers have responded positively to Tableau in key areas including self service, visualization, collaboration and business achievement.
Marketing Statements
Large International Vendor peer group Top ranked Large International vendor in business benefits achieved
Top ranked Large International vendor in goal achievement
Top ranked Large International vendor in business achievement
Top ranked Large International vendor in variety of data types
Top ranked Large International vendor in functional scope
Leading Large International vendor in competitive win rate
Leading Large International vendor in competitiveness
Top ranked Large International vendor user recommendation
Top ranked Large International vendor in collaboration
Leading Large International vendor in mobile BI
Top ranked Large International vendor in visual analysis
Top ranked Large International vendor in innovation
Top ranked Large International vendor in vendor support
Top ranked Large International vendor in project length
Top ranked Large International vendor in self service
Top ranked Large International vendor in agility

14 Tableau in THE BI SURVEY 12
Copyright © BARC GmbH 2012. All rights reserved. Business Application Research Center - BARC GmbH Steinbachtal 2b 97082 Würzburg Germany +49 (0)931 880651-0


![Tableau Presantation.ppt [Kompatibilitetstilstand] · Why Tableau Tableau a great Tool for visualization, BI and data analytics. • Ideal for complex visualization • Interactive](https://static.fdocuments.in/doc/165x107/5ec5464447074405911878d3/tableau-kompatibilitetstilstand-why-tableau-tableau-a-great-tool-for-visualization.jpg)