TABLE OF CONTENTS - Tzonline · vi productive sectors. The publications so far have proved to be of...
183
Transcript of TABLE OF CONTENTS - Tzonline · vi productive sectors. The publications so far have proved to be of...


i
TABLE OF CONTENTS Pages
FOREWORD..........................................................................................................................v
SECTION I............................................................................................................................1
1.0 LAND, PEOPLE AND CLIMATE..........................................................................1
1.1 Geographical Location............................................................................................. 1 1.2 Land Area .................................................................................................................. 1 1.3 Topography and Drainage:..................................................................................... 2 1.4 Climate, Soils and Vegetation ................................................................................. 3 1.5 Agro - Economic Zones:.......................................................................................... 4 1.6 Administrative Units ................................................................................................ 7 1.7 Ethnicity..................................................................................................................... 8 1.8 Population Characteristics ...................................................................................... 9 1.9 Migration and Employment................................................................................... 23
SECTION II........................................................................................................................28
2.0 REGIONAL ECONOMY.............................................................................................28
2.1 Introduction:............................................................................................................ 28 2.2 Regional GDP and Per Capita GDP....................................................................... 29 2.3 PRODUCTIVE SECTORS.......................................................................................... 31
2.3.1 Agriculture............................................................................................ 31 2.3.2 Livestock............................................................................................... 42 2.3.3 Natural Resources ............................................................................... 50 2.3.4 Mining................................................................................................... 66 2.3.5 Industry and Trade.............................................................................. 66
SECTION III ......................................................................................................................67
3.0 ECONOMIC INFRASTRUCTURE............................................................................67 3.1 Introduction............................................................................................................. 67 3.2 Roads........................................................................................................................ 67 3.3 Railway Transport .................................................................................................. 74 3.4 Air Services ............................................................................................................. 74 3.5 Communication Facilities....................................................................................... 74 3.6 Energy ...................................................................................................................... 75

ii
SECTION IV.....................................................................................................................77
4.0 SOCIAL SERVICES....................................................................................................77
4.1 EDUCATION: ................................................................................................................. 77 4.1.1 Primary Education ............................................................................................ 77 4.1.2 Secondary Education....................................................................................... 84 4.1.3 Adult Education ............................................................................................... 87
4.2 HEALTH .......................................................................................................................... 89 4.2.1 Introduction ...................................................................................................... 89 4.2.2 Morbidity and Mortality ................................................................................. 90 4.2.3 Health Infrastructure........................................................................................ 90 4.2.4 Child Immunization........................................................................................... 92 4.2.5 Maternal Mortality........................................................................................... 93 4.2.6 Infant and Under Five Mortality................................................................... 97 4.2.7 Child Nutrition Status.................................................................................... 104 4.2.8 AIDS................................................................................................................. 105 4.2.9 Life Expectancy............................................................................................... 106
4.3 WATER SUPPLY ......................................................................................................... 107 4.3.1 Introduction .................................................................................................... 107 4.3.2 Rural Water Supply........................................................................................ 110 4.3.3 Urban Water Supply ...................................................................................... 112 4.3.4 Sanitation......................................................................................................... 116
SECTION V .................................................................................................................... 118
5.0 OTHER DEVELOPMENT RELATED ISSUES .............................................. 118
5.1 WOMEN IN DEVELOPMENT ............................................................................... 118 5.2 COOPERATIVES..................................................................................................... 119 5.3 NGOS ACTIVITIES IN THE REGION................................................................... 120 5.4 DONOR PROJECTS................................................................................................. 122

iii
SECTION VI.................................................................................................................. 124
6.0 POTENTIAL INVESTMENT AREAS.................................................................... 124
6.1 AGRICULTURE ...................................................................................................... 124 6.2 LIVESTOCK............................................................................................................. 124 6.3 FORESTRY .............................................................................................................. 125 6.4 BEEKEEPING.......................................................................................................... 127 6.5 MINING................................................................................................................... 127 6.6 INDUSTRIAL DEVELOPMENT ............................................................................. 127 6.7 ROADS..................................................................................................................... 128 6.8 COMMUNICATION NETWORK............................................................................ 128 6.9 ENERGY .................................................................................................................. 128 6.10 HEALTH ................................................................................................................. 128 6.11 WATER SUPPLY ................................................................................................... 129 6.12 EDUCATION ........................................................................................................... 129 6.13 WOMEN DEVELOPMENT .................................................................................... 130 ANNEXES
ANNEX ″″ A″″ .................................................................................................................. 131
Tabora Region in a Nutshell........................................................................................ 131
ANNEX ″″ B″″ ................................................................................................................. 145
Igunga District Summary (1996)............................................................................ 145
ANNEX ″″ C″″ ................................................................................................................. 150
Nzega District Summary (1996) ............................................................................. 150
ANNEX ″″ D″″ .................................................................................................................. 155
Tabora (and Sikonge) District Summary (1996)................................................ 155
ANNEX ″″ E″″ ................................................................................................................... 161
Urambo District Summary 1996................................................................................ 161

iv
ANNEX ″″ F″″ ..................................................................................................................... 167
1.0 GENERAL INFORMATION ABOUT TANZANIA ....................................... 141
Population.............................................................................................................. 142 Land Use................................................................................................................ 143 Arable Land:.......................................................................................................... 169 Lakes....................................................................................................................... 169 Mountain summits (metres above sea level).................................................... 169 Climate.................................................................................................................... 170
1.2 SOCIAL SERVICES........................................................................................... 171
Health facilities...................................................................................................... 171 Education............................................................................................................... 171
NATIONAL PARKS ....................................................................................................... 172

v
FOREWORD
1. As we approach the 21st Century the problems facing rural areas in developing countries like Tanzania are numerous and formidable. Social and Economic services are deteriorating and proving to be unsustainable; school enrollment rates are declining; food situation is precarious; infant and maternal mortality rates continue to be high; unemployment is on the rise triggering off mass migration of youth from the rural areas into already overcrowded urban centres; in Tabora Region, for example, land pressure is escalating and deforestation is going on at an alarming rate.
2. This situation has arisen because of many factors including ill -
prepared rural development programmes and weak monitoring and supervision of the implementation of development programmes and sectoral strategies. The observed shortcomings in the policy formulation, project identification, design, and implementation in the developing countries is in turn attributed to lack of reliable and adequate data and information on the rural development process.
3. The publication of Regional Socio-economic Profiles series by
the Planning Commission in collaboration with Regional Commissioner's offices should be viewed as a fruitful attempt towards finding solutions to the existing problem of data and information gap.
4. The Regional Profile series cover a wide range of data and
information on geography, population, social economic parameters, social services, economic infrastructure and

vi
productive sectors. The publications so far have proved to be of high demand and a vital source of information to many policy makers, planners, researchers, donors and functional managers.
The Planning Commission has found it a worthwhile effort to
extend the exercise to cover even more regions. Readers are invited to make suggestions and constructive criticisms which can assist in improving the quality and effectiveness of future Profiles.
5. I would like to take this opportunity to acknowledge with
thanks once again the financial support of the Royal Norwegian Embassy which facilitated the preparation of the Tabora Region Socio-Economic Profile. I would also like to thank both the Planning Commission and Tabora Regional Planning Staff who put a lot of effort into ensuring the successful completion of this task.
Nassoro W. Malocho (MP)
MINISTER OF STATE PLANNING AND PARASTATAL SECTOR REFORM
May, 1998

1
SECTION I 1.0 LAND, PEOPLE AND CLIMATE 1.1 Geographical Location
Tabora Region is located in Mid-Western part of Tanzania on the central plateau between latitude 40-70 South and longitude 310 - 340 East. The region shares a border with Shinyanga region in the North, Singida region in the East, Mbeya and Rukwa regions in the South while the Western border is shared with Kigoma region.
1.2 Land Area
Tabora region has an area of 76,151 sq.km. representing 9% of the land area of Mainland Tanzania. A total of 34,698 sq.km. are Forest Reserves and 17,122 sq.km. are Game Reserves.
Fig. 1 Land classification in Tabora region
Forest Reserves
67%
Game Reserves
33%

2
1.3 Topography and Drainage:
(i) Topography: The south west and north central portions of the region are divided by a watershed which runs from east to west. From the water-shed gently rolling country bisected by broad badly defined drainage lines (known as mbugas) drain to Ugalla River in the south west and the Igombe and later the Malagarasi River and Lake Sagara which form the western boundary of the region. In the north east, the topography is better defined but again the actual drainage line drain into Wembere River and its tributaries and eventually into lake Kitangiri. Most of the region lies at altitude between 1,000 and 1,500 metres with only two small areas in the northwest and south-east rising to some 1,800 metres above sea level.
(ii) Drainage: Tabora region is drained by the two river
systems of the Malagarasi and the Manonga - Wembere. The Malagarasi drains the southern and western part of the region into Lake Tanganyika and out into the Atlantic. The Manonga drains into the inland Lake Eyasi.
The extensive Malagarasi swamp covers the extreme western part of the region. The sedimentary Bukoba formation forms a dominant ridge line which block the drainage to the west resulting in the swampy lowland and broad Mbuga filled valleys which penetrates deeply into the south - central area of the region.
The flat low-lying areas are significant from hydrogeologic point of view. They are flooded during the rainy season and potentially water logged during the rest of the year.

3
Most of the rivers are dry river beds during the dry season and even during the rainy season the rivers fill the bank or overflow during a very short period and recede rapidly.
The main cause of these short peaks is the vegetation type of the region. Much of the miombo forest floor is bare of vegetative cover. The rainfall runs off the bare surface and very little water infiltrates into the subsurface soils.
1.4 Climate, Soils and Vegetation
Tabora Region has a warm climate with temperatures reaching their peak in September - October just before the onset of the rainy season. The daily mean temperature is around 230C. There is a slightly cooler period from May to July, marked by onset of dry winds which continue until October. Rainfall is seasonal, falling almost from June to October during which occasional showers can be expected. In the West the rainfall totals over 1000 mm, while in the east it drops to 700 mm or less.
Soil vary widely, ranging from sandy loam’s in the South Centres and West to heavy (black/dark brown) soils in poorly drained areas especially in the North of the region. Vegetation consists of upland vegetation which include woodland, bushland thicket, grassland; lowland or wetland vegetation consisting of wooded grassland and swamps. Woodland is the natural vegetation over most of the region and can be divided into two groups: Miombo woodland and Acacia, Cambretum and Albizia species. Bushland and bushed grassland considered to be a degraded form of a number of different vegetation types which have been cleared, browsed and selectively grazed for many years are the most

4
widespread types in the North East. Large areas are covered by “thorn-thicket” which is especially extensive on the lowland bordering the Manonga and Wembere valleys. A dense, impenetrable deciduous thicket of multi-stemmed shrubs known as Itigi thicket, occurs in the east of the region. Wooded grassland is found in mbuga and consists of tall coarse grasses with less than 50% of trees while grassland is found in the wetter mbugas which are invariably flooded for long periods during the wet season within areas of wooded grassland and on the edges of swamp vegetation.
1.5 Agro - Economic Zones:
Tabora region which is reasonably homogenous regarding topography and temperature has major ecological differences which if combined with other factors can be divided into five Economic Zones as follows.
- Western Fringe Zone: This area which follows the
Western and South-Western boundary of the region has a high rainfall of over 1000mm, is sparsely populated and varies in elevation from 1000 to 1500 metres. It is characterized by mainly flat and featureless topography with the area gradually sloping away to the river flood plains in the west and south adjacent to the Ugalla and Malagarasi Rivers and Lake Sagara.

5
Soils vary from reddish sandy loams on the top of the ridges through grey sandy loams down to heavy black alluvial soils on the flood plains. The vegetation on the better drained areas is composed of Brachystegia - Jubernadia woodland with an undercover of grassland composed mainly of Hyperrhenia with Echinocloa on the river and lake edges. It is an area of great potential but development has been limited by the low population level as a result of the presence of tsetsefly and poor road communication..
The cropping pattern is characterized by subsistence crops such as maize, cassava, beans, tobacco and paddy being grown in the wetter areas. Cattle population is low due to the presence of tsetsefly. Fishing is concentrated on Lake Sagara.
- The Miombo Zone: This zone is the most extensive in
the region and covers about 6,000,000ha. Rainfall varies from some 700 mm in the East to over 1000 mm in the West. Most of the zone is gently undulating with occasional granite hills emerging from the ridges, and low swampy depressions forming the drainage lines between the ridges. Elevation is generally between 1000 - 1500 metres with some areas on the eastern border of the Zone rising to 1800 metres. Soils on the upper slopes are mainly red brown sandy loams underlain by light sandy clays while soils in the lower slopes are drained dark grey sandy loams with black clays in the depressions. The dominant trees are Brachystegia and Jubernadia with underlying grass cover

6
of Hyperrhenia. The soils are of medium fertility when first cleared of woodland but both structure and fertility decline under cropping.
Cropping is largely confined to tobacco, maize, cassava and beans with paddy being grown in “mbugas”. Saw-milling (of indigenous species) and extensive beekeeping are features of non-settled areas.
- The North East Zone: This zone is located in the
North-East corner of the region bordering on the Manonga River to the North and Wembere plains in the East. Rainfall is between 700 mm in the East to 850 mm in the West. The zone covers an area of about 350,000 ha. The topography is gently rolling with poorly defined drainage lines. There is a low escarpment in the North where the plain falls to the area adjacent to Manonga Valley. This zone is densely populated mainly due to immigration from the more densely settled regions to the North. Soils are mainly black clays or clay loams (black cotton soils) which make the zone an important cotton growing area with maize and sorghum being grown as food crops. There is very large cattle population and cattle are extensively used for ploughing.
- East Central Zone: The zone is in the North East of the
region between the North East Zone and the Miombo Zone and includes the Wembere Plains. It is an area with more incised drainage than the rest of the region with the exception of the area extreme East which is the flood plain

7
of the Wembere River. Altitude varies from 1000 to 1800 metres and rainfall from 500 mm to 800 mm. Vegetation and soils are mixed in the Western portion of the zone. The soils are sandy loams with the vegetation consisting of belts of Miombo Woodlands interspersed with Cambretum bush. To the East, Acacia species become dominant on the heavier soils, while the Wembere plains consist of grassland with small area of Acacia. The zone has pockets of tsetsefly infestation.
Cropping is confined to cotton, maize, sorghum, groundnuts and cassava. The north of the zone has a large cattle population with the Wembere plains being extensively used for dry season grazing.
- The North West Zone: This zone is situated on the
North, West of North East Zone. The topography is gently rolling with broad “mbugas”. The rainfall varies from 700 mm to 1000 mm and altitude from 1000 to 1500 metres. The soils vary from dark clays in the mbugas to light sandy soils on the ridges. Natural vegetation has largely been cut out but there are broad belts of scrub Cambretum on the poorer soils. Crops are paddy, maize, groundnuts and some cotton. This zone has a large cattle population.
1.6 Administrative Units
Tabora region which before 1996 was divided into four administrative districts of Igunga, Nzega, Tabora and Urambo has been reorganized into five administrative districts. Sikonge is the

8
newly established district excised from Tabora district. The districts are divided into 18 Divisions which in turn are Subdivided into 133 wards comprising a total of 455 villages.
TABLE I-1: AREA AND ADMINISTRATIVE STRUCTURE OF TABORA REGION
District Area % Number of
Km2 Divisions Wards Villages
Igunga
Nzega
Tabora
Sikonge
Urambo
6788
6961
*20104
*21000
21299
8.9
9.1
26.4
27.6
28.8
4
4
4
2
4
26
37
36
8
26
96
131
106
31
91
Total Region 76151 100.0 18 133 455
*Estimates Source: Regional Brief (1997)
Fig. 2: Distribution of Area in Km2 by district, Tabora region
Igunga Nzega Tabora Sikonge Urambo0
5000
10000
15000
20000
25000
Igunga Nzega Tabora Sikonge Urambo
1.7 Ethnicity
The name Tabora originated from Matoborwa meaning sweet potatoes which was a staple food for Nyamwezi people who form large population of Tabora. Visitors could not pronounce the

9
word Matoborwa instead they called it Tobora which later on came to be known as Tabora.
The name Nyamwezi also came into history around 1830 after formation of Kahama town which is also occupied by Nyamwezi people. As people were travelling to and from Kahama Arabs used to ask them, “where were they going or coming from.” The answer was “Unyamwezini” meaning a place where the moon rises.
1.8 Population Characteristics 1.8.1 Size, Distribution and Growth:
The population size of Tabora Region is recorded in the 1967, 1978 and 1988 population censuses as shown in Table I -2 which includes the densities of the population per square kilometres in respective years.
TABLE I -2: POPULATION OF TABORA REGION 1967, 1978 AND 1988
Year 1967 1978 1988 Annual Average Growth
1967/1978 1978/1988 Population 502,068 817,907 1,036,293 4.5 2.4 Population Density
6.6 10.7 13.6 - -
Source: Compiled from Population Censuses 1967, 1978 and 1988
Fig. 3 (a): Population of Tabora Region, 1967, 1978 and 1988

10
1967 1978 19880
200000
400000
600000
800000
1000000
1200000
1967 1978 1988
Fig. 3 (b): Population Density of Tabora Region, 1967, 1978 and 1988
0
2
4
6
8
10
12
14
1967 1978 1988
The population of Tabora Region increased by 63% between 1967 and 1978 and more than 26% between 1978 and 1988. However in order to get a proper picture, the region’s population and density has to be matched against other regions in Tanzania Mainland. The picture which emerges from Table I - 3 below show that although Tabora Region is the second largest region in the country, next to Arusha Region, the population density is only 14 people per sq.km. in 1988 far below the national average.
TABLE I -3 POPULATION DISTRIBUTION BY REGIONS AND
DENSITY, TANZANIA MAINLAND 1988
REGION LAND AREA
SQ.KM.
POPULATION POPULATION DENSITY
PER SQ.KM.
POPULATION AS % OF MAINLAND

11
TABORA 76,120 1,036,294 14.0 4.6 Arusha Dodoma Iringa Kilimanjaro Kagera Kigoma Lindi Mwanza Morogoro Mbeya Mara Mtwara Coast/DSM Ruvuma Rukwa Singida Shinyanga Tanga
82,098 41,311 56,850 13,309 28,456 37,040 67,000 20,095 70,799 60,350 21,760 16,710 33,800 66,477 68,635 49,341 50,760 26,677
1,352,225 1,235,277 1,193,074 1,108,699 1,313,639 853,263 646,345 1,878,271 1,222,737 1,476,261 952,616 875,977 1,998,865 783,327 704,050 791,814 1,763,960 1,280,262
16.5 30.0 21.3 83.7 46.6 23.1 9.6 93.5 17.0 24.0 43.7 53.2 59.1 12.0 10.1 16.0 34.9 48.1
6.0 5.5 5,3 4.9 5.8 3.1 2.9 8.4 5.4 6.6 4.2 4.0 8.9 3.5 3.1 3.5 7.9 5.7
Total Mainland
887,588 22,466,955 25.3 100.0
Fig. 4 (a): Distribution of land area (sq.km.) of Tabora Region to the Total Mainland
Tabora Region
8%
Total Mainland
92%

12
Fig. 4 (b): Distribution of population of Tabora Region to the Total Mainland, 1988
Tabora Region
4%
Total Mainland
96%

13
Fig. 4 (c): Distribution of population as percentage for Tabora Region to the Total Mainland, 1988
Tabora Region
4%
Total Mainland
96%
Population distribution in the region is uneven e.g. Tabora and Urambo Districts which cover about 82% of the regions area have only 8 people per sq.km. as compared to Igunga and Nzega Districts which cover a total of 18% of the regions area and have 30 and 42 people per sq.km. respectively as shown in Table I - 4. The population densities of the districts in Tabora region reveal that there is already a mounting land pressure in Igunga and Nzega districts (increasing population and livestock densities) which call for serious concern in future compared to other districts. TABLE I - 4: POPULATION DISTRIBUTION BY SEX AND DENSITY DISTRICTWISE, TABORA REGION, 1988
DISTRICT
POPULATION
LAND AREA
POPULATION DENSITY
PERS-ONS/KM2
MALE FEMALE TOTAL % Sq.Km %
Igunga
Nzega
*Tabora
Urambo
99,854
144,483
173,393
91,933
103,243
151,130
176,754
95,503
203,097
295,613
350.147
187,436
19.6
28.5
33.8
18.1
6,788
6,961
41,103
21,299
8.9
9.1
54.0
28.0
29.9
42.5
8.5
8.8
Total Region 509,663 526,630 1,036,293 100.0 76,151 100.0 13.6

14
*Includes Sikonge District Source: Population Census, Regional Profile 1988

15
FIG. 5: Population Distribution by District and Sex , 1988
Igunga Nzega Tabora Urambo0
50000
100000
150000
200000
Igunga Nzega Tabora Urambo
Male Female
Table I - 5 reveals that during 1967/78 Tabora region had high annual population growth rate of 4.5% compared to 3.2% of Mainland. When compared to subsequent ten years of 1978/88 the rate had gone down to 2.4% compared to 2.8 of Mainland.
TABLE I -5: ANNUAL POPULATION GROWTH BY DISTRICTS 1967/78, 1978/1988, TABORA REGION
DISTRICT
POPULATION
ANNUAL POPULATION GROWTH
1967 1978 1988 1967/78 1978/88 Igunga Nzega Tabora (R) Urambo Tabora(U)
302,017
200,051
189,475
225,001 186,939 149,104 67,388
203,097
295,613 256,641 187,436 93,506
na
na
0.7
2.8 3.4 2.3 3.3
Total Region 502,068 817,907 1,036,293 4.5 2.4
Source: Population Censuses 1967, 1978 and 1988.

16
TABLE I - 6: POPULATION AND POPULATION GROWTH BY REGIONS 1978 AND 1988
REGION POPULATION ANNUAL GROWTH
1978 1988 1967/78 1978/88
Tabora Arusha Dodoma Iringa Kilimanjaro Kagera Kigoma Lindi Mwanza Morogoro Mbeya Mara Mtwara Dar es Salaam Ruvuma Rukwa Singida Shinyanga Tanga Coast
817,907 926,223 972,005 925,044 902,437 1,009,767 648,941 527,624 1,443,379 939,264 1,079,864 723,827 771,818 843,090 561,575 451,897 617,949 1,323,535 1,037,767 516,586
1,036,293 1,352,225 1,235,277 1,193,074 1,108,699 1,313,639 853,263 642,364 1,878,271 1,279,931 1,476,261 952,616 875,583 1,360,850 783,327 704,050 791,814 1,763,960 1,280,262 639,182
4.5 3.8 2.9 2.7 2.9 3.9 2.9 2.1 2.8 2.9 3.3 2.6 2.0 7.8 3.2 4.5 2.7 3.5 2.7 1.7
2.4 3.7 2.4 2.7 2.1 2.7 2.7 2.0 2.6 2.6 3.1 2.9 1.4 4.7 3.3 4.2 2.5 2.9 2.1 2.1
Total Mainland 17,036,499 22,474,580 3.2 2.8
1.8.2 Sex, Households and Age Groups:
Distribution of the population between sexes in 1988 census gives a regional average sex ratio of 97. This means that for every 100 females there are 97 males or there are a lot more women compared to men. Nzega and Urambo districts showed the biggest disparity in a number between the sexes in the region as compared to Tabora Urban. See Table I - 7

17
TABLE I - 7: POPULATION DISTRIBUTION BY SEX - 1988 TABORA REGION
District Male Female Total Sex Ratio
Igunga Nzega Tabora (R) Urambo Tabora (U)
99,854 144,483 126,681 91,933 46,712
103,243 151,130 129,960 95,503 46,794
203,097 295,613 256,641 187,436 93,506
96.7 95.6 97.5 96.3 99.8
Total Region 509,663 526,630 1,036,293 96.7
Source: Population Census, Regional Profile 1988
Fig.6: Population Distribution by District and Sex , Tabora Region, 1988
Igunga Nzega Tabora(R)
Urambo Tabora(U)
0
20000
40000
60000
80000
100000
120000
140000
160000
Igunga Nzega Tabora(R)
Urambo Tabora(U)
Male
Female
Table I - 8 show a different situation with respect to 1978 census.
While the regional average sex ratio remained essentially the same, District sex ratios varied greatly. Tabora district, both rural and urban showed more men than women. Thus while the sex ratio for Tabora rural was 100.1, it was 101.7 for Tabora urban or 100.6 for Tabora district as a whole.

18
TABLE I - 8 POPULATION DISTRIBUTION BY SEX - 1978 District Male Female Total Sex Ratio Igunga Nzega Tabora (R) Urambo Tabora (U)
93,299 109,149 93,561 74,414 33,979
96,176 115,852 93,378 74,690 33,409
189,475 225,001 186,939 149,104 67,388
97.0 94.2
100.1 99.6 101.7
Total Region 404,402 413,505 817,907 97.8
Source: Population Census, Regional Profile 1978.
Fig.7: Population Distribution by District and Sex , Tabora Region, 1978
Igunga Nzega Tabora(R)
Urambo Tabora(U)
0
20000
40000
60000
80000
100000
120000
Igunga Nzega Tabora(R)
Urambo Tabora(U)
Male
Female
TABLE I - 9: POPULATION DISTRIBUTION BY SEX IN RURAL AND URBAN IN 1988, TABORA REGION DISTRICT RURAL URBAN
MALE FEMALE TOTAL MALE FEMALE TOTAL Igunga Nzega Tabora (R) Urambo Tabora (U)
95,694 134,692 122,524 81,990 221
98,796 140,449 125,455 84,162 229
194,490 275,141 247,979 166,152 450
4,160 9,791 4,157 9,943 46,491
4,447 10,681 4,505 11,341 46,565
8,607 20,472 8,662 21,284 93,056
Total Region
435,121 449,091 884,212 74,542 77,539 152,081
Source: Population Census, Regional Profile 1988

19
There are 180,129 households in Tabora Region with an average household size of 5.7 according to 1988 census. Igunga District had the highest size at 6.4 while Urambo and Tabora Urban had the lowest at 5.3. See Table I-10
TABLE I-10 POPULATION AND HOUSEHOLD SIZE BY DISTRICT - 1988 TABORA REGION
DISTRICT TOTAL POPULATIO
N
NUMBER OS HOUSEHOLDS
AVERAGE HOUSEHOLD SIZE
Igunga Nzega *Tabora (R) Urambo Tabora (U)
203,097 295,613 256,641 187,436 93,506
31,793 51,598 44,224 34,949 17,565
6.4 5.7 5.9 5.3 5.3
Total Region 1,036,293 180,129 5.7 *Includes Sikonge District. Source: Population Census, 1988 - Regional Profile Tabora.
Table I-11 reveals the average household size for the urban areas to be 5.0 while that of rural area is 5.9. It is difficult to advance an explanation for the big difference in household size but one may attribute it to the low level of awareness on family planning in the rural areas as compared to urban areas.
TABLE I-11 POPULATION AND HOUSEHOLD SIZE IN RURAL AND URBAN
1988, TABORA REGION
District
Population
No of Household Average
Household Size Rural Urban Rural Urban Rural Urban
Igunga Nzega Tabora (R) Urambo Tabora (U)
194,490 275,141 247,979 116,152 450
8,607 20,472 8,662 21,284 93,056
9,884 47,041 42,411 30,504 81
1,903 4,557 1,813 4,445 17,484
6.5 5.8 5.8 5.4 5.6
4.5 4.5 4.8 4.8 5.4
Total Region
884,212 152,081 49,921 30,202 5.9 5.0

20

21
Fig. 8: Rural and Urban population orientation by District, Tabora Region, 1988
Igunga Nzega Tabora(R)
Urambo Tabora(U)
1 9 4 4 9 0
8607
2 7 5 1 4 1
20472
2 4 7 9 7 9
8662
1 1 6 1 5 2
212844 5 0
93056
0
50000
100000
150000
200000
250000
300000
Igunga Nzega Tabora(R)
Urambo Tabora(U)
Rural
Urban
Table I-12 shows that in 1988 census there were more dependants than the working force, for while the working force represented 49.3% of the population, the dependant group represented 50.7%. In comparing with the 1978 census, the number of dependants was less than the working force. Thus while the working force was 51.2% of the total population the number of dependants was only 48.8%.
TABLE I-12 POPULATION AGE GROUPS BY DISTRICT 1988, TABORA
REGION
DISTRICT AGE GROUP DEPENDENCY
0 - 4 5 - 14 15 - 44 45 - 64 65+ RATIO Igunga Nzega Tabora (R) Urambo Tabora(U)
36,255 49,079 44,555 34,422 14,064
55,890 84,194 76,768 57,273 24,638
82,115 115,795 92,697 70,530 42,740
20,064 33,160 27,965 17,965 8,231
8,773 13,385 14,656 7,246 3,833
98.5 98.3 113.4 112.3 84.0
Total Region 178,375 298,763 403,877 107,385 47,893 102.9

22
Fig. 9: Population by Age Groups, Tabora Region, 1978 and 1988
0 - 4 5 - 14 15 - 44 45 - 64 65+0
50000
100000
150000
200000
250000
300000
350000
400000
450000
0 - 4 5 - 14 15 - 44 45 - 64 65+
Population 1988 Population 1978
TABLE I-13 POPULATION AGE GROUPS BY DISTRICT 1978 TABORA REGION
DISTRICT
AGE GROUP DEPENDENCY
0 - 4 5 - 14 15 - 44 45 -64 65 + RATIO Igunga Nzega Tabora (R) Urambo Tabora(U)
36,343 39,435 33,135 28,857 11,311
51,473 60,847 48,056 38,427 15,284
74,452 86,943 71,020 59,707 31,697
20,151 27,807 23,882 16,440 6,550
7,056 9,969 10,846 5,673 2,546
100.3 96.1 97.2 95.8 80.4
149,081 214,087 323,819 94,830 36,090 95.4
Source: Population Census, 1978
The comparison of the proportion of the dependant group among
the districts show a significant difference. It ranges from 50.2% for Tabora Urban to 53% for Tabora Rural and Urambo districts respectively. The comparison of the proportion of the dependants group among districts in 1978 show no significant difference.

23
TABLE I-14 POPULATION PROJECTIONS BY DISTRICT, TABOR REGION District 1988 1996 1997 1998 1999 2000
Igunga Nzega Tabora (R)Urambo Tabora (U)
203,097 295,613 256,641 187,436
93,506
215,225 368,941 341,788 224,514 120,302
216,759 379,227 353,431 229,737 124,239
218,303 389,801 365,472 235,083 128,304
219,859 400,669 377,923 240,552 132,503
221,425 411,841 390,797 246,149 136,839
TOTAL 1,036,293 1,270,770 1,303,393 1,336,963 1,371,506 1,407,051
Fig. 10: Population Projections, 1988, 1996 - 2000, Tabora Region
1988 1996 1997 1998 1999 20000
200000
400000
600000
800000
1000000
1200000
1400000
1600000
1988 1996 1997 1998 1999 2000
1.9 Migration and Employment
Migration can be a very significant factor in bringing a change in the population of an area. It is a form of geographic mobility involving a change of usual residence between clearly defined geographic units. Major reasons forcing people to migrate are search of new farming land, better pasture for livestock and a better life through employment opportunities. Lifetime In-migration stood at 241,729 while lifetime out migration was 175,359, this giving a net lifetime migration figure of 66,370. This positive net lifetime migration figure means that the region was receiving people from other parts of the country and in particular from Kigoma and Singida regions searching for employment opportunities in tobacco and cotton farms.

24
TABLE I-16 LIFE TIME MIGRATION BY REGION 1988, TANZANIA
Region Lifetime in Migration
Lifetime Out Migration
Net Life Time Migration
Gross Migration
Tabora
Arusha
Dodoma
Iringa
Kagera
Kigoma
Kilimanjaro
Lindi
Mara
Morogoro
Mbeya
Mtwara
Mwanza
Dar es Salaam
Rukwa
Ruvuma
Singida
Shinyanga
Tanga
Coast
241,729
218,424
89,900
49,282
103,713
26,795
93,040
95,200
75,982
172,393
160,377
46,299
270,142
651,246
87,599
66,442
86,651
288,210
98,747
103,804
175,359
76,703
190,985
169,480
109,693
129,718
217,423
145,031
115,865
141,956
113,378
144,988
303,646
150,625
49,294
81,661
130,531
281,447
150,915
207,716
66,370
141,724
-101,085
120,198
-5,980
-102,923
-124,383
-49,831
-39,878
30,437
46,999
-98,689
-33,504
500,621
38,305
15,219
-63,880
6,763
-52,168
-103,912
417,088
295,130
280,885
218,762
213,406
156,513
310,463
240,231
191,852
314,349
278,755
191,287
573,788
801,871
136,898
148,103
237,182
569,657
249,662
311,520
Mainland 3,025,983 3,106,414 -80,431 6,132,397
Fig.11: Life Time Migration in Tabora Region, 1988 Census

25
050000
100000150000200000250000300000350000400000450000
Lifetime inMigration
Lifetime outMigration
Net LifeTime
Migration
GrossMigration
The 1988 population census for Tabora Region indicated that
about 884,000 people or 85.3% lives in rural areas (See Table I-11). Therefore one would expect the economically active population of Tabora region to be engaged in the agricultural sector. Table I-17 shows a general picture of employment status in Tabora for population aged 10 years and above in 1988.
The breakdown of population employed by type of occupation
both rural and urban reveal that about 68.8% of the population were engaged in agricultural activities while 2.4% and 3.4% were engaged in industry and office work respectively. About 27% of the population had no employment, retired or were too old and therefore unable to work. Almost all type of occupation listed were dominated by males except in agriculture where females exceeded males.
TABLE 17: POPULATION 10 YEARS AND ABOVEBY SEX, DISTRICT AND
OCCUPATION 1988 SEX OCCUPATION
DISTRICT
OFFICE WORK
AGRICULTURAL WORK
INDUSTRY WORK
NOT EMP- LOYED
TOTAL

26
Male: Igunga
Nzega
Tabora (R)
Urambo
Tabora (U)
1,834
2,675
1,675
1,826
6,828
47,323
68,946
58,763
41,999
7,239
946
1,925
1,482
1,496
6,777
14,822
21,776
20,492
13,869
10,464
64,925
95,322
82,412
59,190
31,308
Total 15,440 223,668 12,626 81,413 333,157
Female: Igunga
Nzega
Tabora (R)
Urambo
Tabora (U)
1,441
1,476
971
756
3,556
52,237
68,251
62,561
46,607
13,707
311
544
347
396
2,152
16,192
33,461
22,553
15,118
15,256
70,181
103,732
86,432
62,877
34,671
Total 8,200 243,363 3,750 102,580 353,893
Both sexes: Igunga
Nzega
Tabora(R)
Urambo
Tabora(U)
3,275
4,151
3,248
2,582
10,384
99,560
137,197
120,722
88,606
20,946
1,257
2,469
1,829
1,892
8,929
31,014
55,227
43,045
28,987
25,720
135,106
199,044
168,844
122,067
65,979
Total 23,640 467,031 16,376 183,993 691,050
Source: 1988 Population Census, Tabora Regional Profile
• Office Work for administrative, managerial professional,
technical, clerical and sales work. • Industry work: craftsmen, machine operators, small scale
trades & labourers and other workers • Not employed includes “not stated”

27

28
SECTION II 2.0 REGIONAL ECONOMY 2.1 Introduction:
The main economic activities of Tabora region are agricultural production and livestock keeping. About 90% of the population is engaged in agriculture and livestock keeping apart from other activities like beekeeping, fishing and lumbering. The region is estimated to have 2.4 milliion hectare of potentially cultivable land but only less than 20 per cent is under cultivation. Subsistence farming is the main form of farming. Food crop production of which maize is the leading staple food crop is mostly aimed at meeting the family’s food requirements. Tobacco and cotton are the major cash crops.
Livestock keeping is the second predominant economic activity which if properly exploited can contribute significantly to the region’s economy. The cattle population which is made up of indigeneous breed is kept as evidence of personal wealth and prestige in a traditional way. The natural forests which provide high qualilty hardwood for timber and fuelwood are also a source of beekeeping for honey, beeswax, and wildlife. Fishing potentials are not fully exploited and fishing activities are mainly confined to Lake Sagara and Ugalla Rivers. Industries, trade and mining activities are carried out at a small scale although commercial gold mining is under exploration.
29
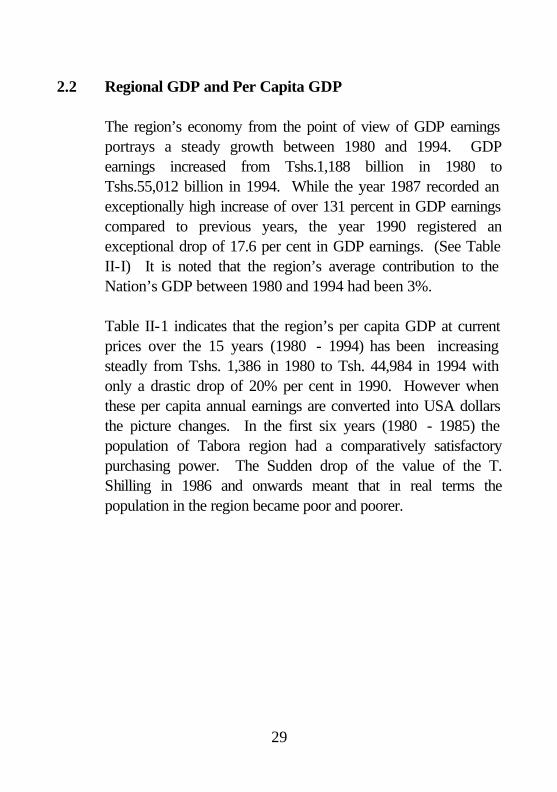
2.2 Regional GDP and Per Capita GDP
The region’s economy from the point of view of GDP earnings portrays a steady growth between 1980 and 1994. GDP earnings increased from Tshs.1,188 billion in 1980 to Tshs.55,012 billion in 1994. While the year 1987 recorded an exceptionally high increase of over 131 percent in GDP earnings compared to previous years, the year 1990 registered an exceptional drop of 17.6 per cent in GDP earnings. (See Table II-I) It is noted that the region’s average contribution to the Nation’s GDP between 1980 and 1994 had been 3%.
Table II-1 indicates that the region’s per capita GDP at current prices over the 15 years (1980 - 1994) has been increasing steadly from Tshs. 1,386 in 1980 to Tsh. 44,984 in 1994 with only a drastic drop of 20% per cent in 1990. However when these per capita annual earnings are converted into USA dollars the picture changes. In the first six years (1980 - 1985) the population of Tabora region had a comparatively satisfactory purchasing power. The Sudden drop of the value of the T. Shilling in 1986 and onwards meant that in real terms the population in the region became poor and poorer.

30
TABLE II-1: THE GDP AND PER CAPITA GDP OF TABORA REGION AT CURRENT PRICES AND PERCENTAGE CHANGE 1980 - 1994
Year
GDP at Current Prices
(Tsh. million
)
% Change
Per Capita GDP
%
Change
% Average
contribution to
national GDP
Tshs. Excha-ngeRate
USA Dollars
1980 1981 1982 1983 1984 1985 1986 1987 1988 1989 1990 1991 1992 1993 1994
1,188 1,491 1,894 2,039 2,352 3,199 3,886 9,003 16,292 26,521 21,859 27,934 34,090 42,584 55,012
- 25.5 27.0 7.6 15.3 36.0 21.5 131.5 81.0 62.8 -17.6 27.8 22.0 24.9 29.2
1,386 1,698 2,106 2,215 2,494 3,313 3,930 8,891 15,760 24,945 19,993 24,843 29,481 35,810 44,984
8.22 8.35 9.52 12.44 18.16 16.50 51.70 83.70 125.00 192.00 197.00 234.00 335.00 480.00 553.00
169 203 221 178 137 201 76 106 126 130 101 106 88 75 81
- 22.5 24.0 5.2 12.6 32.8 18.6 126.2 77.2 53.3 -20.0 24.7 18.7 21.5 25.6
Source: National Accounts of Tanzania, 1976 - 1994 Bureau of Statistics Fig. 12 (a): The GDP at current prices (million T.shs.), Tabora Region 1980 -1994

31
1980
1982
1984
1986
1988
1990
1992
1994
0 10000 20000 30000 40000 50000 60000
1980
1982
1984
1986
1988
1990
1992
1994
Fig. 12 (b): Per Capita GDP at Current Prices (Million T.shs.), Tabora Region 1980 -
1994
1980
1982
1984
1986
1988
1990
1992
1994
0 5 0 0 0 1 0 0 0 0 1 5 0 0 0 2 0 0 0 0 2 5 0 0 0 3 0 0 0 0 3 5 0 0 0 4 0 0 0 0 4 5 0 0 0 5 0 0 0 0
1980
1982
1984
1986
1988
1990
1992
1994
2.3 Productive Sectors 2.3.1 Agriculture 2.3.1.1 Introduction

32
Agriculture is the predominant economic sector in Tabora Region. It is dominated by smallholders organised in some 455 villages. The bulk of agricultural production come from smallholders who employ very little capital. The main inputs are labour and land. Despite the important role agriculture plays in the regional economy and development there is a great deal of unutilized potential. The region is estimated to have 2,400,000 hectares of potentially cultivable land but only about 500,000 hectares are under cultivation. Although the region is not rich in surface waters, it has over 100,000 hectares of potential irrigable land. The present irrigation system covers only about 700 hectares or 0.7% of the potential irrigable land area.
TABLE II-2 ARABLE LAND AREA, TABORA REGION
TYPE HECTARES % Uncultivated land Under rainfed Agriculture Under Irrigation
1,943,280
456,000
720
80.97
19.00
0.03 TOTAL 2,400,000 100.0
Source: Regional Agricultural Office.
2.3.1.2 Food Crop Production Major food crops produced in the region include maize, paddy,
sorghum, cassava and beans. TABLE II-3 FOOD CROP PRODUCTION IN TONNES 1987/88 - 1996/97, TABORA REGION
Year/Crop Maize Paddy Sorghum Cassava Beans

33
1987/88
1988/89
1989/90
1990/91
1991/92
1992/93
1993/94
1994/95
1995/96
1996/97
126,100
120,705
146,314
108,800
75,163
103,522
107,717
143,800
216,580
149,280
32,490
38,844
53,363
65,380
28,857
35,606
13,051
35,000
45,977
25,122
32,160
33,931
49,463
21,830
41,710
20,789
17,000
60,000
40,761
25,540
70,360
46,869
80,251
99,390
54,328
86,452
59,128
65,638
28,200
84,996
9,230
26,642
4,413
2,470
8,325
6,224
4,876
14,000
23,000
21,583 Sources: Regional Agricultural Office, Tabora Region.

34
Fig. 13: Production trend of main food crops (maize, paddy, sorghum, cassava and beans), (in tonnes), Tabora Region 1987/88 - 1996/97
0
50000
100000
150000
200000
25000019
87/8
8
1988
/89
1989
/90
1990
/91
1991
/92
1992
/93
1993
/94
1994
/95
1995
/96
1996
/97
Maize Paddy SorghumCassava Beans
Maize Maize is the leading grain crop in Tabora region and forms an important and desirable food crop with the highest per capita consumption rate in the local diet. Soils throughout the region are generally suitable for maize growing with the exception of the lowlying mbugas where drainage is poor and the sandy soils in the low rainfall eastern areas. The most serious constraint to maize production is the double threat of insufficient total rainfall and mid season dry spell. Maize is produced on small scale farms by peasant farmers. Yields per unit area are generally poor due to low use of fertilizers and improved seeds, low plant population, excessive interplanting and in some areas unsuitable environmental conditions. Potential yields particularly in

35
Urambo, Tabora and Sikonge districts can be good with proper fertilization and improved cultivation practices. In TableII-3 one observes a gradual increase in maize production with little fluctuations in total production probably because of change in weather condition. However most of the maize production in the region is primarily a staple food for consumption and very little is sold outside the region. Paddy Paddy is one of the staple food grain in the region mainly grown in paddies. Areas of paddy growing are therefore limited to natural depressions (mbugas) where soils are usually quite fertile though heavier and relatively poorly drained. The water holding quality of the soils in the bogs makes it possible to maintain the water control necessary far paddy growth. These bogs occur throughout the region and seem to have similar soil characteristics within the depressions. Western Nzega is the centre of the most extensive land area suitable for paddy production and is on the 900 - 1000mm rainfall zone with ample precipitation for rice. All cultivation e.g. land preparation, weeding, transplanting is by hand as is harvesting by sicle. The use of chemical fertilizers, pesticide and high yielding varieties like IRR is very limited. The average yield has been of the order of 800 kg. to 1700 kg/ha. Production of paddy, as in Table II-3 has shown a marked fluctuation due to various constraints which include the unreliability and in variability of rainfall to supply enough water required for paddy growing.
36
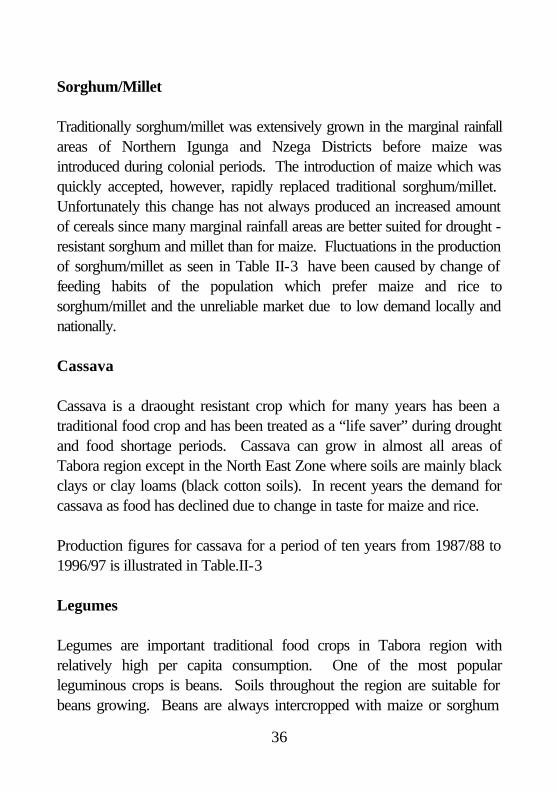
Sorghum/Millet Traditionally sorghum/millet was extensively grown in the marginal rainfall areas of Northern Igunga and Nzega Districts before maize was introduced during colonial periods. The introduction of maize which was quickly accepted, however, rapidly replaced traditional sorghum/millet. Unfortunately this change has not always produced an increased amount of cereals since many marginal rainfall areas are better suited for drought - resistant sorghum and millet than for maize. Fluctuations in the production of sorghum/millet as seen in Table II-3 have been caused by change of feeding habits of the population which prefer maize and rice to sorghum/millet and the unreliable market due to low demand locally and nationally. Cassava Cassava is a draought resistant crop which for many years has been a traditional food crop and has been treated as a “life saver” during drought and food shortage periods. Cassava can grow in almost all areas of Tabora region except in the North East Zone where soils are mainly black clays or clay loams (black cotton soils). In recent years the demand for cassava as food has declined due to change in taste for maize and rice. Production figures for cassava for a period of ten years from 1987/88 to 1996/97 is illustrated in Table.II-3 Legumes Legumes are important traditional food crops in Tabora region with relatively high per capita consumption. One of the most popular leguminous crops is beans. Soils throughout the region are suitable for beans growing. Beans are always intercropped with maize or sorghum

37
which traditionally has been a source of protein. Production of beans has been fluctuating as shown in Table II-3. 2.3.1.3 Cash Crop Production Tobacco and cotton are the important cash crops in Tabora Region although groundnuts and sunflower have also been regarded as cash crops. TABLE: II-4 CASH CROPS PRODUCTION IN TONNES - 1987/88 - 1996/97
Year/Crop Tobacco Cotton Groundnut Sunflower
1987/88
1988/89
1989/90
1990/91
1991/92
1992/93
1993/94
1994/95
1995/96
1996/97
6,136
6,300
10,670
10,970
12,122
14,443
11,419
17,175
19,406
25,671
8,819
6,318
14,925
14,057
7,819
5,151
7,052
11,904
9,900
6,028
17,500
20,493
29,710
15,599
21,165
17,150
8,683
50,273
85,648
11,874
1,014
1,799
7,240
7,840
2,132
245
420
576
605
788 Source: Regional Agricultural Office

38
Fig. 14: Production trend of main cash crops (tobacco, cotton, grounnut and sunflower), (in tonnes), Tabora Region 1987/88 - 1996/97
0
1 0 0 0 0
2 0 0 0 0
3 0 0 0 0
4 0 0 0 0
5 0 0 0 0
6 0 0 0 0
7 0 0 0 0
8 0 0 0 0
9 0 0 0 019
87/8
8
1988
/89
1989
/90
1990
/91
1991
/92
1992
/93
1993
/94
1994
/95
1995
/96
1996
/97
Tobacco Cotton
Groundnut Sunflower
Tobacco: Tobacco was first introduced in Tabora Region by the Overseas Food Corporation in the fifties but since then Tabora has become the dominant producer of tobacco in Tanzania. The predominant tobacco growing areas cover most of the Western portion of the region, the central South and a small area in Southwest of Nzega District, with rainfall ranging from 800 mm. annually in southwest of Nzega to over 1000mm. in Western and North-Western parts of Tabora, Sikonge and Urambo Districts. While the continuing long term tobacco production is dependent on clearing new land for tobacco growing and the continuing supply of accessible fuelwood for tobacco curing and consequently the rapid way of depleting forests, production of tobacco is potentially dependent on proper husbandry techniques and increase in input usage. Planned

39
programme of annual tree planting equivalent to annual fuelwood need for tobacco is therefore requisite for long term tobacco production. Production of tobacco has steadly been increasing from 6,136 tons in 1987/88 to 25,671 tons in 1996/97 as recorded in Table II-4 Cotton Cotton production in Tabora Region is concentrated in Nzega and Igunga Districts primarily in the Manonga Valley. The description of the North-East Zone provides details on the most favourable cotton producing area and location in the region. There is room for increasing cotton production but relatively low production has been caused by low level of input usage particularly fertilizers and insecticides combined with poor husbandry techniques. Observation from Table II-4 show fluctuations in production. Groundnuts: Groundnuts are an important traditional food cum cash crop in Tabora Region. Soils throughout the region with an exception of Manonga Plains and lowlying mbugas, are suitable for groundnut growing. Groundnuts are almost always intercropped with maize or sorghum which traditionally has been a form of insurance against periodic droughts and mid-season dry spell. The non-use of fertilizers and low plant population has resulted in low yields. Production of groundnuts has been fluctuating as can be observed from Table II-4 and Figure 14.

40
Sunflower Sunflower is an oilseed crop introduced in late sixties in Tabora Region. The soils throughout the region are generally suitable for sunflower growing except in the lowlying mbugas where drainage is poor. From 1987/88 to 1996/97 production has been fluctuating reading a peak of 7840 tons in 1990/91 and dropping to 245 tons in 1992/93 and increasing gradually to 788 tons in 1996/97 2.3.1.4 Mechanisation:
Although improved farming methods and techniques are important in raising agricultural production, many peasants in Tabora Region continue to use traditional farming methods and tools - the most common are the handhoes, axe and panga. Oxenisation is commonly practised in Igunga and Nzega districts and very limited in Tabora, Sikonge and Urambo districts. Tractor cultivation is less widespread in the region and most of the few tractors available are unserviceable.
TABLE :II-5 DISTRIBUTION OF TRACTORS IN TABORA REGION, 1993
Condition of Tractors District Serviceable Unserviceable
/Scrap Total
Igunga Nzega Tabora* Urambo
30 13 28 50
46 12 67 63
76 25 95
113
2.3.1.5 Farm Inputs
Soil fertility is one of the factor which limits agricultural production in Tabora Region. Although the soils have the potential to support a variety of crops, about 80% of the soils in the region are

41
infertile sandy soils lying in high rainfall zone. Many farmers have started to realize the importance of using fertilizers and improved seed for both food and cash crops. This has created high demand for farm inputs. These inputs are supplied by stockists and private companies dealing with tobacco and cotton purchases but the demand have always exceeded the supply. Reliance is placed on the use of cattle manure particularly in Igunga and Nzega Districts.
TABLE II-6 DEMAND AND SUPPLY OF FARM INPUTS, IN TONNES, TABORA REGION 1990/91 - 1996/97
Year Commercial Fertilizer Improved Seeds Required Supplie
d % Required Supplie
d %
1990/91 1991/92 1992/93 1993/94 1994/95 1995/96 1996/97
33,190 33,190 36,550 37,462 29,783 30,785 39,763
12,677 17,980 17,867 28,286 15,659 28,818 29,764
38 54 49 75 52 94 74
145 44 84 104 163 164 2,144
69 53 61 106 34 36
670
48 120 73 102 21 22 31
Source: Regional Agricultural Office
2.3.1.6 Irrigation
The annual rainfall for Tabora Region ranges from 650 mm to 1100 mm but although total rainfall may be sufficient for the commonly grown crops such as maize and tobacco, distribution through the growing season is uneven and unreliable. The unreliability and invariability of rainfall can be overcome by irrigation. The best immediate potential for irrigation in Tabora Region is that of supplementary irrigation to provide water control particularly in the paddy fields. The region has a large irrigation project of Mwamapuli covering 630 hectares. This project has been supported by UNP/UNCDF/ADC. Another large irrigation project known as Smallholder Development Project for Marginal

42
Areas cover a total of 750 hectare is completed in Choma cha Nkola; (300ha) and Itumba (150 ha) in Igunga district and Lusu (300ha) in Nzega district. This project is supported by IFAD. Other irrigation projects are in Bukene (100ha) and Idudumo (40ha) in Nzega district supported by JOCV/JICA, and Igigwa (40ha) in Tabora district.
TABLE II-7 IRRIGATION PROJECTS IN TABORA REGION Project Area
covered Donor Beneficiaries
Mwamapuli Irrigation project
Area 630 ha UNP/UNCDF/ADC and Government of Tanzania
750 Families
Choma cha Nkola 300 ha. IFAD and Government of Tanzania
400 families
Itumba 150 ha. IFAD and Government of Tanzania
300 families
Idudumo 40 ha. Nzedese 80 families Igigwa 40 ha. TABODECO Operating Net Lusu 300 ha. IFAD and Government
of Tanzania expected to 400 families
Bukene 100 ha. JOCV/JICA Expexted to benefit 200 families
Source: Regional Agricultural Officer
2.3.2 Livestock 2.3.2.1 Introduction:
Livestock Keeping is the second predominant economic activity in Tabora Region. The climate and environmental conditions are favourable for livestock keeping. The most important type of livestock are cattle, sheep and goats. The cattle population is made up of indigeneous breed, the majority being Tanzania short horn Zebu but substantial number of long horned Ankole cattle exist. There are a few animals of improved breed. Most sheep are black head and long tail type while goats are of the short

43
eared type. Other livestock kept include mostly donkeys, pigs, chicken, ducks and pigeons.
2.3.2.2 Livestock population and distribution
Tabora Region has a livestock population of 1,009571 cattle, 464,327 goats and 151,034 sheep (1994/95 Sample Census). The livestock population and distribution as recorded in 1984 livestock census is shown in Table II-9 Table II-8 compares Tabora Region to other Regions and reveals that human and livestock population and livestock density are more or less the same. In terms of numbers Tabora region ranks seventh position in stock numbers and accounts for 6.4% of the national herd.
TABLE II-8 POPULATION AND LIVESTOCK DISTRIBUTION AND DENSITY
BY REGIONS 1994/95, MAINLAND TANZANIA
Land Area
Population1
Population Density per
sq.km
Livestock (Csttle)
population2 (1994/95
Livestock Density
Live- stock
Density Rank
TABORA 76,151 1,036,293 14.0 1,009,571 13.2 9 Arusha Dodoma Iringa Kagera Kigoma Kilimanjaro Lindi Mara Morogoro Mbeya Mtwara Mwanza Rukwa Ruvuma Singida Shinyanga Tanga Coast/DSM
82.098 41,311 56,850 28,456 37,040 13,309 66,040 21,760 70,799 60,350 16,710 20.095 68,635 66,477 49,341 50,760 26,677 33,800
1,352,225 1,235,277 1,193,074 1,313,639 853,263 1,108,699 642,364 952,616 1,222,737 1,476,261 887,583 1,878,271 704,050 783,327 791,814 1,763,960 1,280,262 1,998,865
16.5 30.0 21.3 46.6 23.1 83.7 9.8 43.7 17.0 24.0 53.2 93.5 10.1 12.0 16.0 34.9 48.1 59.1
1,477,589 1,587,093 364,693 354,119 62,609 464,126 2,853 1,291,576 237,857 924,725 15,119 2,450,396 426,329 75,027 1,944,271 2,262,809 653,550 40,490
18.0 38.4 6.4 12.4 1.7 34.9
0.04 59.3 3.4 12.0 0.9 121.9 6.2 1.1 39.4 44.6 24.5 1.2
8 5 12 10 15 6 19 2 4 11 18 1 13 17 4 3 7 16

44
Mainland 885,987 22,474,580 25.4 15,644,802 17.6 Source: 1 1988 Population Census 2 National sample Census of Agriculture 1994/95 Tanzania Mainland Report Vol. II. TABLE II-9 DISTRIBUTION OF MAJOR LIVESTOCK BY TYPE AND
DISTRICT, TABORA REGION
Cattle
Goats
Sheep Livestock (Cattle) Density/Sg. Km.
Igunga Nzega *Tabora Urambo
411,568 311,345 184,034 75,210
76,396 90,080 53,000 25,327
91,454 62,200 26,010 4,009
60.6 44.7 4.5 3.5
982,157 253,803 183,673 12.9 Source: 1984 Livestock Census Fig. 15: Distribution of major livestock (cattle, goats and sheep) by District, Tabora Region, 1984
0
50000
100000
150000
200000
250000
300000
350000
400000
450000
Igunga Nzega Tabora Urambo
Cattle Goats Sheep
The incidence of tsetse in the region explains the distribution of livestock and some limitation to area available for grazing. Livestock concentration is in the North East of the region in Igunga and Nzega Districts which are almost entirely tsetse free

45
and have a population of over 700,000 cattle while the Tabora Sikonge and Urambo Districts which are mostly tsetse infested have less than the population of Igunga and Nzega. Likewise, while the stocking rate is 60 LU/Km2 for Igunga and 40LU/Km2 for Nzega, Tabora and Sikonge have the stocking rate of 4 LU/Km2 and Urambo has 3LU/Km2. However, the distribution within the region is changing quite rapidly with livestock owners moving away from the overstocked northern districts of Igunga and Nzega to either Tabora, Sikonge or Urambo districts or out of the region altogether.
2.3.2.3 Livestock Management
It is traditional practice in most parts of Tanzania for cattle to be kept as evidence of personal wealth and prestige and the Tabora Region is no exception. This practice has resulted in excessive cattle population despite the heavy drain on existing land and water resources. In Tabora Region there are two types of livestock keepers: the semi-nomadic pastoralists whom cattle form the dominant source of livelihood and the cultivators who own livestock but depend primarily on agriculture for their subsistence and cash surplus. The present livestock husbandry methods in the region are extensive relying on large areas of natural grassland with pasturing on crop residues from cultivated “shambas” and “mbugas” during the dry season to supplement the natural pasture.
2.3.2.4 Livestock Infrastructure :
Livestock infrastructure include 75 dips, 29 livestock health centres, 33 livestock markets, 32 abbatoirs and 42 crushes. As -may be observed in Table II-10 the infrastructure available are

46
inadequate when compared to the number of livestock in the region. If for instance one looks at the dipping facilities in Igunga which has the largest number of livestock in the region, there are only 15 dips. This means an average of 27,400 cattle per dip. Allowing for 5,000 cattle per dip, the number of dips is barely enough. However for a number of reasons the dips are not operational. The main reasons appear to be lack of water at or near the dip, lack of acaricides and breakdown in the dip structures. The livestock health centres lack minimum requirements such as equipments chemicals and reagents as well as adequate staffing. As such cannot provide necessary services to livestock owners.
TABLE II-10: LIVESTOCK FACILITIES/SERVICES IN TABORA REGION
Dips Veterinary
District Operating
out of order
Total Centres Markets
Abbatoirs
Igunga Nzega Tabora* Urambo
10 14 12 7
5 7 8 8
15 25 20 15
7 11 5 6
10 8 11 4
43 12 13 3
Total Region
47 28 75 29 33 32
Source: Regional Livestock Officer.
2.3.2.5 Livestock Production and Marketing
The predominance of the indigeneous livestock has resulted in low productivity. The indigeneous Tanzania Zebu Cattle (TZC) takes 4-5 years to reach maturity and average between 200-250 kgm. Calving percentages are about 50% with calf mortalities at 30%. Goats and Sheep take two years to reach maturity with a carcass weight of 15 - 20 kgm. Apart from genetic potential, diseases,

47
poor nutrition levels and water and inadequate livestock infrastructure contribute to this low productivity.
The marketing of livestock in the region is restricted to tradition. All livestock and particularly cattle brought to an authorized primary market for sale are auctioned and price are fixed by competitive bidding. Table II-11 gives the number of livestock officially sold in the region.
TABLE II-11: LIVESTOCK MARKETTED, 1990 - 1996, TABORA REGION
Year Cattle Goats Sheep 1990 1991 1992 1993 1994 1995 1996
26,961 25,918 29,334 28,452 17,400 13,072 17,750
5,857 3,567 8,436 8,892 7,066 6,561 10,106
2,048 1,406 2,934 3,548 2,620 2,235 3,487
Source: Regional Livestock Officer.
Fig. 16: Livestock marketed (cattle, goats and sheep), 1990 - 1996, Tabora region

48
0
5000
10000
15000
20000
25000
30000
1990 1991 1992 1993 1994 1995 1996
Cattle Goats Sheep
There has been a general decline in cattle sales from 26,961 in 1990 to 17,750 in 1996. However goat sales have increased, with some fluctuations, from 5,657 to 10,066 during the same period. Similarly sheep sales registered an increase.

49
There has been fluctuation in hides and skin sales between 1990 and 1996. Peak sales of hide were in 1993 when 96,420 pieces were recorded. Apparently this was a drought year when many animals died. The sale of goat skins had declined from 81,214 pieces in 1990 to 53,075 pieces in 1996 while sheep skin sales recorded some fluctuations.
TABLE: II-12: HIDES AND SKIN SALES 1990 - 1996, TABORA REGION
Year Cattle Goat Sheep 1990 1991 1992 1993 1994 1995 1996
69,734 72,224 47,647 96,420 79,092 69,954 42,959
81,214 77,827 36,738 38,865 40,965 73,083 53,675
15,011 33,676 17,302 21,352 22,460 42,471 10,475
Fig. 17: Hide and Skin Sales 1990 - 1996, Tabora Region
0
5000
10000
15000
20000
25000
30000
1990 1991 1992 1993 1994 1995 1996
Cattle Goats Sheep

50
2.3.3 Natural Resources Introduction.
Tabora Region is well endowed with the renewable natural resources like forests, wildlife, fishery and honey-bee. The hardwood forests of the region form part of Miombo woodland of central plateau of Western Tanzania covering about 60% of the region and constituting one of the largest area of forest reserve in the country. The forest resources serve two purposes: mainly timber and fuelwood. Apart from timber production the demand for fuel wood is more pronounced by tobacco production for which fuelwood is required in large quantities. However most parts of Igunga and Nzega districts are deforested and depict a near desert situation. The Miombo woodlands also constitute the most valuable non-wood products including honey, tannin etc.
Fishing activities are mainly carried out in Lake Sagara, Ugalla river, Mwamapuli and Igombe Dams. The fishing resources are capable of producing up to 600 tons of fish per annum. Wildlife resources include the Ugalla Game Reserve and Game controlled areas wich attract tourist hunting.
2.3.3.1 Forestry
The natural vegetation of Tabora Region is woodland mainly made up of miombo woodland (Brachystegia-julbernodia) in the rolling central plateau and Acacia/Cambretum and bushland thicket in the north and east part of the region.
The miombo is the most valuable type of woodland for sawn timber extraction as it contains the valuable hardwood species of

51
Plerocarpus angolensis (Mninga), Dalbergia melanozilon (Mpingo), Afzelia quanzensi (Mkola), Swatzia madagasuariensis (Kasanda) and Brachystagia speciformis (Mtundu). These woodlands cover an area of about 5,282,000 hectares which is about 69 percent of the total regional area.
TABLE: II-13: AREA COVERED BY FORESTS BY DISTRICT (HECTARE)
TABORA REGION District Natural Forest Public land Total
Igunga Nzega Tabora Urambo
115,271 120,824 2,420,670 994,419
23,100 192,800 868,277 547,333
138,371 313,624 3,288,947 1,541,752
Total Region 3,651,184 1,631,510 5,282,694
Source: Tabora Regionnal Statistical Abstract 1993 Bureau of Statistics.
There is a total of 33 Forest Reserves which have a total area of 3,422,500 hectares out of which about 119,691 hectares are catchment forests and about 201,017 hectares have disappeared through encroachment. This brings the total exploitable forest reserve at 3,201,792 hectares. Adding 1,631,510 hectares
TABLE II-14: NUMBER OF FOREST RESERVES BY DISTRICT, TABORA REGION
District Number of Forest Reserves Area (Ha)
Igunga Nzega Tabora Urambo
3 11 15 4
115,271 110,164 2,302,665 994,400
Total Region 33 3,522,500
of public land forest brings the total area of exploitable forest to about 4,833,000 hectares. Discounting for about 1,000,000 hectares which at present are too far from habitation or market, there are only about 1,833,000 hectares of commercially

52
exploitable forest resources. An average hectare of intact Miombo Woodland excluding Mbugas has mean annual increment (MAI) of 2.5 m3 per annum. However due to depletion of Miombo Woodland, the estimated mean annual increament (MAI) is only 1.2 m3 per annum. This gives roughly a total annual increament of 2.199,600 m3 of solid wood. or 3,299,400 m 3 of stacked wood. It is estimated that at present only about 1,050,000 m3 of stacked wood is being harvested as fuelwoood and charcoal per year. The estimated area under tobacco todate is 20,000 hectares. At the estimated 64m3 per hectare of tobacco (LUP 1987), the total requirement of solid wood for curing tobacco would be 1,280,000 m3 per season. Besides household use and tobacco, fuelwood is required for brewing, fish smoking, brick making etc. The overall fuelwood consumption may therefore be over 2,330,000 m3 per annum while the natural regeneration of the woodland is estimated at 2,199,600 m3.
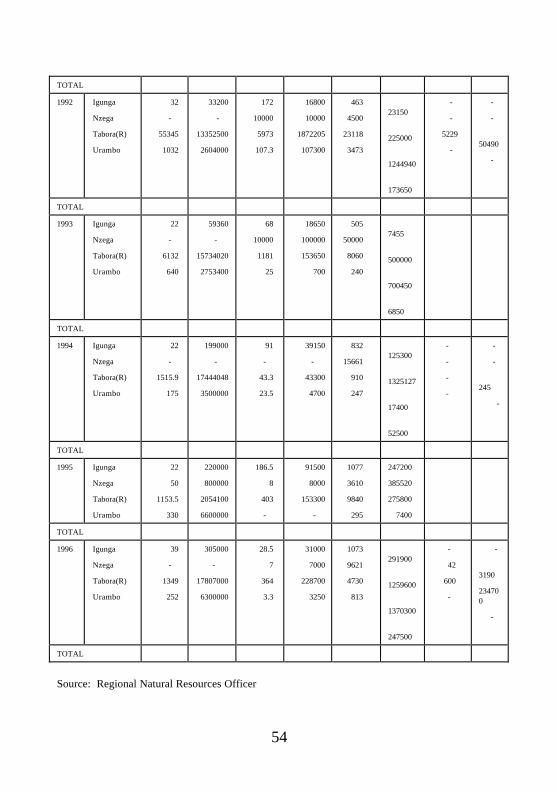
TABLE: II- 15 FOREST PRODUCTION AND REVENUE COLLECTED BY DISTRICT 1985 - 1996 TABORA REGION
Round wood Fuel wood stacked Charcoal Poles
Year
District M3 Tshs. M3 Tshs. M3 Tshs. Numbers Tshs.
1985 Igunga
Nzega
Tabora (R)
Urambo
211
1049.35
48111.72
1329
30206
95863.95
135828.7
190242
906.85
3066.1
5316.2
2008.3
15382
9174.85
24308.95
1559.3
2761
2761
93837
3691
11863
11863
387351
16350
-
2992
597.05
280.5
-
4878
6710
8504
TOTAL 50701.07 452140.65
11297.45 50425.1 103050 427427
3869.55 20092
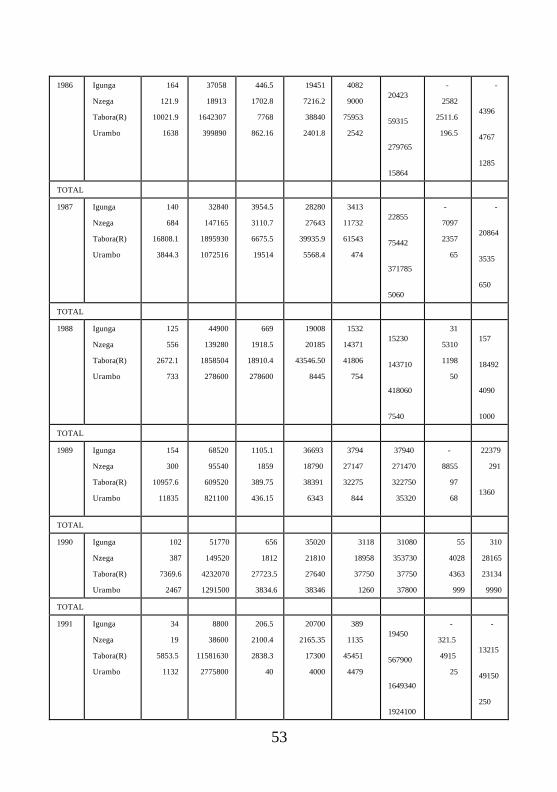
53
1986 Igunga
Nzega
Tabora(R)
Urambo
164
121.9
10021.9
1638
37058
18913
1642307
399890
446.5
1702.8
7768
862.16
19451
7216.2
38840
2401.8
4082
9000
75953
2542
20423
59315
279765
15864
-
2582
2511.6
196.5
-
4396
4767
1285
TOTAL
1987 Igunga
Nzega
Tabora(R)
Urambo
140
684
16808.1
3844.3
32840
147165
1895930
1072516
3954.5
3110.7
6675.5
19514
28280
27643
39935.9
5568.4
3413
11732
61543
474
22855
75442
371785
5060
-
7097
2357
65
-
20864
3535
650
TOTAL
1988 Igunga
Nzega
Tabora(R)
Urambo
125
556
2672.1
733
44900
139280
1858504
278600
669
1918.5
18910.4
278600
19008
20185
43546.50
8445
1532
14371
41806
754
15230
143710
418060
7540
31
5310
1198
50
157
18492
4090
1000
TOTAL
1989 Igunga
Nzega
Tabora(R)
Urambo
154
300
10957.6
11835
68520
95540
609520
821100
1105.1
1859
389.75
436.15
36693
18790
38391
6343
3794
27147
32275
844
37940
271470
322750
35320
-
8855
97
68
22379
291
1360
TOTAL
1990 Igunga
Nzega
Tabora(R)
Urambo
102
387
7369.6
2467
51770
149520
4232070
1291500
656
1812
27723.5
3834.6
35020
21810
27640
38346
3118
18958
37750
1260
31080
353730
37750
37800
55
4028
4363
999
310
28165
23134
9990
TOTAL
1991 Igunga
Nzega
Tabora(R)
Urambo
34
19
5853.5
1132
8800
38600
11581630
2775800
206.5
2100.4
2838.3
40
20700
2165.35
17300
4000
389
1135
45451
4479
19450
567900
1649340
1924100
-
321.5
4915
25
-
13215
49150
250
54
TOTAL
1992 Igunga
Nzega
Tabora(R)
Urambo
32
-
55345
1032
33200
-
13352500
2604000
172
10000
5973
107.3
16800
10000
1872205
107300
463
4500
23118
3473
23150
225000
1244940
173650
-
-
5229
-
-
-
50490
-
TOTAL
1993 Igunga
Nzega
Tabora(R)
Urambo
22
-
6132
640
59360
-
15734020
2753400
68
10000
1181
25
18650
100000
153650
700
505
50000
8060
240
7455
500000
700450
6850
TOTAL
1994 Igunga
Nzega
Tabora(R)
Urambo
22
-
1515.9
175
199000
-
17444048
3500000
91
-
43.3
23.5
39150
-
43300
4700
832
15661
910
247
125300
1325127
17400
52500
-
-
-
-
-
-
245
-
TOTAL
1995 Igunga
Nzega
Tabora(R)
Urambo
22
50
1153.5
330
220000
800000
2054100
6600000
186.5
8
403
-
91500
8000
153300
-
1077
3610
9840
295
247200
385520
275800
7400
TOTAL
1996 Igunga
Nzega
Tabora(R)
Urambo
39
-
1349
252
305000
-
17807000
6300000
28.5
7
364
3.3
31000
7000
228700
3250
1073
9621
4730
813
291900
1259600
1370300
247500
-
42
600
-
-
3190
234700
-
TOTAL
Source: Regional Natural Resources Officer

55
Wood is cut continuously near the villages where the forest gradually deteriorates into unproductive scrubs. This is particularly serious around tobacco growing villages. The combined impact of wood fuel consumption and clearing for agricultural expansion puts pressure on the natural woodland particularly in Igunga and Nzega districts.
As can be seen in Table II-15 forest production especially in
roundwood from 1985 to 1996 has been decreasing. This may be attributed to rising in price per cubic metre at stamp area but also to the conservation strategies under implementation by the region. Similarly, as a result of the rise in prices, the value of forestry products have progressively increased.
The demand for wood products will continue to rise every year as
the population increases and particularly so as long as clearing of woodland for tobacco production and cutting of wood for curing tobacco as well as need for new settlements continues. The region has been undertaking afforestation efforts with the main aim of trying to narrow the gap between adverse supply and demand situation of fuel. This has involved the establishment of tree nurseries as a source of seedlings and establilshment of demonstration woodlots.

56
TABLE : II-16 TREE SEEDLINGS RAISED AND HECTARES PLANTED 1985 - 1995
Year Number of Seedlings (No.) Area Planted (Ha.) 1985 926,844 414 1986 861,930 444 1987 302,002 236 1988 627,419 317 1989 425,670 228.05 1990 184,876 104.6 1991 195,200 110.2 1992 194,000 101.4 1993 41,500 23.29 1994 185,169 107.1 1995 311,012 182.9 Total 4,455,622 2,268.54
Source: Regional Natural Resources Officer
It is appreciated that apart from government departments raising tree seedlings, some religious institutions and donor communities have taken measures of raising seedlings for planting by the community as shown in Table: II-16
TABLE: II-17 NUMBER OF SEEDLINGS RAISED AND PLANTED BY DIFFERENT GROUPS 1985 - 1995
Number of Seedlings by groups Year Government
Department Religious
Institution Donor
Community Planted (Ha)
1985 926.844 - - 414 1986 861,930 - - 444 1987 302,002 - - 236 1988 627,419 - - 317 1989 425,670 - - 228.05 1990 184,876 - - 104.6 1991 195,200 85,000 400,190 183.7 1992 194,000 - - 101.4 1993 41,500 47,000 - 50.9 1994 185,169 85,000 - 157.1 1995 311,012 65,000 - 221.1
TOTAL 4,255,622 282,000 400,190 2,457.85 Source: Regional Natural Resources Officer
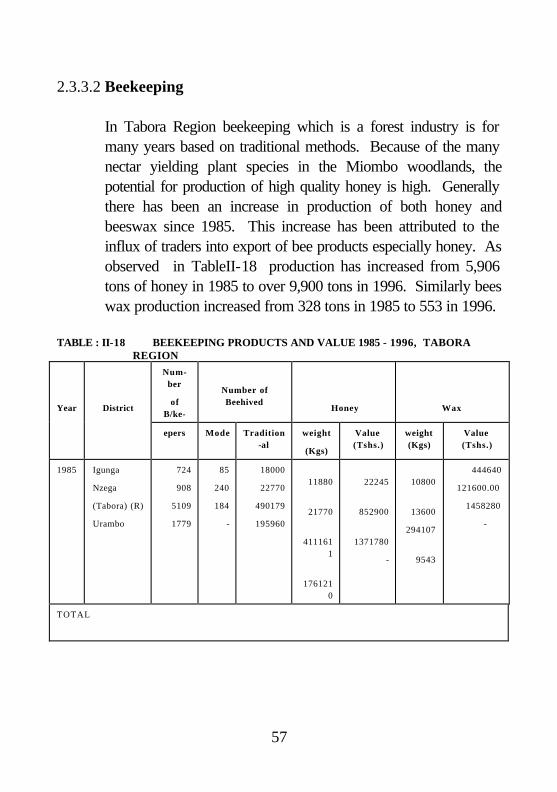
57
2.3.3.2 Beekeeping
In Tabora Region beekeeping which is a forest industry is for many years based on traditional methods. Because of the many nectar yielding plant species in the Miombo woodlands, the potential for production of high quality honey is high. Generally there has been an increase in production of both honey and beeswax since 1985. This increase has been attributed to the influx of traders into export of bee products especially honey. As observed in TableII-18 production has increased from 5,906 tons of honey in 1985 to over 9,900 tons in 1996. Similarly bees wax production increased from 328 tons in 1985 to 553 in 1996.
TABLE : II-18 BEEKEEPING PRODUCTS AND VALUE 1985 - 1996, TABORA
REGION
Year
District
Num-ber
of B/ke-
Number of Beehived
Honey
Wax
epers Mode Tradition-al
weight
(Kgs)
Value (Tshs.)
weight (Kgs)
Value (Tshs.)
1985 Igunga
Nzega
(Tabora) (R)
Urambo
724
908
5109
1779
85
240
184
-
18000
22770
490179
195960
11880
21770
411161
1
176121
0
22245
852900
1371780
-
10800
13600
294107
9543
444640
121600.00
1458280
-
TOTAL

58
1986 Igunga
Nzega
Tabora (R)
Urambo
760
953
5364
1867
42
61
184
-
21280
33355
497400
145500
178752
280182
4476000
1309500
5958000
93399000
149220000
43650000
12768
20013.5
248700
87300
2106720
330227.50
41035500
14404500
TOTAL
1987 Igunga
Nzega
Tabora (R)
Urambo
790
1152
5619
1960
42
61
150
-
25050
27000
501900
190120
195390
226800
2710260
1026648
6643260
7711200
92148840
34906032
15030
13500
210013
57036
2479950
2227500
34652145
9410940
TOTAL
1988 Igunga
Nzega
Tabora (R)
Urambo
790
1209
5815
2182
40
50
36
10
16580
27000
494275
167420
112725
121500
2669085
904068
7665300
8201250
18016323
61024590
12523
13300
204080
100452
4383750
4655000
71417500
35157500
TOTAL

59
1989 Igunga
Nzega
Tabora (R)
Urambo
862
1248
5619
1960
-
36
32
10
20120
25948
494275
167420
108648
140119
2669085
904068
73337740
945802
16192736
610245590
12070
15600
296565
100450
4224500
5425000
103797750
35157500
TOTAL
1990 Igunga
Nzega
Tabora (R)
Urambo
900
1279
6106
2148
-
30
253
-
21399
26293
507183
184168
102715
141982
3314407
1215508
693326.5
9583785
221963289
81439034
12839
157758
301309
110500
4493650
5521425
1005458150
38675000
TOTAL
1991 Igunga
Nzega
Tabora (R)
Urambo
1000
1333
6335
2490
-
30
253
-
21399
26400
517248
184162
115551
190080
4344326
1546960
1039950
17107200
390989340
139226400
12839
15840
310309
11049
5135600
6336000
124123600
44198880
TOTAL

60
1992 Igunga
Nzega
Tabora (R)
Urambo
1348
1386
6621
2615
-
-
300
-
22341
27403
537937
191528
174259
197301
4841433
1608835
2788440
31368160
97462928
257413600
13404
16441
322762
114917
8042400
9864600
193657200
6895200
TOTAL
1993 Igunga
Nzega
Tabora (R)
Urambo
1400
1386
6952
2745
23167
24650
562144
201104
152902
1774890
5059290
1309936
27216554
31591440
900533620
322168608
13900
147990
337286
120662
1668000
17748000
409743200
144794400
TOTAL
1994 Igunga
Nzega
Tabora (R)
Urambo
1400
1414
6952
2745
10 23167
25343
590251
201104
157902
197671
5312259
1809936
27216556
35183438
94552102
322168608
13900
5205.5
35415
120662
16680000
1446600
42498000
144794400
TOTAL

61
1995 Igunga
Nzega
Tabora (R)
Urambo
1010
1405
7953
3011
6 24250
26530
619764
2101553
174600
191016
5527876
1891365
49761000
54439560
1589694660
33903902
8
4550
15918
371358
126091
21825000
23877000
557787000
189136500
TOTAL
1996 Igunga
Nzega
Tabora (R)
Urambo
1060
1470
8320
3062
2 25250
27591
550752
1097593
1281800
231764
5856768
1976481
7799200
99426756
847910349
847910340
15150
16554
390451
131765
24240000
26486400
576721600
210824000
TOTAL
Source: Regional Natural Resources Officer
2.3.3.3 Wildlife
Tremendous wildlife resources are found in Tabora region. With the exception of Nzega district, all districts are rich in wild animals. The main species include elephants, buffaloes, waterbuck, eland, giraffe, impala, roan and sable antelopes, warthog, hippo, and many birds such as Francolin love birds. The region has one game reserve which is the Ugalla Game Reserve located in the southern part of Urambo. The reserve which has a vast grazing land, bush and forest land is infested by tsetse fly which eliminates most human habitation or bars the introduction of domesticated

62
animals. Currently the reserve is under the management of the Ugalla Game Reserve Project. However, under the new concept of wildlife conservation the population living adjacent to the reserve is given the right to exploit other resources in the reserve.
The region has three open areas that have a variety of wildlife. These include Wembere Wetlands with an area of about 200,000 hectares and Pembampazi open area which has an area of about 150,000 hectares. The third open game areas is in Sikonge district. Also the region has a number of Game Controlled Areas as shown in Table II-19
TABLE: II-19 GAME CONTROLLED AREAS IN TABORA REGION
Name of GCA District Area Ha Igombe GCA Igombe Dam GCA Kigosi GCA Luganzo GCA Rungwa River GCA Ugunda GCA Nyonga GCA
Urambo Tabora Urambo Urambo Sikonge Sikonge Sikonge
300,000 10,000 700,000 250,000 1,500 100,000 2,000,000
Total 3,361,500
Source: Natural Resources Officer, Tabora.
Tourist hunting which started in 1992 is being conducted in the following blocks: Ugalla Game Reserve, Luganzo GCA, Rungwa GCA, Ugunda GCS, Wembere South and Ugalla - Niensi area. Table II-20 shows the number of animals and revenue generated since 1992/93 season to 1997/98
TABLE: II-20 REVENUE GENERATED FROM TOURIST HUNTING 1992 - 19998 TABORA REGION
Year Number of animals hunted Revenue in US $

63
1992/93 1993/94 1994/95 1995/96 1996/97 1997/98
235 293 519 175 247 308
206,420 183,049 333,823 233,830 167,840 134,874
Source: Regional Natural Resources Officer TABLE :II-21 REVENUE FROM WILDLIFE RELATED ACTIVITIES 1990/91 - 1995/96 (IN TSHS.)
REVENUE FROM WILDLIFE PRODUCTS
Year Hunting licence
fee (US $)
Fees for possessing wildlife products
Sale of wildlife products
Sale of hunting wildlife
card
Fine
charges
Total
1990/91 - 5,000
9,530 54,910 25,800 95,240
1991/92 - - 25,450 319,775 17,000 362,225
1992/93 206,420 - 25,450 731,075 27,000 783,725
1993/94 183,049 - 47,880 161,765 42,600 252,245
1994/95 333,823 - 53,000 822,768 41,500 917,268
1995/96 133,830 5,900
110,750 914,943 20,200 1,051,793
1996/97 167,840 29,200
26,300 1,333,516 11,800 1,400,8160
1997/98 134,874 - 57,300 - - 192,174
Source: Regional Natural Resources Officer
Fig. 18: Total Revenue from wildlife related activities 1990/91 - 1995/96 (in
Tshs.)

64
0
200,000
400,000
600,000
800,000
1,000,000
1,200,000
1,400,000
1,600,000
1990
/91
1991
/92
1992
/93
1993
/94
1994
/95
1995
/96
1996
/97
1997
/98
2.3.3.4 Fisheries
Situated in the inland of Tanzania, Tabora region has limited fishing resources. Fishing activities are mainly confined to Lake Sagara, Ugalla River and the man made dams of Igombe, Kilimi, Mwamapuli, Mihama and Bulenya. Fishing is done by individuals using seine nets. The recorded production of fresh and dried fish is as shown in Table II-22 Potential for increasing the catch lies in Lake Sagara and Ugalla River with the improvement in fishing gears.
TABLE II-22 PRODUCTION OF FISH AND VALUE 1985 - 1996 TABORA
REGION Year No: of fishermen No: of Vessels Weight in tons Value in Tshs.

65
1985 1986 1987 1988 1989 1990 1991 1992 1993 1994 1995 1996
3532 1080 2272 1244 2948 5382 2479 2038 2606 1652 1365 2121
711 489 758 603 1367 5350 2479 2038 2606 1652 1365 1121
1281.9 354.9 475.2 791.78 708.2 479.72 1145.6 979.5 206.28 184.54 261.75 264.8
11,699,720 3,935,570 11,298,400 11,808,551 12,127,000 13,404,600 17,878,490 14,106,218 15,500,220 13,331,500 17,023,300 18,770,220
TOTAL 28719 20539 7134.17 150,883,589 Source: Regional Natural Resources Officer
Fig. 19: Production of fish (weight in tons), 1985 - 1996, Tabora region
0
200
400
600
800
1000
1200
1400
1985
1986
1987
1988
1989
1990
1991
1992
1993
1994
1995
1996

66
2.3.4 Mining
Although mining industry has been contributing to the region economy of Tabora region since colonial times, very little is known about the actual potential of minerals. For a long time mining activities have been carried out by smallscale prospectors. Recently some large companies have shown interest in prospecting and mining in the region. Currently there are 26 companies prospecting for gold and one company is prospecting for diamonds. Preparations are in progress for gold mining by Golden Pride Project Ltd. in Nzega district.
2.3.5 Industry and Trade
Industry and Trade are important activities which directly contribute to the region’s economy while employing a good number of active labour force. The big industrial establishments in Tabora are the TABOTEX (Tabora Textile) which deals with cotton spinning and employs over 1000 people and the Manonga Ginnery which gins cotton and employs over 500 people. Other industrial establishments are the 260 small scale industries which include timber sawing, furniture making, vehicle garages, metal sheet working, oil processing and many others employing over 700 people. Trade business in the region is not much progressive because of low demand for commodities.

67
SECTION III 3.0 ECONOMIC INFRASTRUCTURE 3.1 Introduction
Economic infractructure is very vital for any economic development to take place. Growth in agricultural and industrial production, trade, national defence, administration and even political integration all depend on efficient and smooth operation of communication, transport and energy resources. Tabora region has a lot of development potentials but its economic infrastructure is very much underdeveloped thus making the region “an island within the vast sea” of Tanzania. The communication system of the region has three aspects: railways, air and road transport. The railroad which traverse the region east to west and north to southwest is the key medium for transport into or out of the region. The only commercial airport in the region is located in Tabora with several plane connections each week to Dar es Salaam and other towns of Kigoma and Mwanza. Both the railway and air transport is coordinated at the national level while the road transport is coordinated at the regional level.
3.2 Roads
Tabora region has a total of 4840 Kms of road network with 660 Km of trunk roads under the responsibility of the Ministry of Works, 1273 Kms of regional roads under the responsibility of the region and a total of 2790 Km. under respective districts responsibility.

68
There are two trunk roads traversing the region:
• The Singida border to Kahama via Nzega • The Mbeya border to Shinyanga border via Tabora and
Nzega
The Singida border to Kahama as well as the portion of Shinyanga border to Tabora are of engineered gravel or medium to fair standard but the condition has deteriorated due to poor maintenance. The road portion from Tabora to Mbeya and Rukwa borders is fair to poor condition and in some cases is merely a track.
TABLE: III-1 ROAD NETWORK IN KMS BY TYPE OF ROAD AND BY
DISTRICT, TABORA REGION Type of Road Igunga Nzega Tabora Urambo Total
Trunk Roads Regional Roads District Roads Tarmac Roads
88 291 128 .....
161 240 742 ......
394 602 905 17
..... 140 1,132 .....
643 1,273 2,907 17
TOTAL 507 1,143 1,918 1,272 4,840
Source: Regional Works Engineer, Tabora
The Regional and Distric Roads connect district headquarters, parts of the district to district headquarters or to main centres in the tobacco and cotton growing areas. Most of these roads have earth surface which is worn out and in poor condition. The major road network consist of the following roads:-
Puge - Ziba - Choma (Km 113)

69
This road covers a distance of 113 Km. The road passes through reddish sand or sand silt soils with black clay soils in the depressions or mbugas. The road surface which is partly gravelled and partly consists of earth or sand. This road is currently in bad condition with poor drainage. The road facilitates transportation of cotton to the Manonga Ginnery and many feeder roads which pass through the cotton growing areas are connected to this road. Tabora - Ulyankulu (Km 88)
The road from Tabora to Ulyankulu covers a distance of 88 kms passing through an area which rises gradually with rocky hills and ridges intersected by wide valley. The soils show the usual variation of red laterristic on the rocky hills to reddishbrown on the slopes and grey or black grey in depression. There are a few feeder roads joing this road. The road has twenty five (25) culverts of which fifteen (15) are permanent and in good condition. The road surface is partly gravel and partly of earth or sand. This road which leads to the Refugee Settlement of Ulyankulu facilitates transportation of goods and crops to and from Ulyankulu and villages along the road to Tabora.
Choma - Nata - Bukene (Km 68)
This road is equally important because it passes through the cotton producing areas. The road covers a distance of 68 km. with two permanent bridges and a few culverts which are in poor condition. The road common soils are the black cotton soils. The road surface is partly gravel and partly of earth and is in poor condition. The road is impassable during the rain season especially when the Manonga River floods. The road facilitates

70
transportation of crops particularly cotton to the ginnery of Choma and cotton bales from the ginnery to the railhead of Bukene. Itigi (Singida Boarder) - Tabora Road - (Km. 174)
Itigi (Singida Border) - Tabora Road passes through Nyahua mbugas reaching Tabora Town. It covers a distance of 174 Kms. From Tabora to Kigwa the road is passable throughout the year while the Kigwa village to Itigi border portion is passable only during the dry season. A large portion of the road is characterized by mbuga soils and generally during the rain season the mbuga areas are flooded and eroded causing the road to be impassable. The road surface consists of earth and is in poor condition.
The Tabora - Chagu (Kigoma border) (Km 218) The Tabora - Chagu (Kigoma border) road covers a distance of
218 kms. From Tabora the road passes through Urambo Town, Kaliua Village to Chagu village (Kigoma Border). From Tabora to Kaliua Village the road is passable throughout the year while the Kaliua - Chagu portion is passable only during the dry season. The road surface from Tabora to Urambo consists of gravel while the remaining portion is of earth and is in poor condition. This road which passes through the major tobacco producing areas promote inter region trade and communication between Tabora and Kigoma regions.
Igunga - Mbutu - Choma Chankola (Km 91) The road covers a distance of 91 kms passing through Mbutu,
Igurubi to Choma Cha Nkola from Igunga Town. It passes through the flat plain which is abruptly bordered to the north by a steep slope along the Manonga plains. The dominating soils are
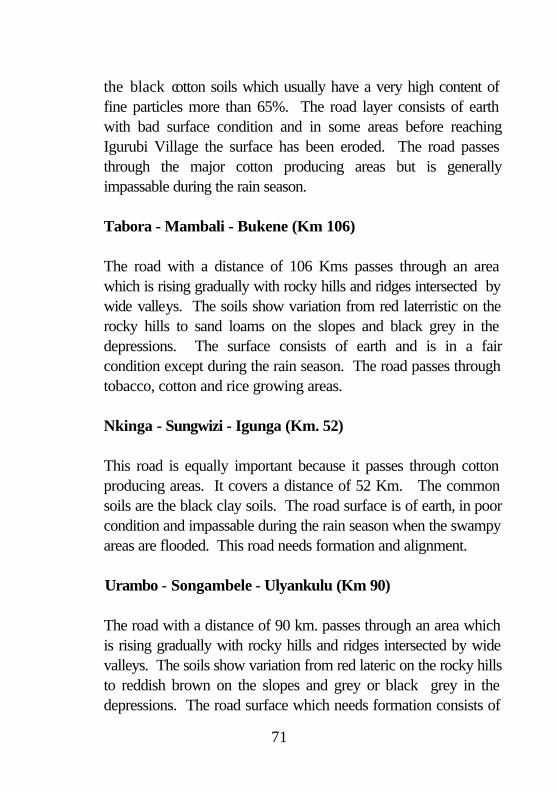
71
the black cotton soils which usually have a very high content of fine particles more than 65%. The road layer consists of earth with bad surface condition and in some areas before reaching Igurubi Village the surface has been eroded. The road passes through the major cotton producing areas but is generally impassable during the rain season.
Tabora - Mambali - Bukene (Km 106) The road with a distance of 106 Kms passes through an area
which is rising gradually with rocky hills and ridges intersected by wide valleys. The soils show variation from red laterristic on the rocky hills to sand loams on the slopes and black grey in the depressions. The surface consists of earth and is in a fair condition except during the rain season. The road passes through tobacco, cotton and rice growing areas.
Nkinga - Sungwizi - Igunga (Km. 52) This road is equally important because it passes through cotton
producing areas. It covers a distance of 52 Km. The common soils are the black clay soils. The road surface is of earth, in poor condition and impassable during the rain season when the swampy areas are flooded. This road needs formation and alignment.
Urambo - Songambele - Ulyankulu (Km 90) The road with a distance of 90 km. passes through an area which
is rising gradually with rocky hills and ridges intersected by wide valleys. The soils show variation from red lateric on the rocky hills to reddish brown on the slopes and grey or black grey in the depressions. The road surface which needs formation consists of

72
earth but is generally passable except during rain season. There are few feeder roads adjoining this road which passes through tobacco and groundnut producing areas.
TABLE : II-2 ROAD DENSITY BY DISTRICT, TABORA REGION District Land Area (Sq Km) Total Roads Km. Road Density
Km/Sq Km Ranking
Igunga
Nzega
Tabora
Urambo
6,788
6,961
41,103
21,299
507
1,143
1,998
1,192
0.075
0.164
0.049
0.056
2
1
4
3
Total 76,151 4,840 0.063 -
Table II-2 ranks the district in the order of development of roads.
The road density for Tabora district is the lowest in the region with only 0.049 Km/sq km. of land area while Nzega district has a well developed road network showing high density of 0.164 km/sq.km. Construction of the Tabora to Itigi road and to Mbeya border to gravel engineered or tarmac standard would greatly reduce the region’s dependence on the Central Railway line and open up to southern regions for the movement of agricultural and industrial goods to and from Tabora.
TABLE: III-3 DISTRIBUTION OF ROAD NETWORK BY CATEGORY AND
DISTRICT, TABORA REGION
Trunk Roads Regional Roads District Roads Total
District Km % Km % Km % Km %
Igunga
Nzega
Tabora
Urambo
88
161
411
-
13.3
24.4
62.3
-
291
240
602
140
22.9
18.8
47.3
11.0
128
742
905
1132
4.4
25.5
31.1
39.0
507
1143
1918
1272
10.5
23.6
39.6
26.3

73
Total 660 100.0 1273 100.0 2907 100.0 4840 100.0
Source: Regional Works Engineer, Tabora

74
As can be observed in Table: III-3 Road network distribution in Tabora Region show that Tabora/Sikonge and Urambo districts have the longest road network followed by Nzega distict while Igunga district has the least length of roads.
3.3 Railway Transport
Tabora region is served by the central line railways system. At Tabora the railway line from Dar es Salaam branches to Mwanza, Kigoma and Mpanda at Kaliua. The importance of the central line to the region is felt in the movement of vital freight to and from the region and passenger service to some towns and villages located adjacent to it especially in the rain season when lorry and bus service become erratic.
3.4 Air Services
Tabora region is served by one commercial airport located in Tabora township. It is capable of handling Fokker aircrafts and other small planes. Air Tanzania a public airline is the main scheduled airline operating flights three times a week between Dar es Salaam , Tabora, and Kigoma. In addition to Air Tanzania domestic flights there are other private sector companies operating regularly. There are also five airstrips which are Urambo, Igunga, Nkinga Kaliua and Nzega which are normally used by flying doctors, agricultural researchers and crop protection experts.
3.5 Communication Facilities
There are three types of telecommunication systems: Modern, Automatic and Manual. There are two modern system having 2,800 lines, but only 1,393 lines are utilised. All of these systems

75
are international self dialing. The Automatic system is used in Nzega and is having 600 lines. The manual are at Urambo with 100 lines, Sikonge with 100 lines, Igunga with 100 lines, Bukene and Kaliua with 100 lines. Tabora town is accessible to telex with 22 lines and telefax with 14 lines. There are three postal offices at Tabora, Nzega and Urambo. There are also sub post offices at Igunga, Sikonge, Bukene and Ulyankulu
3.6 Energy
There are two main sources of energy used mainly by the populatiion in Tabora region. Electricity and Fuelwood. Electricity is used for industrial and domestic purpose. The use of electricity for domestic purposes is limited to residents in urban areas of Tabora, Nzega and Urambo and particularly those who can afford it. Electricity in Tabora and Nzega townships is supplied by Tanzania Electricity Company (TANESCO) while Urambo town is supplied by Urambo Electricity Corporation (UECO). The rural population which comprise of over 85 per cent of the regional population depend on firewood or charcoal as the main source of energy.
TABLE III-4 HOUSEHOLD BY ELECTRICITY SUPPLY BY DISTRICT 1988,
TABORA REGION
Electricity Supply Total Percentage with
District Available Not Available
Household electricity (of total)
Igunga
Nzega
Tabora(R)
Urambo
Tabora(U)
158
1370
228
363
5560
31,635
50,228
43,996
34,586
12,005
31,793
51,598
44,224
34,949
17,565
0.5
2.6
0.5
1.0
31.6

76
Total Region
7679 172,450 180,129 4.3
Source: 1988 Population Census Regional Profile Tabora
As can be observed in Table: III-4, only 4.3 per cent of
households in the region had electricity by 1988 the highest percent being in Tabora Urban.
It is therefore a general fact that fuelwood which includes firewood
and charcoal accounts for more than 96 percent of the total energy used in the region for domestic purposes. The supply of this form of energy result in indiscriminate cutting of trees and consequently destruction of forest cover causing soil erosion and other forms of land degradation.
Fig. 20: Household by electricity supply by district 1988, Tabora Region
0
1000
2000
3000
4000
5000
6000
Igunga Nzega Tabora (R) Urambo Tabora (U)

77
SECTION IV 4.0 SOCIAL SERVICES 4.1 Education: 4.1.1 Primary Education Enrolment
The Primary Education policy in Tanzania has been to offer every child of school going age (7 years) an opportunity to primary education. In Tabora region, like in other regions in the country, primary education has expanded tremendously since independence. At the on set of UPE in 1974 Tabora region had 220 primary schools with total enrolment of 58,306 pupils. By 1997 Tabora region had a total number of 517 primary schools with a total enrolment of 164,329 pupils, an increase of 282 per cent. (Table IV-1).
TABLE IV-1: PRIMARY SCHOOL EXPANSION AND PUPIL ENROLMENT
IN TABORA REGION 1974 - 1997 Years
(Selected) No. of Primary
Schools %
Increase Numbmer of
Pupils %
Increase
1974 1978 1988 1994 1997
220 405 487 505 517
100.0 184.0 221.0 229.0 235.0
58,306 106,537 132,617 151,650 164,329
100.0 182.0 227.0 260.0 282.0
The enrollment rate stood at 78 percent of the target group
between 7 - 8 years in 1996. While there was 885 streams with a capacity of enrolling 39,825 or more primary one pupils, only

78
30,040 pupils were enrolled in that year. This is equivalent to 78 percent of the total enrollment target as revealed in Table IV-2
TABLE: IV-2 ENROLMENT IN PRIMARY ONE BY DISTRICT IN 1996, TABORA REGION
District No. of Schools
No. of Std. One
Streams
Eligible Enrollme-nt (7-8yrs)
Actual Enroll-
ment
%
No. of Vacancies
%
Equiva-lent
Streams
Igunga Nzega Tabora(R) Urambo Tabora U)
104 146 114
94 59
133 311 162 158 121
6,339 11,198 10,515 7,353 3,305
5,444 7,550 4,857 6,023 6,166
85.8 67.4 46.2 81.9 186.6
895 3,648 4,492 1,187 +1,552
14.2 32.6 53.8 18.1 +86.6
19 81 100 26 +34
Total Region
517
885
38,710
30,040
77.6
8,670
22.4
192
Source: Regional Education Officer.
Fig. 21: Actrual Enrolment in Primary One by District in 1996, Tabora Region
Igunga Nzega Tabora(R)
Urambo Tabora(U)
01000
20003000
40005000
60007000
8000
Igunga Nzega Tabora(R)
Urambo Tabora(U)
There were a total of 8,670 empty vacancies in standard one in
1996, which means about 192 streams were empty in all districts except Tabora Urban which needed an extra 34 streams to accomodate the surplus 1,552 pupils. While Tabora Urban had the highest enrolment rate of 187 percent, Tabora and Sikonge districts had the lowest enrolment rate of 46 percent.
School Droputs

79
School drop out in Tabora is mainly caused by early marriages
where girls are sometimes forced to drop out from school in order to get married, truancy which is very common in areas growing tobacco or practicing nomadic pastoralism, pregnancy of school girls or deaths.
There was a total of 865 drop outs or 0.5 percent out of 155,733
registered primary school pupils in 1996 as compared to a total of 2,872 dropouts or 1.9 percent out of 155,586 registered pupils in 1995.
TABLE: IV-3: PRIMARY SCHOOL DROPOUTS 1995 - 1996 TABORA
REGION
1995 1996
Reason Boys Girls Total Boys Girls Total
Truancy Pregnancy Death Other
1,014 .... 56 460
803 87 47 405
1,817 87 103 865
353 ... 21 29
368 58 21 15
721 58 42 44
Total 1,530 1,342 2,872 403 462 865
Source: Regional Education Officer, Tabora.
Fig. 22: Total reason for primary school dropouts, 1995 - 1996, Tabora Region

80
0
500
1000
1500
2000
Truancy Pregnancy Death Other
Total dropout 1995 Total dropout 1996
Table: IV-3 show that truancy accounted for 63 percent in 1995 and 83 percent in 1996. In 1996 the number of girls accounted for 53% of all dropouts while in 1995 it was 47%.
Primary Education Infrastructure Many primary schools in Tabora Region do not have adequate
number of classrooms, teachers, houses, desks and other buildings and furniture. Table IV-4 reveals the sad situation in all districts. Classrooms available are far below the requirement.
TABLE:IV-4 PRIMARY EDUCATION CLASSROM REQUIREMENT AND
AVAILABILITY, TABORA REGION 1996 District Requirement Available Shortfall %
Shortfall
Igunga Nzega Tabora(R) Urambo Tabora(U)
194 798 797 738 543
127 281 634 500 368
67 517 163 238 175
34.5 64.8 20.4 32.2 32.2
Total Region 3,070 1,910 1,160 37.8
Source: Regional Education Officer, Tabora Region

81
The overall classroom requirements in the region is 3,070 but what is available is only 1,910 classroms leaving a deficit of 1,160 classrooms equivalent to 37.8 percent. The situation is particularly acute in Nzega district which has a shortfall of 64.8 percent. The national policy is that, for effective communication between the teacher and the pupil, the number of pupils per classroom should not be more than 45. But for Tabora region with the total primary school enrolment of 155,733 pupils in 1996, each classroom on the average accomodates 81.5
Classrooms are not the only area where physical facilities are
inadequate. There is also an acute shortage of desks by 65.3 percent, tables and chairs by 72.5 percent and permanent pit latrines by 56.1 percent.
TABLE:IV-5 DISTRIBUTION OF DESKS BY DISTRICTS 1996 TABORA REGION
District Requirement Actual Shortfall Percentage Shortfall (%)
Igunga 11,790 2,704 9,086 77.0 Nzega 13,616 6,376 7,120 51.5 Tabora (R) 12,510 3,699 8,811 70.4 Urambo 10,668 4,586 6,082 57.0 Tabora (U) 8,984 3,565 5,419 60.3 Total 57,954 20,013 37,821 65.3
Source: Regional Education Officer
TABLE: IV-6 DISTRIBUTION OF TABLES AND CHAIRS BY DISTRICT 1996,
TABORA REGION District Requirement Actual Shortfall Percentage
Shortfall (%) Igunga 3,397 693 1,704 79.6 Nzenga 3,763 1,084 2,679 71.2 Tabora (R) 3,546 978 2,568 27.6

82
Urambo 2,512 782 1,730 68.9 Tabora (U) 2,796 850 1,946 69.6 Total 16,014 4,387 11,618 72.5
Source: Regional Education Officer
TABLE:IV-7 DISTRIBUTION OF TOILETS/PIT LATRINES BY DISTRICT IN 1996
District Requirement Actual Shortfall Percentage Shortfall (%)
Igunga 1,279 636 643 50.3 Nzega 1,634 156 1,478 90.4 Tabora (R) 1,224 824 403 32.9 Urambo 1,053 666 387 36.7 Tabora (U) 985 427 558 56.6 Total 6,178 2,709 3,469 56.1
Source: Regional Education Officer
Teachers’ houses are also important for primary education
efficiency and teachers morale. But this is probably an area where very little has been done as can be observed in Table:IV-8
TABLE: IV-8: TEACHERS’ HOUSES IN PRIMARY SCHOOLS BY DISTRICT, TABORA REGION 1996
District Requirement Available Shorfall % Shortfall Igunga Nzega Tabora (R) Urambo Tabora (U)
896 1,140
745 947 933
41 190 51 123 45
855 950 694 824 888
95.4 83.3 93.1 87.0 95.2
Total Region 4,661 450 4,211 90.3
Source: Regional Education Officer, Tabora
Primary School Teachers

83
The region had a total of 4,583 primary school teachers in 1996 with teacher pupil ratio of 1:34 against the national ratio of 1:45. But the schools face shortage of Grade IIA teachers and most of these available teachers are concentrated in urban centres.
TABLE:IV-9 DISTRIBUTION OF TEACHERS BY DISTRICT, TABORA REGION 1996
District Requirement Available Shortfall % Shortfall Igunga Nzega Tabora(R) Urambo Tabora (U)
936 1,309 1,043 965 827
792 1,172 772 838 1,008
144 137 271 126
+ 18
15.4 10.5 26.0 13.0
121.9 Total Region 5,080 4,583 678 13.3
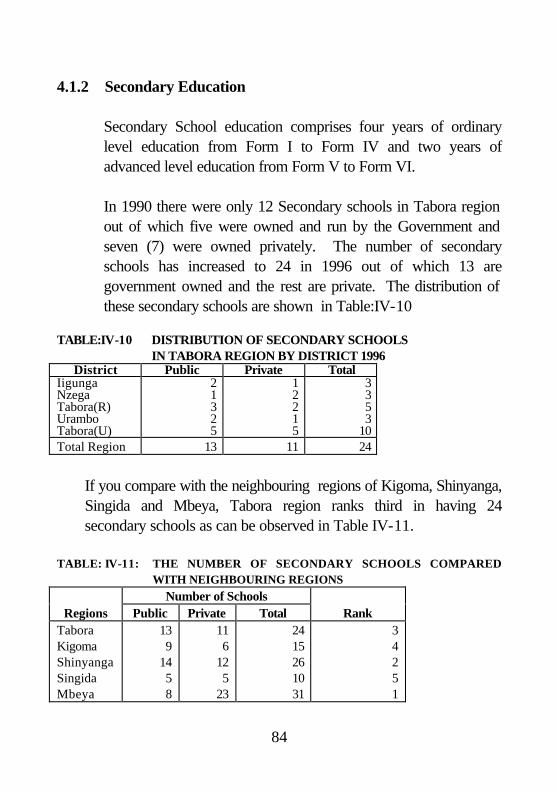
84
4.1.2 Secondary Education Secondary School education comprises four years of ordinary
level education from Form I to Form IV and two years of advanced level education from Form V to Form VI.
In 1990 there were only 12 Secondary schools in Tabora region
out of which five were owned and run by the Government and seven (7) were owned privately. The number of secondary schools has increased to 24 in 1996 out of which 13 are government owned and the rest are private. The distribution of these secondary schools are shown in Table:IV-10
TABLE:IV-10 DISTRIBUTION OF SECONDARY SCHOOLS IN TABORA REGION BY DISTRICT 1996
District Public Private Total Iigunga Nzega Tabora(R) Urambo Tabora(U)
2 1 3 2 5
1 2 2 1 5
3 3 5 3
10 Total Region 13 11 24
If you compare with the neighbouring regions of Kigoma, Shinyanga,
Singida and Mbeya, Tabora region ranks third in having 24 secondary schools as can be observed in Table IV-11.
TABLE: IV-11: THE NUMBER OF SECONDARY SCHOOLS COMPARED
WITH NEIGHBOURING REGIONS
Number of Schools Regions Public Private Total Rank
Tabora Kigoma Shinyanga Singida Mbeya
13 9
14 5 8
11 6
12 5
23
24 15 26 10 31
3 4 2 5 1

85
It is observed in Table:IV-12 that more boys than girls were selected to join Form I in Secondary schools during the years 1990 - 1996. The number of students selected for Form I has ranged from 3.0 percent in 1990 to 12.5 percent in 1996 of the total number of students who sat for the Std. VII final examination.
TABLE:IV-12 PUPILS SELECTED FOR FORM I BY SEX AND YEAR TABORA REGION
STD VII Form I Selection Enrolment
Year Leavers Boys Girls Total Rate %
1990 2,071 42 20 62 3.0 1991 2,231 41 20 61 2.7 1992 2,493 48 25 73 2.9 1993 2,707 86 67 153 5.6 1994 2,339 117 103 220 9.4 1995 2,998 118 98 216 7.2 1996 2,470 174 135 309 12.5 Total 17,309 626 468 1,094 6.3
Fig. 23: Pupils selected for Form I by Sex and year, Tabora Region
1990 1991 1992 1993 1994 1995 19960
20
406080
100
120140160180
1990 1991 1992 1993 1994 1995 1996
Boys Girls
Enrolment in public and private secondary schools in Tabora region can be found in Tables: IV-13 and Table: IV-14
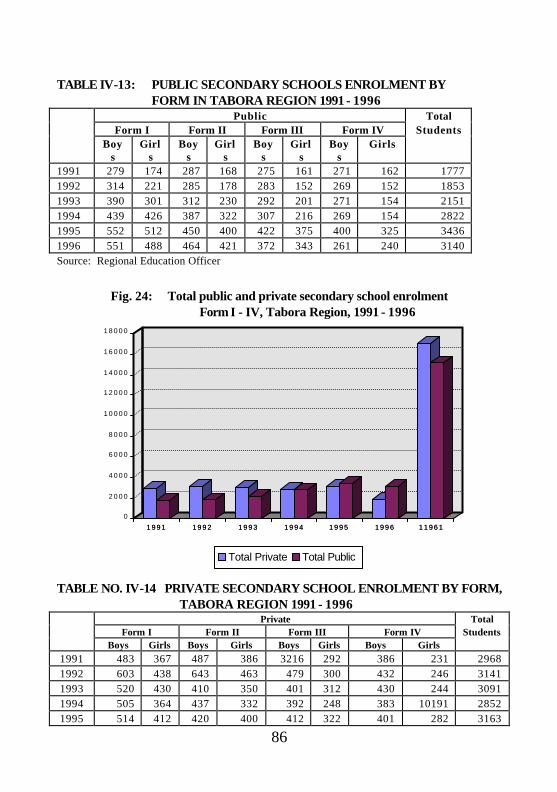
86
TABLE IV-13: PUBLIC SECONDARY SCHOOLS ENROLMENT BY FORM IN TABORA REGION 1991 - 1996
Public Total Form I Form II Form III Form IV Students Boy
s Girl
s Boy
s Girl
s Boy
s Girl
s Boy
s Girls
1991 279 174 287 168 275 161 271 162 1777 1992 314 221 285 178 283 152 269 152 1853 1993 390 301 312 230 292 201 271 154 2151 1994 439 426 387 322 307 216 269 154 2822 1995 552 512 450 400 422 375 400 325 3436 1996 551 488 464 421 372 343 261 240 3140 Source: Regional Education Officer
Fig. 24: Total public and private secondary school enrolment
Form I - IV, Tabora Region, 1991 - 1996
1 9 9 1 1 9 9 2 1 9 9 3 1 9 9 4 1 9 9 5 1 9 9 6 1 1 9 6 10
2 0 0 0
4 0 0 0
6 0 0 0
8 0 0 0
1 0 0 0 0
1 2 0 0 0
1 4 0 0 0
1 6 0 0 0
1 8 0 0 0
1 9 9 1 1 9 9 2 1 9 9 3 1 9 9 4 1 9 9 5 1 9 9 6 1 1 9 6 1
Total Private Total Public
TABLE NO. IV-14 PRIVATE SECONDARY SCHOOL ENROLMENT BY FORM,
TABORA REGION 1991 - 1996 Private Total Form I Form II Form III Form IV Students Boys Girls Boys Girls Boys Girls Boys Girls
1991 483 367 487 386 3216 292 386 231 2968 1992 603 438 643 463 479 300 432 246 3141 1993 520 430 410 350 401 312 430 244 3091 1994 505 364 437 332 392 248 383 10191 2852 1995 514 412 420 400 412 322 401 282 3163

87
1996 295 372 275 161 246 153 238 149 1889 Source: Regional Education Officer
There were 5,029 students in 1996 out of whom 2,207 or 44 percent were girls.
4.1.3 Adult Education Tabora region ranks 18th among 19 position as can be observed
in Table IV-15 which compares mainland region’s literacy attainments and development from 1967 to 1988.
TABLE: IV-15: PERCENTAGE OF LITERACY FOR POPULATION AGED 10
YEARS AND ABOVE IN TABORA REGION COMPARED TO OTHER REGIONS IN LAST THREE CENSUSES
Region 1967 Census 1978 Census 1988 Census Ranking TABORA Kilimanjaro Dar es Salaam Ruvuma Tanga Morogoro Mara Iringa Kagera Dodoma Mtwara Mbeya Rukwa Lindi Singida Mwanza Coast Kigoma Arusha Shinyanga
27 56 60 41 40 37 35 31 40 24 28 29 .. ..
24 25 26 19 26 16
40.5 74.1 73.3 66.3 60.6 58.6 56.4 54.0 52.9 49.5 51.4 49.2 48.5 48.4 46.7 44.3 44.0 43.7 41.9 33.2
50.5 80.8 80.7 70.5 66.0 62.8 63.9 68.3 59.5 55.5 57.1 61.9 58.6 53.8 57.4 57.3 51.1 55.1 58.1 48.3
18 1
1 2 4 6 5 3 8 14 13 7 9 16 11 12 17 15 10 19

88
It is observed from Table:IV-15 that the literacy level in Tabora region had reached 50.5 percent compared to 80.8 percent for Kilimanjaro and 80.7 percent for Dar es Salaam at the time of 1988 population Census. Table IV-16 reveals that women’s literacy is lower than male literacy in all the regions both in urban and rural areas. This is also true for Tabora region and also true for all districts as can be observed in Table IV-16 below.
Fig. 25: Percentage of literacy for population aged 10 years and above in Tabora
Region compared to other Regions in the last three Censuses
1967 Census 1978 Census 1988 Census0
10
20
30
40
50
60
1967 Census 1978 Census 1988 Census
TABLE:IV-16 LITERACY RATES FOR RURAL AND URBAN POPULATION OF
10 YEARS AND ABOVE 1988 CENSUS MALE FEMALE
REMARKS Rural Urban Total Rural Urban Total
Tabora 56.1 85.2 60.5 36.7 67.8 41.6 Iringa 80.1 87.4 84.9 57.2 70.4 58.5 Kilimanjaro 84.5 90.3 85.5 75.7 83.6 76.9 Dar es Salaam 68.4 90.0 87.9 48.0 77.7 74.6 Ruvuma 77.7 87.6 78.7 61.4 75.7 63.3 Tanga 72.8 88.6 75.9 53.1 75.6 57.3 Morogoro 68.8 86.4 72.9 49.5 72.0 54.6 Mara 73.7 88.0 75.3 53.7 71.5 55.6 Kagera 68.0 84.4 69.0 49.7 72.4 50.9
89
Mtwara 65.5 77.9 67.3 46.3 61.6 48.5 Dodoma 61.5 85.4 64.4 45.1 73.7 48.2 Mbeya 69.9 87.5 73.3 48.4 70.0 52.4 Rukwa 69.1 84.3 71.3 43.9 66.4 47.3 Lindi 62.4 75.9 64.6 42.0 60.2 44.8 Singida 65.0 85.5 66.8 47.2 70.8 49.3 Mwanza 63.7 83.7 67.6 43.4 66.9 47.8 Coast 60.1 72.2 64.0 40.1 51.8 44.9 Kigoma 65.1 83.1 67.4 43.1 62.7 45.5 Arusha 61.5 91.8 65.6 46.4 82.8 50.9 Shinyanga 57.9 85.9 59.9 36.2 67.7 39.3 Source: Regional Education Officer
TABLE: IV-17 ILLITERATE POPULATION CENSUS 1996 OF 10 - 65 + YEARS
Age Group
Sex
Igunga
Nzega
Tabora
(R)
Urambo
Tabora
(U) 10 -14 Male 247 381 326 392 65 Female 489 392 652 2250 146 15 - 29 Male 2666 1678 2168 2210 720 Female 4017 2254 2954 2597 1157 30 - 44 Male 3146 2206 2523 1576 4521 Female 4709 3049 3587 2351 1395 45 - 54 Male 1733 1633 1443 1715 620 Female 2503 1997 2136 2906 928 55 - 65+ Male 1796 2120 1661 1071 852 Female 1721 1634 2400 1892 1099 Total Male 9588 7288 8121 6864 3297 Female 13439 9329 11729 11996 4722 Grand Total 23027 16677 19850 18860 8019 Source: Regional Education Officer
4.2 Health 4.2.1 Introduction

90
Both modern and traditional health systems co-exist in Tabora region. In the modern situation there are government, voluntary agencies, parastatal organisation and private health services. The traditional health system consists of traditional healers and traditional birth attendants whose contribution is still accepted by the communities.
The climate, social habit, poor economic conditions and inadaquate or rundown health infrastructure have aggravated health situation in the region.
4.2.2 Morbidity and Mortality The ten most common causes of morbidity and mortality are as
shown in Table IV-18. TABLE IV-18: THE TEN MOST COMMON CAUSES OF MORBIDITY IN
TABORA REGION 1996 Disease Occurrence % of all cases Ranking
1. Malaria 2. URTI 3. Diarrhoea 4. Eye Disease 5. Pneumonia 6. Intestinal Worms 7. Skin Disease 8. Anaemia 9. Gonorrhea 10. Ear Disease
269,136 85.390 46,542 22,420 11,237 23,326 20,390 7,436 6,196 2,813
54.4 17.2 9.4 4.5 2.3 4.7 4.1 1.5 1.3 0.6
1 2 3 5 7 4 6 8 9 10
By far the most common cause is malaria followed by upper respiratory tract infections. Diarrhoea and intestinal worms are also more evident.
4.2.3 Health Infrastructure
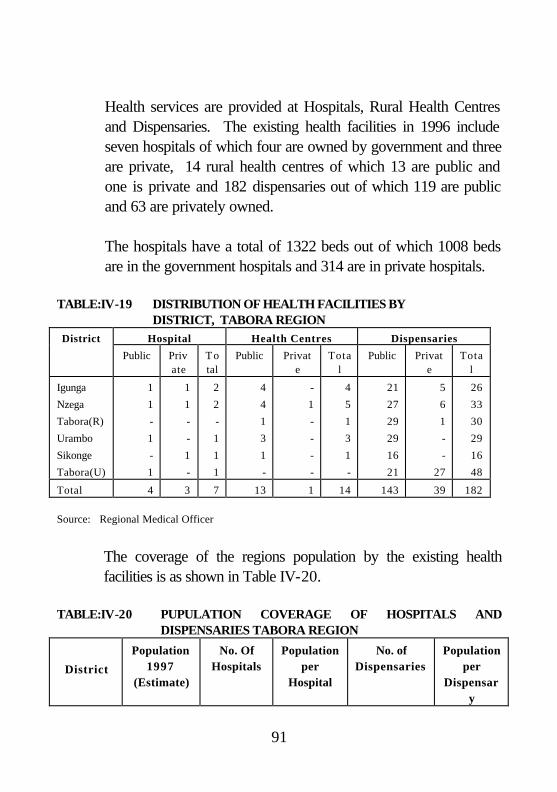
91
Health services are provided at Hospitals, Rural Health Centres and Dispensaries. The existing health facilities in 1996 include seven hospitals of which four are owned by government and three are private, 14 rural health centres of which 13 are public and one is private and 182 dispensaries out of which 119 are public and 63 are privately owned.
The hospitals have a total of 1322 beds out of which 1008 beds are in the government hospitals and 314 are in private hospitals.
TABLE:IV-19 DISTRIBUTION OF HEALTH FACILITIES BY DISTRICT, TABORA REGION District Hospital Health Centres Dispensaries
Public Private
T otal
Public Private
Total
Public Private
Total
Igunga
Nzega
Tabora(R)
Urambo
Sikonge
Tabora(U)
1
1
-
1
-
1
1
1
-
-
1
-
2
2
-
1
1
1
4
4
1
3
1
-
-
1
-
-
-
-
4
5
1
3
1
-
21
27
29
29
16
21
5
6
1
-
-
27
26
33
30
29
16
48
Total 4 3 7 13 1 14 143 39 182 Source: Regional Medical Officer
The coverage of the regions population by the existing health
facilities is as shown in Table IV-20. TABLE:IV-20 PUPULATION COVERAGE OF HOSPITALS AND
DISPENSARIES TABORA REGION
District
Population 1997
(Estimate)
No. Of Hospitals
Population per
Hospital
No. of Dispensaries
Population per
Dispensary

92
Igunga
Nzega
Tabora (R)
Urambo
Tabora (U)
216,759
379,227
353,431
229,737
124,239
2
2
1
1
1
108,379
189.613
353,431
229,737
124,239
26
33
46
29
48
8,337
11,492
7,683
7,922
2,588
Total 1,303,394 7 186,199 182 7,161 Source: Regional Medical Officer
The population per bed coverage in 1997 was 986 as against the
national coverage of 896. See Table: IV-21 TABLE:IV-21 NUMBER OF POPULATION PER BED BY DISTRICT
District Population 1997 (Estimate)
Number of Hospital Beds
Population per Bed
Igunga Nzega Tabora (R) Urambo Tabora (U)
216,759 379,227 353,431
224,737 124,239
299 361 210 102 350
725 1050 1683 2252 355
Region 1,303,394 1,322 986
Source: Health Statistics Abstract 1996, Ministry of Health
4.2.4 Child Immunization
There are six early childhood diseases against which immunization can be given. These diseases are tuberculosis, pertussis, diptitheria, tetanus, polio and measles. The number one target group for such immunization consist of new born children before they reach one year. The second target group are the under fives. The immunization of children under one year had by 1995 reached above 80 percent in Urambo district. The lowest coverage was Tabora/Sikonge districts.

93
TABLE:IV-22 IMMUNISATION COVERAGE OF UNDER ONE YEAR BY DISTRICT 1994 - 1995, TABORA REGION.
Years Igunga Nzega Tabora/Sikonge
Urambo Tabora Urban
Total
BCG 1994 1995
96 86
95 92
53 86
97 94
99 93
97 85
DPT3 1994 1995
79 73
77 79
78 72
83 87
80 75
79 77
POLIO3 1994 1995
61 73
52 79
36 71
43 86
99.5 75
52 77
MEASLES 1994 1995
94 63
74 80
72 77
94 86
66 76
80 70
Source: Regional Medical Officer
For all the districts, immunization of under fives was well covered above 70 percent in 1994 and 1995.
TABLE:IV -23 IMMUNISATION COVERAGE OF UNDER FIVE YEAR
BY DISTRICT 1994 - 1995, TABORA REGION Years Igunga Nzega Tabora/
Sikonge Urambo Tabora Total
BCG 1994
1995
90
86
96
92
99
86
92
94
53
93
91
85
DPT2 1994
1995
69
73
75
79
77
72
86
87
74
75
77
77
POLIO3 1994
1995
73
73
75
79
81
71
86
86
77
75
93
77
MEASLES 1994
1995
76
63
66
80
80
77
82
86
72
76
84
70
Source: Regional Medical Officer
4.2.5 Maternal Mortality
The death of women while pregrant or within 42 days of the termination of pregnancy defines maternal mortality. Maternal surveillance and delivery of children at a health facility reduces the risk of death to both child and mother. Table:IV-24show how Tabora region fares compared to other regions with respect to the

94
place of delivery. More women deliver at a health facility in Tabora Region ranking Fourth after Dar es Salaam, Ruvuma and Kilimanjaro regions.

95
TABLE: IV-24 PLACE OF DELIVERY - PERCENT DISTRIBUTION OF BIRTHS IN TABORA REGION
Region Health Facility Home Don’t Know/ Missing Total
Tabora Dodoma Arusha Kilimanjaro Tanga Morogoro Dar es Salaam Lindi Mtwara Ruvuma Iringa Mbeya Singida Rukwa Kigoma Shinyanga Kagera Mwanza Mara Coast
63.3 41.5 41.3 64.3 45.0 54.0 85.9 49.5 51.5 79.8 46.6 46.9 47.1 45.6
- 38.9 29.6 37.6 31.7 51.1
28.7 57.4 54.1 31.1 54.3 44.7 12.3 42.3 47.8 17.8 53.0 52.7 51.5 53.5
- 50.4 67.7 53.8 58.7 44.0
8.0 1.1 4.6 4.6 0.6 1.3 1.8 8.2 0.7 2.4 0.3 0.4 1.4 0.8
- 10.7 2.7 8.6 9.6 4.9
100 100 100 100 100 100 100 100 100 100 100 100 100 100
- 100 100 100 100 100
The Maternal Mortality Rate for Tabora when compared to other
regions is as shown in Table IV-25

96
TABLE IV-25: MATERNAL MORTALITY RATE IN TANZANIA MAINLAND BY REGION FOR 1992, 1993, 1994
Region 1992 1993 1994 Tabora 151 185 130 Arusha Coast Dar es Salaam Dodoma Iringa Kagera Kigoma Kilimanjaro Lindi Mara Morogoro Mtwara Mwanza Rukwa Ruvuma Shinyanga Singida Tanga
102 209 220 197 311 304 144 126 262 67
289 264 221 172 225 143 242 255
158 111 398 214 321 343 155 46
289 361 172 212 186 294 189 188 171 172
114 70
237 208 276 190 105 107 193 436 190 161 266 243 186 199 238 220
Source: Health Statistical Abstract 1996
Fig. 27: Maternal Mortality Rate in Tabora Region For 1992, 1993, 1994

97
0
50
100
150
200
1992 1993 1994
4.2.6 Infant and Under Five Mortality The infant mortality rate (IMR) and the Under five Mortallity Rate
(U5MR) are the two ultimate indicators of child survical. Table IV-26 shows that Tabora region had a better performance compared to other regions. Both the IMR and U5MR are showing the healing sign of declining.
TABLE IV-26: INFANT AND UNDER FIVE MORTALITY RATES FOR
TABORA REGION COMPARED TO OTHER REGIONS 1975, 1985, 1995
Region IMR U5MR
1975 1985 1995 1975 1985 1995
Tabora 140 101 73 236 166 116

98
Arusha
Dar es Salaam
Coast
Dodoma
Iringa
Kagera
Kigoma
Kililmanjaro
Lindi
Mara
Mbeya
Morogoro
Mtwara
Mwanza
Rukwa
Shinyanga
Singida
Tanga
108
108
121
133
152
133
163
76
151
140
161
140
161
139
170
150
137
112
75
105
113
132
130
130
115
67
140
125
124
125
138
115
131
110
96
106
52
102
105
130
111
127
81
59
129
112
96
112
119
95
101
81
67
100
179
179
204
225
257
225
269
119
255
236
257
236
267
233
283
252
231
187
129
173
189
222
220
219
192
104
236
211
209
211
233
192
221
183
157
176
78
168
174
220
187
212
137
90
218
189
163
189
202
157
172
131
106
‘166
Nation 137 115 96 213 191 158
Source: Health Statistics Abstract 1996.
Fig. 28 (a): Infant Mortality Rates (IMR) for Tabora Region Compared to the Nation 1975, 1985 and 1995

99
1975 1985 19950
20
40
60
80
100
120
140
1975 1985 1995
Tabora Region Nation
Fig. 28 (b): Under Five Mortality Rates (U5MR) for Tabora Region
Compared to the Nation 1975, 1985 and 1995
1975 1985 19950
50
100
150
200
250
1975 1985 1995
Tabora Region Nation
As can be observed in Table IV-27 there is a difference in
mortality rates in urban and rural areas while the IMR was 101 in 1988 it was 103 in urban areas. Similarly the U5MR in 1988 was

100
166 but it was 165 in rural and 169 in urban areas. These rates surprisingly show that children in urban areas carry a greater risk of death than in rural areas compared to most regions.
TABLE:IV-27 INFANT AND UNDER FIVE MORTALITY RATES BY REGION,
RURAL AND URBAN, 1988 Region IMR U5MR
Rural Urban Rural Urban
Tabora 101 103 165 169 Arusha Coast Dar es Salaam Dodoma Iringa Kagera Kigoma Kilimanjaro Lindi Mara Mbeya Morogoro Mtwara Mwanza Rukwa Ruvuma Shinyanga Singida Tanga
76 115 121 136 130 130 116 66 143 128 128 134 143 119 134 114 112 99 109
72 104 103 94 135 116 109 73 121 101 107 94 108 94 112 107 92 81 89
120 193 203 230 219 220 194 102 241 216 216 226 241 200 227 190 186 161 182
114 172 169
154’ 229 193 181 115 204 116 177 153 180 158 186 177 150 129 144
Mainland 118 114 197 190
Source: 1988 Population Census (National Profile)
A look at Table IV-28 show that male children in the region as in
most regions in Tanzania are more at risk from death than their female counterparts.

101
Fig. 29 (a): Infant Mortality Rates (IMR) of Tabora Region compared to the Mainland, Rural and Urban, 1988
90
95
100
105
110
115
120
Rural Urban
Tabora Mainland
Fig. 29 (b): Under Five Mortality Rates (U5MR) of Tabora Region compared to
the Mainland, Rural and Urban, 1988
145150155160165170175180185190195200
Rural Urban
Tabora Mainland
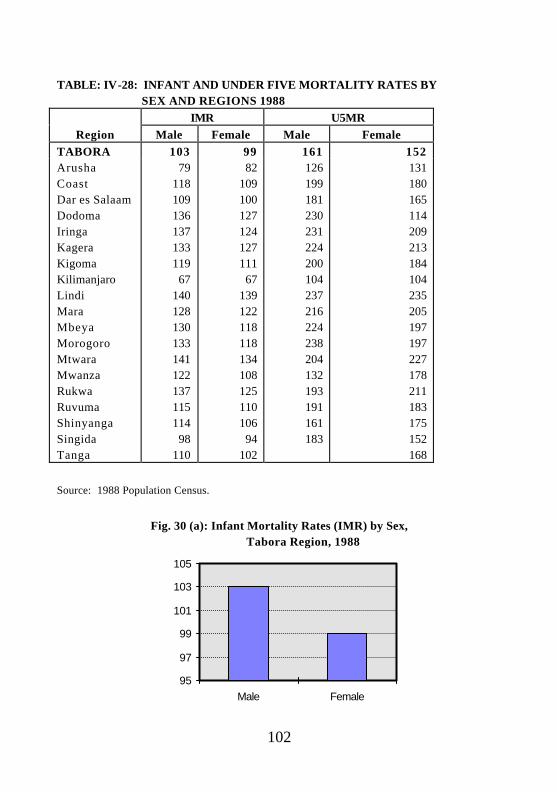
102
TABLE: IV-28: INFANT AND UNDER FIVE MORTALITY RATES BY SEX AND REGIONS 1988
IMR U5MR
Region Male Female Male Female
TABORA 103 99 161 152 Arusha Coast Dar es Salaam Dodoma Iringa Kagera Kigoma Kilimanjaro Lindi Mara Mbeya Morogoro Mtwara Mwanza Rukwa Ruvuma Shinyanga Singida Tanga
79 118 109 136 137 133 119 67 140 128 130 133 141 122 137 115 114 98 110
82 109 100 127 124 127 111 67
139 122 118 118 134 108 125 110 106 94
102
126 199 181 230 231 224 200 104 237 216 224 238 204 132 193 191 161 183
131 180 165 114 209 213 184 104 235 205 197 197 227 178 211 183 175 152 168
Source: 1988 Population Census.
Fig. 30 (a): Infant Mortality Rates (IMR) by Sex,
Tabora Region, 1988
95
97
99
101
103
105
Male Female

103
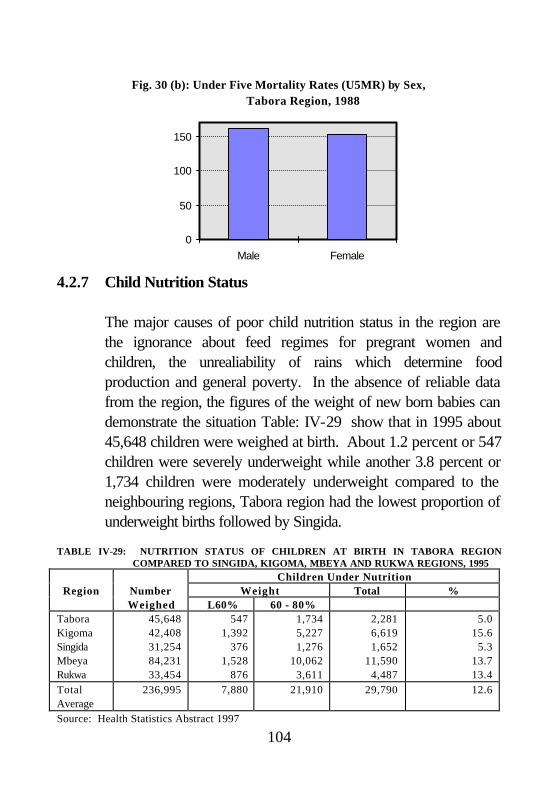
104
Fig. 30 (b): Under Five Mortality Rates (U5MR) by Sex, Tabora Region, 1988
0
50
100
150
Male Female
4.2.7 Child Nutrition Status
The major causes of poor child nutrition status in the region are the ignorance about feed regimes for pregrant women and children, the unrealiability of rains which determine food production and general poverty. In the absence of reliable data from the region, the figures of the weight of new born babies can demonstrate the situation Table: IV-29 show that in 1995 about 45,648 children were weighed at birth. About 1.2 percent or 547 children were severely underweight while another 3.8 percent or 1,734 children were moderately underweight compared to the neighbouring regions, Tabora region had the lowest proportion of underweight births followed by Singida.
TABLE IV-29: NUTRITION STATUS OF CHILDREN AT BIRTH IN TABORA REGION
COMPARED TO SINGIDA, KIGOMA, MBEYA AND RUKWA REGIONS, 1995 Children Under Nutrition
Region Number Weight Total % Weighed L60% 60 - 80%
Tabora Kigoma Singida Mbeya Rukwa
45,648 42,408 31,254 84,231 33,454
547 1,392 376 1,528 876
1,734 5,227 1,276 10,062 3,611
2,281 6,619 1,652 11,590 4,487
5.0 15.6 5.3 13.7 13.4
Total Average
236,995 7,880 21,910 29,790 12.6
Source: Health Statistics Abstract 1997

105
4.2.8 AIDS
Acquired Immunity Deficiency Syndrome (AIDS) is gaining importance as a cause of death in most parts of the country. It is both a social and economic problem for the region. The first case of AIDS in the region was discovered in 1985. By 1993 the cummulative total of AIDS cases was 1,415 or 235 people in every 100,000 population.
TABLE: IV-30: CUMMULATIVE AID CASES BY REGION 1985 - 1993
Region/Year
1985 1986 1987 1988 1989 1990 1991 1992 1993
Arusha
Coast
D’Salaam
Dodoma
Iringa
Kagera
Kigoma
Kilimanjaro
Lindi
Mara
Mbeya
Morogoro
Mtwara
Mwanza
Rukwa
Ruvuma
Shinyanga
Singida
Tabora
Tanga
0
1
51
0
1
322
0
8
0
0
0
0
1
15
0
0
0
0
5
0
10
4
471
7
3
847
3
36
1
3
16
11
5
54
1
20
8
6
6
13
47
79
1470
47
68
1665
50
207
9
30
208
88
23
171
5
45
31
74
59
80
217
224
3093
105
305
2142
109
455
45
99
747
247
95
448
90
76
144
197
232
210
429
413
5203
247
374
2543
243
570
111
139
1042
339
173
644
94
187
227
284
510
335
579
705
7196
277
612
3164
434
854
394
237
2819
544
369
1065
124
388
463
405
802
650
881
1147
8651
400
1660
3886
631
1523
563
483
4741
1733
824
2119
203
788
931
577
1071
1257
996
1341
8868
426
1945
4135
818
1779
668
600
5633
2167
995
2448
258
999
1102
683
1208
1377
1152
1457
9186
520
2232
4387
961
2279
800
668
6081
2287
1051
2762
317
1192
1310
759
1415
1606

106
Mainland 404 1525 4456 9280 14107 22081 34140 38416 42422
Source: Health Statistics Abstract 1996, Ministry of Health.
Fig. 31: Commulative IDS Cases in Tabora Region, 1985 - 1993
0
200
400
600
800
1000
1200
1400
1600
1985 1986 1987 1988 1989 1990 1991 1992 1993
4.2.9 Life Expectancy
Life expectancy is the ultimate measure of a region’s health environment. Between 1978 and 1988 censuses life expectancy for Tabora region improved from 44 years to 53 years. If viewed for males and females the life expectancy was 53 for males and 54 for females. This means that usually female have longer life expectancy than males as can be seen in Table IV-31.

107
TABLE IV-31: LIFE EXPECTANCY AT BIRTH BY SEX AND BY REGION. TANZANIA MAINLAND 1978 AND 1988
Average 1988 Region 1978 Average Male Female Ranking
Tabora 44 53 53 54 4 Arusha Coast Dodoma Dar esSalaam Iringa Kagera Kigoma Kilimanjaro Lindi Mara Mbeya Mtwara Mwanza Morogoro Rukwa Ruvuma Shinyanga Singida Tanga
50 47 45 50 41 45 40 58 42 44 41 40 44 44 40 43 42 44 49
57 48 46 50 45 45 48 59 47 47 47 46 48 46 45 49 50 55 49
57 46 45 50 44 44 47 57 46 46 45 44 46 45 44 48 48 54 48
58 51 47 50 47 45 49 62 48 48 48 48 50 48 47 50 51 55 51
2 9
18 5
19 18 11 1
13 12 14 16 10 15 17 8 6 3 7
Mainland 44 49 51
4.3 Water Supply 4.3.1 Introduction
Tabora region is in the semi-arid climatic zone in which there is a limited natural water resources. Most rivers in the region which could be a source of surface water flow strongly at the height of the rains but the flow rate drops off sharply at the end of wet season. All the major rivers which are the Ugalla, the Wembere and Malagarasi rivers are perennial. The tributaries of these rivers

108
are generally broad mbugas with badly defined drainage channels, but in which in the wettest areas to the west, shallow underground supplies of water are readily accessible. The only large natural supply of surface water is Lake Sagara on the Western boundary of the region. Shallow underground water could be obtained from wells but suitable areas for the use of this technique need to be defined and better construction and maintenance techniques applied. The deeper underground water potential is generally only poor to fair due to the presence of underlying beds of granite or granadiorites while in the North East of Nzega District, much of the underground water is saline or has a high flouride content. Good yields of 1000 gallons per hour or more have been obtained at depth of 60 - 120 metres in selected areas mainly to west of Tabora but the failure rate in drilling varies from one good borehole to one poor dry hole.
Due to the region’s flat rolling topography, the poor stream flow and the presence over large areas of sandy permeable soils, good dam site are not easy to locate. However some 50 dams have been built in the region with the largest being the Mwamapuli dam (600 million gallons), the Bulenya (450 million gallons) both in East Nzega, followed by the Mihama and Kilimi dams in South East and West Nzega, and the Igombe and Kazima dams in Tabora district. In difficult areas, an alternative source of water has been provided by the construction of “charcos” which are large excavated pits that collect water during the rainy season.
For the last three years from 1995 to 1997 Tabora region has experienced inadequate rains which have led to drought both in rural and urban areas. The situation has led to the drying up of

109
various water sources like Kazima, Uchama and Nkiniziwa dams and some shallow wells and charcoals. The installed water supply facilities are estimated to benefit about 36% of the region’s population, Currently the vast majority of rural population still rely on traditional water sources for human and livestock watering either from hand dug water holes in river bed or unlined, unprotected shallow wells or ponds. Table: IV-32 below shows the situation.
TABLE IV-32: NATURAL SOURCES AND WATER SCHEMES BY DISTRICT,
TABORA REGION 1996. DISTRICT IGUNGA NZEGA TABORA URAMBO TOTAL
Piped Scheme Operating Not Operating
4 2
2 7
7 9
4 5
15 28
TOTAL 6 9 16 9 43 Shallow Wells. With Hand pumps Without Hand pumps
19 24
19 15
40 26
35 21
113
86
TOTAL 43 34 66 56 199 Boreholes With Pumped W/S Without Pumped W/S Dry, Saline etc.
2 3
21
4
11 8
3 5
73
17
9 17
26 28
119
TOTAL 26 23 81 43 173 Dams Reservoirs Springs
5 8 -
9 -
16
6 10
7
3 - 8
23 18 31
Source: Regional Water engineer
TABLE IV-33: NUMBER OF PEOPLE SERVED WITH CLEAN WATER BY DISTRICT
District 1988 1996
Population % Served Population % Served
Igunga 23,941 12.0 64,341 30 Nzega 44,382 15.0 99,682 27 Tabora (R) 42,812 17.0 140.181 41

110
Urambo 28,136 15.0 97,913 44 Tabora (U) 29,982 32.0 64,555 53.0 TOTAL 169,253 16.3 466,672 36.8 Source: Regional Water Engineer
4.3.2 Rural Water Supply
The rural population in Tabora region which is estimated to be 953,520 people is served with 51 piped water schemes, and 444 shallow wells. Out of 51 piped schemes three schemes are run by private organisation and 48 are run by government. The schemes are estimated to supply 1,623.47 cu m of water per day. This is 23.6 percent of the designed capacity of 689,7m3 per day. However the estimated water demand is 23,838m3 per day.
The 444 shallow wells are estimated to supply water for 110,750 people but due to long dry spell, most of these wells are dry. If these wells were properly working the combined level of service for the rural water supply facilities would be 31,0 percent of the total rural population.
TABLE IV-34: NUMBER OF RURAL POPULATION SERVED WITH CLEAN
WATER (1996), TABORA REGION
District
Total Rural
Population
Population
Served
%
Population
Served
Total Village
s
Villages
Served
%
Villages
Served
Igunga Nzega *Tabora Urambo
206,186 343,284 330,167 198,919
31,960 83,467 60,760 48,337
15.5 24.3 18.4 24.3
96 131 137 91
7 27 28 15
7.3 20.6 38.4 16.5
Total Region
1,078,756 224,524 20.8 455 77 16.9
* Includes Sikonge District. NB. Sikonge Town is Urban. Source : Regional Water Engineer

111
In the past few years, the installation of rural water supply systems was undertaken by Government. The burden of cost to the Government in such service increased to an extent that the government could no longer bear it. Later on it became necessary that these cost be shared between the Government and the beneficiaries. However, some other sources of assistance have to be sought for as neither the government nor the beneficiaries are not adequately funded to install and maintain these services. In Rural areas apart from the Government, the Councils and the beneficiaries, are also other actors to this cost sharing of water supply systems.
The cost sharing approach is now being emphasized to be
undertaken by beneficiaries through their Village Water Committees and Water Funds, but the willingness to contribute to a project depends to a large extent on a household’s or Community’s evaluation of the potential benefits. Some Communities are willing to contribute cash, others labour, ideas and leadership depending on Social-economic status and mass mobilization.
TABLE IV-35: VILLAGES WITH WATER FUNDS AND AMOUNT COLLECTED
BY DISTRICT 1993 - 19995) TABORA REGION 1993 1994
District Villages Amount Collected
Villages Amount Collected
Igunga 8 3,345,760 2 5,603,740 Nzega 8 775,220 12 505,600 Tabora (R) - - 1 148,902 Urambo 1 5,000 1 500 Sikonge 1 9,000 - - Tabora (U) 3 10,816 - - Total 21 4,141,296 16 6,258,742 Source: Regional Water Engineer

112
4.3.3 Urban Water Supply
Tabora Region has a total of 14 Urban Centres out of which one is a Municipality, Four District Headquarters and the Sub-Urban Centres. The present population in all is estimated at 241,245 and projected to reach 312,796 by the year 2002. Out of 193,214 people in Four (4) Districts Headquarters and one Municipality only 96,870 people are served with piped water which is 50.1%.
i) Igunga Town Water Supply
Igunga district rank first in the problem of water compared to other districts of Tabora. It is also unfortunate that very few Non-Governmental Organization are out to support people’s development efforts especially in the provision of water. Consequently the level of service is very low. The present level of service is estimated at less than 30% of the total population.
Igunga Town gets its water from Bulenya Dam by two ways, mainly by gravity system which catters for about 1/2 of the Town areas and by a booster pump stastion which supplies to sensitive areas e.g. District Hospital, Government offices and the remaining residential areas not commanded by gravity system.
For several years now, Igunga water committee has been running the project through people’s contribution, but due to economical fall back and increase in water demand due to population growth, the service has dropped to nearly stop-line.
ii) Nzega Town Water Supply

113
Nzega Town have three major water sources e.g. Uchama Dam, Kalangali Dam, and one borehole the present population is estimated at 25,000 people. The town has 15 public kiosks and 980 personal connection the total demand is 1750m3/day. The production capacity at present is only 450m3/day which is approximate 27% and this is being produced by Uchama Pumping System only, Kalangali Pumping system is out of order (beyond repair).
The major problems for the Nzega Water Supply are the rapid expansion of Nzega town, thus increasing water demand, the frequent beack down of the only machinery at Uchama Dam and lack of funds for operating and mantain the water supply system.
With the situation at Uchama Pumping Station suggestion is that more emphasis be put to supply Nzega Town with water from Kilimi Dam as the Uchama and Kalangali Dams drys or the water level drops excessively during the dry period. Also the construction of Ushirika Tank be completed which will increase the storage capacity by 125,000 gallons.
iii) Urambo Town Water Supply
Urambo Town is estimated to have six borehole as the water source with a total yield of 630m3/day while the total demand is 87m3/day which is 72% of service level. At present only three bore hole are in working condition which produces 35429m3/day which is 41% of level of service. The three other bore holes need new pumping unit.
114
Another problem at Urambo is the storage tanks, there are 7 storage tanks but only three (3) storage tanks are in use with a total capacity of 71,200 gallons, the other four (4) are out of order due to old age.

115
iv) Tabora Municipal Water Supply:
Tabora Municipal has a population about 126,500 people. The people of Tabora municipal obtain their water from three main water sources namely:-
(a) Igombe Dam which was built in 1958 with a total capacity
of 41,000,000m3 (b) Kazima Dam which was build in 1952 with a total
capacity of 1,620,000m3, but this capacity has decreased very much due to siltation.
(c) Three shallow wells with a total yield of 400m3/day.
Total demand of water for Tabora Municipal is 18,000m3/day while the supply is only 10,000m3/day which is 44%. The situation of water in Tabora Municipal is very severe, hence the water demand is almost twice as much as that is supplied due to the fact that the entire water supply system need major rehabilitation, to see and find ways of increasing the Igombe, Kazima Dam’s Storage capacity, to rehabilitate the rising main since the existing one has the capacity of carring only 10,000m3/day against design capacity of sand filters of filtering 15,000m3/day. Also the distribution systems should be looked, there are areas without the distribution system, and some areas have very old distribution lines as a result they carry little water, or no water at all due to blockage and courses leakage which make a lot of water to be lost on the way to the user.

116
TABLE IV-36: POPULATION SERVED WITH CLEAN WATER IN URBAN AREAS 1996
District Total Urban Population Population Served % Population
Served Igunga Nzega Tabora (R) Urambo Tabora (U)
10,039 25,657 11,621 25,595
120,302
9,951 7,581 4,860 9,923
64,555
99.1 29.5 41.8 38.8 53.6
Total 193,214 96,870 50.1
Source: Regional Water Engineer
4.3.4 Sanitation
In Tabora there is a 5.3 k.m. public sewer to which a few institutions and residential houses are connected. This sewer terminates into oxidation pond near Milambo Barracks. Nearly all houses in Tabora Municipal have no access to the public sewer or service sewer. Cesspit emptying remains the only immediate solution for domestic waste.
i) Rural sanitation status:
In most rural areas traditional pit latrines have been adopted and about 24% of the rural population go without latrines. More over, some people who go looking for green pastures in grazing areas, go in the bush for excreta disposal. Design of strong and permanent type of latrines (VIP) have already been introduced by the Ministry of Water and contruction has already started in Tabora Urban. For the Rural part, training of craftsmen on how

117
to construct these latrines has also started with Nzega District.
Apart from excreta disposal, sanitation generally is very poor in the rural areas. May be this is atributed to poor housing and dwelling conditions especially where animals share the same premise with the people. This conditions is expected to improve to the better because the Regional Authority have embarked on campaign for modern housing and improved dwelling congitions.
TABLE IV-37: HOUSEHOLD WITH TOILET BY DISTRICT - 1996.
Total Type of Toilet Total %
District Households (1988
Pit VIP Septic Tanks
Household with Toilet
Igunga Nzega Tabora (R) Urambo Tabora (U)
31,793 51,598 44,224 34,940 17,565
27,252 34,638 31,189 30,067 15,640
63 136 73 56
131
- - - -
763
27,315 34,774 31,262 30,123 16,534
85.9 67.4 70.7 86.2 94.1
Total Region
180,129 129,786 459 763 131,008 72.8
Source: Regional Water Engineer
ii) Urban sanitation status
In Urban areas very few houses are saved by septic tanks system. Instead traditional pit latrines have been adopted as the means of excreta disposal, mainly in densely populated areas, a good number of houses have fairly simple latrines, but the number vary year after year, this is because the type of soil which we have in here is mainly sandy, as such many latrines do collapse at the end a rainy season. This situation is complicated in Tabora Municipality for the fact that the water table is very high. All the

118
same devices of strong and parmanent type of latrines have been introduced by the Ministry of Water through the Municipal Council of Tabora and people are slowly adopting themselves to such latrines.
SECTION V
5.0 OTHER DEVELOPMENT RELATED ISSUES 5.1 Women in Development
Tabora region has a very high population of women compared to men. For every 100 women there are 97 men. This means women are even more vitally important for the economic and social welfare of Tabora Region. They are the producers of wealth and food for the households. Women toil in fields, homes, in livestock keeping, in searching for fuelwood, fetching water for the family in addition to their traditional role of child bearing and rearing. Despite their economic importance women as a group are more vulnerable to health risks because of gender.
The unequal access by women to decision-making, credit, markets, training, basic social services, land, extension services, technology and employment opportunities continue to present severe constraints to their integration into development activities and to their achievement of equitable social development.
Early marriages, comparative illiteracy and autdated discriminatory customs all contribute to the erosion of women rights.

119
Women, like men have to be trained for and exposed to leadership situation right from childhood if they are to assume position of responsibility in society. The increased awareness on gender issues and concerns will create an environment that will encourage the formulation and implementation of policies, programmes and projects that address to their constraints.
The formation of women groups and women oriented organisations are providing the fora on which to launch women empowerment, income generation and awareness of the inequalities. There are 86 women income generating groups in the region operating in different activities as shown in Table: V-1 with 762 members or 0.14% of the total population of women in the region.
TABLE V-1: WOMEN ECONOMIC GROUPS BY DISTRICT IN TABORA
REGION 1996
District Women Groups
No. of Members
Activitis
Igunga Nzega Tabora (R) Urambo Tabora (U)
10 17 13 12 34
50 310 65 67 270
Tailoring, cookery, grossary, gardening, charcoal felling, viosks, fish rendors, livestock selling, petty business and pombe shops.
Total Region 86 762
Source: Regional Community Development Officer, Tabora
5.2 Cooperatives
Tabora region has a total of 258 co-operative societies with two cooperative unions Igembensabo Cooperative Union Ltd (ICU) with 58 primary cooperative societies as members is basically for

120
cotton growers while Western Zone Tobacco Growers Cooperative Union with membership of 85 primary cooperative societies is meant for tobacco growers. Other cooperative societies include Saving and Credit, industrial, housing, fishing, shop and other services. See Table: V - 2
TABLE: V - 2 COOPERATIVE SOCIETIES IN TABORA REGION 1996
Type of Districts
Co-operatives Igunga Urambo Nzega Tabora (R) Sikonge Tabora(U) Total
Produce pri-mary Society
40 48 33 27 15 7 170
Saving and Credit
1 11 16 11 3 12 54
Shopp owners 1 3 3 - - 9 16 Industries - 1 2 1 - 3 7 Housing - - - - - 1 1 Fishermen - 1 1 - 1 1 4 Services - 2 2 1 - 1 6 Total Region 42 66 57 40 19 34 258
The total number of members to these cooperative societies is
25,056 or 2.4 percent of the total population of the region. TABLE V-3: MEMBERS IN COOPERATIVE SOCIETIES BY DISTRICT,
TABORA REGION 1996
Type of
Districts
Co-operatives
Igunga
Urambo
Nzega
Tabora(R
)
Sikong
e
Tabora(U
)
TOTAL
Produce pri-mary Society
1615 8236 1172 6017 1150 1288 19685
Saving and Credit
1196 310 713 173 1107 3541
Shopp owners 43 146 40 - - 283 512 Industries - 15 30 12 - 45 102 Housing - - - - - - - Fishermen - 15 10 - 16 1246 1276 Services - 115 47 15 - 1 187
Total 1658 9723 1609 6757 1339 3970 25056
5.3 NGOS Activities in the Region

121
The exact number of NGOs and what they are doing in the region is not very clear. But what is known is that apart from the religious NGOS in Tabora, there about 9 potential NGOs, of which only 4 are local NGOs. None of these four can stand on their own without support. The following table shows some activities being undertaken by these NGOs.
TABLE:V - 4 NGOS WITH THEIR ACTIVIES IN THE REGION: Name of NGO Area
Operating Objectives Progress
CARITAS All Districts - To assist community in bringing about their deve- lopment. It is mult sectoral - To assist the community during crises
- Recommandable
WORLD VISION Igunga and Nzega - To assist in water, health, agriculture, environmental conservation.
- It has worked in the for a short period.
HEALTH PROJECT ABROAD (HPA)
Igunga, Tabora (R) , Municipal and Urambo
- To assist community in improving health and education services
- Recommandable
WATERAID Tabora (R) and Municipal
- To assist community in improving water, health and Sanitation services.
- Recommandable
THE FRIENDS OF URAMBO AND MWANHALA
Urambo and Nzega
- To assist community in improving water, health, education services and afforestation.
- Racommandable
MARTEA Igunga, Urambo and Tabora
- To assist in water, health, agriculture, environmental conservation. - Ant - AIDS campaign
- Not so efficient.
HABITAT INTER-NATIONAL
Igunga - Rural housing - Recommandable

122
TAHEA Tabora (R) and Municipal.
- Food Storage. - To assist community in improving water, health and Sanitation services.
- It lacks financial capability.
MORAVIAN CHURCH
All districts - To assist community in improving water, health, education services and agriculture.
- Recommandable
ANGLICAN CHURCH
All Districts - To assist community in improving water, health, education services and afforestation.
- Recommandable
TADESO All Districts - To asist community in improving water, health, education services and afforestation.
- Not efficient.
5.4 Donor Projects 5.4.1 Forest Resource Management Project - (FRMP)
The project funded by the World Bank and the Government of Tanzania started in 1991 and has two components: Lands and Forestry.
5.4.2 Child Survival Protection and Development Programme (CSPD)
This project began in 1980’s with financing from UNICEF, WHO and the Government of Tanzania . The objectives of the project are to combat malnutrition lower mortality rates among children and mothers. The project covers Nzega and Igunga districts.
5.4.3 Cummunity Health Fund (CHF)

123
This is a pilot project carried out in Igunga district funded by WHO and Government of Tanzania. The objective of the project is to introduce a system whereby the community contribute to a health fund to cover for medical expenses.
5.4.4 Smallholder Development Project for Marginal Areas (SDPMA)
The project aims at assisting smallholders to increase productivity of paddy per hectare. It is funded by IFAD and the Government of Tanzania.

124
SECTION VI 6.0 POTENTIAL INVESTMENT AREAS 6.1 Agriculture
Tabora region which is estimated to have 2.4 million hectares of cultivable land has a great potential for a wide variety of crops-both cash and food crops. Although invariability and unreliability of rainfall is the main factor limiting crop production, total rainfall of between 800 to 2000 mm per year is sufficient for crop growing particularly the common grown crops of tobacco, cotton and maize.
The unreliability and invariability of rainfall can be overcome by irrigation. There are several potential areas suitable for rainwater harvesting irrigation. Some of these areas are Mbuga ya Lyela, Mwaguguli/Mwaluto, Sigili, Simbo/Mwisi, Igurubi/Mwagalo, Isakamaliwa, Kisanga/Mkolye, Kizengi, Mpumbili, Nyahua, Bukumbi, Lake Sagara, Kalina, Uyumbu, Mabama, Ndono, Songambele and Limbuka.
The use of organic fertilizers such as manure, compost and legumes should be emphasized in order to retain and increase soil fertility. There is also a potential for integration of agriculture and forestry (agroforesty) as well as improving cropping pattern for food crops (intercropping) in order to maximize yields in less fertile soils.
6.2 Livestock

125
The region’s climate and environmental conditions are favourable for livestock keeping. There is a potential for the Tanzania Short-horn Zebu to produce a reasonably good quality of meat. But there is still a need to improve the management systems and use animal breeding techniques which can lead to improved quality and increase the quantity of meat. The climate also favours growth of animals of improved breed but dairy development will mean mainly the promotion of dairy cattle through local breeding.
Since the present system of free grazing for livestock leads to overstocking, overgrazing and destruction of forage and soil structure causing serious soil erosion particularly in Nzega and Igunga districts, sound livestock development measures should be taken. These can include the shifting of livestock from overstocked and overgrazed areas of Igunga and Nzega district to planned understocked areas of Urambo, Tabora and Sikonge districts; the establishment and improvement of village pastures; and the establishment of new livestock settlement areas around certain large mbugas and the deregistered forest reserves.
6.3 Forestry
The rapid increase in population has increased pressure on the woodlands outside and inside the forest reserves using fuelwood as a source of energy for cooking, lighting and other activities. Clearing of woodland for tobacco production and cutting of wood for tobacco curing as well as need for new settlements have resulted in severe clearing of woodland and encroachment of some forest reserves. In addition to afforestation efforts, improvement and intensification of agriculture will reduce the need to clear new land for agricultural production. Agro-forestry and improved land use practices offer important opportunity for

126
improving land productivity while maintaining environmental stability.

127
6.4 Beekeeping.
Tabora region is highly endowed with Miombo woodlands which make them potential for high quality honey and beeswax production. This is possible because of the ecological conditions and due to the fact that there is little or no chemical use in these woodlands, Commercial and small scale production can be increased if modern technology is applied. In addition steps should be taken to encourage further the establishment of beekeeping groups on a sound cooperative basis, which make easy the provision of extension services and financial assistance.
6.5 Mining
Full mineral exploitation has not yet been achieved in Tabora region. But the current efforts in mineral prospecting will open up a wide investment opportunities since more information is required on mineral status.
6.6 Industrial Development
Although industrial development is a source of employment opportunities for an increasing number of unemployed youths, the existing industrial establishments in the region have not significantly solved the problem. There is a big room for investment in agro-industries for processing of agricultural and livestock products such as textile, vegetable oilmilling, flour milling and such other industries particularly at village level. Forest based industries can also be expanded such as lumbering, furniture making, and many others.

128
6.7 Roads
The road network in Tabora region has a considerably greater impact on the development of the region than railways. While the railways are important for interregional trade, trunk roads linking Tabora to other neighbouring regions are more important and should be improved to tarmac level. These roads are Tabora - Itigi road, Tabora - Rungwa (Mbeya) road, Tabora - Shinyanga border road, Tabora - Kigoma border road and Singida border to Kahama road. Maintenance and improvement of the existing regional and district roads from earth to gravel standard is of top priority to ensure smooth transportation of inputs and produce to and from the rural areas. Routine maintenance of these roads should be reviewed as a means of protecting previous investment.
6.8 Communication Network
Like roads, telecommunications are vital in servicing and stimulating development. Investment in the quality and quantity of telephones and fax links is badly required in all the district centres and eventually in the rural areas.
6.9 Energy
Electricity supply is concentrated in Tabora and Nzega towns. Further investment is needed to supply electricity to other towns and centres in rural areas if the region is to attract industries and conserve fuelwood energy.
6.10 Health
129
The health care delivery is already open for private investment. In the long run the country’s delivery of health care will be predominantly in the hands of private sector. Therefore individuals, NGO’s, companies and other private sector organisations are encouraged to invest in the establishment and running of health facilities in order to increase the coverage. In addition the training of health personnel; the supply of drugs, vaccine, equipment and other medical supplies, and technical assistance are vital for improving to quality of medical services. Lastly the containment of AIDS, HIV and STD’s infections is necessary through health education and other preventive measures.
6.11 Water Supply
The supply of potable and safe water is much below the demand. It is about 32.4 percent for rural areas and ... percent for urban areas. This means that there is little hope of raising the supply of water unless new investment will be forthcoming. A lot of resources in terms of pipes and equipment for piped systems and pumping equipment for deep and shallow wells have to be found to achieve a 100% coverage. Sanitation and sewarage is critical in urban areas because of overcrowding.
6.12 Education
Investment in education sector at all levels from pre-school education to University is now open to private sector. There is still quite a significant number of children of school going age who are not going to school. In 1988 the coverage was one primary school to every 2123 people. The corresponding figure for `996 is 2506. The demand is there and even stronger with respect to

130
secondary schools. The envolvement at secondary school ‘Level is very very low. While the number and quality of primary schools is poor, the quality of primary and secondary education is low. Therefore assistance to existing establishments in terms of infrastructure or teaching materials will have impact in raising the standard of education.
6.13 Women in Development
Investment is required first to increase awareness among women regarding gender issues and poverty alleviation and secondly in the formation of women groups for income generation and training of women.

131
ANNEX ″″ A″″ TABORA REGION IN A NUTSHELL 1.0 GENERAL 1.1 Location
Mid-Western part of Tanzania on the central plateau between latitude 40-7o South and longitude 31o-34o East.
1.2 Land Frontiers: North : Shinyanga Region East : Singida Region South : Mbeya and Rukwa Regions West : Kigoma Region 1.3 Land Area Land area 76,151 Sq. Km. or 9% of Tanzania Mainland area. 1.4 Climate, Soil and Vegetation
- Warm climate, daily mean 23oC. Seasonal rainfal totals from over 1000 mm. in the west to 700 mm. or less in the east.
- Soils vary widely ranging from sandy loams in the South,
Centre and West to heavy (black/fark brown) soils especially in the North.

132
- Vegetation: woodland, bushland thicket and grassland. 1.5 Agro-Economic Zones.
Zone I: Western Fringe Zone : Western and South Western boundary of the region with over 1000 mm. of rainfall, sparsely populated at an elevation from 1000 - 1500m. ASL. Crops maize, cassava, beans, paddy and tobacco.
Zone II: Miombo Zone : Most extensive zone in region.
Rainfall 700 mm. in the East to over 1000 mm. in the West. Elevation between 1000 m - 1500 m ASL. Crops: tobacco, maize, cassava, beans and paddy. Sawmilling and extensive beekeeping.
Zone III : North East Zone : Located in the North-East
corner of the region. Rainfall 700 mm East - 850 mm West. Densely populated zone. Crops: Cotton, maize and sorghum. Large cattle population.
Zone IV : East Centre Zone : Situated in the North-West
of North East Zone. Altitude between 1000m - 1800 m ASL. Rainfall 500 mm. - 800 mm. Crops: cotton, maize, sorghum, groundnut and cassava. Large cattle population
Zone IV : North West Zone : Situated in the North-West
of North East Zone. Altitude 1000m - 1500 m ASL. Rainfall 700 mm. - 1000 mm. Crops are

133
cotton, paddy, maize, sorghum and groundnuts. Large cattle population.
1.6 Administrative Units
- Five administrative districts of Igunga, Nzega, Tabora, Sikonge and Urambo with Tabora Municipality.
- 18 Divisions - 133 Wards - 455 Villages. 1.7 Population : (a) Population Census 1998 Total = 1,036,293 Sex Ratio = 96.7 Growth Rate = 2.4 Population Density = 13.6 per km2 Average Household Size = 14.7% Urbanization = 14.7% Net Lifetime Migration 66,370 (b) Population Projections 1996 AD 1998 AD 2000 AD Total = 1,270,770 1,336,963 1,407,051 Density 16.7 17.5 18.5 (c) Other Censuses

134
1978 Total Population 817,907 1967 Total Population 502,068 2.0 PRODUCTIVE SECTORS 2.1 Agriculture - Arable Land 2,400,000 ha - Cultivated Land 456,720 ha - Uncultivated Land 1,943,280 ha - Food Crops: Maize, Paddy, Sorghum, Cassava, Beans - Cash Crops: Tobacco, Cotton, Sunflower, Groundnuts 2.2 Livestock 1984 Census : Cattle 982,157 Goats 253,803 Sheep 183,673 Livestock facilities Dips 75 L.H.C. 29 Livestock Markets 33 Abbatoirs 32 2.3 Forestry Area under forest Ha 5,282,694 Area under forest reserves Ha 3,522,500 Number of forest reserves No 33

135
2.4 Beekeeping: No. of beekeepers (1996) 13,912 No. of beehives (1996) 1,701,186 2.5 Wildlife: November of Game Reserves 1 No. November of Game Controlled Areas 7 Nos. Area of Game Reserves N.A. Area of Game Controlled Areas Ha. 3,361,500 3.0 ECONOMIC INFRASTRUCTURE 3.1 Roads: Trunk Roads Km. 643 Regional Roads KM 1,273 District Roads KM 2,907 Road Density 0.063 Km/Sq. Km. 3.2 Railways TRC = Tabora - Dar es Salaam Tabora - Kigoma Tabora - Mwanza Tabora - Kaliua - Mpanda. 3.3 Telecommunications: - Full post offices 3 Nos. - Sub - Post offices 4 Nos.

136
- Telephone lines 3,200 - Fax lines/Telex lines 34 3.4 Air Services. - Major Airport at Tabora - Other airstrips at Nzega, Nkinga, Urambo, Kaliua 3.5 Energy Access to Electricity (1988 census) Rural areas: 0.5 % of rural households Urban Areas: 3.8 % of urban households all Areas: 4.3 % of all households. 4.0 BASIC SOCIAL INFRASTRUCTURE 4.1 Health: (1996) Number of Hospitals 4 Government 3 Voluntary Agencies Health Centres: 12 Government 1 Vp;imtaru Agemcoes Dispensaries 143 Government 28 Voluntary Agencies 11 Parastatals/Private 4.2 Water Supply (a) Rural Water Supplies

137
Dams 23 Nos. Boreholes 57 Nos. Shallow Wells 444 Nos. (b) Urban Water Supplies Dams and piped system 5 Boreholes 7 Shallow Wells 3 4.3 Education (1997 (a) Primary Education Number of primary schools 517 Envolment (Total) 164,329 Envolment Rate 77.6 (b) Secondary Education Number of Secondary Schools: Govt. 13 Private 11 Enrolment(Total) in Governmen Schools 3,140 Private Schools 1,889 5.0 SELECTED SOCIO-ECONOMIC INDICATORS (1996) 5.1 Education (Primary) Population per School
2,458 Pupils per 1000 population
129

138
Pupils per School 301
Pupils per classroom 81
Pupils per Teacher 34
%Shortage of classroom to requirement 37.8 %Shortage of houses to requirement 90.3 %Shortage of toilets to requirement 56.1 %Shortage of teachers to requirement 13.3 Education (Secondary) Population per Secondary School 52,948 Pupils per 10,000 population 39.6 Adult Literacy: 1967 Census 27.0 1978 Census 40.5 1988 Census 50.5 5.2 Health (a) Facilities: Population per hospital (1997) 186,199 Population per dispensary 7,161 Population per hospital Bed 986 Population per facility 6,420 Faco;otoes [er 10,000 0.6

139
(b) Services: < 1 Child Immunization Cpverage (1995) BCG 85% DPT3 77% Polio 3 77% Measles 70% < 5 Child Immunisation Coverage 70% (c) Basic Indicators Infant Mortality Rate (IMR) 1975 140 1985 101 1995 73

140
1988 IMR Rural 101 Urban 103 Male 109 Female 99 Under Five Mortality Rate U5 MR 1975 236 1985 166 1995 116 1988 U5 MR Rural 165 Urban 169 Male 161 Female 152 Maternal Mortality Rate (MMR) 1992 151 1993 185 1994 130 Life Expectancy 1978 Average 44 1988 Male 53 Female 54

141

142
WATER SUPPLY Population Supplied with Safe Water against demand (percentage) Rural Areas Igunga 15.5 Nzega 24.3 Tabora/Sikonge 18.4 Urambo 24.3 Urban Areas Igunga 99.1 Nzega 29.5 Tabora (R) 41.8 Urambo 38.8 Tabora (U) 53.6 Regional Total 36.0 Sanitation Population covered with Toilet facilities. Igunga 86 % Nzega 67 % Tabora (R) 71 % Urambo 86 % Tabora (U) 94 %

143
Regional Total 73 % REGIONAL ECONOMY: Regional GDP at current prices (Millions) Tshs. US $ 1980 1,188 144 1985 3,199 194 1990 21,859 111 1994 55,012 99 Regional Per Capita GDP at Current Prices. Tshs. US $ 1980 1,386 169 1985 3,313 201 1990 19,993 101 1994 44,984 81 OTHER ISSUES: (a) Women Economic/Gender Issue Groups Groups 86 Members 762 (b) Cooperatives - Cooperative Unions 2 - Produce Cooperative Societies 170 - Other Cooperative Societies 88

144
- Members - Produce Cooperatives 19,685 - Other Cooperatives 5,371

145
ANNEX ″″ B″″ IGUNGA DISTRICT SUMMARY (1996) 1.0 GENERAL 1:1 Location: North Eastern part of the region. Borders: North: - Shinyanga Region (Kahama District) East: - Singida Region South: - Tabora District West: - Nzega District 1:2 Land Area: 6788 Sq. km. or 8.9 percent of the area of Tabora Region 1:3 Administrative Units: Divisions = 4 Wards = 26 Villages = 96 1:4 Population: (a) Population 1988 Census: Total = 203,097 Sex Ratio = 96.7 Dependency Ration = 98.5 Growth Rate = 0.7 Population Density = 29.9 /Km2 % Urban population= 4.2 Average Household Urban = 4.5 Rural = 6.5

146
District = 6.4 (b) Population Projections 1996 AG 1998 AD 2000 AD Total 215,225 218,303 221,425 Density 31.7 32.2 32.6 2.0 ECONOMIC ACTIVITIES: 2.:1 Agriculture: Food crops - maize, sorghum, paddy - Cash crops: cotton, sunflower. 2:2 Livestock: Livestock population (1984 Census) Cattle 411,568 Goats 76,396 Sheep 91,454 Livestock Facilities: Dips - 15 Veterinary Centres - 7 Abbatoirs - 43 Livestock Markets - 10 2:3 Natural Resources: Forest Reserves - Number - 3 No. Area - 115,271 ha Game Reserves - Number - Nil Area - Nil

147
Game Controlled Areas -Number - Nil - Area - Nil Beekeping: Total beehives 25,250 3.0 ECONOMIC INFRASTRUCTURE 3:1 Roads: Trunk roads Km 88 Regional roads Km 291 District roads - 128 Road Density 0.075 Km/Sq. Km. 3:2 Railway Transport - None 3:3 Air Services - Nkinga Airstrip 3:4 Telecommunicatio: Full Post Office - Nil Sub-Post Office - 1 No. Telephone lines - 100 Fax Lines - Nil 3:5 Energy: Access to electricity (1988) Households 0.5 percent. 4.0 BASIC SOCIAL FACILITIES 4:1 Health (1996 Hospitals 2 Nos. Health Centres 4 Nos. Dispensaries 26 Nos. 4:2 Education (1996)

148
Number of primary schools 104 Enrollment (Total) 5,444 Enrollment Rate 85.8 Number of Secondary Schools 3

149
4:3 Water Supply Rural Water Supply: Operating Not working Total - Piped Schemes 4 2 6 - Boreholes 5 21 26 - Shallow Wells 70 - 70 % of population with clean and safe water.

150
ANNEX ″″ C″″ NZEGA DISTRICT SUMMARY (1996) 1.0 GENERAL 1:1 Location: Central: Northern part of the region Borders: North-Kahama district(Shinyanga Region). East - Igunga district South - Tabora district West - Tabora district 1:2 Land Area: 6961 Sq. Km. or 9.1 percent of the total area of
Tabora Region 1:3 Administrative Set Up: Divisions - 4 Wards - 37 Village - 131 1:4 Population (a) Population 1988 Census; Total population - 295,613 Sex Ratio - 95.6 Dependency Ration - 98.3 Growth Rate - 2.8 Population Density - 42.5 % Urban population - 6.9 Average Households: Urban 4.5 Rural 5.8
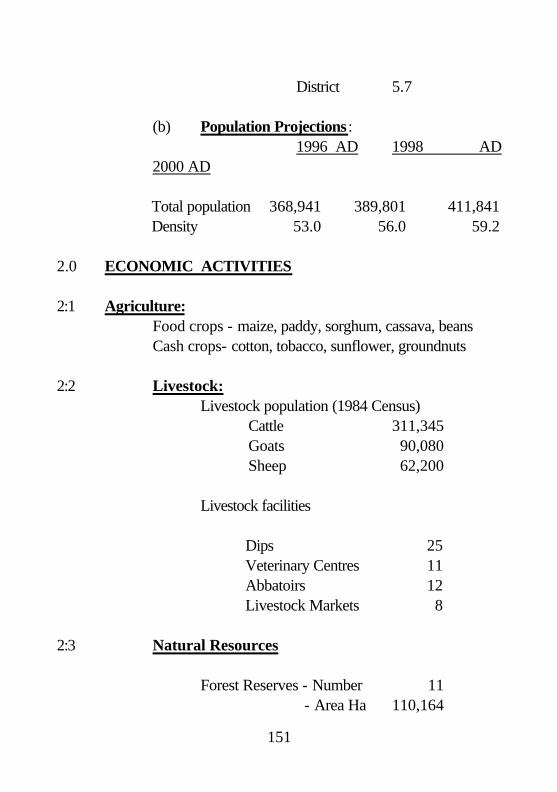
151
District 5.7 (b) Population Projections : 1996 AD 1998 AD
2000 AD Total population 368,941 389,801 411,841 Density 53.0 56.0 59.2 2.0 ECONOMIC ACTIVITIES 2:1 Agriculture: Food crops - maize, paddy, sorghum, cassava, beans Cash crops- cotton, tobacco, sunflower, groundnuts 2:2 Livestock: Livestock population (1984 Census) Cattle 311,345 Goats 90,080 Sheep 62,200 Livestock facilities Dips 25 Veterinary Centres 11 Abbatoirs 12 Livestock Markets 8 2:3 Natural Resources Forest Reserves - Number 11 - Area Ha 110,164

152
Game Reserves-Number Nil -Area Nil Game Controlled Areas- Number Nil - Area Nil Beekeeping - Total Hives 27,591 3.0 ECONOMIC INFRASTRUCTURE 3:1 Roads Trunk Roads Km 161 Regional roads Km 240 District roads Km 742 Road Density Km0.164 Km/Sq. Km. 3:2 Railway Transport: TRC-Bukene-Isaka (to Shinyanga) 3:3 Air Services: Nzega Airstrip 3:4 Telecommunications : Full Post Office 1 No. Sub Post Office 1 No. Telephone line 700 Fax lines. - 3:5 Energy: Access to Electricity (1988) Households 2.6 %

153
4.0 BASIC SOCIAL FACILITIES 4:1 Health (1996) Number of Hospitals - Number of Rural Health Centres - Number of Dispensaries - 4:2 Education (1996) Number of primary schools - 146 Total Enrollment - 7,550 Enrollment Rate - 67.4 Number of Secondary schools Public - 1 Private - 2 4:3 Water Supply: (1996) Rural Water Supply: Operating Not working Total Piped schemes 2 7 9 Boreholes 15 8 23 Shallow wells 19 26 45 Percentage of rural population with potable and safe water Urban Water Supply:- Piped Scheme 1 - 1 Boreholes 1 - 1 Shallowells - - - Percentage of urban population with potable and safe water 27%

154

155
ANNEX ″″ D″″
TABORA (AND SIKONGE) DISTRICT SUMMARY (1996) 1.0 GENERAL 1:1 Location:Central - Southern part of the region Borders :North - Kahama, Igunga and Nzega Districts East - Singida Region South - Mbeya and Rukwa regions West - Urambo District 1:2 Land Area : 41,103 Sq. Km. or 54 % of the total area of the region. 1:3 Administrative Units: Tabora : Divisions 4 Wards 36 Villages 106 Sikonge : Divisions 2 Wards 8 Villages 31 1:4 Population: (a) Population 1988 Census Tabora Rural Tabora Urban Total population 256,641 93,506 Sex Ratio 97.5 99.8 Dependency Ratio 113.4 84.0 Growth Rate 3.4 3.3 Population Density 6.2 -

156
% Urban Population 3.4 100.0

157
Average Household: Urban 4.8 5.4 Rural 5.8 5.6 District 5.9 5.3 (b) Population Projections 1996 AD 1998 AD 2000 AD Total 341,788 365,472 390,979 Density 8.3 8.9 9.5 2.0 ECONOMIC ACTIVITIES 2:1 Agriculture -Food Crops: maize, paddy, cassava, beans -Cash Crops: tobacco, sunflower, groundnuts 2:2 Livestock -Livestock population (1984 Census) Cattle - 184,034 Goats - 53,000 Sheep - 26,010 -Livestock facilities Dips - 20 Veterinary Centres - 5 Abbatoirs - 13 Livestock Markets 0 11 2:3 Natural Resources: Forest Reserves- Number 15 Areas 2,302,665 ha Game Reserves- Number N + 1

158
Areas N + 1 Game Controlled Area-Number 1 No Areas 2,111,500 ha. Beekeeping -Total beehives- 550,752 3.0 ECONOMIC INFRASTRUCTURE 3:1 Roads : Trunk Roads Km 411 Regional Roads Km 602 District Roads Km 905 Road Density 0.049 Km/Km2 3:2 Railway Transport: TRC: Tabora - Karangasi (to Dar es Salaam) Tabora - Mabama (to Kigoma) Tabora - Ipala (to Mwanza) 3:3 Air Services : Tabora Airport 3:4 Telecommunications - Full Post Office 1 No - Sub Post Office 1 No - Telephone lines 2,800 - Fax lines 36 3.5 Energy: - Access to electricity (1988) Rural Households 0.5 % Urban Households 31.6 %

159

160
4.0 BASIC SOCIAL FACILITIES 4.1 Health (1996) Number of hospitals = 1 Number of Rural Health Centres = 2 Number of Dispensaries = 46 4.2 Education (1996) Number of primary schools = 114 Total Enrollment = 4,857 Enrollment Rate = 46.2 Number of Secondary Schools- Public 3 Private 2 4.3 Water Supply Rural Water Supply: Operating Not working Total -Piped schemes 7 9 16 -Boreholes 8 73 81 -Shallow Wells 123 - 128 Percentage of population with potable and safe water

161
ANNEX ″″ E″″
URAMBO DISTRICT SUMMARY 1996 1.0 GENERAL 1:1 Location: Western part of the region Borders:North - Kahama district (Shinyanga Region) East - Tabora district South - Mpanda District (Ruvuma Region) West - Kigoma District (Kigoma Region) 1:2 Land Area: 21,299 Sq. Km or 28.8 percent of the total area of the region. 1:3 Administrative Set Up: Division - 4 Wards - 26 Villages - 91 1:4 Population (a) Population 1988 Census Total population - 187,436 Sex Ratio - 96.3 Dependency Ratio - 112.3 Growth Rate - 2.3 Population Density - 8.8 % Urban population - 11.4

162
Average Households:- Urban - 4.8 Rural - 5.4 District - 5.3 (b) Population Projection: 1996 AD 1998 AD 2000 AD Total population224,514 235,083 246,149 Population Density 10.5 11.0 11.6 2.0 ECONOMIC ACTIVITIES 2:1 Agriculture : Food crops: - maize, paddy, cassava, beans Cash crops: - tobacco, cotton, groundnuts 2.:2 Livestock: Livestock population (1984 Census) Cattle - 75,210 Goats - 25,327 Sheep - 4,009 Livestock Facilities Dips - 15 Veterinary Centres - 6 Abbatoirs - 3 Livestock Markets - 4 2:3 Natural Resources: Forest Reserves - Number 4 Nos - Area Ha 994,400 Game Reserves - Number 1

163
Area

164
Game Controlled Areas - Number 3 No Area 1,250,000 Ha Beekeeping: Total Hives 1,097,593 3.0 ECONOMIC INFRASTRUCTURE 3:1 Roads : Trunk roads Km Nil Regional roads Km 140 District roads Km 1,132 Road Density Km 0.056 Km/Km2 3:2 Railway Transport: TRC - Ussoke - Ussinge (to Kigoma) - Kaliua - Ugalla River (to Mpanda). 3:3 Air Services: Urambo Airstrip 3:4 Telecommunication: Full Post Office 1 No (Urambo) Sub Post Office 1 No (Ulyankulu) Telephone lines 100 Fax Lines Nil 3:5 Energy: Access to Electricity (1988) Households 1.0 percent

165

166
4.0 BASIC SOCIAL FACILITIES 4.1 Health (1996) Number of Hospitals - 1 No Number of Rural Health Centres - 3 Nos Number of Dispensaries - 29 4:2 Education: (1996) Number of primary schools - 94 Enrollment - 6,023 Enrollment Rate - 81.9 Number of Secondary Schools: - 3 - Public 2 - Private 1 4:3 Water Supply -Rural Water Supply: Operating Not working Total Piped schemes 4 5 9 Boreholes 26 17 43 Shallow wells 35 21 56 Percentage of population with clean and safe water: 16.5 - Urban Water Supply: Piped scheme Nil Boreholes 6 No Shallow wells Nil Percentage of population with clean and safe water: 38.8

167
ANNEX ″″ F″″
1.0 GENERAL INFORMATION ABOUT TANZANIA Location: (290E-410; 10S - 120S) Land Frontiers: To the North: Kenya and Uganda To West: Burundi, Rwanda and Zaire To South: Zambia, Malawi and Mozambique To East: Indian Ocean
AREA OF MAINLAND Land area 881,289 Sq.Km. Water area (Inland) 61,495 Sq.Km. Tanzania area 942,784 Sq.Km.
TANZANIA MAINLAND AREA BY REGIONS (SQ KM) Total 942,784 Arusha 84,567 Morogoro 70,799 Coast 32,407 Mwanza 35,248 Dodoma 41,311 Lindi 66,046 Iringa 58,936 D'Salaam 1,393 Kigoma 45,066 Rukwa 75,240 Kagera 39,627 Ruvuma 66,477 Kilimanjaro 13,309 Shinyanga 50,781 Mara 30,150 Singida 49,341 Mbeya 62,420 Tabora 76,151 Mtwara 16,707 Tanga 26,808

168
Population
TOTAL POPULATION AND LIFE EXPECTANCY FOR TANZANIA - BY REGIONS, 1967, 1978, 1988, 1996:
REGION
TOTAL POPULATION LIFE EXP. 1988
1967 (No.) 1978 (No.) 1988 ('000)
1996** ('000)
M Yrs
W Yrs
Dodoma Arusha Kilimanjaro Tanga Morogoro Coast Dar es Salaam Lindi Mtwara Ruvuma Iringa Mbeya Singida Tabora Rukwa Kigoma Shinyanga Kagera Mwanza Mara
709,380 610,474 652,722 771,060 682,700 428,041 356,286 419,853 621,293 395,447 689,905 753,765 457,938 502,068 276,091 473,443 899,468 658,712
1,055,883 544,125
972,005 926,223 902,437
1,037,767 939,264 516,586 843,090 527,624 771,818 561,575 925,044
1,079,864 613,949 817,907 451,897 648,941
1,323,535 1,009,767 1,443,379
723,827
1,234.9 1,348.4 1,106.0 1,307.3 1,254.0
636.5 1,357.6
645.0 887.4 781.4
1,206.0 1,472.7
789.9 1,033.8
693.3 857.8
1,768.6 1,358.8 1,874.4
968.6
1,472.5 1,784.0 1,703.5 1,521.8 1,519.4
740.9 1,945.7
744.8 976.7
1,001.3 1,472.9 1,857.0
949.4 1,232.6
954.7 1,047.6
2,194.83 1,659.5 2,270.9 1,202.0
57 46 50 45 44 44 47 57 46 46 45 45 44 46 44 48 48 54 53 48
58 51 50 47 47 45 49 62 48 48 48 48 48 50 47 50 51 55 54 51
Tanzania Mainland 11,958,654 17,036,499 22,582.4 28,252.2 49 51
Zanzibar North Zanzibar South Zanzibar Urban Pemba Pemba
56,360 39,087 95,047 72,015 92,306
77,017 51,749
142,041 106,290 99,014
97.1 70.2
208.4 137.4 127.7
119.0 91.8
290.4 172.6 160.4
46 45 46 46 45
47 50 52 48 50
Zanzibal Is. 354,815 476,111 640.7 834.2 46 49
Tanzania United Rep. 12,313,469 17,512,610 23,223.1 29,086.4 47 50
Note: The projections are based on the national Population Census of 1988, and the calculated growth rates since the 1978 census.
Source: Bureau of Statistics.

169
Land Use (Ha (millions) Proportion Small holder cultivation 4.1 5% Large scale agriculture 1.1 1% Grazing Land 35.0 39% Forest and Wood Lands 44.0 50% Other Lands 4.4 5% Total 88.6 100%
Arable Land: Arable Land (Ha) 3,634,000
Lakes Victoria 34,850 sq km Tanganyika 13,350 sq km Nyasa 5,600 sq km Rukwa 2,850 sq km Eyasi 1,050 sq km Natron 900 sq km Manyara 320 sq km
Mountain summits (metres above sea level) Kilimanjaro 5,895 Meru 4,566

170
Climate
(a) Rainfall Main rain season on the coast is between March and May and
the second season is between October and December. Rainfall is well distributed throughout the year but there is a peak during March and May.
Average maximum temperature (degrees centigrade) Jan. Apr. July October Dar es Salaam 31.6 30.1 28.6 31.3 Arusha 28.9 25.3 21.1 27.3 Dodoma 31.4 28.4 26.0 30.2 Average manimum tempereture (degrees centigrade) Jan. Apr. July October Dar es Salaam 23.3 22.9 18.3 31.3 Arusha 12.2 16.9 12.6 27.3 Dodoma 19.2 13.5 16.2 30.2 Gross Domestic Product at factor cost (billion Shs.) 1992. At current price 688.0 At constant prices 32.2 GDP growth rate at 1976 prices 1985-92 3.69% Per capita 27,355 At current price 27,355 At constant price 1,280

171
1.2 SOCIAL SERVICES
HEALTH FACILITIES YEAR HOSPITALS RHC DISPENSARIES 1960 98 22 975 1980 149239 2,600 1990 173276 3,014
Education: Enrolment rates 1995 compared with other East Africa countries
COUNTRY GROSS ENROLLMENT
PRIMARY SECONDARY
KENYA UGANDA TANZANIA
94
76
67
28
20
13

172
NATIONAL PARKS National Parks (area in sq km)
PARK LOCATION AND PARTICULARS
(i) SERENGETI NATIONAL PARK
LOCATION: At the border of Arusha & Mara Region, about 32 km from Arusha town AREA SIZE: 14,763 square km. It is the largest and oldest Park in Tanzania having been established under the British Colony in 195l. It contains the greatest and most spectacular concentration of plain animals left any where in Africa. MAJOR ATTRACTIONS: Wildebeest about 1.7 million, Lions 3,000. About 35 species of animals and 500 species of birds, Buffalos, Chetah, Leopards etc.
(ii) LAKE MANYARA NATIONAL PARK
LOCATION: Some 125 Kilometres South West of Arusha town. It was officially established and gazzetted as a National Park in 1960. AREA: Lake Manyara National Park covers a total area of 320 square kilometres, 230 kilometres constituting Lake Manyara itself. MAJOR ATTRACTIONS: The Rift Valley edge on the West with the vast lake underneath. Natural forest with many natural rivers and springs. Tree-climbing lions, various species of animals plus about 360 species of birds, Elephants, Hippos, Leopards, Baboons etc.
(iii) TARANGIRE NATIONAL PARK
LOCATION: South of Arusha town along the Dodoma Highway. It was established in l970. AREA: Tarangire National Park covers some 2,600 Square kilometres. MAJOR ATTRACTIONS: Tree climbing pythons, zebra, kongoni, elephant, buffalo, waterbuck, gazettes and oryx.

173
(iv)ARUSHA NATIONAL PARK (MOMELA)
LOCATION: The Park is located between Mount Meru and Mount Kilimanjaro. Formally Ngudoto National Park until 1967. Was commissioned as National Park in 1960. AREA: The park covers some 137 square Kilometres. MAJOR ATTRACTIONS: Ngurdoto Crater, Lake Momella, Mount Meru and the Natural Momela Forests. There are many species of Animals and birds. The most common being African elephant, colobus and velvet monkey, hippo, duicker and a number of bird species.
(v)KILIMANJARO NATIONAL PARK
LOCATION: The Kilimanjaro National Park which derived its name from Mount Kilimanjaro is part and parcel of the Mountain. It was established in 1973. AREA: The bounderies of the Park include the natural forest under and around the Mountain. It covers some 760 square Kilometres. MAJOR ATTRACTIONS: Mount Kilimanjaro with its three peaks Shira (3,962 metres) Mawenzi and Kibo (5,149 and 5,895 metres respectively) above sea level form the largest part of the Park's attraction. There are also various species of Animals, plants and birds.
(vi)MIKUMI NATIONAL PARK
LOCATION: It is situated some 216 km along the Dar - Zambia Highway. It was established in 1964. AREA: Mikumi National Park which borders with Africa's largest Game reserve, the Selous is the third biggest National Park after Serengeti and Ruaha National Park and covers 3230 sq km. MAJOR ATTRACTIONS: The plains sorrounding River Mkata which are rich in flora and fauna are by themselves a wonderful scenarial. The common animals found in the park include zebra, buffalos, elephants, Hippos, lions and the Impalas.

174
(vii)UDZUNGWA NATIONAL PARK
LOCATION: This Park is located South of Mikumi National Park along the Mikumi-Ifakara Highway. The Park was established in 1992. AREA: The Park which derives its identity from the famous Udzungwa mountain has an area of 1990 square kilometres. MAJOR ATTRACTIONS: Its unique species of Fauna and Flora which called for its declaration as a National Park. The Udzungwa Mountains and Forests are a good source of Rivers and springs, one of them being the famous Kilombero River, which constitutes the essential part of the multi-hactoral its total Kilombero Sugar Plantations. Additional attractions: Lions, Buffalos, Giraffes etc.
(viii)RUAHA NATIONAL PARK
LOCATION: The name Ruaha, is derived from the Hehe word "Luvaha" meaning a river. AREA: Park covers an area of 12,950 square kilometres, the second largest in the country. Ruaha National Park which was established in 1964 is situated some 130 km west of Iringa town. MAJOR ATTRACTIONS: The Ruaha River by itself is an attraction, leave alone some hundreds of species of Flora which sorround it. Besides there are a lot of Crocodiles, Hippos, Elephants etc.
(ix) KATAVI NATIONAL PARK*
LOCATION: It is located in Mpanda District, Rukwa Region. It was established in 1974. AREA: The Katavi National Park which is about 40 kilometres South -East of Mpanda town covers an area of 2,253 square kilometres. MAJOR ATTRACTION: Lakes Chala and Chada plus other springs and rivers whose waters feed into lake Rukwa constitute a unique environment. Animals in the park include zebra, sable, eland, leopard, buffalo, lion, antelops etc. Animals like, Buffalos, Elephants, Zebras and BushBucks are a good attraction to visitors.

175
(x)MAHALE NATIONAL PARK
LOCATION: Located some 120 south of Kigoma town along the shores of lake Tanganyika, Mahale National Park is yet another attraction in Tanzania's Natural Heritages. AREA: Mahale nation Park has about 1,613 square kilometres and was gazzetted in 1948. MAJOR ATTRACTIONS :Chimpanzees are a major attraction. Also there is a good number of monkey species including red colobus monkeys. It is estimated that there are 700 Chimpanzees in Mahale and 15 species of monkeys whose habits tally with those of the Chimps.
(xi) GOMBE NATIONAL PARK
LOCATION: Gombe National Park is situated 16 km north of Kigoma town in western Tanzania. It is a narrow strip of mountainous country bounded in the east by the eastern rift valley escarpment and by lake Tanganyika in the west AREA: Covering some 52 square kilometres. National park, was commssioned in 1968. MAJOR ATTRACTIONS : Ever green forests and primates. These include Chimpanzees, Baboons, blue monkey red tails and red colobus.
(xii) RUBONDO NATIONAL PARK
LOCATION: The Park which form park of a number of archipelagos in Lake Victoria covers some 240 square Kilometres. it was established in 1977 MAJOR ATTRACTIONS : The Chimpanzees. But other attractions include, Hippos, Giraffes, and Elephants. the absence of man-eaters such as Lions & Leopards ensures a safe walk in Rubondo Park even some fishing activities with boats under Park wardens are carried out.
(xiii) NGORONGORO
LOCATION: It is situated west of Arusha town some 230 kms. AREA: The park covers 8320 sq km MAJOR ATTRACTION: Wildebeest, Lions, Buffalos, Leopards, Variety of birds species, Giraffes, elephans etc

176