TABLE OF CONTENTS - Vermilion Energy
81
Transcript of TABLE OF CONTENTS - Vermilion Energy


Vermilion Energy Inc. AIF for the year ended December 31, 2016
TABLE OF CONTENTS
GLOSSARY OF TERMS .............................................................................................................................................................................................. 4Conventions.......................................................................................................................................................................................................... 6Abbreviations ........................................................................................................................................................................................................ 6Conversion............................................................................................................................................................................................................ 6
SPECIAL NOTE REGARDING FORWARD LOOKING STATEMENTS....................................................................................................................... 7PRESENTATION OF OIL AND GAS RESERVES AND PRODUCTION INFORMATION ........................................................................................... 8
Contingent Resources .......................................................................................................................................................................................... 8Prospective Resources......................................................................................................................................................................................... 9
NON-GAAP MEASURES ............................................................................................................................................................................................. 9VERMILION ENERGY INC......................................................................................................................................................................................... 10
General ............................................................................................................................................................................................................... 10Organizational Structure of the Company........................................................................................................................................................... 10
DESCRIPTION OF THE BUSINESS.......................................................................................................................................................................... 11Operating Segments and Description of Properties ........................................................................................................................................... 11
GENERAL DEVELOPMENT OF THE BUSINESS ..................................................................................................................................................... 15Three Year History and Outlook ........................................................................................................................................................................... 15
STATEMENT OF RESERVES DATA AND OTHER OIL AND GAS INFORMATION ................................................................................................ 18Reserves and Future Net Revenue .................................................................................................................................................................... 18Reconciliations of Changes in Reserves ............................................................................................................................................................ 26Undeveloped Reserves ...................................................................................................................................................................................... 34Timing of Initial Undeveloped Reserves Assignment ......................................................................................................................................... 34Future Development Costs ................................................................................................................................................................................. 35Oil and Gas Properties and Wells....................................................................................................................................................................... 36Costs Incurred .................................................................................................................................................................................................... 37Acreage .............................................................................................................................................................................................................. 37Exploration and Development Activities ............................................................................................................................................................. 38Properties with No Attributed Reserves.............................................................................................................................................................. 39Tax Information................................................................................................................................................................................................... 40Production Estimates.......................................................................................................................................................................................... 41Production History .............................................................................................................................................................................................. 42Marketing ............................................................................................................................................................................................................ 46
DIRECTORS AND OFFICERS................................................................................................................................................................................... 47Directors ............................................................................................................................................................................................................. 47Officers ............................................................................................................................................................................................................... 49
DESCRIPTION OF CAPITAL STRUCUTURE. .......................................................................................................................................................... 50Common Shares................................................................................................................................................................................................. 50Cash Dividends................................................................................................................................................................................................... 50Premium Dividend and Dividend Reinvestment Plan ......................................................................................................................................... 51Shareholder Rights Plan..................................................................................................................................................................................... 51
MARKET FOR SECURITIES...................................................................................................................................................................................... 52AUDIT COMMITTEE MATTERS ................................................................................................................................................................................ 53
Audit Committee Charter .................................................................................................................................................................................... 53Composition of the Audit Committee .................................................................................................................................................................. 53External Audit Service Fees ............................................................................................................................................................................... 53
CONFLICTS OF INTEREST....................................................................................................................................................................................... 54INTEREST OF MANAGEMENT AND OTHERS IN MATERIAL TRANSACTIONS.................................................................................................... 54LEGAL PROCEEDINGS............................................................................................................................................................................................. 54MATERIAL CONTRACTS .......................................................................................................................................................................................... 54INTERESTS OF EXPERTS........................................................................................................................................................................................ 54TRANSFER AGENT AND REGISTRAR .................................................................................................................................................................... 54
Vermilion Energy Inc. AIF for the year ended December 31, 2016
RISK FACTORS ......................................................................................................................................................................................................... 55Reserve Estimates.............................................................................................................................................................................................. 55Uncertainty of Contingent Resource Estimates .................................................................................................................................................. 55Uncertainty of Prospective Resource Estimates................................................................................................................................................. 55Volatility of Oil and Natural Gas Prices............................................................................................................................................................... 55Changes in Legislation ....................................................................................................................................................................................... 56Government Regulations .................................................................................................................................................................................... 56Competition......................................................................................................................................................................................................... 56Operational Matters ............................................................................................................................................................................................ 56Environmental Concerns .................................................................................................................................................................................... 57Kyoto Protocol .................................................................................................................................................................................................... 58Discretionary Nature of Dividends ...................................................................................................................................................................... 58Debt Service ....................................................................................................................................................................................................... 58Changes in Income Tax Laws ............................................................................................................................................................................ 58Depletion of Reserves ........................................................................................................................................................................................ 58Net Asset Value .................................................................................................................................................................................................. 58Volatility of Market Price of Common Shares ..................................................................................................................................................... 58Variations in Interest Rates and Foreign Exchange Rates ................................................................................................................................. 59Increase in Operating Costs or Decline in Production Level .............................................................................................................................. 59Acquisition Assumptions..................................................................................................................................................................................... 59Failure to Realize Anticipated Benefits of Prior Acquisitions .............................................................................................................................. 59Additional Financing ........................................................................................................................................................................................... 59Potential Conflicts of Interest .............................................................................................................................................................................. 60Accounting Adjustments ..................................................................................................................................................................................... 60Market Accessibility ............................................................................................................................................................................................ 60Cyber Security .................................................................................................................................................................................................... 60
ADDITIONAL INFORMATION .................................................................................................................................................................................... 61
APPENDIX ACONTINGENT RESOURCES…………………………………………………………………………………............................................................. 62PROSPECTIVE RESOURCES…………………………………………………………………………………........................................................... 67
APPENDIX BREPORT ON RESERVES DATA BY INDEPENDENT QUALIFIED RESERVES EVALUATOR OR AUDITOR (FORM 51-101F2) ................. 73REPORT ON CONTINGENT RESOURCES DATA AND PROSPECTIVE RESOURCES DATA BY INDEPENDENT QUALIFIED RESERVES
EVALUATOR OR AUDITOR (FORM 51-101F2) ............................................................................................................................................. 74
APPENDIX CREPORT OF MANAGEMENT AND DIRECTORS ON RESERVES DATA AND OTHER INFORMATION (FORM 51-101F3) ......................... 76
APPENDIX DTERMS OF REFERENCE FOR THE AUDIT COMMITTEE............................................................................................................................... 77

Vermilion Energy Inc. AIF for the year ended December 31, 2016
4
GLOSSARY OF TERMS
In addition to terms defined elsewhere in this annual information form, the following are defined terms used in this annual information form:
“2003 Arrangement” means the plan of arrangement under the ABCA involving the Trust, Vermilion Resources Ltd., Clear Energy Inc. and VermilionAcquisition Ltd., which was completed on January 22, 2003;
“ABCA” means the Business Corporations Act (Alberta), R.S.A. 2000, c. B-9, as amended, including the regulations promulgated thereunder;
“AGCA” means Alberta Gas Cost Allowance;
“AIF” means this Annual Information Form and the appendices attached hereto;
“Affiliate” when used to indicate a relationship with a person or company, has the same meaning as set forth in the Securities Act (Alberta);
“Board of Directors” or “board” means the board of directors of Vermilion;
“CGUs” means cash generating units and based on management’s judgement, represents the lowest level at which there is identifiable cash inflowsthat are largely independent of the cash inflows of other groups of assets or properties;
“Common Shares” means a common share in the capital of the Company;
“Contingent Resources” are those quantities of petroleum estimated, as of a given date, to be potentially recoverable from known accumulationsusing established technology or technology under development, but which are not currently considered to be commercially recoverable due to one ormore contingencies;
“Control” means, with respect to control of a body corporate by a person, the holding (other than by way of security) by or for the benefit of that personof securities of that body corporate to which are attached more than 50% of the votes that may be cast to elect directors of the body corporate (whetheror not securities of any other class or classes shall or might be entitled to vote upon the happening of any event or contingency) provided that suchvotes, if exercised, are sufficient to elect a majority of the board of directors of the body corporate;
“Conversion Arrangement” means the plan of arrangement effected on September 1, 2010 under section 193 of the ABCA pursuant to which theTrust converted from an income trust to a corporate structure, and Unitholders exchanged their Trust Units for common shares of the Company on aone-for-one basis and holders of exchangeable shares of VRL received 1.89344 common shares for each exchangeable share held;
“Depletion units” means groups of assets or properties that are within a specific production area and have similar economic lives. Depletion unitsrepresent the lowest level of disaggregation for which Vermilion accumulates costs for the purposes of calculating and recording depletion;
“Dividend” means a dividend paid by Vermilion in respect of the common shares, expressed as an amount per common share;
“Dividend Payment Date” means any date that Dividends are paid to Shareholders, generally being the 15th day of the calendar month following thedetermination of a Dividend Record Date;
“Dividend Record Date” means the last day of each calendar month or such other date as may be determined from time to time by the Company;
“GLJ” means GLJ Petroleum Consultants Ltd., independent petroleum engineering consultants of Calgary, Alberta;
“GLJ Report” means the independent engineering reserves evaluation of certain oil, NGL and natural gas interests of the Company prepared by GLJdated February 1, 2017 and effective December 31, 2016;
“GLJ Resource Assessment” means the independent engineering resource evaluation prepared by GLJ to assess contingent and prospectiveresources across all of the Company’s key operating regions with an effective date of December 31, 2016;
“IFRS” means International Financial Reporting Standards, as issued by the International Accounting Standards Board;
“Income Tax Act” or “Tax Act” means the Income Tax Act (Canada), R.S.C. 1985, c. 1. (5th Supp.), as amended, including the regulationspromulgated thereunder;

Vermilion Energy Inc. AIF for the year ended December 31, 2016
5
“Meeting” means the annual meeting of Shareholders of the Company to be held on April 28, 2017 (or, if adjourned, such other date on which themeeting is held);
“NYSE” means New York Stock Exchange;
“PNG” means Petroleum and Natural Gas properties and equipment;
“PRRT” means Petroleum Resource Rent Tax, a profit based tax levied on petroleum projects in Australia;
“Plan” means the Premium DividendTM and Dividend Reinvestment Plan of the Company dated effective February 27, 2015, as amended orsupplemented from time to time;
“Prospective Resources” are those quantities of petroleum estimated, as of a given date, to be potentially recoverable from undiscoveredaccumulations by application of future development projects;
“Rights Plan” means the Shareholder Rights Plan of the Company;
“Senior Unsecured Notes” means the $225 million aggregate principal amount of five year senior unsecured notes of the Company issued February10, 2011 and repaid on February 10, 2016;
“Shareholders” means holders from time to time of the Company’s common shares;
“Shareholder Rights Plan Agreement” means the Shareholder Rights Plan Agreement dated September 1, 2010 between the Company andComputershare Trust Company of Canada establishing the Rights Plan, as amended and restated as of May 1, 2013 and as amended or supplementedfrom time to time;
“Subsidiary” means, in relation to any person, any body corporate, partnership, joint venture, association or other entity of which more than 50% ofthe total voting power of common shares or units of ownership or beneficial interest entitled to vote in the election of directors (or members of acomparable governing body) is owned or controlled, directly or indirectly, by such person;
“TSX” means the Toronto Stock Exchange;
“Trust” means Vermilion Energy Trust, an unincorporated open-ended investment trust governed by the laws of the Province of Alberta that wasdissolved and ceased to exist pursuant to the Conversion Arrangement;
“Trust Unit” means units in the capital of the Trust;
“Unitholders” means former unitholders of the Trust;
“Vermilion” or the “Company” means Vermilion Energy Inc. and where context allows, its consolidated business enterprise, except that a referenceto “Vermilion” prior to the date of the Conversion Arrangement means the consolidated business enterprise of the Trust, unless otherwise indicated;and
“VRL” means Vermilion Resources Ltd., previously a subsidiary of the corporation.

Vermilion Energy Inc. AIF for the year ended December 31, 2016
6
Conventions
Unless otherwise indicated, references herein to "$" or "dollars" are to Canadian dollars. All financial information herein has been presented inCanadian dollars in accordance with IFRS. Abbreviations Oil and Natural Gas Liquidsbbl barrelMbbl thousand barrelsbbl/d barrels per dayNGLs natural gas liquidsNatural GasMcf thousand cubic feetMMcf million cubic feetMcf/d thousand cubic feet per dayMMcf/d million cubic feet per dayMMBtu million British Thermal UnitsOtherAPI American Petroleum Institute°API An indication of the specific gravity of crude oil measured on the API gravity scale.
Liquid petroleum with a specified gravity of 28 °API or higher is generally referred to as light crude oil.boe barrel of oil equivalentM$ thousand dollarsMM$ million dollarsMboe 1,000 barrels of oil equivalentMMboe million barrels of oil equivalentWTI West Texas Intermediate, the reference price paid in U.S. dollars at Cushing, Oklahoma for crude oil of
standard grade.TTF the day-ahead price for natural gas in the Netherlands, quoted in MWh of natural gas, at the Title Transfer Facility Virtual
Trading Point operated by Dutch TSO Gas Transport ServicesNBP the reference price paid for natural gas in the United Kingdom, quoted in pence per therm, at the National Balancing Point
Virtual Trading Point operated by National Grid
Conversion
The following table sets forth certain standard conversions from Standard Imperial Units to the International System of Units (or metric units). To Convert From To Multiply ByMcf Cubic metres 28.174Cubic metres Cubic feet 35.494bbls Cubic metres 0.159Cubic metres bbls oil 6.290Feet Metres 0.305Metres Feet 3.281Miles Kilometres 1.609Kilometres Miles 0.621Acres Hectares 0.405Hectares Acres 2.471
Vermilion Energy Inc. AIF for the year ended December 31, 2016
7
SPECIAL NOTE REGARDING FORWARD LOOKING STATEMENTS
Certain statements included or incorporated by reference in this annual information form may constitute forward looking statements or financial outlooks under applicable securities legislation. Such forward looking statements or information typically contain statements with words such as "anticipate", "believe", "expect", "plan", "intend", "estimate", "propose", or similar words suggesting future outcomes or statements regarding an outlook. Forward looking statements or information in this annual information form may include, but are not limited to:
capital expenditures;business strategies and objectives;estimated reserve quantities and the discounted present value of future net cash flows from such reserves;petroleum and natural gas sales;future production levels (including the timing thereof) and rates of average annual production growth, estimated contingent resources;exploration and development plans;acquisition and disposition plans and the timing thereof;operating and other expenses, including the payment of future dividends; royalty and income tax rates;the timing of regulatory proceedings and approvals; andthe estimate of Vermilion’s share of the expected natural gas production from the Corrib field.
Such forward-looking statements or information are based on a number of assumptions all or any of which may prove to be incorrect. In addition to any other assumptions identified in this document, assumptions have been made regarding, among other things:
the ability of the Company to obtain equipment, services and supplies in a timely manner to carry out its activities in Canada and internationally;the ability of the Company to market crude oil, natural gas liquids and natural gas successfully to current and new customers;the timing and costs of pipeline and storage facility construction and expansion and the ability to secure adequate product transportation;the timely receipt of required regulatory approvals;the ability of the Company to obtain financing on acceptable terms;foreign currency exchange rates and interest rates; future crude oil, natural gas liquids and natural gas prices; andManagement’s expectations relating to the timing and results of development activities.
Although the Company believes that the expectations reflected in such forward looking statements or information are reasonable, undue reliance should not be placed on forward looking statements because the Company can give no assurance that such expectations will prove to be correct. Financial outlooks are provided for the purpose of understanding the Company’s financial strength and business objectives and the information may not be appropriate for other purposes. Forward looking statements or information are based on current expectations, estimates and projections that involve a number of risks and uncertainties which could cause actual results to differ materially from those anticipated by the Company and described in the forward looking statements or information. These risks and uncertainties include but are not limited to:
the ability of management to execute its business plan;the risks of the oil and gas industry, both domestically and internationally, such as operational risks in exploring for, developing and producing crude oil, natural gas liquids and natural gas;risks and uncertainties involving geology of crude oil, natural gas liquids and natural gas deposits;risks inherent in the Company's marketing operations, including credit risk;the uncertainty of reserves estimates and reserves life and estimates of contingent resources and estimates of prospective resources and associated expenditures;the uncertainty of estimates and projections relating to production, costs and expenses;potential delays or changes in plans with respect to exploration or development projects or capital expenditures;the Company's ability to enter into or renew leases on acceptable terms; fluctuations in crude oil, natural gas liquids and natural gas prices, foreign currency exchange rates and interest rates;health, safety and environmental risks;uncertainties as to the availability and cost of financing;the ability of the Company to add production and reserves through exploration and development activities;general economic and business conditions; the possibility that government policies or laws may change or governmental approvals may be delayed or withheld; uncertainty in amounts and timing of royalty payments;risks associated with existing and potential future law suits and regulatory actions against the Company; andother risks and uncertainties described elsewhere in this annual information form or in the Company's other filings with Canadian securities authorities.

Vermilion Energy Inc. AIF for the year ended December 31, 2016
8
The forward-looking statements or information contained in this annual information form are made as of the date hereof and the Company undertakes no obligation to update publicly or revise any forward-looking statements or information, whether as a result of new information, future events or otherwise, unless required by applicable securities laws.
PRESENTATION OF OIL AND GAS RESERVES AND PRODUCTION INFORMATION
All oil and natural gas reserve information contained in this annual information form is derived from the GLJ Report and has been prepared and presented in accordance with the Canadian Oil and Gas Evaluation Handbook (“COGEH”) and National Instrument 51-101 Standards of Disclosure for Oil and Gas Activities ("NI 51-101"). The actual oil and natural gas reserves and future production will be greater than or less than the estimates provided in this annual information form. The estimated future net revenue from the production of the disclosed oil and natural gas reserves does not represent the fair market value of these reserves.
Natural gas volumes have been converted on the basis of six thousand cubic feet of natural gas to one barrel of oil equivalent. Barrels of oil equivalent (“boe”) may be misleading, particularly if used in isolation. A boe conversion ratio of six thousand cubic feet of natural gas to one barrel of oil is based on an energy equivalency conversion method primarily applicable at the burner tip and does not represent a value equivalency at the wellhead.
Contingent Resources
"Contingent resources" are not, and should not be confused with, petroleum and natural gas reserves. "Contingent resources" are defined in COGEH as those quantities of petroleum estimated, as of a given date, to be potentially recoverable from known accumulations using established technology or technology under development, but which are not currently considered to be commercially recoverable due to one or more contingencies. Contingencies may include factors such as economic, legal, environmental, political and regulatory matters or a lack of markets. It is also appropriate to classify as contingent resource the estimated discovered recoverable quantities associated with a project in the early evaluation stage.
The primary contingencies which currently prevent the classification of Vermilion’s contingent resource as reserves include but are not limited to:
preparation of firm development plans, including determination of the specific scope and timing of projects; project sanction; access to capital markets; shareholder and regulatory approvals as applicable;access to required services and field development infrastructure; oil and natural gas prices in Canada and internationally in jurisdictions in which Vermilion operates; demonstration of economic viability; future drilling program and testing results; further reservoir delineation and studies; facility design work; corporate commitment; development timing; limitations to development based on adverse topography or other surface restrictions; and the uncertainty regarding marketing and transportation of petroleum from development areas.
There is no certainty that it will be commercially viable to produce any portion of the contingent resources or that Vermilion will produce any portion of the volumes currently classified as contingent resources. The estimates of contingent resources involve implied assessment, based on certain estimates and assumptions, that the contingent resources described exists in the quantities predicted or estimated and that the contingent resources can be profitably produced in the future. The net present value of the future net revenue from the contingent resources does not necessarily represent the fair market value of the contingent resources. Actual contingent resources (and any volumes that may be reclassified as reserves) and future production therefrom may be greater than or less than the estimates provided herein.

Vermilion Energy Inc. AIF for the year ended December 31, 2016
9
Prospective Resources
“Prospective resources" are not, and should not be confused with, petroleum and natural gas reserves. "Prospective resources" are defined in COGEHas those quantities of petroleum estimated, as of a given date, to be potentially recoverable from undiscovered accumulations by application of future development projects.
There is no certainty that any portion of the prospective resources will be discovered. If discovered, there is no certainty that it will be commercially viable to produce any portion of the prospective resources or that Vermilion will produce any portion of the volumes currently classified as prospective resources. The estimates of prospective resources involve implied assessment, based on certain estimates and assumptions, that the resources described exists in the quantities predicted or estimated and that the resources can be profitably produced in the future. The net present value of the future net revenue from the prospective resources does not necessarily represent the fair market value of the prospective resources.The recovery and resources estimates provided herein are estimates only. Actual prospective resources (and any volumes that may be reclassified as reserves or contingent resources) and future production from such prospective resources may be greater than or less than the estimates provided herein.
NON-GAAP MEASURES
This annual information form includes non-GAAP measures as further described herein. Management of the Company believes these non-GAAPmeasures are a useful tool in analyzing operating performance. These measures do not have standardized meanings prescribed by GAAP and arenot disclosed in Vermilion’s audited consolidated financial statements and, therefore, may not be comparable with the calculations of similar measuresfor other entities.
“Cash dividends per share” represents actual cash dividends paid per share by the Company during the relevant periods.
Vermilion Energy Inc. AIF for the year ended December 31, 2016
10
VERMILION ENERGY INC.
General
Vermilion Energy Inc. is the successor to the Trust, following the completion of the Conversion Arrangement whereby the Trust converted from anincome trust to a corporate structure by way of a court approved plan of arrangement under the ABCA on September 1, 2010.
As at December 31, 2016, Vermilion had 503 full time employees of which 178 employees were located in its Calgary head office, 54 employees in itsCanadian field offices, 152 employees in France, 60 employees in the Netherlands, 33 employees in Australia, 9 employees in the United States, 13employees in Germany and 4 employees in Hungary.
Vermilion Energy Inc. was incorporated on July 21, 2010 pursuant to the provisions of the ABCA for the purpose of facilitating the ConversionArrangement. The registered and head office of Vermilion Energy Inc. is located at Suite 3500, 520 – 3rd Avenue S.W., Calgary, Alberta, T2P 0R3.
Organizational Structure of the Company
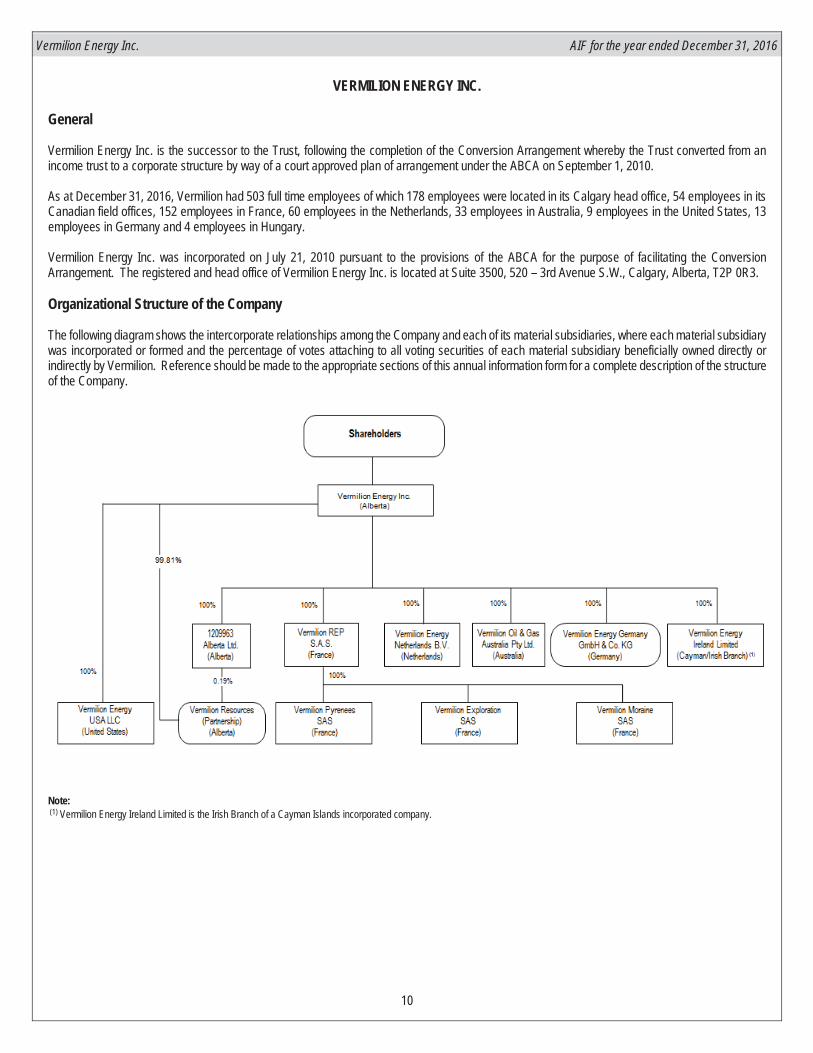
The following diagram shows the intercorporate relationships among the Company and each of its material subsidiaries, where each material subsidiary was incorporated or formed and the percentage of votes attaching to all voting securities of each material subsidiary beneficially owned directly or indirectly by Vermilion. Reference should be made to the appropriate sections of this annual information form for a complete description of the structure of the Company.
Note:(1) Vermilion Energy Ireland Limited is the Irish Branch of a Cayman Islands incorporated company.

Vermilion Energy Inc. AIF for the year ended December 31, 2016
11
DESCRIPTION OF THE BUSINESS
Vermilion is an international energy producer that seeks to create value through the acquisition, exploration, development and optimization of producingproperties in North America, Europe and Australia. Vermilion focuses on the exploitation of light oil and liquids-rich natural gas conventional resourceplays in Canada and the United States, the exploration and development of high impact natural gas opportunities in the Netherlands and Germany,and oil drilling and workover programs in France and Australia. Vermilion also holds an 18.5% non-operated working interest in the Corrib gas field inIreland.
Vermilion's priorities are health and safety, the environment, and profitability, in that order. Nothing is more important to us than the safety of the publicand those who work with us, and the protection of our natural surroundings. Vermilion has been recognized as a top decile performer amongstCanadian publicly listed companies in governance practices, as a Climate "A" List performer by the CDP, and a Best Workplace in the Great Place toWork® Institute's annual rankings in Canada, France, the Netherlands and Germany. Vermilion emphasizes strategic community investment in eachof our operating areas.
Operating Segments and Description of Properties(1)
Vermilion has operations in three core areas: North America, Europe and Australia. Vermilion's business within these regions is managed at the country level through business units which form the basis of the Company's operating segments. These operating segments, as well as a description of the material oil and natural gas properties, facilities and installations in which Vermilion has an interest, are discussed below. For a discussion of the competitive conditions affecting Vermilion’s business, refer to "Competition" in the Risk Factors section of this AIF.
Canada Business Unit
Vermilion’s Canadian production is primarily focused in three areas of Alberta: West Pembina, Slave Lake and Central Alberta and in the Northgate Region of southeast Saskatchewan. Vermilion's main natural gas producing areas are West Pembina and Central Alberta, while Northgate, Slave Lake and the Cardium light crude oil play in West Pembina are the main oil producing areas. West Pembina is the Company's main NGL producing area.
Vermilion holds an average 74% working interest in 445,900 (328,500 net) acres of developed land, and an average 89% working interest in 500,300 (443,000 net) acres of undeveloped land. Vermilion had 523 (358 net) producing natural gas wells and 611 (445 net) producing oil wells in Canada as at December 31, 2016.
Vermilion owns and operates three natural gas plants and has an ownership interest in seven additional plants, resulting in combined gross natural gas processing capacity of over 80 MMcf/d. In addition, Vermilion has oil processing capacity of over 25,000 bbl/d through eleven operated oil batteries including a 15,000 bbl/d oil battery in West Pembina.
For the year ended December 31, 2016, production in Canada averaged 84.3 MMcf/d of natural gas and 11,723 bbl/d of light crude oil, medium crude oil and NGLs. Sales of natural gas in 2016 were $65.9 million (2015 - $72.7 million) and sales from light crude oil, medium crude oil and NGLs were $187.0 million (2015 - $247.9 million).
During 2016, the majority of Vermilion's Canadian exploration and development expenditures were directed to our Mannville program with activity focused in the West Pembina and Ferrier areas of Alberta. During 2016 Vermilion drilled or participated in 20 (12.0 net) Mannville wells and production from the Mannville play increased by 55% as compared to 2015. Vermilion plans to drill 23 (15.0 net) Mannville wells in 2017. Vermilion expects to increase activity in its Cardium and southeast Saskatchewan plays year-over-year. The Company plans to drill or participate in nine (6.0 net) Cardium wells and 13 (11.3 net) southeast Saskatchewan wells in 2017 as compared to two (0.2 net) Cardium wells and seven (5.5 net) southeast Saskatchewan wells in 2016. Vermilion expects that the Mannville, Cardium and southeast Saskatchewan assets will continue to support the Company's production growth.
The GLJ Report assigned 77,092 Mboe of total proved reserves and 130,215 Mboe of proved plus probable reserves to Vermilion's properties located in Canada.
France Business Unit
Vermilion entered France in 1997 and has completed three subsequent acquisitions. The Company is the largest oil producer in the country andrepresents approximately three-quarters of domestic oil production. Vermilion predominately produces oil in France and the Company's oil is priced with reference to Dated Brent.

Vermilion Energy Inc. AIF for the year ended December 31, 2016
12
Vermilion's main producing areas in France are located in the Aquitaine Basin which is southwest of Bordeaux, France and in the Paris Basin, located just east of Paris. The two major fields in the Paris Basin area are Champotran and Chaunoy and the two major fields in the Aquitaine Basin are Parentis and Cazaux. Vermilion operates 20 oil batteries and 12 single well batteries in the country. Given the legacy nature of these assets, the throughput capability of these batteries exceeds any projected future requirements. Vermilion holds an average 96% working interest in 218,100 (208,900 net) acres of developed land and 100% working interest in 336,600 (336,600 net) acres of undeveloped land in the Aquitaine and Paris Basins. Vermilion had 336 (331 net) producing oil wells and three (3 net) producing gas wells in France as at December 31, 2016.
For the year ended December 31, 2016, production in France averaged 11,896 bbl/d of light crude oil and medium crude oil and 0.4 MMcf/d of natural gas. Sales from light crude oil and medium crude oil in 2016 were $246.6 million (2015 - $280.5 million) and sales of natural gas were $0.3 million (2015 - $0.9 million). Natural gas sales in France have decreased significantly since 2013 following the closure of a third party processing facility.
In 2016, Vermilion drilled four (4.0 net) wells in the Champotran field and commenced drilling a horizontal sidetrack well in the Vulaines field, with the related completion and tie-in activity planned for 2017. In 2017, Vermilion intends to drill its first four (4.0 net) wells in the Neocomian fields in the Paris Basin. The Company also intends to continue its ongoing program of workovers and optimizations. By continuing to develop its inventory in France, while minimizing declines through workovers and optimizations, Vermilion seeks to deliver moderate production growth from its French assets.
The GLJ Report assigned 42,958 Mboe of total proved reserves and 65,040 Mboe of proved plus probable reserves to Vermilion's properties located in France.
Netherlands Business Unit
Vermilion entered the Netherlands in 2004 and is the country's second largest onshore natural gas producer. Vermilion's natural gas production in the Netherlands is priced off of the TTF index.
Vermilion's Netherlands assets consist of 24 onshore concessions and two offshore concessions. Production consists solely of natural gas with a small amount of related condensate. Vermilion’s total land position in the Netherlands covers 1,492,500 (841,500 net) acres at an average 56% working interest, of which 95% is undeveloped. Vermilion had 54 (37 net) producing natural gas wells as at December 31, 2016.
For the year ended December 31, 2016, Vermilion's production in the Netherlands averaged 47.8 MMcf/d of natural gas and 88 bbl/d of NGLs. Sales in 2016 of natural gas were $99.3 million (2015 - $127.3 million) and sales from NGLs were $1.4 million (2015 - $1.8 million).
Vermilion drilled two (0.9 net) wells in the Netherlands during 2016 and the Company expects to drill two (1.0 net) exploration wells in 2017. In addition, Vermilion expects to complete a seismic program in the Akkrum concession and execute a major turnaround at the Garijp Treatment Centre. Vermilion expects that its inventory of potentially high-impact exploration and development opportunities in the Netherlands will continue to support the Company's production growth in the country.
The GLJ Report assigned 10,473 Mboe of total proved reserves and 17,733 Mboe of proved plus probable reserves to Vermilion's properties located in the Netherlands.
Germany Business Unit
Vermilion entered Germany in 2014 with the acquisition of a 25% non-operated interest in natural gas producing assets. In December 2016, Vermilion completed an acquisition of oil and gas producing properties that provided Vermilion with its first operated position in the country. Vermilion holds a significant undeveloped land position in Germany as a result of a farm-in agreement the Company entered into in 2015. Vermilion's natural gas production in Germany is priced with reference to TTF and oil production is priced with reference to Dated Brent.
Including the interests that were acquired in December 2016, Vermilion’s producing assets in Germany consist of operated and non-operated interests in seven natural gas fields and five oil fields. Prior to the December 2016 acquisition, Vermilion's producing assets in Germany consisted of a 25% non-operated interest in four natural gas fields. Including the wells from this acquisition, Vermilion had 141 (111 net) producing oil wells and 20 (7 net) producing natural gas wells as at December 31, 2016.
Vermilion holds a significant land position in northwest Germany comprised of 67,600 (25,800 net) developed acres and 2,609,300 (1,054,900 net) undeveloped acres. The Company also holds a 0.4% equity interest in Erdgas Munster GmbH ("EGM"), a joint venture created in 1959 to jointly transport, process, and market gas in northwest Germany. This transportation interest allows for our proportionate share of produced volumes to be processed, blended, and transported to designated gas consumers through the EGM network of approximately 2,000 kilometres of pipeline.
For the year ended December 31, 2016, production in Germany averaged 14.9 MMcf/d of natural gas. Sales of natural gas in 2016 were $29.0 million (2015 - $41.4 million).

Vermilion Energy Inc. AIF for the year ended December 31, 2016
13
During 2016, Vermilion continued its ongoing analysis of the proprietary geologic data associated with the farm-in assets. In 2017, the Company plans to invest in optimization and other well work on the assets the Company acquired in December 2016 as well as prepare for the drilling of one (0.25 net) well in the Dümmersee-Uchte area which is expected to be drilled in 2018.
The GLJ Report assigned 12,202 Mboe of total proved reserves and 23,528 Mboe of proved plus probable reserves to Vermilion's properties located in Germany.
Ireland Business Unit
Vermilion acquired an 18.5% non-operating interest in the offshore Corrib gas field located off the northwest coast of Ireland in 2009. The asset is comprised of six offshore wells, an onshore natural gas processing facility and offshore and onshore pipeline segments. At the time of the acquisition most of the key components of the project, with the exception of the onshore pipeline, were either complete or in the latter stages of development. In 2011, approvals and permissions were granted for the onshore gas pipeline and tunneling commenced in December 2012. In May 2014, Vermilion announced the completion of tunnel boring operations. In September 2015, the project operator, Shell E&P Ireland Limited, declared the project operationally ready for service. With the final regulatory consent received on December 29, 2015, gas began to flow from the Corrib project on December 30, 2015.
Production volumes at Corrib reached full plant capacity of approximately 65 mmcf/d (10,900 boe/d) net to Vermilion at the end of Q2 2016 following recertification activities associated with a third party gas distribution pipeline network. Production at Corrib is expected to remain stable for a period of 12 - 18 months following the achievement of peak production volumes before starting to decline.
For the year ended December 31, 2016, production in Ireland averaged 50.9 MMcf/d of natural gas. Sales of natural gas in 2016 were $109.2 million. There were negligible sales in 2015 as production did not commence until December 30, 2015.
The GLJ Report assigned 16,596 Mboe of total proved reserves and 25,061 Mboe of proved plus probable reserves to Vermilion's property located in Ireland.
Australia Business Unit
In 2005, Vermilion acquired a 60% operated interest in the Wandoo offshore oil field and related production assets, located on Western Australia's northwest shelf. In 2007, Vermilion acquired the remaining 40% interest in the asset. Production occurs from 18 well bores and five lateral sidetrack wells that are tied into two platforms, Wandoo 'A' and Wandoo 'B'. Wandoo 'B' is permanently manned, houses the required production facilities and incorporates 400,000 bbls of oil storage within the platform's concrete gravity structure. The Wandoo 'B' facilities are capable of processing 162,000bbl/d of total fluid to separate the oil from produced water. Vermilion's land position in the Wandoo field is comprised of 59,600 acres (gross and net).
For the year ended December 31, 2016, Vermilion's production in Australia averaged 6,304 bbl/d of light crude oil and medium crude oil. Sales in 2016 from light crude oil and medium crude oil were $136.8 million (2015 - $162.8 million).
During 2015 and 2016, Vermilion drilled three wells in Australia and does not presently expect to drill any additional Australian wells until 2019. Vermilion manages its Australian asset and related capital investment programs to maintain stable production at levels of between 6,000 – 8,000 boe/d.
The GLJ Report assigned 12,418 Mboe of total proved reserves and 17,068 Mboe of proved plus probable reserves to Vermilion's property located in Australia.
United States Business Unit
Vermilion entered the United States in 2014. The Company's assets include 108,500 (97,200 net) acres of land in the Powder River basin of northeastern Wyoming, of which 96% is undeveloped. Vermilion had 11 (9 net) producing oil wells in the United States as at December 31, 2016.
For the year ended December 31, 2016, Vermilion’s production in the United States averaged 422 bbl/d of light crude oil, medium crude oil and NGLs and 0.2 MMcf/d of natural gas. Sales from all commodities in 2016 were $7.3 million (2015 - $4.3 million).
During 2016, Vermilion continued work on its early stage Turner Sand development in the Powder River Basin, completing two (2.0 net) wells that were drilled in 2015 and drilling one (1.0 net) additional well in 2016. In 2017, Vermilion expects to drill three (3.0 net) wells in this play.

Vermilion Energy Inc. AIF for the year ended December 31, 2016
14
The GLJ Report assigned 4,076 Mboe of total proved reserves and 11,477 Mboe of proved plus probable reserves to Vermilion's properties located in the United States.
Central and Eastern Europe (CEE) Business Unit
Vermilion has established a CEE Business unit with a head office in Budapest, Hungary. The CEE business unit is responsible for business development in the CEE, including managing the exploration and development opportunities associated with the Company's land holdings in Hungary, Croatia and Slovakia.
At present, the CEE business unit does not have any production or revenues.
Vermilion's land position in the CEE consists of 322,100 (322,100 net) acres in Hungary, 183,000 (91,500 net) acres in Slovakia and 2.35 million (2.35 million net) acres in Croatia. Currently, Vermilion's entire land position in the CEE is undeveloped.
(1) The production numbers stated refer to Vermilion's working interest share before deduction of Crown, freehold and other royalties. Reserve amounts are gross reserves, stated before deduction of royalties, as at December 31, 2016, based on forecast costs and price assumptions as evaluated in the GLJ Report.
Vermilion Energy Inc. AIF for the year ended December 31, 2016
15
GENERAL DEVELOPMENT OF THE BUSINESS
Three Year History and Outlook
The following describes the development of Vermilion's business over the last three completed financial years. None of the acquisitions describedbelow constituted a “significant acquisition” within the meaning of applicable securities laws.
2014
Vermilion achieved record annual production of 49,573 boe/d exceeding the top end of guidance targets following three upward revisions to guidanceduring the year. Average annual production increased by 21% as compared to 2013. Canadian production growth was attributable to a 20% increasein average production from the Cardium light oil resource play, a near tripling of Mannville condensate-rich gas production and the addition ofapproximately 1,900 boe/d of production from southeast Saskatchewan assets that the Company acquired during the year. In addition, full yearproduction growth of 8% in the Netherlands and the addition of approximately 2,500 boe/d associated with German assets Vermilion acquired duringthe year contributed to the increase.
As announced in 2013, Vermilion increased its monthly dividend by 7.5% to $0.215 per share commencing with the January 2014 dividend. Vermilionmaintained its monthly dividend at $0.215 per share throughout 2014.
New Area Entries
During 2014, Vermilion successfully entered four new areas within the Company's existing core regions following acquisitions in Germany, SoutheastSaskatchewan, and the United States as well as the receipt of a significant concession in Hungary.
In February 2014, Vermilion acquired a 25% non-operated interest in a four-partner consortium in Germany from GDF Suez S.A. (currently known asEngie E&P Deutschland GmbH). The assets comprised four gas producing fields across eleven production licenses characterized by a low effectiveannual decline rate of approximately 11%. The acquired assets included both exploration and production licenses comprising a total of 204,000 grossacres, of which 85% was in the exploration license. The acquisition represented Vermilion's entry into Germany, a producing region with a long historyof oil and gas development activity, low political risk, and strong marketing fundamentals. Total consideration for the acquisition was $172.9 millionwhich was funded through existing credit facilities.
In April 2014, Vermilion completed the acquisition of Elkhorn Resources Inc., a private southeast Saskatchewan producer. The acquisition providedVermilion with light crude oil producing assets located in the Northgate region of southeast Saskatchewan, approximately 57,000 net acres of land(approximately 80% undeveloped), seven oil batteries, and preferential access to 50% or greater capacity at a solution gas facility. Total considerationcomprised $180 million of cash, the assumption of approximately $43 million of debt, and the issuance of 2.8 million common shares of Vermilionvalued at approximately $205 million (based on the closing price per Vermilion common share of $72.50 on the Toronto Stock Exchange on April 29,2014).
In September 2014, Vermilion acquired assets in the Powder River Basin of northeastern Wyoming for $11.1 million. The acquired assets includedapproximately 68,000 acres of land (98% undeveloped) and working interest production of approximately 200 bbls/d (100% light crude oil and mediumcrude oil). The land base included 53,000 net acres at an average operated working interest of 70% in a tight oil project in the Turner Sand at a depthof approximately 1,500 metres. The acquisition provided Vermilion with a low-cost entry into the Powder River Basin and an entry into the sizableUnited States exploration and production market. The Company established an office in Denver, Colorado for its new United States business unit.
In 2014, Vermilion was awarded the Battonya South concession in Hungary. The concession consists of 116,000 gross acres located in the southernpart of the country. The term of the exploration license is 4 years.
Crude Oil Price Decline
Beginning in mid-2014, global crude oil prices began a significant decline markedly changing the upstream energy environment. Vermilion took anumber of actions in response to the price environment.
In November 2014, Vermilion re-launched its company-wide Profitability Enhancement Program ("PEP") which is focused on enhancing long-termprofitability. This represented the third installment of PEP since the Company's inception with the prior two initiatives having achieved strong resultsin both the 1998 industry downturn and the financial crisis of 2008-2009. PEP focuses Vermilion's employees and contractors on increasing revenues,and reducing capital, operating and general and administrative costs, as well as improving efficiencies where possible.
Vermilion Energy Inc. AIF for the year ended December 31, 2016
16
To preserve financial flexibility by providing ongoing access to a modest amount of very low-cost equity capital, Vermilion amended its existing DividendReinvestment Plan to include a Premium Dividend™ Component. Under the Premium Dividend™ Component, shares are issued at a 3.5% discountto a calculated average market price. The shares are sold at prevailing market prices by the Plan Broker (Canaccord Genuity Corporation), whoprovides participating Shareholders with a premium cash payment equal to 101.5% of their dividends, while the Plan Broker retains the balance of thediscount as its fee.
In December 2014, Vermilion announced a reduced capital program for 2015 to support the strength of its balance sheet and the sustainability of itsdividend.
Other Events
The Corrib project in Ireland continued to progress following the completion of tunnel boring operations in May 2014. During the remainder of 2014,project operator Shell Exploration & Production Ireland Ltd. successfully completed offshore workover and pipeline operations and outfitted the 4.9 kmtunnel, including installation of flow and umbilical lines, hydro-testing and dewatering, with the final weld completed in December 2014.
In 2014, Vermilion celebrated its 20 year anniversary as a publicly traded company.
2015
Vermilion achieved record annual production of 54,922 boe/d representing an increase of 11% as compared to 2014. Full-year average productionwas within 0.1% of guidance as strong production results from other business units largely offset the production shortfall related to regulatory delaysat Corrib.
In 2015, Vermilion entered into a farm-in agreement in northwest Germany. The farm-in provided Vermilion with participating interest in 18 onshoreexploration licenses, comprising approximately 850,000 net undeveloped acres in the North German Basin, in exchange for carrying 50% of thefarmor's costs associated with the drilling and testing of six net exploration wells over the following five years. The agreement also granted Vermilionoperatorship during the exploration phase for 11 of the 18 licenses as well as proportionate ownership of key proprietary data spanning the farm-inassets.
On December 29, 2015 Vermilion announced that Shell E&P Ireland Limited, operator of the Corrib project, received the final remaining consentrequired for production from the office of Ireland's Minister for Communications, Energy and Natural Resources. Following this, natural gas began toflow from the Corrib gas project in Ireland on December 30, 2015.
Vermilion continued to prioritize preserving the strength of its balance sheet and increase its financial flexibility in response to the continued weakcommodity price environment. Total exploration and development ("E&D") investment for 2015 totalled $487 million, representing a nearly 30%decrease from the prior year. Vermilion continued to focus on reducing costs through PEP and the Company increased its credit facility capacity by$500 million during the year to $2.0 billion while also extending the term to May 2019.
2016
Vermilion achieved record annual production of 63,526 boe/d representing an increase of 16% as compared to 2015. The increase was attributableto a full-year of Corrib production and organic growth in the Netherlands.
The commodity price environment continued to be extremely challenging during 2016. WTI averaged US$43.32/bbl for the year and reached an intra-year, monthly average low of US$30.62/bbl in February 2016. To support its balance sheet and dividend in the prevailing price environment, theCompany continued to focus on further improving capital efficiencies as well as achieving cost reductions through PEP. Accordingly, in January 2016,Vermilion announced a $285 million E&D capital budget for 2016 representing a 42% decrease from 2015. As commodity prices continued to weakenduring Q1 2016, in February 2016 Vermilion announced a further reduction in its 2016 E&D capital budget to $235 million. In August 2016, Vermilionmodestly increased its E&D capital expenditure guidance for 2016 to $240 million. E&D capital expenditures for 2016 totalled $242.4 million,representing decreases from 2015 and 2014 of 50% and 65%, respectively.
Vermilion maintained its dividend at $0.215 per month during the year. Commencing with the October 2016 dividend payment, the Company beganprorating the Premium DividendTM Component of the Dividend Reinvestment Plan by 25%. This resulted from the continued strength in the Company'sbusiness associated with cost reductions and capital efficiency improvements coupled with the expectation of a more stable commodity priceenvironment. Vermilion subsequently increased the proration factor applied to the Premium DividendTM Component to 50% commencing with theJanuary 2017 dividend payment. In February 2017, the Company announced a further increase in the proration factor to 75% commencing with theApril 2017 dividend payment. Subject to unexpected changes in the commodity price outlook, Vermilion intends to discontinue the Premium DividendTM
Component beginning with the July 2017 dividend payment, such that there would be no further equity issuance under this program.

Vermilion Energy Inc. AIF for the year ended December 31, 2016
17
Vermilion repaid the $225 million of 6.5% Senior Unsecured Notes that came due on February 10, 2016 with funds from its credit facility. While theCompany assessed opportunities to diversify its debt structure, the credit facility represented the company’s most cost-effective method of borrowing.
Effective March 1, 2016, Mr. Lorenzo Donadeo retired as Chief Executive Officer of Vermilion and became Chair of the Board of Directors. Mr. AnthonyMarino, previously the Company's President and Chief Operating Officer, assumed the role of President and CEO. Mr. Larry Macdonald, previouslythe Board of Director's Chair, assumed the role of the newly created role of Lead Independent Director.
In December 2016, Vermilion closed an acquisition of producing oil and gas properties in Germany from Engie E&P Deutschland GmbH (previouslyknown as GDF Suez S.A.) for total consideration of $45.6 million, net of acquired product inventory. The Acquisition comprised operated and non-operated interests in five oil and three natural gas producing fields, along with an operated interest in one exploration license. Vermilion assumedoperatorship of six of the eight producing fields, with the other fields operated by ExxonMobil Production Deutschland (EMPG) and Deutsche ErdoelAG (DEA). Production from the acquired assets was approximately 2,000 boe/d in 2016. The acquisition provided Vermilion with its first operatedproducing properties in Germany, and advanced the Company’s objective of developing a material business unit in the country.
In June 2016, the Republic of Croatia ratified the grant of four exploration blocks to Vermilion. The exploration blocks consisted of approximately 2.35million gross acres (100% working interest), with a substantial portion of the acreage located near existing crude oil and natural gas fields in northeastCroatia. The initial five-year exploration period consists of two phases with an option to relinquish the blocks following the initial three-year phase. InDecember 2016, Vermilion entered into a farm-in agreement in Slovakia with NAFTA, Slovakia's dominant exploration and production company. Thefarm-in agreement grants Vermilion a 50% working interest to jointly explore 183,000 gross acres on an existing license. The primary term of the farm-in agreement is five years.
Vermilion was awarded a position on CDP's 2016 Climate "A" List. CDP (formerly Carbon Disclosure Project) is a London-based not-for-profitorganization that administers a global environmental disclosure system that assists in the measurement and management of corporate environmentalimpacts. Only 193 companies globally achieved Climate "A" List recognition in 2016 and Vermilion was one of only five oil and gas companies in theworld, and the only North American energy company, on the 2016 Climate "A" List. Vermilion has voluntarily reported emissions data to CDP for eachyear since 2012, recognizing the importance of measuring and understanding the Company’s environmental impact.
Outlook
While commodity prices have increased from the lows experienced during 2016, significant uncertainty in the commodity price environment remains.Vermilion intends to maintain a low level of financial leverage and keep cash uses for dividends and E&D capital investment below internal cashgeneration. Consistent with these objectives, in October 2016 Vermilion announced an E&D capital budget for 2017 of $295 million with correspondingproduction guidance of between 69,000-70,000 boe/d. Based on the current commodity price strip, Vermilion expects to fully fund 2017 E&D capitalinvestment and cash dividends from fund flows from operations, with surplus cash generation primarily directed to debt reduction.
TM denotes trademark of Canaccord Genuity Capital Corporation.

Vermilion Energy Inc. AIF for the year ended December 31, 2016
18
STATEMENT OF RESERVES DATA AND OTHER OIL AND GAS INFORMATION
Reserves and Future Net Revenue
The following is a summary of the oil and natural gas reserves and the value of future net revenue of Vermilion as evaluated by GLJ in a report datedFebruary 1, 2016 with an effective date of December 31, 2016. Pricing used in the forecast price evaluations is set forth in the notes to the tables.
Reserves and other oil and gas information contained in this section is effective December 31, 2016 unless otherwise stated.
All evaluations of future net revenue set forth in the tables below are stated after overriding and lessor royalties, Crown royalties, freehold royalties,mineral taxes, direct lifting costs, normal allocated overhead and future capital investments, including abandonment and reclamation obligations.Future net revenues estimated by the GLJ Report do not represent the fair market value of the reserves. Other assumptions relating to thecosts, prices for future production and other matters are included in the GLJ Report. There is no assurance that the future price and costassumptions used in the GLJ Report will prove accurate and variances could be material.
Reserves for Australia, Canada, France, Germany, Ireland, the Netherlands and United States are established using deterministic methodology. Totalproved reserves are established at the 90 percent probability (P90) level. There is a 90 percent probability that the actual reserves recovered will beequal to or greater than the P90 reserves. Total proved plus probable reserves are established at the 50 percent probability (P50) level. There is a50 percent probability that the actual reserves recovered will be equal to or greater than the P50 reserves.
The Report on Reserves Data by Independent Qualified Reserves Evaluator in Form 51-101F2 and the Report of Management and Directors on Oiland Gas Disclosure in Form 51-101F3 are contained in Schedules "A" and "B", respectively.
The following tables provide reserves data and a breakdown of future net revenue by component and product type using forecast prices and costs.For Canada, the tables following include AGCA.
The following tables may not total due to rounding.
Vermilion Energy Inc. AIF for the year ended December 31, 2016
19
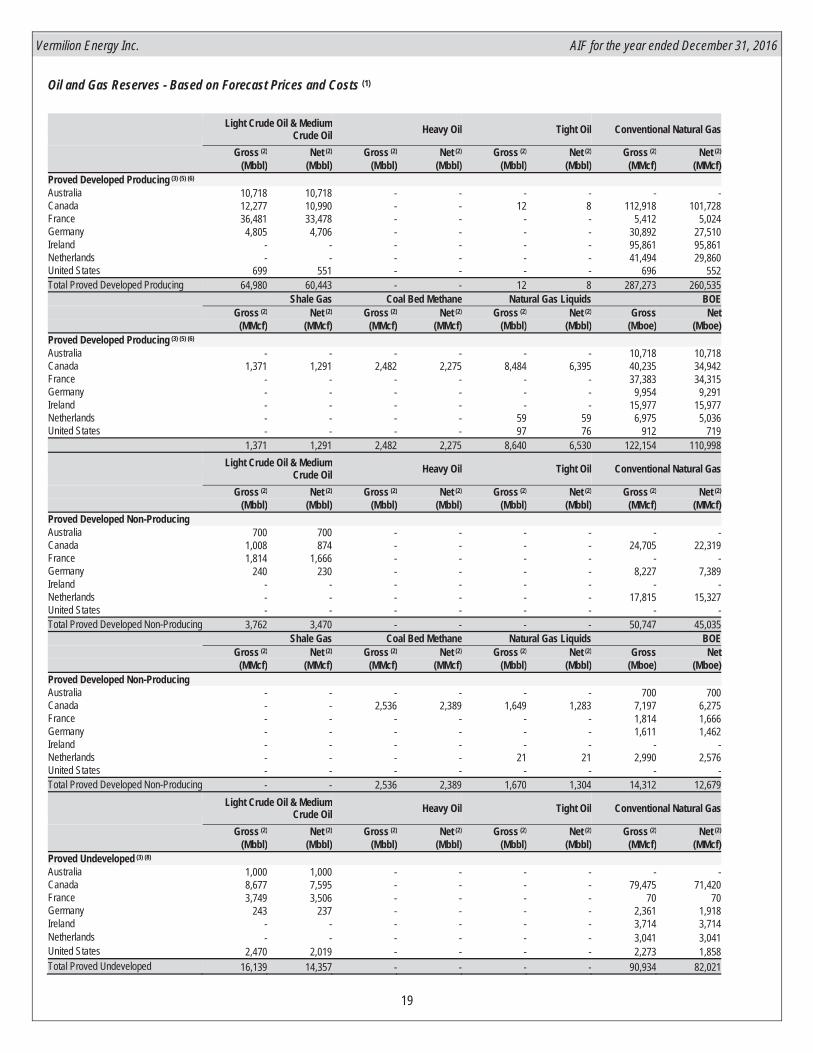
Oil and Gas Reserves - Based on Forecast Prices and Costs (1)
Light Crude Oil & Medium
Crude Oil Heavy Oil Tight Oil Conventional Natural Gas
Gross (2) Net (2) Gross (2) Net (2) Gross (2) Net (2) Gross (2) Net (2)
(Mbbl) (Mbbl) (Mbbl) (Mbbl) (Mbbl) (Mbbl) (MMcf) (MMcf)Proved Developed Producing (3) (5) (6)
Australia 10,718 10,718 - - - - - -Canada 12,277 10,990 - - 12 8 112,918 101,728 France 36,481 33,478 - - - - 5,412 5,024 Germany 4,805 4,706 - - - - 30,892 27,510 Ireland - - - - - - 95,861 95,861 Netherlands - - - - - - 41,494 29,860 United States 699 551 - - - - 696 552 Total Proved Developed Producing 64,980 60,443 - - 12 8 287,273 260,535
Shale Gas Coal Bed Methane Natural Gas Liquids BOEGross (2) Net (2) Gross (2) Net (2) Gross (2) Net (2) Gross Net
(MMcf) (MMcf) (MMcf) (MMcf) (Mbbl) (Mbbl) (Mboe) (Mboe)Proved Developed Producing (3) (5) (6)
Australia - - - - - - 10,718 10,718 Canada 1,371 1,291 2,482 2,275 8,484 6,395 40,235 34,942 France - - - - - - 37,383 34,315 Germany - - - - - - 9,954 9,291 Ireland - - - - - - 15,977 15,977 Netherlands - - - - 59 59 6,975 5,036 United States - - - - 97 76 912 719
1,371 1,291 2,482 2,275 8,640 6,530 122,154 110,998 Light Crude Oil & Medium
Crude Oil Heavy Oil Tight Oil Conventional Natural Gas
Gross (2) Net (2) Gross (2) Net (2) Gross (2) Net (2) Gross (2) Net (2)
(Mbbl) (Mbbl) (Mbbl) (Mbbl) (Mbbl) (Mbbl) (MMcf) (MMcf)Proved Developed Non-ProducingAustralia 700 700 - - - - - -Canada 1,008 874 - - - - 24,705 22,319 France 1,814 1,666 - - - - - -Germany 240 230 - - - - 8,227 7,389 Ireland - - - - - - - -Netherlands - - - - - - 17,815 15,327 United States - - - - - - - -Total Proved Developed Non-Producing 3,762 3,470 - - - - 50,747 45,035
Shale Gas Coal Bed Methane Natural Gas Liquids BOEGross (2) Net (2) Gross (2) Net (2) Gross (2) Net (2) Gross Net
(MMcf) (MMcf) (MMcf) (MMcf) (Mbbl) (Mbbl) (Mboe) (Mboe)Proved Developed Non-ProducingAustralia - - - - - - 700 700 Canada - - 2,536 2,389 1,649 1,283 7,197 6,275 France - - - - - - 1,814 1,666 Germany - - - - - - 1,611 1,462 Ireland - - - - - - - -Netherlands - - - - 21 21 2,990 2,576 United States - - - - - - - -Total Proved Developed Non-Producing - - 2,536 2,389 1,670 1,304 14,312 12,679
Light Crude Oil & MediumCrude Oil Heavy Oil Tight Oil Conventional Natural Gas
Gross (2) Net (2) Gross (2) Net (2) Gross (2) Net (2) Gross (2) Net (2)
(Mbbl) (Mbbl) (Mbbl) (Mbbl) (Mbbl) (Mbbl) (MMcf) (MMcf)Proved Undeveloped (3) (8)
Australia 1,000 1,000 - - - - - -Canada 8,677 7,595 - - - - 79,475 71,420 France 3,749 3,506 - - - - 70 70Germany 243 237 - - - - 2,361 1,918 Ireland - - - - - - 3,714 3,714 Netherlands - - - - - - 3,041 3,041 United States 2,470 2,019 - - - - 2,273 1,858 Total Proved Undeveloped 16,139 14,357 - - - - 90,934 82,021

Vermilion Energy Inc. AIF for the year ended December 31, 2016
20
Shale Gas Coal Bed Methane Natural Gas Liquids BOEGross (2) Net (2) Gross (2) Net (2) Gross (2) Net (2) Gross Net
(MMcf) (MMcf) (MMcf) (MMcf) (Mbbl) (Mbbl) (Mboe) (Mboe)Proved UndevelopedAustralia - - - - - - 1,000 1,000 Canada - - 3,043 2,812 7,230 5,541 29,660 25,508 France - - - - - - 3,761 3,518 Germany - - - - - - 637 557 Ireland - - - - - - 619 619 Netherlands - - - - 1 1 508 508 United States - - - - 315 258 3,164 2,587 Total Proved Undeveloped - - 3,043 2,812 7,546 5,800 39,349 34,297
Light Crude Oil & MediumCrude Oil Heavy Oil Tight Oil Conventional Natural Gas
Gross (2) Net (2) Gross (2) Net (2) Gross (2) Net (2) Gross (2) Net (2)
(Mbbl) (Mbbl) (Mbbl) (Mbbl) (Mbbl) (Mbbl) (MMcf) (MMcf)Proved (3)
Australia 12,418 12,418 - - - - - -Canada 21,962 19,460 - - 12 8 217,098 195,467 France 42,044 38,650 - - - - 5,482 5,094 Germany 5,288 5,173 - - - - 41,480 36,817 Ireland - - - - - - 99,575 99,575 Netherlands - - - - - - 62,350 48,228 United States 3,169 2,570 - - - - 2,969 2,410 Total Proved 84,881 78,271 - - 12 8 428,954 387,591
Shale Gas Coal Bed Methane Natural Gas Liquids BOEGross (2) Net (2) Gross (2) Net (2) Gross (2) Net (2) Gross Net
(MMcf) (MMcf) (MMcf) (MMcf) (Mbbl) (Mbbl) (Mboe) (Mboe)ProvedAustralia - - - - - - 12,418 12,418 Canada 1,371 1,291 8,061 7,476 17,363 13,219 77,092 66,725 France - - - - - - 42,958 39,499 Germany - - - - - - 12,202 11,310 Ireland - - - - - - 16,596 16,596 Netherlands - - - - 81 81 10,473 8,120 United States - - - - 412 334 4,076 3,306 Total Proved 1,371 1,291 8,061 7,476 17,856 13,634 175,815 157,974
Light Crude Oil & MediumCrude Oil Heavy Oil Tight Oil Conventional Natural Gas
Gross (2) Net (2) Gross (2) Net (2) Gross (2) Net (2) Gross (2) Net (2)
(Mbbl) (Mbbl) (Mbbl) (Mbbl) (Mbbl) (Mbbl) (MMcf) (MMcf)Probable (4) Australia 4,650 4,650 - - - - - -Canada 14,103 12,146 - - 2 1 151,707 135,215 France 21,933 20,261 - - - - 892 884 Germany 2,279 2,238 - - - - 54,284 47,482 Ireland - - - - - - 50,787 50,787 Netherlands - - - - - - 43,184 33,118 United States 5,727 4,716 - - - - 5,481 4,512 Total Probable 48,692 44,011 - - 2 1 306,335 271,998
Shale Gas Coal Bed Methane Natural Gas Liquids BOEGross (2) Net (2) Gross (2) Net (2) Gross (2) Net (2) Gross Net
(MMcf) (MMcf) (MMcf) (MMcf) (Mbbl) (Mbbl) (Mboe) (Mboe)ProbableAustralia - - - - - - 4,650 4,650 Canada 284 267 4,677 4,395 12,907 9,730 53,123 45,190 France - - - - - - 22,082 20,408 Germany - - - - - - 11,326 10,152 Ireland - - - - - - 8,465 8,465 Netherlands - - - - 63 56 7,260 5,576 United States - - - - 760 625 7,401 6,093

Vermilion Energy Inc. AIF for the year ended December 31, 2016
21
Total Probable 284 267 4,677 4,395 13,730 10,411 114,307 100,534 Light Crude Oil & Medium
Crude Oil Heavy Oil Tight Oil Conventional Natural Gas
Gross (2) Net (2) Gross (2) Net (2) Gross (2) Net (2) Gross (2) Net (2)
(Mbbl) (Mbbl) (Mbbl) (Mbbl) (Mbbl) (Mbbl) (MMcf) (MMcf)Proved Plus Probable (3) (4)
Australia 17,068 17,068 - - - - - -Canada 36,065 31,606 - - 14 9 368,805 330,682 France 63,977 58,911 - - - - 6,374 5,978 Germany 7,567 7,411 - - - - 95,764 84,299 Ireland - - - - - - 150,362 150,362 Netherlands - - - - - - 105,534 81,346 United States 8,896 7,286 - - - - 8,450 6,922 Total Proved Plus Probable 133,573 122,282 - - 14 9 735,289 659,589
Shale Gas Coal Bed Methane Natural Gas Liquids BOEGross (2) Net (2) Gross (2) Net (2) Gross (2) Net (2) Gross Net
(MMcf) (MMcf) (MMcf) (MMcf) (Mbbl) (Mbbl) (Mboe) (Mboe)Proved Plus Probable (3) (4)
Australia - - - - - - 17,068 17,068 Canada 1,655 1,558 12,738 11,871 30,270 22,949 130,215 111,915 France - - - - - - 65,040 59,907 Germany - - - - - - 23,528 21,462 Ireland - - - - - - 25,061 25,061 Netherlands - - - - 144 137 17,733 13,696 United States - - - - 1,172 959 11,477 9,399 Total Proved Plus Probable 1,655 1,558 12,738 11,871 31,586 24,045 290,122 258,508
Notes:(1) The pricing assumptions used in the GLJ Report with respect to net present value of future net revenue (forecast) as well as the inflation rates used for operating and capital costs are
set forth below. See “Forecast Prices used in Estimates”. The NGL price is an aggregate of the individual natural gas liquids prices used in the Total Proved plus Probable evaluation.GLJ is an independent qualified reserves evaluator appointed pursuant to NI 51-101.
(2) "Gross Reserves" are Vermilion's working interest (operating or non-operating) share before deduction of royalties and without including any royalty interests of Vermilion. "Net Reserves"are Vermilion's working interest (operating or non-operating) share after deduction of royalty obligations, plus Vermilion's royalty interests in reserves.
(3) "Proved" reserves are those reserves that can be estimated with a high degree of certainty to be recoverable. It is likely that the actual remaining quantities recovered will exceed theestimated proved reserves.
(4) "Probable" reserves are those additional reserves that are less certain to be recovered than proved reserves. It is equally likely that the actual remaining quantities recovered will begreater or less than the sum of the estimated proved plus probable reserves.
(5) "Developed" reserves are those reserves that are expected to be recovered from existing wells and installed facilities or, if facilities have not been installed, that would involve a lowexpenditure (e.g. when compared to the cost of drilling a well) to put the reserves on production.
(6) "Developed Producing" reserves are those reserves that are expected to be recovered from completion intervals open at the time of the estimate. These reserves may be currentlyproducing or, if shut-in, they must have previously been on production, and the date of resumption of production must be known with reasonable certainty.
(7) "Developed Non-Producing" reserves are those reserves that either have not been on production, or have previously been on production, but are shut in, and the date of resumption ofproduction is unknown.
(8) "Undeveloped" reserves are those reserves expected to be recovered from known accumulations where a significant expenditure (for example, when compared to the cost of drilling awell) is required to render them capable of production. They must fully meet the requirements of the reserves classification (proved, probable, possible) to which they are assigned.

Vermilion Energy Inc. AIF for the year ended December 31, 2016
22
Net Present Value of Future Net Revenue - Based on Forecast Prices and Costs (1)
Before Deducting Future Income Taxes Discounted At After Deducting Future Income Taxes Discounted At
(M$) 0% 5% 10% 15% 20% 0% 5% 10% 15% 20%Proved Developed Producing (2) (4) (5)
Australia 134,236 217,117 240,607 240,546 231,618 164,830 197,187 199,187 190,432 178,594 Canada 963,690 777,268 645,191 553,740 487,804 963,690 777,268 645,191 553,740 487,804 France 2,009,158 1,404,527 1,073,623 871,502 736,836 1,664,358 1,169,631 894,523 725,047 611,642 Germany 193,385 187,330 161,141 138,822 121,707 193,385 187,330 161,141 138,822 121,707 Ireland 471,720 441,671 396,917 356,653 323,302 471,720 441,671 396,917 356,653 323,302 Netherlands 76,272 86,832 91,069 92,068 91,365 65,732 76,545 81,019 82,239 81,743 United States 29,716 23,345 19,334 16,637 14,710 29,716 23,345 19,334 16,637 14,710 Total Proved Developed Producing 3,878,177 3,138,090 2,627,882 2,269,968 2,007,342 3,553,431 2,872,977 2,397,312 2,063,570 1,819,502 Proved Developed Non-Producing (2) (4) (6)
Australia 31,411 35,177 32,247 28,181 24,473 31,411 35,177 32,247 28,181 24,473 Canada 147,607 108,964 87,413 73,769 64,329 147,607 108,964 87,413 73,769 64,329 France 87,674 71,387 60,449 52,665 46,857 60,567 49,131 41,376 35,850 31,732 Germany 41,121 29,470 21,864 16,769 13,244 41,121 29,470 21,864 16,769 13,244 Ireland - - - - - - - - - -Netherlands 46,907 45,115 42,066 38,740 35,545 33,688 32,489 29,973 27,127 24,367 United States - - - - - - - - - -Total Proved Developed Non-Producing 354,720 290,113 244,039 210,124 184,448 314,394 255,231 212,873 181,696 158,145 Proved Undeveloped (2) (7)
Australia 34,323 24,134 16,832 11,574 7,761 12,618 2,648 (1,772) (3,929) (5,057)Canada 569,308 368,599 249,906 175,120 125,532 416,577 282,567 199,226 144,148 106,013 France 187,253 137,261 104,175 81,348 64,957 129,800 91,741 66,604 49,467 37,335 Germany 18,403 11,756 7,584 4,902 3,130 18,403 11,756 7,584 4,902 3,130 Ireland 12,873 9,337 6,763 4,894 3,536 12,873 9,337 6,763 4,894 3,536 Netherlands 10,896 9,095 7,611 6,411 5,443 8,160 6,584 5,294 4,263 3,443 United States 72,284 38,191 20,027 9,645 3,348 72,284 38,191 20,027 9,645 3,348 Total Proved Undeveloped 905,340 598,373 412,898 293,894 213,707 670,715 442,824 303,726 213,390 151,748 Proved (2)
Australia 199,970 276,428 289,686 280,301 263,852 208,859 235,012 229,662 214,684 198,010 Canada 1,680,605 1,254,831 982,510 802,629 677,665 1,527,874 1,168,799 931,830 771,657 658,146 France 2,284,085 1,613,175 1,238,247 1,005,515 848,650 1,854,725 1,310,503 1,002,503 810,364 680,709 Germany 252,909 228,556 190,589 160,493 138,081 252,909 228,556 190,589 160,493 138,081 Ireland 484,593 451,008 403,680 361,547 326,838 484,593 451,008 403,680 361,547 326,838 Netherlands 134,075 141,042 140,746 137,219 132,353 107,580 115,618 116,286 113,629 109,553 United States 102,000 61,536 39,361 26,282 18,058 102,000 61,536 39,361 26,282 18,058 Total Proved 5,138,237 4,026,576 3,284,819 2,773,986 2,405,497 4,538,540 3,571,032 2,913,911 2,458,656 2,129,395 Probable (3)
Australia 198,227 163,180 128,734 101,649 81,484 107,201 87,874 68,562 53,406 42,201 Canada 1,372,807 814,946 539,761 384,694 288,798 1,009,708 591,846 389,432 277,104 208,604 France 1,378,689 734,502 464,026 323,290 239,221 974,931 502,379 305,000 203,471 143,693 Germany 336,322 208,119 130,651 86,473 59,902 248,590 162,713 105,566 71,859 51,003 Ireland 354,566 235,805 167,862 126,297 99,303 354,566 235,805 167,862 126,297 99,303 Netherlands 162,029 137,048 115,870 98,750 85,096 111,908 92,487 75,843 62,469 51,946 United States 270,229 147,720 90,240 59,467 41,247 175,706 98,838 61,958 41,765 29,522 Total Probable 4,072,869 2,441,320 1,637,144 1,180,620 895,051 2,982,610 1,771,942 1,174,223 836,371 626,272 Proved Plus Probable (2) (3)
Australia 398,197 439,608 418,420 381,950 345,336 316,060 322,886 298,224 268,090 240,211 Canada 3,053,412 2,069,777 1,522,271 1,187,323 966,463 2,537,582 1,760,645 1,321,262 1,048,761 866,750 France 3,662,774 2,347,677 1,702,273 1,328,805 1,087,871 2,829,656 1,812,882 1,307,503 1,013,835 824,402 Germany 589,231 436,675 321,240 246,966 197,983 501,499 391,269 296,155 232,352 189,084 Ireland 839,159 686,813 571,542 487,844 426,141 839,159 686,813 571,542 487,844 426,141 Netherlands 296,104 278,090 256,616 235,969 217,449 219,488 208,105 192,129 176,098 161,499 United States 372,229 209,256 129,601 85,749 59,305 277,706 160,374 101,319 68,047 47,580 Total Proved Plus Probable 9,211,106 6,467,896 4,921,963 3,954,606 3,300,548 7,521,150 5,342,974 4,088,134 3,295,027 2,755,667
Notes:(1) The pricing assumptions used in the GLJ Report with respect to net present value of future net revenue (forecast) as well as the inflation rates used for operating and capital costs are
set forth below. See “Forecast Prices used in Estimates”. The NGL price is an aggregate of the individual natural gas liquids prices used in the Total Proved plus Probable evaluation.GLJ is an independent qualified reserves evaluator appointed pursuant to NI 51-101.
(2) "Proved" reserves are those reserves that can be estimated with a high degree of certainty to be recoverable. It is likely that the actual remaining quantities recovered will exceed theestimated proved reserves.
(3) "Probable" reserves are those additional reserves that are less certain to be recovered than proved reserves. It is equally likely that the actual remaining quantities recovered will begreater or less than the sum of the estimated proved plus probable reserves.
(4) "Developed" reserves are those reserves that are expected to be recovered from existing wells and installed facilities or, if facilities have not been installed, that would involve a lowexpenditure (e.g. when compared to the cost of drilling a well) to put the reserves on production.
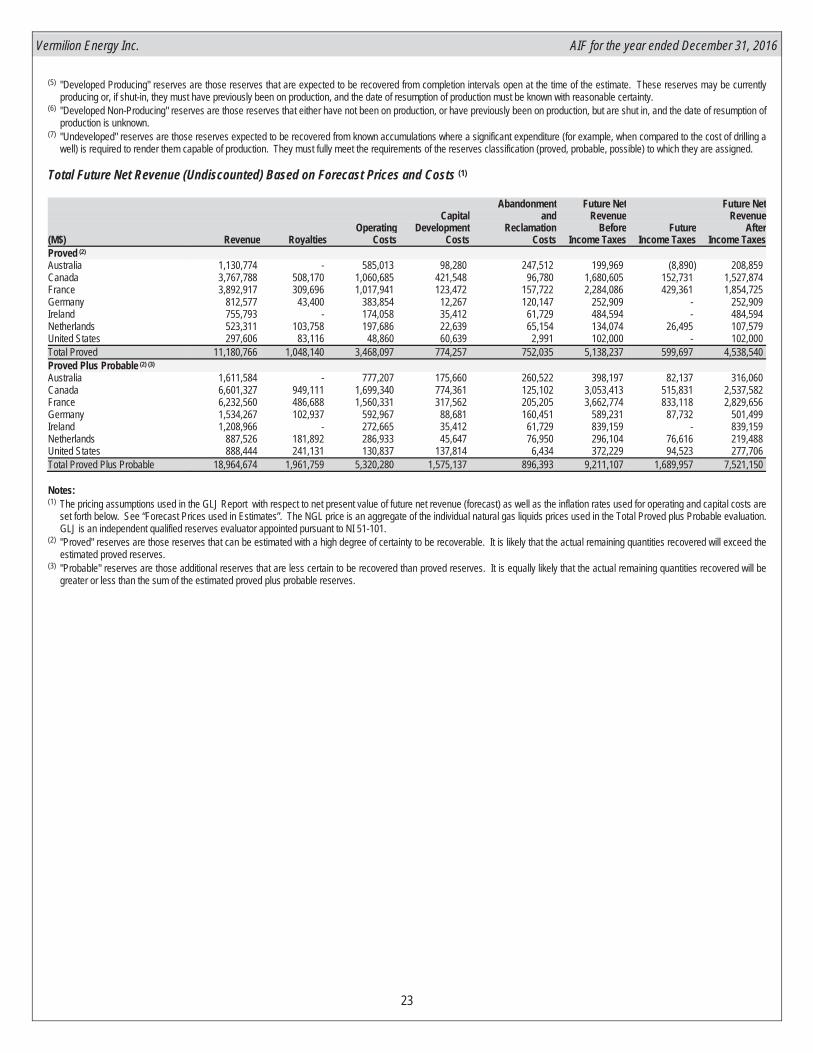
Vermilion Energy Inc. AIF for the year ended December 31, 2016
23
(5) "Developed Producing" reserves are those reserves that are expected to be recovered from completion intervals open at the time of the estimate. These reserves may be currentlyproducing or, if shut-in, they must have previously been on production, and the date of resumption of production must be known with reasonable certainty.
(6) "Developed Non-Producing" reserves are those reserves that either have not been on production, or have previously been on production, but are shut in, and the date of resumption ofproduction is unknown.
(7) "Undeveloped" reserves are those reserves expected to be recovered from known accumulations where a significant expenditure (for example, when compared to the cost of drilling awell) is required to render them capable of production. They must fully meet the requirements of the reserves classification (proved, probable, possible) to which they are assigned.
Total Future Net Revenue (Undiscounted) Based on Forecast Prices and Costs (1)
Abandonment Future Net Future NetCapital and Revenue Revenue
Operating Development Reclamation Before Future After(M$) Revenue Royalties Costs Costs Costs Income Taxes Income Taxes Income TaxesProved (2)
Australia 1,130,774 - 585,013 98,280 247,512 199,969 (8,890) 208,859 Canada 3,767,788 508,170 1,060,685 421,548 96,780 1,680,605 152,731 1,527,874 France 3,892,917 309,696 1,017,941 123,472 157,722 2,284,086 429,361 1,854,725 Germany 812,577 43,400 383,854 12,267 120,147 252,909 - 252,909 Ireland 755,793 - 174,058 35,412 61,729 484,594 - 484,594 Netherlands 523,311 103,758 197,686 22,639 65,154 134,074 26,495 107,579 United States 297,606 83,116 48,860 60,639 2,991 102,000 - 102,000 Total Proved 11,180,766 1,048,140 3,468,097 774,257 752,035 5,138,237 599,697 4,538,540 Proved Plus Probable (2) (3)
Australia 1,611,584 - 777,207 175,660 260,522 398,197 82,137 316,060 Canada 6,601,327 949,111 1,699,340 774,361 125,102 3,053,413 515,831 2,537,582 France 6,232,560 486,688 1,560,331 317,562 205,205 3,662,774 833,118 2,829,656 Germany 1,534,267 102,937 592,967 88,681 160,451 589,231 87,732 501,499 Ireland 1,208,966 - 272,665 35,412 61,729 839,159 - 839,159 Netherlands 887,526 181,892 286,933 45,647 76,950 296,104 76,616 219,488 United States 888,444 241,131 130,837 137,814 6,434 372,229 94,523 277,706 Total Proved Plus Probable 18,964,674 1,961,759 5,320,280 1,575,137 896,393 9,211,107 1,689,957 7,521,150
Notes:(1) The pricing assumptions used in the GLJ Report with respect to net present value of future net revenue (forecast) as well as the inflation rates used for operating and capital costs are
set forth below. See “Forecast Prices used in Estimates”. The NGL price is an aggregate of the individual natural gas liquids prices used in the Total Proved plus Probable evaluation.GLJ is an independent qualified reserves evaluator appointed pursuant to NI 51-101.
(2) "Proved" reserves are those reserves that can be estimated with a high degree of certainty to be recoverable. It is likely that the actual remaining quantities recovered will exceed theestimated proved reserves.
(3) "Probable" reserves are those additional reserves that are less certain to be recovered than proved reserves. It is equally likely that the actual remaining quantities recovered will begreater or less than the sum of the estimated proved plus probable reserves.

Vermilion Energy Inc. AIF for the year ended December 31, 2016
24
Future Net Revenue by Product Type Based on Forecast Prices and Costs (1)
Future Net RevenueBefore Income Taxes (2)
(Discounted at 10% Per Year) Unit ValueProved Developed Producing (M$) ($/boe)Light crude oil & medium crude oil (3) 1,869,323 28.43 Heavy Oil (3) - -Conventional Natural gas (4) 755,799 16.95 Shale Gas 1,928 6.93 Coal Bed Methane 832 2.19 Total Proved Developed Producing 2,627,882 23.68 Proved Developed Non-ProducingLight crude oil & medium crude oil (3) 119,652 32.00 Heavy Oil (3) - -Conventional Natural gas (4) 123,922 14.51 Shale Gas - -Coal Bed Methane 465 1.17 Total Proved Developed Non-Producing 244,039 19.25 Proved UndevelopedLight crude oil & medium crude oil (3) 279,927 14.84 Heavy Oil (3) - -Conventional Natural gas (4) 132,343 8.84 Shale Gas - -Coal Bed Methane 628 1.34 Total Proved Undeveloped 412,898 12.04 ProvedLight crude oil & medium crude oil (3) 2,268,902 25.72 Heavy Oil (3) - -Conventional Natural gas (4) 1,012,064 14.82 Shale Gas 1,928 6.97 Coal Bed Methane 1,925 1.53 Total Proved 3,284,819 20.79 ProbableLight crude oil & medium crude oil (3) 1,044,229 20.31 Heavy Oil (3) - -Conventional Natural gas (4) 590,638 12.22 Shale Gas 357 6.26 Coal Bed Methane 1,920 2.62 Total Probable 1,637,144 16.28 Proved Plus ProbableLight crude oil & medium crude oil (3) 3,313,131 23.76 Heavy Oil (3) - -Conventional Natural gas (4) 1,602,702 13.70 Shale Gas 2,285 6.93 Coal Bed Methane 3,845 1.91 Total Proved Plus Probable 4,921,963 19.04
Notes:(1) The pricing assumptions used in the GLJ Report with respect to net present value of future net revenue (forecast) as well as the inflation rates used for operating and capital costs are
set forth below. See “Forecast Prices used in Estimates”. The NGL price is an aggregate of the individual natural gas liquids prices used in the Total Proved plus Probable evaluation.GLJ is an independent qualified reserves evaluator appointed pursuant to NI 51-101.
(2) Other Company revenue and costs not related to a specific product type have been allocated proportionately to the specified product types. Unit values are based on Company NetReserves. Net present value of reserves categories are an approximation based on major products.
(3) Including solution gas and other by-products.(4) Including by-products but excluding solution gas.
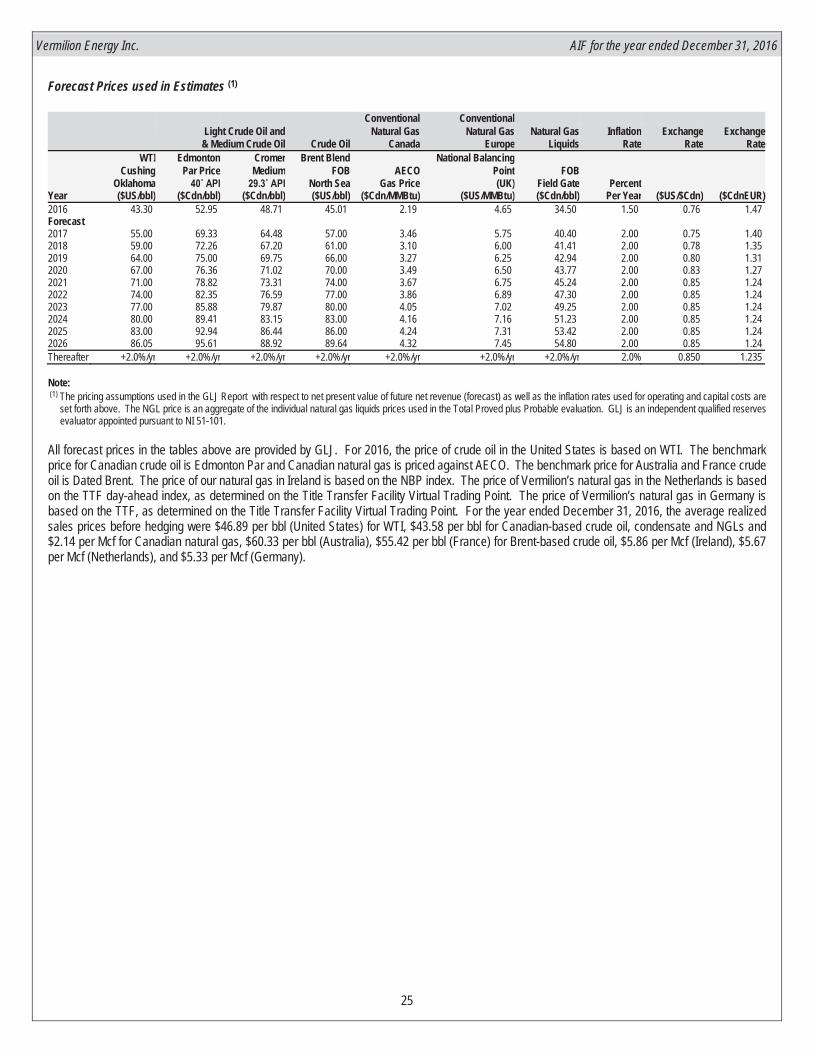
Vermilion Energy Inc. AIF for the year ended December 31, 2016
25
Forecast Prices used in Estimates (1)
Conventional Conventional Light Crude Oil and Natural Gas Natural Gas Natural Gas Inflation Exchange Exchange
& Medium Crude Oil Crude Oil Canada Europe Liquids Rate Rate Rate WTI Edmonton Cromer Brent Blend National Balancing
Cushing Par Price Medium FOB AECO Point FOB Oklahoma North Sea Gas Price (UK) Field Gate Percent
Year ($US/bbl) ($Cdn/bbl) ($Cdn/bbl) ($US/bbl) ($Cdn/MMBtu) ($US/MMBtu) ($Cdn/bbl) Per Year ($US/$Cdn) ($CdnEUR)2016 43.30 52.95 48.71 45.01 2.19 4.65 34.50 1.50 0.76 1.47 Forecast2017 55.00 69.33 64.48 57.00 3.46 5.75 40.40 2.00 0.75 1.40 2018 59.00 72.26 67.20 61.00 3.10 6.00 41.41 2.00 0.78 1.35 2019 64.00 75.00 69.75 66.00 3.27 6.25 42.94 2.00 0.80 1.31 2020 67.00 76.36 71.02 70.00 3.49 6.50 43.77 2.00 0.83 1.27 2021 71.00 78.82 73.31 74.00 3.67 6.75 45.24 2.00 0.85 1.24 2022 74.00 82.35 76.59 77.00 3.86 6.89 47.30 2.00 0.85 1.24 2023 77.00 85.88 79.87 80.00 4.05 7.02 49.25 2.00 0.85 1.24 2024 80.00 89.41 83.15 83.00 4.16 7.16 51.23 2.00 0.85 1.24 2025 83.00 92.94 86.44 86.00 4.24 7.31 53.42 2.00 0.85 1.24 2026 86.05 95.61 88.92 89.64 4.32 7.45 54.80 2.00 0.85 1.24 Thereafter +2.0%/yr +2.0%/yr +2.0%/yr +2.0%/yr +2.0%/yr +2.0%/yr +2.0%/yr 2.0% 0.850 1.235
Note:(1) The pricing assumptions used in the GLJ Report with respect to net present value of future net revenue (forecast) as well as the inflation rates used for operating and capital costs are
set forth above. The NGL price is an aggregate of the individual natural gas liquids prices used in the Total Proved plus Probable evaluation. GLJ is an independent qualified reservesevaluator appointed pursuant to NI 51-101.
All forecast prices in the tables above are provided by GLJ. For 2016, the price of crude oil in the United States is based on WTI. The benchmarkprice for Canadian crude oil is Edmonton Par and Canadian natural gas is priced against AECO. The benchmark price for Australia and France crudeoil is Dated Brent. The price of our natural gas in Ireland is based on the NBP index. The price of Vermilion’s natural gas in the Netherlands is basedon the TTF day-ahead index, as determined on the Title Transfer Facility Virtual Trading Point. The price of Vermilion’s natural gas in Germany isbased on the TTF, as determined on the Title Transfer Facility Virtual Trading Point. For the year ended December 31, 2016, the average realizedsales prices before hedging were $46.89 per bbl (United States) for WTI, $43.58 per bbl for Canadian-based crude oil, condensate and NGLs and$2.14 per Mcf for Canadian natural gas, $60.33 per bbl (Australia), $55.42 per bbl (France) for Brent-based crude oil, $5.86 per Mcf (Ireland), $5.67per Mcf (Netherlands), and $5.33 per Mcf (Germany).

Vermilion Energy Inc. AIF for the year ended December 31, 2016
26
Reconciliations of Changes in Reserves
The following tables set forth a reconciliation of the changes in Vermilion's gross light crude oil and medium crude oil, heavy oil, tight oil, conventionalnatural gas, coal bed methane, shale gas and NGLs reserves as at December 31, 2016 compared to such reserves as at December 31, 2015 basedon the forecast price and cost assumptions set forth in note 3. Reconciliation of Company Gross Reserves by Principal Product Type - Based on Forecast Prices and Costs
Light Crude Oil &AUSTRALIA Total Oil (4) Medium Crude Oil Heavy Oil Tight Oil
Proved + Proved + Proved + Proved +Proved Probable P+P (1) (2) Proved Probable Probable Proved Probable Probable Proved Probable Probable Proved Probable ProbableFactors (Mbbl) (Mbbl) (Mbbl) (Mbbl) (Mbbl) (Mbbl) (Mbbl) (Mbbl) (Mbbl) (Mbbl) (Mbbl) (Mbbl)At December 31, 2015 13,765 3,700 17,465 13,765 3,700 17,465 - - - - - -Discoveries - - - - - - - - - - - -Extensions & Improved Recovery 700 1,300 2,000 700 1,300 2,000 - - - - - -Technical Revisions 260 (350) (90) 260 (350) (90) - - - - - -Acquisitions - - - - - - - - - - - -Dispositions - - - - - - - - - - - -Economic Factors - - - - - - - - - - - -Production (2,307) - (2,307) (2,307) - (2,307) - - - - - -At December 31, 2016 12,418 4,650 17,068 12,418 4,650 17,068 - - - - - -
Total Gas (4) Conventional Natural Gas Coal Bed Methane (5) Shale Gas (5)
Proved + Proved + Proved + Proved +Proved Probable P+P (1) (2) Proved Probable Probable Proved Probable Probable Proved Probable Probable Proved Probable ProbableFactors (MMcf) (MMcf) (MMcf) (MMcf) (MMcf) (MMcf) (MMcf) (MMcf) (MMcf) (MMcf) (MMcf) (MMcf)At December 31, 2015 - - - - - - - - - - - -Discoveries - - - - - - - - - - - -Extensions & Improved Recovery - - - - - - - - - - - -Technical Revisions - - - - - - - - - - - -Acquisitions - - - - - - - - - - - -Dispositions - - - - - - - - - - - -Economic Factors - - - - - - - - - - - -Production - - - - - - - - - - - -At December 31, 2016 - - - - - - - - - - - -
Natural Gas Liquids BOEProved + Proved +
Proved Probable P+P (1) (2) Proved Probable Probable Proved Probable ProbableFactors (Mbbl) (Mbbl) (Mbbl) (Mboe) (Mboe) (Mboe)At December 31, 2015 - - - 13,765 3,700 17,465 Discoveries - - - - - -Extensions & Improved Recovery - - - 700 1,300 2,000 Technical Revisions - - - 260 (350) (90)Acquisitions - - - - - -Dispositions - - - - - -Economic Factors - - - - - -Production - - - (2,307) - (2,307)At December 31, 2016 - - - 12,418 4,650 17,068

Vermilion Energy Inc. AIF for the year ended December 31, 2016
27
Light Crude Oil &CANADA Total Oil (4) Medium Crude Oil Heavy Oil Tight Oil
Proved + Proved + Proved + Proved +Proved Probable P+P (1) (2) Proved Probable Probable Proved Probable Probable Proved Probable Probable Proved Probable ProbableFactors (Mbbl) (Mbbl) (Mbbl) (Mbbl) (Mbbl) (Mbbl) (Mbbl) (Mbbl) (Mbbl) (Mbbl) (Mbbl) (Mbbl)At December 31, 2015 22,990 14,792 37,782 22,971 14,786 37,757 9 3 12 10 3 13Discoveries - - - - - - - - - - - -Extensions & Improved Recovery 620 281 901 620 281 901 - - - - - -Technical Revisions 611 (1,284) (673) 616 (1,280) (664) (9) (3) (12) 4 (1) 3Acquisitions 206 317 523 206 317 523 - - - - - -Dispositions - - - - - - - - - - - -Economic Factors (15) (1) (16) (15) (1) (16) - - - - - -Production (2,438) - (2,438) (2,436) - (2,436) - - - (2) - (2)At December 31, 2016 21,974 14,105 36,079 21,962 14,103 36,065 - - - 12 2 14
Total Gas (4) Conventional Natural Gas Coal Bed Methane (5) Shale Gas (5)
Proved + Proved + Proved + Proved +Proved Probable P+P (1) (2) Proved Probable Probable Proved Probable Probable Proved Probable Probable Proved Probable ProbableFactors (MMcf) (MMcf) (MMcf) (MMcf) (MMcf) (MMcf) (MMcf) (MMcf) (MMcf) (MMcf) (MMcf) (MMcf)At December 31, 2015 200,263 138,068 338,331 190,111 132,676 322,787 8,210 4,917 13,127 1,942 475 2,417Discoveries - - - - - - - - - - - -Extensions & Improved Recovery 18,401 20,608 39,009 18,401 20,608 39,009 - - - - - -Technical Revisions 27,342 (8,022) 19,320 26,058 (7,696) 18,362 1,394 (135) 1,259 (110) (191) (301)Acquisitions 13,078 6,758 19,836 13,006 6,671 19,677 72 87 159 - - -Dispositions (353) (132) (485) (353) (132) (485) - - - - - -Economic Factors (1,351) (612) (1,963) (649) (420) (1,069) (702) (192) (894) - - -Production (30,850) - (30,850) (29,476) - (29,476) (913) - (913) (461) - (461)At December 31, 2016 226,530 156,668 383,198 217,098 151,707 368,805 8,061 4,677 12,738 1,371 284 1,655
Natural Gas Liquids BOEProved + Proved +
Proved Probable P+P (1) (2) Proved Probable Probable Proved Probable ProbableFactors (Mbbl) (Mbbl) (Mbbl) (Mboe) (Mboe) (Mboe)At December 31, 2015 14,795 12,751 27,546 71,162 50,554 121,717 Discoveries - - - - - -Extensions & Improved Recovery 1,412 825 2,237 5,099 4,541 9,640
Technical Revisions 2,004 (1,088) 916 7,172 (3,709) 3,463 Acquisitions 1,045 471 1,516 3,431 1,914 5,345 Dispositions (8) (3) (11) (67) (25) (92)Economic Factors (31) (49) (80) (271) (152) (423)Production (1,854) - (1,854) (9,434) - (9,434)At December 31, 2016 17,363 12,907 30,270 77,092 53,123 130,215

Vermilion Energy Inc. AIF for the year ended December 31, 2016
28
Light Crude Oil &FRANCE Total Oil (4) Medium Crude Oil Heavy Oil Tight Oil
Proved + Proved + Proved + Proved +Proved Probable P+P (1) (2) Proved Probable Probable Proved Probable Probable Proved Probable Probable Proved Probable ProbableFactors (Mbbl) (Mbbl) (Mbbl) (Mbbl) (Mbbl) (Mbbl) (Mbbl) (Mbbl) (Mbbl) (Mbbl) (Mbbl) (Mbbl)At December 31, 2015 40,721 21,325 62,046 40,721 21,325 62,046 - - - - - -Discoveries - - - - - - - - - - - -Extensions & Improved Recovery 2,279 314 2,593 2,279 314 2,593 - - - - - -Technical Revisions 3,445 319 3,764 3,445 319 3,764 - - - - - -Acquisitions - - - - - - - - - - - -Dispositions - - - - - - - - - - - -Economic Factors (47) (25) (72) (47) (25) (72) - - - - - -Production (4,354) - (4,354) (4,354) - (4,354) - - - - - -At December 31, 2016 42,044 21,933 63,977 42,044 21,933 63,977 - - - - - -
Total Gas (4) Conventional Natural Gas Coal Bed Methane (5) Shale Gas (5)
Proved + Proved + Proved + Proved +Proved Probable P+P (1) (2) Proved Probable Probable Proved Probable Probable Proved Probable Probable Proved Probable ProbableFactors (MMcf) (MMcf) (MMcf) (MMcf) (MMcf) (MMcf) (MMcf) (MMcf) (MMcf) (MMcf) (MMcf) (MMcf)At December 31, 2015 7,835 1,559 9,394 7,835 1,559 9,394 - - - - - -Discoveries - - - - - - - - - - - -Extensions & Improved Recovery - - - - - - - - - - - -Technical Revisions (2,170) (654) (2,824) (2,170) (654) (2,824) - - - - - -Acquisitions - - - - - - - - - - - -Dispositions - - - - - - - - - - - -Economic Factors (20) (13) (33) (20) (13) (33) - - - - - -Production (163) - (163) (163) - (163) - - - - - -At December 31, 2016 5,482 892 6,374 5,482 892 6,374 - - - - - -
Natural Gas Liquids BOEProved + Proved +
Proved Probable P+P (1) (2) Proved Probable Probable Proved Probable ProbableFactors (Mbbl) (Mbbl) (Mbbl) (Mboe) (Mboe) (Mboe)At December 31, 2015 - - - 42,027 21,585 63,612 Discoveries - - - - - -Extensions & Improved Recovery - - - 2,279 314 2,593 Technical Revisions - - - 3,083 210 3,293 Acquisitions - - - - - -Dispositions - - - - - -Economic Factors - - - (50) (27) (77)Production - - - (4,381) - (4,381)At December 31, 2016 - - - 42,958 22,082 65,040

Vermilion Energy Inc. AIF for the year ended December 31, 2016
29
Light Crude Oil &GERMANY Total Oil (4) Medium Crude Oil Heavy Oil Tight Oil
Proved + Proved + Proved + Proved +Proved Probable P+P (1) (2) Proved Probable Probable Proved Probable Probable Proved Probable Probable Proved Probable ProbableFactors (Mbbl) (Mbbl) (Mbbl) (Mbbl) (Mbbl) (Mbbl) (Mbbl) (Mbbl) (Mbbl) (Mbbl) (Mbbl) (Mbbl)At December 31, 2015 - - - - - - - - - - - -Discoveries - - - - - - - - - - - -Extensions & Improved Recovery 244 755 999 244 755 999 - - - - - -Technical Revisions - - - - - - - - - - - -Acquisitions 5,044 1,524 6,568 5,044 1,524 6,568 - - - - - -Dispositions - - - - - - - - - - - -Economic Factors - - - - - - - - - - - -Production - - - - - - - - - - - -At December 31, 2016 5,288 2,279 7,567 5,288 2,279 7,567 - - - - - -
Total Gas (4) Conventional Natural Gas Coal Bed Methane (5) Shale Gas (5)
Proved + Proved + Proved + Proved +Proved Probable P+P (1) (2) Proved Probable Probable Proved Probable Probable Proved Probable Probable Proved Probable ProbableFactors (MMcf) (MMcf) (MMcf) (MMcf) (MMcf) (MMcf) (MMcf) (MMcf) (MMcf) (MMcf) (MMcf) (MMcf)At December 31, 2015 31,500 17,999 49,499 31,500 17,999 49,499 - - - - - -Discoveries - - - - - - - - - - - -Extensions & Improved Recovery - 33,249 33,249 - 33,249 33,249 - - - - - -Technical Revisions 4,250 (898) 3,352 4,250 (898) 3,352 - - - - - -Acquisitions 11,182 3,934 15,116 11,182 3,934 15,116 - - - - - -Dispositions - - - - - - - - - - - -Economic Factors - - - - - - - - - - - -Production (5,452) - (5,452) (5,452) - (5,452) - - - - - -At December 31, 2016 41,480 54,284 95,764 41,480 54,284 95,764 - - - - - -
Natural Gas Liquids BOEProved + Proved +
Proved Probable P+P (1) (2) Proved Probable Probable Proved Probable ProbableFactors (Mbbl) (Mbbl) (Mbbl) (Mboe) (Mboe) (Mboe)At December 31, 2015 - - - 5,250 3,000 8,250 Discoveries - - - - - -Extensions & Improved Recovery - - - 244 6,297 6,541 Technical Revisions - - - 708 (150) 559 Acquisitions - - - 6,909 2,179 9,087 Dispositions - - - - - -Economic Factors - - - - - -Production - - - (909) - (909)At December 31, 2016 - - - 12,202 11,326 23,528

Vermilion Energy Inc. AIF for the year ended December 31, 2016
30
Light Crude Oil &IRELAND Total Oil (4) Medium Crude Oil Heavy Oil Tight Oil
Proved + Proved + Proved + Proved +Proved Probable P+P (1) (2) Proved Probable Probable Proved Probable Probable Proved Probable Probable Proved Probable ProbableFactors (Mbbl) (Mbbl) (Mbbl) (Mbbl) (Mbbl) (Mbbl) (Mbbl) (Mbbl) (Mbbl) (Mbbl) (Mbbl) (Mbbl)At December 31, 2015 - - - - - - - - - - - -Discoveries - - - - - - - - - - - -Extensions & Improved Recovery - - - - - - - - - - - -Technical Revisions - - - - - - - - - - - -Acquisitions - - - - - - - - - - - -Dispositions - - - - - - - - - - - -Economic Factors - - - - - - - - - - - -Production - - - - - - - - - - - -At December 31, 2016 - - - - - - - - - - - -
Total Gas (4) Conventional Natural Gas Coal Bed Methane (5) Shale Gas (5)
Proved + Proved + Proved + Proved +Proved Probable P+P (1) (2) Proved Probable Probable Proved Probable Probable Proved Probable Probable Proved Probable ProbableFactors (MMcf) (MMcf) (MMcf) (MMcf) (MMcf) (MMcf) (MMcf) (MMcf) (MMcf) (MMcf) (MMcf) (MMcf)At December 31, 2015 105,821 47,405 153,226 105,821 47,405 153,226 - - - - - -Discoveries - - - - - - - - - - - -Extensions & Improved Recovery 3,714 2,718 6,432 3,714 2,718 6,432 - - - - - -Technical Revisions 8,610 721 9,331 8,610 721 9,331 - - - - - -Acquisitions - - - - - - - - - - - -Dispositions - - - - - - - - - - - -Economic Factors 57 (57) - 57 (57) - - - - - - -Production (18,627) - (18,627) (18,627) - (18,627) - - - - - -At December 31, 2016 99,575 50,787 150,362 99,575 50,787 150,362 - - - - - -
Natural Gas Liquids BOEProved + Proved +
Proved Probable P+P (1) (2) Proved Probable Probable Proved Probable ProbableFactors (Mbbl) (Mbbl) (Mbbl) (Mboe) (Mboe) (Mboe)At December 31, 2015 - - - 17,637 7,901 25,538 Discoveries - - - - - -Extensions & Improved Recovery - - - 619 453 1,072 Technical Revisions - - - 1,435 121 1,556 Acquisitions - - - - - -Dispositions - - - - - -Economic Factors - - - 10 (10) -Production - - - (3,105) - (3,105)At December 31, 2016 - - - 16,596 8,465 25,061

Vermilion Energy Inc. AIF for the year ended December 31, 2016
31
Light Crude Oil &NETHERLANDS Total Oil (4) Medium Crude Oil Heavy Oil Tight Oil
Proved + Proved + Proved + Proved +Proved Probable P+P (1) (2) Proved Probable Probable Proved Probable Probable Proved Probable Probable Proved Probable ProbableFactors (Mbbl) (Mbbl) (Mbbl) (Mbbl) (Mbbl) (Mbbl) (Mbbl) (Mbbl) (Mbbl) (Mbbl) (Mbbl) (Mbbl)At December 31, 2015 - - - - - - - - - - - -Discoveries - - - - - - - - - - - -Extensions & Improved Recovery - - - - - - - - - - - -Technical Revisions - - - - - - - - - - - -Acquisitions - - - - - - - - - - - -Dispositions - - - - - - - - - - - -Economic Factors - - - - - - - - - - - -Production - - - - - - - - - - - -At December 31, 2016 - - - - - - - - - - - -
Total Gas (4) Conventional Natural Gas Coal Bed Methane (5) Shale Gas (5)
Proved + Proved + Proved + Proved +Proved Probable P+P (1) (2) Proved Probable Probable Proved Probable Probable Proved Probable Probable Proved Probable ProbableFactors (MMcf) (MMcf) (MMcf) (MMcf) (MMcf) (MMcf) (MMcf) (MMcf) (MMcf) (MMcf) (MMcf) (MMcf)At December 31, 2015 48,199 48,688 96,887 48,199 48,688 96,887 - - - - - -Discoveries 233 145 378 233 145 378 - - - - - -Extensions & Improved Recovery 8,104 8,782 16,886 8,104 8,782 16,886 - - - - - -Technical Revisions 20,790 (15,818) 4,972 20,790 (15,818) 4,972 - - - - - -Acquisitions 2,654 1,446 4,100 2,654 1,446 4,100 - - - - - -Dispositions - - - - - - - - - - - -Economic Factors (128) (59) (187) (128) (59) (187) - - - - - -Production (17,502) - (17,502) (17,502) - (17,502) - - - - - -At December 31, 2016 62,350 43,184 105,534 62,350 43,184 105,534 - - - - - -
Natural Gas Liquids BOEProved + Proved +
Proved Probable P+P (1) (2) Proved Probable Probable Proved Probable ProbableFactors (Mbbl) (Mbbl) (Mbbl) (Mboe) (Mboe) (Mboe)At December 31, 2015 88 83 171 8,122 8,198 16,320 Discoveries 1 1 2 40 25 65Extensions & Improved Recovery 3 7 10 1,353 1,470 2,823 Technical Revisions 17 (31) (14) 3,482 (2,667) 815 Acquisitions 5 3 8 447 244 691 Dispositions - - - - - -Economic Factors (1) (0) (1) (22) (10) (32)Production (32) - (32) (2,949) - (2,949)At December 31, 2016 81 63 144 10,473 7,260 17,733

Vermilion Energy Inc. AIF for the year ended December 31, 2016
32
Light Crude Oil &UNITED STATES Total Oil (4) Medium Crude Oil Heavy Oil Tight Oil
Proved + Proved + Proved + Proved +Proved Probable P+P (1) (2) Proved Probable Probable Proved Probable Probable Proved Probable Probable Proved Probable ProbableFactors (Mbbl) (Mbbl) (Mbbl) (Mbbl) (Mbbl) (Mbbl) (Mbbl) (Mbbl) (Mbbl) (Mbbl) (Mbbl) (Mbbl)At December 31, 2015 2,034 3,818 5,852 2,034 3,818 5,852 - - - - - -Discoveries - - - - - - - - - - - -Extensions & Improved Recovery 1,105 1,644 2,749 1,105 1,644 2,749 - - - - - -Technical Revisions 178 271 449 178 271 449 - - - - - -Acquisitions - - - - - - - - - - - -Dispositions - - - - - - - - - - - -Economic Factors (4) (6) (10) (4) (6) (10) - - - - - -Production (144) - (144) (144) - (144) - - - - - -At December 31, 2016 3,169 5,727 8,896 3,169 5,727 8,896 - - - - - -
Total Gas (4) Conventional Natural Gas Coal Bed Methane (5) Shale Gas (5)
Proved + Proved + Proved + Proved +Proved Probable P+P (1) (2) Proved Probable Probable Proved Probable Probable Proved Probable Probable Proved Probable ProbableFactors (MMcf) (MMcf) (MMcf) (MMcf) (MMcf) (MMcf) (MMcf) (MMcf) (MMcf) (MMcf) (MMcf) (MMcf)At December 31, 2015 2,170 4,378 6,548 2,170 4,378 6,548 - - - - - -Discoveries - - - - - - - - - - - -Extensions & Improved Recovery 1,011 1,578 2,589 1,011 1,578 2,589 - - - - - -Technical Revisions (129) (460) (589) (129) (460) (589) - - - - - -Acquisitions - - - - - - - - - - - -Dispositions - - - - - - - - - - - -Economic Factors (6) (15) (21) (6) (15) (21) - - - - - -Production (77) - (77) (77) - (77) - - - - - -At December 31, 2016 2,969 5,481 8,450 2,969 5,481 8,450 - - - - - -
Natural Gas Liquids BOEProved + Proved +
Proved Probable P+P (1) (2) Proved Probable Probable Proved Probable ProbableFactors (Mbbl) (Mbbl) (Mbbl) (Mboe) (Mboe) (Mboe)At December 31, 2015 346 698 1,044 2,742 5,246 7,988 Discoveries - - - - - -Extensions & Improved Recovery 141 219 360 1,415 2,127 3,541 Technical Revisions (62) (155) (217) 94 39 134 Acquisitions - - - - - -Dispositions - - - - - -Economic Factors (2) (2) (4) (7) (11) (18)Production (11) - (11) (168) - (168)At December 31, 2016 412 760 1,172 4,076 7,401 11,477
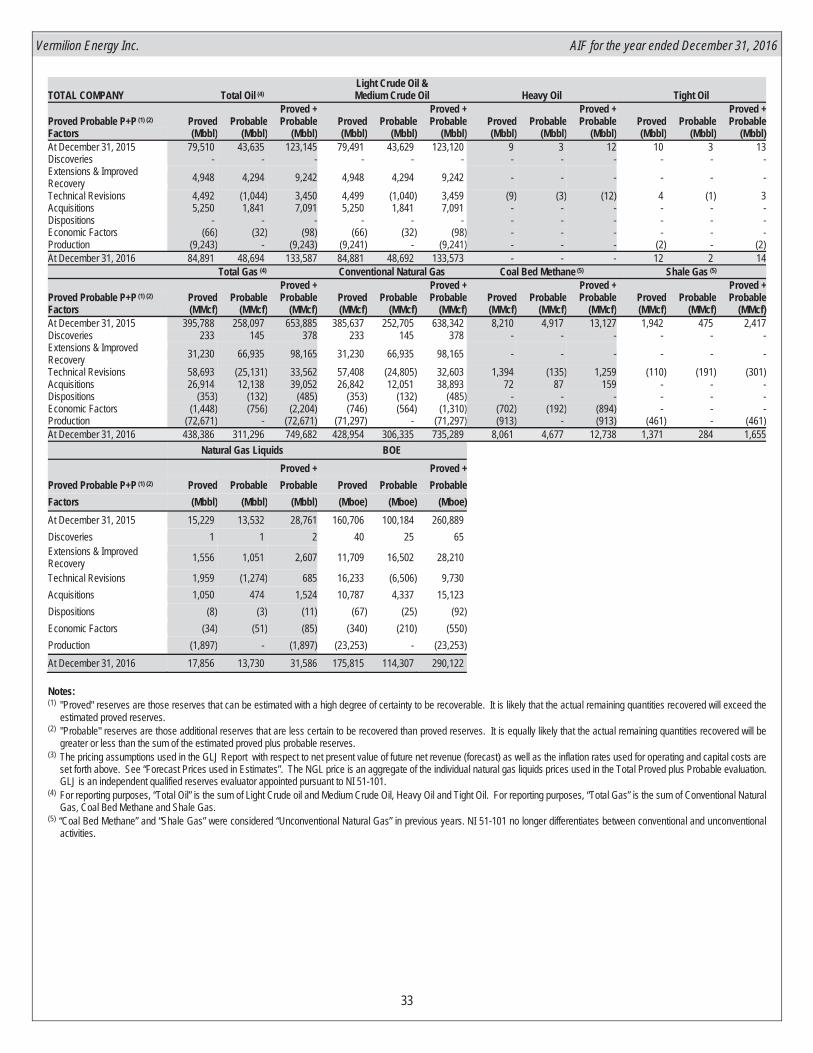
Vermilion Energy Inc. AIF for the year ended December 31, 2016
33
Light Crude Oil &TOTAL COMPANY Total Oil (4) Medium Crude Oil Heavy Oil Tight Oil
Proved + Proved + Proved + Proved +Proved Probable P+P (1) (2) Proved Probable Probable Proved Probable Probable Proved Probable Probable Proved Probable ProbableFactors (Mbbl) (Mbbl) (Mbbl) (Mbbl) (Mbbl) (Mbbl) (Mbbl) (Mbbl) (Mbbl) (Mbbl) (Mbbl) (Mbbl)At December 31, 2015 79,510 43,635 123,145 79,491 43,629 123,120 9 3 12 10 3 13Discoveries - - - - - - - - - - - -Extensions & Improved Recovery 4,948 4,294 9,242 4,948 4,294 9,242 - - - - - -Technical Revisions 4,492 (1,044) 3,450 4,499 (1,040) 3,459 (9) (3) (12) 4 (1) 3Acquisitions 5,250 1,841 7,091 5,250 1,841 7,091 - - - - - -Dispositions - - - - - - - - - - - -Economic Factors (66) (32) (98) (66) (32) (98) - - - - - -Production (9,243) - (9,243) (9,241) - (9,241) - - - (2) - (2)At December 31, 2016 84,891 48,694 133,587 84,881 48,692 133,573 - - - 12 2 14
Total Gas (4) Conventional Natural Gas Coal Bed Methane (5) Shale Gas (5)
Proved + Proved + Proved + Proved +Proved Probable P+P (1) (2) Proved Probable Probable Proved Probable Probable Proved Probable Probable Proved Probable ProbableFactors (MMcf) (MMcf) (MMcf) (MMcf) (MMcf) (MMcf) (MMcf) (MMcf) (MMcf) (MMcf) (MMcf) (MMcf)At December 31, 2015 395,788 258,097 653,885 385,637 252,705 638,342 8,210 4,917 13,127 1,942 475 2,417Discoveries 233 145 378 233 145 378 - - - - - -Extensions & Improved Recovery 31,230 66,935 98,165 31,230 66,935 98,165 - - - - - -Technical Revisions 58,693 (25,131) 33,562 57,408 (24,805) 32,603 1,394 (135) 1,259 (110) (191) (301)Acquisitions 26,914 12,138 39,052 26,842 12,051 38,893 72 87 159 - - -Dispositions (353) (132) (485) (353) (132) (485) - - - - - -Economic Factors (1,448) (756) (2,204) (746) (564) (1,310) (702) (192) (894) - - -Production (72,671) - (72,671) (71,297) - (71,297) (913) - (913) (461) - (461)At December 31, 2016 438,386 311,296 749,682 428,954 306,335 735,289 8,061 4,677 12,738 1,371 284 1,655
Natural Gas Liquids BOEProved + Proved +
Proved Probable P+P (1) (2) Proved Probable Probable Proved Probable ProbableFactors (Mbbl) (Mbbl) (Mbbl) (Mboe) (Mboe) (Mboe)At December 31, 2015 15,229 13,532 28,761 160,706 100,184 260,889 Discoveries 1 1 2 40 25 65Extensions & Improved Recovery 1,556 1,051 2,607 11,709 16,502 28,210
Technical Revisions 1,959 (1,274) 685 16,233 (6,506) 9,730 Acquisitions 1,050 474 1,524 10,787 4,337 15,123 Dispositions (8) (3) (11) (67) (25) (92)Economic Factors (34) (51) (85) (340) (210) (550)Production (1,897) - (1,897) (23,253) - (23,253)At December 31, 2016 17,856 13,730 31,586 175,815 114,307 290,122
Notes:(1) "Proved" reserves are those reserves that can be estimated with a high degree of certainty to be recoverable. It is likely that the actual remaining quantities recovered will exceed the
estimated proved reserves.(2) "Probable" reserves are those additional reserves that are less certain to be recovered than proved reserves. It is equally likely that the actual remaining quantities recovered will be
greater or less than the sum of the estimated proved plus probable reserves.(3) The pricing assumptions used in the GLJ Report with respect to net present value of future net revenue (forecast) as well as the inflation rates used for operating and capital costs are
set forth above. See “Forecast Prices used in Estimates”. The NGL price is an aggregate of the individual natural gas liquids prices used in the Total Proved plus Probable evaluation.GLJ is an independent qualified reserves evaluator appointed pursuant to NI 51-101.
(4) For reporting purposes, “Total Oil” is the sum of Light Crude oil and Medium Crude Oil, Heavy Oil and Tight Oil. For reporting purposes, “Total Gas” is the sum of Conventional NaturalGas, Coal Bed Methane and Shale Gas.
(5) “Coal Bed Methane” and “Shale Gas” were considered “Unconventional Natural Gas” in previous years. NI 51-101 no longer differentiates between conventional and unconventionalactivities.
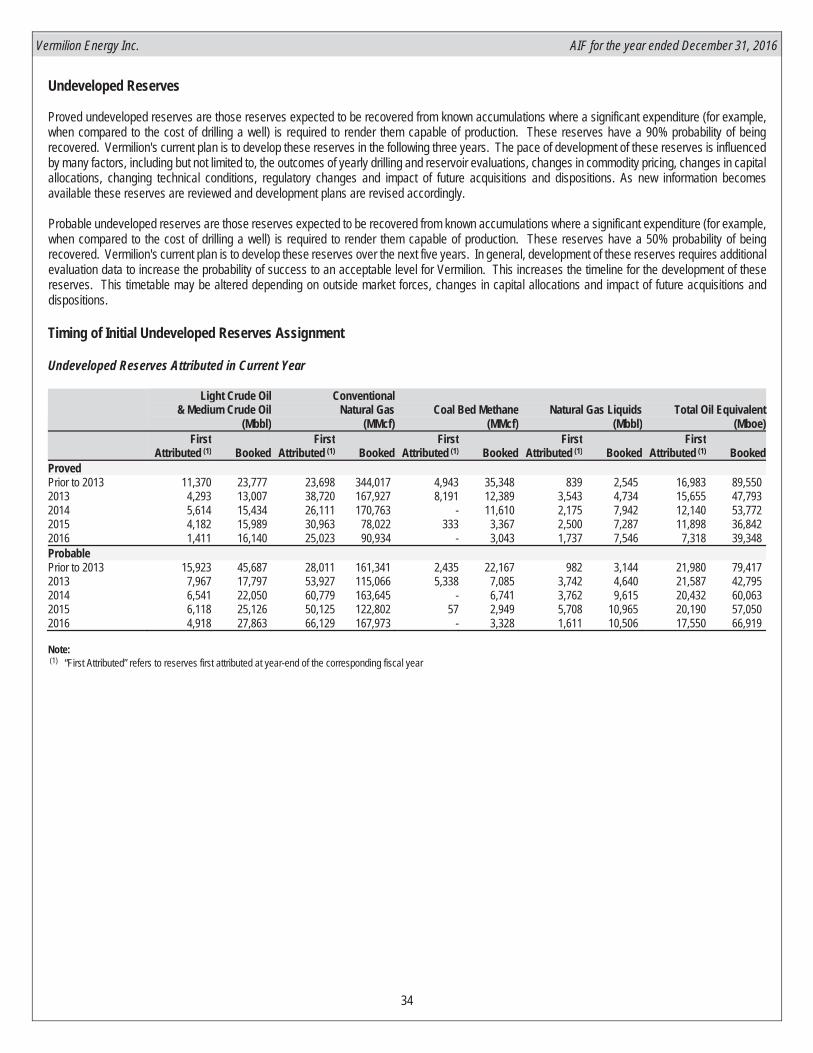
Vermilion Energy Inc. AIF for the year ended December 31, 2016
34
Undeveloped Reserves
Proved undeveloped reserves are those reserves expected to be recovered from known accumulations where a significant expenditure (for example,when compared to the cost of drilling a well) is required to render them capable of production. These reserves have a 90% probability of beingrecovered. Vermilion's current plan is to develop these reserves in the following three years. The pace of development of these reserves is influencedby many factors, including but not limited to, the outcomes of yearly drilling and reservoir evaluations, changes in commodity pricing, changes in capitalallocations, changing technical conditions, regulatory changes and impact of future acquisitions and dispositions. As new information becomesavailable these reserves are reviewed and development plans are revised accordingly.
Probable undeveloped reserves are those reserves expected to be recovered from known accumulations where a significant expenditure (for example,when compared to the cost of drilling a well) is required to render them capable of production. These reserves have a 50% probability of beingrecovered. Vermilion's current plan is to develop these reserves over the next five years. In general, development of these reserves requires additionalevaluation data to increase the probability of success to an acceptable level for Vermilion. This increases the timeline for the development of thesereserves. This timetable may be altered depending on outside market forces, changes in capital allocations and impact of future acquisitions anddispositions.
Timing of Initial Undeveloped Reserves Assignment
Undeveloped Reserves Attributed in Current Year
Light Crude Oil Conventional& Medium Crude Oil Natural Gas Coal Bed Methane Natural Gas Liquids Total Oil Equivalent
(Mbbl) (MMcf) (MMcf) (Mbbl) (Mboe)First First First First First
Attributed (1) Booked Attributed (1) Booked Attributed (1) Booked Attributed (1) Booked Attributed (1) BookedProved Prior to 2013 11,370 23,777 23,698 344,017 4,943 35,348 839 2,545 16,983 89,550 2013 4,293 13,007 38,720 167,927 8,191 12,389 3,543 4,734 15,655 47,793 2014 5,614 15,434 26,111 170,763 - 11,610 2,175 7,942 12,140 53,772 2015 4,182 15,989 30,963 78,022 333 3,367 2,500 7,287 11,898 36,842 2016 1,411 16,140 25,023 90,934 - 3,043 1,737 7,546 7,318 39,348 Probable Prior to 2013 15,923 45,687 28,011 161,341 2,435 22,167 982 3,144 21,980 79,417 2013 7,967 17,797 53,927 115,066 5,338 7,085 3,742 4,640 21,587 42,795 2014 6,541 22,050 60,779 163,645 - 6,741 3,762 9,615 20,432 60,063 2015 6,118 25,126 50,125 122,802 57 2,949 5,708 10,965 20,190 57,050 2016 4,918 27,863 66,129 167,973 - 3,328 1,611 10,506 17,550 66,919
Note:(1) “First Attributed” refers to reserves first attributed at year-end of the corresponding fiscal year

Vermilion Energy Inc. AIF for the year ended December 31, 2016
35
Future Development Costs (1)
The table below sets out the future development costs deducted in the estimation of future net revenue attributable to total proved reserves and totalproved plus probable reserves (using forecast prices and costs).
Total Proved Total Proved Plus Probable(M$) Estimated Using Forecast Prices and Costs Estimated Using Forecast Prices and CostsAustralia2017 9,420 9,420 2018 6,701 6,701 2019 51,052 51,052 2020 2,993 2,993 2021 3,052 57,174 Remainder 25,062 48,320 Total for all years undiscounted 98,280 175,660 Canada2017 77,141 101,695 2018 90,442 126,482 2019 81,623 128,701 2020 95,424 189,622 2021 59,376 175,978 Remainder 17,542 51,883 Total for all years undiscounted 421,548 774,361 France2017 39,113 60,593 2018 29,528 49,613 2019 23,548 107,737 2020 6,753 40,020 2021 14,167 23,931 Remainder 10,363 35,668 Total for all years undiscounted 123,472 317,562 Germany2017 2,183 3,562 2018 584 3,272 2019 8,499 30,655 2020 154 6,863 2021 153 41,162 Remainder 694 3,167 Total for all years undiscounted 12,267 88,681 Ireland2017 1,311 1,311 2018 - -2019 1,706 1,706 2020 16,890 16,890 2021 - -Remainder 15,505 15,505 Total for all years undiscounted 35,412 35,412 Netherlands2017 2,200 7,790 2018 13,525 15,009 2019 604 4,838 2020 385 4,278 2021 287 8,095 Remainder 5,638 5,637 Total for all years undiscounted 22,639 45,647 United States2017 10,500 10,500 2018 18,426 36,468 2019 18,207 48,039 2020 13,506 42,806 2021 - -Remainder - 1

Vermilion Energy Inc. AIF for the year ended December 31, 2016
36
Total for all years undiscounted 60,639 137,814 Total Company2017 141,868 194,871 2018 159,206 237,545 2019 185,239 372,728 2020 136,105 303,472 2021 77,035 306,340 Remainder 74,804 160,181 Total for all years undiscounted 774,257 1,575,137
Note:(1) The pricing assumptions used in the GLJ Report with respect to net present value of future net revenue (forecast) as well as the inflation rates used for operating and capital costs are
set forth above. See “Forecast Prices used in Estimates”. The NGL price is an aggregate of the individual natural gas liquids prices used in the Total Proved plus Probable evaluation.GLJ is an independent qualified reserves evaluator appointed pursuant to NI 51-101.
Vermilion expects to source its capital expenditure requirements from internally generated cash flow and, as appropriate, from Vermilion’s existingcredit facility or equity or debt financing. It is anticipated that costs of funding the future development costs will not impact development of its propertiesor Vermilion’s reserves or future net revenue.
Oil and Gas Properties and Wells (1) (2)
The following table sets forth the number of wells in which Vermilion held a working interest as at December 31, 2016:
Oil GasProducing Non-Producing (5) Producing Non-Producing (5)
Gross Wells (3) Net Wells (4) Gross Wells (3) Net Wells (4) Gross Wells (3) Net Wells (4) Gross Wells (3) Net Wells (4)
CanadaAlberta 471 326 166 99 523 358 405 307Saskatchewan 140 119 22 20 - - - -Total Canada 611 445 188 119 523 358 405 307Australia 18 18 - - - - - -France 336 331 84 83 3 3 - -Germany 141 111 24 11 20 7 6 3Ireland - - - - 6 1 - -Netherlands - - - - 54 37 12 11United States (Wyoming) 11 9 2 1 - - - -Total Vermilion 1,117 914 298 214 606 406 423 321
Notes:(1) Well counts are based on wellbores.(2) Wells for Australia and Ireland are located offshore.(3) "Gross" refers to the total wells in which Vermilion has an interest, directly or indirectly.(4) "Net" refers to the total wells in which Vermilion has an interest, directly or indirectly, multiplied by the percentage working interest owned by Vermilion, directly or indirectly, therein.(5) Non-producing wells include wells which are capable of producing, but which are currently not producing, and are re-evaluated with respect to future commodity prices, proximity to
facility infrastructure, design of future exploration and development programs and access to capital.

Vermilion Energy Inc. AIF for the year ended December 31, 2016
37
Costs Incurred
The following table summarizes the capital expenditures made by Vermilion on oil and gas properties for the year ended December 31, 2016:
Acquisition CostsProved Unproved Exploration Development Total
(M$) Properties Properties Costs Costs CostsAustralia - - - 59,910 59,910 Canada 13,309 - - 62,706 76,015 Croatia - - 2,968 - 2,968 France - - - 68,472 68,472 Germany 48,377 - - 3,803 52,180 Hungary - - 338 - 338Ireland - - - 9,375 9,375 Netherlands 28,259 - - 23,740 51,999 United States 5,935 - - 13,539 19,474 Total 95,880 - 3,306 241,545 340,731
Acreage
The following table summarizes the acreage for the year ended December 31, 2016:
Developed (1) Undeveloped Total TotalGross (2) Net (3) Gross (2) Net (3) Gross (2) Net
Australia 20,164 20,164 39,389 39,389 59,553 59,553 Canada 445,898 328,530 500,251 443,116 946,149 771,646 Croatia - - 2,348,984 2,348,984 2,348,984 2,348,984 France 218,110 208,858 336,595 336,595 554,705 545,453 Germany 67,634 25,798 2,609,304 1,054,905 2,676,938 1,080,703 Hungary - - 322,142 322,142 322,142 322,142 Ireland 7,200 1,300 - - 7,200 1,300 Netherlands 80,725 48,539 1,411,744 792,942 1,492,469 841,481 Slovakia - - 183,000 91,500 183,000 91,500United States 4,368 4,031 104,128 93,121 108,496 97,152 Total 844,099 637,220 7,855,537 5,522,694 8,699,636 6,159,914
Notes:(1) “Developed” means the acreage assigned to productive wells based on applicable regulations.(2) “Gross” means the total acreage in which Vermilion has a working interest, directly or indirectly.(3) “Net” means the total acreage in which Vermilion has a working interest, directly or indirectly, multiplied by the percentage working interest of Vermilion.

Vermilion Energy Inc. AIF for the year ended December 31, 2016
38
Exploration and Development Activities
The following table sets forth the number of development and exploration wells which Vermilion completed during its 2016 financial year:
Exploration Wells Development WellsGross (1) Net (2) Gross (1) Net (2)
AustraliaOil - - 2.0 2.0 Gas - - - -Dry Holes - - - -Total Completed - - 2.0 2.0 CanadaOil - - 9.0 5.6 Gas - - 20.0 12.0 Dry Holes - - - -Total Completed - - 29.0 17.6 FranceOil - - 4.0 4.0 Gas - - - -Dry Holes - - - -Total Completed - - 4.0 4.0 GermanyOil - - - -Gas - - - -Dry Holes - - - -Total Completed - - - -IrelandOil - - - -Gas - - - -Dry Holes - - - -Total Completed - - - -NetherlandsOil - - - -Gas - - 1.0 0.4 Dry Holes - - 1.0 0.5 Total Completed - - 2.0 0.9 United StatesOil - - 1.0 1.0 Gas - - - -Dry Holes - - - -Total Completed - - 1.0 1.0 Total CompanyOil - - 16.0 12.6 Gas - - 21.0 12.4 Dry Holes - - 1.0 0.5 Total Completed - - 38.0 25.5
Notes:(1) "Gross" refers to the total wells in which Vermilion has an interest, directly or indirectly.(2) "Net" refers to the total wells in which Vermilion has an interest, directly or indirectly, multiplied by the percentage working interest owned by Vermilion, directly or indirectly therein.
Please see "Description of the Business - Operating Segments and Description of Properties" for a general description of the Company's current andlikely exploration and development activities.

Vermilion Energy Inc. AIF for the year ended December 31, 2016
39
Properties with No Attributed Reserves
The following table sets out Vermilion's properties with no attributed reserves as at December 31, 2016:
Properties with No Attributed ReservesCountry Gross Acres (1) Net AcresAustralia 31,838 31,838 Canada 244,671 216,726 Croatia 2,348,984 2,348,984 France 229,239 229,239 Germany 2,565,069 1,037,022 Hungary 322,142 322,142 Ireland - -Netherlands 1,367,670 768,187 Slovakia 183,000 91,500United States 95,944 85,802 Total 7,388,557 5,131,440
Notes:(1) "Gross" refers to the total acres in which Vermilion has an interest, directly or indirectly.(2) "Net" refers to the total acres in which Vermilion has an interest, directly or indirectly, multiplied by the percentage working interest owned by Vermilion, directly or indirectly therein.
Vermilion expects its rights to explore, develop and exploit approximately 71,400 (70,100 net) acres in Canada, 2,675 (2,675 net) acres in the UnitedStates, 18,285 (18,285 net) acres in France, and 19,667 (8,845 net) acres in Germany to expire within one year, unless the Company initiates thecapital activity necessary to retain the rights. Work commitments on these lands are categorized as seismic acquisition, geophysical studies or wellcommitments. No such rights are expected to expire within one year for Australia, Croatia, Hungary, Ireland and the Netherlands. Vermilion currentlyhas no material work commitments in Australia, Canada and the United States. Vermilion's work commitments with respect to its European lands heldare estimated to be $15.1 million in the next year.
Vermilion’s properties with no attributed reserves do not have any significant abandonment and reclamation costs in any country other than Canada,which has a net estimated cost of $17.7 million. All properties with no attributed reserves do not have high expected development or operating costsor contractual sales obligations to produce and sell at substantially lower prices than could be realized.

Vermilion Energy Inc. AIF for the year ended December 31, 2016
40
Tax Information
Vermilion pays current taxes in France, the Netherlands and Australia. Corporate income taxes in France and the Netherlands apply to taxable incomeafter eligible deductions. In France, taxable income is taxed at 34.4%. In 2012, the France government enacted a new 3% tax on dividend distributionsmade by entities subject to corporate income tax in France. The tax applies to any dividends paid on or after April 17, 2012 and is not recovered byany tax treaties or deductible for French corporate income tax purposes. In late December 2016, the France government passed legislation, the effectof which will exempt any dividend distributions made by Vermilion after January 1, 2017 from the 3% tax. Vermilion did not pay any dividends from itsFrench entities in 2016. In the Netherlands, current income taxes are applied to taxable income, after eligible deductions and a 10% uplift deductionapplied to operating expenses, eligible general and administration expenses and tax deductions for depletion and abandonment retirement obligations,at a tax rate 50%. As a function of the impact of Vermilion’s tax pools, the Company does not presently pay current taxes in Canada, Germany, Irelandand the United States. The Canadian segment includes holding companies that pay current taxes in foreign jurisdictions.
In Australia, current taxes include both corporate income taxes and PRRT. Corporate income taxes are applied at a rate of approximately 30% ontaxable income after eligible deductions, which include PRRT paid. PRRT is a profit based tax applied at a rate of 40% on sales less eligibleexpenditures, including operating expenses and capital expenditures.
The following table sets forth Vermilion’s tax pools as at December 31, 2016:
(M$) Oil and Gas Assets Tax Losses Other TotalAustralia 276,911 (1) - - - 276,911 Canada 978,949 (1) 489,702 (5) 32,503 1,501,154 France 351,551 (2) 13,360 (6) - 364,911 Germany 190,002 (3) 57,156 (7) 20,306 267,464 Ireland 942,129 (4) 403,779 (5) - 1,345,908 Netherlands 68,139 (3) - - - 68,139 United States 34,885 (1) 30,328 (5) 797 66,010 Total 2,842,566 994,325 53,606 3,890,497
Notes:(1) Deduction calculated using various declining balance rates(2) Deduction calculated using a combination of straight-line over the assets life and unit of production method(3) Deduction calculated using a unit of production method(4) Deduction for current development expenditures and tax losses at 100% against taxable income(5) Tax losses can be carried forward at 100% against taxable income(6) Tax losses carried forward are available to offset the first €1 million of taxable income and 50% of taxable profits in excess each taxation year(7) Tax losses carried forward are available to offset the first €1 million of taxable income and 60% of taxable profits in excess each taxation year

Vermilion Energy Inc. AIF for the year ended December 31, 2016
41
Production Estimates
The following table sets forth the volume of production estimated for the year ended December 31, 2017 as reflected in the estimates of gross provedreserves and gross proved plus probable reserves in the GLJ Report:
Light Crude Oil & Conventional Shale Coal Bed Natural Gas Medium Crude Oil Heavy Oil Tight Oil Natural Gas Natural Gas Methane Liquids BOE
(bbl/d) (bbl/d) (bbl/d) (Mcf/d) (Mcf/d) (Mcf/d) (bbl/d) (boe/d)AustraliaProved 5,791 - - - - - - 5,791 Proved Plus Probable 5,932 - - - - - - 5,932 CanadaProved 5,957 - 4 81,102 551 2,623 6,597 26,604 Proved Plus Probable 6,655 - 5 90,765 569 2,827 7,570 29,923 FranceProved 12,287 - - 1,234 - - - 12,492 Proved Plus Probable 13,288 - - 1,247 - - - 13,496 GermanyProved 1,078 - - 18,170 - - - 4,107 Proved Plus Probable 1,122 - - 19,045 - - - 4,296 IrelandProved - - - 57,175 - - - 9,529 Proved Plus Probable - - - 59,025 - - - 9,838 NetherlandsProved - - - 46,831 - - 81 7,886 Proved Plus Probable - - - 54,155 - - 101 9,127 United StatesProved 570 - - 407 - - 56 694Proved Plus Probable 670 - - 461 - - 64 810Total Proved 25,683 - 4 204,919 551 2,623 6,734 67,103 Total Proved Plus Probable 27,667 - 5 224,698 569 2,827 7,735 73,422

Vermilion Energy Inc. AIF for the year ended December 31, 2016
42
Production History
The following table sets forth certain information in respect of production, product prices received, royalties, production costs and netbacks receivedby Vermilion for each quarter of its most recently completed financial year. Light crude oil and medium crude oil average net prices received in thefollowing table also includes immaterial amounts generated by the sale of heavy oil.
Three Months Ended Three Months Ended Three Months Ended Three Months EndedMarch 31, 2016 June 30, 2016 September 30, 2016 December 31, 2016
AustraliaAverage Daily Production
Light Crude Oil and Medium Crude Oil (bbl/d) 6,180 6,083 6,562 6,388 Conventional Natural Gas (MMcf/d) - - - -Natural Gas Liquids (bbl/d) - - - -
Average Net Prices ReceivedLight Crude Oil and Medium Crude Oil ($/bbl) 46.93 61.53 60.61 69.05 Conventional Natural Gas ($/Mcf) - - - -Natural Gas Liquids ($/bbl) - - - -
RoyaltiesLight Crude Oil and Medium Crude Oil ($/bbl) - - - -Conventional Natural Gas ($/Mcf) - - - -Natural Gas Liquids ($/bbl) - - - -
Production CostsLight Crude Oil and Medium Crude Oil ($/bbl) 17.63 22.08 17.59 26.83 Conventional Natural Gas ($/Mcf) - - - -Natural Gas Liquids ($/bbl) - - - -
Netback ReceivedLight Crude Oil and Medium Crude Oil ($/bbl) 29.30 39.45 43.02 42.22 Conventional Natural Gas ($/Mcf) - - - -Natural Gas Liquids ($/bbl) - - - -
CanadaAverage Daily Production
Light Crude Oil and Medium Crude Oil (bbl/d) 8,231 6,965 6,406 5,004 Conventional Natural Gas (MMcf/d) 97.16 87.44 77.62 75.12 Natural Gas Liquids (bbl/d) 4,719 5,175 5,026 5,385
Average Net Prices Received Light Crude Oil and Medium Crude Oil ($/bbl) 38.94 58.92 54.38 61.97 Conventional Natural Gas ($/Mcf) 1.93 1.34 2.39 3.05 Natural Gas Liquids ($/bbl) 25.32 29.69 32.85 38.59
RoyaltiesLight Crude Oil and Medium Crude Oil ($/bbl) 4.44 4.36 3.33 6.53 Conventional Natural Gas ($/Mcf) 0.08 (0.06) 0.14 0.22 Natural Gas Liquids ($/bbl) 3.50 3.22 4.05 5.70
TransportationLight Crude Oil and Medium Crude Oil ($/bbl) 2.76 2.87 3.12 2.84 Conventional Natural Gas ($/Mcf) 0.16 0.16 0.18 0.18 Natural Gas Liquids ($/bbl) 1.70 1.39 1.82 1.70
Production CostsLight Crude Oil and Medium Crude Oil ($/bbl) 8.87 9.10 10.55 9.91 Conventional Natural Gas ($/Mcf) 1.44 1.06 0.95 1.32 Natural Gas Liquids ($/bbl) 5.24 4.93 5.47 8.94
Netback Received Light Crude Oil and Medium Crude Oil ($/bbl) 22.87 42.59 37.38 42.69 Conventional Natural Gas ($/Mcf) 0.25 0.18 1.12 1.32 Natural Gas Liquids ($/bbl) 14.88 20.15 21.51 22.25

Vermilion Energy Inc. AIF for the year ended December 31, 2016
43
FranceAverage Daily Production
Light Crude Oil and Medium Crude Oil (bbl/d) 12,220 12,326 11,827 11,220 Conventional Natural Gas (MMcf/d) 0.44 0.54 0.42 0.38 Natural Gas Liquids (bbl/d) - - - -
Average Net Prices Received Light Crude Oil and Medium Crude Oil ($/bbl) 43.36 58.19 56.14 63.99 Conventional Natural Gas ($/Mcf) 1.66 1.58 1.58 1.55 Natural Gas Liquids ($/bbl) - - - -
RoyaltiesLight Crude Oil and Medium Crude Oil ($/bbl) 6.09 6.19 6.08 5.95 Conventional Natural Gas ($/Mcf) 0.29 0.39 0.32 0.36 Natural Gas Liquids ($/bbl) - - - -
TransportationLight Crude Oil and Medium Crude Oil ($/bbl) 3.35 3.29 3.09 3.55 Conventional Natural Gas ($/Mcf) - - - -Natural Gas Liquids ($/bbl) - - - -
Production CostsLight Crude Oil and Medium Crude Oil ($/bbl) 12.84 10.55 11.06 10.13 Conventional Natural Gas ($/Mcf) 2.24 2.27 2.55 3.12 Natural Gas Liquids ($/bbl) - - - -
Netback Received Light Crude Oil and Medium Crude Oil ($/bbl) 21.08 38.16 35.91 44.36 Conventional Natural Gas ($/Mcf) (0.87) (1.08) (1.29) (1.93)Natural Gas Liquids ($/bbl) - - - -
GermanyAverage Daily Production
Light Crude Oil and Medium Crude Oil (bbl/d) - - - -Conventional Natural Gas (MMcf/d) 15.96 14.31 14.52 14.80 Natural Gas Liquids (bbl/d) - - - -
Average Net Prices Received - - - -Light Crude Oil and Medium Crude Oil ($/bbl) - - - -Conventional Natural Gas ($/Mcf) 5.30 4.82 5.08 6.09 Natural Gas Liquids ($/bbl) - - - -
Royalties - - - -Light Crude Oil and Medium Crude Oil ($/bbl) - - - -Conventional Natural Gas ($/Mcf) 0.60 0.74 0.18 0.01 Natural Gas Liquids ($/bbl) - - - -
Transportation - - - -Light Crude Oil and Medium Crude Oil ($/bbl) - - - -Conventional Natural Gas ($/Mcf) 0.61 0.81 0.42 0.28 Natural Gas Liquids ($/bbl) - - - -
Production Costs - - - -Light Crude Oil and Medium Crude Oil ($/bbl) - - - -Conventional Natural Gas ($/Mcf) 1.79 1.92 2.49 2.91 Natural Gas Liquids ($/bbl) - - - -
Netback Received - - - -Light Crude Oil and Medium Crude Oil ($/bbl) - - - -Conventional Natural Gas ($/Mcf) 2.30 1.35 1.99 2.89 Natural Gas Liquids ($/bbl) - - - -
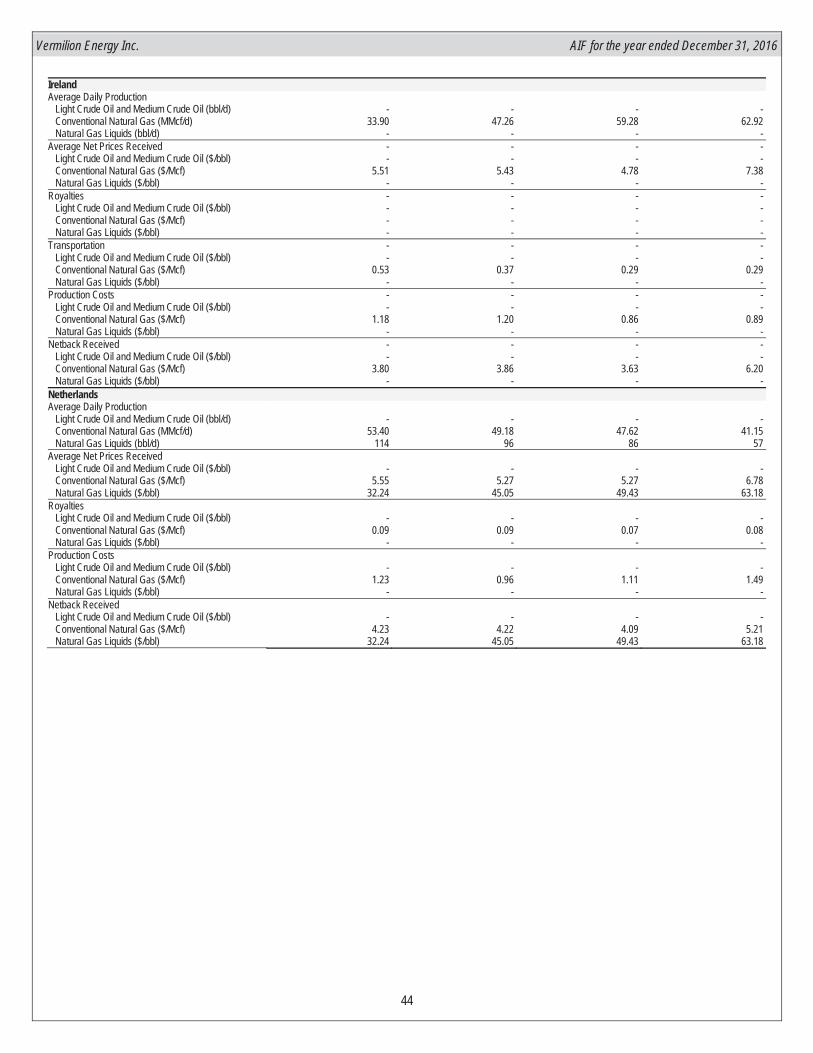
Vermilion Energy Inc. AIF for the year ended December 31, 2016
44
IrelandAverage Daily Production
Light Crude Oil and Medium Crude Oil (bbl/d) - - - -Conventional Natural Gas (MMcf/d) 33.90 47.26 59.28 62.92 Natural Gas Liquids (bbl/d) - - - -
Average Net Prices Received - - - -Light Crude Oil and Medium Crude Oil ($/bbl) - - - -Conventional Natural Gas ($/Mcf) 5.51 5.43 4.78 7.38 Natural Gas Liquids ($/bbl) - - - -
Royalties - - - -Light Crude Oil and Medium Crude Oil ($/bbl) - - - -Conventional Natural Gas ($/Mcf) - - - -Natural Gas Liquids ($/bbl) - - - -
Transportation - - - -Light Crude Oil and Medium Crude Oil ($/bbl) - - - -Conventional Natural Gas ($/Mcf) 0.53 0.37 0.29 0.29 Natural Gas Liquids ($/bbl) - - - -
Production Costs - - - -Light Crude Oil and Medium Crude Oil ($/bbl) - - - -Conventional Natural Gas ($/Mcf) 1.18 1.20 0.86 0.89 Natural Gas Liquids ($/bbl) - - - -
Netback Received - - - -Light Crude Oil and Medium Crude Oil ($/bbl) - - - -Conventional Natural Gas ($/Mcf) 3.80 3.86 3.63 6.20 Natural Gas Liquids ($/bbl) - - - -
NetherlandsAverage Daily Production
Light Crude Oil and Medium Crude Oil (bbl/d) - - - -Conventional Natural Gas (MMcf/d) 53.40 49.18 47.62 41.15 Natural Gas Liquids (bbl/d) 114 96 86 57
Average Net Prices ReceivedLight Crude Oil and Medium Crude Oil ($/bbl) - - - -Conventional Natural Gas ($/Mcf) 5.55 5.27 5.27 6.78 Natural Gas Liquids ($/bbl) 32.24 45.05 49.43 63.18
RoyaltiesLight Crude Oil and Medium Crude Oil ($/bbl) - - - -Conventional Natural Gas ($/Mcf) 0.09 0.09 0.07 0.08 Natural Gas Liquids ($/bbl) - - - -
Production CostsLight Crude Oil and Medium Crude Oil ($/bbl) - - - -Conventional Natural Gas ($/Mcf) 1.23 0.96 1.11 1.49 Natural Gas Liquids ($/bbl) - - - -
Netback ReceivedLight Crude Oil and Medium Crude Oil ($/bbl) - - - -Conventional Natural Gas ($/Mcf) 4.23 4.22 4.09 5.21 Natural Gas Liquids ($/bbl) 32.24 45.05 49.43 63.18

Vermilion Energy Inc. AIF for the year ended December 31, 2016
45
United StatesAverage Daily Production
Light Crude Oil and Medium Crude Oil (bbl/d) 368 458 383 362 Conventional Natural Gas (MMcf/d) 0.26 0.20 0.20 0.18 Natural Gas Liquids (bbl/d) 39 26 30 23
Average Net Prices Received Light Crude Oil and Medium Crude Oil ($/bbl) 35.80 52.56 51.29 59.09 Conventional Natural Gas ($/Mcf) 0.67 0.37 0.64 1.93 Natural Gas Liquids ($/bbl) 4.81 3.25 5.14 19.48
RoyaltiesLight Crude Oil and Medium Crude Oil ($/bbl) 10.47 15.47 14.69 17.24 Conventional Natural Gas ($/Mcf) 0.40 0.18 0.39 1.72 Natural Gas Liquids ($/bbl) 2.70 5.21 (0.11) 4.51
TransportationLight Crude Oil and Medium Crude Oil ($/bbl) - - - -Conventional Natural Gas ($/Mcf) - - - -Natural Gas Liquids ($/bbl) - - - -
Production CostsLight Crude Oil and Medium Crude Oil ($/bbl) 8.33 7.22 12.27 9.04 Conventional Natural Gas ($/Mcf) - - - -Natural Gas Liquids ($/bbl) - - - -
Netback Received Light Crude Oil and Medium Crude Oil ($/bbl) 17.00 29.87 24.33 32.81 Conventional Natural Gas ($/Mcf) 0.27 0.19 0.25 0.21 Natural Gas Liquids ($/bbl) 2.11 (1.96) 5.25 14.97
Total Average Daily Production
Light Crude Oil and Medium Crude Oil (bbl/d) 26,999 25,832 25,178 22,974 Conventional Natural Gas (MMcf/d) 201.11 198.93 199.65 194.54 Natural Gas Liquids (bbl/d) 4,872 5,297 5,142 5,465
Average Net Prices ReceivedLight Crude Oil and Medium Crude Oil ($/bbl) 42.59 59.09 56.96 65.90 Conventional Natural Gas ($/Mcf) 3.76 3.53 3.98 5.47 Natural Gas Liquids ($/bbl) 25.32 29.84 32.96 38.80
RoyaltiesLight Crude Oil and Medium Crude Oil ($/bbl) 4.50 4.35 3.77 4.87 Conventional Natural Gas ($/Mcf) 0.11 0.05 0.09 0.10 Natural Gas Liquids ($/bbl) 3.44 3.22 3.99 5.68
Transportation CostsLight Crude Oil and Medium Crude Oil ($/bbl) 2.49 2.32 2.15 2.50 Conventional Natural Gas ($/Mcf) 0.22 0.22 0.19 0.19 Natural Gas Liquids ($/bbl) 1.65 1.36 1.78 1.67
Production CostsLight Crude Oil and Medium Crude Oil ($/bbl) 12.49 12.87 12.86 14.45 Conventional Natural Gas ($/Mcf) 1.37 1.13 1.08 1.34 Natural Gas Liquids ($/bbl) 5.09 4.81 5.34 8.79
Netback ReceivedLight Crude Oil and Medium Crude Oil ($/bbl) 23.11 39.55 38.18 44.08 Conventional Natural Gas ($/Mcf) 2.06 2.13 2.62 3.84 Natural Gas Liquids ($/bbl) 15.14 20.45 21.85 22.66

Vermilion Energy Inc. AIF for the year ended December 31, 2016
46
Marketing
The nature of Vermilion’s operations results in exposure to fluctuations in commodity prices, interest rates and foreign currency exchange rates.Vermilion monitors and, when appropriate, uses derivative financial instruments to manage its exposure to these fluctuations. All transactions of thisnature entered into by Vermilion are related to an underlying financial position or to future crude oil and natural gas production. Vermilion does not usederivative financial instruments for speculative purposes. Vermilion has not obtained collateral or other security to support its financial derivatives asmanagement reviews the creditworthiness of its counterparties prior to entering into derivative contracts.
During the normal course of business, Vermilion may also enter into fixed price arrangements to sell a portion of its production or purchase commoditiesfor operational use.
Vermilion’s outstanding risk management positions as at December 31, 2016 are summarized in Supplemental Table 2: Hedges, included in theCompany’s 2016 Management’s Discussion and Analysis, dated February 24, 2017, available on SEDAR at www.sedar.com, under Vermilion’sSEDAR profile.

Vermilion Energy Inc. AIF for the year ended December 31, 2016
47
DIRECTORS AND OFFICERS
As at January 31, 2017, the directors and officers of Vermilion, as a group, beneficially owned, or controlled or directed, directly or indirectly, 3,903,713 common shares representing approximately 3.3% of the issued and outstanding common shares.
Set forth below is certain information respecting the current directors and officers of Vermilion. References to Vermilion in the following tables for dates prior to the Conversion Arrangement refer to VRL and to the Company following the date of the Conversion Arrangement.
Directors
Vermilion’s board of directors currently consists of ten directors. The directors are nominated by the Company and elected annually by Shareholders and hold office until the next annual meeting of Shareholders, or until their successors are elected or appointed.
Name and Municipality of Residence Committee(s) Office Held
Year First Elected or Appointed as Director Principal Occupation During the Past Five Years
Lorenzo DonadeoCalgary, AlbertaCanada
(1) Chairman of the Board
1994 Since March 1, 2016, Chairman of the Board of Vermilion
March 2014 – March 1, 2016 Chief Executive Officer of Vermilion
2003 – March 2014, President and Chief Executive Officer of VermilionClaudio A. Ghersinich Calgary, AlbertaCanada
(3) (6) Director 1994 Since 2011, Chairman of ArPetrol Ltd., a public oil and gas company
Since 2010, Director of Valeura Energy Inc., a public oil and gas company
Since 2005, President of Carrera Investments Corp., a private investment company
Loren M. Leiker Houston, TexasUSA
(6) Director 2012 Since 2014, Director of Navitas Midstream Partners LLC
Since 2012, Director of SM Energy, a public energy company
2012 to 2015, Director of Midstates Petroleum, a public exploration and production company
2008 to 2011, Senior Executive VP Exploration, EOG Resources, a public oil and gas company
Larry J. MacdonaldOkotoks, AlbertaCanada
(2) (3) (4) (5) (6) Lead Director 2002 Since March 1, 2016, Lead Director of Vermilion
2012 to March 1, 2016, Chairman of the Board of Vermilion
2012 to 2016, Chairman Northpoint Resources, a private oil and gas company
Since 2003, Chairman & Chief Executive Officer and Director of Point Energy Ltd., a private oil and gas company
2006 to 2013, Director of Sure Energy Inc.
William F. MadisonSugar Land, TexasUSA
(5) (6) Director 2004 Since 2011, Director of Montana Tech Foundation, an independent, non-profit organization
Since 2007, Director of Canadian Oil Recovery and Remediation Enterprise, Inc., a public oil recovery and remediation company
Timothy R. MarchantCalgary, AlbertaCanada
(5) (6) Director 2010 Since 2015, Director, Valeura Energy Inc., a public oil and gas company
Since 2013, Non-Executive Director of Cub Energy Inc., a public oil and gas company
Since 2009, Adjunct Professor of Strategy and Energy Geopolitics, Haskayne School of Business
2011 to 2013, Executive Chair of Anatolia Energy Corp., a public oil and gas company
Anthony W. MarinoCalgary, AlbertaCanada
President & ChiefExecutive Officer and Director
2016 Since March 1, 2016, President and Chief Executive Officer
March 2014 – March 1, 2016, President and Chief Operating Officer of Vermilion
June 2012 – March 2014, Executive Vice President and Chief Operating Officer of Vermilion
2009 to 2012, Director, President & CEO, Baytex Energy Corporation, a public oil and gas company

Vermilion Energy Inc. AIF for the year ended December 31, 2016
48
Robert Michaleski Calgary, AlbertaCanada
(3) Director 2016 Since 2013, Director of United Way of Calgary and Area, a non-profit organization
2012 to 2013, Chief Executive Officer of Pembina Pipeline Corporation, a public energy transportation company
2000 to 2012, President and Chief Executive Officer of Pembina Pipeline Corporation
Since 2012, Director of Essential Energy Services Ltd., a public oilfield services company
Since 2003, Director of Coril Holdings Ltd., a private investment company
Since 2000, Director of Pembina Pipeline CorporationSarah E. RaissCalgary, AlbertaCanada
(4) (5) Director 2014 Since 2016, Director, Ritchie Bros. Auctioneers, a public heavy equipment auction company.
Since 2014, Director, Loblaw Companies Limited, a public food distributor company
Since 2011, Director, Commercial Metals Company, a public global, metals recycling, manufacturing, fabricating and trading company
2012 to 2015, Board Chair, Alberta Electric Systems Operator, a not-for-profit entity responsible for the planning and operation of the Alberta Interconnected Electric System
2012 to February 2016, Director, Canadian Oil Sands Limited, a public oil company
2009 to 2014, Director, Shoppers Drug Mart Corporation, a public pharmacy products and services company
Catherine L. WilliamsCalgary, AlbertaCanada
(3) (4) Director 2015 Since 2016, Director of Enbridge Income Fund, an energy infrastructure asset investment vehicle
Since 2015, Director of Enbridge Pipelines Inc., a subsidiary of Enbridge Inc., a public energy transportation company
Since 2015, Trustee of Enbridge Commercial Trust, a subsidiary of Enbridge Inc., a public energy transportation company
Since 2015, Director of Enbridge Income Partners GP Inc., a subsidiary of Enbridge Inc., a public energy transportation company
Since 2010, Chair of Human Resources and Compensation Committee, Enbridge Inc., a public energy transportation company
Since 2007, Director of Enbridge Inc., a public energy transportation company
Since 2007, Owner and Managing Director, Options Canada Ltd., a private investment company
2009 to 2014, Director, Alberta Investment Management Corporation, an institutional investment fund manager
2009 to 2012, Director, Tim Hortons Inc., a publicly-traded restaurant chain in North America
Committees:(1) Chairman of the Board (2) Lead Director (3) Member of the Audit Committee(4) Member of the Governance and Human Resources Committee(5) Member of the Health, Safety and Environment Committee (6) Member of the Independent Reserves Committee

Vermilion Energy Inc. AIF for the year ended December 31, 2016
49
Officers
Name and Municipality of Residence Office Held Principal Occupation During the Past Five YearsAnthony W. MarinoCalgary, AlbertaCanada
President & Chief Executive Officer
Since March 1, 2016, President and Chief Executive Officer
March 2014 – March 1, 2016, President and Chief Operating Officer of Vermilion
June 2012 – March 2014, Executive Vice President and Chief Operating Officer of Vermilion
2009 to 2012, Director, President & CEO, Baytex Energy Corporation, a public oil and gas company
Curtis W. HicksCalgary, AlbertaCanada
Executive Vice President& Chief Financial Officer
Since 2004, Executive Vice President and Chief Financial Officer of Vermilion
Mona JasinskiCalgary, AlbertaCanada
Executive Vice PresidentPeople & Culture
Since February 2015, Executive Vice President, People and Culture
2011 to 2015, Executive Vice President People of Vermilion
Michael KaluzaCalgary, AlbertaCanada
Executive Vice President & Chief Operating Officer
Since March 1, 2016, Executive Vice President and Chief Operating Officer
May 2014 – March 1, 2016, Vice President, Canada Business Unit of Vermilion
2013 to 2014, Director Canada Business Unit of Vermilion
2012 to 2013, Vice President, Corporate Development and Planning, Baytex Energy Corporation, a public oil and gas company
2011 to 2012, Vice President, Planning, Baytex Energy Corporation, a public oil and gas company
Anthony (Dion) HatcherCalgary, AlbertaCanada
Vice President Canada Business Unit
Since March 1, 2016, Vice President Canada Business Unit
May 1, 2014 to March 1, 2016, Director Alberta Foothills – Canada Business Unit
February 2013 to May 2014, Cardium / LRG Development Manager
January 2010 to February 2013 – Cardium Development Manager
Terry HergottCalgary, AlbertaCanada
Vice PresidentMarketing
Since April 2012, Vice President, Marketing of Vermilion
1998 to 2012, Canadian Supply and Trading Manager, Marathon Petroleum Corp.
Gerard SchutDen HaagThe Netherlands
Vice PresidentEuropean Operations
Since July 2012, Vice President European Operations of Vermilion
August 2006 to May 2012, General Manager, Chevron Exploration and Production Netherlands, a subsidiary of Chevron Corporation, a public oil and gas company
Robert J. Engbloom, Q.C.Calgary, AlbertaCanada
Corporate Secretary Since January 2015, senior partner with Norton Rose Fulbright Canada LLP, a law firm
2012 to 2014, partner with and Deputy Chair of Norton Rose Fulbright Canada LLP, a law firm
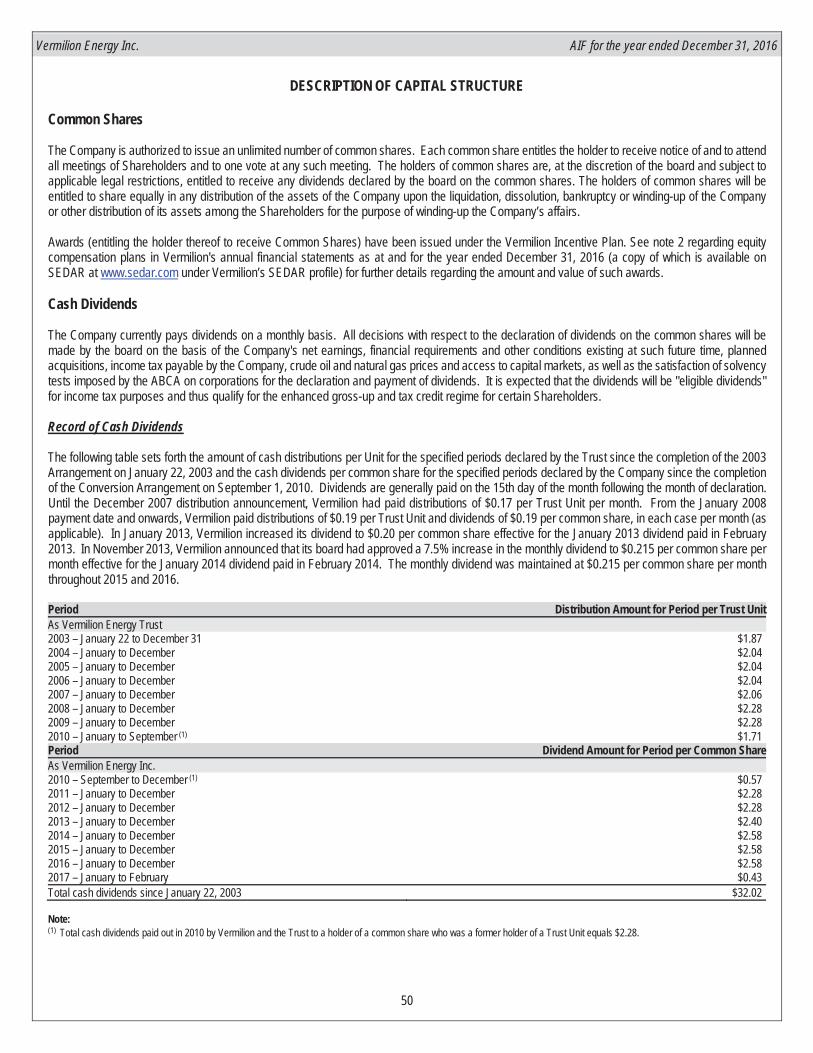
Vermilion Energy Inc. AIF for the year ended December 31, 2016
50
DESCRIPTION OF CAPITAL STRUCTURE
Common Shares
The Company is authorized to issue an unlimited number of common shares. Each common share entitles the holder to receive notice of and to attendall meetings of Shareholders and to one vote at any such meeting. The holders of common shares are, at the discretion of the board and subject toapplicable legal restrictions, entitled to receive any dividends declared by the board on the common shares. The holders of common shares will beentitled to share equally in any distribution of the assets of the Company upon the liquidation, dissolution, bankruptcy or winding-up of the Companyor other distribution of its assets among the Shareholders for the purpose of winding-up the Company’s affairs.
Awards (entitling the holder thereof to receive Common Shares) have been issued under the Vermilion Incentive Plan. See note 2 regarding equitycompensation plans in Vermilion's annual financial statements as at and for the year ended December 31, 2016 (a copy of which is available onSEDAR at www.sedar.com under Vermilion’s SEDAR profile) for further details regarding the amount and value of such awards.
Cash Dividends
The Company currently pays dividends on a monthly basis. All decisions with respect to the declaration of dividends on the common shares will bemade by the board on the basis of the Company's net earnings, financial requirements and other conditions existing at such future time, plannedacquisitions, income tax payable by the Company, crude oil and natural gas prices and access to capital markets, as well as the satisfaction of solvencytests imposed by the ABCA on corporations for the declaration and payment of dividends. It is expected that the dividends will be "eligible dividends"for income tax purposes and thus qualify for the enhanced gross-up and tax credit regime for certain Shareholders.
Record of Cash Dividends
The following table sets forth the amount of cash distributions per Unit for the specified periods declared by the Trust since the completion of the 2003Arrangement on January 22, 2003 and the cash dividends per common share for the specified periods declared by the Company since the completionof the Conversion Arrangement on September 1, 2010. Dividends are generally paid on the 15th day of the month following the month of declaration.Until the December 2007 distribution announcement, Vermilion had paid distributions of $0.17 per Trust Unit per month. From the January 2008payment date and onwards, Vermilion paid distributions of $0.19 per Trust Unit and dividends of $0.19 per common share, in each case per month (asapplicable). In January 2013, Vermilion increased its dividend to $0.20 per common share effective for the January 2013 dividend paid in February2013. In November 2013, Vermilion announced that its board had approved a 7.5% increase in the monthly dividend to $0.215 per common share permonth effective for the January 2014 dividend paid in February 2014. The monthly dividend was maintained at $0.215 per common share per monththroughout 2015 and 2016. Period Distribution Amount for Period per Trust UnitAs Vermilion Energy Trust2003 – January 22 to December 31 $1.87 2004 – January to December $2.04 2005 – January to December $2.04 2006 – January to December $2.04 2007 – January to December $2.06 2008 – January to December $2.28 2009 – January to December $2.28 2010 – January to September (1) $1.71 Period Dividend Amount for Period per Common ShareAs Vermilion Energy Inc. 2010 – September to December (1) $0.57 2011 – January to December $2.28 2012 – January to December $2.28 2013 – January to December $2.40 2014 – January to December $2.58 2015 – January to December $2.58 2016 – January to December $2.58 2017 – January to February $0.43 Total cash dividends since January 22, 2003 $32.02
Note:(1) Total cash dividends paid out in 2010 by Vermilion and the Trust to a holder of a common share who was a former holder of a Trust Unit equals $2.28.

Vermilion Energy Inc. AIF for the year ended December 31, 2016
51
Premium Dividend™ and Dividend Reinvestment Plan
Under the Premium Dividend™ and Dividend Reinvestment Plan (the “Plan”), Eligible Shareholders who elect to participate in the DividendReinvestment Component can reinvest their dividends in common shares at a discount to the Average Market Price (with no broker commissions ortrading costs), similar to our previous Dividend Reinvestment Plan (Vermilion’s Amended and Restated Dividend Reinvestment Plan dated effectiveSeptember 1, 2010 as amended effective February 27, 2014 (the “Previous DRIP”). The discount to the Average Market Price was 3% during 2016and effective January 1, 2017 the discount is 2%.
Under the Premium Dividend™ Component, Eligible Shareholders have the option to reinvest their dividends in common shares which are exchangedfor a premium cash payment equal to 101.5% of the reinvested dividends. Under the Premium Dividend™ Component, shares are issued at a 3.5%discount to the Average Market Price. The shares are sold at prevailing market prices by the Plan Broker (Canaccord Genuity Corporation), whoprovides participating Shareholders with a premium cash payment equal to 101.5% of their dividends, while the Plan Broker retains the balance of thediscount as its fee.
Eligible Shareholders are not required to participate in the Plan. Eligible Shareholders who have not elected to participate in the Plan willcontinue to receive their regular cash dividends in the usual manner.
The total cost of equity issuance to Vermilion under the Dividend Reinvestment Component and the Premium Dividend™ Component of the Plan is2% and 3.5%, respectively, providing Vermilion with access to a low cost source of equity capital. The Premium Dividend™ Component of the planwas implemented as a short-term measure to maintain Vermilion's financial strength during the commodity price downturn which began in mid-2014.Commencing with the October dividend payment, the Company began proration of the Premium DividendTM Component of the Plan by 25%. Vermilionsubsequently increased the proration factor applied to the Premium DividendTM Component to 50% commencing with the January 2017 dividendpayment. In February 2017, the Company announced a further increase in the proration factor to 75% commencing with the April 2017 dividendpayment. Subject to unexpected changes in the commodity price outlook, Vermilion intends to discontinue the Premium DividendTM Componentbeginning with the July 2017 dividend payment, such that there would be no further equity issuance under this program.
Each component of the Plan, which is explained in greater detail in the complete Plan document available on Vermilion’s corporate website atwww.vermilionenergy.com (under the heading “Investor Relations” subheading “DRIP”), is subject to eligibility restrictions, applicable withholding taxes,prorating as provided for in the Plan, and other limitations on the availability of common shares to be issued or purchased in certain events. OnlyCanadian-resident Shareholders may participate in the Premium DividendTM Component of the Plan. The Dividend Reinvestment Component of thePlan is available to Canadian residents and non-U.S. resident foreign Shareholders who meet certain eligibility criteria as set forth in the completePlan. U.S. resident Shareholders are not currently permitted to participate in either component of the Plan due to the requirement, under U.S. securitiesregulations, to maintain a continuous shelf registration for issuance of new equity to U.S. Shareholders. At this time, Vermilion has not put in placethe required shelf registration due to the high cost of establishing and maintaining such a shelf registration.
TM denotes trademark of Canaccord Genuity Capital Corporation.
Shareholder Rights Plan
Vermilion has a shareholder rights plan (the "Shareholder Rights Plan") to ensure that, to the extent possible, all Shareholders are treated equally andfairly in connection with any takeover bid for the Company. The Shareholder Rights Plan discourages coercive hostile takeover bids by creating thepotential that any Common Shares which may be acquired or held by such a bidder will be significantly diluted. Pursuant to the Shareholder RightsPlan, one right (a "Right") has been issued by the Company in respect of each Common Share that is outstanding prior to the time the Rights separatefrom the Common Shares (the "Separation Time"). The Separation Time would occur at the time of an unsolicited take-over bid whereby a personacquires or attempts to acquire 20% or more of the Company's Common Shares. Until the Separation Time, the rights are not exercisable or dilutive.The Rights do not change the manner in which Shareholders currently trade their Common Shares and no separate Rights certificates are issued. Onor after the Separation Time, each Right would permit the holder, other than 20% acquirer, to purchase Common Shares at a substantial discount tothe prevailing market price unless the application of the Rights Plan is waived by the Board of Directors.
Vermilion initially adopted a unitholder rights plan in 2003, which was subsequently renewed and approved by unitholders in 2006 and 2009. Inconjunction with the conversion of the Trust to a corporation on September 1, 2010, the Shareholder Rights Plan was approved and subsequentlyreapproved by Shareholders in 2013 and 2016. The Shareholder Rights Plan must be reapproved at every third annual meeting of Shareholders.
The foregoing summary is qualified in its entirety by reference to the Shareholder Rights Plan Agreement, a copy of which is available on SEDAR atwww.sedar.com under Vermilion's SEDAR profile.

Vermilion Energy Inc. AIF for the year ended December 31, 2016
52
MARKET FOR SECURITIES
The outstanding common shares of the Company are listed and posted for trading on the TSX and the NYSE under the symbol VET. The followingtable sets forth the closing price range and trading volume of the common shares on the TSX for the periods indicated: 2016 High Low Close Volume January $38.18 $29.71 $37.46 10,885,419 February $37.80 $31.56 $36.80 8,931,986 March $42.69 $36.53 $38.01 9,440,829 April $44.21 $34.86 $43.15 14,172,944 May $44.81 $39.92 $43.39 10,202,589 June $47.34 $39.31 $41.14 11,331,250 July $44.08 $39.88 $43.50 7,690,280 August $50.04 $42.11 $47.39 9,611,763 September $51.25 $45.35 $50.82 9,974,099 October $55.26 $50.41 $52.60 9,399,239 November $55.20 $50.83 $54.49 7,402,679 December $58.98 $54.90 $56.49 6,035,617 2017 High Low Close Volume January $57.98 $52.79 $53.68 5,456,428

Vermilion Energy Inc. AIF for the year ended December 31, 2016
53
AUDIT COMMITTEE MATTERS
Audit Committee Charter
Vermilion has established an audit committee (the "Audit Committee") to assist the board of directors in carrying out its oversight responsibilities with respect to, among other things, financial reporting, internal controls and the external audit process of the Company. The Audit Committee Terms of Reference are set out in Schedule "D" to this annual information form.
Composition of the Audit Committee
The following table sets forth the name of each current member of the Audit Committee, whether pursuant to applicable securities legislation, such member is considered independent, whether pursuant to applicable securities legislation, such member is considered financially literate and the relevant education and experience of such member.
Name IndependentFinancially
Literate Relevant Education and ExperienceCatherine L. Williams(Chair)
Yes Yes Ms. Williams has a Bachelor of Arts degree from University of Western Ontario and a Masters in Business Administrationfrom the Queen’s University. Ms. Williams brings 31 years of oil and gas industry experience, with an extensive background in finance, mergers and acquisitions, and business management. Ms. Williams is currently the Owner and Managing Director of Options Canada Ltd. (since 2007) and serves as a Board member of Enbridge Inc. (since 2010) and Chairs its Human Resources and Compensation Committee. She was a Board member of Alberta Investment Management Corporation from 2009 to 2014 and Tim Hortons Inc. from 2009 to 2012. From 2003 to 2007, Ms. Williams held the role of Chief Financial Officer for Shell Canada Ltd., prior to which she held various positions with Shell Canada Limited, Shell Europe Oil Products, Shell Canada Oil Products and Shell International (1984 to 2003).
Claudio A. Ghersinich Yes Yes Mr. Ghersinich holds a B.Sc. Civil Engineering degree from the University of Manitoba. Mr. Ghersinich has obtained financial experience and exposure to accounting and financial issues in a role as a founder of Vermilion Resources Ltd. in 1994 and as an audit committee member of other public companies.
Larry J. Macdonald Yes Yes Mr. Macdonald holds a Bachelor of Science degree from the University of Alberta. He has more than 46 years of experience in the oil and gas industry, with an extensive background in leadership, strategy and growth, finance, exploration, corporate relations and marketing. Mr. Macdonald completed the Executive Management Program at the Wharton Business School at the University of Pennsylvania in 1993 and attended a Financial Literacy Course at the Rotman Business School at the University of Toronto in coordination with the Institute of Corporate Directors. Currently, he is theChairman and Chief Executive Officer (since 2003) of Point Energy Ltd., a private oil and gas exploration company. From 2012 to 2016, he was Chairman of Northpoint Resources. From 2003 to 2006, he was a Managing Director of Northpoint Energy Ltd., and from 2006 to 2013 a director of Sure Energy Inc. Previously, he was the Chairman and Chief Executive Officer of Pointwest Energy Inc. and President and Chief Operating Officer of Anderson Exploration Ltd. He began his career with PanCanadian Petroleum Limited in 1969 (until 1977) and later worked for several exploration firms.
Robert Michaleski Yes Yes Mr. Michaleski holds a Bachelor of Commerce (Honours) degree from the University of Manitoba and is a Chartered Accountant. He has over 30 years of experience in various senior management and executive capacities at Pembina Pipeline Corporation. He was Chief Executive Officer from 2000 to 2013 and also President from 2000 to 2012. He was Vice President and Chief Financial Officer from 1997 to 2000, Vice President of Finance from 1992 to 1997, Controller from 1980 to 1992, and Manager of Internal Audit from 1978 to 1980. He has been a Director of Pembina since 2000, a Director of Essential Energy Services Ltd. since 2012, and a Director of Coril Holdings Ltd. since 2003. He is a member of the Institute of Corporate Directors.
External Audit Service Fees
Prior to the commencement of any work, fees for all audit and non-audit services provided by the Company’s auditors must be approved by the Audit Committee.
During the years ended December 31, 2016 and 2015, Deloitte LLP, the auditors of the Company, received the following fees from the Company: Item 2016 2015Audit fees (1) $1,545,495 $1,560,759 Audit-related fees (2) $18,325 $80,698 Tax fees (3) $57,614 $55,020
Notes:(1) Audit fees consisted of professional services rendered by Deloitte LLP for the audit of the Company's financial statements for the years ended December 31, 2016 and 2015.(2) Audit-related fees billed by Deloitte LLP for assurance and related services that are reasonably related to the performance of the audit or review of Vermilion’s financial statements, but
which are not included in the audit fees.(3) Tax fees consist of fees for tax compliance services in various jurisdictions.

Vermilion Energy Inc. AIF for the year ended December 31, 2016
54
CONFLICTS OF INTEREST
The directors and officers of Vermilion are engaged in and will continue to engage in other activities in the oil and natural gas industry and, as a result of these and other activities, the directors and officers of Vermilion may become subject to conflicts of interest. The ABCA provides that in the event that a director has an interest in a contract or proposed contract or agreement, the director shall disclose his interest in such contract or agreement and shall refrain from voting on any matter in respect of such contract or agreement unless otherwise provided under the ABCA. To the extent that conflicts of interest arise, such conflicts will be resolved in accordance with the provisions of the ABCA.
As at the date hereof, Vermilion is not aware of any existing or potential material conflicts of interest between Vermilion and a director or officer of Vermilion.
INTEREST OF MANAGEMENT AND OTHERS IN MATERIAL TRANSACTIONS
No director or officer of the Company, nor any other insider of the Company, nor their associates or affiliates has or has had, at any time within the three most recently completed financial years ending December 31, 2016, any material interest, direct or indirect, in any transaction or proposed transaction that has materially affected or would materially affect the Company.
LEGAL PROCEEDINGS
The Company is not party to any significant legal proceedings as of February 24, 2017.
MATERIAL CONTRACTS
The Company has not entered into any material contracts outside its normal course of business.
INTERESTS OF EXPERTS
As at the date hereof, principals of GLJ, the independent engineers for the Company, personally disclosed in certificates of qualification that they neither had nor expect to receive any common shares. The principals of GLJ and their employees (as a group) beneficially own less than one percent of any of the Company’s securities.
Deloitte LLP is the auditor of the Company and is independent within the meaning of the Rules of Professional Conduct of the Chartered Professional Accountants of Alberta.
TRANSFER AGENT AND REGISTRAR
The transfer agent and registrar for the Company’s common shares is Computershare Trust Company of Canada at its principal offices in Calgary, Alberta and Toronto, Ontario.

Vermilion Energy Inc. AIF for the year ended December 31, 2016
55
RISK FACTORS
The following is a summary of certain risk factors relating to the business of the Company. The following information is a summary only of certain risk factors and is qualified in its entirety by reference to, and must be read in conjunction with, the detailed information appearing elsewhere in this annual information form. Additional risks and uncertainties not currently known to Vermilion that it currently views as immaterial may also materially and adversely affect its business, financial condition and/or results of operations. Shareholders and potential Shareholders should carefully consider the information contained herein and, in particular, the following risk factors.
Reserve Estimates
There are numerous uncertainties inherent in estimating quantities of proved and probable reserves and future net revenues to be derived therefrom, including many factors beyond the Company's control. The reserve and future net revenue information set forth in this annual information form represents estimates only. The reserves and estimated future net cash flow from the Company's properties have been independently evaluated by GLJ with an effective date of December 31, 2016. These evaluations include a number of assumptions relating to factors such as initial production rates, production decline rates, ultimate recovery of reserves, timing and amount of capital expenditures, marketability of production, future prices of crude oil and natural gas, operating costs, well abandonment and salvage values, royalties and other government levies that may be imposed over the producing life of the reserves. These assumptions were based on prices in use at the date the GLJ Report was prepared, and many of these assumptions are subject to change and are beyond the Company's control. Actual production and cash flow derived therefrom will vary from these evaluations, and such variations could be material.
Estimates with respect to reserves that may be developed and produced in the future are often based upon volumetric calculations, probabilistic methods and upon analogy to similar types of reserves, rather than upon actual production history. Estimates based on these methods generally are less reliable than those based on actual production history. Subsequent evaluation of the same reserves based upon production history will result in variations, which may be material, in the estimated reserves.
Reserve estimates may require revision based on actual production experience. Such figures have been determined based upon assumed commodity prices and operating costs.
The present value of estimated future net revenue referred to in this annual information form should not be construed as the fair market value of estimated crude oil and natural gas reserves attributable to the Company's properties. The estimated discounted future revenue from reserves are based upon price and cost estimates which may vary from actual prices and costs and such variance could be material. Actual future net revenue will also be affected by factors such as the amount and timing of actual production, supply and demand for crude oil and natural gas, curtailments or increases in consumption by purchasers and changes in governmental regulations and taxation.
Uncertainty of Contingent Resource Estimates
Information regarding quantities of contingent resources included in the Appendix to this Annual Information Form are estimates only. References to “contingent resources” do not constitute, and should be distinguished from, references to “reserves”. The same uncertainties inherent in estimating quantities of reserves apply to estimating quantities of contingent resources. In addition, there are contingencies that prevent resources from being classified as reserves. There is no certainty that it will be commercially viable to produce any portion of the contingent resources due to one or more contingencies. Contingencies may include factors such as economic, legal, environmental, political and regulatory matters or a lack of markets. Actual results may vary significantly from these estimates and such variances could be material.
Uncertainty of Prospective Resource Estimates
Information regarding quantities of prospective resources included in the Appendix to this Annual Information Form are estimates only. References to “prospective resources” do not constitute, and should be distinguished from, references to “reserves” and “contingent resources”. The same uncertainties inherent in estimating quantities of reserves apply to estimating quantities of prospective resources. In addition, there are contingencies that prevent resources from being classified as reserves. There is no certainty that it will be commercially viable to produce any portion of the prospective resources. Actual results may vary significantly from these estimates and such variances could be material.
Volatility of Oil and Natural Gas Prices
The Company's operational results and financial condition are dependent on the prices received for oil and natural gas production. Oil and natural gas prices have fluctuated materially during recent years and are determined by supply and demand factors, including weather and general economic conditions as well as conditions in other oil and natural gas regions. Any prolonged decline in oil and natural gas prices could have an adverse effect on Vermilion's cash flow which could have the effect of decreasing dividends.

Vermilion Energy Inc. AIF for the year ended December 31, 2016
56
Changes in Legislation
There can be no assurance that income tax laws and government incentive programs relating to the oil and gas industry in Canada and the foreign jurisdictions in which the Company operates, will not be changed in a manner which adversely affects the Company.
The Governments of Alberta and Saskatchewan receive royalties on production of natural resources from lands in which they own the mineral rights. A change in the royalty regime resulting in an increase in royalties would reduce Vermilion's net earnings and could make future capital expenditures or Vermilion's operations uneconomic and could, in the event of a material increase in royalties, make it more difficult to service and repay outstanding debt or impair Vermilion’s ability to declare dividends. Any material increase in royalties would also significantly reduce the value of the Company's associated assets.
The Government of Alberta released its Royalty Review Advisory Panel Report on January 29, 2016 ("RRAP"). The RRAP recommendations were accepted, which outlined the implementation of a Modernized Royalty Framework (“MRF”) that took effect on January 1, 2017. The MRF includes royalty incentives for the efficient development of conventional crude oil, natural gas, and NGL resources and no changes to the royalty structure of wells drilled prior to 2017 for a 10-year period from the royalty program's implementation date as they will continue to be governed by the previous Alberta Royalty Framework (“ARF”). It also includes the replacement of royalty credits/holidays on conventional wells by a revenue minus cost framework with a post-payout royalty rate based on commodity prices, the reduction of royalty rates for mature wells, and a neutral internal rate ofreturn for any given play compared to the ARF. The MRF is not expected to materially impact Vermilion’s financial condition.
Government Regulations
Vermilion's operations are governed by many levels of government, including municipal, state, provincial and federal governments in Canada, France,Germany, the Netherlands, Australia, Ireland, Hungary, Croatia, Slovakia and the United States. Vermilion is subject to laws and regulations regardingenvironment, health and safety issues, lease interests, taxes and royalties, among others. Failure to comply with the applicable laws can result in significant increases in costs, penalties and even losses of operating licences. The regulatory process involved in each of the countries in which Vermilion operates is not uniform and regulatory regimes vary as to complexity, timeliness of access to, and response from, regulatory bodies and other matters specific to each jurisdiction. If regulatory approvals or permits are delayed or not obtained, there can also be delays or abandonment of projects, decreases in production and increases in costs, and Vermilion may not be able to fully execute its strategy. Governments may also amend or create new legislation and regulatory bodies may also amend regulations or impose additional requirements which could result in increased capital, operating and compliance costs.
Competition
Vermilion actively competes for reserve acquisitions, exploration leases, licences and concessions and skilled industry personnel with a substantial number of other oil and gas companies, some of which have significantly greater financial resources than Vermilion. Vermilion's competitors include major integrated oil and natural gas companies and numerous other independent oil and natural gas companies and individual producers and operators.
Vermilion's ability to successfully bid on and acquire additional property rights, to discover reserves, to participate in drilling opportunities and to identify and enter into commercial arrangements with customers will be dependent upon developing and maintaining close working relationships with its future industry partners and joint operators and its ability to select and evaluate suitable properties and to consummate transactions in a highly competitive environment.
Operational Matters
The operation of oil and gas wells and facilities involves a number of operating and natural hazards which may result in blowouts, environmental damage and other unexpected or dangerous conditions resulting in damage to Vermilion and possible liability to regulators and third parties. Vermilion maintains liability insurance, where available, in amounts consistent with industry standards. Business interruption insurance may also be purchased for selected operations, to the extent that such insurance is commercially viable. Vermilion may become liable for damages arising from such events against which it cannot insure or against which it may elect not to insure because of high premium costs or other reasons. Costs incurred to repair such damage or pay such liabilities may impair Vermilion's ability to satisfy its debt obligations or declare dividends.
Continuing production from a property, and to some extent the marketing of production, are largely dependent upon the ability of the operator of the property. To the extent the operator fails to perform these functions properly, revenue may be reduced. Payments from production generally flow through the operator and there is a risk of delay and additional expense in receiving such revenues if the operator becomes insolvent. Although satisfactory title reviews are generally conducted in accordance with industry standards, such reviews do not guarantee or certify that a defect in the chain of title may not arise to defeat the claim of Vermilion or its subsidiaries to certain properties. Such circumstances could impair Vermilion's ability to satisfy its debt obligations or declare dividends.
Vermilion Energy Inc. AIF for the year ended December 31, 2016
57
In addition to the usual delays in payment by purchasers of oil and natural gas to the operators of the properties, and by the operator to Vermilion, payments between any of such parties may also be delayed by restrictions imposed by lenders, delays in the sale or delivery of products, delays in the connection of wells to a gathering system, blowouts or other accidents, recovery by the operator of expenses incurred in the operation of the properties or the establishment by the operator of reserves for such expenses.
Risks and uncertainties associated with weather conditions can shorten the winter drilling season in Canada and can impact the spring and summer drilling programs, potentially resulting in increased costs or reduced production. Western Australia’s northwest shelf is subject to seasonal disruptions caused by cyclones. During cyclone season (December to March) the Company may have to reduce production rates as a result of the inability to offload to tankers due to bad weather. Cyclones may also cause production shut-ins due to the evacuation of staff or damage to equipment on the platform.
Environmental Concerns
The oil and natural gas industry is subject to environmental regulation pursuant to local, provincial, state and federal legislation. A breach of such legislation may result in the imposition of fines, the issuance of clean up orders in respect of Vermilion or its assets, or the loss or suspension of regulatory approvals. Such legislation may be changed to impose higher standards and potentially more costly obligations on Vermilion. There canbe no assurance that the Company will be able to satisfy its actual future environmental and reclamation obligations.
Vermilion expects to incur abandonment and reclamation costs as existing oil and gas properties are abandoned and reclaimed. In 2016, expendituresbeyond normal compliance with environmental regulations were considered to be in the ordinary course of business. Vermilion does not anticipate material expenditures beyond amounts paid in respect of normal compliance with environmental regulations in 2017.
Vermilion's exploration and production facilities and other operations and activities in North America, Europe and Australia will emit a small amount ofgreenhouse gasses which may subject Vermilion to legislation regulating emissions of greenhouse gases and which may include a requirement to reduce emissions or emissions intensity from Vermilion's operations and facilities. As such, Vermilion continues to evaluate and monitor regulatory initiatives and overall trends so that it is aware of potential developments that could affect its business and operations. It is possible that future international, national, provincial or state emissions reduction requirements in jurisdictions that Vermilion operates in may require further reductions of emissions or emissions intensity. The direct or indirect costs of complying with emissions regulations may adversely affect the business of Vermilion in North America, Europe and Australia.
The Government of Alberta released its Climate Leadership Plan which impacts all consumers and businesses that contribute to carbon emissions in Alberta. The plan includes imposing carbon pricing that is applied on carbon emissions from heating and transportation fuels across all sectors, which started at $20 per tonne on January 1, 2017 and moving to $30 per tonne on January 1, 2018, the phase-out of coal-fired power generation by 2030, a cap on oil sands emissions production of 100 megatonnes, and a 45 per cent reduction in methane emissions by the oil and gas sector by 2025. Vermilion expects the Climate Leadership Plan to increase the cost of operating its properties located in Alberta and does not currently anticipate material impacts on its results of operations.
In October 2016, the Canadian federal government announced a new Pan-Canadian Pricing on Carbon Pollution strategy (the "Strategy") in response to the Paris Agreement that was ratified by Canada and other nations in October 2016. Under the Strategy, the federal government is proposing a benchmark carbon pricing program that includes, at a minimum, a price on carbon emissions of $10 per tonne in 2018, rising by $10 per tonne each year to $50 per tonne in 2022. The Carbon Strategy also proposes a federal backstop in the event that provincial jurisdictions fail to meet the benchmark. As mentioned above, Alberta has already established a carbon pricing system that was referenced in the federal announcement and therefore, currently, the Strategy is not anticipated to have a material impact on Vermilion’s results of operations.
Vermilion was awarded a position on CDP's 2016 Climate "A" List. CDP (formerly Carbon Disclosure Project) is a London-based not-for-profitorganization that administers a global environmental disclosure system that assists in the measurement and management of corporate environmentalimpacts. Only 193 companies globally achieved Climate "A" List recognition in 2016 and Vermilion was one of only five oil and gas companies in theworld and the only North American energy company on the 2016 list. Vermilion has voluntarily reported emissions data to CDP for each year since2012, recognizing the importance of measuring and understanding the Company’s environmental impact.

Vermilion Energy Inc. AIF for the year ended December 31, 2016
58
Kyoto Protocol
Australia, Canada, France, Ireland, Germany and the Netherlands are signatories to the United Nations Framework Convention on Climate Change and have all ratified the Kyoto Protocol established thereunder. Australia, France, Ireland, Germany and the Netherlands, as Annex B parties to the Kyoto Protocol, and Ireland, France, Germany and Netherlands as members of the European Union, are required to reduce their nation-wide emissions of carbon dioxide, methane, nitrous oxide and other greenhouse gases. Canada formally withdrew from the Kyoto Protocol in 2012.
Discretionary Nature of Dividends
The declaration and payment (including the amount thereof) of future cash dividends, if any, is subject to the discretion of the board of directors of the Company and may vary depending on a variety of factors and conditions existing from time to time, including fluctuations in commodity prices, production levels, capital expenditure requirements, debt service requirements, operating costs, royalty burdens, foreign exchange rates and the satisfaction of the liquidity and solvency tests under the ABCA for the declaration and payment of dividends. Depending on these and other factors considered relevant to the declaration and payment of dividends by the board of directors and management of the Company (some or all of which may be beyond the control of the board of directors and management of the Company), the Company may change its dividend policy from time to time. Any reduction of dividends may adversely affect the market price or value of common shares.
Debt Service
Vermilion may, from time to time, finance a significant portion of its operations through debt. Amounts paid in respect of interest and principal on debt incurred by Vermilion may impair Vermilion's ability to satisfy its other obligations. Variations in interest rates and scheduled principal repayments could result in significant changes in the amount required to be applied to debt service before payment by Vermilion of its debt obligations. Ultimately, this may result in lower levels of cash flow for the Company.
Lenders may be provided with security over substantially all of the assets of Vermilion and its Subsidiaries. If Vermilion becomes unable to pay its debt service charges or otherwise commits an event of default such as bankruptcy, a lender may be able to foreclose on or sell the assets of Vermilion and/or its Subsidiaries.
Changes in Income Tax Laws
Income tax laws and administrative policies may be changed in a manner which adversely affects the Company and/or Shareholders.
Depletion of Reserves
The Company has certain unique attributes which differentiate it from other oil and gas industry participants. Dividends paid from cash flow generatedin respect of properties, absent commodity price increases or cost effective acquisition and development activities, may decline over time in a manner consistent with declining production from typical crude oil, natural gas and natural gas liquids reserves. Accordingly, absent capital expenditures or acquisitions of additional crude oil and natural gas properties, Vermilion's current production levels and reserves will decline.
Vermilion's future crude oil and natural gas reserves and production, and therefore its cash flows, will be highly dependent on Vermilion's success inexploiting its reserve base and acquiring additional reserves. Without reserve additions through acquisition or development activities, Vermilion's reserves and production will decline over time as reserves are exploited.
Net Asset Value
The net asset value of the assets of the Company from time to time will vary dependent upon a number of factors beyond the control of management, including crude oil and natural gas prices. The trading prices of the common shares from time to time is also determined by a number of factors which are beyond the control of management and such trading prices may be greater than the net asset value of the Company's assets.
Volatility of Market Price of Common Shares
The market price of the common shares may be volatile. The volatility may affect the ability of Shareholders to sell the common shares at an advantageous price. Market price fluctuations in the common shares may be due to the Company’s operating results failing to meet the expectationsof securities analysts or investors in any quarter, downward revision in securities analysts’ estimates, governmental regulatory action, adverse change in general market conditions or economic trends, acquisitions, dispositions or other material public announcements by the Corporation or its competitors, along with a variety of additional factors, including, without limitation, those set forth under “Forward-Looking Statements” in this annual

Vermilion Energy Inc. AIF for the year ended December 31, 2016
59
information form. In addition, the market price for securities in the stock markets, including the TSX and NYSE, has experienced significant price and trading fluctuations in recent years. These fluctuations have resulted in volatility in the market prices of securities that often has been unrelated or disproportionate to changes in operating performance. These broad market fluctuations may adversely affect the market price of the common shares.
Variations in Interest Rates and Foreign Exchange Rates
An increase in interest rates could result in a significant increase in the amount the Company pays to service debt, potentially impacting dividends to Shareholders.
In addition, an increase in the exchange rate for the Canadian dollar versus the U.S. dollar would result in the receipt by the Company of fewer Canadian dollars for its production which may affect future dividends. The Company monitors and, when appropriate, uses derivative financial instruments to manage its exposure to currency exchange rate risks. The increase in the exchange rate for the Canadian dollar and future Canadian/United States exchange rates may impact future dividends and the future value of the Company's reserves as determined by independent evaluators.
Increase in Operating Costs or Decline in Production Level
An increase in operating costs or a decline in Vermilion’s production level could have an adverse effect on Vermilion’s cash flow and, therefore, could reduce dividends to Shareholders and affect the market price of the common shares. The level of production may decline at rates greater than anticipated due to unforeseen circumstances, many of which are beyond Vermilion's control. A significant decline in production could result in materially lower revenues and cash flow and, therefore, could reduce dividends to Shareholders and affect the market price of the common shares.
Acquisition Assumptions
When making acquisitions, Vermilion estimates future performance of the assets to be acquired that may prove to be inaccurate.
Acquired assets are subject to inherent risks associated with predicting the future performance of those assets. Vermilion makes certain estimates and assumptions respecting the economic potential of the assets it acquires which may not be realized over time. As such, assets acquired may not possess the value Vermilion attributed to them, which could adversely impact cash flow.
Failure to Realize Anticipated Benefits of Prior Acquisitions
Vermilion may, from time to time, complete one or more acquisitions for various strategic reasons including to strengthen its position in the oil and natural gas industry and to create the opportunity to realize certain benefits, including, among other things, potential cost savings. In order to achieve the benefits of any future acquisitions, Vermilion will be dependent upon its ability to successfully consolidate functions and integrate operations, procedures and personnel in a timely and efficient manner and to realize the anticipated growth opportunities and synergies from combining the acquired assets and operations with those of the Company. The integration of acquired assets and operations requires the dedication of managementeffort, time and resources, which may divert management's focus and resources from other strategic opportunities and from operational matters during the process. The integration process may result in the disruption of ongoing business and customer relationships that may adversely affect Vermilion's ability to achieve the anticipated benefits of such prior acquisitions.
Additional Financing
Vermilion’s credit facility and any replacement credit facility may not provide sufficient liquidity. The amounts available under Vermilion's credit facility may not be sufficient for future operations, or Vermilion may not be able to obtain additional financing on attractive economic terms, if at all. Any failure to obtain financing may have a material adverse effect on Vermilion's business, and dividends to Shareholders may be reduced, suspended or eliminated.
To the extent that external sources of capital, including the issuance of additional common shares, become limited or unavailable, Vermilion's ability to make the necessary capital investments to maintain or expand its crude oil and natural gas reserves will be impaired. To the extent the Company is required to use cash flow to finance capital expenditures or property acquisitions, the level of cash available that may be declared payable as dividends will be reduced.
Potential Conflicts of Interest

Vermilion Energy Inc. AIF for the year ended December 31, 2016
60
Circumstances may arise where members of the board of directors or officers of Vermilion are directors or officers of companies which are in competition to the interests of Vermilion. No assurances can be given that opportunities identified by such persons will be provided to Vermilion.
Accounting Adjustments
The presentation of financial information in accordance with IFRS requires that management apply certain accounting policies and make certain estimates and assumptions which affect reported amounts in Vermilion’s consolidated financial statements. The accounting policies may result in non-cash charges to net income and write-downs of net assets in the consolidated financial statements. Such non-cash charges and write-downs may be viewed unfavourably by the market and may result in an inability to borrow funds and/or may result in a decline in the common share price.
Lower crude oil and gas prices increase the risk of write-downs of Vermilion’s oil and gas property investments. Under IFRS, assets are aggregated into groups known as CGUs for impairment testing. CGUs are reviewed for indicators that the carrying value of the CGU may exceed its recoverable amount. If an indication of impairment exists, the CGU’s recoverable amount is then estimated. A CGU’s recoverable amount is defined as the higher of the fair value less costs to sell and its value in use. If the carrying amount exceeds its recoverable amount an impairment loss is recorded to net earnings in the period to reduce the carrying value of the CGU to its recoverable amount. While these impairment losses would not affect cash flow, the charge to net earnings could be viewed unfavourably in the market.
Market Accessibility
A decline in Vermilion’s ability to market crude oil and natural gas production could have a material adverse effect on its production levels or on the price that Vermilion receives for production which, in turn, could reduce dividends to its Shareholders and the trading price of the common shares.
Vermilion’s business depends in part upon the availability, proximity and capacity of natural gas gathering systems, pipelines and processing facilities. Canadian federal and provincial, as well as United States federal and state, regulation of crude oil and natural gas production, processing and transportation, tax and energy policies, general economic conditions, and changes in supply and demand could adversely affect Vermilion’s ability to produce and market crude oil and natural gas. If market factors change and inhibit the marketing of Vermilion production, overall production or realized prices may decline, which could reduce dividends to Shareholders.
Cyber Security
Vermilion manages cyber security risk by ensuring appropriate technologies, processes and practices are effectively designed and implemented to help prevent, detect and respond to threats as they emerge and evolve. The primary risks to Vermilion include, loss of data, destruction or corruption of data, compromising of confidential customer or employee information, leaked information, disruption of business, theft or extortion of funds, regulatory infractions, loss of competitive advantage and reputational damage. Vermilion relies upon a complete suite of advanced controls as protection from such attacks including, but not limited to the following:
a) Enterprise class firewall infrastructure, secure network architecture and anti-malware defense systems to protect against network intrusion, malware infection and data loss.
b) Regularly conducted comprehensive third party reviews and vulnerability assessments to ensure that information technology systems are up-to-date and properly configured, to reduce security risks arising from outdated or misconfigured systems and software.
c) Disaster recovery planning, ongoing monitoring of network traffic patterns to identify potential malicious activities or attacks
Incident response processes are in place to isolate and control potential attacks. Data backup and recovery processes are in place to minimize risk of data loss and resulting disruption of business. Through ongoing vigilance and regular employee awareness, Vermilion has not experienced a cyber security event of a material nature. As it is difficult to quantify the significance of such events, cyber attacks such as, security breaches of company, customer, employee, and vendor information, as well as hardware or software corruption, failure or error, telecommunications system failure, service provider error, intentional or unintentional personnel actions, malicious software, attempts to gain unauthorized access to data and other electronic security breaches that could lead to disruptions in systems, unauthorized release of confidential or otherwise protected information and the corruption of data, may in certain circumstances be material and could have an adverse effect on Vermilion’s business, financial condition and results of operations. As result of the unpredictability of the timing, nature and scope of disruptions from such attacks, Vermilion could potentially be subject to production downtimes, operational delays, the compromising of confidential or otherwise protected information, destruction or corruption of data, security breaches, other manipulation or improper use of its systems and networks or financial losses, any of which could have a material adverse effect on Vermilion’s competitive position, financial condition or results of operations.
ADDITIONAL INFORMATION

Vermilion Energy Inc. AIF for the year ended December 31, 2016
61
Additional information relating to the Company may be found on SEDAR at www.sedar.com under Vermilion’s SEDAR profile. Additional information related to the remuneration and indebtedness of the directors and officers of the Company, and the principal holders of common shares and Rights to purchase common shares and securities authorized for issuance under the Company's equity compensation plans, where applicable, are contained in the information circular of the Company in respect of its most recent annual meeting of Shareholders involving the election of directors. Additional financial information is provided in the Company's audited financial statements and management's discussion and analysis for the year ended December 31, 2016.

Vermilion Energy Inc. AIF for the year ended December 31, 2016
62
APPENDIX ACONTINGENT RESOURCES
Summary information regarding contingent resources and net present value of future net revenues from contingent resources are set forth below andare derived, in each case, from the GLJ Resources Assessment. The GLJ Resources Assessment was prepared in accordance with COGEH andNI-51-101 by GLJ, an independent qualified reserve evaluator. All contingent resources evaluated in the GLJ Resources Assessment were deemedeconomic at the effective date of December 31, 2016. Contingent resources are in addition to reserves estimated in the GLJ Report.
A range of contingent resources estimates (low, best and high) were prepared by GLJ. See notes 6 to 8 of the tables below for a description of lowestimate, best estimate and high estimate.
The GLJ Resources Assessment estimated gross risked contingent resources with a project maturity subclass of “Development Pending” of 120.4million boe (low estimate) to 309.4 million boe (high estimate), with a best estimate of 198.5 million boe. Contingent resources are in addition toreserves estimated in the GLJ Report.
The GLJ Resources Assessment estimated gross risked contingent resources with a project maturity subclass of “Development Unclarified” of 10.7million boe (low estimate) to 28.7 million boe (high estimate), with a best estimate of 19.5 million boe.
An estimate of risked net present value of future net revenue of contingent resources is preliminary in nature and is provided to assist thereader in reaching an opinion on the merit and likelihood of the company proceeding with the required investment. It includes contingentresources that are considered too uncertain with respect to the chance of development to be classified as reserves. There is uncertaintythat the risked net present value of future net revenue will be realized.
Summary of Risked Oil and Gas Contingent Resources as at December 31, 2016 (1) (2) - Forecast Prices and Costs (3) (4)
Light Crude Oil & Conventional Coal Bed Natural Gas BOE Unrisked
Resources Medium Crude Oil Natural Gas Methane Liquids BOEProject ChanceMaturity Gross Net Gross Net Gross Net Gross Net Gross Net of Dev. Gross NetSub-Class (Mbbl) (Mbbl) (MMcf) (MMcf) (MMcf) (MMcf) (Mbbl) (Mbbl) (Mboe) (Mboe) (%) (9) (Mboe) (Mboe)Contingent (1C) - Low EstimateDevelopment Pending(10)
Australia(11) - - - - - - - - - - - - -Canada(12) 13,145 9,681 250,957 226,293 1,455 1,382 19,917 15,769 75,131 63,396 81.9% 91,750 77,305 France(13) 14,152 13,241 969 969 - - - - 14,314 13,403 86.8% 16,486 15,438 Germany(14) - - 17,317 15,138 - - - - 2,886 2,523 78.3% 3,686 3,222 Ireland - - - - - - - - - - - - -Netherlands(15) - - 10,336 10,336 - - 2 2 1,725 1,725 81.4% 2,119 2,119 USA(16) 20,581 17,072 18,952 15,720 - - 2,627 2,179 26,367 21,871 90.0% 29,296 24,300 Total 47,878 39,994 298,531 268,456 1,455 1,382 22,546 17,950 120,423 102,918 84.0% 143,337 122,384 Contingent (2C) - Best EstimateDevelopment Pending(10)
Australia(11) 2,440 2,440 - - - - - - 2,440 2,440 80.0% 3,050 3,050 Canada(12) 25,648 18,373 389,272 346,617 3,534 3,357 29,537 22,869 120,653 99,571 80.3% 150,178 123,661 France(13) 27,543 25,702 1,246 1,246 - - - - 27,751 25,908 85.1% 32,628 30,453 Germany(14) - - 29,595 25,886 - - - - 4,933 4,314 78.3% 6,300 5,510 Ireland - - - - - - - - - - - - -Netherlands(15) - - 28,521 28,521 - - 6 6 4,760 4,760 81.3% 5,853 5,853 USA(16) 29,466 24,441 27,811 23,069 - - 3,855 3,197 37,956 31,483 90.0% 42,173 34,981 Total 85,097 70,956 476,445 425,339 3,534 3,357 33,398 26,072 198,493 168,476 82.6% 240,182 203,508 Contingent (3C) - High EstimateDevelopment Pending(10)
Australia(11) 3,280 3,280 - - - - - - 3,280 3,280 80.0% 4,100 4,100 Canada(12) 52,590 37,459 567,390 500,749 5,174 4,788 41,650 31,616 189,667 153,331 79.2% 239,562 193,233 France(13) 43,866 40,873 1,609 1,609 - - - - 44,134 41,141 84.3% 52,336 48,774 Germany(14) - - 54,150 47,382 - - - - 9,025 7,897 78.3% 11,526 10,086 Ireland - - - - - - - - - - - - -Netherlands(15) - - 50,159 50,159 - - 13 13 8,373 8,373 80.5% 10,403 10,403 USA(16) 42,381 35,152 40,945 33,961 - - 5,675 4,707 54,880 45,519 90.0% 60,977 50,577 Total 142,117 116,764 714,253 633,860 5,174 4,788 47,338 36,336 309,359 259,541 81.6% 378,904 317,173

Vermilion Energy Inc. AIF for the year ended December 31, 2016
63
Light Crude Oil & Conventional Coal Bed Natural Gas BOE UnriskedResources Medium Crude Oil Natural Gas Methane Liquids BOEProject ChanceMaturity Gross Net Gross Net Gross Net Gross Net Gross Net of Dev. Gross NetSub-Class (Mbbl) (Mbbl) (MMcf) (MMcf) (MMcf) (MMcf) (Mbbl) (Mbbl) (Mboe) (Mboe) (%) (9) (Mboe) (Mboe)Contingent (1C) - Low EstimateDevelopment Unclarified(17)
Australia - - - - - - - - - - - - -Canada(18) - - 44,744 39,976 - - 897 745 8,354 7,408 58.2% 14,361 12,743 France(19) 1,511 1,434 - - - - - - 1,511 1,434 42.4% 3,560 3,376 Germany - - - - - - - - - - - - -Ireland - - - - - - - - - - - - -Netherlands - - - - - - - - - - - - -USA - - - - - - - - - - - - -Total 1,511 1,434 44,744 39,976 - - 897 745 9,865 8,842 55.0% 17,921 16,119 Contingent (2C) - Best EstimateDevelopment Unclarified(17)
Australia - - - - - - - - - - - - -Canada(18) - - 75,428 66,726 - - 1,640 1,339 14,211 12,460 57.2% 24,859 21,796 France(19) 2,539 2,410 - - - - - - 2,539 2,410 44.6% 5,690 5,398 Germany - - - - - - - - - - - - -Ireland - - - - - - - - - - - - -Netherlands(20) - - 16,351 15,777 - - 32 16 2,757 2,646 49.4% 5,580 5,301 USA - - - - - - - - - - - - -Total 2,539 2,410 91,779 82,503 - - 1,672 1,355 19,507 17,516 54.0% 36,129 32,495 Contingent (3C) - High EstimateDevelopment Unclarified(17)
Australia - - - - - - - - - - - - -Canada(18) - - 103,491 89,867 - - 2,178 1,727 19,427 16,705 57.6% 33,746 29,063 France(19) 3,825 3,632 - - - - - - 3,825 3,632 46.4% 8,250 7,829 Germany - - - - - - - - - - - - -Ireland - - - - - - - - - - - - -Netherlands(20) - - 32,346 31,475 - - 48 24 5,439 5,270 53.4% 10,184 9,761 USA - - - - - - - - - - - - -Total 3,825 3,632 135,837 121,342 - - 2,226 1,751 28,691 25,607 55.0% 52,180 46,653
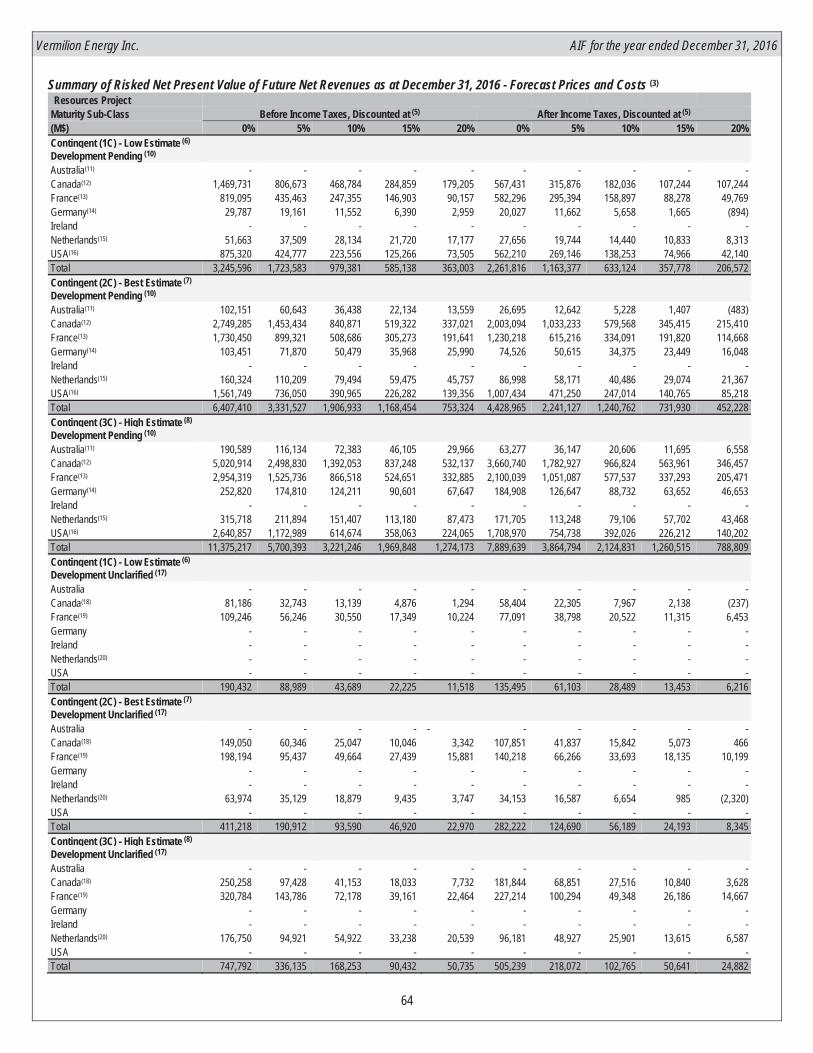
Vermilion Energy Inc. AIF for the year ended December 31, 2016
64
Summary of Risked Net Present Value of Future Net Revenues as at December 31, 2016 - Forecast Prices and Costs (3)
Resources ProjectMaturity Sub-Class Before Income Taxes, Discounted at (5) After Income Taxes, Discounted at (5)
(M$) 0% 5% 10% 15% 20% 0% 5% 10% 15% 20%Contingent (1C) - Low Estimate (6)
Development Pending (10)
Australia(11) - - - - - - - - - -Canada(12) 1,469,731 806,673 468,784 284,859 179,205 567,431 315,876 182,036 107,244 107,244 France(13) 819,095 435,463 247,355 146,903 90,157 582,296 295,394 158,897 88,278 49,769 Germany(14) 29,787 19,161 11,552 6,390 2,959 20,027 11,662 5,658 1,665 (894)Ireland - - - - - - - - - -Netherlands(15) 51,663 37,509 28,134 21,720 17,177 27,656 19,744 14,440 10,833 8,313 USA(16) 875,320 424,777 223,556 125,266 73,505 562,210 269,146 138,253 74,966 42,140 Total 3,245,596 1,723,583 979,381 585,138 363,003 2,261,816 1,163,377 633,124 357,778 206,572 Contingent (2C) - Best Estimate (7)
Development Pending (10)
Australia(11) 102,151 60,643 36,438 22,134 13,559 26,695 12,642 5,228 1,407 (483)Canada(12) 2,749,285 1,453,434 840,871 519,322 337,021 2,003,094 1,033,233 579,568 345,415 215,410 France(13) 1,730,450 899,321 508,686 305,273 191,641 1,230,218 615,216 334,091 191,820 114,668 Germany(14) 103,451 71,870 50,479 35,968 25,990 74,526 50,615 34,375 23,449 16,048 Ireland - - - - - - - - - -Netherlands(15) 160,324 110,209 79,494 59,475 45,757 86,998 58,171 40,486 29,074 21,367 USA(16) 1,561,749 736,050 390,965 226,282 139,356 1,007,434 471,250 247,014 140,765 85,218 Total 6,407,410 3,331,527 1,906,933 1,168,454 753,324 4,428,965 2,241,127 1,240,762 731,930 452,228 Contingent (3C) - High Estimate (8)
Development Pending (10)
Australia(11) 190,589 116,134 72,383 46,105 29,966 63,277 36,147 20,606 11,695 6,558 Canada(12) 5,020,914 2,498,830 1,392,053 837,248 532,137 3,660,740 1,782,927 966,824 563,961 346,457 France(13) 2,954,319 1,525,736 866,518 524,651 332,885 2,100,039 1,051,087 577,537 337,293 205,471 Germany(14) 252,820 174,810 124,211 90,601 67,647 184,908 126,647 88,732 63,652 46,653 Ireland - - - - - - - - - -Netherlands(15) 315,718 211,894 151,407 113,180 87,473 171,705 113,248 79,106 57,702 43,468 USA(16) 2,640,857 1,172,989 614,674 358,063 224,065 1,708,970 754,738 392,026 226,212 140,202 Total 11,375,217 5,700,393 3,221,246 1,969,848 1,274,173 7,889,639 3,864,794 2,124,831 1,260,515 788,809 Contingent (1C) - Low Estimate (6)
Development Unclarified (17)
Australia - - - - - - - - - -Canada(18) 81,186 32,743 13,139 4,876 1,294 58,404 22,305 7,967 2,138 (237)France(19) 109,246 56,246 30,550 17,349 10,224 77,091 38,798 20,522 11,315 6,453 Germany - - - - - - - - - -Ireland - - - - - - - - - -Netherlands(20) - - - - - - - - - -USA - - - - - - - - - -Total 190,432 88,989 43,689 22,225 11,518 135,495 61,103 28,489 13,453 6,216 Contingent (2C) - Best Estimate (7)
Development Unclarified (17)
Australia - - - - - - - - - -Canada(18) 149,050 60,346 25,047 10,046 3,342 107,851 41,837 15,842 5,073 466 France(19) 198,194 95,437 49,664 27,439 15,881 140,218 66,266 33,693 18,135 10,199 Germany - - - - - - - - - -Ireland - - - - - - - - - -Netherlands(20) 63,974 35,129 18,879 9,435 3,747 34,153 16,587 6,654 985 (2,320)USA - - - - - - - - - -Total 411,218 190,912 93,590 46,920 22,970 282,222 124,690 56,189 24,193 8,345 Contingent (3C) - High Estimate (8)
Development Unclarified (17)
Australia - - - - - - - - - -Canada(18) 250,258 97,428 41,153 18,033 7,732 181,844 68,851 27,516 10,840 3,628 France(19) 320,784 143,786 72,178 39,161 22,464 227,214 100,294 49,348 26,186 14,667 Germany - - - - - - - - - -Ireland - - - - - - - - - -Netherlands(20) 176,750 94,921 54,922 33,238 20,539 96,181 48,927 25,901 13,615 6,587 USA - - - - - - - - - -Total 747,792 336,135 168,253 90,432 50,735 505,239 218,072 102,765 50,641 24,882

Vermilion Energy Inc. AIF for the year ended December 31, 2016
65
Notes:(1) Contingent resources are defined in the COGEH as those quantities of petroleum estimated, as of a given date, to be potentially recoverable from known accumulations using
established technology or technology under development, but which are not currently considered to be commercially recoverable due to one or more contingencies. There is no certainty that it will be commercially viable to produce any portion of the contingent resources or that Vermilion will produce any portion of the volumes currently classified as contingent resources. The estimates of contingent resources involve implied assessment, based on certain estimates and assumptions, that the resources described exists in the quantities predicted or estimated, as at a given date, and that the resources can be profitably produced in the future. The risked net present value of the future net revenue from the contingentresources does not represent the fair market value of the contingent resources. Actual contingent resources (and any volumes that may be reclassified as reserves) and future production therefrom may be greater than or less than the estimates provided herein.
(2) GLJ prepared the estimates of contingent resources shown for each property using deterministic principles and methods. Probabilistic aggregation of the low and high property estimates shown in the table might produce different total volumes than the arithmetic sums shown in the table.
(3) The forecast price and cost assumptions utilized in the year-end 2016 reserves report were also utilized by GLJ in preparing the GLJ Resource Assessment. See ”GLJ December 31, 2016 Forecast Prices” in this AIF.
(4) "Gross” contingent resources are Vermilion's working interest (operating or non-operating) share before deduction of royalties and without including any royalty interests of Vermilion."Net” contingent resources are Vermilion's working interest (operating or non-operating) share after deduction of royalty obligations, plus Vermilion's royalty interests in contingent resources.
(5) The risked net present value of future net revenue attributable to the contingent resources does not represent the fair market value of the contingent resources. Estimated abandonment and reclamation costs have been included in the evaluation.
(6) This is considered to be a conservative estimate of the quantity that will actually be recovered. It is likely that the actual remaining quantities recovered will exceed the low estimate. If probabilistic methods are used, there should be at least a 90 percent probability (P90) that the quantities actually recovered will equal or exceed the low estimate.
(7) This is considered to be the best estimate of the quantity that will actually be recovered. It is equally likely that the actual remaining quantities recovered will be greater or less than the best estimate. If probabilistic methods are used, there should be at least a 50 percent probability (P50) that the quantities actually recovered will equal or exceed the best estimate.
(8) This is considered to be an optimistic estimate of the quantity that will actually be recovered. It is unlikely that the actual remaining quantities recovered will exceed the high estimate. If probabilistic methods are used, there should be at least a 10 percent probability (P10) that the quantities actually recovered will equal or exceed the high estimate.
(9) The Chance of Development (CoDev) is the estimated probability that, once discovered, a known accumulation will be commercially developed. Five factors have been considered in determining the CoDev as follows:
CoDev = Ps (Economic Factor) × Ps (Technology Factor) × Ps (Development Plan Factor) ×Ps (Development Timeframe Factor) × Ps (Other Contingency Factor) whereinPs is the probability of successEconomic Factor – For reserves to be assessed, a project must be economic. With respect to contingent resources, this factor captures uncertainty in the assessment of economic status principally due to uncertainty in cost estimates and marketing options. Economic viability uncertainty due to technology is more aptly captured with the Technology Factor. The Economic Factor will be 1 for reserves and will often be 1 for development pending projects and for projects with a development study or pre-development study with a robust rate of return. A robust rate of return means that the project retains economic status with variation in costs and/or marketing plans over the expected range of outcomes for these variables.Technology Factor - For reserves to be assessed, a project must utilize established technology. With respect to contingent resources, this factor captures the uncertainty in the viability of the proposed technology for the subject reservoir, namely, the uncertainty associated with technology under development. By definition, technology under development is a recovery process or process improvement that has been determined to be technically viable via field test and is being field tested further to determine its economic viability in the subject reservoir. The Technology Factor will be 1 for reserves and for established technology. For technology under development, this factor will consider different risks associated with technologies being developed at the scale of the well versus the scale of a project and technologies which are being modified or extended for the subject reservoir versus new emerging technologies which have not previously been applied in any commercial application. The risk assessment will also consider the quality and sufficiency of the test data available, the ability to reliably scale such data and the ability to extrapolate results in time.Development Plan Factor – For reserves to be assessed, a project must have a detailed development plan. With respect to contingent resources, this factor captures the uncertainty in the project evaluation scenario. The Development Plan Factor will be 1 for reserves and high, approaching 1, for development pending projects. This factor will consider development plan detail variations including the degree of delineation, reservoir specific development and operating strategy detail (technology decision, well layouts (spacing and pad locations), completion strategy, start-up strategy, water source and disposal, other infrastructure, facility design, marketing plans etc) and the quality of the cost estimates as provided by the developer.Development Timeframe Factor – In the case of major projects, for reserves to be assessed, first major capital spending must be initiated within 5 years of the effective date. The Development Timeframe Factor will be 1 for reserves and will often be 1 for development pending projects provided the project is planned on-stream based on the same criteria used in the assessment of reserves. With respect to contingent resources, the factor will approach 1 for projects planned on-stream with a timeframe slightly longer than the limiting reserves criteria. Other Contingency Factor – For reserves to be assessed, all contingencies must be eliminated. With respect to contingent resources, this factor captures major contingencies, usually beyond the control of the operator, other than those captured by economic status, technology status, project evaluation scenario status and the development timeframe. The Other Contingency Factor will be 1 for reserves and for development pending projects and less than 1 for on hold. Provided all contingencies have been identified and their resolution is reasonably certain, this factor would also be 1 for development unclarified projects.These factors may be inter-related (dependent) and care has been taken to ensure that risks are appropriately accounted.
(10) Project maturity subclass development pending is defined as contingent resources where resolution of the final conditions for development is being actively pursued (high chance of development).
(11) Contingent resources for Australia have been estimated based on the continued drilling in our active core asset (see “Description of Properties” section of this AIF) using established recovery technologies. The estimated cost to bring these contingent resources on commercial production is $142 MM and the expected timeline is between 7 and 9 years. The specific contingencies for these resources are corporate commitment and development timing.
(12) Contingent resources for Canada have been estimated based on the continued drilling in our active core assets (see “Description of Properties” section of this AIF) using established recovery technologies. The estimated cost to bring these contingent resources on commercial production is $1,170 MM and the expected timeline is between 1 and 12 years. The specific contingencies for these resources are corporate commitment and development timing.
(13) Contingent resources for France have been estimated based on the continued drilling in our active core assets (see “Description of Properties” section of this AIF) using established recovery technologies. The estimated cost to bring these contingent resources on commercial production is $550 MM and the expected timeline is between 3and 10 years. The specific contingencies for these resources are corporate commitment and development timing.
(14) Contingent resources for Germany have been estimated based on the continued drilling in our active core assets (see “Description of Properties” section of this AIF) using established recovery technologies. The estimated cost to bring these contingent resources on commercial production is $55 MM and the expected timeline is between 3 and 5 years. The specific contingencies for these resources are corporate commitment and development timing.
(15) Contingent resources for Netherlands have been estimated based on the continued drilling in our active core assets (see “Description of Properties” section of this AIF) using established recovery technologies. The estimated cost to bring these contingent resources on commercial production is $34 MM and the expected timeline is between two and 10 years. The specific contingencies for these resources are corporate commitment and development timing.

Vermilion Energy Inc. AIF for the year ended December 31, 2016
66
(16) Contingent resources for USA have been estimated based on the continued drilling in our active core asset (see “Description of Properties” section of this AIF) using established recovery technologies. The estimated cost to bring these contingent resources on commercial production is $431 MM and the expected timeline is between 4 and 12 years. The specific contingencies for these resources are corporate commitment and development timing.
(17) Project maturity subclass development unclarified is defined as contingent resources when the evaluation is incomplete and there is ongoing activity to resolve any risks or uncertainties.
(18) In Canada, GLJ has estimated an aggregate of risked unclarified best estimate contingent resources of 14.2 mmboe for the projects outlined below. Utilizing established recovery technology, the risked estimated cost to bring these resources on commercial production is an aggregate of $108 MM with an expected timeline of 4 to 15 years.
Ferrier Notikewin Based on contingencies related to corporate commitment and development timing that is greater than 10 years, GLJ has estimated risked unclarified best estimate contingent resources at 5.1 mmboe and the risked estimated cost to bring these resources on commercial production is $36 MM. The expected timeline is 11 to 15 years.
Ferrier Falher Based on contingencies related to corporate commitment and development timing that is greater than 10 years, GLJ has estimated risked unclarified best estimate contingent resources at 3.8 mmboe and the risked estimated cost to bring these resources on commercial production is $28 MM. The expected timeline is 11 to 15 years.
West Pembina Glauconite Based on contingencies related to corporate commitment and development timing as well as economic risk related to capital and operating cost uncertainty due to limited horizontal development in proximity to interest lands, GLJ has estimated risked unclarified best estimate contingent resources at 5.3 mmboe and the risked estimated cost to bring these resources on commercial production is $44 MM. The expected timeline is 4 to 10 years.
(19) In France, GLJ has estimated an aggregate of risked unclarified best estimate contingent resources of 2.5 mmboe for the projects outlined below. Utilizing established recovery technology, the risked estimated cost to bring these resources on commercial production is an aggregate of $36 MM with an expected timeline of 8 to 10 years.
Charmottes Based on contingencies related to corporate commitment and development timing, along with the project still being in the pre-development study/sourcing stage related to waterflood development, GLJ has estimated risked unclarified best estimate contingent resources at 1.3 mmboe and the risked estimated cost to bring these resources on commercial production is $29 MM. The expected timeline is 8 to 10 years.
Chaunoy Based on contingencies related to corporate commitment and development timing, along with a CO2 pilot project still being in the conceptual study stage, GLJ has estimated risked unclarified best estimate contingent resources at 1.2 mmboe and the risked estimated cost to bring these resources on commercial production is $7 MM. The expected timeline is 9 to 10 years.
(20) In the Netherlands, GLJ has estimated an aggregate of risked unclarified best estimate contingent resources of 2.8 mmboe for the projects outlined below. Utilizing established recovery technology, the risked estimated to bring these resources on commercial production an aggregate of $45 MM with an expected timeline of 3 to 9 years.
Netherlands East Based on contingencies related to corporate commitment and development timing along with proof-of-concept utilizing directional drilling and unknown deliverability from Zechstein carbonates, GLJ has estimated risked unclarified best estimate contingent resources at 1.6 mmboe and the risked estimated cost to bring these resources on commercial production is $24 MM. The expected timeline is 3 to 9 years.
Netherlands West Based on contingencies related to corporate commitment and development timing along with further study required regarding the deliverability of the Bunter sands, GLJ has estimated risked unclarified best estimate contingent resources at 1.2 mmboe and the risked estimated cost to bring these resources on commercial production is $21 MM. The expected timeline is 5 years.
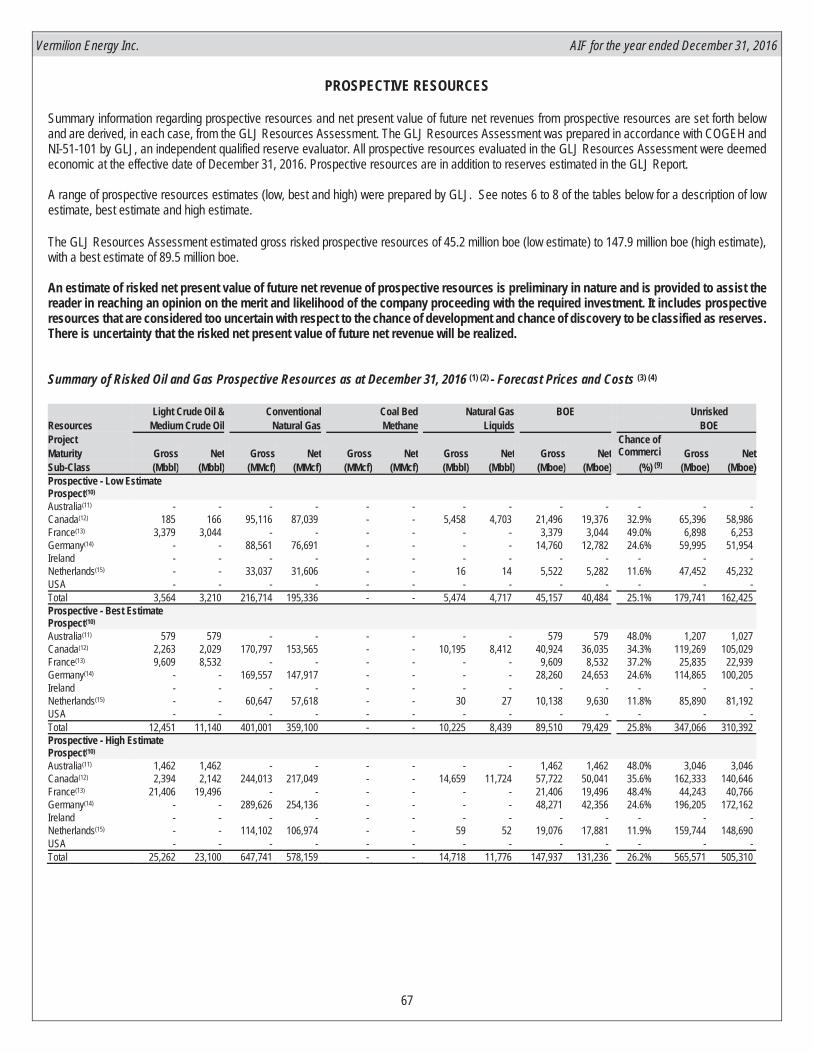
Vermilion Energy Inc. AIF for the year ended December 31, 2016
67
PROSPECTIVE RESOURCES
Summary information regarding prospective resources and net present value of future net revenues from prospective resources are set forth belowand are derived, in each case, from the GLJ Resources Assessment. The GLJ Resources Assessment was prepared in accordance with COGEH andNI-51-101 by GLJ, an independent qualified reserve evaluator. All prospective resources evaluated in the GLJ Resources Assessment were deemedeconomic at the effective date of December 31, 2016. Prospective resources are in addition to reserves estimated in the GLJ Report.
A range of prospective resources estimates (low, best and high) were prepared by GLJ. See notes 6 to 8 of the tables below for a description of lowestimate, best estimate and high estimate.
The GLJ Resources Assessment estimated gross risked prospective resources of 45.2 million boe (low estimate) to 147.9 million boe (high estimate),with a best estimate of 89.5 million boe.
An estimate of risked net present value of future net revenue of prospective resources is preliminary in nature and is provided to assist thereader in reaching an opinion on the merit and likelihood of the company proceeding with the required investment. It includes prospectiveresources that are considered too uncertain with respect to the chance of development and chance of discovery to be classified as reserves.There is uncertainty that the risked net present value of future net revenue will be realized.
Summary of Risked Oil and Gas Prospective Resources as at December 31, 2016 (1) (2) - Forecast Prices and Costs (3) (4)
Light Crude Oil & Conventional Coal Bed Natural Gas BOE Unrisked
Resources Medium Crude Oil Natural Gas Methane Liquids BOEProject Chance ofMaturity Gross Net Gross Net Gross Net Gross Net Gross Net Commerci Gross NetSub-Class (Mbbl) (Mbbl) (MMcf) (MMcf) (MMcf) (MMcf) (Mbbl) (Mbbl) (Mboe) (Mboe) (%) (9) (Mboe) (Mboe)Prospective - Low EstimateProspect(10)
Australia(11) - - - - - - - - - - - - -Canada(12) 185 166 95,116 87,039 - - 5,458 4,703 21,496 19,376 32.9% 65,396 58,986 France(13) 3,379 3,044 - - - - - - 3,379 3,044 49.0% 6,898 6,253 Germany(14) - - 88,561 76,691 - - - - 14,760 12,782 24.6% 59,995 51,954 Ireland - - - - - - - - - - - - -Netherlands(15) - - 33,037 31,606 - - 16 14 5,522 5,282 11.6% 47,452 45,232 USA - - - - - - - - - - - - -Total 3,564 3,210 216,714 195,336 - - 5,474 4,717 45,157 40,484 25.1% 179,741 162,425 Prospective - Best EstimateProspect(10)
Australia(11) 579 579 - - - - - - 579 579 48.0% 1,207 1,027 Canada(12) 2,263 2,029 170,797 153,565 - - 10,195 8,412 40,924 36,035 34.3% 119,269 105,029 France(13) 9,609 8,532 - - - - - - 9,609 8,532 37.2% 25,835 22,939 Germany(14) - - 169,557 147,917 - - - - 28,260 24,653 24.6% 114,865 100,205 Ireland - - - - - - - - - - - - -Netherlands(15) - - 60,647 57,618 - - 30 27 10,138 9,630 11.8% 85,890 81,192 USA - - - - - - - - - - - - -Total 12,451 11,140 401,001 359,100 - - 10,225 8,439 89,510 79,429 25.8% 347,066 310,392 Prospective - High EstimateProspect(10)
Australia(11) 1,462 1,462 - - - - - - 1,462 1,462 48.0% 3,046 3,046 Canada(12) 2,394 2,142 244,013 217,049 - - 14,659 11,724 57,722 50,041 35.6% 162,333 140,646 France(13) 21,406 19,496 - - - - - - 21,406 19,496 48.4% 44,243 40,766 Germany(14) - - 289,626 254,136 - - - - 48,271 42,356 24.6% 196,205 172,162 Ireland - - - - - - - - - - - - -Netherlands(15) - - 114,102 106,974 - - 59 52 19,076 17,881 11.9% 159,744 148,690 USA - - - - - - - - - - - - -Total 25,262 23,100 647,741 578,159 - - 14,718 11,776 147,937 131,236 26.2% 565,571 505,310

Vermilion Energy Inc. AIF for the year ended December 31, 2016
68
Summary of Risked Net Present Value of Future Net Revenues as at December 31, 2016 - Forecast Prices and Costs (3)
Resources ProjectMaturity Sub-Class Before Income Taxes, Discounted at (5) After Income Taxes, Discounted at (5)
(M$) 0% 5% 10% 15% 20% 0% 5% 10% 15% 20%Prospective (Pr1) -Low Estimate (6)
Prospect (10)
Canada (12) 273,867 127,001 60,110 27,921 11,751 198,318 85,907 35,748 12,466 1,407 France (13) 151,213 75,323 38,554 20,217 10,789 102,347 48,093 22,638 10,518 4,652 Germany (14) 155,230 65,643 24,054 5,229 (3,139) 106,234 38,604 8,125 (4,675) (9,585)Netherlands (15) 146,420 81,758 50,537 34,384 25,278 75,803 39,394 21,746 13,088 8,573 Total 726,730 349,725 173,255 87,751 44,679 482,702 211,998 88,257 31,397 5,047 Prospective (Pr2) -Best Estimate (7)
Prospect (10)
Australia (11) 46,694 25,575 14,527 8,526 5,152 18,252 9,659 5,268 2,957 1,705 Canada (12) 727,622 350,852 183,676 102,149 59,257 528,484 248,071 122,227 63,175 33,061 France (13) 517,189 263,016 143,095 82,612 50,242 362,550 176,276 91,520 50,373 29,196 Germany (14) 572,696 240,171 105,603 47,332 20,454 415,985 166,082 66,349 24,697 6,525 Netherlands (15) 364,314 193,047 120,340 83,689 62,715 195,684 99,659 59,140 39,348 28,449 Total 2,228,515 1,072,661 567,241 324,308 197,820 1,520,955 699,747 344,504 180,550 98,936 Prospective (Pr3) -High Estimate (8)
Prospect (10)
Australia (11) 150,518 78,083 43,242 25,161 15,218 62,445 31,968 17,425 9,981 5,947 Canada (12) 1,110,298 500,889 256,708 143,539 85,330 808,440 354,301 174,070 92,184 51,196 France (13) 1,550,119 742,476 388,981 219,441 131,689 1,098,279 514,614 263,597 145,437 85,435 Germany (14) 1,215,756 520,750 240,583 116,696 57,872 897,478 370,617 162,227 72,477 31,319 Netherlands (15) 785,423 409,343 255,631 178,273 133,629 425,214 216,893 132,001 90,034 66,319 Total 4,812,114 2,251,541 1,185,145 683,110 423,738 3,291,856 1,488,393 749,320 410,113 240,216
Notes:(1) Prospective resources are defined in the COGEH as those quantities of petroleum estimated, as of a given date, to be potentially recoverable from unknown accumulations by
application of future development projects. Prospective resources have both an associated chance of discovery (CoDis) and a chance of development (CoDev). There is no certainty that any portion of the prospective resources will be discovered. If discovered, there is no certainty that it will be commercially viable to produce any portion of the prospective resources or that Vermilion will produce any portion of the volumes currently classified as prospective resources. The estimates of prospective resources involve implied assessment, based on certain estimates and assumptions, that the resources described exists in the quantities predicted or estimated, as at a given date, and that the resources can be profitably produced in the future. The risked net present value of the future net revenue from the prospective resources does not represent the fair market value of the prospective resources. Actual prospective resources (and any volumes that may be reclassified as reserves) and future production therefrom may be greater than or less than the estimates provided herein.
(2) GLJ prepared the estimates of prospective resources shown for each property using deterministic principles and methods. Probabilistic aggregation of the low and high property estimates shown in the table might produce different total volumes than the arithmetic sums shown in the table.
(3) The forecast price and cost assumptions utilized in the year-end 2016 reserves report were also utilized by GLJ in preparing the GLJ Resource Assessment. See ”GLJ December 31, 2016 Forecast Prices” in this AIF.
(4) "Gross” prospective resources are Vermilion's working interest (operating or non-operating) share before deduction of royalties and without including any royalty interests of Vermilion. "Net” prospective resources are Vermilion's working interest (operating or non-operating) share after deduction of royalty obligations, plus Vermilion's royalty interests in prospective resources.
(5) The risked net present value of future net revenue attributable to the prospective resources does not represent the fair market value of the prospective resources. Estimatedabandonment and reclamation costs have been included in the evaluation.
(6) This is considered to be a conservative estimate of the quantity that will actually be recovered. It is likely that the actual remaining quantities recovered will exceed the low estimate. If probabilistic methods are used, there should be at least a 90 percent probability (P90) that the quantities actually recovered will equal or exceed the low estimate.
(7) This is considered to be the best estimate of the quantity that will actually be recovered. It is equally likely that the actual remaining quantities recovered will be greater or less than the best estimate. If probabilistic methods are used, there should be at least a 50 percent probability (P50) that the quantities actually recovered will equal or exceed the best estimate.
(8) This is considered to be an optimistic estimate of the quantity that will actually be recovered. It is unlikely that the actual remaining quantities recovered will exceed the high estimate. If probabilistic methods are used, there should be at least a 10 percent probability (P10) that the quantities actually recovered will equal or exceed the high estimate.
(9) The chance of commerciality is defined as the product of the chance of discovery and the chance of development. Chance of discovery is defined in COGEH as the estimated probability that exploration activities will confirm the existence of a significant accumulation of potentially recoverable petroleum. Chance of development is defined as the estimated probability that, once discovered, a known accumulation will be commercially developed.
The Chance of Development (CoDev) is the estimated probability that, once discovered, a known accumulation will be commercially developed. Five factors have been considered in determining the CoDev as follows:
CoDev = Ps (Economic Factor) × Ps (Technology Factor) × Ps (Development Plan Factor) ×Ps (Development Timeframe Factor) × Ps (Other Contingency Factor) whereinPs is the probability of successEconomic Factor – For reserves to be assessed, a project must be economic. With respect to prospective resources, this factor captures uncertainty in the assessment of economic status principally due to uncertainty in cost estimates and marketing options. Economic viability uncertainty due to technology is more aptly captured with the Technology Factor. The Economic Factor will be 1 for reserves and will often be 1 for development pending and for projects with a development study or pre-development study with a robust rate of return. A robust rate of return means that the project retains economic status with variation in costs and/or marketing plans over the expected range of outcomes for these variables.Technology Factor - For reserves to be assessed, a project must utilize established technology. With respect to prospective resources, this factor captures the uncertainty in the viability of the proposed technology for the subject reservoir, namely, the uncertainty associated with technology under development. By definition, technology under development
Vermilion Energy Inc. AIF for the year ended December 31, 2016
69
is a recovery process or process improvement that has been determined to be technically viable via field test and is being field tested further to determine its economic viability in the subject reservoir. The Technology Factor will be 1 for reserves and for established technology. For technology under development, this factor will consider different risks associated with technologies being developed at the scale of the well versus the scale of a project and technologies which are being modified or extended for the subject reservoir versus new emerging technologies which have not previously been applied in any commercial application. The risk assessment will also consider the quality and sufficiency of the test data available, the ability to reliably scale such data and the ability to extrapolate results in time.Development Plan Factor – For reserves to be assessed, a project must have a detailed development plan. With respect to prospective resources, this factor captures the uncertainty in the project evaluation scenario. The Development Plan Factor will be 1 for reserves and high, approaching 1, for development pending projects. This factor will consider development plan detail variations including the degree of delineation, reservoir specific development and operating strategy detail (technology decision, well layouts (spacing and pad locations), completion strategy, start-up strategy, water source and disposal, other infrastructure, facility design, marketing plans etc.) and the quality of the cost estimates as provided by the developer.Development Timeframe Factor – In the case of major projects, for reserves to be assessed, first major capital spending must be initiated within 5 years of the effective date. The Development Timeframe Factor will be 1 for reserves and will often be 1 for development pending provided the project is planned on-stream based on the same criteria used in the assessment of reserves. With respect to prospective resources, the factor will approach 1 for projects planned on-stream with a timeframe slightly longer than the limiting reserves criteria. Other Contingency Factor – For reserves to be assessed, all contingencies must be eliminated. With respect to prospective resources, this factor captures major contingencies, usually beyond the control of the operator, other than those captured by economic status, technology status, project evaluation scenario status and the development timeframe. The Other Contingency Factor will be 1 for reserves and for development pending and less than 1 for on hold. Provided all contingencies have been identified and their resolution is reasonably certain, this factor would also be 1 for development unclarified.These factors may be inter-related (dependent) and care has been taken to ensure that risks are appropriately accounted.
The Chance of Discovery (CoDis) is defined in COGEH as the estimated probability that exploration activities will confirm the existence of a significant accumulation of potentially recoverable petroleum. Five factors have been considered in determining the CoDis as follows:
CoDis = Ps (Source) × Ps (Timing and Migration) × Ps (Trap) ×Ps (Seal) × Ps (Reservoir) whereinPs is the probability of successSource – For a significant accumulation of potentially recoverable petroleum, a viable source rock capable of generating hydrocarbons must exist. The probability of a source rock investigates stratigraphic presence and location, volumetric adequacy and organic richness of the proposed source rock. In proven hydrocarbon systems, this factor will be a 1. This factor becomes critical when looking at frontier basins. Timing and Migration - For a significant accumulation of potentially recoverable petroleum, the source rock must reach thermal maturity to generate the hydrocarbons and have a conduit with which to fill the closures that existed at the time of migration. The probability of timing and migration investigates the movement of hydrocarbons from the source rock to the trap. This factor evaluates the pathways and/or carrier beds, including fault systems, which can transport buoyant hydrocarbons from the source kitchen to the prospect area at a time that the trap existed. This factor is often 1 in producing trends, but there is a possibility of migration shadows where the conduits do not fill a viable trap, which would decrease this factor.Trap - For a significant accumulation of potentially recoverable petroleum, a reservoir must be present in a structural or stratigraphic closure. The trap factor looks at the definition of the geometry of the accumulation, which is determined using seismic, gravity and/or magnetic techniques and surrounding well logs to determine the probability of a significant accumulation. The risking of this includes examining data quality (e.g. 2D vs 3D seismic coverage) and potential depth conversion possibilities which give confidence in the mapped trap. Stratigraphic trap definition is used for volumetric calculations, but it is given a 1 for this chance factor as the stratigraphic risk will be captured in seal.Seal - For a significant accumulation of potentially recoverable petroleum, a reservoir must be sealed both on the top and laterally by a lithology that contains the hydrocarbon accumulation within the reservoir. It is also necessary that these accumulated hydrocarbons have been preserved from flushing or leakage. Factors that affect top, seat and lateral seals are fluid viscosity, bed thickness, natural continuity of sealing facies, differential permeability, fault history and reservoir pressures needed to maintain a hydrocarbon column. The probability that the accumulation is not able to be contained by the surrounding rocks is captured in this chance factor.Reservoir - For a significant accumulation of potentially recoverable petroleum, a reservoir rock must be present and have sufficient porosity and permeability and be of a sufficient thickness to produce quantities of mobile hydrocarbon. Under this approach, encountering wet, commercial quality and quantity sandstones would not be a failure in the reservoir category, but rather in one of the other factors. It is the reservoir along with the trap which determine the volumetrics of the accumulation.Serial multiplication of these five decimal fractions representing the five geologic chance factors can be done as they are considered independent of each other.
(10) GLJ has sub-classified the best estimate prospective resources by maturity status, consistent with the requirements of the COGE Handbook. These prospective resources have been sub-classified as “Prospect” which the COGE Handbook defines as a potential accumulation within a play that is sufficiently well defined to present a viable drilling target.
(11) Prospective resources for Australia have been estimated based on development timing and reservoir risk, GLJ has estimated the CoDev at 80% and the CoDis at 60%. The corresponding chance of commerciality is 48%. Risked best estimate prospective resources have been estimated at .06 mmboe. Utilizing established recovery technology, the risked estimated cost to bring these resources on commercial production is $17.2 MM. The expected development timeline is 8 years.
(12) Prospective resources for Canada have been estimated based on the individual prospects outlined below. GLJ has estimated the aggregate CoDev at 86% and the aggregate CoDis at 40%. The corresponding chance of commerciality is 34%. Risked best estimate prospective resources have been estimated at an aggregate of 40.9 mmboe. Utilizing established recovery technology, the risked estimated cost to bring these resources on commercial production is an aggregate of $621.9 MM. The expected development timeline is 2 to 20 years.
Wilrich Prospect: Based on reservoir risk, development timing and limited Wilrich development on the land base, GLJ has estimated the CoDev at 35% andthe CoDis at 85%. The corresponding chance of commerciality is 30%. Risked best estimate prospective resources have been estimated at 22.2 mmboe and the risked estimated cost to bring these resources on commercial production is $218 MM with an expected timeline of 2 to 8 years.
West Pembina Glauconite Prospect: Based on chance of discovery risk due to uncertainty regarding threshold for reservoir quality to support commercial development of
resources with horizontal drilling, along with economic risk related to capital and operating cost uncertainty due to limited horizontal development in proximity to interest lands and chance of development risk related to corporate commitment and development timing. GLJ has estimated the CoDev at 34% and the CoDis at 90%. The corresponding chance of commerciality is 31%. Risked best estimate prospective resources have been estimated at 8.4 mmboe and the risked estimated cost to bring these resources on commercial production is $242 MM with an expected timeline of 6 to 14 years.
Drayton ValleyNotikewin Prospect: Based on reservoir risk and development timing, GLJ has estimated the CoDev at 70% and the CoDis at 85%. The corresponding chance
of commerciality is 60%. Risked best estimate prospective resources have been estimated at 4.6 mmboe and the risked estimated cost to bring these resources on commercial production is $69.3 MM. The expected development timeline is 10 to 12 years.
Vermilion Energy Inc. AIF for the year ended December 31, 2016
70
Saskatchewan Prospects Based on reservoir risk and development timing, GLJ has estimated the CoDev at 90% and the CoDis at 80%. The corresponding chance of commerciality is 72%. Risked best estimate prospective resources have been estimated at 3.0 mmboe and the risked estimated cost to bring these resources on commercial production is $63.6 MM with an expected timeline of 7 to 12 years
Ferrier Falher Prospect Based on reservoir risk and development timing, GLJ has estimated the CoDev at 60% and the CoDis at 90%. The corresponding chance of commerciality is 54%. Risked best estimate prospective resources have been estimated at 2.6 mmboe and the risked estimated cost to bring these resources on commercial production is $24.9 MM with an expected timeline of 16 to 20 years.
Utikuma Gilwood Prospect Based on reservoir risk, development timing and limited Gilwood development in the area, GLJ has estimated the CoDev at 60% and the CoDis at 50%. The corresponding chance of commerciality is 30%. Risked best estimate prospective resources have been estimated at 0.2 mmboe and the risked estimated cost to bring these resources on commercial production is $3.2 MM with an expected timeline of 16 to 20 years.
(13) Prospective resources for France have been estimated based on the individual prospects outlined below. GLJ has estimated the aggregate CoDev at 52% and the aggregate CoDis at 71%. The corresponding chance of commerciality is 37%. Risked best estimate prospective resources have been estimated at an aggregate of 9.6 Utilizing established recovery technology, the risked estimated cost to bring these resources on commercial production is an aggregate of $254.3 MM. The expected development timeline is 3 to 12 years.
Rachee Prospect Based on risk of closure and data quality along with development timing, GLJ has estimated the CoDev at 80% and the CoDis at 80%. The corresponding chance of commerciality is 64%. Risked best estimate prospective resources have been estimated at 3.4 mmboe and the risked estimated cost to bring these resources on commercial production is $125.0 MM with an expected timeline of 10 to 14 years.
Malnoue Prospect Based on reservoir, structure and trap risk along with development timing, GLJ has estimated the CoDev at 70% and the CoDis at 38%. The corresponding chance of commerciality is 27%. Risked best estimate prospective resources have been estimated at 1.4 mmboe and the risked estimated cost to bring these resources on commercial production is $31.6 MM with an expected timeline of 8 to 12 years.
West Lavergne Prospect Based on structure risk and development timing GLJ has estimated the CoDev at 80% and the CoDis at 70%. The corresponding chance of commerciality is 56%. Risked best estimate prospective resources have been estimated at 1.2 mmboe and the risked estimated cost to bring these resources on commercial production is $6.1 MM with an expected timeline of 4 years.
Champotran Prospect Based on reservoir risk and development timing, GLJ has estimated the CoDev at 80% and the CoDis at 80%. The corresponding chance of commerciality is 64%. Risked best estimate prospective resources have been estimated at 0.7 mmboe and the risked estimated cost to bring these resources on commercial production is $14.6 MM with an expected timeline of 7 to 8 years.
Cazaux Prospect Based on reservoir risk and development timing, GLJ has estimated the CoDev at 70% and the CoDis at 30%. The corresponding chance of commerciality is 21%. Risked best estimate prospective resources have been estimated at 0.6 mmboe and the risked estimated cost to bring these resources on commercial production is $10.3 MM with an expected timeline of 5 to 7 years.
Vulaines Prospect Based on reservoir and structure risk along with development timing, GLJ has estimated the CoDev at 80% and the CoDis at 40%. The corresponding chance of commerciality is 32%. Risked best estimate prospective resources have been estimated at 0.6 mmboe and the risked estimated cost to bring these resources on commercial production is $12.6 MM with an expected timeline of 5 to 6 years.
Phobos Prospect Based on reservoir, and closure risk, economic factors and development timing, GLJ has estimated the CoDev at 50% and the CoDis at 50%. The corresponding chance of commerciality is 25%. Risked best estimate prospective resources have been estimated at 0.5 mmboe and the risked estimated cost to bring these resources on commercial production is $20.6 MM with an expected timeline of 9 to 10 years.
Charmottes Prospect Based on reservoir risk and development timing, GLJ has estimated the CoDev at 60% and the CoDis at 50%. The corresponding chance of commerciality is 30%. Risked best estimate prospective resources have been estimated at 0.5 mmboe and the risked estimated cost to bring these resources on commercial production is $18.5 MM with an expected timeline of 8 to 10 years.
Bernet Prospect Based on risks associated with reservoir, seal and trap along with economic factors, and development timing, GLJ has estimated the CoDev at 50% and the CoDis at 65%. The corresponding chance of commerciality is 33%. Risked best estimate prospective resources have been estimated at 0.3 mmboe and the risked estimated cost to bring these resources on commercial production is $6.7 MM with an expected timeline of 5 to 6 years.
Vert Le Grand Prospect Based on reservoir and structure risk along with development timing, GLJ has estimated the CoDev at 70% and the CoDis at 28%. Thecorresponding chance of commerciality is 20%. Risked best estimate prospective resources have been estimated at 0.2 mmboe and the risked estimated cost to bring these resources on commercial production is $3.6 MM with an expected timeline of 3 years.
Pays De Born Prospect Based on reservoir, seal and trap risk, along with economic factors and development timing, GLJ has estimated the CoDev at 50% and the CoDis at 50%. The corresponding chance of commerciality is 25%. Risked best estimate prospective resources have been estimated at 0.1 mmboe and the risked estimated cost to bring these resources on commercial production is $2.6 MM with an expected timeline of 8 to 9 years.
Les Genets Prospect Based on reservoir, seal and closure risk, along with economic factors and development timing, GLJ has estimated the CoDev at 60% and the CoDis at 16%. The corresponding chance of commerciality is 9.6%. Risked best estimate prospective resources have been estimated at 0.1 mmboe and the risked estimated cost to bring these resources on commercial production is $0.9 MM with an expected timeline of 9 years.
North Acacias Prospect Based on reservoir, seal and trap risk, along with economic factors and development timing, GLJ has estimated the CoDev at 70% and the CoDis at 39%. The corresponding chance of commerciality is 27%. Risked best estimate prospective resources have been estimated at 0.08 mmboe and the risked estimated cost to bring these resources on commercial production is $1.2 MM with an expected timeline of 6 to 7 years.

Vermilion Energy Inc. AIF for the year ended December 31, 2016
71
(14) Prospective resources for Germany have been estimated based on the individual prospects outlined below. GLJ has estimated the aggregate CoDev at 60% and the aggregate CoDis at 41%. The corresponding chance of commerciality is 25%. Risked best estimate prospective resources have been estimated at an aggregate of 28.3 mmboe. Utilizing established recovery technology, the risked estimated cost to bring these resources on commercial production is an aggregate of 173.6MM. The expected development timeline is 2 to 15 years.
Ihlow Prospect Based on reservoir, seal and trap risk along with development timing, GLJ has estimated the CoDev at 71%, and the CoDis at 51%. The corresponding chance of commerciality is 36%. Risked best estimate prospective resources have been estimated at 6.6 mmboe and the risked estimated cost to bring these resources on commercial production is $44.7 MM with an expected timeline of 8 years.
Wisselshorst A Prospect Based on seal and trap risk along with development timing , GLJ has estimated the CoDev at 90%, and the CoDis at 45%. The corresponding chance of commerciality is 41%. Risked best estimate prospective resources have been estimated at 4.8 mmboe and the risked estimated cost to bring these resources on commercial production is $32.2 MM with an expected timeline of 8 years.
Simonswolde South Prospect Based on reservoir, seal and trap risk along with development timing , GLJ has estimated the CoDev at 71%, and the CoDis at 48%. The corresponding chance of commerciality is 34%. Risked best estimate prospective resources have been estimated at 4.1 mmboe and the risked estimated cost to bring these resources on commercial production is $14.6 MM with an expected timeline of 10 years.
Klosterseelte Prospect Based on reservoir, seal and trap risk along with development timing, GLJ has estimated the CoDev at 49%, and the CoDis at 49%. The corresponding chance of commerciality is 24%. Risked best estimate prospective resources have been estimated at 2.8 mmboe and the risked estimated cost to bring these resources on commercial production is $12.2 MM with an expected timeline of 5 years.
Ohlendorf Prospect Based on source and trap risk along with development timing, GLJ has estimated the CoDev at 58%, and the CoDis at 30%. The corresponding chance of commerciality is 17%. Risked best estimate prospective resources have been estimated at 2.4 mmboe and the risked estimated cost to bring these resources on commercial production is $10.1 MM with an expected timeline of 15 years.
Wisselshorst B Prospect Based on reservoir, seal and trap risk along with development timing , GLJ has estimated the CoDev at 90%, and the CoDis at 38%. The corresponding chance of commerciality is 34%. Risked best estimate prospective resources have been estimated at 2.3 mmboe and the risked estimated cost to bring these resources on commercial production is $17.9 MM with an expected timeline of 11 years.
Jeddeloh Prospect Based on reservoir, seal and trap risk along with development timing, GLJ has estimated the CoDev at 38%, and the CoDis at 31%. The corresponding chance of commerciality is 12%. Risked best estimate prospective resources have been estimated at 2.3 mmboe and the risked estimated cost to bring these resources on commercial production is $18.5 MM with an expected timeline of 8 years.
Simonswolde North Prospect Based on reservoir, seal and trap risk along with development timing , GLJ has estimated the CoDev at 62%, and the CoDis at 45%. The corresponding chance of commerciality is 28%. Risked best estimate prospective resources have been estimated at 1.4 mmboe and the risked estimated cost to bring these resources on commercial production is $5.6 MM with an expected timeline of 8 years.
Uphuser Meer Prospect Based on reservoir, seal and trap risk along with development timing , GLJ has estimated the CoDev at 47%, and the CoDis at 51%. The corresponding chance of commerciality is 24%. Risked best estimate prospective resources have been estimated at 1.0 mmboe and the risked estimated cost to bring these resources on commercial production is $4.5 MM with an expected timeline of 9 years.
Burgmoor Z5 Prospect Based on reservoir, seal and trap risk along with development timing , GLJ has estimated the CoDev at 63%, and the CoDis at 52%. The corresponding chance of commerciality is 33%. Risked best estimate prospective resources have been estimated at 0.7 mmboe and the risked estimated cost to bring these resources on commercial production is $2.8 MM with an expected timeline of 2 years.
Wellie Prospect Based on reservoir, seal and source risk along with development timing, GLJ has estimated the CoDev at 32%, and the CoDis at 20%. The corresponding chance of commerciality is 6%. Risked best estimate prospective resources have been estimated at 0.3 mmboe and the risked estimated cost to bring these resources on commercial production is $3 MM with an expected timeline of 11 years.
Otterstedt Prospect Based on reservoir, seal and trap risk along with development timing , GLJ has estimated the CoDev at 46%, and the CoDis at 34%. The corresponding chance of commerciality is 16%. Risked best estimate prospective resources have been estimated at 0.3 mmboe and therisked estimated cost to bring these resources on commercial production is $3.2 MM with an expected timeline of 14 years..
Widdernhausen East Prospect Based on reservoir, seal and trap risk along with development timing, GLJ has estimated the CoDev at 32%, and the CoDis at 44%. The corresponding chance of commerciality is 14%. Risked best estimate prospective resources have been estimated at 0.3 mmboe and the risked estimated cost to bring these resources on commercial production is $2.1 MM with an expected timeline of 12 years.
Ostervesede Prospect Based on reservoir and seal risk along with development timing, GLJ has estimated the CoDev at 23%, and the CoDis at 25%. The corresponding chance of commerciality is 6%. Risked best estimate prospective resources have been estimated at 0.1 mmboe and the risked estimated cost to bring these resources on commercial production is $0.7 MM with an expected timeline of 11years.
(15) Prospective resources for Netherlands have been estimated based on the factors outlined below. GLJ has estimated the aggregate CoDev at 40% and the aggregate CoDis at 30%. The corresponding chance of commerciality is 12%. Risked best estimate prospective resources have been estimated at an aggregate of 10.1 mmboe. Utilizing established recovery technology, the risked estimated cost to bring these resources on commercial production is an aggregate of 88.2 MM with an expected timeline of 2 to 12 years.
Prospective resources for Netherlands East have been estimated based on the individual areas outlined below. GLJ has estimated the aggregate CoDev at 25% and the aggregate CoDis at 44%. The corresponding chance of commerciality is 11%. Risked best estimate prospective resources have been estimated at an aggregate of 8.0 mmboe and the risked estimated cost to bring these resources on commercial production is an aggregate of 66.3 MM with an expected timeline of 2 to 12 years.
Chance of discovery provided for 111 prospective reservoir targets across 92 prospective locations. Risk primarily associated with presence of reservoir and seal as region proven to have adequate source, migration and timing to charge target reservoirs.Chance of development risked to account for company commitment and development timing, anticipated timing for permitting in respective licenses and distance to export (i.e. pipeline/facility requirements to transport gas to sales point). Chance of development is also a function of prospect size.

Vermilion Energy Inc. AIF for the year ended December 31, 2016
72
92 prospects summed probabilistically across 13 development groups to appropriately allocate required infrastructure capital across multiple prospective targets within reasonable proximity. As probabilistic summation of the groups resulted in strong economic indicators, no further minimum economic field size calculations were applied as they were considered to have nominal impact.
Prospective resources for Netherlands West have been estimated based on the factors outlined below. GLJ has estimated the aggregate CoDev at 65% and the aggregate CoDis at 28%. The corresponding chance of commerciality is 18%. Risked best estimate prospective resources have been estimated at an aggregate of 2.1 mmboe and the risked estimated cost to bring these resources on commercial production is an aggregate of$ 21.8 MM with an expected timeline of 2 to 9 years.
Chance of discovery provided for 10 prospective reservoir targets across 11 prospective locations. Risk primarily associated with presence of reservoir and seal as region proven to have adequate source, migration and timing to charge target reservoirs.Chance of development risked to account for company commitment and development timing, anticipated timing for permitting in respective licenses and distance to export (i.e. pipeline/facility requirements to transport gas to sales point). Chance of development is also a function of prospect size.11 prospects summed probabilistically across 3 development groups to appropriately allocate required infrastructure capital across multiple prospective targets within reasonable proximity. As probabilistic summation of the groups resulted in strong economic indicators no further minimum economic field size calculations were applied as they were considered to have nominal impact.

Vermilion Energy Inc. AIF for the year ended December 31, 2016
73
APPENDIX BREPORT ON RESERVES DATA BY INDEPENDENT QUALIFIED RESERVES EVALUATOR OR AUDITOR (FORM 51-101F2)
To the Board of Directors of Vermilion Energy Inc. (the "Company"):
1. We have evaluated the Company’s reserves data as at December 31, 2016. The reserves data are estimates of proved reserves and probable reserves and related future net revenue as at December 31, 2016, estimated using forecast prices and costs.
2. The reserves data are the responsibility of the Company’s management. Our responsibility is to express an opinion on the reserves data based on our evaluation.
3. We carried out our evaluation in accordance with standards set out in the Canadian Oil and Gas Evaluation Handbook as amended from time to time (the "COGE Handbook") maintained by the Society of Petroleum Evaluation Engineers (Calgary Chapter).
4. Those standards require that we plan and perform an evaluation to obtain reasonable assurance as to whether the reserves data are free of material misstatement. An evaluation also includes assessing whether the reserves data are in accordance with principles and definitions presented in the COGE Handbook.
5. The following table shows the net present value of future net revenue (before deduction of income taxes) attributed to proved plus probable reserves, estimated using forecast prices and costs and calculated using a discount rate of 10 percent, included in the reserves data of the Company evaluated for the year ended December 2016, and identifies the respective portions thereof that we have evaluated and reported on to the Company's board of directors:
Location of Reserves Net Present Value of Future Net Revenue
Independent Qualified Effective Date of (Country or Foreign (before income taxes, 10% discount rate - M$)Reserves Evaluator Evaluation Report Geographic Area) Audited Evaluated Reviewed TotalGLJ Petroleum Consultants December 31, 2015 Australia - 376,474 - 376,474 GLJ Petroleum Consultants December 31, 2015 Canada - 1,416,572 - 1,416,572 GLJ Petroleum Consultants December 31, 2015 France - 1,569,992 - 1,569,992 GLJ Petroleum Consultants December 31, 2015 Germany - 77,544 - 77,544 GLJ Petroleum Consultants December 31, 2015 Ireland - 666,013 - 666,013 GLJ Petroleum Consultants December 31, 2015 Netherlands - 280,337 - 280,337 GLJ Petroleum Consultants December 31, 2015 USA - 70,085 - 70,085 Total - 4,457,018 - 4,457,018
6. In our opinion, the reserves data evaluated by us have, in all material respects, been determined and are in accordance with the COGE Handbook, consistently applied. We express no opinion on the reserves data that we reviewed but did not audit or evaluate.
7. We have no responsibility to update our reports referred to in paragraph 5 for events and circumstances occurring after the effective date of our reports.
8. Because the reserves data are based on judgements regarding future events, actual results will vary and the variations may be material.
EXECUTED as to our reports referred to above:
GLJ Petroleum Consultants Ltd., Calgary, Alberta, Canada, February 1, 2017
“Jodi L. Anhorn”Jodi L. Anhorn, M.Sc., P.Eng. Executive Vice President & COO

Vermilion Energy Inc. AIF for the year ended December 31, 2016
74
APPENDIX B - PART 2REPORT ON CONTINGENT RESOURCES DATA AND PROSPECTIVE RESOURCES DATA BY INDEPENDENT QUALIFIED
RESERVES EVALUATOR OR AUDITOR (FORM 51-101F2)
To the board of directors of Vermilion Energy Inc. (the "Company"):
1. We have evaluated the Company's contingent resources data and prospective resources data as at December 31, 2016. The contingentresources data and prospective resources data are risked estimates of volume of contingent resources and prospective resources andrelated risked net present value of future net revenue as at December 31, 2016, estimated using forecast prices and costs.
2. The contingent resources data and prospective resources data are the responsibility of the Company's management. Our responsibilityis to express an opinion on the contingent resources data and prospective resources data based on our evaluation.
3. We carried out our evaluation in accordance with standards set out in the Canadian Oil and Gas Evaluation Handbook as amendedfrom time to time (the "COGE Handbook") maintained by the Society of Petroleum Evaluation Engineers (Calgary Chapter).
4. Those standards require that we plan and perform an evaluation to obtain reasonable assurance as to whether the contingentresources data and prospective resources data are free of material misstatement. An evaluation also includes assessing whether thecontingent resources data and prospective resources data are in accordance with principles and definitions presented in the COGEHandbook.
5. The following tables set forth the risked volume and risked net present value of future net revenue of contingent resources and prospective resources (before deduction of income taxes) attributed to contingent resources and prospective resources, estimated using forecastprices and costs and calculated using a discount rate of 10 percent, included in the Company's statement prepared in accordance withForm 51-101F1 and identifies the respective portions of the contingent resources data and prospective resources data that we haveevaluated and reported on to the Company's board of directors:
Contingent Resources
Location of Resources Other than Reserves (Country or Foreign Geographic Area)
Net Present Value of Future NetRevenue (before income taxes,
Independent Risked 10% discount rate - M$)Qualified Reserves Effective Date of Volume
Classification Evaluator or Auditor Evaluation Report (Mboe) Audited Evaluated TotalDevelopment Pending Contingent Resources (2C) GLJ Petroleum Consultants December 31, 2016 Australia 2,440 - 36,438 36,438 Development Pending Contingent Resources (2C) GLJ Petroleum Consultants December 31, 2016 Canada 120,653 - 840,871 840,871 Development Pending Contingent Resources (2C) GLJ Petroleum Consultants December 31, 2016 France 27,751 - 508,686 508,686 Development Pending Contingent Resources (2C) GLJ Petroleum Consultants December 31, 2016 Germany 4,933 - 50,479 50,479 Development Pending Contingent Resources (2C) GLJ Petroleum Consultants December 31, 2016 Ireland - - - -Development Pending Contingent Resources (2C) GLJ Petroleum Consultants December 31, 2016 Netherlands 4,760 - 79,494 79,494 Development Pending Contingent Resources (2C) GLJ Petroleum Consultants December 31, 2016 USA 37,956 - 390,965 390,965 Total 198,493 - 1,906,933 1,906,933
Independent Qualified Reserves Evaluator or Auditor
Effective Date of Evaluation Report
Location of Resources Other than Reserves (Country or Foreign Geographic Area)
Risked Volume (Mboe)
Classification Development Unclarified Contingent Resources (2C) GLJ Petroleum Consultants December 31, 2016 Australia -Development Unclarified Contingent Resources (2C) GLJ Petroleum Consultants December 31, 2016 Canada 14,211 Development Unclarified Contingent Resources (2C) GLJ Petroleum Consultants December 31, 2016 France 2,539 Development Unclarified Contingent Resources (2C) GLJ Petroleum Consultants December 31, 2016 Germany -Development Unclarified Contingent Resources (2C) GLJ Petroleum Consultants December 31, 2016 Ireland -Development Unclarified Contingent Resources (2C) GLJ Petroleum Consultants December 31, 2016 Netherlands 2,757 Development Unclarified Contingent Resources (2C) GLJ Petroleum Consultants December 31, 2016 USA -Total 19,507

Vermilion Energy Inc. AIF for the year ended December 31, 2016
75
Prospective Resources
Independent Qualified Reserves Evaluator or Auditor
Effective Date of Evaluation Report
Location of Resources Other than Reserves (Country or Foreign Geographic Area)
Risked Volume (Mboe)Classification
Prospect Prospective Resources GLJ Petroleum Consultants December 31, 2016 Australia 579Prospect Prospective Resources GLJ Petroleum Consultants December 31, 2016 Canada 40,924 Prospect Prospective Resources GLJ Petroleum Consultants December 31, 2016 France 9,609 Prospect Prospective Resources GLJ Petroleum Consultants December 31, 2016 Germany 28,260 Prospect Prospective Resources GLJ Petroleum Consultants December 31, 2016 Ireland -Prospect Prospective Resources GLJ Petroleum Consultants December 31, 2016 Netherlands 10,138 Prospect Prospective Resources GLJ Petroleum Consultants December 31, 2016 USA -Total 89,510 6. In our opinion, the contingent resources data and prospective resources data respectively evaluated by us have, in all material respects,
been determined and are in accordance with the COGE Handbook, consistently applied. We express no opinion on the contingent resources data and prospective resources that we reviewed but did not audit or evaluate.
7. We have no responsibility to update our reports referred to in paragraph 5 for events and circumstances occurring after the effective date of our reports.
8. Because the contingent resources data and prospective resources data are based on judgments regarding future events, actual results will vary and the variations may be material.
EXECUTED as to our reports referred to above:
GLJ Petroleum Consultants Ltd., Calgary, Alberta, Canada, February 1, 2017
“Jodi L. Anhorn”Jodi L. Anhorn, M.Sc., P.Eng. Executive Vice President & COO
Vermilion Energy Inc. AIF for the year ended December 31, 2016
76
APPENDIX CREPORT OF MANAGEMENT AND DIRECTORS ON RESERVES DATA AND OTHER INFORMATION (FORM 51-101F3)
Terms to which a meaning is ascribed in National Instrument 51-101 have the same meaning herein.
Management of Vermilion Energy Inc. (the "Company") are responsible for the preparation and disclosure, or arranging for the preparation and disclosure of information with respect to the Company's oil and gas activities in accordance with securities regulatory requirements. This information includes reserves data, and includes contingent resources data and prospective resources data, which are estimates of proved reserves and probable reserves and related future net revenue as at December 31, 2016, estimated using forecast prices and costs.
Independent qualified reserves evaluators have evaluated the Company's reserves data, contingent resources data and prospective resources data. The report of the independent qualified reserves evaluators is presented in Schedule A to the Annual Information Form of the Company for the year ended December 31, 2016.
The Independent Reserves Committee of the Board of Directors of the Company has:
(a) reviewed the Company's procedures for providing information to the independent qualified reserves evaluators;
(b) met with the independent qualified reserves evaluators to determine whether any restrictions affected the ability of the independent qualified reserves evaluators to report without reservation; and
(c) reviewed the reserves data, contingent resources data and prospective resources data with Management and the independent qualified reserves evaluators.
The Independent Reserves Committee of the Board of Directors has reviewed the Company's procedures for assembling and reporting other information associated with oil and gas activities and has reviewed that information with Management. The Board of Directors has, on the recommendation of the Audit and Independent Reserves Committees, approved:
(a) the content and filing with securities regulatory authorities of Form 51-101F1 containing reserves data, contingent resources data and prospective resources data and other oil and gas information;
(b) the filing of Form 51-101F2 which is the report of the independent qualified reserves evaluators on the reserves data; and
(c) the content and filing of this report.
Because the reserves data, contingent resources data and prospective resources data are based on judgements regarding future events, actual results will vary and the variations may be material.
“Anthony Marino”Anthony Marino, President & Chief Executive Officer
“Curtis Hicks”Curtis W. Hicks, Executive Vice President and Chief Financial Officer
“Lorenzo Donadeo”Lorenzo Donadeo, Director and Chairman of the Board
“Claudio A. Ghersinich”Claudio A. Ghersinich, Director
February 24, 2017

Vermilion Energy Inc. AIF for the year ended December 31, 2016
77
APPENDIX DTERMS OF REFERENCE FOR THE AUDIT COMMITTEE
I. PURPOSE
The primary function of the Audit Committee (the "Committee") is to assist the Board in fulfilling its oversight responsibilities with respect to the Company’s accounting and financing reporting processes and the audit of the Company’s financial statements, including oversight of:
A. the integrity of the Company’s financial statements;
B. the Company’s compliance with legal and regulatory requirements;
C. the independent auditors’ qualifications and independence;
D. the financial information that will be provided to the Shareholders and others;
E. the Company’s systems of disclosure controls and internal controls regarding finance, accounting, legal compliance and ethics, which management and the Board have established;
F. the performance of the Company’s audit processes; and
G. such other matters required by applicable laws and rules of any stock exchange on which the Company’s shares are listed for trading.
While the Committee has the responsibilities and powers set forth in its terms of reference, it is not the duty of the Committee to prepare financial statements, plan or conduct audits or to determine that the Company’s financial statements and disclosures are complete and accurate and are in accordance with International Financial Reporting Standards and applicable rules and regulations. Primary responsibility for the financial reporting, information systems, risk management, and disclosure controls and internal controls of the Company is vested in management.
II. COMPOSITION AND OPERATIONS
A. The Committee shall be composed of not fewer than three directors and not more than five directors, all of whom are “independent”1 under the requirements or guidelines for audit committee service under applicable securities laws and rules of any stock exchange on which the Company’s shares are listed for trading.
B. All Committee members shall be "financially literate,"2 and at least one member shall have "accounting or related financial expertise" as such terms are interpreted by the Board in its business judgment in light of, and in accordance with, the requirements or guidelines for audit committee service under applicable securities laws and rules of any stock exchange on which the Company’s shares are listed for trading. The Committee may include a member who is not financially literate, provided he or she attains this status within a reasonable period of time following his or her appointment and providing the Board has determined that including such member will not materially adversely affect the ability of the Committee to act independently.
C. No Committee member shall serve on the audit committees of more than two other public issuers without prior determination by the Board that such simultaneous service would not impair the ability of such member to serve effectively on the Committee.
D. The Committee shall operate in a manner that is consistent with the Committee Guidelines outlined in Tab 8 of the Board Manual.
E. The Company's auditors shall be advised of the names of the Committee members and will receive notice of and be invited to attend meetings of the Committee, and to be heard at those meetings on matters relating to the auditor's duties.
F. The Committee may request any officer or employee of the Company, or the Company’s legal counsel, or any external or internal auditors to attend a meeting of the Committee to provide such pertinent information as the Committee requests or to meet with any members of, or consultants to the Committee. The Committee has the authority to communicate directly with the internal and external auditors as it deems appropriate to consider any matter that the Committee or auditors determine should be brought to the attention of the Board or Shareholders.
G. The Committee shall have the authority to select, retain, terminate and approve the fees and other retention terms of special independent legal counsel and other consultants or advisers to advise the Committee, as it deems necessary or appropriate, at the Company’s expense.
1 Committee members must be “independent”, as defined in Sections 1.4 and 1.5 of National Instrument 52-110 and ‘‘independent’’ under the requirements of Rule 10A-3 of the Securities
Exchange Act of 1934, as amended, and Section 303A.06 of the NYSE Listed Company Manual. 2 The Board has adopted the NI 52-110 definition of "financial literacy", which is an individual is financially literate if he or she has the ability to read and understand a set of financial
statements that present a breadth and level of complexity of accounting issues that are generally comparable to the breadth and complexity of the issues that can reasonably be expected to be raised by the issuer's financial statements.

Vermilion Energy Inc. AIF for the year ended December 31, 2016
78
APPENDIX DTERMS OF REFERENCE FOR THE AUDIT COMMITTEE (CONTINUED)
H. The Company shall provide for appropriate funding, as determined by the Committee, for payment of (i) compensation to the independent auditors engaged for the purpose of preparing or issuing an audit report or performing other audit review or attest services for the Company, (ii) compensation to any advisers employed by the Committee and (iii) ordinary administrative expenses of the Committee that are necessary or appropriate for carrying out its duties.
I. The Committee shall meet at least four times each year.
III. DUTIES AND RESPONSIBILITIES
Subject to the powers and duties of the Board, the Committee will perform the following duties:
A. Financial Statements and Other Financial Information
The Committee will review and recommend for approval to the Board financial information that will be made publicly available. This includes the responsibility to:
i) review and recommend approval of the Company's annual financial statements, MD&A and earnings press release and report to the Board of Directors before the statements are approved by the Board of Directors;
ii) review and recommend approval for release the Company's quarterly financial statements, MD&A and press releases, as well as financial information and earnings guidance provided to analysts and rating agencies;
iii) satisfy itself that adequate procedures are in place for the review of the public disclosure of financial information extracted or derived from the Company's financial statements, other than the public disclosure referred to in items (i) and (ii) above, and periodically assess the adequacy of those procedures; and
iv) review the Annual Information Form and any Prospectus/Private Placement Memorandums.
Review, and where appropriate, discuss:
v) the appropriateness of critical accounting policies and financial reporting practices used by the Company;vi) major issues regarding accounting principles and financial statement presentations, including any significant proposed changes in
financial reporting and accounting principles, policies and practices to be adopted by the Company and major issues as to theadequacy of the Company’s internal controls and any special audit steps adopted in light of material control deficiencies;
vii) analyses prepared by management or the external auditor setting forth significant financial reporting issues and judgments made in connection with the preparation of the financial statements, including analyses of the effects of alternative International Financial Reporting Standards (“IFRS”) methods on the financial statements of the Company and any other opinions sought by management from an independent or other audit firm or advisor with respect to the accounting treatment of a particular item;
viii) any management letter or schedule of unadjusted differences provided by the external auditor and the Company’s response to that letter and other material written communication between the external auditor and management;
ix) any problems, difficulties or differences encountered in the course of the audit work including any disagreements with management or restrictions on the scope of the external auditor’s activities or on access to requested information and management’s response thereto;
x) any new or pending developments in accounting and reporting standards that may affect the Company;xi) the effect of regulatory and accounting initiatives, as well as any off-balance sheet structures on the financial statements of the
Company and other financial disclosures;xii) any reserves, accruals, provisions or estimates that may have a significant effect upon the financial statements of the Company; xiii) the use of special purpose entities and the business purpose and economic effect of off balance sheet transactions, arrangements,
obligations, guarantees and other relationships of Company and their impact on the reported financial results of the Company;xiv) the use of any “pro forma” or “adjusted” information not in accordance with generally accepted accounting principles;xv) any litigation, claim or contingency, including tax assessments, that could have a material effect upon the financial position of the
Company, and the manner in which these matters may be, or have been, disclosed in the financial statements; andxvi) accounting, tax and financial aspects of the operations of the Company as the Committee considers appropriate.

Vermilion Energy Inc. AIF for the year ended December 31, 2016
79
APPENDIX DTERMS OF REFERENCE FOR THE AUDIT COMMITTEE (CONTINUED)
B. Risk Management, Internal Control and Information Systems
The Committee will review and discuss with management, and obtain reasonable assurance that the risk management, internal control and information systems are operating effectively to produce accurate, appropriate and timely management and financial information. This includes the responsibility to:
i) review the Company's risk management controls and policies with specific responsibility for Credit & Counterparty, Market & Financial, Political and Strategic & Repatriation risks;
ii) obtain reasonable assurance that the information systems are reliable and the systems of internal controls are properly designed and effectively implemented through separate and periodic discussions with and reports from management, the internal auditor and external auditor; and
iii) review management steps to implement and maintain appropriate internal control procedures including a review of policies.
C. External Audit
The external auditor is required to report directly to the Committee, which will review the planning and results of external audit activities and the ongoing relationship with the external auditor. This includes:
i) review and recommend to the Board, for Shareholder approval, the appointment of the external auditor;ii) review and approve the annual external audit plan, including but not limited to the following:
a) engagement letter between the external auditor and financial management of the Company;b) objectives and scope of the external audit work;c) procedures for quarterly review of financial statements;d) materiality limit;e) areas of audit risk;f) staffing;g) timetable; andh) compensation and fees to be paid by the Company to the external auditor.
iii) meet with the external auditor to discuss the Company's quarterly and annual financial statements and the auditor's report including the appropriateness of accounting policies and underlying estimates;
iv) maintain oversight of the external auditor's work and advise the Board, including but not limited to:a) the resolution of any disagreements between management and the external auditor regarding financial reporting;b) any significant accounting or financial reporting issue;c) the auditors' evaluation of the Company's system of internal controls, procedures and documentation;d) the post audit or management letter containing any findings or recommendation of the external auditor, including management's
response thereto and the subsequent follow-up to any identified internal control weaknesses;e) any other matters the external auditor brings to the Committee's attention; andf) evaluate and assess the qualifications and performance of the external auditors for recommendation to the Board as to the
appointment or reappointment of the external auditor to be proposed for approval by the Shareholders, and ensuring that such auditors are participants in good standing pursuant to applicable regulatory laws.
v) review the auditor's report on all material subsidiaries;vi) review and discuss with the external auditors all significant relationships that the external auditors and their affiliates have with the
Company and its affiliates in order to determine the external auditors' independence, including, without limitation:a) requesting, receiving and reviewing, on a periodic basis, a formal written statement from the external auditors, including a list of
all relationships between the external auditor and the Company that may reasonably be thought to bear on the independence of the external auditors with respect to the Company;
b) discussing with the external auditors any disclosed relationships or services that the external auditors believe may affect the objectivity and independence of the external auditors; and
c) recommending that the Board take appropriate action in response to the external auditors' report to satisfy itself of the external auditors' independence.
vii) annually request and review a report from the external auditor regarding (a) the external auditor’s quality-control procedures, (b) any material issues raised by the most recent quality-control review, or peer review, of the external auditor, or by any inquiry or investigation by governmental or professional authorities within the preceding five years respecting one or more independent audits carried out by the firm, and (c) any steps taken to deal with any such issues;
viii) review and pre-approve any non-audit services to be provided to the Company or any affiliates by the external auditor's firm or its affiliates (including estimated fees), and consider the impact on the independence of the external audit;
ix) review the disclosure with respect to its pre-approval of audit and non-audit services provided by the external auditors; andx) meet periodically, and at least annually, with the external auditor without management present.

Vermilion Energy Inc. AIF for the year ended December 31, 2016
80
APPENDIX DTERMS OF REFERENCE FOR THE AUDIT COMMITTEE (CONTINUED)
D. Compliance
The Committee shall:i) Ensure that the external auditor's fees are disclosed by category in the Annual Information Form in compliance with regulatory
requirements;ii) Disclose any specific policies or procedures adopted for pre-approving non-audit services by the external auditor including affirmation
that they meet regulatory requirements;iii) Assist the Governance and Human Resources Committee with preparing the Company's governance disclosure by ensuring it has
current and accurate information on:a) the independence of each Committee member relative to regulatory requirements for audit committees;b) the state of financial literacy of each Committee member, including the name of any member(s) currently in the process of
acquiring financial literacy and when they are expected to attain this status; andc) the education and experience of each Committee member relevant to his or her responsibilities as Committee member.
iv) Disclose, if required, if the Company has relied upon any exemptions to the requirements for committees under applicable securities laws and rules of any stock exchange on which the Company’s shares are listed for trading.
E. Other
The Committee shall:
i) establish and periodically review procedures for:a) the receipt, retention and treatment of complaints received by the Company regarding accounting, internal accounting controls,
or auditing matters; andb) the confidential, anonymous submission by employees of concerns regarding questionable accounting or auditing matters or
other matters that could negatively affect the Company, such as violations of the Code of Business Conduct and Ethics.ii) review and approve the Company's hiring policies regarding partners, employees and former partners and employees of the present
and former external auditor;iii) review insurance coverage of significant business risks and uncertainties;iv) review material litigation and its impact on financial reporting;v) review policies and procedures for the review and approval of officers' expenses and perquisites;vi) review the policies and practices concerning the expenses and perquisites of the Chairman, including the use of the assets of the
Company;vii) review with external auditors any corporate transactions in which directors or officers of the Company have a personal interest; andviii) review the terms of reference for the Committee at least annually and otherwise as it deems appropriate, and recommend changes to
the Board as required. The Committee shall evaluate its performance with reference to the terms of reference annually.IV. ACCOUNTABILITY
D. The Committee Chair has the responsibility to make periodic reports to the Board, as requested, on financial and other matters considered by the Committee relative to the Company.
E. The Committee shall report its discussions to the Board by maintaining minutes of its meetings and providing an oral report at the next Board meeting.