Table of Contents - ecologyandsociety.org · Table of Contents Linkages Among Water Vapor Flows,...
39
Table of Contents Linkages Among Water Vapor Flows, Food Production, and Terrestrial Ecosystem Services ........................0 ABSTRACT ...................................................................................................................................................0 INTRODUCTION.........................................................................................................................................1 INVISIBLE GREEN WATER VAPOR AND VISIBLE BLUE LIQUID WATER .....................................2 ESTIMATING WATER VAPOR FLOWS OF MAJOR TERRESTRIAL BIOMES..................................3 Grasslands, wetlands, woodlands, and forests ..................................................................................6 Croplands ..........................................................................................................................................7 Results of water vapor estimates of major terrestrial biomes ...........................................................7 ESTIMATING TOTAL WATER VAPOR FLOWS FROM CONTINENTS..............................................9 INTERRELATIONS BETWEEN WATER VAPOR FLOWS AND TERRESTRIAL ECOSYSTEM SERVICES 0 FRESHWATER, FOOD, AND ECOSYSTEM SERVICES FOR A GROWING HUMAN POPULATION 1 INTENTIONAL ECOHYDROLOGICAL LANDSCAPE MANAGEMENT ............................................13 CONCLUSIONS ..........................................................................................................................................14 RESPONSES TO THIS ARTICLE.............................................................................................................14 Acknowledgments: .......................................................................................................................................15 LITERATURE CITED................................................................................................................................15 APPENDIX 1 ...............................................................................................................................................18 APPENDIX 2 ...............................................................................................................................................27 APPENDIX 3 ...............................................................................................................................................31 APPENDIX 4 ...............................................................................................................................................32
Transcript of Table of Contents - ecologyandsociety.org · Table of Contents Linkages Among Water Vapor Flows,...
Table of Contents
Linkages Among Water Vapor Flows, Food Production, and Terrestrial Ecosystem Services........................0ABSTRACT...................................................................................................................................................0INTRODUCTION.........................................................................................................................................1INVISIBLE GREEN WATER VAPOR AND VISIBLE BLUE LIQUID WATER.....................................2ESTIMATING WATER VAPOR FLOWS OF MAJOR TERRESTRIAL BIOMES..................................3
Grasslands, wetlands, woodlands, and forests..................................................................................6Croplands..........................................................................................................................................7Results of water vapor estimates of major terrestrial biomes...........................................................7
ESTIMATING TOTAL WATER VAPOR FLOWS FROM CONTINENTS..............................................9INTERRELATIONS BETWEEN WATER VAPOR FLOWS AND TERRESTRIAL ECOSYSTEM SERVICES0FRESHWATER, FOOD, AND ECOSYSTEM SERVICES FOR A GROWING HUMAN POPULATION1INTENTIONAL ECOHYDROLOGICAL LANDSCAPE MANAGEMENT............................................13CONCLUSIONS..........................................................................................................................................14RESPONSES TO THIS ARTICLE.............................................................................................................14Acknowledgments:.......................................................................................................................................15LITERATURE CITED................................................................................................................................15APPENDIX 1...............................................................................................................................................18APPENDIX 2...............................................................................................................................................27APPENDIX 3...............................................................................................................................................31APPENDIX 4...............................................................................................................................................32
Linkages Among Water Vapor Flows, FoodProduction, and Terrestrial Ecosystem ServicesJohan Rockström1,2, Line Gordon2, Carl Folke2,3, Malin Falkenmark4,5, and Maria Engwall2
1RELMA; 2Stockholm University; 3Beijer International Institute of Ecological Economics; 4Swedish NaturalScience Research Council; 5Stockholm International Water Institute (SIWI)
• Abstract• Introduction• Invisible Green Water Vapor and Visible Blue Liquid Water• Estimating Water Vapor Flows of Major Terrestrial Biomes
♦ Grasslands, Wetlands, Woodlands, and Forests♦ Croplands♦ Results of Water Vapor Estimates of Major Terrestrial Biomes
• Estimating Total Water Vapor Flows from Continents• Interrelations between Water Vapor Flows and Terrestrial Ecosystem Services• Freshwater, Food, and Ecosystem Services for a Growing Human Population• Intentional Ecohydrological Landscape Management• Conclusions• Responses to this Article• Acknowledgments• Literature Cited• Appendix 1: Total water vapor flows from croplands• Appendix 2: Total water vapor flow from forests/woodlands, wetlands, and grasslands• Appendix 3: Estimating evaporating surface runoff from croplands• Appendix 4: Cited literature in appendices
ABSTRACT
Global freshwater assessments have not addressed the linkages among water vapor flows, agricultural foodproduction, and terrestrial ecosystem services. We perform the first bottom−up estimate of continental watervapor flows, subdivided into the major terrestrial biomes, and arrive at a total continental water vapor flow of70,000 km3/yr (ranging from 56,000 to 84,000 km3/yr). Of this flow, 90% is attributed to forests, includingwoodlands (40,000 km3/yr), wetlands (1400 km3/yr), grasslands (15,100 km3/yr), and croplands (6800 km3/yr).These terrestrial biomes sustain society with essential welfare−supporting ecosystem services, including foodproduction. By analyzing the freshwater requirements of an increasing demand for food in the year 2025, wediscover a critical trade−off between flows of water vapor for food production and for other welfare−supportingecosystem services. To reduce the risk of unintentional welfare losses, this trade−off must become embedded inintentional ecohydrological landscape management.
KEY WORDS:catchment management, ecohydrological landscape, evapotranspiration, food production, freshwater management,global freshwater assessment, resilience, terrestrial ecosystem services, trade−offs, water use efficiency, water vapor flows.
Published August 6, 1999.
INTRODUCTION
Earth is a human−dominated planet. The well−being of humanity is intimately dependent upon the ecologicallife−support systems now undergoing rapid changes (Vitousek et al. 1986, Lubchenco 1998). The capacity ofecological systems to continuously supply a flow of nature's services to humanity is largely taken for granted (deGroot 1992, Daily 1997), despite the fact that this capacity is increasingly becoming a limiting factor forsocioeconomic development (Odum 1989, Folke 1991, Jansson et al. 1994).
In many areas, both locally and regionally, available freshwater is already a limiting factor for industrialdevelopment, household needs, and irrigation of crops (Gleick 1993, Falkenmark 1997). An estimated 25% of theworld's food market is at present driven by water scarcity, i.e., food is imported due to insufficient irrigationwater for local food production (Postel 1998). A recent analysis indicates that 55% of the world population in2025 will live in countries incapable of self−sufficient food production, due to lack of water for irrigatedagriculture (Falkenmark 1997). Furthermore, water quality deterioration caused by human activities isdiminishing the quantity of freshwater available to society (Lundqvist 1998). Recent estimates indicate thathumanity appropriates for industry, households, and irrigated agriculture 54% of the global accessible runoffflow (Postel et al. 1996).
However, freshwater − the bloodstream of the biosphere − is also needed to drive critical processes and functionsin forests, woodlands, wetlands, grasslands, croplands, and other terrestrial systems, and to maintain themresilient to change. These systems generate numerous essential ecosystem services, including biomass productionin agriculture and forestry (Costanza et al. 1997). Surprisingly, past international global freshwater assessmentsof whether or not humanity is heading toward regional and even a global water crisis, have neglected the watervapor flows supporting the generation of ecosystem services (Gleick 1993, UN−SEI 1997). Generally, it is onlythe liquid runoff water, moving across the continents in rivers and as groundwater flow, that is perceived as thefreshwater resource for socioeconomic development. Even if there is reason to be concerned over future liquidwater use, by far the largest proportion of terrestrial production of food, biomass, and the generation of otherecosystem services originates from rain−fed land use. As an example, around two−thirds of the world's food,harvested from 83% of the world's croplands, is derived from rain−fed production (Gleick 1993).
In this article, we perform the first bottom−up calculation of continental water vapor flows. The estimate isgeneralized from field studies of water vapor flows from different biomes, focusing in particular on croplands,grasslands, forests, woodlands, and wetlands, biomes of great significance for the generation of terrestrialecosystem services. The estimate includes calculations of a range of water requirements for terrestrial biomes,depending on water management and annual climatic variations.
We begin to address the complex, but largely neglected, issue of the interplay among water vapor flows,agricultural food production, and the generation of ecosystem services in terrestrial biomes. Our findingshighlight the fact that the critical issue of how to feed a growing human population through agricultural foodproduction cannot be tackled in isolation from the freshwater−dependent generation of ecosystem services in thesurrounding landscape.

INVISIBLE GREEN WATER VAPOR AND VISIBLE BLUELIQUID WATER
In the Introduction, we distinguished between water vapor flows and liquid water flows. In the literature on waterand food production, water vapor and liquid water are sometimes called green water and blue water, respectively(Falkenmark 1995). Both concepts provide useful tools for the analysis of local, regional, and global flows in thehydrologic cycle. Liquid (blue) water flow is the total runoff originating from the partitioning of precipitation atthe land surface (forming surface runoff ) and the partitioning of soil water (forming groundwater recharge) (Fig.1). Water vapor (green) is the return flow of water to the atmosphere as evapotranspiration (ET), which includestranspiration by vegetation and evaporation from soil, lakes, and water intercepted by canopy surfaces(Rockström 1997). We regard ET as the result of the work of the whole ecosystem, including the resilience itneeds for securing the generation of ecosystem services in the long run.
Fig. 1. The hydrological cycle, showing the repartitioning of rainfall into vapor and liquid freshwater flow (modifiedfrom Jansson et al. 1999).
Previous estimates, e.g., L'vovich and White (1990), have calculated ET indirectly as the difference betweenprecipitation, P, over continents (110,305 km3/yr) and total runoff, R, (38,230 km3/yr), arriving at 72,075 km3/yr.It should, however, be noted that in areas where data on rainfall and river flow did not exist, the estimates weredone using the six component model developed by L'vovich (1979), in which runoff is estimated from regressioncurves related to rainfall, and the partitioning between drainage and evapotranspiration is through proportionalitycurves specific for different biomes.
ESTIMATING WATER VAPOR FLOWS OF MAJORTERRESTRIAL BIOMES
The distribution of ecosystems on a global scale is, to a large extent, governed by climatic factors including wateravailability, but it can also be influenced by natural or human−induced disturbance regimes. When water is infree supply, the ET from a complete green canopy of standard crop can be predicted directly from climaticfactors (Thornwaite and Mather 1955, Penman 1963). This is called potential ET. The actual ET of an ecosystem,however, is dependent on (1) the water supply, limited by the amount of precipitation, on−flow of water, andability to store water in the system; and (2) the processes in an ecosystem that modify the amount of waterflowing in and out from the system. These processes, necessary for the generation of ecosystem services, includethe development of deep or shallow rooting structures, transformation of topography, and changes in size of leafarea, and they are largely dependent on the quality of the soil. The ET of an ecosystem is thus not only a factor ofclimate but also a result of the ability of the biota to modify the available water flow.
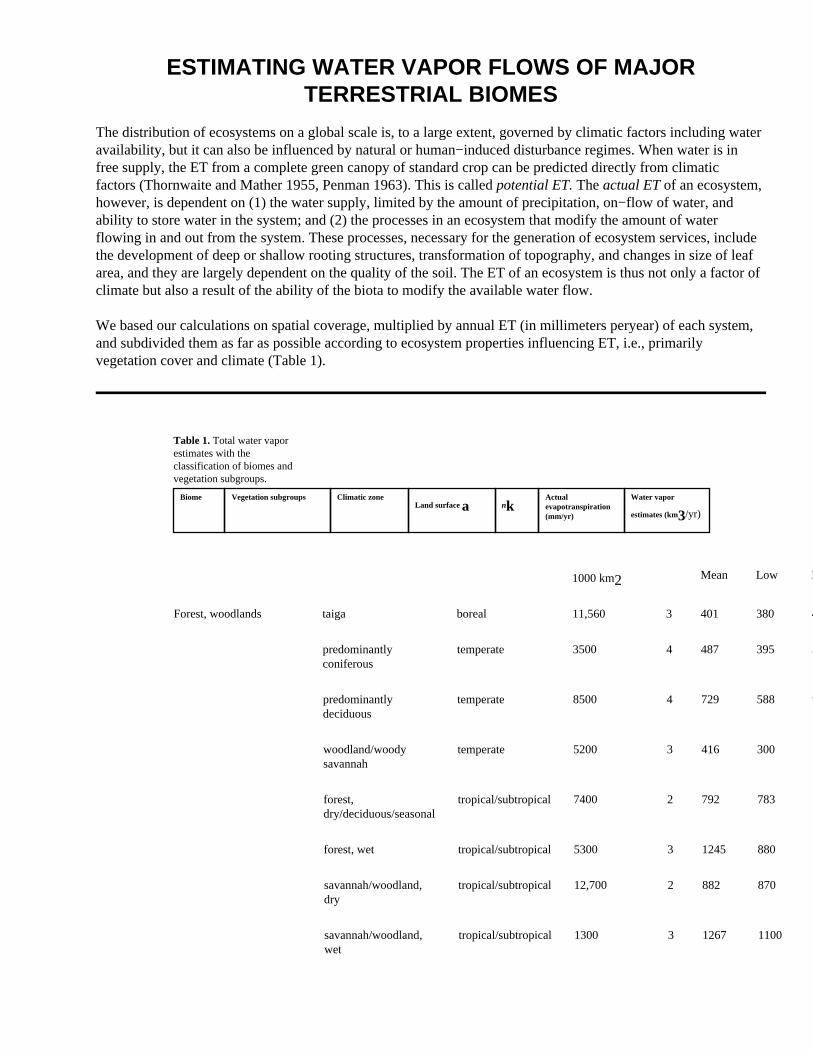
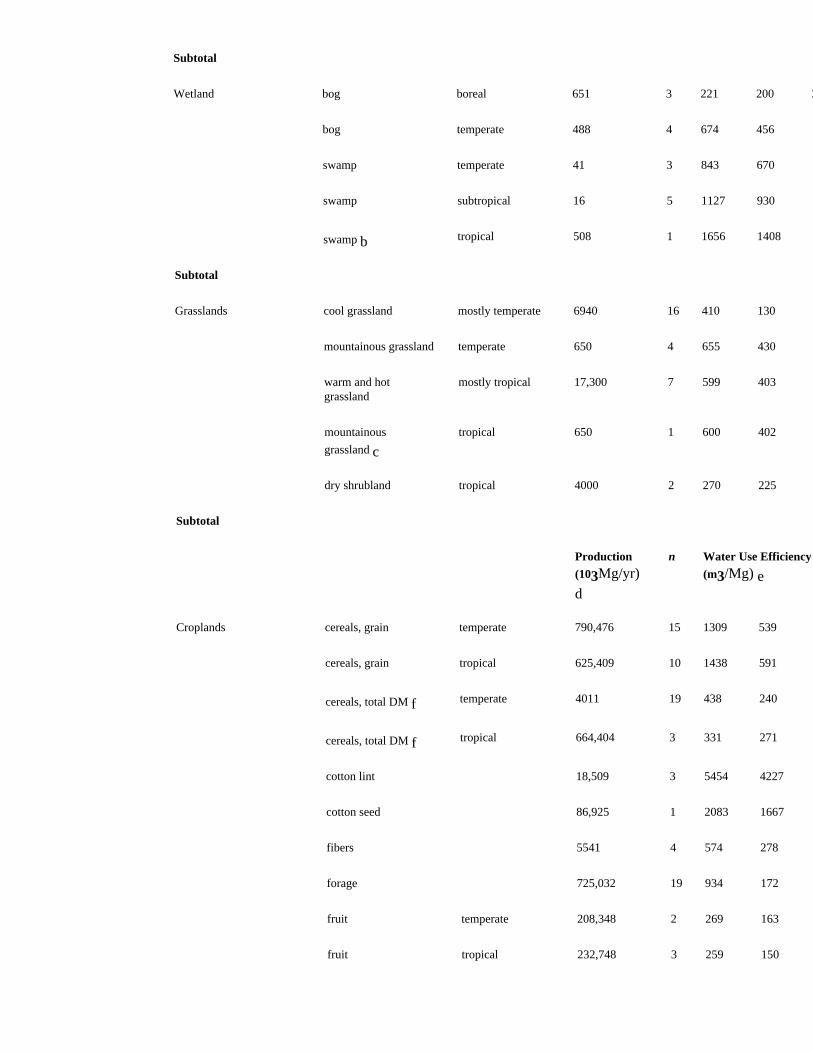
We based our calculations on spatial coverage, multiplied by annual ET (in millimeters peryear) of each system,and subdivided them as far as possible according to ecosystem properties influencing ET, i.e., primarilyvegetation cover and climate (Table 1).
Table 1. Total water vaporestimates with theclassification of biomes andvegetation subgroups.
Biome Vegetation subgroups Climatic zoneLand surface a nk
Actualevapotranspiration(mm/yr)
Water vapor
estimates (km3/yr)
1000 km2 Mean Low High Mean Low High
Forest, woodlands taiga boreal 11,560 3 401 380 420 4636 4393 4855
predominantlyconiferous
temperate 3500 4 487 395 580 1705 1383 2030
predominantlydeciduous
temperate 8500 4 729 588 964 6199 4998 8194
woodland/woodysavannah
temperate 5200 3 416 300 530 2165 1560 2756
forest,dry/deciduous/seasonal
tropical/subtropical 7400 2 792 783 800 5857 5794 5920
forest, wet tropical/subtropical 5300 3 1245 880 1493 6600 4664 7913
savannah/woodland,dry
tropical/subtropical 12,700 2 882 870 894 11,201 11,049 11,354
savannah/woodland,wet
tropical/subtropical 1300 3 1267 1100 1500 1647 1430 1950
Subtotal 40,009 35,271 44,972
Wetland bog boreal 651 3 221 200 260 144 130 169
bog temperate 488 4 674 456 1020 329 223 498
swamp temperate 41 3 843 670 720 35 27 30
swamp subtropical 16 5 1127 930 1277 18 15 20
swamp b tropical 508 1 1656 1408 1904 841 715 967
Subtotal 1366 1110 1684
Grasslands cool grassland mostly temperate 6940 16 410 130 633 2843 900 4393
mountainous grassland temperate 650 4 655 430 951 426 280 618
warm and hotgrassland
mostly tropical 17,300 7 599 403 862 10,356 6967 14,913
mountainous
grassland c
tropical 650 1 600 402 798 390 261 519
dry shrubland tropical 4000 2 270 225 315 1080 900 1260
Subtotal 15,095 9308 21,702
Production
(103Mg/yr)
d
n Water Use Efficiency
(m3/Mg) e
Croplands cereals, grain temperate 790,476 15 1309 539 2643 1095 564 1919
cereals, grain tropical 625,409 10 1438 591 4369 764 555 1178
cereals, total DM f temperate 4011 19 438 240 646 56 31 83
cereals, total DM f tropical 664,404 3 331 271 372 235 217 247
cotton lint 18,509 3 5454 4227 6313 101 78 117
cotton seed 86,925 1 2083 1667 2500 181 144 217
fibers 5541 4 574 278 870 3 2 5
forage 725,032 19 934 172 2810 641 249 1403
fruit temperate 208,348 2 269 163 375 58 34 78
fruit tropical 232,748 3 259 150 350 60 35 81

natural rubber/gums 6088 2 30,137 29,167 31,108 183 178 189
nuts g 6929 1 415 200 1080 2 1 6
oil−bearing crops temperate 35,454 3 1892 1530 2117 64 54 72
oil−bearing crops tropical 55,225 2 3083 2667 3500 71 70 92
oil palm h 6,604,000
km2
1 1500mm
1250mm
1750mm
242 212 278
pulses, dry seed temperate 43,493 3 3355 1731 5833 157 75 197
pulses, dry seed tropical 166,338 5 1866 1250 3003 283 214 370
pulses, green seed temperate 9326 2 1149 583 1714 12 5 16
rice 540,838 4 1099 839 1404 594 454 759
roots and tubers temperate 558,137 7 286 139 402 144 94 217
roots and tubers g tropical 330,786 1 616 369 1299 204 122 430
roots, tubers for
fodder f
temperate 11,105 8 326 157 616 4 2 7
spices i 4091 0 1000 800 1500 4 3 6
stimulant crops 791 3 4515 2083 6983 33 28 74
sugar cane 1,120,898 3 123 100 163 138 112 182
vegetables j 549,683 6 147 35 500 75 22 242
Subtotal 5404 3552 8427
Total 61,879 49,280 76,800
a Land surfaces for forests and grasslands are derived from Olson et al. (1983); land surfaces for wetlandsare from Matthews (1983).
b Low/high values are based on the mean +/− 15%.
c Low/high values are based on the mean +/− 33%, based on the average standard deviation of the othersubgroups in grasslands.
d Production data are from the FAO (Faostat 1997).
e Note that only the aggregate average WUE values for similar crops are presented in Table 1. For example,the WUE values and the water vapor estimates for cereals/temperate in Table 1 are derived from individualvalues for each major cereal (wheat, barley, oats, rye, and buckwheat).
f The WUE was calculated based on the total dry matter yield.
g The mean WUE comes from only one article; the low and high are the variations within that article.
h For oil palms, which are harvested on the same area for oil, kernels, and fruit, the total freshwater used wascalculated by
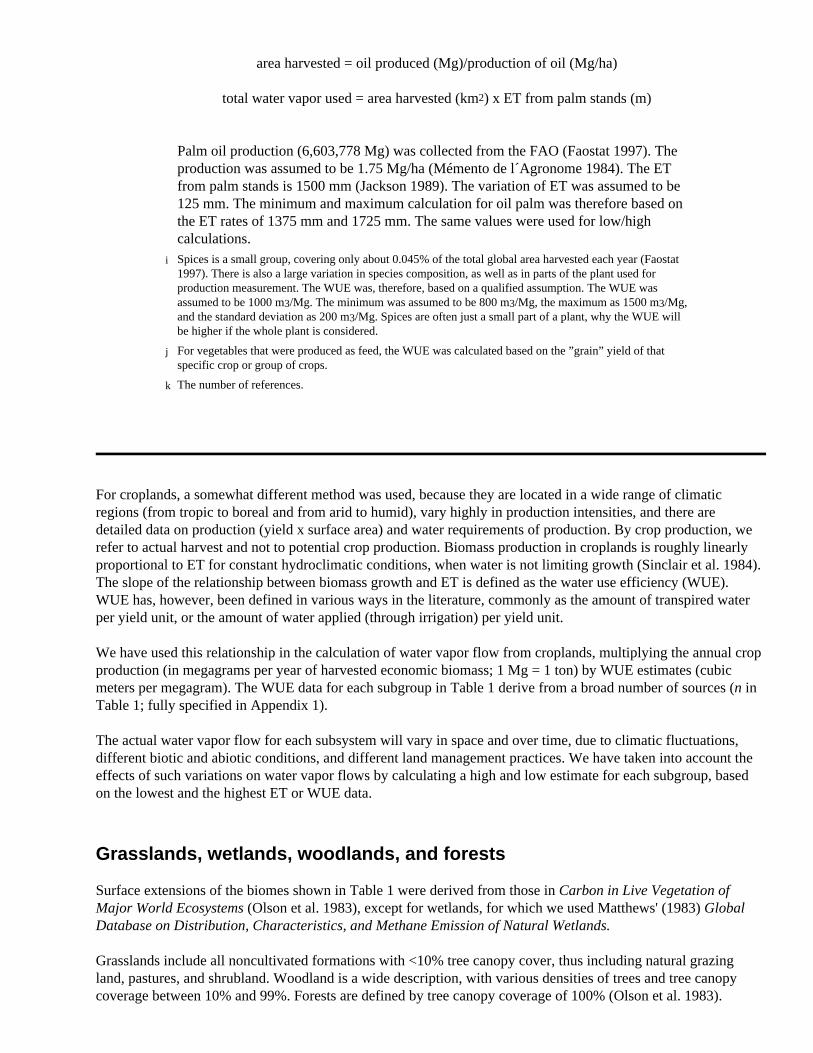
area harvested = oil produced (Mg)/production of oil (Mg/ha)
total water vapor used = area harvested (km2) x ET from palm stands (m)
Palm oil production (6,603,778 Mg) was collected from the FAO (Faostat 1997). Theproduction was assumed to be 1.75 Mg/ha (Mémento de l´Agronome 1984). The ETfrom palm stands is 1500 mm (Jackson 1989). The variation of ET was assumed to be125 mm. The minimum and maximum calculation for oil palm was therefore based onthe ET rates of 1375 mm and 1725 mm. The same values were used for low/highcalculations.
i Spices is a small group, covering only about 0.045% of the total global area harvested each year (Faostat1997). There is also a large variation in species composition, as well as in parts of the plant used forproduction measurement. The WUE was, therefore, based on a qualified assumption. The WUE wasassumed to be 1000 m3/Mg. The minimum was assumed to be 800 m3/Mg, the maximum as 1500 m3/Mg,and the standard deviation as 200 m3/Mg. Spices are often just a small part of a plant, why the WUE willbe higher if the whole plant is considered.
j For vegetables that were produced as feed, the WUE was calculated based on the ”grain” yield of thatspecific crop or group of crops.
k The number of references.
For croplands, a somewhat different method was used, because they are located in a wide range of climaticregions (from tropic to boreal and from arid to humid), vary highly in production intensities, and there aredetailed data on production (yield x surface area) and water requirements of production. By crop production, werefer to actual harvest and not to potential crop production. Biomass production in croplands is roughly linearlyproportional to ET for constant hydroclimatic conditions, when water is not limiting growth (Sinclair et al. 1984).The slope of the relationship between biomass growth and ET is defined as the water use efficiency (WUE).WUE has, however, been defined in various ways in the literature, commonly as the amount of transpired waterper yield unit, or the amount of water applied (through irrigation) per yield unit.
We have used this relationship in the calculation of water vapor flow from croplands, multiplying the annual cropproduction (in megagrams per year of harvested economic biomass; 1 Mg = 1 ton) by WUE estimates (cubicmeters per megagram). The WUE data for each subgroup in Table 1 derive from a broad number of sources (n inTable 1; fully specified in Appendix 1).
The actual water vapor flow for each subsystem will vary in space and over time, due to climatic fluctuations,different biotic and abiotic conditions, and different land management practices. We have taken into account theeffects of such variations on water vapor flows by calculating a high and low estimate for each subgroup, basedon the lowest and the highest ET or WUE data.
Grasslands, wetlands, woodlands, and forests
Surface extensions of the biomes shown in Table 1 were derived from those in Carbon in Live Vegetation ofMajor World Ecosystems (Olson et al. 1983), except for wetlands, for which we used Matthews' (1983) GlobalDatabase on Distribution, Characteristics, and Methane Emission of Natural Wetlands.
Grasslands include all noncultivated formations with <10% tree canopy cover, thus including natural grazingland, pastures, and shrubland. Woodland is a wide description, with various densities of trees and tree canopycoverage between 10% and 99%. Forests are defined by tree canopy coverage of 100% (Olson et al. 1983).
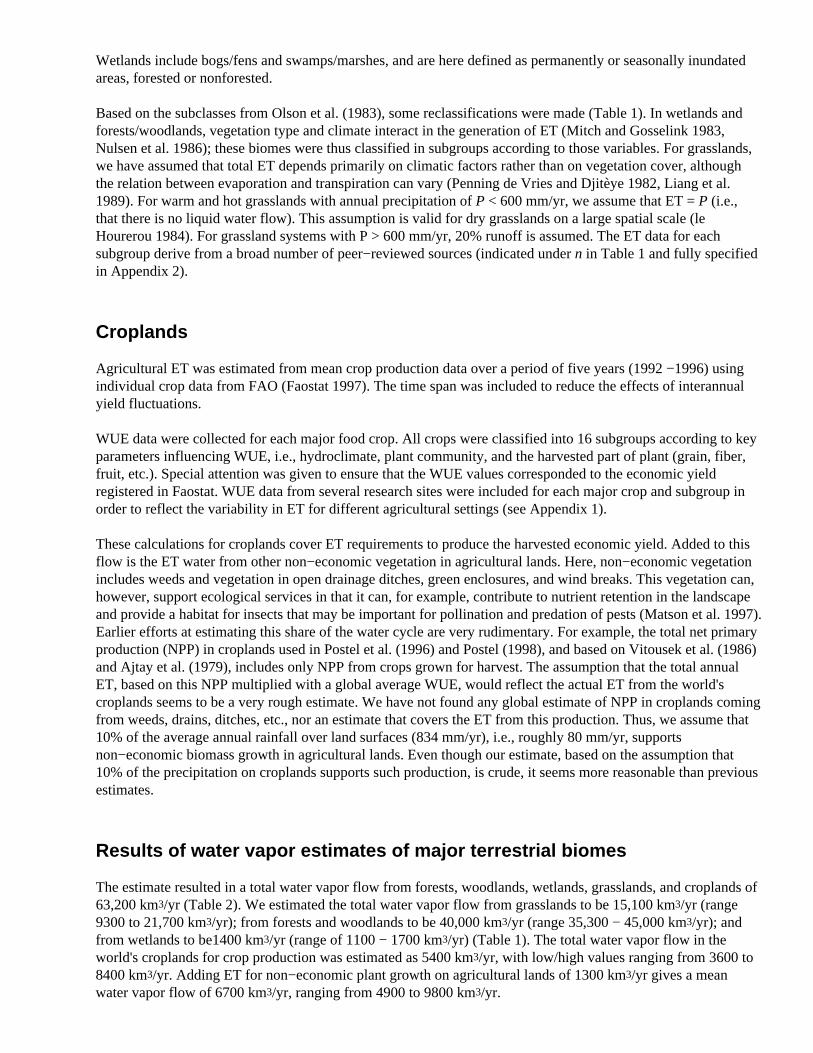
Wetlands include bogs/fens and swamps/marshes, and are here defined as permanently or seasonally inundatedareas, forested or nonforested.
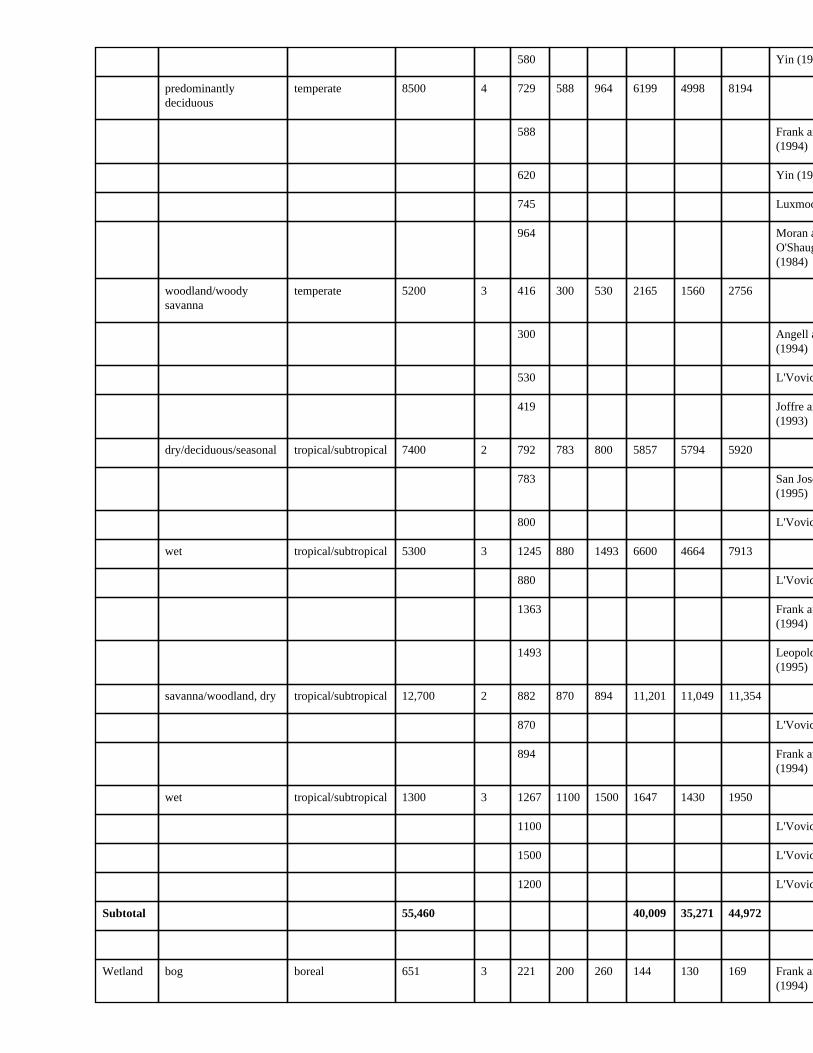
Based on the subclasses from Olson et al. (1983), some reclassifications were made (Table 1). In wetlands andforests/woodlands, vegetation type and climate interact in the generation of ET (Mitch and Gosselink 1983,Nulsen et al. 1986); these biomes were thus classified in subgroups according to those variables. For grasslands,we have assumed that total ET depends primarily on climatic factors rather than on vegetation cover, althoughthe relation between evaporation and transpiration can vary (Penning de Vries and Djitèye 1982, Liang et al.1989). For warm and hot grasslands with annual precipitation of P < 600 mm/yr, we assume that ET = P (i.e.,that there is no liquid water flow). This assumption is valid for dry grasslands on a large spatial scale (leHourerou 1984). For grassland systems with P > 600 mm/yr, 20% runoff is assumed. The ET data for eachsubgroup derive from a broad number of peer−reviewed sources (indicated under n in Table 1 and fully specifiedin Appendix 2).
Croplands
Agricultural ET was estimated from mean crop production data over a period of five years (1992 −1996) usingindividual crop data from FAO (Faostat 1997). The time span was included to reduce the effects of interannualyield fluctuations.
WUE data were collected for each major food crop. All crops were classified into 16 subgroups according to keyparameters influencing WUE, i.e., hydroclimate, plant community, and the harvested part of plant (grain, fiber,fruit, etc.). Special attention was given to ensure that the WUE values corresponded to the economic yieldregistered in Faostat. WUE data from several research sites were included for each major crop and subgroup inorder to reflect the variability in ET for different agricultural settings (see Appendix 1).
These calculations for croplands cover ET requirements to produce the harvested economic yield. Added to thisflow is the ET water from other non−economic vegetation in agricultural lands. Here, non−economic vegetationincludes weeds and vegetation in open drainage ditches, green enclosures, and wind breaks. This vegetation can,however, support ecological services in that it can, for example, contribute to nutrient retention in the landscapeand provide a habitat for insects that may be important for pollination and predation of pests (Matson et al. 1997).Earlier efforts at estimating this share of the water cycle are very rudimentary. For example, the total net primaryproduction (NPP) in croplands used in Postel et al. (1996) and Postel (1998), and based on Vitousek et al. (1986)and Ajtay et al. (1979), includes only NPP from crops grown for harvest. The assumption that the total annualET, based on this NPP multiplied with a global average WUE, would reflect the actual ET from the world'scroplands seems to be a very rough estimate. We have not found any global estimate of NPP in croplands comingfrom weeds, drains, ditches, etc., nor an estimate that covers the ET from this production. Thus, we assume that10% of the average annual rainfall over land surfaces (834 mm/yr), i.e., roughly 80 mm/yr, supportsnon−economic biomass growth in agricultural lands. Even though our estimate, based on the assumption that10% of the precipitation on croplands supports such production, is crude, it seems more reasonable than previousestimates.
Results of water vapor estimates of major terrestrial biomes
The estimate resulted in a total water vapor flow from forests, woodlands, wetlands, grasslands, and croplands of63,200 km3/yr (Table 2). We estimated the total water vapor flow from grasslands to be 15,100 km3/yr (range9300 to 21,700 km3/yr); from forests and woodlands to be 40,000 km3/yr (range 35,300 − 45,000 km3/yr); andfrom wetlands to be1400 km3/yr (range of 1100 − 1700 km3/yr) (Table 1). The total water vapor flow in theworld's croplands for crop production was estimated as 5400 km3/yr, with low/high values ranging from 3600 to8400 km3/yr. Adding ET for non−economic plant growth on agricultural lands of 1300 km3/yr gives a meanwater vapor flow of 6700 km3/yr, ranging from 4900 to 9800 km3/yr.

Table 2. Bottom−up estimate ofglobal water vapor flows from thecontinents.
Water vapor sourceOur estimates (km3/yr)
Earlierestimates
(km3/yr)
References
Major terrestrial biomes
Croplands 6800 2285 −5500
Postel et al. (1996),Shiklomanov(1996), Postel(1998)
Temperate and tropicalgrasslands
15,100 5800 Postel et al. (1996)
Temperate and tropical forests,woodlands, and taiga
40,000 6800 Postel et al. (1996)
Bogs, fens, swamps, and marshes 1400
Subtotal 63,200 14,885−18,100
Other systems
Green areas in urban settlements 100 100 Postel et al. (1996)
Upstream rural water use 210
Lake evaporation 600 600 L´vovich (1979)
Evaporation from large reservoirs
(>100 x 106 m3) 130 130 L´vovich and
White (1990)
Evaporation from small
reservoirs (<100 x 106 m3) 30
Tundra and deserts 5700
Subtotal 6800 830
Total 70,000 15,715−18,930
We believe our estimates to be conservative, especially for agriculture. Our ET estimates for crop production

only relate to harvested yield after reduction for threshing and post−harvest losses (which can amount to > 20%of the ET−demanding crop on the farmer's field). The WUE data used in this article originate from researchstations that generally have more favorable cultivation conditions than does the farmer, which results in higherWUE values than under on−farm conditions. Our data show that, on average, some 1400 m3 of ET flow is neededto produce 1 Mg of cereal grain in the tropics. There are, however, many research findings suggesting that WUEis much lower in farmers' fields, often amounting to some 3000 − 6000 m3/Mg (Dancette 1983, Rockström et al.1998). This is explained by relatively lower soil fertility, higher runoff losses, and less advanced landmanagement practices on−farm, and will result in lower yields (< 1000 kg/ha in sub−Saharan Africa) and highersoil evaporation losses. This low WUE in agriculture is reflected by the high estimate in Table 1 of 8427 km3/yrfor crops.
The aggregate estimate in Table 1 ranges from 49,000 to 77,000 km3/yr, which is roughly a deviation of 14,000km3/yr from the mean. The large fluctuations in water vapor flow within the subgroups mainly reflect fourdifferent sources of variation: location, climatic fluctuations, land management, and random error. It is worthmentioning that the fluctuation of annual rainfall over land surfaces is of the same order of magnitude as ourestimated water vapor fluctuations, and varies between 90,000 and 120,000 km3/yr. The considerable variationsin water vapor use suggest that mean water vapor estimates, especially for agriculture, are of limited interest inassessing regional and global freshwater needs. The range includes parameters that we cannot influence (e.g., soilproperties and hydroclimatic fluctuations), but also factors that we can influence through integrated land andfreshwater management.
The large range also indicates that there is an important potential for improving WUE in agriculture. Cropmanagement, such as choice of cultivars, planting density, crop protection, and soil and water management, willaffect the ratio between ET and yield and, thereby, WUE. In soil and water management, care must be taken withnutrients and soil structure in order to minimize the effects of erosion and runoff. Variations in WUE for aspecific crop species also illustrate the capacity of a certain crop to grow in a spectrum of hydroclimates (e.g.,maize from humid to semiarid tropics).
Postel et al. (1996) estimated the freshwater requirements for the annual human appropriation of net primaryproduction of grasslands to be 5800 km3/yr, and of harvested forest products to be 6800 km3/yr. Postel (1998)also estimated the annual human appropriation for total food production (including croplands, grazing lands,irrigation water losses, and aquaculture) to be 13,800 km3/yr.
In summary, earlier estimates suggest that humans depend on some 14,900−15,800 km3/yr (Table 2) of watervapor to support human−appropriated primary production. This corresponds to 21−22% of the top−downestimate by L'vovich and White (1990) of water vapor flow from continents (72,075 km3/yr). Our results indicatethat the major terrestrial biomes appropriate as much as 88% of this water vapor flow.
ESTIMATING TOTAL WATER VAPOR FLOWS FROMCONTINENTS
As shown in Table 2, our estimated average water vapor flow from croplands, forests, woodlands, grasslands,and wetlands amounts to 63,200 km3/yr. By adding water vapor flows from remaining continental systems, weperform, to our knowledge, the first bottom−up calculation of total water vapor flows from continents. Theestimate is generalized from field studies of water vapor flows from different biomes.
Evapotranspiration from green areas in urban settlements has been estimated at 100 km3/yr (Postel et al. 1996),and vapor flows from lakes account for an estimated 600 km3/yr (L'vovich 1979). Added to this is the complexgrey zone of domestic water use by rural societies. The magnitude of this upstream rural water evaporating afteruse is difficult to estimate. If 82% of the population in developing countries (estimated from WRI 1994 and FAO
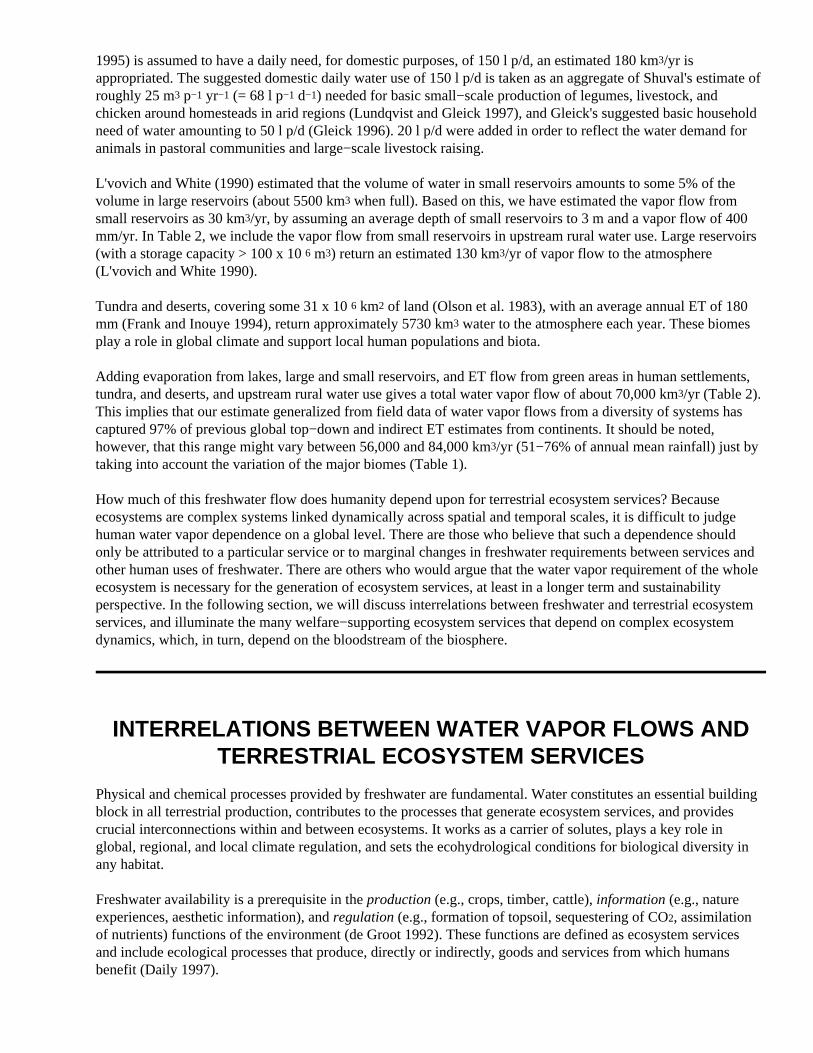
1995) is assumed to have a daily need, for domestic purposes, of 150 l p/d, an estimated 180 km3/yr isappropriated. The suggested domestic daily water use of 150 l p/d is taken as an aggregate of Shuval's estimate ofroughly 25 m3 p−1 yr−1 (= 68 l p−1 d−1) needed for basic small−scale production of legumes, livestock, andchicken around homesteads in arid regions (Lundqvist and Gleick 1997), and Gleick's suggested basic householdneed of water amounting to 50 l p/d (Gleick 1996). 20 l p/d were added in order to reflect the water demand foranimals in pastoral communities and large−scale livestock raising.
L'vovich and White (1990) estimated that the volume of water in small reservoirs amounts to some 5% of thevolume in large reservoirs (about 5500 km3 when full). Based on this, we have estimated the vapor flow fromsmall reservoirs as 30 km3/yr, by assuming an average depth of small reservoirs to 3 m and a vapor flow of 400mm/yr. In Table 2, we include the vapor flow from small reservoirs in upstream rural water use. Large reservoirs(with a storage capacity > 100 x 10 6 m3) return an estimated 130 km3/yr of vapor flow to the atmosphere(L'vovich and White 1990).
Tundra and deserts, covering some 31 x 10 6 km2 of land (Olson et al. 1983), with an average annual ET of 180mm (Frank and Inouye 1994), return approximately 5730 km3 water to the atmosphere each year. These biomesplay a role in global climate and support local human populations and biota.
Adding evaporation from lakes, large and small reservoirs, and ET flow from green areas in human settlements,tundra, and deserts, and upstream rural water use gives a total water vapor flow of about 70,000 km3/yr (Table 2).This implies that our estimate generalized from field data of water vapor flows from a diversity of systems hascaptured 97% of previous global top−down and indirect ET estimates from continents. It should be noted,however, that this range might vary between 56,000 and 84,000 km3/yr (51−76% of annual mean rainfall) just bytaking into account the variation of the major biomes (Table 1).
How much of this freshwater flow does humanity depend upon for terrestrial ecosystem services? Becauseecosystems are complex systems linked dynamically across spatial and temporal scales, it is difficult to judgehuman water vapor dependence on a global level. There are those who believe that such a dependence shouldonly be attributed to a particular service or to marginal changes in freshwater requirements between services andother human uses of freshwater. There are others who would argue that the water vapor requirement of the wholeecosystem is necessary for the generation of ecosystem services, at least in a longer term and sustainabilityperspective. In the following section, we will discuss interrelations between freshwater and terrestrial ecosystemservices, and illuminate the many welfare−supporting ecosystem services that depend on complex ecosystemdynamics, which, in turn, depend on the bloodstream of the biosphere.
INTERRELATIONS BETWEEN WATER VAPOR FLOWS ANDTERRESTRIAL ECOSYSTEM SERVICES
Physical and chemical processes provided by freshwater are fundamental. Water constitutes an essential buildingblock in all terrestrial production, contributes to the processes that generate ecosystem services, and providescrucial interconnections within and between ecosystems. It works as a carrier of solutes, plays a key role inglobal, regional, and local climate regulation, and sets the ecohydrological conditions for biological diversity inany habitat.
Freshwater availability is a prerequisite in the production (e.g., crops, timber, cattle), information (e.g., natureexperiences, aesthetic information), and regulation (e.g., formation of topsoil, sequestering of CO2, assimilationof nutrients) functions of the environment (de Groot 1992). These functions are defined as ecosystem servicesand include ecological processes that produce, directly or indirectly, goods and services from which humansbenefit (Daily 1997).
Crops, trees, cattle, and other biomass production depend on accessible renewable freshwater. Nature requireswater for food web support to wildlife and for maintenance of habitats in which they live. The processes oftopsoil formation in forests and croplands and nutrient retention in wetlands involve water. Grassland systemsdevelop patchy dynamics that respond to water availability by redistributing water and nutrients in the landscapefor improved performance (Walker 1993). Ecosystem services of tropical rain forests depend both on watertranspired by vegetation and on evaporation that supports species adapted to a moist environment.
Ecosystems are interconnected by liquid water and water vapor flows. Forests are linked to other systems such asgrasslands and wetlands, both directly and indirectly, in ways in which freshwater plays a critical role.Freshwater directly transports mineral nutrients and organic matter between systems. Indirectly, freshwatersupports services across ecosystems, such as the spreading of seeds, both directly by water and indirectly aswater is needed to sustain a habitat for mobile organisms that spread seeds, and to sustain a habitat for bees andother insects that are important for pollination. The biota play an important role in the regulation of atmosphericwater by redirecting liquid water to water vapor flow, thereby recycling it to local rainfall. This can be of greatsignificance, e.g., in the Sahel region where > 90% of the rainfall appears to be attributed to ET flow fromvegetated land surfaces (Savenije 1995). Furthermore, terrestrial ecosystems contribute to freshwater qualitythrough biochemical processes such as denitrification and other forms of microbiological activity, and byfacilitating infiltration, thereby moderating river flow seasonality, erosion, and flooding.
Freshwater is also required for ecosystem resilience. Resilience is the buffer capacity to disturbance performedby functional groups of species linked in complex temporal and spatial webs of interactions (Peterson et al.1998). Dynamics of ecosystems (Holling 1986) and variability in water flow patterns can interact and respond toeach other with feedback mechanisms at different temporal and spatial scales (Mitch and Gosselink 1983, Swanket al. 1988). Forest fires can cause huge runoff increases that may impact on downstream systems, as experiencedin Australia (E. O'Laughlin, Canberra, Australia, personal communication). Resilience makes it possible for aforest to absorb a fire and maintain the potential to reorganize and recover, thereby continuing to supplyecosystem services essential to society, and also to reduce negative effects on downstream water−ecosystemservices for other human uses. Similarly, grasslands have adapted to disturbances such as invasion of grazers orinsects, fire, and periods of flooding or drought, and need the dynamic interactions of biological diversity torespond in a resilient fashion to these disturbances (Walker 1993). Freshwater is a key driverin these dynamics.
Putting freshwater in such an ecological context and in the light of data in Tables 1 and 2 suggests that thedegrees of freedom for production of life support for the expanding world population is limited. There will befundamental trade−offs between food production and other welfare−supporting ecosystem services in terms ofavailable freshwater.
FRESHWATER, FOOD, AND ECOSYSTEM SERVICES FOR AGROWING HUMAN POPULATION
The per capita dependence on water vapor for production of food in croplands is roughly 1180 m3/yr, based on apopulation of 5.7 billion people in 1995 (UN 1997). Recognizing that the human population probably will reach6 billion within the next few months, we used data from 1995, as they can be compared with the data on cropproduction that we have used, which refer to the years 1992−1996. Future demand for food will involve anincreased appropriation in terms of additional water vapor flow for crop production. (Grasslands also providefood in terms of animal protein. However, because grazing is only one of multiple functions in the grasslandsystem, and is also a process within the system, it would be misleading to try to estimate how much of the 2650m3 p−1 yr−1 of water vapor estimated here from grasslands is attributed to cattle production).
L'vovich and White (1990) have estimated the changes in runoff during the past 300 years (1680−1980) causedby redirections of liquid water to water vapor flows through irrigation. Their results suggest that the water vapor

flows have increased from 86 km3/yr to 2570 km3/yr during this period. In the coming 100 years, they estimate afurther doubling in response to food production needs. Considerable changes in water vapor and liquid waterflow patterns seem unavoidable.
Using the human population increase reported by the United Nations (UN 1997), i.e., an increase of 2.6 to 8.3billion in 2025, and assuming a current per capita water vapor use for crop production, we calculate an additionalwater need of 3100 km3/yr in 2025. This would imply a total crop water demand in 2025 of about 9,800 km3/yr, a31% increase in freshwater demand for crop production. Could we appropriate this amount of freshwater in atrade−off−free manner toward other terrestrial biomes? We have identified three possible options.
The first option, propagated by international organizations (e.g., FAO, UNDP, IIMI), is to increase irrigatedagriculture. According to Shiklomanov (1997), the increase in ET in irrigated agriculture by 2025 would amountto 425 km3/yr, or about 14% of the additional freshwater demand. Because increased irrigation impliesliquid−to−vapor redirection of freshwater and, thereby, a continuation of river depletion, the scope for solvingfuture food shortages through irrigation alone, without causing severe impacts elsewhere, seems limited (Leah1995).
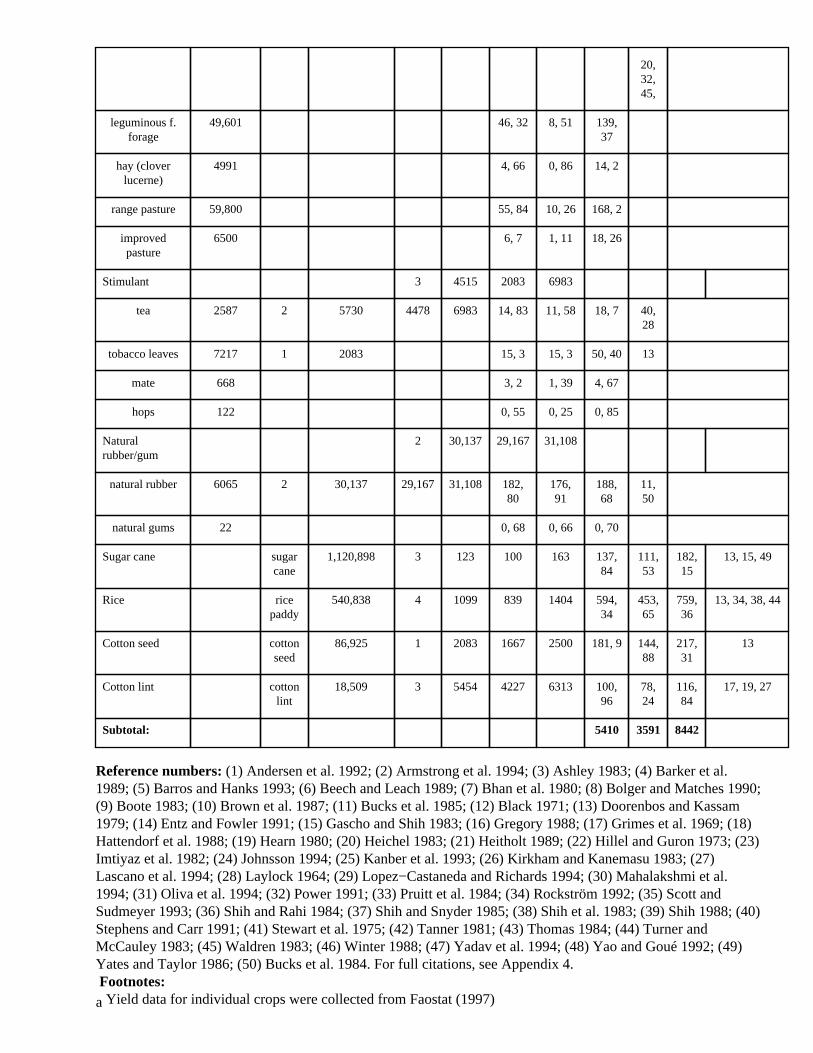
The second option is to improve rain−fed agriculture (Falkenmark et al. 1998). There seem to be two majoravenues. The first is to improve water−use−efficiency in crop production by redirecting in−field evaporation totranspiration within croplands, i.e., increasing the yields with the same amount of water vapor flow. It seemsreasonable to assume a 10% overall increase in WUE as a result of e.g., better crop varieties, improved farmingpractices, soil fertility management, and soil and water conservation measures. This would diminish the futurewater needs by about 300 km3/yr. The second avenue is to redirect evaporating surface runoff for use incroplands. This option concerns water that now runs off from croplands and evaporates in areas of low biomassproductivity and degraded lands, predominantly in semiarid and arid regions, i.e., water that never reaches riversand does not contribute to the generation of ecosystem services. This water could be captured by surface−waterharvesting and used for supplementary irrigation during dry spells (Rockström and Valentin 1997). This measurewould not only conserve water but alsowould conserve soil by diminishing erosion caused by surface waterrunoff. A first−cut estimate of this option is arrived at by a comparison between surface runoff on a local scalefrom croplands vs. runoff on a continental scale, assuming an even distribution of croplands globally. Theamount of water available for redirection from evaporating surface runoff in semiarid and arid regions for use incroplands is hard to estimate. We assumed that the difference in surface runoff coefficients between field scaleand continental scale for croplands in Africa, Asia, and South America is attributed to evaporating surfacerunoff. An even distribution of croplands on the different continents was assumed. Croplands cover 10.5% of theglobal terrestrial area. The runoff water from croplands available for surface water harvesting in Africa, Asia, andSouth America would then be roughly 300 km3/yr. See Appendix 3 for data and references.
Thus, it may very well be that developments in irrigated and rain−fed agriculture cannot cover the full need ofincreased water appropriation for food production, actually only about one−third or 1000 km3/yr out of 3100km3/yr, according to our first−cut estimate. Desalinization of seawater for food production is not a viable solutionbecause the costs would be several factors higher than the price of the crops.
It seems as though the final option to feed another 2.6 billion world inhabitants until AD 2025, is to redirectsubstantial amounts of water vapor flows from other biomes to croplands. Intensifying the conversions of forests,woodlands, and, to some extent, grasslands and wetlands, to croplands in the tropics and subtropics is a likelydevelopment scenario. Assuming that the main part of the remaining freshwater demand would be appropriatedfrom tropical/subtropical systems, their water vapor flows would decrease by 5.5% in only 25 years. Becausemost of the population growth will occur in the tropical region, this is also where the increase in food productionprimarily will occur. Thus, we divided the 2100 km3/yr of additional water vapor needed by the total water vaporfrom our estimates in tropical grasslands, forests, woodlands, and wetlands, which amounts to 38,000 km3/yr,thus resulting in a 5.5% increase.
There is a severe risk that further land use change to capture freshwater for crop production will lead toincreasingly fragile, less diverse systems with lower resilience, and will cause subsequent erosion of ecosystem

services. Will such redirections of water vapor increase or decrease total human well−being? The results of ourestimate, in the light of an expanding human population and escalating globalization, illustrate that we are facingmajor challenges in freshwater−land use management. Management must explicitly deal with what we call theincreasing water vapor−related scarcity. This "new scarcity," which concerns the critical trade−off betweenwater vapor for ecosystem services generated by terrestrial biomes and water vapor for food production, has notbeen sufficiently addressed in freshwater assessments.
INTENTIONAL ECOHYDROLOGICAL LANDSCAPEMANAGEMENT
The critical trade−off between use of water vapor for food production to a growing world population or forwelfare−supporting ecosystem services must be addressed in a conscious way. Proper attention must be paid toside effects generated by land use change. Modifications of ecosystems will alter water flows, and redirection ofwater flows will modify ecosystem services. There are numerous intentional local and sector−based land usedecisions that have caused unintentional ecologically and water−driven side effects. Such effects are generallydiscussed under the term "environmental impacts," without perception of the causes behind them.
Ecologically driven side effects of land use conversion, such as shifts in key functional groups of species or lossof resilience, can change ecological and hydrological preconditions for the generation of ecosystem services. Forexample, movements of organisms in the landscape may change, and thereby impact on ecosystem services suchas pest control, pollination, and seed dispersal by birds, bats, mammals, and insects (Baskin 1997, Bisonette1997). Ecologically driven side effects can impact on processes of significance to the surrounding region (such asdenitrification by wetlands), or processes performed on a local scale, but valued at a global scale (such assequestration of CO2 by forests). These side effects may accumulate and transfer to the landscape and further, toa regional and even to a global scale (Holling 1994).
Freshwater−driven side effects of human activities caused by land use conversions can also change ecologicaland hydrological preconditions for the generation of ecosystem services. Such side effects are linked tointerventions with the water partitioning process, and are propagated downstream or downwind by the watercycle. They may involve river depletion, altered relations between storm flow and low flow, and consequencesfor water−dependent downstream activities such as direct water uses, or ecosystem services generated by riparianwetlands and aquatic ecosystems. For example, land−clearing in southwestern Australia caused a rising watertable and a threat of saline groundwater seepage into ephemeral watercourses that fed drinking water reservoirs.In the Murray Darling basin and the Hungarian Great Plain, deforestation caused widespread water−logging.Land conversion may also have atmospherically transferred consequences on downwind rainfall (Savenije 1995).
Our scenario of freshwater needs for food production for the additional world population indicates thatsubstantial amounts of freshwater will have to be redirected to croplands from other terrestrial biomes. Increasedirrigation and land conversions will produce costly side effects on the capacity of both aquatic (Postel andCarpenter 1997) and terrestrial ecosystems to generate ecosystem services. With a sectoral management and abusiness−as−usual approach, regional conflicts will probably grow rapidly. Instead of passively allowingunintentional impacts to develop, as in the past, an ability to manage the overall catchment, or theecohydrological landscape, in an intentional manner must be developed.
A few cases of intentional ecohydrological landscape management have been reported from Australia and SouthAfrica, recognizing the interdependence among liquid/vapor freshwater flows, ecosystems services, and humanwell−being. In Australia, an agreement has been signed between a forest firm and Melbourne City on increasingthe rotation time in an upland forest to improve the water source for the city (Jayasuria 1994). In South Africa apermit system has been in operation for several decades, by which the "costs" of afforestation, in terms of riverdepletion, are estimated (van der Zel 1997). Moreover, the South African fynbos restoration project involves
systematic reduction of the invasion of highly water−consuming alien vegetation. The fynbos catchment is seenas an integrated whole, and governance rests on combined ecological and hydrological knowledge andunderstanding (van Wilgen et al. 1996).
CONCLUSIONS
We have estimated the total water vapor flow from continental ecosystems to be 70,000 km3/yr, based ongeneralized field data. Our result captures 97% of the evapotranspiration branch (72,075 km3/yr) of globalfreshwater budgets (L'vovich and White 1990). A large part of our water vapor flow (63,200 km3/yr, or 90%) isattributed to forests, woodlands, wetlands, grasslands, and croplands. These terrestrial biomes sustain societywith essential welfare−supporting ecosystem services, including food production.
We do not know the actual freshwater requirements for generating key terrestrial ecosystem services appropriatedby the present global human population. To what extent freshwater can be used more efficiently in existingecosystems is also an open question. Future understanding of complex behavior and interactions within andbetween ecosystems and freshwater flows may improve this knowledge. We can, however, conclude that earlierglobal freshwater assessments, which have focused their analysis on the runoff branch of freshwater (e.g., Gleick1993, UN 1997), have seriously underestimated the human dependence on renewable freshwater flows. Waterperceived as unused or even invisible on a human−dominated planet, to a large extent, is already in use forecosystem support and services to social and economic development.
What are the implications of our results for the management of freshwater, food production, and terrestrialecosystem services in a world of an expanding human population, intensification in global affairs, and ecologicalsystems undergoing rapid change? Obviously, a shift in perception and approach to water management isnecessary. Water is not just an economic commodity to be engineered as input in food production or industrialactivities. Water is a fundamental force in ecological life−support systems on which social and economicdevelopment depend. Freshwater flows, crop production, and other terrestrial ecosystem services areinterconnected and interdependent. Therefore, water appropriation for crop production to a growing humanpopulation should no longer be viewed in isolation from potential impacts of freshwater re−directions. It maylead to erosion of critical and welfare−supporting ecosystem services in both terrestrial and aquatic systems, andpotential conflicts between upstream and downstream users.
Land use choices are also water choices, and will always lead to alterations in the flow of freshwater andecosystem services elsewhere. This trade−off is made explicit in our scenario of freshwater for crop production tosupport a growing human population. It has to become embedded in the management of dynamic freshwaterecosystem linkages, in what we call the ecohydrological landscape. The challenge is immense and will requireco−management at catchment levels, often crossing administrative and even national boundaries.
RESPONSES TO THIS ARTICLE
Responses to this article are invited. If accepted for publication, your response will be hyperlinked to the article.To submit a comment, follow this link. To read comments already accepted, follow this link.

Acknowledgments:
This article is the product of an interdisciplinary team work, where the contributions of the authors successivelygrew out from their starting contributions (Falkenmark's and Folke's conceptual bridge building, Rockström'smethodology development and Gordon's and Engvall's in depth data analysis). Gordon's work is supported bythe Swedish Council for Forestry and Agricultural Research (SJFR), and Folke's partly by the Pew Scholarsprogram of The Pew Charitable Trusts.
LITERATURE CITED
Ajtay, G. L., P. Ketner, and P. Duvigneaud. 1979. Pages 129−182 in B. Bolin, E. T. Degens, S. Kempe, and P.Ketner, editors. The global carbon cycle. John Wiley, New York, New York, USA.
Baskin, Y. 1997. The work of nature: how the diversity of life sustains us. Island Press, Washington, D.C., USA.
Bisonette, J. A., editor. 1997. Wildlife and landscape ecology: effects on pattern and scale. Springer Verlag,New York, New York, USA.
Costanza, R., R. d'Arge, R. deGroot, S. Farber, M. Grasso, B. Hannon, K. Limburg, S. Naeem, R. V.O'Neill, J. Paruelo, R. G. Raskin, P. Sutton, and M. van den Belt. 1997. The value of the world's ecosystemservices and natural capital. Nature387:253−260.
Daily, G. C., editor. 1997. Nature's services − human dependence on natural ecosystems. Island Press,Washington, D.C., USA.
Dancette, C. 1983. Besoins en eau du mil au Sénégal − Adaptations en zone semi−aride tropicale. L'AgronomieTropicale38:267−280.
de Groot, R. S. 1992. Functions of nature: evaluation of nature in environmental planning, management, anddecision making. Wolters−Noordhoff, Groningen, the Netherlands.
Falkenmark, M. 1995. Pages 15−16 in FAO Land and Water Bulletin Number 1. Land and Water Integrationand River Basin Management, FAO, Rome, Italy.
_______ . 1997. Meeting water requirements of an expanding world population. Philosophical Transactions ofthe Royal Society of London B352:929−936.
Falkenmark, M., W. Klohn, J. Lundqvist, S. Postel, J. Rockström, D. Seckler, S. Hillel, and J.Wallace. 1998. Water scarcity as a key factor behind global food insecurity: Round table discussion.Ambio21(2): 148 − 154.
Falkenmark, M., et al. 1998. Statement at the IXth World Water Congress, Montreal 6 September1997, Specialsession IV. Ambio27:154.
−−> FAO. 1995. World Agriculture: towards 2010. N. Alexandratos, editor. John Wiley, Chichester, UK.
Faostat. 1997. Electronic database available on the internet http://apps.fao.org. FAO, Statistics Division, Rome,Italy. [Data were taken 09/26/97.]

Folke, C. Socio−economic dependence on the life−support environment. 1991. Pages 77−94 in C. Folke and T.Kåberger, editors. Linking the natural environment and the economy: essays from the Eco−Eco Group. KluwerAcademic, Dordrecht, the Netherlands.
Frank, D. A., and R. S. Inouye. 1994. Temporal variation in actual evapotranspiration of terrestrial ecosystems:patterns and ecological implications. Journal of Biogeography21:401−411.
Gleick, P. H., editor. 1993. Water in crisis. Oxford University Press, New York, New York, USA.
_______ . 1996. Basic water requirements for human activities: meeting basic needs. WaterInternational21:83−92.
Holling, C. S. 1986. The resilience of terrestrial ecosystems: local surprise and global change. Pages 292−317in W. C. Clark and R. E. Munn, editors. Sustainable development of the biosphere. Press Syndicate of theUniversity of Cambridge, Cambridge, UK.
_______ . 1994. An ecologist's view of the Malthusian conflict. Pages 79−103 in K. Lindahl−Kiessling and H.Landberg, editors. Population, economic development, and the environment. Oxford University Press, Oxford,UK.
Jackson, I. J. 1989. Climate, water and agriculture in the tropics. Longman Scientific and Technical, New York,New York, USA.
Jansson, A.−M., M. Hammer, C. Folke, and R. Costanza, editors. 1994. Investing in natural capital. IslandPress, Washington, D.C., USA.
Jansson, Å., C. Folke, J. Rockström, and L. Gordon. 1999. Linking freshwater flows and ecosystem servicesappropriated by people: the case of the Baltic Sea drainage basin. Ecosystems, in press.
Jayasuriya, D. 1994. Value proposition as a tool for conflict resolution in natural resources utalization. Paperpresented at a seminar on Integration of Land and Water Management, 24−25 October1994. Natural ResourcesManagement Institute, Stockholm University, Stockholm, Sweden.
L'vovich, M. I. 1979. World water resources and their future. LithoCrafters, Chelsea, UK.
L'vovich, M. I., and G. F. White. 1990. Use and transformation of terrestrial water systems. Pages 235−252in B. L. Turner II, W. C. Clark, R. W. Kates, J. F. Richards, J. T. Mathews, and W. B. Meyer, editors. The Earthas transformed by human action. Cambridge University Press, Cambridge, UK.
Le Houerou, H. N. 1984. Rain use efficiency: a unifying concept in arid−land ecology. Journal of AridEnvironments7:213−247.
Liang,Y. M., D. L. Hazlett, and W. K. Laurenroth. 1989. Biomass dynamics and water use efficiencies of fiveplant communities in the shortgrass steppe. Oecologia80:148−153.
Lubchenco, J. 1998. Entering the century of the environment: a new social contract for science.Science279:491−496.
Lundqvist, J. 1998. Avert looming hydrocide. Ambio27:428−433.
Lundqvist , J., and P. Gleick. 1997. Sustaining our waters into the 21st century. Background Report No.4 of theComprehensive assessment of the freshwater resources of the world. WMO−SEI, Stockholm, Sweden.
Matson, P. A., W. J. Parton, A. G. Power, and M. J. Swift. 1997. Agricultural intensification and ecosystem
properties. Science277:504−509.
Matthews, E. 1983. Global vegetation and land use: new high−resolution databases for climate studies. Journalof Climate and Applied Meteorology22:474−487.
Mémento de l'Agronome. 1984. Ministère de la coopération et du développement, Paris, France.
Mitch, W. J., and J. G. Gosselink. 1983. Wetlands. Van Nostrand Reinhold, New York, New York, USA.
Nulsen, R. A., K. J. Bligh, I. N. Baxter, E. J. Solin, and D. H. Imrie. 1986. The fate of rainfall in a mallee andheath vegetated catchment in southern Western Australia. Australian Journal of Ecology11:361−371.
Odum, E. P. 1989. Ecology and our endangered life−support systems. Sinauer Associates, Sunderland,Massachusetts, USA.
Olson, J. S., J. A. Watts, and L. J. Allison. 1983. Carbon in live vegetation of major world ecosystems. OakRidge National Laboratory, Environmental Science Division, Report ORNL−5862, Oak Ridge, Tennessee, USA.
Penman, H. L. 1963. Natural evaporation from open water, bare soil, and grass. Proceedings of the RoyalSociety, London, Series A193:120−145.
Penning de Vries, F. W. T., and M. A. Djitèye, editors. 1982. La productivité des pâturages Sahéliens : uneétude des sols, des végétations et de l'exploitation de cette ressource naturelle. Pudoc, Wageningen, theNetherlands.
Peterson, G., C. R. Allen, and C. S. Holling. 1998. Ecological resilience, biodiversity, and scale.Ecosystems1:6−18.
Postel, S. L. 1998. Water for food production: will there be enough in 2025? BioScience48:629−637.
Postel, S., and S. Carpenter. 1997. Freshwater ecosystem services. Pages 195−214 in G. C. Daily, editor.Nature's services − human dependence on natural ecosystems. Island Press, Washington, D.C., USA.
Postel, S. L., G. C. Daily, and P. R. Ehlich. 1996. Human appropriation of renewable fresh water.Science271:785−788.
Rockström, J. 1997. On−farm agrohydrological analysis of the Sahelian yield crisis: Rainfall partitioning, soilnutrients and water use efficiency of pearl millet. Dissertation. Stockholm University. Akademitryck AB,Edsbruk, Sweden.
Rockström, J., P−E. Jansson, and J. Barron. 1998. Seasonal rainfall partitioning under runon and runoffconditions on sandy soil in Niger − on−farm measurements and water balance modelling. Journal ofHydrology210:68−92.
Rockström, J., and C. Valentin. 1997. Hillslope dynamics of on−farm generation of surface water flows: Thecase of rainfed cultivation of pearl millet in the Sahel. Agricultural Water Management33:183−210.
Savenije, H. H. G. 1995. New definitions for moisture recycling and the relationship with land−use changes inthe Sahel. Journal of Hydrology167:57−78.
Shiklomanov, I. A. 1996. Assessment of water resources and water availability in the world. State HydrologicalInstitute, St. Petersburg, Russia.
_______ . 1997. Assessment of water resources and water availability of the world. Background Report No.2 of
the Comprehensive assessment of the freshwater resources of the world. WMO−SEI, Stockholm, Sweden.
Sinclair, T. R., C. B. Tanner, and J. M. Bennett. 1984. Water−use−efficiency in crop production.BioScience34:36−40.
Swank, W. T., L. W. Swift Jr., and J. E. Douglas. 1988. Stream flow changes associated with forest cutting,species composition, and natural disturbances. Pages 297−312 in W. T. Swank and D. A. Crossley Jr., editors.Forest hydrology and ecology at Coweeta. Springer−Verlag, New York, New York, USA.
Thornwaite, C. W., and J. R. Mather. 1955. The water balance. Climatology8:1−87.
UN−SEI. 1997. Comprehensive assessment of the freshwater resources of the world. WMO−SEI, Stockholm,Sweden.
van der Zel, D. W. 1997. Sustainable industrial afforestation in South Africa under water and otherenvironmental pressures. Pages 217−225 in D. Rosbjerg, editor. Sustainability of water resources underincreasing uncertainity. Proceedings of the Rabat Symposium. IAHS Press, Wallingford, UK.
van Wilgen, B. W., R. M. Cowling, and C. J. Burgers. 1996. Valuation of ecosystem services: a case studyfrom a South African fynbos ecosystem. BioScience46:184−189.
Vitousek, P. M., P. R. Ehrlich, A. H. Ehrlich, and P. A. Matson. 1986. Human appropriation of the productsof photosynthesis. BioScience36:368−373.
Walker, B. H. 1993. Rangeland ecology: understanding and managing change. Ambio22:80−87.
WRI. 1994. World Resources 1994−1995. Oxford University Press, Oxford, UK.
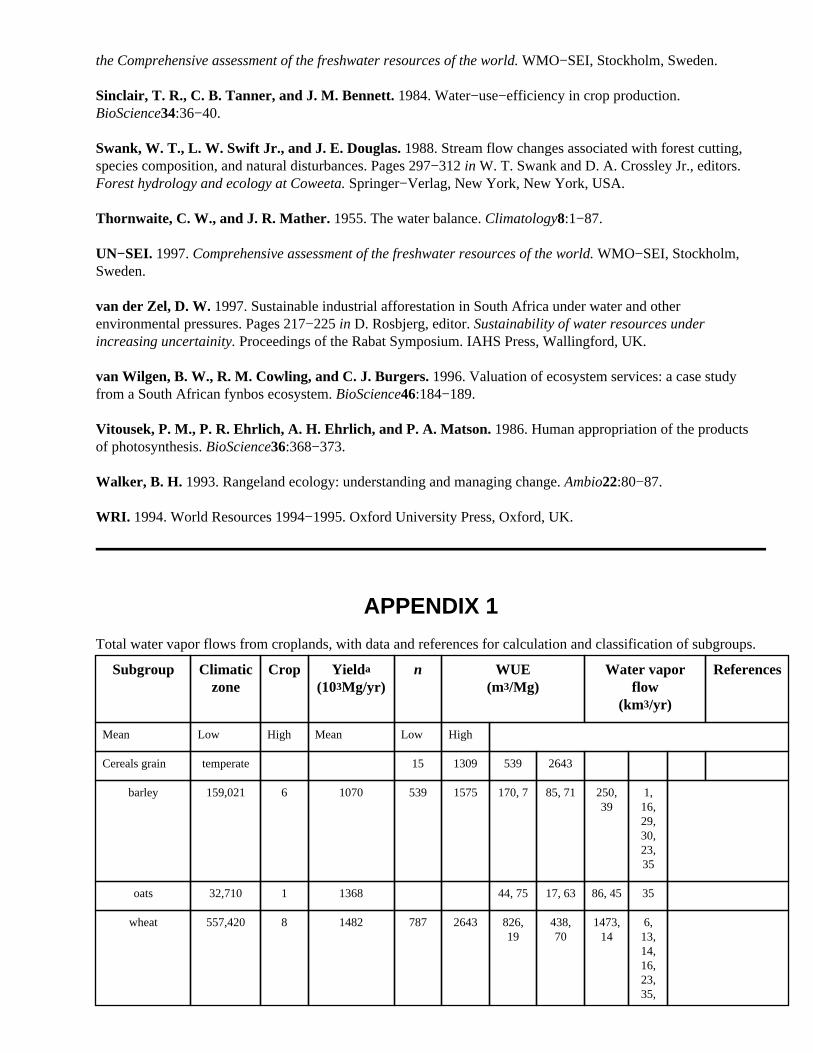
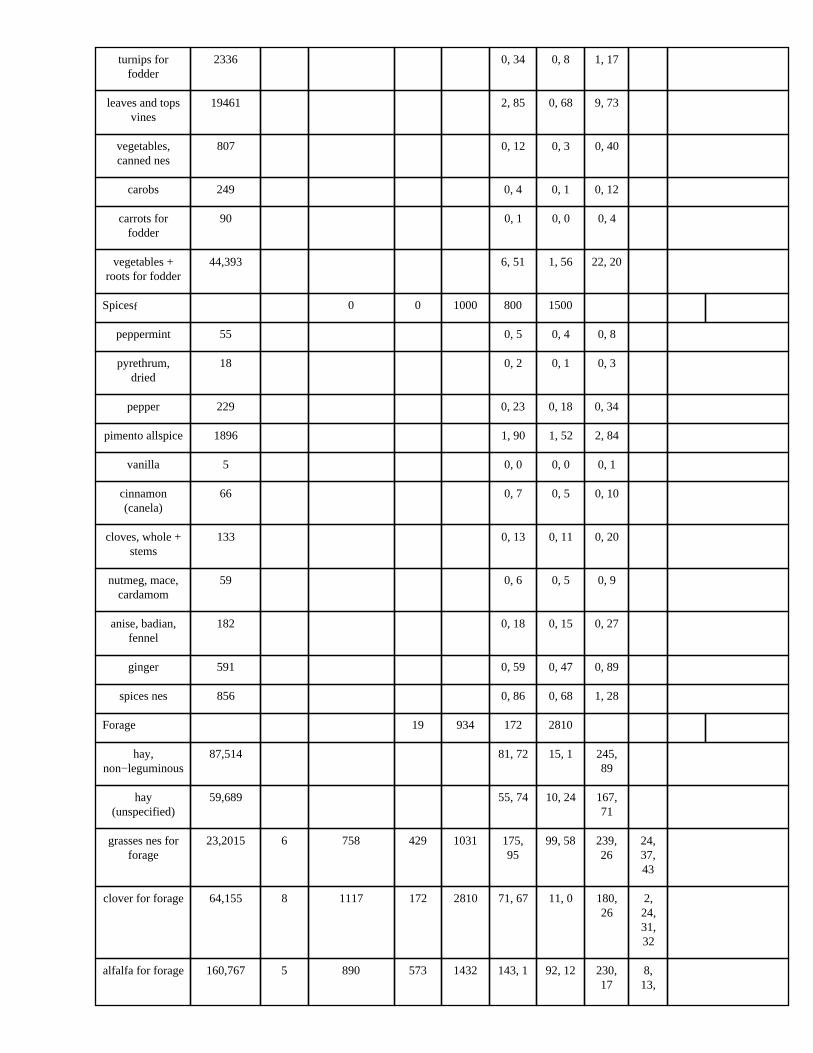
APPENDIX 1
Total water vapor flows from croplands, with data and references for calculation and classification of subgroups.
Subgroup Climaticzone
Crop Yielda
(103Mg/yr)n WUE
(m3/Mg)Water vapor
flow(km3/yr)
References
Mean Low High Mean Low High
Cereals grain temperate 15 1309 539 2643
barley 159,021 6 1070 539 1575 170, 7 85, 71 250,39
1,16,29,30,23,35
oats 32,710 1 1368 44, 75 17, 63 86, 45 35
wheat 557,420 8 1482 787 2643 826,19
438,70
1473,14
6,13,14,16,23,35,
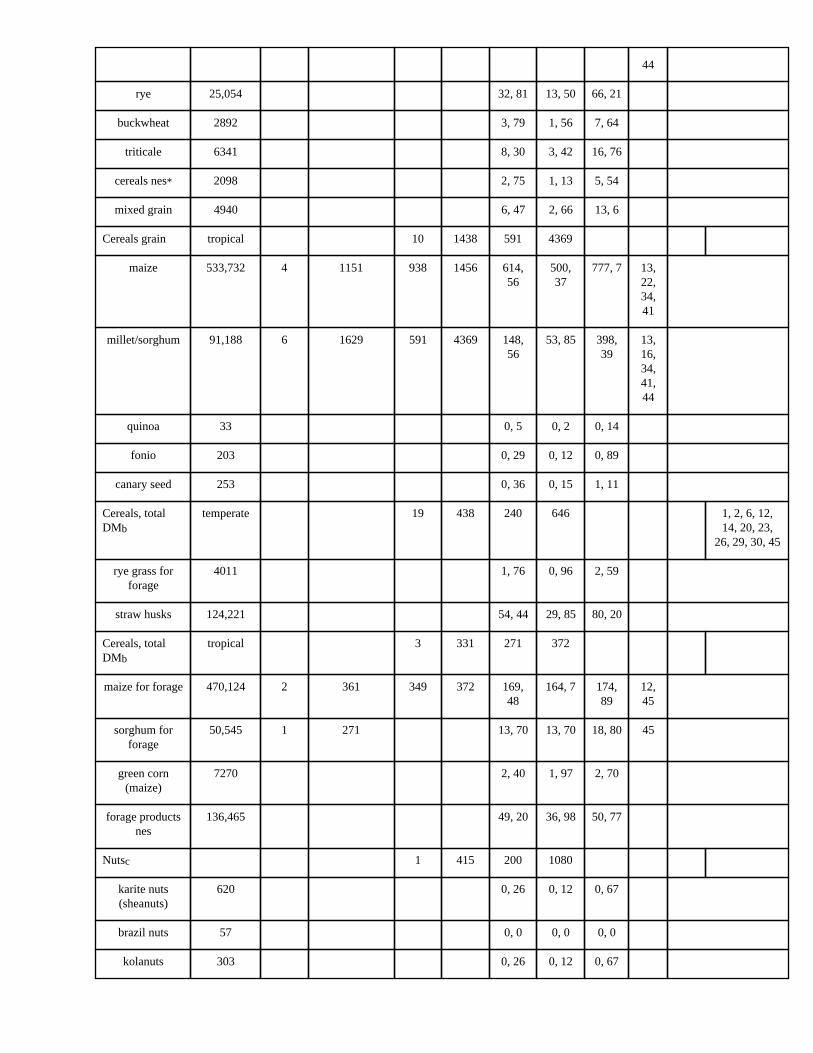
44
rye 25,054 32, 81 13, 50 66, 21
buckwheat 2892 3, 79 1, 56 7, 64
triticale 6341 8, 30 3, 42 16, 76
cereals nes* 2098 2, 75 1, 13 5, 54
mixed grain 4940 6, 47 2, 66 13, 6
Cereals grain tropical 10 1438 591 4369
maize 533,732 4 1151 938 1456 614,56
500,37
777, 7 13,22,34,41
millet/sorghum 91,188 6 1629 591 4369 148,56
53, 85 398,39
13,16,34,41,44
quinoa 33 0, 5 0, 2 0, 14
fonio 203 0, 29 0, 12 0, 89
canary seed 253 0, 36 0, 15 1, 11
Cereals, totalDMb
temperate 19 438 240 646 1, 2, 6, 12,14, 20, 23,
26, 29, 30, 45
rye grass forforage
4011 1, 76 0, 96 2, 59
straw husks 124,221 54, 44 29, 85 80, 20
Cereals, totalDMb
tropical 3 331 271 372
maize for forage 470,124 2 361 349 372 169,48
164, 7 174,89
12,45
sorghum forforage
50,545 1 271 13, 70 13, 70 18, 80 45
green corn(maize)
7270 2, 40 1, 97 2, 70
forage productsnes
136,465 49, 20 36, 98 50, 77
Nutsc 1 415 200 1080
karite nuts(sheanuts)
620 0, 26 0, 12 0, 67
brazil nuts 57 0, 0 0, 0 0, 0
kolanuts 303 0, 26 0, 12 0, 67
cashew nuts 670 0, 2 0, 1 0, 6
chestnuts 497 0, 13 0, 6 0, 33
tung nuts 631 0, 28 0, 13 0, 72
almonds 1212 0, 21 0, 10 0, 54
walnuts 1002 0, 26 0, 13 0, 68
pistachios 386 1 415 200 1080 0, 16 0, 8 0, 42 25
hazelnuts(filberts)
629 0, 42 0, 20 1, 8
areca nuts(betel)
487 0, 16 0, 8 0, 42
nuts nes 434 0, 26 0, 13 0, 68
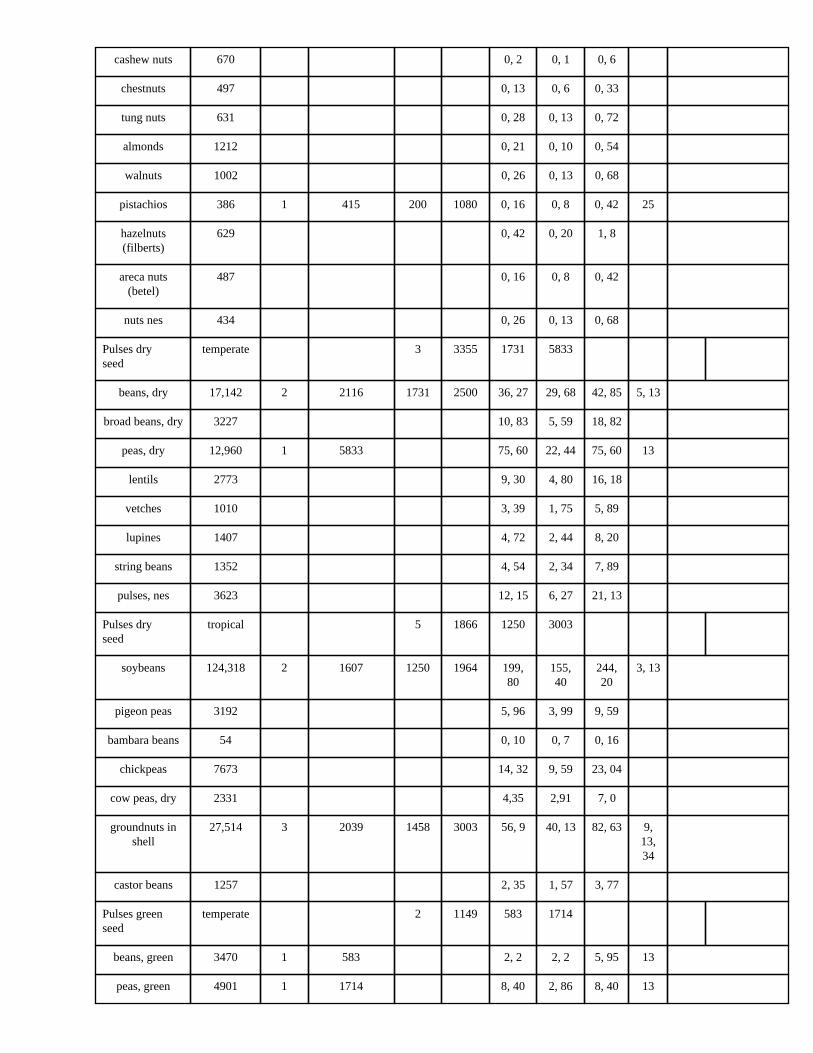
Pulses dryseed
temperate 3 3355 1731 5833
beans, dry 17,142 2 2116 1731 2500 36, 27 29, 68 42, 85 5, 13
broad beans, dry 3227 10, 83 5, 59 18, 82
peas, dry 12,960 1 5833 75, 60 22, 44 75, 60 13
lentils 2773 9, 30 4, 80 16, 18
vetches 1010 3, 39 1, 75 5, 89
lupines 1407 4, 72 2, 44 8, 20
string beans 1352 4, 54 2, 34 7, 89
pulses, nes 3623 12, 15 6, 27 21, 13
Pulses dryseed
tropical 5 1866 1250 3003
soybeans 124,318 2 1607 1250 1964 199,80
155,40
244,20
3, 13
pigeon peas 3192 5, 96 3, 99 9, 59
bambara beans 54 0, 10 0, 7 0, 16
chickpeas 7673 14, 32 9, 59 23, 04
cow peas, dry 2331 4,35 2,91 7, 0
groundnuts inshell
27,514 3 2039 1458 3003 56, 9 40, 13 82, 63 9,13,34
castor beans 1257 2, 35 1, 57 3, 77
Pulses greenseed
temperate 2 1149 583 1714
beans, green 3470 1 583 2, 2 2, 2 5, 95 13
peas, green 4901 1 1714 8, 40 2, 86 8, 40 13
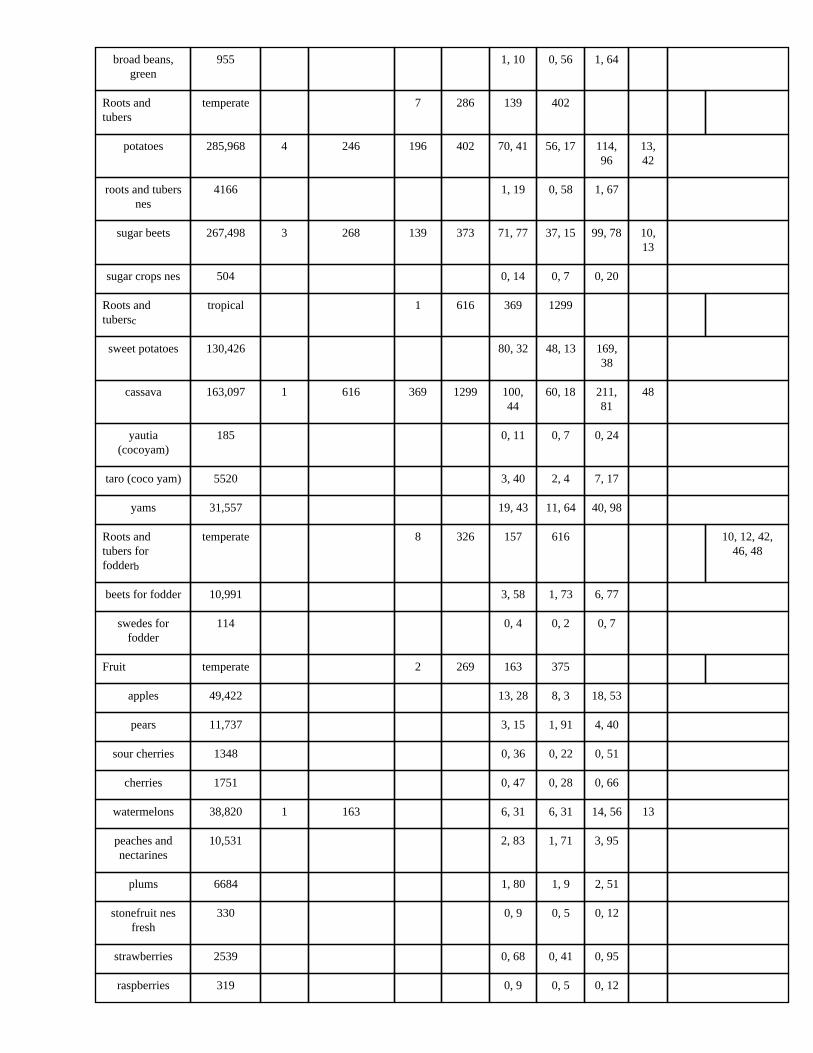
broad beans,green
955 1, 10 0, 56 1, 64
Roots andtubers
temperate 7 286 139 402
potatoes 285,968 4 246 196 402 70, 41 56, 17 114,96
13,42
roots and tubersnes
4166 1, 19 0, 58 1, 67
sugar beets 267,498 3 268 139 373 71, 77 37, 15 99, 78 10,13
sugar crops nes 504 0, 14 0, 7 0, 20
Roots andtubersc
tropical 1 616 369 1299
sweet potatoes 130,426 80, 32 48, 13 169,38
cassava 163,097 1 616 369 1299 100,44
60, 18 211,81
48
yautia(cocoyam)
185 0, 11 0, 7 0, 24
taro (coco yam) 5520 3, 40 2, 4 7, 17
yams 31,557 19, 43 11, 64 40, 98
Roots andtubers forfodderb
temperate 8 326 157 616 10, 12, 42,46, 48
beets for fodder 10,991 3, 58 1, 73 6, 77
swedes forfodder
114 0, 4 0, 2 0, 7
Fruit temperate 2 269 163 375
apples 49,422 13, 28 8, 3 18, 53
pears 11,737 3, 15 1, 91 4, 40
sour cherries 1348 0, 36 0, 22 0, 51
cherries 1751 0, 47 0, 28 0, 66
watermelons 38,820 1 163 6, 31 6, 31 14, 56 13
peaches andnectarines
10,531 2, 83 1, 71 3, 95
plums 6684 1, 80 1, 9 2, 51
stonefruit nesfresh
330 0, 9 0, 5 0, 12
strawberries 2539 0, 68 0, 41 0, 95
raspberries 319 0, 9 0, 5 0, 12
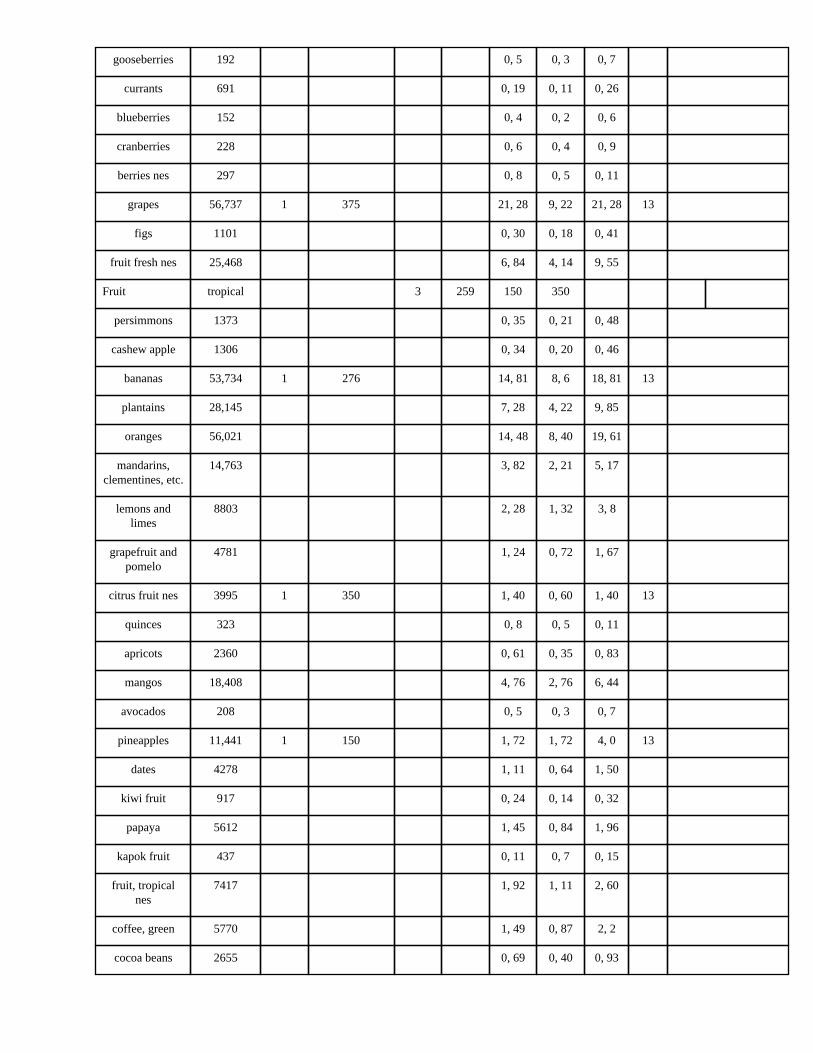
gooseberries 192 0, 5 0, 3 0, 7
currants 691 0, 19 0, 11 0, 26
blueberries 152 0, 4 0, 2 0, 6
cranberries 228 0, 6 0, 4 0, 9
berries nes 297 0, 8 0, 5 0, 11
grapes 56,737 1 375 21, 28 9, 22 21, 28 13
figs 1101 0, 30 0, 18 0, 41
fruit fresh nes 25,468 6, 84 4, 14 9, 55
Fruit tropical 3 259 150 350
persimmons 1373 0, 35 0, 21 0, 48
cashew apple 1306 0, 34 0, 20 0, 46
bananas 53,734 1 276 14, 81 8, 6 18, 81 13
plantains 28,145 7, 28 4, 22 9, 85
oranges 56,021 14, 48 8, 40 19, 61
mandarins,clementines, etc.
14,763 3, 82 2, 21 5, 17
lemons andlimes
8803 2, 28 1, 32 3, 8
grapefruit andpomelo
4781 1, 24 0, 72 1, 67
citrus fruit nes 3995 1 350 1, 40 0, 60 1, 40 13
quinces 323 0, 8 0, 5 0, 11
apricots 2360 0, 61 0, 35 0, 83
mangos 18,408 4, 76 2, 76 6, 44
avocados 208 0, 5 0, 3 0, 7
pineapples 11,441 1 150 1, 72 1, 72 4, 0 13
dates 4278 1, 11 0, 64 1, 50
kiwi fruit 917 0, 24 0, 14 0, 32
papaya 5612 1, 45 0, 84 1, 96
kapok fruit 437 0, 11 0, 7 0, 15
fruit, tropicalnes
7417 1, 92 1, 11 2, 60
coffee, green 5770 1, 49 0, 87 2, 2
cocoa beans 2655 0, 69 0, 40 0, 93

Oil−bearingcrops
temperate 3 1892 1530 2117
non−wooded rapeseed 29,595 2 1780 1530 2029 52, 67 45, 28 60, 5 7, 35
mustard seed 469 1 2117 0, 99 0, 72 0,99 47
hempeed 36 0, 7 0, 5 0, 8
linseed 2351 4, 45 3, 60 4, 98
poppy seed 41 0, 8 0, 6 0, 9
oilseeds nes 1458 2, 76 2, 23 3, 9
vegetable tallow 117 0, 22 0, 18 0, 25
tallowtree seeds 781 1, 48 1, 19 1, 65
melon seed 607 1, 15 0, 93 1, 28
Oil−bearingcrops
tropical 2 3083 2667 3500
non−wooded safflowerseed
753 1 2667 2, 1 2, 1 2, 63 13
sunflower 23,004 1 2667 61, 34 61, 34 80, 51 13
sesame seed 2432 7, 50 6, 49 8, 51
stillinga oil 117 0, 36 0, 31 0, 41
woody tropical
coconuts d 10.3 x10⁶km2
1320 mm 1200mm
1500mm
136,17
123,79
154,74
palm oil, palmkernels, oil
palm fruit d
6.6
x106 km2 1500 mm 1250
mm1750mm
99, 6 82, 55 115,57
olives 11,100 1 583 500 667 6, 47 5, 55 7, 40 13
Fibers 4 574 278 870 2, 6, 12
flax fiber andtow
571 0, 33 0, 16 0, 50
kapokseed inshell
328 0, 19 0, 9 0, 29
hemp fiber andtow
102 0, 6 0, 3 0, 9
jute 2619 1, 50 0, 73 2, 28
jute−like fibers 618 0, 35 0, 17 0, 54
ramie 106 0, 6 0, 3 0, 9
sisal 333 0, 19 0, 9 0, 29
agave fibers nes 55 0, 3 0, 2 0, 5

coir 172 0, 10 0, 5 0, 15
abaca (manilahemp)
106 0, 6 0, 3 0, 9
fiber crops nes 423 0, 24 0, 12 0, 37
kapok fiber 107 0, 6 0, 3 0, 9
Vegetablese 6 147 35 500
onions +shallots, green
3287 1 113 0, 37 0, 12 1, 64 13
onions, dry 33765 4, 95 1, 19 16, 88
leeks + otheralliac.veg.
1493 0, 22 0, 5 0, 75
garlic 9211 1, 35 0, 32 4, 61
carrots 15,226 2, 23 0, 54 7, 61
chicory roots 399 0, 6 0, 1 0, 20
tomatoes 80,192 2 83 74 92 6, 63 5, 90 7, 35 13,33
pumpkinssquash gourds
9060 1, 33 0, 32 4, 53
cucumbers andgherkins
21,192 3, 11 0, 75 10, 60
eggplants 10,591 1, 55 0, 37 5, 30
chillies +peppers, green
12,955 1 500 6, 48 0, 46 6, 48 13
okra 1274 0, 19 0, 4 0, 64
cantaloupes +melons
15,216 2, 23 0, 53 7, 61
cabbages 44,618 1 67 2, 97 1, 57 22, 31 13
artichokes 1163 0, 17 0, 4 0, 58
asparagus 2763 0, 41 0, 10 1, 38
lettuce 12,722 1 35 0, 45 0, 45 6, 36 36
spinach 5648 0, 83 0, 20 2, 82
cauliflower 11812 1, 73 0, 42 5, 91
vegetables,fresh nes
186,836 27, 39 6, 57 93, 42
cabbage forfodder
2184 0, 32 0, 8 1, 9
pumpkins forfodder
743 0, 11 0, 3 0, 37
turnips forfodder
2336 0, 34 0, 8 1, 17
leaves and topsvines
19461 2, 85 0, 68 9, 73
vegetables,canned nes
807 0, 12 0, 3 0, 40
carobs 249 0, 4 0, 1 0, 12
carrots forfodder
90 0, 1 0, 0 0, 4
vegetables +roots for fodder
44,393 6, 51 1, 56 22, 20
Spicesf 0 0 1000 800 1500
peppermint 55 0, 5 0, 4 0, 8
pyrethrum,dried
18 0, 2 0, 1 0, 3
pepper 229 0, 23 0, 18 0, 34
pimento allspice 1896 1, 90 1, 52 2, 84
vanilla 5 0, 0 0, 0 0, 1
cinnamon(canela)
66 0, 7 0, 5 0, 10
cloves, whole +stems
133 0, 13 0, 11 0, 20
nutmeg, mace,cardamom
59 0, 6 0, 5 0, 9
anise, badian,fennel
182 0, 18 0, 15 0, 27
ginger 591 0, 59 0, 47 0, 89
spices nes 856 0, 86 0, 68 1, 28
Forage 19 934 172 2810
hay,non−leguminous
87,514 81, 72 15, 1 245,89
hay(unspecified)
59,689 55, 74 10, 24 167,71
grasses nes forforage
23,2015 6 758 429 1031 175,95
99, 58 239,26
24,37,43
clover for forage 64,155 8 1117 172 2810 71, 67 11, 0 180,26
2,24,31,32
alfalfa for forage 160,767 5 890 573 1432 143, 1 92, 12 230,17
8,13,
20,32,45,
leguminous f.forage
49,601 46, 32 8, 51 139,37
hay (cloverlucerne)
4991 4, 66 0, 86 14, 2
range pasture 59,800 55, 84 10, 26 168, 2
improvedpasture
6500 6, 7 1, 11 18, 26
Stimulant 3 4515 2083 6983
tea 2587 2 5730 4478 6983 14, 83 11, 58 18, 7 40,28
tobacco leaves 7217 1 2083 15, 3 15, 3 50, 40 13
mate 668 3, 2 1, 39 4, 67
hops 122 0, 55 0, 25 0, 85
Naturalrubber/gum
2 30,137 29,167 31,108
natural rubber 6065 2 30,137 29,167 31,108 182,80
176,91
188,68
11,50
natural gums 22 0, 68 0, 66 0, 70
Sugar cane sugarcane
1,120,898 3 123 100 163 137,84
111,53
182,15
13, 15, 49
Rice ricepaddy
540,838 4 1099 839 1404 594,34
453,65
759,36
13, 34, 38, 44
Cotton seed cottonseed
86,925 1 2083 1667 2500 181, 9 144,88
217,31
13
Cotton lint cottonlint
18,509 3 5454 4227 6313 100,96
78,24
116,84
17, 19, 27
Subtotal: 5410 3591 8442
Reference numbers: (1) Andersen et al. 1992; (2) Armstrong et al. 1994; (3) Ashley 1983; (4) Barker et al.1989; (5) Barros and Hanks 1993; (6) Beech and Leach 1989; (7) Bhan et al. 1980; (8) Bolger and Matches 1990;(9) Boote 1983; (10) Brown et al. 1987; (11) Bucks et al. 1985; (12) Black 1971; (13) Doorenbos and Kassam1979; (14) Entz and Fowler 1991; (15) Gascho and Shih 1983; (16) Gregory 1988; (17) Grimes et al. 1969; (18)Hattendorf et al. 1988; (19) Hearn 1980; (20) Heichel 1983; (21) Heitholt 1989; (22) Hillel and Guron 1973; (23)Imtiyaz et al. 1982; (24) Johnsson 1994; (25) Kanber et al. 1993; (26) Kirkham and Kanemasu 1983; (27)Lascano et al. 1994; (28) Laylock 1964; (29) Lopez−Castaneda and Richards 1994; (30) Mahalakshmi et al.1994; (31) Oliva et al. 1994; (32) Power 1991; (33) Pruitt et al. 1984; (34) Rockström 1992; (35) Scott andSudmeyer 1993; (36) Shih and Rahi 1984; (37) Shih and Snyder 1985; (38) Shih et al. 1983; (39) Shih 1988; (40)Stephens and Carr 1991; (41) Stewart et al. 1975; (42) Tanner 1981; (43) Thomas 1984; (44) Turner andMcCauley 1983; (45) Waldren 1983; (46) Winter 1988; (47) Yadav et al. 1994; (48) Yao and Goué 1992; (49)Yates and Taylor 1986; (50) Bucks et al. 1984. For full citations, see Appendix 4. Footnotes:a Yield data for individual crops were collected from Faostat (1997)

b The WUE was calculated based on the total dry matter yield. c The mean WUE comes from only one article why the low and high values are the variations within that article.d The total water vapor flow from oil palm and coconuts was calculated as
total water vapor flow (km
3/ yr)= area harvested (km2) x ET (m) from palm stands The ET from palm stands is 1500 mm and for coconut it is 1320 (Jackson 1989). The low/high was assumed tobe 1250 mm and 1750 mm (oil palm) and 1200 and 1500 mm (coconuts). The area of coconut production wascollected from Faostat. For oil palms, the area harvested (the same area is also harvested for oil kernels and fruit)was calculated by
area harvested (ha/yr) = oil produced (Mg/yr)/production of oil (Mg/ha)
Palm oil production (6603778Mg) was collected from Faostat. The production was assumed to be 1.75 Mg/ha(Mémento de l´Agronome 1984). e For vegetables that were produced as feed, the WUE was calculated based on the “grain“ yield of that specificcrop or subgroup, not the total biomass.f Spices is a small group with roughly 0.045% of the total global area harvested each year (Faostat 1997). Withinthis subgroup there is a large variation in species composition as well as in parts of plant used for productionmeasurement. The WUE was therefore based on a qualified assumption of 1000 m3/Mg. The low was assumed to800 m3/Mg and the high to 1200 m3/Mg. This is higher than the 500 m3/Mg that Postel et al. (1996) used as anaverage global WUE value. Because spices are often just a small part of a plant, the WUE will be higher.* nes = not elsewhere specified or included (abbreviation from FAO Stat. 1997.)
APPENDIX 2
Total water vapor flow from forests/woodlands, wetlands, and grasslands, with data and references forcalculation and classification of subgroups.
Biome Subgroup Climaticzone
Areaa
(103 km2)nb ET
(mm/yr)Water vapor flow
(km3/yr)Referencesc
Mean Low High Mean Low High
Forest taiga boreal 11,560 3 401 380 420 4636 4393 4855
420 L'Vovich (1979)
403 Black et al. (1996)
380 Frank and Inouye(1994)
predominantlyconiferous
temperate 3500 4 487 395 580 1705 1383 2030
543 Frank and Inouye(1994)
395 Tiktak and Bouten(1994)
430 Running et al.(1989)
580 Yin (1993)
predominantlydeciduous
temperate 8500 4 729 588 964 6199 4998 8194
588 Frank and Inouye(1994)
620 Yin (1993)
745 Luxmoore (1983)
964 Moran andO'Shaugnessy(1984)
woodland/woodysavanna
temperate 5200 3 416 300 530 2165 1560 2756
300 Angell and Miller(1994)
530 L'Vovich (1979)
419 Joffre and Rambal(1993)
dry/deciduous/seasonal tropical/subtropical 7400 2 792 783 800 5857 5794 5920
783 San José et al.(1995)
800 L'Vovich (1979)
wet tropical/subtropical 5300 3 1245 880 1493 6600 4664 7913
880 L'Vovich (1979)
1363 Frank and Inouye(1994)
1493 Leopoldo et al.(1995)
savanna/woodland, dry tropical/subtropical 12,700 2 882 870 894 11,201 11,049 11,354
870 L'Vovich (1979)
894 Frank and Inouye(1994)
wet tropical/subtropical 1300 3 1267 1100 1500 1647 1430 1950
1100 L'Vovich (1979)
1500 L'Vovich (1979)
1200 L'Vovich (1979)
Subtotal 55,460 40,009 35,271 44,972
Wetland bog boreal 651 3 221 200 260 144 130 169 Frank and Inouye(1994)

202
200 Rouse (1982)
260 L'Vovich (1979)
bog temperate 488 4 674 456 1020 329 223 498
456 Boeye andVerheyen (1992)
490 Mitsch andGosselink (1993)
730 Gilvear et al.(1993)
1020 Mitsch andGosselink (1993)
swamp temperate 41 3 843 670 720 35 27 30
670 Mitsch andGosselink (1993)
1139 Gehrels andMulamoottil(1990)
720 Mitsch andGosselink (1993)
swamp subtropical 16 5 1127 930 1277 18 15 20
930 Mitsch andGosselink (1993)
1032 Yin and Brook(1992)
1317 Dolan et al. (1984)
1080 Mitsch andGosselink (1993)
1277 Abtew (1996)
swamp d tropical 508 1 1656 1408 1904 841 715 967 Schaeffer−Novelliet al. (1990)
1656
Subtotal 1704 1366 1110 1684
Grassland cool grassland temperate 6940 16 410 130 633 2843 900 4393
130 Branson et al.(1969)
190 Sims et al. (1978)
205 Liang et al. (1989)

276 Bokhari and Singh(1974)
339 Scott andSudemyer (1993)
413 Frank and Inouye(1994)
417 Sims et al. (1978)
422 Roberts andRoberts (1992)
450 L´vovich (1979)
450 Sims et al. (1978)
450 Stephenson (1990)
480 Bokhari and Singh(1974)
530 Sims et al. (1978)
571 Frank and Inouye(1994)
600 Stephenson (1990)
633 Bokhari and Singh(1974)
warm and hot
grassland e
tropical 17,300 7 599 403 862 10,356 6967 14,913
403 Le Houerou (1984)
466 Lieth (1975)
500 L´vovich (1979)
596 Misra (1979)
655 Carlson et al.(1990)
708 Laurenroth (1979)
862 Weltz andBlackburn (1995)
montane grassland temperate 650 4 655 430 951 426 280 618
430 Sims et al. (1978)
440 Sims et al. (1978)
799 Holdsworth andMark (1990)
951 Holdsworth andMark (1990)
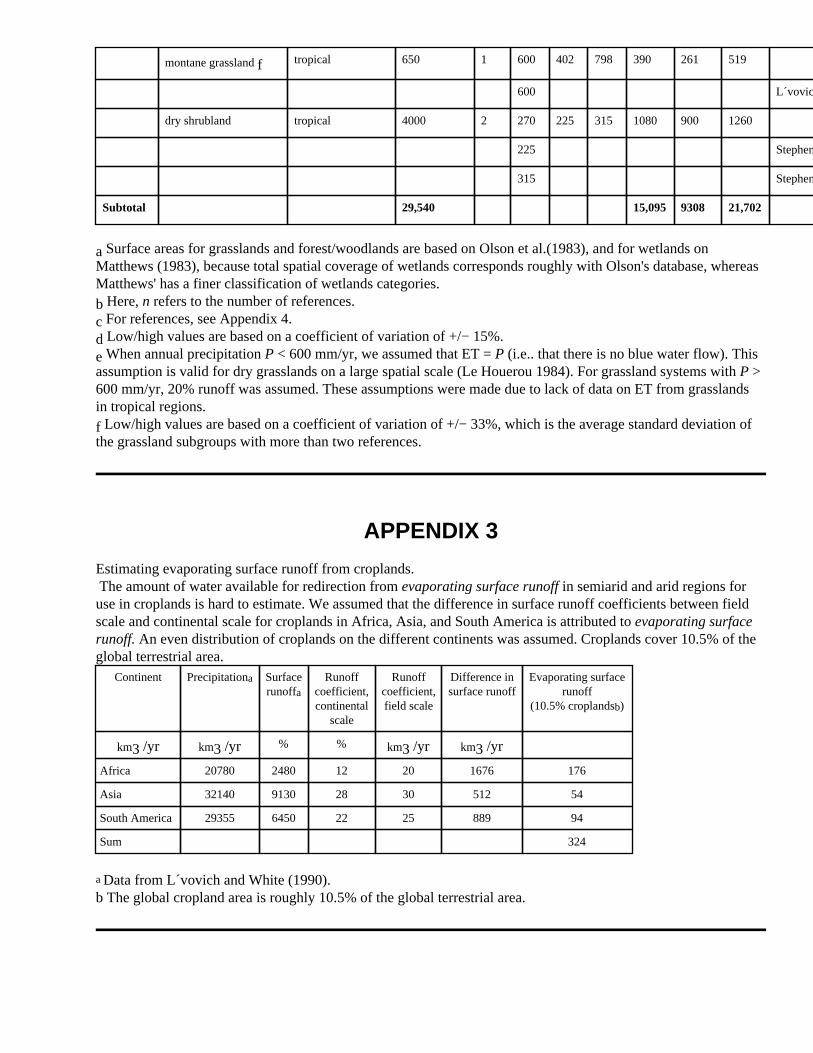
montane grassland f tropical 650 1 600 402 798 390 261 519
600 L´vovich (1979)
dry shrubland tropical 4000 2 270 225 315 1080 900 1260
225 Stephenson (1990)
315 Stephenson (1990)
Subtotal 29,540 15,095 9308 21,702
a Surface areas for grasslands and forest/woodlands are based on Olson et al.(1983), and for wetlands onMatthews (1983), because total spatial coverage of wetlands corresponds roughly with Olson's database, whereasMatthews' has a finer classification of wetlands categories.
b Here, n refers to the number of references.
c For references, see Appendix 4.
d Low/high values are based on a coefficient of variation of +/− 15%.
e When annual precipitation P < 600 mm/yr, we assumed that ET = P (i.e.. that there is no blue water flow). Thisassumption is valid for dry grasslands on a large spatial scale (Le Houerou 1984). For grassland systems with P >600 mm/yr, 20% runoff was assumed. These assumptions were made due to lack of data on ET from grasslandsin tropical regions.
f Low/high values are based on a coefficient of variation of +/− 33%, which is the average standard deviation ofthe grassland subgroups with more than two references.
APPENDIX 3
Estimating evaporating surface runoff from croplands. The amount of water available for redirection from evaporating surface runoff in semiarid and arid regions foruse in croplands is hard to estimate. We assumed that the difference in surface runoff coefficients between fieldscale and continental scale for croplands in Africa, Asia, and South America is attributed to evaporating surfacerunoff. An even distribution of croplands on the different continents was assumed. Croplands cover 10.5% of theglobal terrestrial area.
Continent Precipitationa Surfacerunoffa
Runoffcoefficient,continental
scale
Runoffcoefficient,field scale
Difference insurface runoff
Evaporating surfacerunoff
(10.5% croplandsb)
km3 /yr km3 /yr % % km3 /yr km3 /yr
Africa 20780 2480 12 20 1676 176
Asia 32140 9130 28 30 512 54
South America 29355 6450 22 25 889 94
Sum 324
a Data from L´vovich and White (1990). b The global cropland area is roughly 10.5% of the global terrestrial area.
APPENDIX 4
Cited literature in appendices. Abtew, W. 1996. Evapotranspiration measurements and modelling for three wetland systems in south Florida.Water Resources Bulletin32:465−473.
Ajtay, G. L., P. Ketnerand, and P. Duvigneaud. 1979. Pages 129−182 in B. Bolin, E. T. Degens, S. Kempe,and P. Ketner. The global carbon cycle. John Wiley, New York, New York, USA
Andersen, M. N., C. R. Jensen, and R. Lösch. 1992. The interaction effects of potassium and drought infield−grown barley. I. Yield, water−use efficiency and growth. Acta Agriculturae Scandinavica42:34−44.
Angell, R. F., and R. F. Miller. 1994. Simulation of leaf conductance and transpiration in Juniperusoccidentalis. Forest Science40:5−17.
Armstrong, E. L., J. S. Pate, and D. Tennant. 1994. Water use and root growth in field pea. AustrailianJournal of Plant Physiology21:517−532.
Ashley, D. A. 1983. Pages 389−422 in I. D. Teare and M. M.Peet, editors. Crop−water relations. John Wiley,New York, New York, USA.
Baker, R. E., A. B. Frank, and J. D. Berdahl. 1989. Cultivar and clonal differenceces for water−use efficiencyand yield in four forage grasses. Crop Science29:58−61.
Barros, L.C.G., and R. J. Hanks. 1993. Evapotranspiration and yield as affected by mulch and irrigation.Agronomy Journal85:692−697.
Beech, D. F., and G. J. Leach. 1989. Comparative growth, water−use, and yield of chickpea, safflower, andwheat in south−eastern Queensland. Australian Journal of Experimental Agriculture29:655−662.
Bhan, S., M. Balaraju, and V. Ram. 1980. Water use, yield, and quality of rapeseed as influenced by spacing,irrigation and time of harvest when raised in a multiple−cropping system. Indian Journal of AgriculturalScience50:760−763.
Black, C. C. 1971. Ecological implications of dividing plants into groups with distinct photosynthetic productioncapabilities. Advances in Ecological Research7:87−110. Black, T. A., G. Denhartog, H. H. Neuman, P. D. Blanken, P. C. Yang, C. Russell, Z. Nesic, X. Lee, S. G.Chen, R. Staehler, M. D. Novak. 1996. Annual cycles of water vapour and carbon dioxide fluxes in and above aboreal aspen forest. Global Change Biology2−3:219−229.
Boeye, D., and R. F Verheyen. 1992. The hydrological balance of a groundwater discharge fen. Journal ofHydrology137:149−163.
Bokhari, U. G., and J. S Singh. 1975. Standing state and cycling of nitrogen in soil−vegetation components ofprairie ecosystems. Annual Botany39:273−285.
Bolger, T. P., and A. G. Matches. 1990. Water−use efficiency and yield of safoin and alfalfa. CropScience30:143−148.
Boote, K. J. 1983. Pages 255−286 in I. D. Teare and M. M.Peet, editors. Crop−water relations. John Wiley,New York, New York, USA.
Branson, F. A, R. F. Millerand, and I. S. McQueen. 1969. Plant communities and associated soil and water
factors on shale−derived soils in northeastern Montana. Ecology51:391−407.
Brown, S. C., P. J.Gregory, and A. Wahbi. 1987. Pages 275−283 in J. P. Srivastava, E. Porceddu, E. Acevedo,and S. Varma, editors. Drought tolerance in winter cereals. John Wiley, Chichester, UK.Bucks, D. A., F. S. Nakayama, and O. F. French. 1984. Water management for guayule rubber production.Transactions of the ASAE.27:1763−1770.
Bucks, D. A., F. S.Nakayama, O. F. French, W. W. Legard, and W. L Alexander. 1985. Irrigated guayule −production and water use relationships. Agricultural Water Management10:95−102.
Carlson, D. H., T. L. Thurow, R. W. Knight, and R. K. Heitschmidt. 1990. Effect on honey mesquite on thewater balance of Texas Rolling Plains rangeland. Journal of Range Management 43:491−496.
Dolan, T. J., A. J. Hermann, S. E. Bayley, and J. Zoltek. 1984. Evapotranspiration of a Florida, U.S.A.,freshwater wetland. Journal of Hydrology74:355−371.
Doorenbos, J., and A. H. Kassam. 1979. Yield response to water. FAO Irrigation and Drainage Paper, Rome,Italy.
Entz, M. H., and D. B. Fowler. 1991. Agronomic performance of winter versus spring wheat. AgronomyJournal83:527−532.
FAO. 1995. World agriculture: towards 2010. N. Alexandratos, editor. John Wiley, Chichester, UK.
Faostat. 1997. Electronic database available on the internet http://apps.fao.org FAO, Statistics Division, Rome,Italy. [Data taken 09/26/97.]Frank, D. A., and R. S. Inouye. 1994. Temporal variation in actual evapotranspiration of terrestrial ecosystems:patterns and ecological implications. Journal of Biogeography21:401−411.
Gascho, G. J., and S. F. Shih. 1983. Pages 445−480 in I. D. Teare and M. M.Peet, editors. Crop−waterrelations. John Wiley, New York, New York, USA.
Gehrels, J., and G. Mulamoottil. 1990. Hydrologic processes in a southern Ontario wetland.Hydrobiologia208:221−234.
Gilvear, D. J., R. Andrews, J. H.Tellam, J. W. Lloyd, and D. N. Lerner. 1993. Quantification of the waterbalance and hydrogeological processes in the vicinity of a small groundwater−fed wetland, East Anglia, UK.Journal of Hydrology144:311−334.
Gleick, P. H. 1996. Basic water requirements for human activities: meeting basic needs. WaterInternational2183–92.
Gregory, P. J. 1988. Pages 171−175 in Proceedings of a Conference on Dryland Farming, Amarillo/Bushland,Texas, August 1988. Challenges in dryland agriculture: a global perspective. Texas A M University Press,Texas, USA.
Grimes, D. W., H. Yamada, and W. L. Dickens. 1969. Functions for cotton (Gossypium hirsutum L.)production from irrigation and nitrogen fertilization variables: I. Yield and evapotranspiration. AgronomyJournal61:769−773.
Hattendorf, M. J., M. S. Redselfs, B. Amos, L. R. Stone, and R. E Gwin, Jr. 1988. Comparative water usecharacteristics of six row crops. Agronomy Journal80:80−85
Hearn, A. B. 1980. Water relationships in cotton. Outlook Agriculture10:159−166.
Heichel, G. H. 1983. Pages 127−156 in I. D. Teare and M. M.Peet, editors. Crop−water relations. John Wiley,New York, New York, USA.
Heitholt, J. J. 1989. Water use efficiency and dry matter distribution in nitrogen and water−stressed winterwheat. Agronomy Journal81:464−469.
Hillel, D., and Y. Guron. 1973. Relation between evapotranspiration rate and maize yield. Water ResourcesResearch9:743−748.
Holdsworth, D. K., and A. F. Mark. 1990. Water and nutrient input : output budgets. Effects of plant cover atseven sites in upland snow tussok grasslands of Eastern and Central Otago, New Zealand. Journal of the RoyalSociety of New Zealand20:1−24.
Imitiyaz, M., K. J. Kristensen, and V. Overgaard Mogensen. 1982. Influence of irrigation on water extraction,evapotranspiration, yield and water use efficiency of spring wheat and barley. Acta AgriculturaeScandinavica32:263−271.
Jackson, I. J. 1989. Climate, water and agriculture in the tropics. Longman Scientific and Technical, New York,New York, USA.
Joffre, R., and S. Rambal. 1993. How tree cover influences the water balance of Mediterranean rangelands.Ecology74:570−582.
Johnsson, R. C. 1994. Pages 71−78 in M. C. Heath, T. M. Hess, T. J. Hocking, D. K. L. Mackerran, and W.Stephens, editors. Aspects of applied biology. Volume 38. Association of Applied Biologists, Wellesbourne, UK
Kanber, R., A. Yazar, S. Önder, and H. Köksal. 1993. Irrigation response of pistachio (Pistacia vera L.).Irrigation Science14:7−14.
Kirkham, M. B., and Kanemasu. 1983. Pages 481−520 in I. D. Teare and M. M.Peet, editors. Crop−waterrelations. John Wiley, New York, New York, USA.
L'vovich, M. I. 1979. World water resources and their future. LithoCrafters Inc., Chelsea, UK.
L´vovich, M. I., and G. F. White. 1990. Use and transformation of terrestrial water systems. Pages 235−252in B. L. Turner II, W. C. Clark, R. W. Kates, J. F. Richards, J. T. Mathews, and W. B. Meyer, editors. The Earthas transformed by human action. Cambridge University Press, Cambridge, UK.
Lascano, R. J., R. L. Baumhart, S. K. Hicks, and J. L. Heilman. 1994. Soil and plant water evaporation fromstrip−tilled cotton: measurement and simulation. Agronomy Journal86:987−994.
Lauenroth, W. K. 1979. Pages 3−24 in N. R. French, editor. Perspectives in grasslandecology. Springer−Verlag, New York, New York, USA.
Laycock, D. H. 1964. An empirical correlation between weather and yearly tea yields in Malawi. TropicalAgriculture41:277−300.
Le Houerou, H. N. 1984 Rain use efficiency: a unifying concept in arid−land ecology. Journal of AridEnvironments7:213−247.
Leopoldo, P. R., W. K. Franken, and N. A. V. Nova. 1995. Real evapotranspiration through a tropical rainforest in central Amazonia as estimated by the water balance method. Forest Ecology andManagement73:185−195.
Liang,Y. M., D. L. Hazlett, and W. K. Laurenroth. 1989. Biomass dynamics and water use efficiencies of fiveplant communities in the shortgrass steppe. Oecologia 80:148−153.
Lieth, H. 1975. Pages 203−216 in H. Lieth and R. H. Whittaker, editors. Primary productivity of thebiosphere. Springer−Verlag, Berlin, Germany.
López−Castañeda, C., and R. A. Richards. 1994. Variation in temperate cereals in rainfed environments. III.Water use and water−use efficiency. Field Crops Research39:85−98.
Luxmoore, R. J. 1983. Water budget of an eastern deciduous forest stand. Journal of the Soil Scince Society ofAmerica47:785−791.
Mahalakshmi, V. S. Grandos, I. Naji, S. Ceccarelli, and J.M. Peakock. 1994. Pages 145−152 in M. C. Heath,T. M. Hess, T. J. Hocking, D. K. L. Mackerran, and W. Stephens, editors. Aspects of applied biology. Volume 38.Association of Applied Biologists, Wellesbourne, UK.
Matthews, E. 1983. Global vegetation and land use: new high−resolution databases for climate studies. Journalof Climate and Applied Meteorology22:474−487.
Mémento de l´Agronome. 1984. Ministère de la coopération et du développement, Paris, France.
Misra, R. C. 1979. Pages 189−246 in R. T. Coupland, editor. Grassland ecosystems of the world. CambridgeUniversity Press, Cambridge, UK
Mitch, W. J., and J. G. Gosselink. 1983. Wetlands. Van Nostrand Reinhold, New York, New York, USA.
Moran, R. J., and P. J. O'Shaugnessy. 1984. Determination of the evapotranspiration of E. regnans forestedcatchments using hydrological measurements. Agricultural Water Management8:57−76.
Oliva, R. N., J. J. Steiner, and W. C. Young. 1994. White clover seed production: I. Crop water requirementsand irrigation timing. Crop Science34:762−767.
Olson, J. S., J. A. Watts, and L. J. Allison. 1983. Carbon in live vegetation of major world ecosystems.OakRidge National Laboratory, Environmental Science Division, Report ORNL−5862, Oak Ridge, Tennessee, USA.
Postel, S. L., G. C. Daily, and P. R. Ehlich. 1996. Human appropriation of renewable fresh water.Science271:785−788.
Power, J. F. 1991. Growth characteristics of legume cover crops in a semiarid environment. Soil Science Societyof America Journal55:1659−1663.
Pruitt, W. O., E. Fereres, D. W. Henderson, and R. M Hagan. 1984. Evapotranspiration losses of tomatoesunder drip and furrow irrigation. California Agriculture38:10−11.
Roberts, G., and A. M. Roberts. 1992. Computing the water balance of a small agricultural catchment insouthern England by consideration of different land−use types. II. Evaporative losses from different vegetationtypes. Agricultural Water Management21:155−166.
Rockström, J. 1992. Water use efficiency in agriculture: How can it be improved in arid and semi−aridtropics? Report Tema V, University of Linköping, Department of Water and Environmental Studies, Linköping.
Rouse, W. R. 1982. The water balance of upland tundra in the Hudson Bay lowlands − measured and modelled.Canadien Naturaliste109:457−467.

Running, S. W., R. R. Nemani, D. L. Peterson, L. E. Band, D. F. Potts, L. L. Pierce, and M. A.Spanner. 1989. Mapping regional forest evapotranspiration and photosynthesis by coupling satellite data withecosystem simulation. Ecology70:1090−1101.
San−José, J. J., R. A. Montes, and A. Florentino. 1995. Water flux through a semi−deciduous forest grove ofthe Orionocco savannas. Oecologia101:141−150.
Schaeffer−Novelli, Y., H. de SL. Mesquita, and G. Cintron−Molero. 1990. The Cananeia Lagoon estuarinesystem, Sao Paulo, Brazil. Estuaries13:193−203.
Scott P. R., and R. A Sudemyer. 1993. Evapotranspiration from agricultural plant communities in the highrainfall zone of the southwest of Western Australia. Journal of Hydrology146:301−319.
Shih, S. F., G. S.Rahi, G. H. Snyder, D. S. Harrison, and A. G. Smajstrla. 1983. Rice yield, biomass and leafarea related to evapotranspiration. Transactions of the ASAE26:1458−1464.
Shih, S.F. 1988 Sugarcane yield, biomass and water use efficiency. Trans. ASAE31:142−148.
Shih, S. F., and G. S. Rahi. 1984. Evapotranspiration of lettuce in relation to water table depth. Transactions ofthe ASAE27:1047−1080.
Shih, S. F., and G. H. Snyder. 1985. Water table effects on pasture yield and evapotranspiration. Transactoinsof the ASAE28:1573−1577.
Shuval, H. 1996. Sustainable water resources versus concepts for food security, water security, and water stressfor arid countries. CFWA workshop, Stockholm Environment Institute, New York, New York, USA.
Sims, P. L, J. S. Singh, and W. K. Laurenroth. 1978. The structure and function of ten western NorthAmerican grasslands. I. Abiotic and vegetational characteristics. Journal of Ecology66:251−280.
Stephens, W., and M. K. V. Carr. 1991. Responses of tea (Camellia sinensis) to irrigation and fertilizer. II.Water use. Experimental Agriculture27:193−210.
Stephenson, N. L. 1990. Climatic control of vegetation distribution: the role of the water balance. AmericanNaturalist135:649−670.
Stewart, J. I., R. D. Misra, W. O. Pruitt, and R. M. Hagan. 1975. Irrigating corn and grain sorghum with adeficient water supply. Transactions of the ASAE 18:270−280.
Tanner, C. B. 1981. Transpiration efficiency of potato. Agronomy Journal73:59−64.
Thomas, H. 1994. Pages 41−46 in M. C. Heath, T. M. Hess, T. J. Hocking, D. K. L. Mackerran, and W.Stephens, editors. Aspects of applied biology. Volume 38. The Association of Applied Biologists, Wellesbourne,UK
Tiktak, A., and W. Bouten. 1994. Soil water dynamics and long−term water balances of a Douglas−fir stand inthe Netherlands. Journal of Hydrology156:265−283. Turner, N. C., and G. N. McCauley. 1983. Pages 307−350 in I. D. Teare and M. M.Peet, editors. Crop−waterrelations. John Wiley, New York, New York, USA.
Vitousek, P.M., P.R. Ehrlich, A.H. Ehrlich, and P.A. Matson, P.A. 1986. Human appropriation of theproducts of photosynthesis. BioScience36:368 – 373.
Waldren, R. P. 1983. Pages 187−212 in I. D. Teare and M. M.Peet, editors. Crop−water relations. John Wiley,

New York, New York, USA.
Weltz, M. A., and W. H. Blackburn. 1995. Water budget for south Texas rangelands. Journal of RangeManagement48:45−52.
Winter, S. R. 1988. Influence of seasonal irrigation amount on sugarbeet yield and quality. Journal of SugarbeetResearch25:1−9.
WRI. 1994. World resources, 1994−1995. Oxford University Press, Oxford, UK.
Yadav, S. K., K. Chander, and D. P. Singh. 1994. Response of late−sown mustard (Brassica juncea) toirrigation and nitrogen. Journal of Agricultural Science 123:219−224.
Yao, N. R., and B. Goué. 1992. Water use efficiency of a cassava crop as affected by soil water balance.Agricultural Forest Meteorolgy61:187−203.
Yates, R. A., and R. D. Taylor. 1986. Water use efficiencies in relation to sugarcane yields. Soil Use andManagement2:70−76.
Yin, X. 1993. Variation in foliar nitrogen concentration by forest type and climatic gradients in North America.Canadian Journal of Forest Research23:1587−1602.
Yin, Z. Y., and G. A. Brook. 1992. Evapotranspiration in the Okefenokee Swamp watershed: A comparison oftemperature−based and water balance methods. Journal of Hydrology131:293−312.
Address of Correspondent:Carl FolkeNatural Resources Management Department of Systems Ecology Stockholm University S−106 91 Stockholm, SwedenandBeijer International Institute of Ecological EconomicsRoyal Swedish Academy of SciencesPO Box 50005, S−10405 Stockholm, SwedenPhone: +46 8 164217Fax: +46 8 [email protected]
*The copyright to this article passed from the Ecological Society of America to the Resilience Alliance on 1 January 2000.
Return to Table of Contents for Volume 3, Issue 2