Table of Contents - VMwaredocs.hol.vmware.com/HOL-2018/hol-1801-02-cmp_pdf_en.pdf · The Table of...
93
Table of Contents Lab Overview - HOL-1801-02-CMP - vRealize Suite Standard: Automated, Proactive Management ..................................................................................................................... 2 Lab Guidance .......................................................................................................... 3 Module 1 - Automated workload placement and predictive DRS (30 minutes) ................. 9 Workload Balancing and Placement ...................................................................... 10 Proactively relieve compute contention (pDRS) ................................................... 23 Module Conclusion ................................................................................................ 26 Module 2 -Automated remediation of issues (30 minutes).............................................. 27 Introduction........................................................................................................... 28 Understanding the Alerting Framework................................................................. 29 Constructing Symptoms ........................................................................................ 30 Recommendations and Actions ............................................................................. 49 Building Alerts ....................................................................................................... 52 Automated Remediation ....................................................................................... 66 Conclusion............................................................................................................. 91 HOL-1801-02-CMP Page 1 HOL-1801-02-CMP
Transcript of Table of Contents - VMwaredocs.hol.vmware.com/HOL-2018/hol-1801-02-cmp_pdf_en.pdf · The Table of...

Table of ContentsLab Overview - HOL-1801-02-CMP - vRealize Suite Standard: Automated, ProactiveManagement..................................................................................................................... 2
Lab Guidance .......................................................................................................... 3Module 1 - Automated workload placement and predictive DRS (30 minutes) .................9
Workload Balancing and Placement ...................................................................... 10Proactively relieve compute contention (pDRS) ................................................... 23Module Conclusion ................................................................................................ 26
Module 2 -Automated remediation of issues (30 minutes).............................................. 27Introduction........................................................................................................... 28Understanding the Alerting Framework................................................................. 29Constructing Symptoms........................................................................................ 30Recommendations and Actions ............................................................................. 49Building Alerts....................................................................................................... 52Automated Remediation ....................................................................................... 66Conclusion............................................................................................................. 91
HOL-1801-02-CMP
Page 1HOL-1801-02-CMP

Lab Overview -HOL-1801-02-CMP -
vRealize Suite Standard:Automated, Proactive
Management
HOL-1801-02-CMP
Page 2HOL-1801-02-CMP

Lab GuidanceNote: It will take more than 60 minutes to complete this lab. You shouldexpect to only finish 2-3 of the modules during your time. The modules areindependent of each other so you can start at the beginning of any moduleand proceed from there. You can use the Table of Contents to access anymodule of your choosing.
The Table of Contents can be accessed in the upper right-hand corner of theLab Manual.
In this Lab you will see how to automate the workload balance across your vSphereInfrastructure and automatically remediate any issues that may come up in theenvironment.
Lab Module List:
• Module 1 - Automated workload placement and predictive DRS (60minutes) (Advanced)
• Module 2 -Automated remediation of issues (30 minutes) (Advanced)
Lab Captains:
• Module 1 - Mark Plaza, Sr. Systems Engineer, USA• Module 2 - Tiago Baeta, Staff Systems Engineer, Brazil
This lab manual can be downloaded from the Hands-on Labs Document site found here:
http://docs.hol.vmware.com
This lab may be available in other languages. To set your language preference and havea localized manual deployed with your lab, you may utilize this document to help guideyou through the process:
http://docs.hol.vmware.com/announcements/nee-default-language.pdf
HOL-1801-02-CMP
Page 3HOL-1801-02-CMP
Location of the Main Console
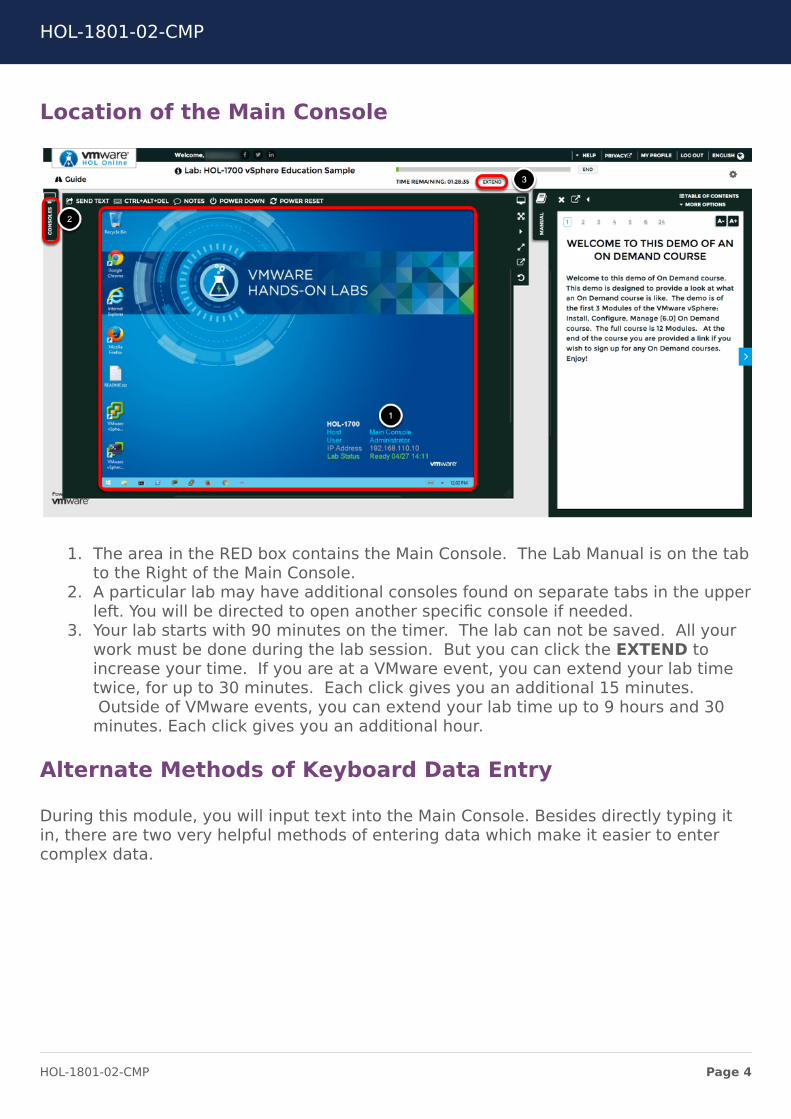
1. The area in the RED box contains the Main Console. The Lab Manual is on the tabto the Right of the Main Console.
2. A particular lab may have additional consoles found on separate tabs in the upperleft. You will be directed to open another specific console if needed.
3. Your lab starts with 90 minutes on the timer. The lab can not be saved. All yourwork must be done during the lab session. But you can click the EXTEND toincrease your time. If you are at a VMware event, you can extend your lab timetwice, for up to 30 minutes. Each click gives you an additional 15 minutes.Outside of VMware events, you can extend your lab time up to 9 hours and 30
minutes. Each click gives you an additional hour.
Alternate Methods of Keyboard Data Entry
During this module, you will input text into the Main Console. Besides directly typing itin, there are two very helpful methods of entering data which make it easier to entercomplex data.
HOL-1801-02-CMP
Page 4HOL-1801-02-CMP
Click and Drag Lab Manual Content Into Console ActiveWindow
You can also click and drag text and Command Line Interface (CLI) commands directlyfrom the Lab Manual into the active window in the Main Console.
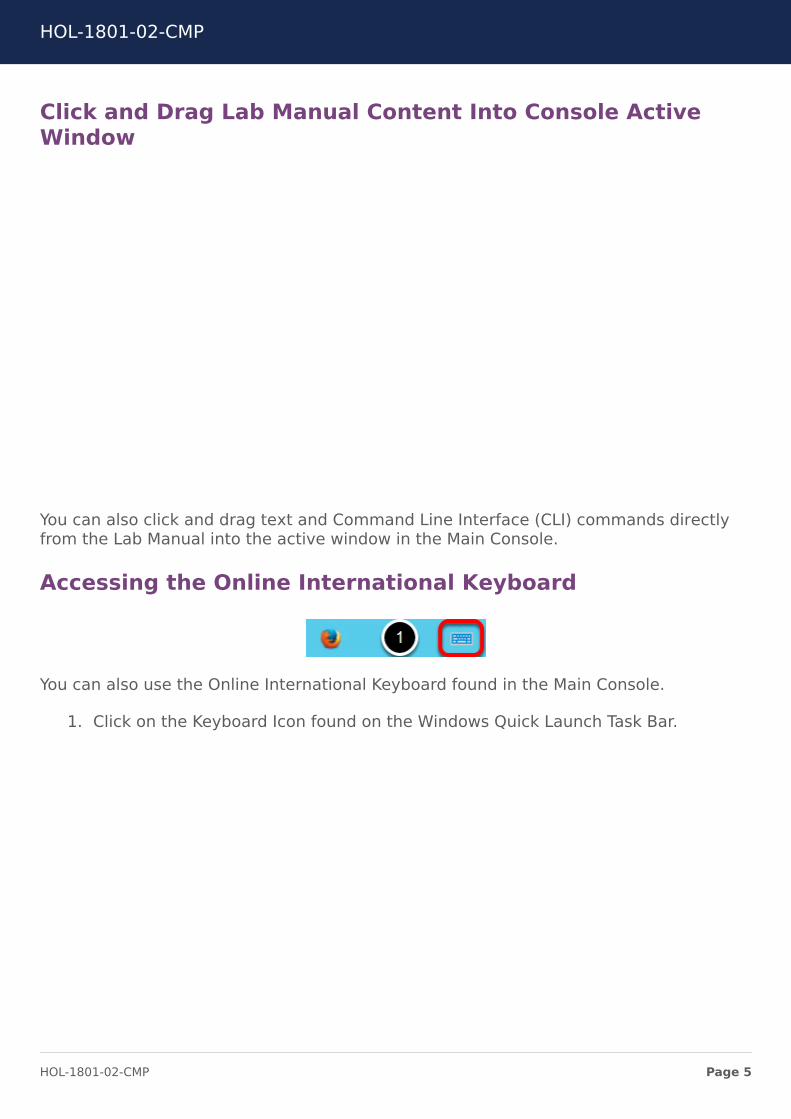
Accessing the Online International Keyboard
You can also use the Online International Keyboard found in the Main Console.
1. Click on the Keyboard Icon found on the Windows Quick Launch Task Bar.
<div class="player-unavailable"><h1 class="message">An error occurred.</h1><div class="submessage"><ahref="http://www.youtube.com/watch?v=xS07n6GzGuo" target="_blank">Try watching this video on www.youtube.com</a>, or enableJavaScript if it is disabled in your browser.</div></div>
HOL-1801-02-CMP
Page 5HOL-1801-02-CMP
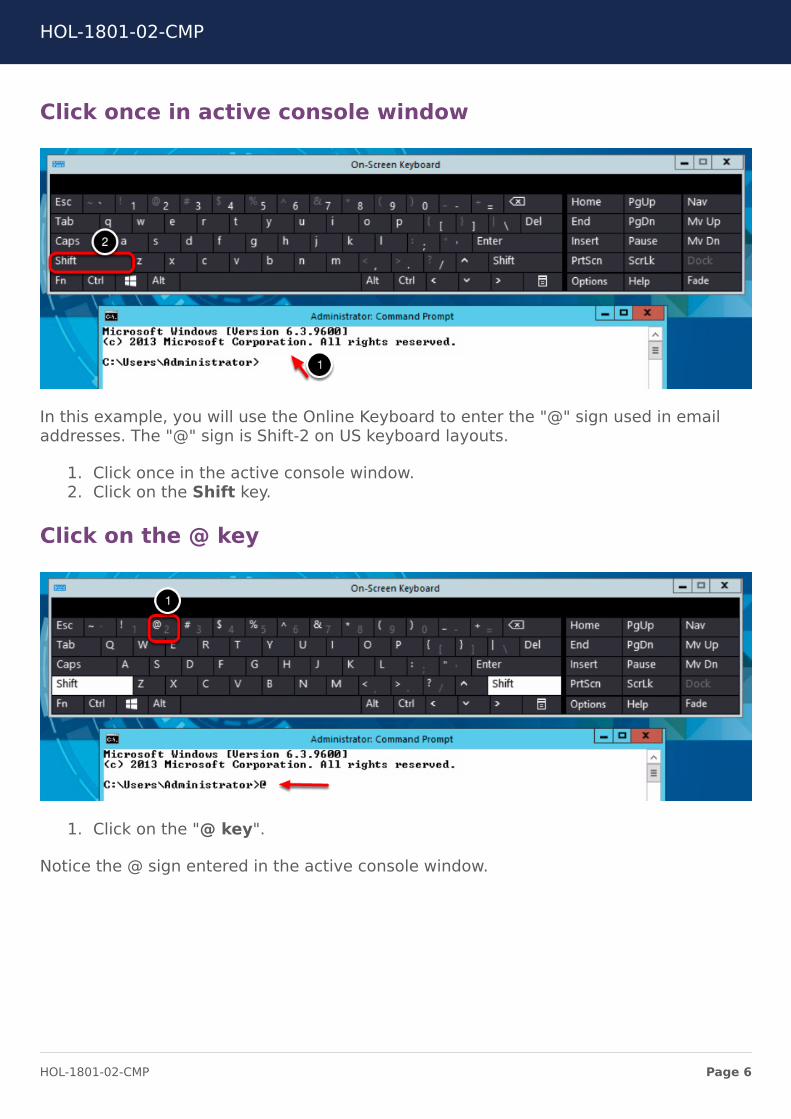
Click once in active console window
In this example, you will use the Online Keyboard to enter the "@" sign used in emailaddresses. The "@" sign is Shift-2 on US keyboard layouts.
1. Click once in the active console window.2. Click on the Shift key.
Click on the @ key
1. Click on the "@ key".
Notice the @ sign entered in the active console window.
HOL-1801-02-CMP
Page 6HOL-1801-02-CMP

Activation Prompt or Watermark
When you first start your lab, you may notice a watermark on the desktop indicatingthat Windows is not activated.
One of the major benefits of virtualization is that virtual machines can be moved andrun on any platform. The Hands-on Labs utilizes this benefit and we are able to run thelabs out of multiple datacenters. However, these datacenters may not have identicalprocessors, which triggers a Microsoft activation check through the Internet.
Rest assured, VMware and the Hands-on Labs are in full compliance with Microsoftlicensing requirements. The lab that you are using is a self-contained pod and does nothave full access to the Internet, which is required for Windows to verify the activation.Without full access to the Internet, this automated process fails and you see this
watermark.
This cosmetic issue has no effect on your lab.
Look at the lower right portion of the screen
HOL-1801-02-CMP
Page 7HOL-1801-02-CMP

Please check to see that your lab is finished all the startup routines and is ready for youto start. If you see anything other than "Ready", please wait a few minutes. If after 5minutes your lab has not changed to "Ready", please ask for assistance.
HOL-1801-02-CMP
Page 8HOL-1801-02-CMP
Module 1 - Automatedworkload placement and
predictive DRS (30minutes)
HOL-1801-02-CMP
Page 9HOL-1801-02-CMP

Workload Balancing and PlacementWithin a virtualized environment, even with the best planning, the distribution of theworkloads between hosts, clusters and data centers can get out of balance. Being out ofbalance itself is not a problem as long each workload can obtain the resources it needswithout causing contention. Contention exists when the workload on a specific hostrequests more resources than are available. Resource contention is one of the mostcritical issues in any virtualized environment. When contention occurs, applicationsslow down and your users are affected.
Distributed Resource Scheduler (DRS) is a proven vSphere feature that moves virtualmachines (VMs) within a cluster (between hosts) to ensure virtual machines are alwaysrunning on a host with adequate resources to support it.
vRealize Operations Manager can move virtual machines between clusters to ensurethe clusters are balanced in the environment, which in the end helps DRS. vRealizeOperations Manager's Rebalance Container action allows you to balance workloadsbetween the clusters in your data center or custom data centers by providing you moverecommendations. These move recommendations come in the form of a rebalanceaction plan. The plan lists move recommendations and provides a reason on why tomove it (CPU or memory imbalance).
Up until now two different methodologies have been employed to mitigate the risk ofcontention, with varied results. New to vRealize Operations and vSphere is PredictiveDRS, a capability that can be used to minimize resource contention proactively.Predictive DRS uses a combination of DRS and vRealize Operations Manager to predict
future demand and determine when and where hot spots will occur. When future hotspots are found, Predictive DRS moves the workloads before contention occurs.
Launch the HVM vRealize Operations Manager Console
Open Firefox Browser from Windows Quick Launch TaskBar
1. Click on the Firefox Icon on the Windows Quick Launch Task Bar.
HOL-1801-02-CMP
Page 10HOL-1801-02-CMP
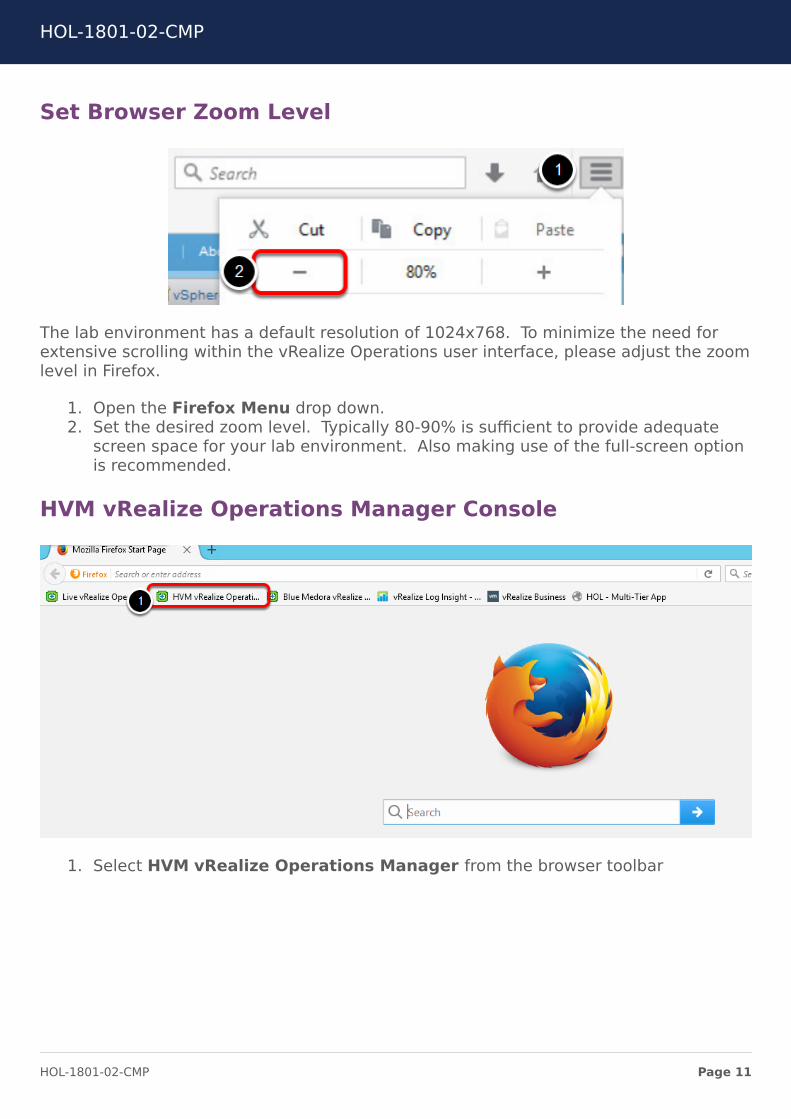
Set Browser Zoom Level
The lab environment has a default resolution of 1024x768. To minimize the need forextensive scrolling within the vRealize Operations user interface, please adjust the zoomlevel in Firefox.
1. Open the Firefox Menu drop down.2. Set the desired zoom level. Typically 80-90% is sufficient to provide adequate
screen space for your lab environment. Also making use of the full-screen optionis recommended.
HVM vRealize Operations Manager Console
1. Select HVM vRealize Operations Manager from the browser toolbar
HOL-1801-02-CMP
Page 11HOL-1801-02-CMP

Log In
Login with the local admin credentials.
1. Select Local Users from the drop down.2. ID = admin ; Password = VMware1! and Click LOG IN
Workload Rebalancing
In the following steps and video, you will learn how to remediate a cluster basedresource constraint by rebalancing virtual machines between clusters using theRebalance Container Action.
HOL-1801-02-CMP
Page 12HOL-1801-02-CMP
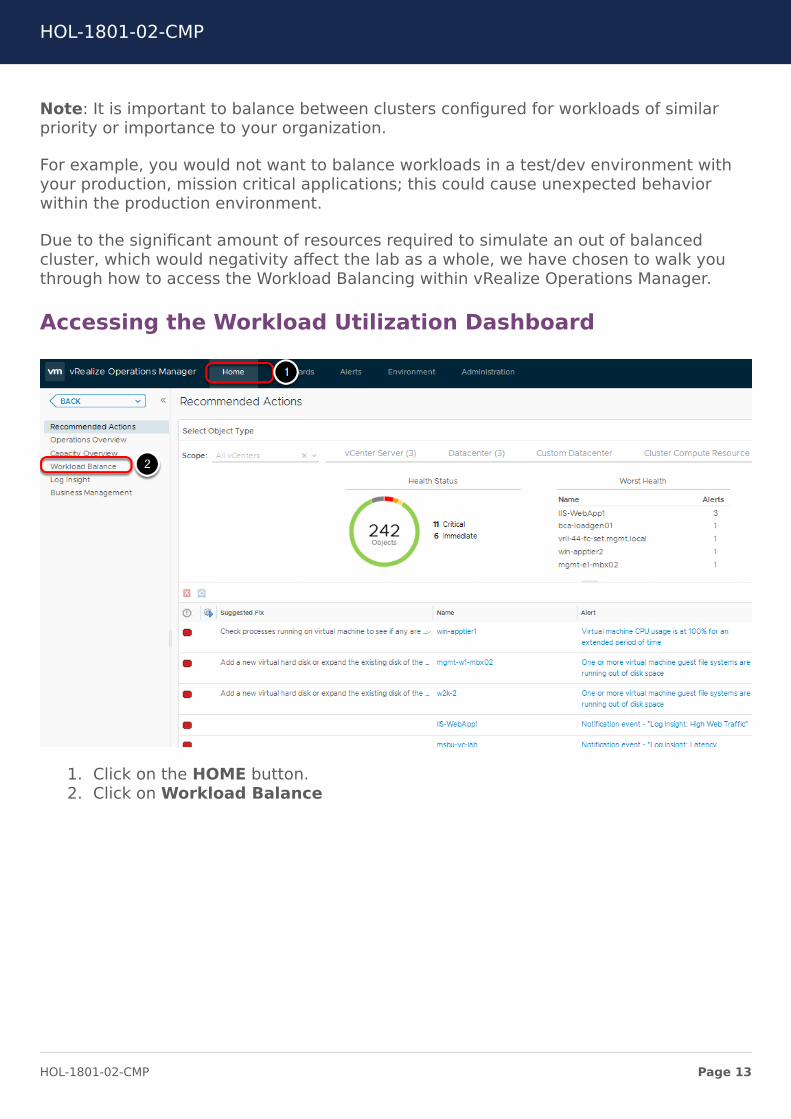
Note: It is important to balance between clusters configured for workloads of similarpriority or importance to your organization.
For example, you would not want to balance workloads in a test/dev environment withyour production, mission critical applications; this could cause unexpected behaviorwithin the production environment.
Due to the significant amount of resources required to simulate an out of balancedcluster, which would negativity affect the lab as a whole, we have chosen to walk youthrough how to access the Workload Balancing within vRealize Operations Manager.
Accessing the Workload Utilization Dashboard
1. Click on the HOME button.2. Click on Workload Balance
HOL-1801-02-CMP
Page 13HOL-1801-02-CMP

The Workload Utilization
The Workload Distribution widget divides objects into 3 categories;
1. Underutilized2. Optimal3. Overutilized
HOL-1801-02-CMP
Page 14HOL-1801-02-CMP

Drill into an Overutilized Resource
1. In the Cluster Compute Resource section (may require you to scroll), hoverover the lab-auto cluster in the Overutilized area.
2. Click Details.
HOL-1801-02-CMP
Page 15HOL-1801-02-CMP

Cluster Details
1. Click the Analysis tab, and Capacity Remaining.2. You can see details on why the cluster is constrained, and that Capacity
Remaining is in a critical state.
Notice capacity is monitored by Disk, Memory, and CPU. In this case the Memory is the"most constrained" resource.
HOL-1801-02-CMP
Page 16HOL-1801-02-CMP

Identify the Datacenter for lab-auto cluster
1. Click Home.2. Click Environment.3. Select vSphere Host and Clusters.
HOL-1801-02-CMP
Page 17HOL-1801-02-CMP

Identify the Datacenter for lab-auto cluster...Continued
1. Expand the Host and Clusters, "VC Lab" vCenter, and "lab-dc" datacenter .Let's take a look at the resource levels for this datacenter.
2. Click on the lab-dc object3. Click the More icon to display All options for this data center.
All Metrics
1. Select the Analysis tab
HOL-1801-02-CMP
Page 18HOL-1801-02-CMP
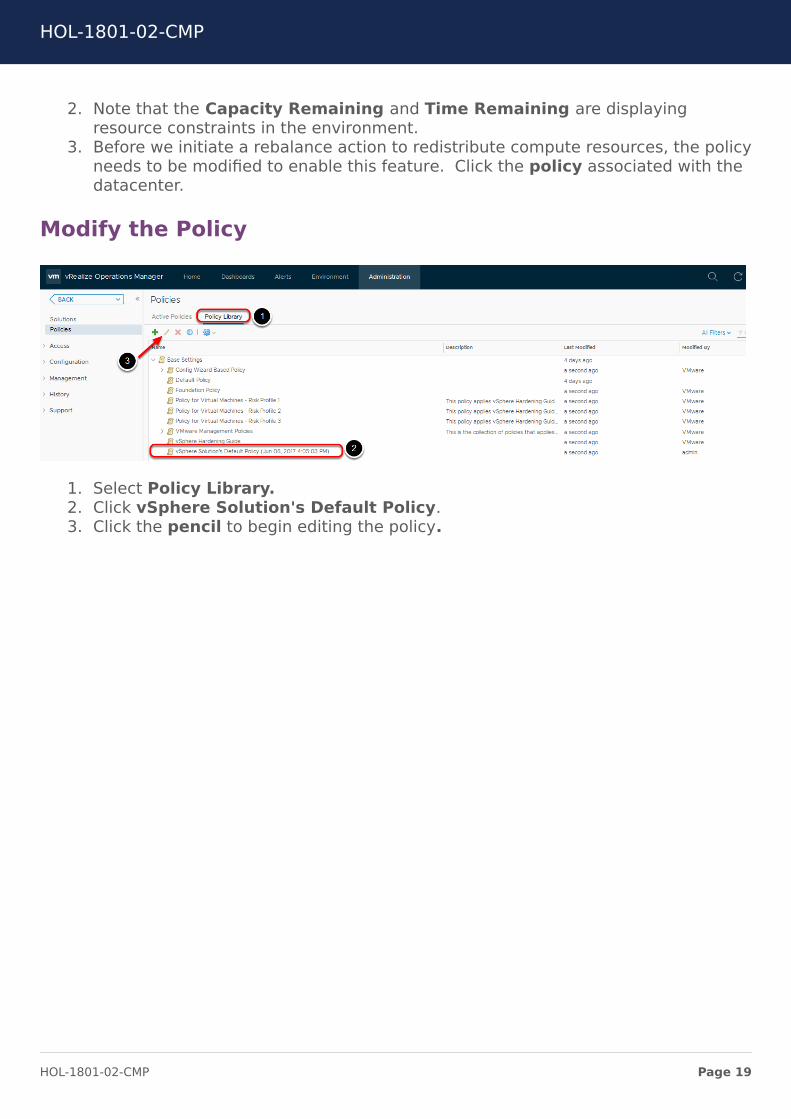
2. Note that the Capacity Remaining and Time Remaining are displayingresource constraints in the environment.
3. Before we initiate a rebalance action to redistribute compute resources, the policyneeds to be modified to enable this feature. Click the policy associated with thedatacenter.
Modify the Policy
1. Select Policy Library.2. Click vSphere Solution's Default Policy.3. Click the pencil to begin editing the policy.
HOL-1801-02-CMP
Page 19HOL-1801-02-CMP
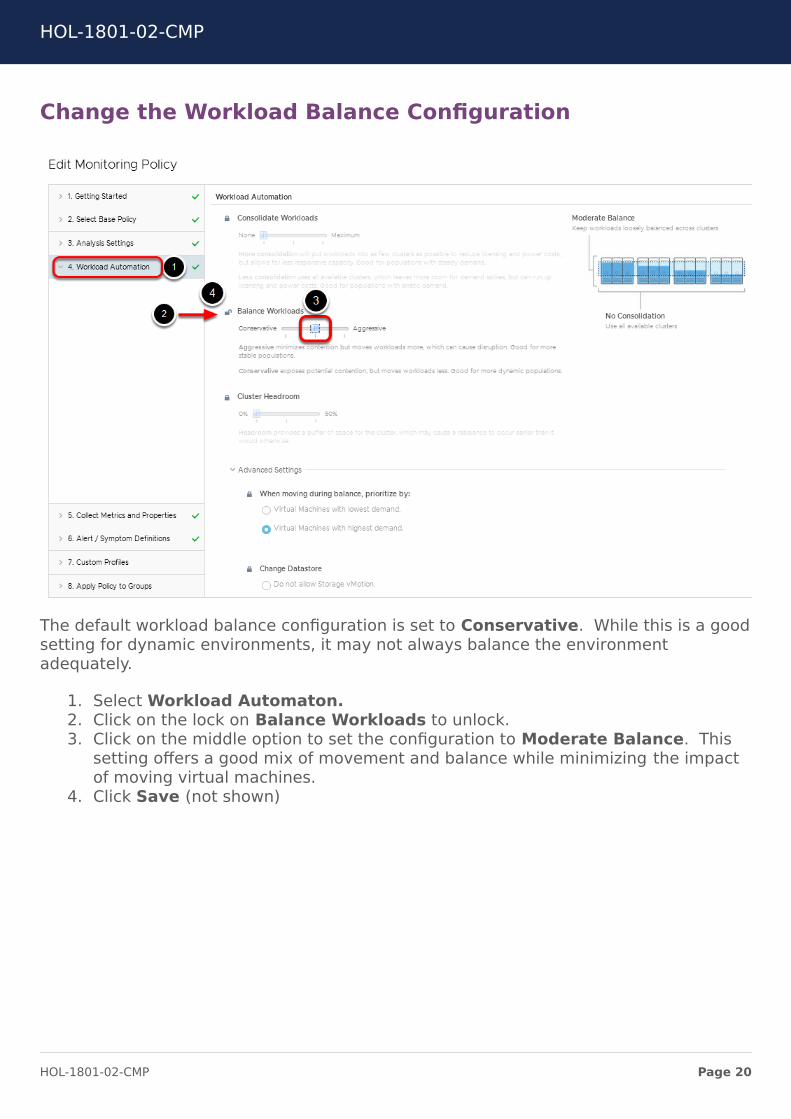
Change the Workload Balance Configuration
The default workload balance configuration is set to Conservative. While this is a goodsetting for dynamic environments, it may not always balance the environmentadequately.
1. Select Workload Automaton.2. Click on the lock on Balance Workloads to unlock.3. Click on the middle option to set the configuration to Moderate Balance. This
setting offers a good mix of movement and balance while minimizing the impactof moving virtual machines.
4. Click Save (not shown)
HOL-1801-02-CMP
Page 20HOL-1801-02-CMP

Start Rebalance Container Action
1. Click Home button.2. Select Workload Balance.3. Select lab-dc Datacenter object4. Click on the Rebalance action. (option is only available for a data center or a
custom datacenter)
Note: Since this is a controlled lab environment the "Rebalance Clusters" featurecannot be improved and is disabled. Take some time to review what other informationis available in this dashboard. The next page shows an example of what the rebalanceaction looks like.
HOL-1801-02-CMP
Page 21HOL-1801-02-CMP

Review Rebalance Container Action
Here is an example of what the Rebalance Container action overview provides. Detailson what systems will be moved to restore balance to the clusters and what this actionwill address.
You can see more details on this through this video: https://youtu.be/w5Pgs_8aazI
HOL-1801-02-CMP
Page 22HOL-1801-02-CMP

Proactively relieve compute contention(pDRS)Resource contention is one of the most critical issues in any virtualized environment.When contention occurs, applications slow down and your users are affected. Up untilnow two different methodologies have been employed to mitigate the risk ofcontention, with varied results. But now I want to introduce you to the new “gamechanging” method available from VMware: Predictive DRS!
Predictive DRS
How does Predictive DRS work? It starts by leveraging one of the core functions ofvRealize Operations, Dynamic Thresholds, which understand the behaviors of allworkloads throughout the day. vRealize Operations Manager collects hundreds ofmetrics across numerous types of objects (hosts, datastores, virtual machines, andother objects) every day. Each night vRealize Operations Manager runs DynamicThreshold calculations using sophisticated analytics to create a band of what is “normal”for each metric/object combination. The band has an upper and lower bound of normalfor each metric associated with object. For example, if there is a simple applicationserver virtual machine, vRealize Operations Manager will show the virtual machine doesnot use a lot of CPU early in the morning. However, at 8 AM, when people start logginginto the system, the CPU load will spike very high. It will then taper off around noon aspeople go to lunch, and then back up again for the rest of the day until people gohome. And don’t forget about the nightly reports which run at 2AM and spike CPU.
HOL-1801-02-CMP
Page 23HOL-1801-02-CMP

The great thing about Dynamic Thresholds is that they are tailored to each individualvirtual machine and application. There is nothing you need to do; the analytical enginein vRealize Operations takes care of everything.
Once vRealize Operations Manager has calculated its Dynamic Thresholds we have 3fundamental data points:
• How many resources is each virtual machine going to need throughout the day• What virtual machines are on running on what hosts?• How big is each host?
Once we have those we can ask the most important contention mitigation question ofall, “Will any of my hosts struggle to serve my workloads today”? If the answer is “Yes”then let’s move a few virtual machines around to avoid that future contentious situation.In a nutshell, this is how Predictive DRS works.
Which method should you use?
By combining DRS capabilities of vSphere 6.5 with historical trends, KPIs and analyticsfrom vRealize Operations Manager, users can get three ways for avoiding/resolvingresource contention.
1. Reactive: The vSphere Distributed Resource Scheduler (DRS) capability resolvesunexpected resource demand by moving VMs within a cluster when contentionbegins.
2. Balance: By combining vSphere DRS and vRealize Operations Work LoadPlacement (WLP) capabilities, VI admins can balance utilization by moving VMsbetween clusters, thereby mitigating resource contention risk.
HOL-1801-02-CMP
Page 24HOL-1801-02-CMP
3. Predictive: In Predictive DRS, resource utilization trends from vRealizeOperations Manager are sent to vSphere 6.5 DRS. This predictive demand ofworkloads is incorporated into DRS algorithms to provide faster balancing andbetter performance between clusters before contention occurs
The SDDC virtual infrastructure (VI) teams will ultimately use a combination of thesethree approaches to avoid and resolve contention in their data centers, and PredictiveDRS is a powerful addition to the toolbox for VI teams looking to optimize resourceutilization and minimize business impact from resource contention.
Predictive DRS Video
The video will focus on a Predictive DRS walk through showing how simple it is toconfigure the Predictive DRS feature in both vRealize Operations 6.6 and vSphere 6.5.This walk through will also serve as a great demonstration of the solution and give you aview into how it all comes together. After watching the video you should be easily ableto configure it in your environment and start seeing the benefits of Predictive DRS.
You can see more details on this through this video: https://youtu.be/cwaALGTyTMU
HOL-1801-02-CMP
Page 25HOL-1801-02-CMP

Module ConclusionYou have completed Module 1 - Automated Workload Placement and PredictiveDRS (pDRS)
You should now have an understanding of:
• Identify and Resolve Workload Contention• Predictive DRS
Feel free to proceed to the next module below:
Module 2 - Automated Remediation of Issues
How to End Lab
If you wish to conclude your lab at this time click on the END button. This will terminateyour lab and all progress. Do this only if you wish to NOT proceed with the othermodules.
HOL-1801-02-CMP
Page 26HOL-1801-02-CMP
Module 2 -Automatedremediation of issues (30
minutes)
HOL-1801-02-CMP
Page 27HOL-1801-02-CMP

IntroductionIn this module we will look at the Alerting Framework in vRealize Operations. We willcover the following topics:
• The Anatomy of the Alertiing Framework• Symptom Construction• Recommendations and Actions• Constructing Alert Definitions• Automated Remediation
This module should take about 30-45 minutes for you to complete.
HOL-1801-02-CMP
Page 28HOL-1801-02-CMP

Understanding the Alerting FrameworkThe Alerting Framework is a very powerful feature of the vRealize Operations platform.It's a relatively simple construct to understand, but once you master it, you can use itfor all sorts of useful purposes in your organisation.
Symptoms Recommendations and Actions
The main construct we use in the Alerting Framework is theAlert Definition. It is madeup of three parts:
• Symptoms- one or more symptoms that define the conditions under which analert will trigger.
• Recommendations- one or more recommendations on what to do if the alert istriggered
• Actions- carrying out the recommendation for the alert
Lets start by looking at Symptoms...
HOL-1801-02-CMP
Page 29HOL-1801-02-CMP
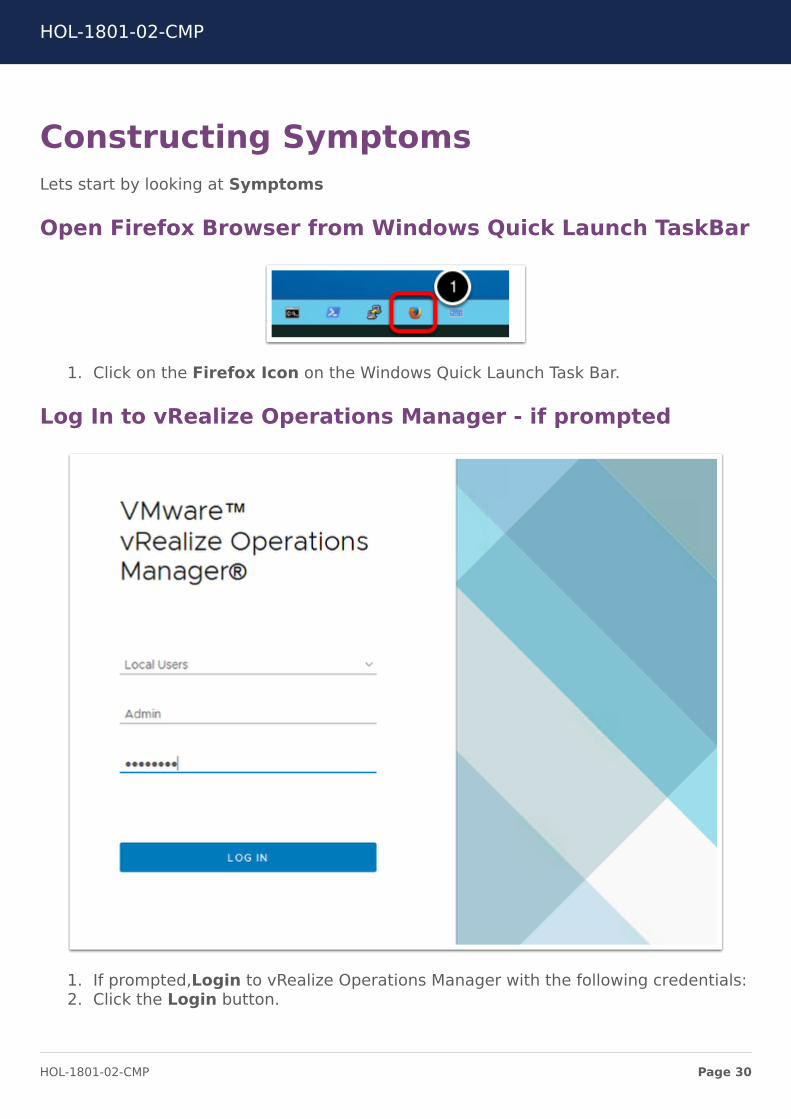
Constructing SymptomsLets start by looking at Symptoms
Open Firefox Browser from Windows Quick Launch TaskBar
1. Click on the Firefox Icon on the Windows Quick Launch Task Bar.
Log In to vRealize Operations Manager - if prompted
1. If prompted,Login to vRealize Operations Manager with the following credentials:2. Click the Login button.
HOL-1801-02-CMP
Page 30HOL-1801-02-CMP

User name: Admin
Password: VMware1!
Set Browser Zoom Level
The lab environment has a default resolution of 1024x768.To minimize the needforextensive scrolling within the vRealize Operations user interface, please adjust thezoomlevel in Firefox.
1. Open theFirefox Menu drop down.2. Set the desired zoom level.Typically 80-90% is sufficient to provide adequate
screen space for vRealize Operations in the lab environment.Also making useofthe full-screen option is recommended.
HOL-1801-02-CMP
Page 31HOL-1801-02-CMP

Navigate to Alert Menu
1. Click on the Alerts Menu Item .
HOL-1801-02-CMP
Page 32HOL-1801-02-CMP

Navigate to Alert Definitions
1. Expand the Alert Settings Menu.2. Click on Symptom Definitions
HOL-1801-02-CMP
Page 33HOL-1801-02-CMP

Find a CPU Ready definition
Most of the Symptom Definitions you will work with will be Metric/Property SymptomDefinitions which will be selected by default in the left hand pane.
1. Lets take a look at a definition related to CPU Ready. Type ready in the filter boxand hit return
2. Click on the returned symptom to highlight it (it will turn blue)3. Click on the pencil icon to edit it
HOL-1801-02-CMP
Page 34HOL-1801-02-CMP
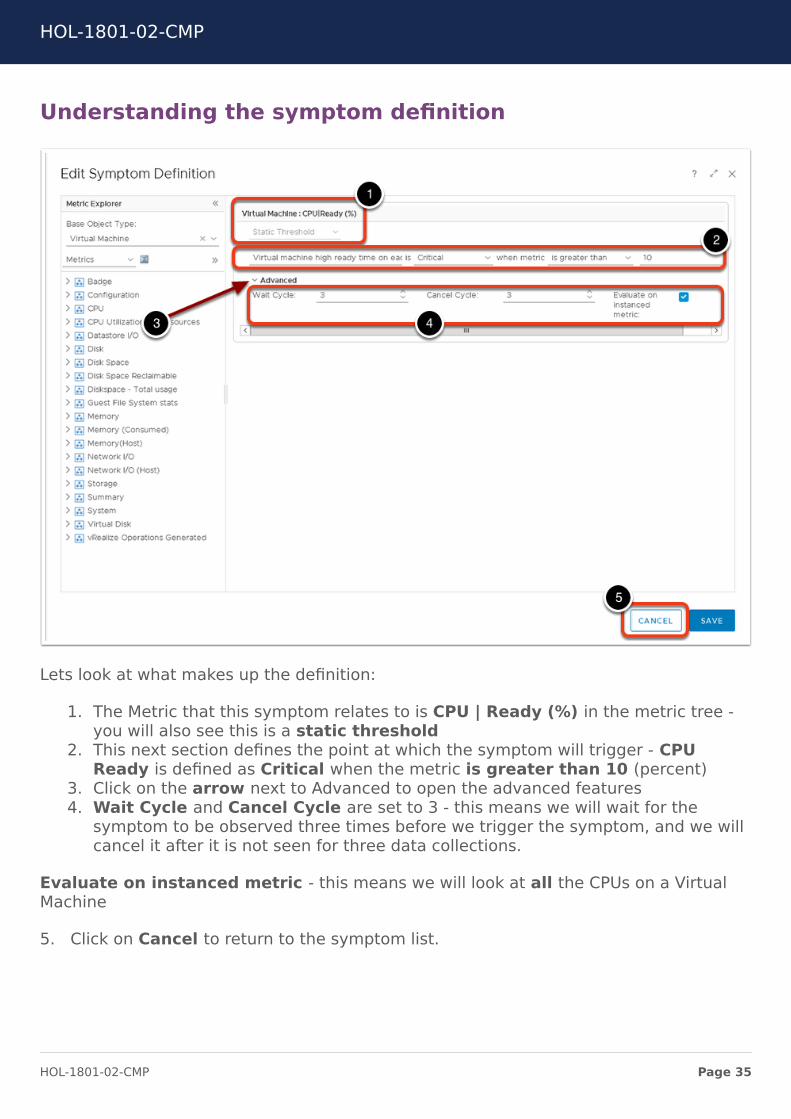
Understanding the symptom definition
Lets look at what makes up the definition:
1. The Metric that this symptom relates to is CPU | Ready (%) in the metric tree -you will also see this is a static threshold
2. This next section defines the point at which the symptom will trigger - CPUReady is defined as Critical when the metric is greater than 10 (percent)
3. Click on the arrow next to Advanced to open the advanced features4. Wait Cycle and Cancel Cycle are set to 3 - this means we will wait for the
symptom to be observed three times before we trigger the symptom, and we willcancel it after it is not seen for three data collections.
Evaluate on instanced metric - this means we will look at all the CPUs on a VirtualMachine
5. Click on Cancel to return to the symptom list.
HOL-1801-02-CMP
Page 35HOL-1801-02-CMP
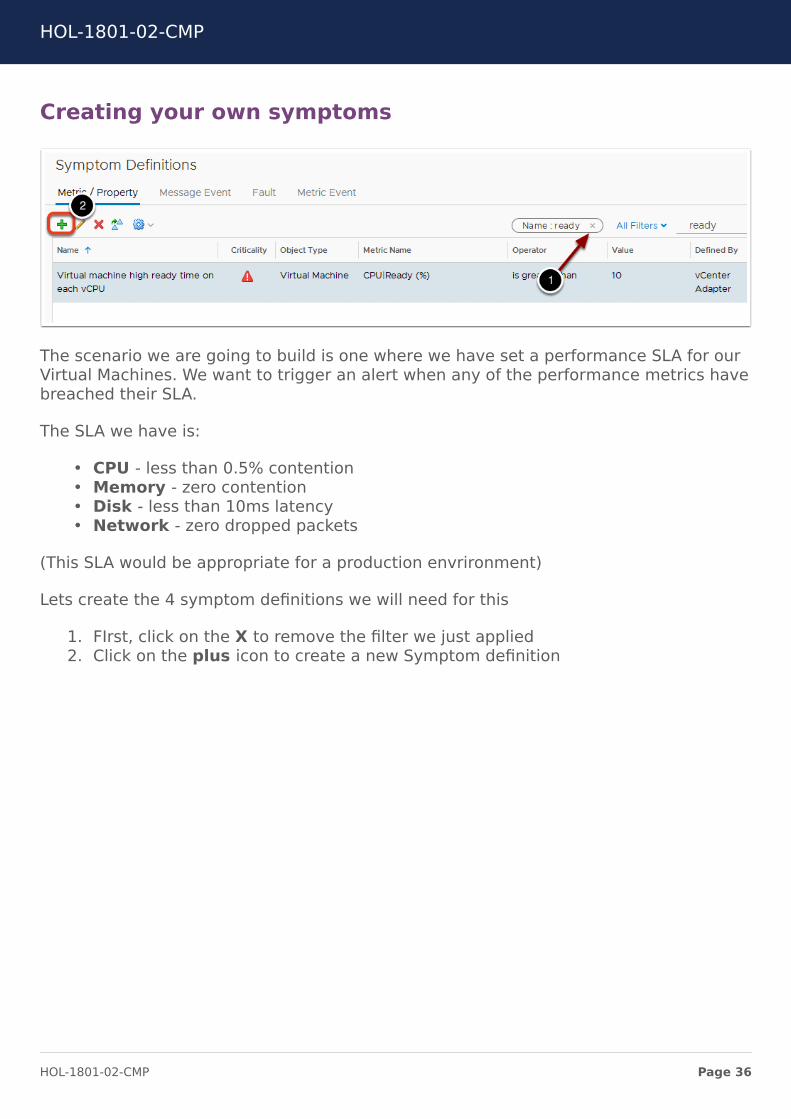
Creating your own symptoms
The scenario we are going to build is one where we have set a performance SLA for ourVirtual Machines. We want to trigger an alert when any of the performance metrics havebreached their SLA.
The SLA we have is:
• CPU - less than 0.5% contention• Memory - zero contention• Disk - less than 10ms latency• Network - zero dropped packets
(This SLA would be appropriate for a production envrironment)
Lets create the 4 symptom definitions we will need for this
1. FIrst, click on the X to remove the filter we just applied2. Click on the plus icon to create a new Symptom definition
HOL-1801-02-CMP
Page 36HOL-1801-02-CMP

Choose the object type
1. Type virtual machine in the Base Object Type field2. When the list of matches appears, select Virtual Machine
HOL-1801-02-CMP
Page 37HOL-1801-02-CMP
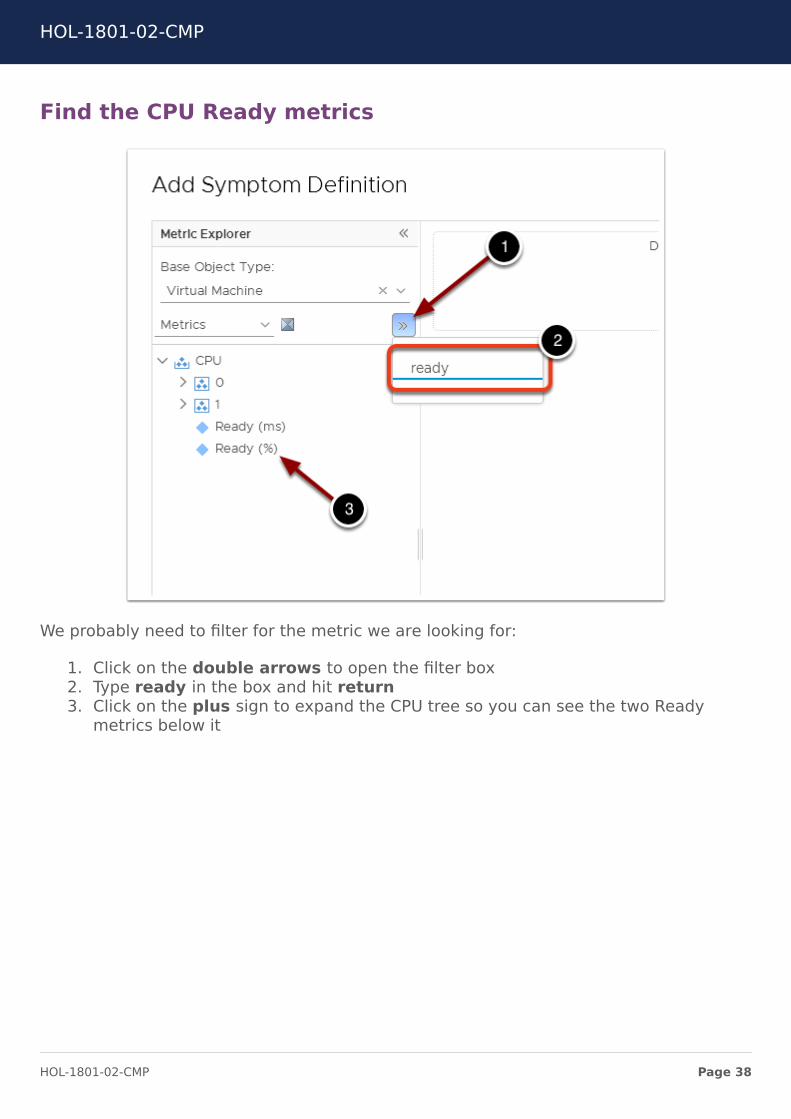
Find the CPU Ready metrics
We probably need to filter for the metric we are looking for:
1. Click on the double arrows to open the filter box2. Type ready in the box and hit return3. Click on the plus sign to expand the CPU tree so you can see the two Ready
metrics below it
HOL-1801-02-CMP
Page 38HOL-1801-02-CMP

Drag the metric
Click on the Ready (%) metric and, holding the mouse button down, drag the metricinto the symptoms panel, then release the mouse button
HOL-1801-02-CMP
Page 39HOL-1801-02-CMP

Configure the Ready (%) Symptom
1. Set the symptom to Static Threshold2. Set the name to - 'Hands on Lab - CPU SLA'3. Set the properties tois Critical when metric is greater than 0.54. You can optionally look at the Advanced settings but we won't change them -
Wait and Cancel cycles we will leave at 3 - the SLA is based on total Ready timeso we don't have to evaluate against each CPU instance
5. Click on Save to save the symptom
HOL-1801-02-CMP
Page 40HOL-1801-02-CMP
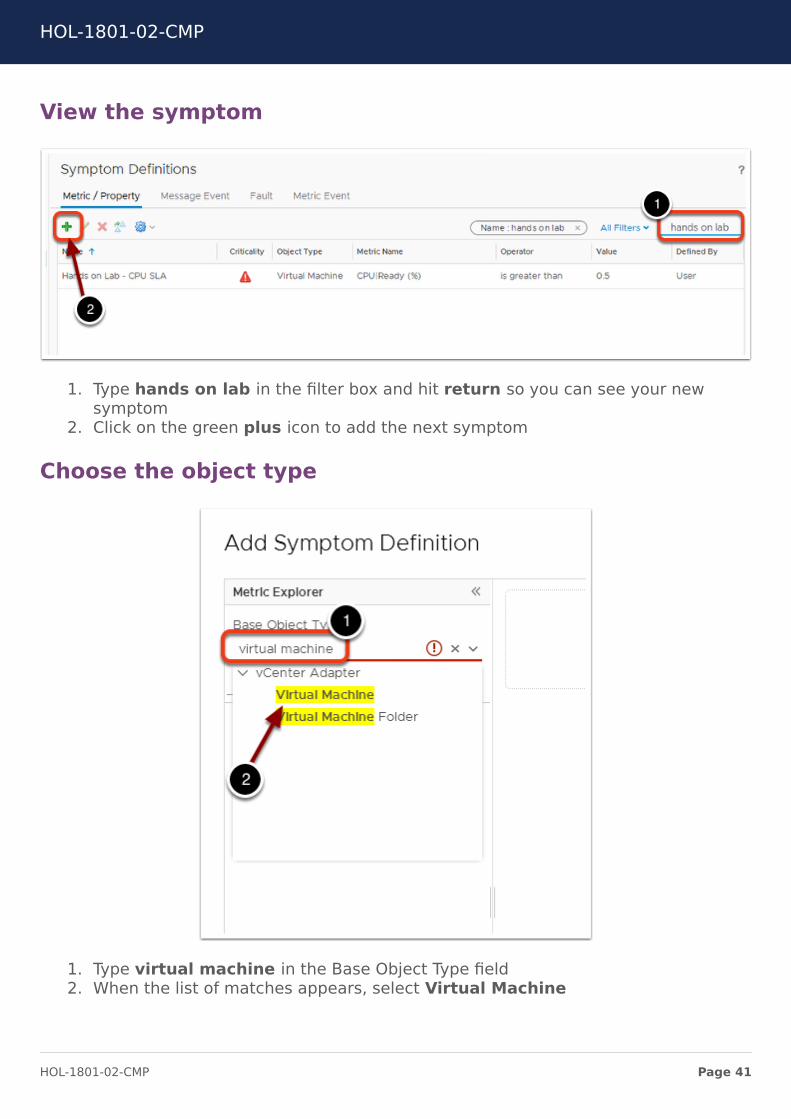
View the symptom
1. Type hands on lab in the filter box and hit return so you can see your newsymptom
2. Click on the green plus icon to add the next symptom
Choose the object type
1. Type virtual machine in the Base Object Type field2. When the list of matches appears, select Virtual Machine
HOL-1801-02-CMP
Page 41HOL-1801-02-CMP

Find the Memory Contention metric
We probably need to filter for the metric we are looking for:
1. Click on the double arrows to open the filter box2. Type contention in the box and hit return3. Click on the plus sign to expand the Memory tree so you can see the
Contention metric below it
Drag the metric
Click on the Contention metric and, holding the mouse button down, drag the metricinto the symptoms panel, and release the mouse button
HOL-1801-02-CMP
Page 42HOL-1801-02-CMP

Configure the Symptom
1. Set the symptom to Static Threshold2. Set the name to - 'Hands on Lab - Memory SLA'3. Set the properties tois Critical when metric is greater than 04. You can optionally look at the Advanced settings but we won't change them -
Wait and Cancel cycles we will leave at 35. Click on Save to save the symptom
HOL-1801-02-CMP
Page 43HOL-1801-02-CMP

Create the Disk Latency symptom
Now we'll create the Disk latency symptom
In the Symptom definitions list click on the green plus sign to add this third definition
This time...
1. Click on the double arrows to open the filter box2. Type latency in the box and hit return3. Expand the Virtual Disk then Aggregate of all instances trees so you can see
the three Latency metrics
HOL-1801-02-CMP
Page 44HOL-1801-02-CMP

Configure the Symptom
This time, drag the Total Latency metric into the Symptom Panel
1. Set the symptom to Static Threshold2. Set the name to - 'Hands on Lab - Disk SLA'3. Set the properties tois Critical when metric is greater than 104. You can optionally look at the Advanced settings but we won't change them -
Wait and Cancel cycles we will leave at 35. Click on Save to save the symptom
HOL-1801-02-CMP
Page 45HOL-1801-02-CMP

Create the Network Packets Dropped symptom
Finally, we'll create the Network Packets Dropped symptom
In the Symptom definitions list click on the green plus sign to add this fourth definition
This time...
1. Click on the double arrows to open the filter box2. Type dropped in the box and hit return3. Expand the Network I/O then Aggregate of all instances trees so you can see
the Packets Dropped (%) metric
HOL-1801-02-CMP
Page 46HOL-1801-02-CMP

Configure the Symptom
This time, drag the Packets Dropped (%) metric into the Symptom Panel
1. Set the symptom to Static Threshold2. Set the name to - 'Hands on Lab -Network SLA'3. Set the properties tois Critical when metric is greater than 04. You can optionally look at the Advanced settings but we won't change them -
Wait and Cancel cycles we will leave at 35. Click on Save to save the symptom
HOL-1801-02-CMP
Page 47HOL-1801-02-CMP

Review the Symptoms
You can now see all four symptoms
HOL-1801-02-CMP
Page 48HOL-1801-02-CMP
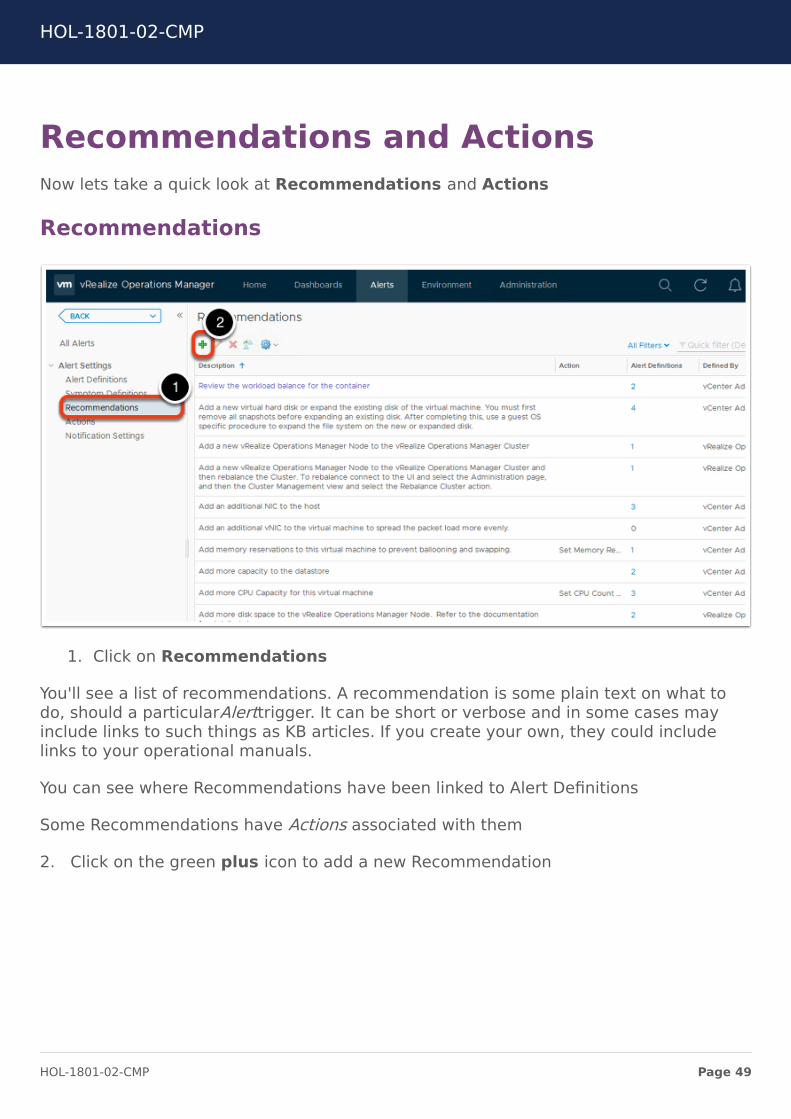
Recommendations and ActionsNow lets take a quick look at Recommendations and Actions
Recommendations
1. Click on Recommendations
You'll see a list of recommendations. A recommendation is some plain text on what todo, should a particularAlerttrigger. It can be short or verbose and in some cases mayinclude links to such things as KB articles. If you create your own, they could includelinks to your operational manuals.
You can see where Recommendations have been linked to Alert Definitions
Some Recommendations have Actions associated with them
2. Click on the green plus icon to add a new Recommendation
HOL-1801-02-CMP
Page 49HOL-1801-02-CMP
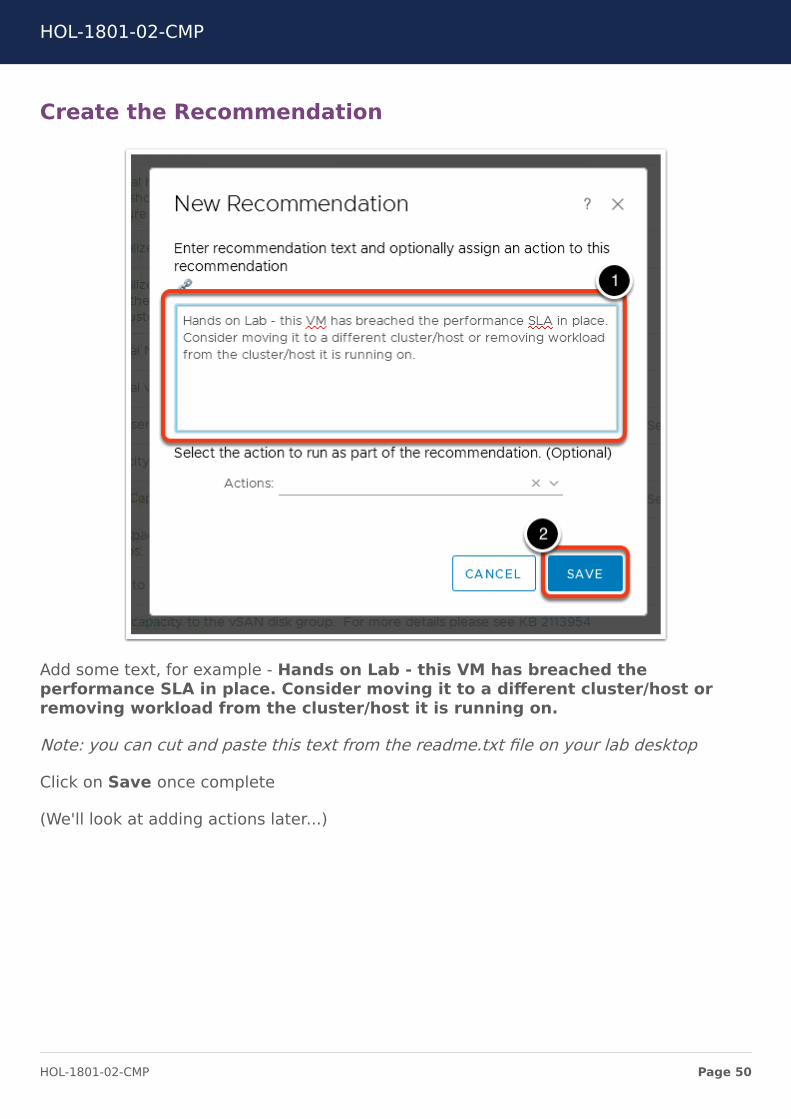
Create the Recommendation
Add some text, for example - Hands on Lab - this VM has breached theperformance SLA in place. Consider moving it to a different cluster/host orremoving workload from the cluster/host it is running on.
Note: you can cut and paste this text from the readme.txt file on your lab desktop
Click on Save once complete
(We'll look at adding actions later...)
HOL-1801-02-CMP
Page 50HOL-1801-02-CMP
Actions
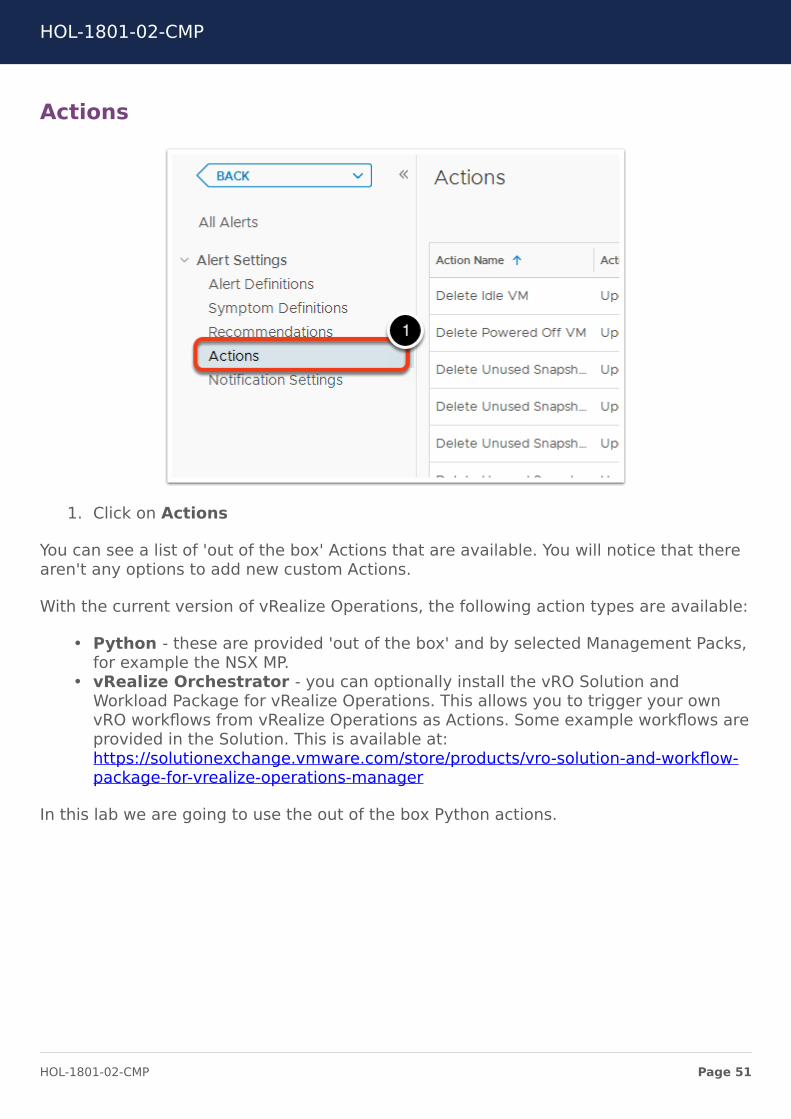
1. Click on Actions
You can see a list of 'out of the box' Actions that are available. You will notice that therearen't any options to add new custom Actions.
With the current version of vRealize Operations, the following action types are available:
• Python - these are provided 'out of the box' and by selected Management Packs,for example the NSX MP.
• vRealize Orchestrator - you can optionally install the vRO Solution andWorkload Package for vRealize Operations. This allows you to trigger your ownvRO workflows from vRealize Operations as Actions. Some example workflows areprovided in the Solution. This is available at:https://solutionexchange.vmware.com/store/products/vro-solution-and-workflow-package-for-vrealize-operations-manager
In this lab we are going to use the out of the box Python actions.
HOL-1801-02-CMP
Page 51HOL-1801-02-CMP

Building AlertsNow lets build an Alert Definition from the four Symptoms and the Recommendationwe just built.
Alert Definitions
1. Click on Alert Definitions2. Click on the green plus icon to start creating the new Alert Definition
HOL-1801-02-CMP
Page 52HOL-1801-02-CMP
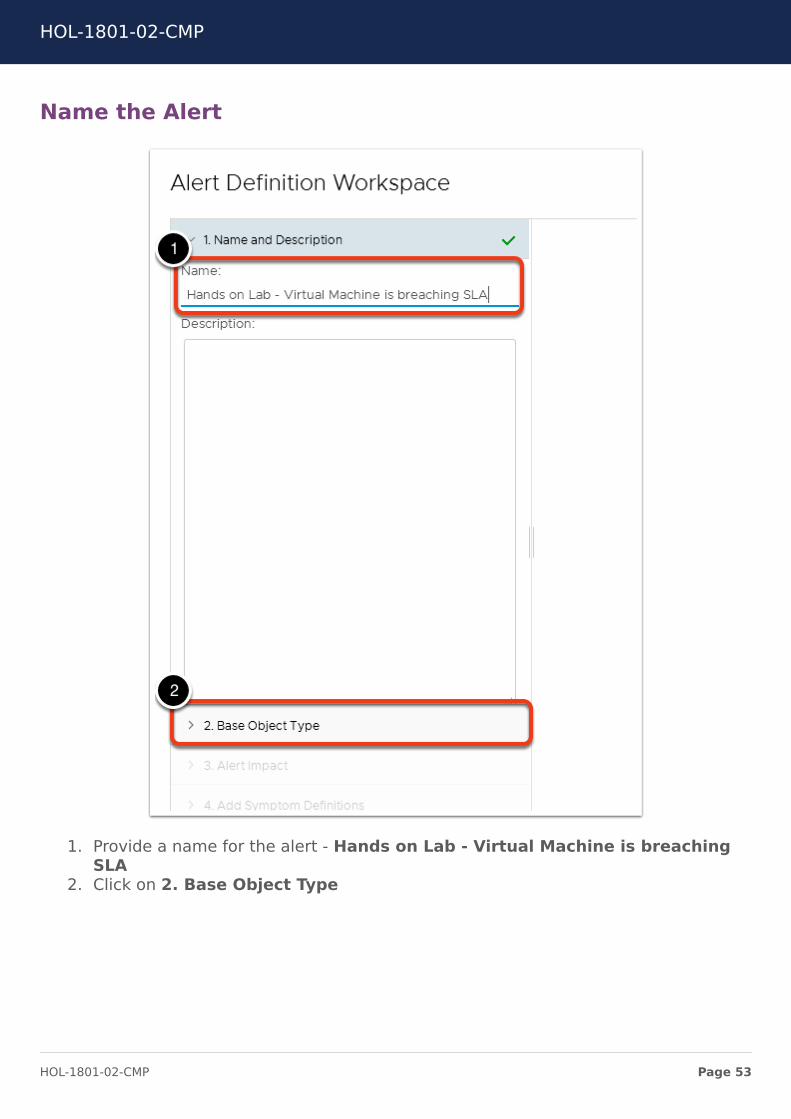
Name the Alert
1. Provide a name for the alert - Hands on Lab - Virtual Machine is breachingSLA
2. Click on 2. Base Object Type
HOL-1801-02-CMP
Page 53HOL-1801-02-CMP

Base Object
1. Type virtual in the Base Object Type selection box2. When the matches appear, select Virtual Machine3. Click on 3. Alert Impact
HOL-1801-02-CMP
Page 54HOL-1801-02-CMP

Alert Impact
The Alert Impact should be set as follows:
1. Impact- The default of Health is appropriate. This means when the Alert istriggered, it will affect the Health badge
2. Criticality- The default of Symptom Based is appropriate. This means it willinherit the criticality of the Symptom(s) triggering the alert
3. Alert Type/Subtype- this should be changed to Virtualization/Hypervisor :Performance - this setting affects how alerts are represented in various parts of
HOL-1801-02-CMP
Page 55HOL-1801-02-CMP

the UI. Use the drop down to select Virtualization/Hypervisor :Performance
4. Wait Cycle- The default of 1 is appropriate - remember we set the Wait andCancel Cycles to 3 in the Symptom definitions? This means the Symptoms willtrigger after being observed 3 times. The additional Alert wait cycle that we setset here defines how long to wait after the Symptom(s) have triggered. A settingof 1 will trigger the alert as soon as the Symptom(s) are triggered
5. Cancel CycleThe default of 1 is appoppriate6. Click on 4. Add Symptom Definitions
Add Symptoms
We will need to filter to find the Symptoms that we created earlier - type hands on labin the filter box and hit return
HOL-1801-02-CMP
Page 56HOL-1801-02-CMP

Drag the CPU SLA Symptom
Click on the Hands on Lab - CPU SLA symptom and, holding the mouse button down,drag it to the Alert Definition panel. Release the mouse button
HOL-1801-02-CMP
Page 57HOL-1801-02-CMP

Add the Disk SLA to the Symptom Set
Drag the Hands on Lab - Disk SLA symptom to the same symptom set. As youhover over the symptom set, it will get a green outline as in the screenshot. Releasethe mouse button when you get this green outline.
Don't drag the symptom into the 'Drag another symptom here to add more symptoms'box below (we'll do this later when we show how the symptom sets work)
HOL-1801-02-CMP
Page 58HOL-1801-02-CMP

Add the Memory SLA to the Symptom Set
Drag the Hands on Lab - Memory SLA symptom to the same symptom set. As youhover over the symptom set, it will get a green outline as in the screenshot. Release themouse button when you get this green outline.
Don't drag the symptom into the 'Drag another symptom here to add more symptoms'box
HOL-1801-02-CMP
Page 59HOL-1801-02-CMP

Change the boolean term
Before we drag the final symptom let's change the boolean term.
Click on the 'Base object exhibits' drop down to change it from the default ofAllto thevalue Any. This means that if any of our individual SLA symptoms are triggered thenthe alert will trigger. We don't want to wait for them to all trigger at the same time -that is very unlikely to happen!
We could just add our final Symptom into this symptom set - however, lets create a 2ndsymptom set to see how they work.
HOL-1801-02-CMP
Page 60HOL-1801-02-CMP
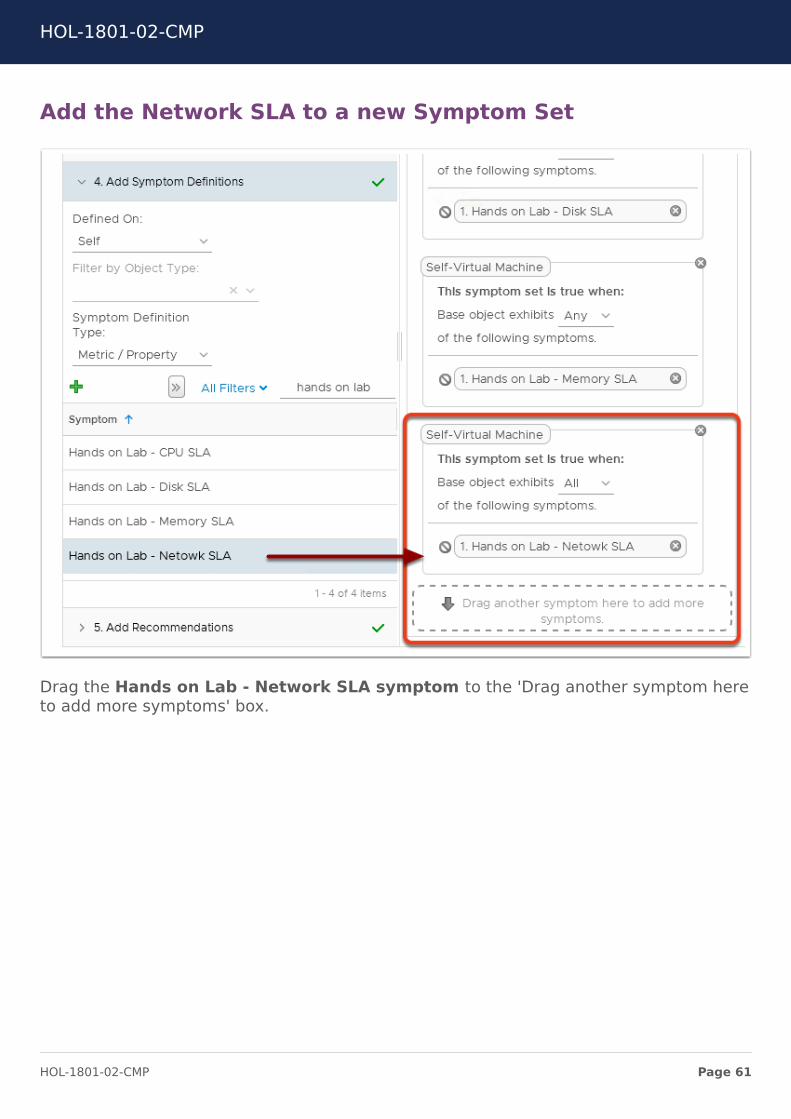
Add the Network SLA to a new Symptom Set
Drag the Hands on Lab - Network SLA symptom to the 'Drag another symptom hereto add more symptoms' box.
HOL-1801-02-CMP
Page 61HOL-1801-02-CMP
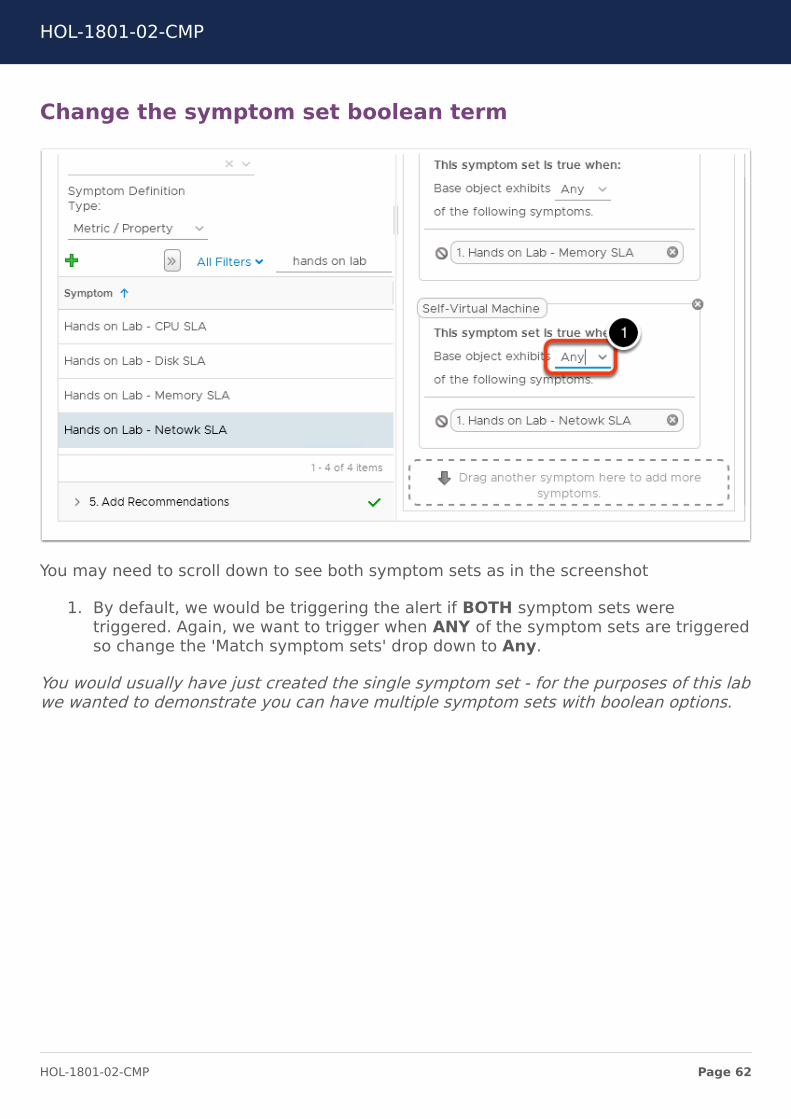
Change the symptom set boolean term
You may need to scroll down to see both symptom sets as in the screenshot
1. By default, we would be triggering the alert if BOTH symptom sets weretriggered. Again, we want to trigger when ANY of the symptom sets are triggeredso change the 'Match symptom sets' drop down to Any.
You would usually have just created the single symptom set - for the purposes of this labwe wanted to demonstrate you can have multiple symptom sets with boolean options.
HOL-1801-02-CMP
Page 62HOL-1801-02-CMP

Recommendation
1. Click on 5. Add Recommendations2. Again, we need to filter, so type hands on lab in the filter box and hit return
HOL-1801-02-CMP
Page 63HOL-1801-02-CMP

Drag the recommendation
1. Drag the recommendation into the 'Drag a recommendation...' box and releasethe mouse button
2. Click on Save to save the Alert Definition
Review the Alert
1. Type the text hands on lab into the filter box and hit return to find your AlertDefinition
2. Use the window divide control and the scroll bar to review the alert that you havejust built.
Has the alert triggered?
Hands on Labs are not designed for proper production workloads! We massivelyovercommit our resources and use vSphere technology to provide the best possible
HOL-1801-02-CMP
Page 64HOL-1801-02-CMP

experience - can you imagine the number of servers we would need if we wanted to run1000 instances of this lab concurrently with absolutely zero memory, CPU or diskcontention!!
To that end, its likely one of our symptoms will have triggered the alert we just created.Given the crazy over-commit we use in the lab we should see some CPU ready time.
1. Click on the Alerts icon2. Filter the alerts by typing "hands" on the filter box;3. Check the listed alerts and you should see the alert definition we just created,
"Hands on Lab - Virtual Machine is breaching SLA" and expand it to checkwhich VMs has triggered it;
4. Click on the alert link to see the recommendation we created for the alert.
HOL-1801-02-CMP
Page 65HOL-1801-02-CMP

Automated RemediationFinally, we thought we'd show an example of automated remediation. We are fairlylimited in Hands on Labs on the workloads we can have running so we've constructed aslightly different scenario. Hopefully you will find it fun.
In this scenario we are going to monitor our application cluster and turn off anymachines that contains "win" in its name! We only want to keep running VMs thatactually have a purpose, like DB, APP, WEB or any other useful application for our lab.Any machine that references an OS on its name it is probably a template or a basereference machine and we do not want them running on our cluster.
Browse to vSphere Hosts and Clusters
1. Click on the Environment menu item
HOL-1801-02-CMP
Page 66HOL-1801-02-CMP

2. Click on vSphere Hosts and Clusters
Find the base/template VM
1. Navigate through the vSphere World inventory until you find theRegionA01-COMP01 cluster object;
2. Expand all the three hosts in the cluster and notice that we have a lot of VMs thatare actually useful for our infrastructure except one;
3. Look for a VM called win-10. This VM is a base VM that we use to deploy windowsmachines and has no need to be powered on consuming valuable computeresources. We are going to create a sympton definition that will automaticallyshutdown this VM.
Adding Symptom Definitions to shutdown VMs
We are going to need to add three informational Symptom Definitions that are goingto define the conditions under which this alert will be trigerred:
a. The cluster is called RegionA01-COMP01;
b. The VM in the cluster contains the prefix win in its name;
HOL-1801-02-CMP
Page 67HOL-1801-02-CMP

c. The VM is powered on.
So, if we see a VM in the "RegionA01-COMP01" cluster that has the prefix "win" in itsname and its "powered on", we're going to power it off!
Definition for filtering the cluster resource
1. Click on the Alerts tab to add the first definition;2. Click on Symptom Definitions (you may have to expand the Alert Settings
menu);3. Click on the green plus sign to create a new definition.
HOL-1801-02-CMP
Page 68HOL-1801-02-CMP

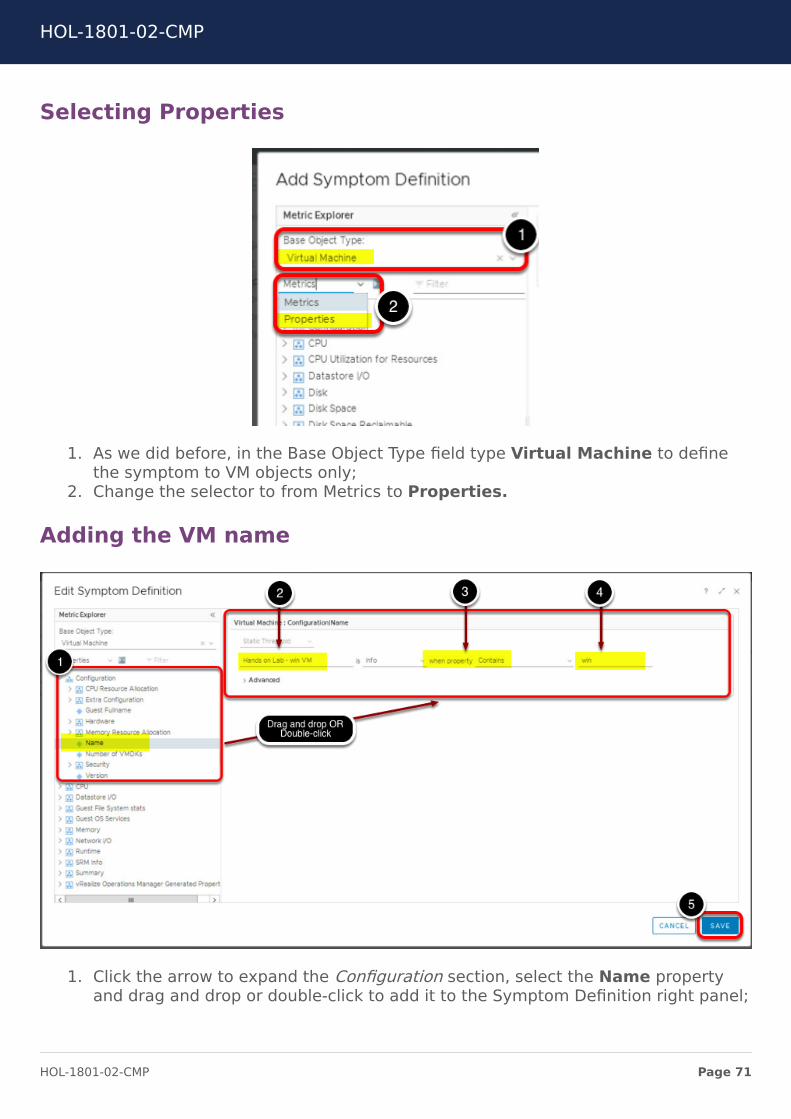
Selecting Properties
1. In the Base Object Type field type Virtual Machine to define the symptom to VMobjects only;
2. Change the selector to from Metrics to Properties.
Adding the Parent Cluster
HOL-1801-02-CMP
Page 69HOL-1801-02-CMP

1. Click the arrow to expand the Summary section, select Parent Cluster propertyand Drag and drop or Double-click to add it to the Symptom Definition rightpanel;
2. In the Symptom Definition Name field type Hands on Lab - COMP01;3. Change the condition to Equals;4. Select the RegionA01-COMP01 cluster from the value list;5. Click the SAVE button.
Definition for filtering the VM by name
1. Click on the Alerts tab to add tge second definition;2. Click on Symptom Definitions (you may have to expand the Alert Settings
menu);3. Click on the green plus sign to create a new definition.
HOL-1801-02-CMP
Page 70HOL-1801-02-CMP
Selecting Properties
1. As we did before, in the Base Object Type field type Virtual Machine to definethe symptom to VM objects only;
2. Change the selector to from Metrics to Properties.
Adding the VM name
1. Click the arrow to expand the Configuration section, select the Name propertyand drag and drop or double-click to add it to the Symptom Definition right panel;
HOL-1801-02-CMP
Page 71HOL-1801-02-CMP

2. In the Symptom Definition Name field type Hands on Lab - win VM;3. Change the condition to Contains;4. Type win in the value list;5. Click the SAVE button.
Definition for filtering the VM by power state
1. Click on the Alerts tab to add tge third definition;2. Click on Symptom Definitions (you may have to expand the Alert Settings
menu);3. Click on the green plus sign to create a new definition.
HOL-1801-02-CMP
Page 72HOL-1801-02-CMP

Adding the VM name
1. In the Base Object Type field type Virtual Machine to define the symptom to VMobjects only;
2. In the filter field type power to filter the metrics related to power state;3. Click the arrow to expand the System section and select the Powered ON metric
and drag and drop or double-click to add it to the Symptom Definition right panel;4. In the Symptom Definition Name field type Hands on Lab - Power State;5. Change the condition to is;6. Type number 1 in the value field;7. Click on Advanced to expand it;8. Change the Wait and Cancel Cycle to 1;9. Click the SAVE button.
HOL-1801-02-CMP
Page 73HOL-1801-02-CMP

Create the Recommendation
1. Click on the Alerts Menu Item2. Expand the Alert Settings Menu3. Click on Recommendations4. Click on the green plus icon
HOL-1801-02-CMP
Page 74HOL-1801-02-CMP
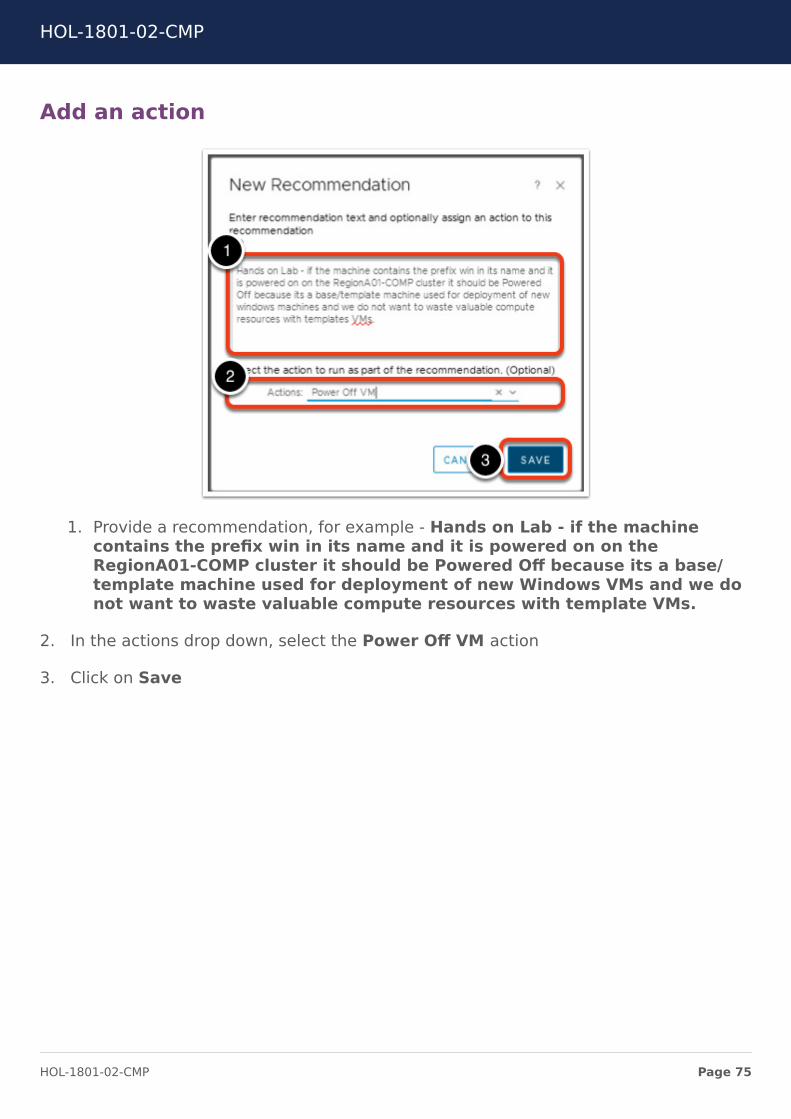
Add an action
1. Provide a recommendation, for example - Hands on Lab - if the machinecontains the prefix win in its name and it is powered on on theRegionA01-COMP cluster it should be Powered Off because its a base/template machine used for deployment of new Windows VMs and we donot want to waste valuable compute resources with template VMs.
2. In the actions drop down, select the Power Off VM action
3. Click on Save
HOL-1801-02-CMP
Page 75HOL-1801-02-CMP

Create the Alert Definition
We have our three Symptoms and the Recommendation, let's now create the AlertDefinition
1. Click on the Alerts Menu Item2. Expand the Alert Settings Menu3. Click on Alert Definitions4. Click on the green plus icon
HOL-1801-02-CMP
Page 76HOL-1801-02-CMP

Name the alert
1. Provide a name - Hands on Lab - Power off rogue VM2. Select 2. Base Object Type
HOL-1801-02-CMP
Page 77HOL-1801-02-CMP

Select Object Type
1. Select the Virtual Machine object type2. Click on 3. Alert Impact
HOL-1801-02-CMP
Page 78HOL-1801-02-CMP

Alert Impact
For Alert Impact you can leave everything as default except:
1. Criticality - this time we are using informational symptoms but together theycreate a critical alert - so we will set the criticality to Critical instead of SymptomBased
2. Change Alert Type and Subtype to Virtualization/Hypervisor : Availability3. Click on 4. Add Symptom Definitions
HOL-1801-02-CMP
Page 79HOL-1801-02-CMP

Filter for Hands on Lab
1. In the filter field type hands and hit ENTER.
Drag the first symptom
HOL-1801-02-CMP
Page 80HOL-1801-02-CMP

Drag Hands on Lab - COMP01 to the Symptom Definition box
Drag the 2nd symptom
Drag the Hands on Lab - win VM symptom into the same symptom set box. Releasethe mouse button when the box turns green
As before, do not drag it into the 'Drag another symptom...' box as we don't want tocreare a 2nd symptom set
HOL-1801-02-CMP
Page 81HOL-1801-02-CMP
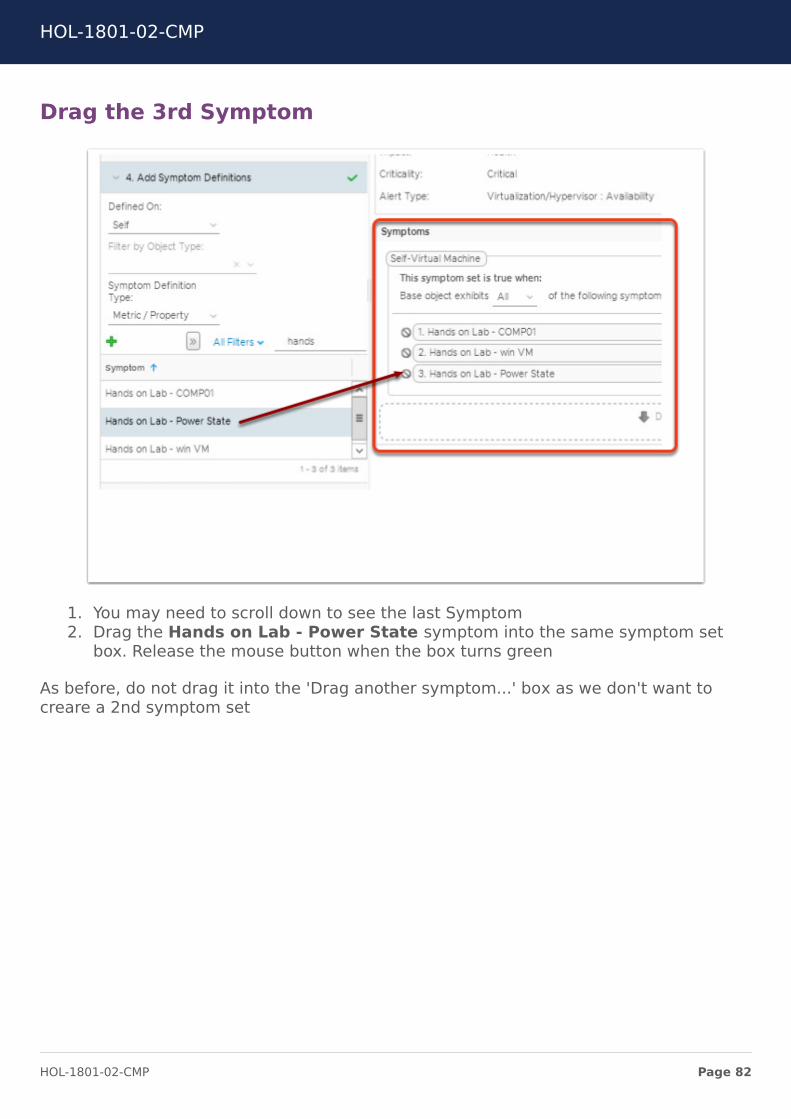
Drag the 3rd Symptom
1. You may need to scroll down to see the last Symptom2. Drag the Hands on Lab - Power State symptom into the same symptom set
box. Release the mouse button when the box turns green
As before, do not drag it into the 'Drag another symptom...' box as we don't want tocreare a 2nd symptom set
HOL-1801-02-CMP
Page 82HOL-1801-02-CMP

Add the recommendation
1. In the filter box type hands and hit ENTER;2. Drag the '...if the machine contains the prefix...' recommendation you just
created into the 'Drag a recommendation...' box
Save
Your alert should look like this
1. Click on Save to save the alert
HOL-1801-02-CMP
Page 83HOL-1801-02-CMP
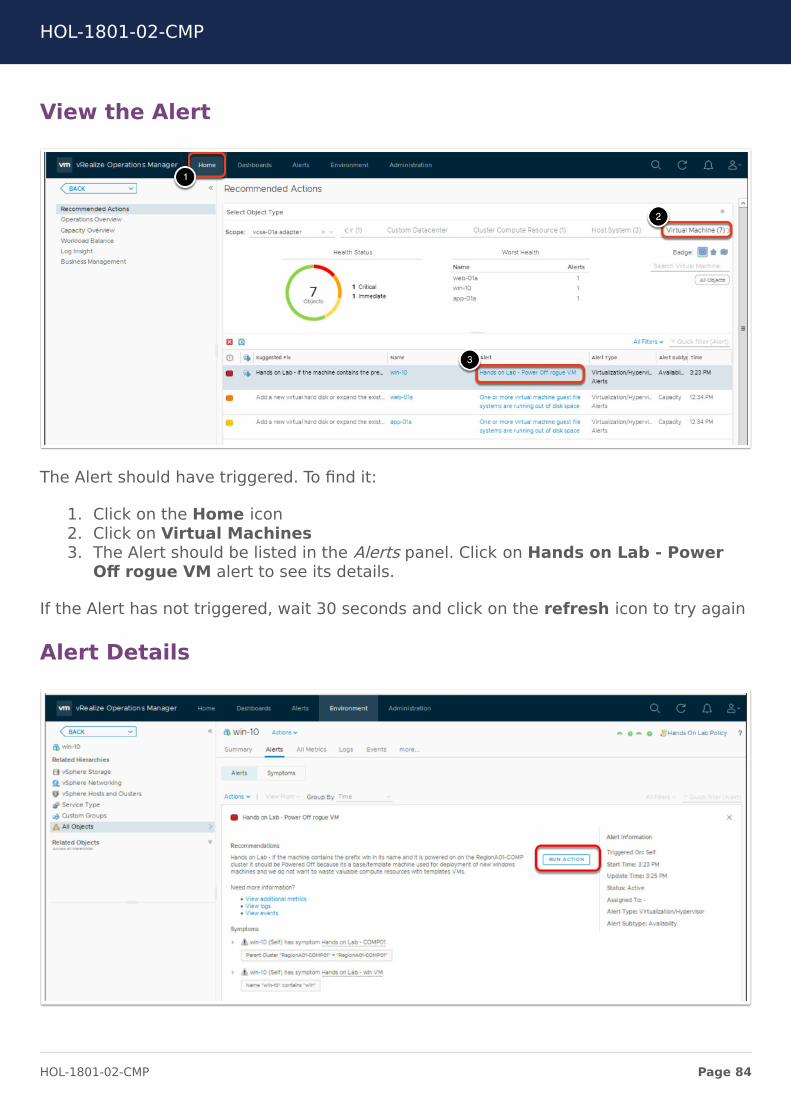
View the Alert
The Alert should have triggered. To find it:
1. Click on the Home icon2. Click on Virtual Machines3. The Alert should be listed in the Alerts panel. Click on Hands on Lab - Power
Off rogue VM alert to see its details.
If the Alert has not triggered, wait 30 seconds and click on the refresh icon to try again
Alert Details
HOL-1801-02-CMP
Page 84HOL-1801-02-CMP

We can see the alert detail including a button to Run Action that should run the PowerOff the VM action. Don't press this yet!!
Let's automate the action...to do this we need to change the policy for this alert.
Edit the HOL policy
1. Click on the Administration menu;2. Click on the Policies tab in the left menu;3. Click on Policy Library;4. Click on Hands On Lab Policy;5. Click on the pencil icon to edit the policy.
HOL-1801-02-CMP
Page 85HOL-1801-02-CMP
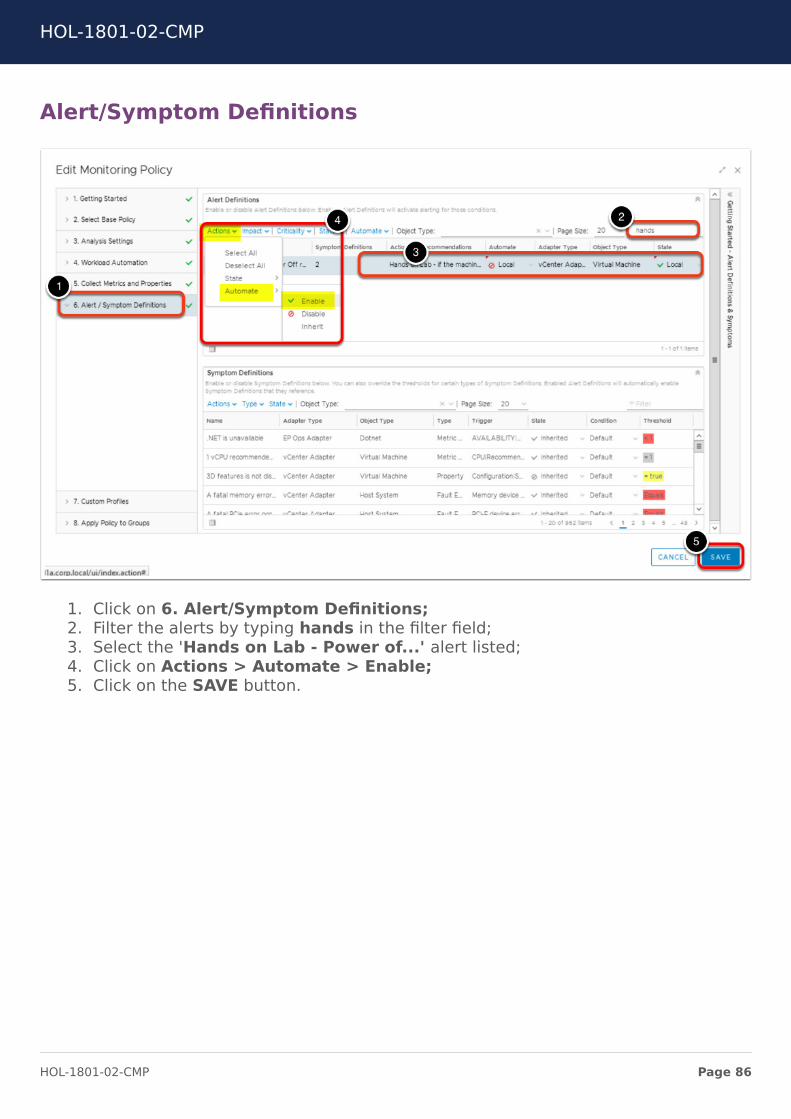
Alert/Symptom Definitions
1. Click on 6. Alert/Symptom Definitions;2. Filter the alerts by typing hands in the filter field;3. Select the 'Hands on Lab - Power of...' alert listed;4. Click on Actions > Automate > Enable;5. Click on the SAVE button.
HOL-1801-02-CMP
Page 86HOL-1801-02-CMP
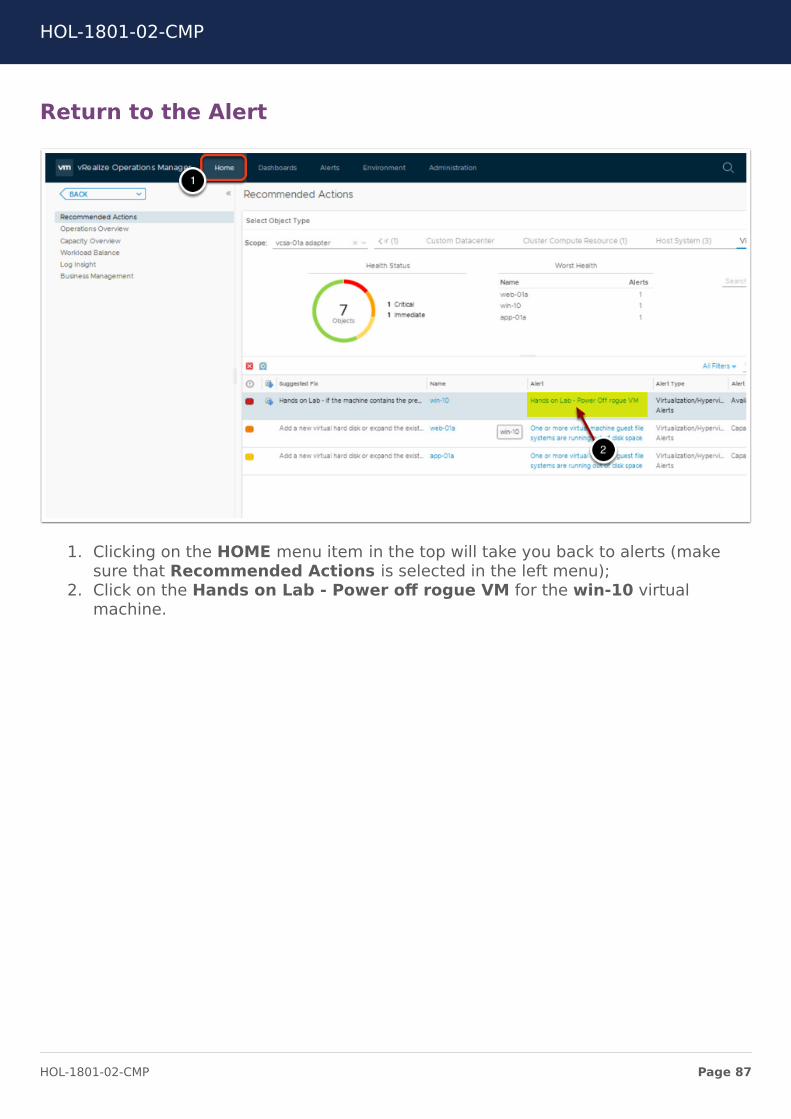
Return to the Alert
1. Clicking on the HOME menu item in the top will take you back to alerts (makesure that Recommended Actions is selected in the left menu);
2. Click on the Hands on Lab - Power off rogue VM for the win-10 virtualmachine.
HOL-1801-02-CMP
Page 87HOL-1801-02-CMP

Cancel the alert
Although we have now automated the Alert, it won't turn the VM off as this particularAlert is already triggered. Automation happens at the time the Alert is triggered. So, weneed to cancel the alert and wait for it to trigger again.
1. Click on Action menu and then Cancel Alert menu option.2. Confirm the Cancel Alert for the selected alert on the confirmation prompt (not
shown).
Now that we have canceled the Alert it should trigger again and automatically shutdown the VM since all the conditions are still true.
HOL-1801-02-CMP
Page 88HOL-1801-02-CMP

Review Recent Tasks
1. Click on the Administration menu item2. Expand the History Menu and click on Recent Tasks3. You will see that the Power Off VM action was logged as automated
If you did power on the machine again you will see that action in progress - if you wait abit longer it will turn off again! No way that VM is staying powered on unless yourename it!
HOL-1801-02-CMP
Page 89HOL-1801-02-CMP
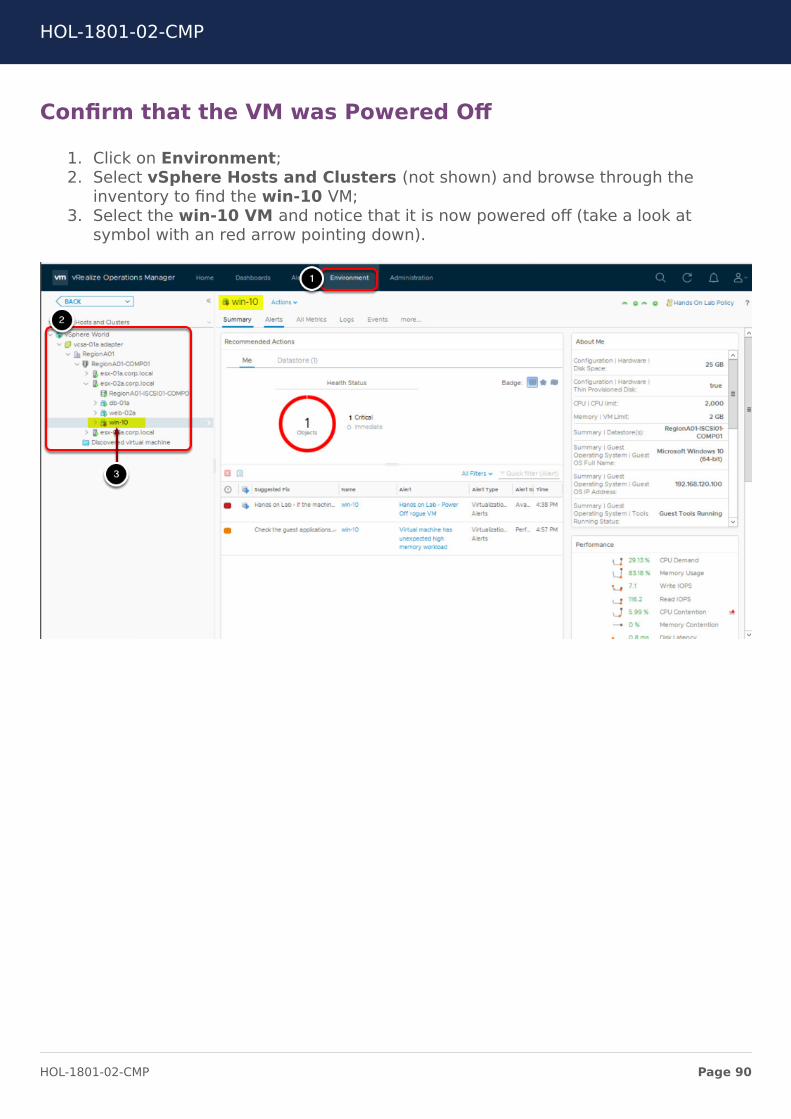
Confirm that the VM was Powered Off
1. Click on Environment;2. Select vSphere Hosts and Clusters (not shown) and browse through the
inventory to find the win-10 VM;3. Select the win-10 VM and notice that it is now powered off (take a look at
symbol with an red arrow pointing down).
HOL-1801-02-CMP
Page 90HOL-1801-02-CMP
ConclusionIn this module you learned:
• The architecture of vRealize Operations Alerting Framework• How to construct Symptoms• How to create Recommendations and Actions• How to build Alerts• How to do a automated remediation of issues
Congratulation on completing "Module 2 - Automatedremediation of issues"
Congratulations on completing Module 1.
If you are looking for additional information on monitoring objects in your managedenvironment for "Automated remediation of issues", try one of these:
• Click on this link• Or go to https://tinyurl.com/yb9xtw59• Or use your smart device to scan the QRC Code.
Proceed to any module below which interests you most.
• Module 1 - Automated workload placement and predictive DRS (60 minutes)(Basic)
HOL-1801-02-CMP
Page 91HOL-1801-02-CMP

How to End Lab
To end your lab click on the END button.
HOL-1801-02-CMP
Page 92HOL-1801-02-CMP

ConclusionThank you for participating in the VMware Hands-on Labs. Be sure to visithttp://hol.vmware.com/ to continue your lab experience online.
Lab SKU: HOL-1801-02-CMP
Version: 20180206-160051
HOL-1801-02-CMP
Page 93HOL-1801-02-CMP