Table Of Contents...2 Table Of Contents TABLE OF CONTENTS .....2


1
TABLE OF CONTENTS
ACKNOWLEDGMENTS 3
STATUS OF THIS REPORT 3
GLOSSARY OF ACRONYMS AND KEY TERMS 4
EXECUTIVE SUMMARY 8
Background to the study 15
Aims of the study 15
This report 15
SECTION ONE: REVIEW OF THE LITERATURE 17
Teacher recruitment 18
Teacher retention 19
SECTION TWO: METHODOLOGY 24
2.1 Research questions 24
2.2 The research process 26
2.3 Profile of the sample 30
SECTION THREE: TEACHER RECRUITMENT AND RETENTION 33
3.1 Teacher recruitment 33
3.2 Teacher retention 56
SECTION FOUR: SENIOR SCHOOL LEADER RECRUITMENT 69
SECTION FIVE: SUPPORT STAFF RECRUITMENT AND RETENTION 74
5.1 Support staff recruitment 74
5.2 Support Staff Retention 77
2
SECTION SIX: DISCUSSION AND SUGGESTED ACTIONS 81
6.1 Sharing practice 82
6.2 Gathering data on the issues 83
6.3 Encouraging staff development 84
6.4 Valuing all schools 84
6.5 Working together to support schools and teachers: a final
reflection and some specific learning to be considered 85
BIBLIOGRAPHY 88
APPENDICES 94
Appendix A- Detail Profile of Responses 94 Appendix B- Case Studies 96 Appendix C- Interview Schedules 122 Appendix D- Questionnaires 132

3
ACKNOWLEDGMENTS
Thanks are first of all due to the partnership led by Yorkshire Futures and Yorkshire Forward, who funded and supported this work, alongside partners including Government Office Yorkshire and Humber and the Training and Development Agency for Schools. We would like to thank in particular the teachers, headteachers, senior school leaders, Local Authority personnel, and initial teacher trainees in Yorkshire and Humber who have shared with us their experiences and their views.
STATUS OF THIS REPORT
This report has been produced by an independent research team from the Centre for Education and Inclusion Research (see contact details below) at Sheffield Hallam University for the partnership. The views expressed therein are those of the authors, and do not necessarily reflect those of Yorkshire Futures, Yorkshire Forward, Government Office Yorkshire and Humber or the Training and Development Agency for Schools. Centre for Education and Inclusion Research Sheffield Hallam University Unit 7 Science Park Howard Street Sheffield S1 1WB [email protected]
www.shu.ac.uk/ceir

4
GLOSSARY OF ACRONYMS AND KEY TERMS AH Assistant Headteacher – senior school leader, below Deputy
Headteacher in management hierarchy. Several may be employed in larger schools
AST Advanced Skills Teacher - teacher who, having passed a
national assessment, is responsible for sharing good practice teaching 80% of their time in their own classroom/school and 20% in other schools
BME Black and Minority Ethnic - the percentage of pupils in Black or
Minority Ethnic groups in a school is one of the most commonly used measures of ethnic makeup in school populations
B Ed Bachelor of Education – undergraduate route into teaching, most
common for primary schools BSc Bachelor of Sciences - An undergraduate academic degree in
sciences CPD Continuing Professional Development - training and
development support for more experienced teachers CVA Contextual Value Added - a normalised score for average
improvement from KS1-2, primary, (CVAMEA) or KS2-4 (secondary)
DCSF Department for Children, Schools and Families – central
government department responsible for schools DH Deputy Headteacher – senior school leader, below Headteacher
in management hierarchy. Up to 3 may be employed in larger schools, often none in primary schools
D&T Design and Technology - Subject area in the English national
curriculum offered from primary onward. It is split into different areas including: textiles, food, graphic products, resistant materials, product design, electronic products, and systems and controls
FSM Free School Meals - eligibility for free school meals is dependent
on family income, so the percentage of pupils eligible to receive free school meals in a school is a crude measure of poverty or deprivation facing the pupils attending a school. Despite its crudity, it is the only widely available measure of parental income available that is easily matched to school and pupil outcomes, so it is very often used as a proxy for poverty/deprivation in quantitative school research studies

5
GCSE General Certificate of Secondary Education - set of British qualifications, taken by secondary school students at age of 14-16 in England, Wales, and Northern Ireland
GTP Graduate Teacher Programme - route into teaching that involves
the trainee being placed predominantly in a school setting. This is the most common 'employment-based route' into teaching
HEFCE Higher Education Funding Council for England- Government
agency with a key role in ensuring accountability and promoting good practice in Higher Education. It distributes public money for teaching and research to university and colleges in England.
HEI Higher Education Institution HLTA Higher Level Teaching Assistant - senior support staff status,
based on the HLTA qualification. Like other Teaching Assistants (TAs). They work in the school alongside the teacher, providing support for teaching and learning activities, and may manage other TAs
HT Headteacher ICT Information and Communication Technology ITT Initial Teacher Training – routes into teaching that lead to
Qualified Teacher Status KS1 Key Stage 1 - the two years of schooling in maintained schools
in England and Wales normally known as Year 1 and 2 when pupils are aged between 5 and 7
KS2 Key Stage 2 - the four years of schooling in maintained schools
in England and Wales normally known as Year 3, 4, 5, and 6 when students are aged between 7 and 11
LA Local Authority Level 2 Attaining 5 or more GCSEs at A*-C or equivalent is now known Threshold as the “Level 2 threshold” in published school performance
tables NCSL National College for School Leadership - government agency
that offers a range of leadership development activities, publications and resources for leaders at different stages in their careers in different settings
NQT Newly Qualified Teacher – teacher in the first year after their ITT OFSTED Office for Standards in Education - government agency
responsible for the management of the system of school

6
inspection defined originally by the Education (Schools) Act 1992
PGCE Post Graduate Certificate in Education – a one or two year route
into teaching for those with a previous undergraduate degree, the most common route into secondary teaching.
PPA Planning, Preparation, and Assessment - contractual entitlement
to set aside 10% of a teachers' timetable (2 hours per week either in 2 x 1 hour blocks or in a single 2 hour block) for teachers to plan, prepare and assess students' work during the normal school day
P/t Part Time QTS Qualified Teacher Status. Aaccreditation for teachers in state
maintained and special schools in England and Wales R&R Recruitment and Retention Allowance. An authorised payment Allowance to employees in posts which are hard to fill. SATs Statutory Assessment Tests - now officially known as end of Key
Stage or National Curriculum tests, these tests assess pupils' progress at the end of KS2
SEN Special Educational Needs - in England, refers to a legal
definition of individuals with learning difficulties or disabilities that make it harder for them to learn or access education than most children of the same age.
SFCC School(s) Facing Challenging Circumstances - whilst there is no
agreed definition of what this means, it typically relates to a school in an area of multiple deprivation. In this study, we define it as a school with less than 30% 5A*-C at GCSE or equivalent including Mathematics and English in 2008 (i.e. a National Challenge school)
SLT Senior Leadership Team – senior group responsible for the
strategic direction of the school, consisting of the Headteacher, and Deputy Headteacher(s) and/or Assistant Headteacher(s)
SPSS Statistical Package for Social Scientists - most commonly used
software programme to analyse quantitative social data STEM Science, Technology, Engineering and Mathematics - the STEM
subjects are the focus of a range of policy interventions aimed at increasing the number of skilled qualified individuals working in related labour markets
SWUPS Schools with unfilled posts
7
TA Teaching Assistant - staff that support teachers and pupils individually or on a group basis. Some are subject specialists for example in numeracy or English as an additional language, and the creative arts as well as special education needs
TAPS Total Average Points Score- for key stage 2 SATS, i.e.
achievement at the end of primary school TDA Training and Development Agency for Schools – government
agency responsible for ITT and continuing training and development of teacher and the whole school workforce
TLR Teaching and Learning Responsibility payments - additional
salary payable to teachers who fulfil specific roles in leading and managing teaching and learning within a school
WB White British

8
EXECUTIVE SUMMARY Purposes and objectives This study was carried out by the Centre for Education and Inclusion Research (CEIR) at Sheffield Hallam University from November 2008 to March 2009 to understand the current picture in the region, and explore the effects of a range of factors on the rates of teacher recruitment and retention. It assesses the variations between schools and teachers and aims to account for the issues arising in Yorkshire and Humber. In summary, the evaluation:
1. Identified different key variables (e.g., school characteristics, circumstances, teachers' characteristics, government initiatives, etc.) that contribute to the success in the retention and recruitment of teachers in the region;
2. Identified key issues and problems in the recruitment and retention of teachers in the region; and
3. Suggested possible courses of action in response to the findings. Research questions The study addressed four key questions:
• How successful are schools in a) recruiting and b) retaining teachers?
• And how does this vary by literacy and STEM subjects (Science, Technology, Engineering, and Mathematics), GCSE attainment, and schools in different environments (challenging circumstances, deprived areas, school type)?
• What are the fine grained characteristics of those appointed to teach across different schools?
• What factors influence these differences? Review of the literature: summary Key issues from the literature we reviewed are as follows. On recruitment, the issue is not simply recruiting teachers, but recruiting appropriate teachers. Budgetary constraints are a major reason for use of temporary contracts; and this adversely affects non-core subjects. The status of schools in terms of recruitment is affected by potential recruits’ views of schools in terms of: performance and standards; and intake in terms of pupil background. However, negative views of working in challenging schools are reduced where there is previous experience of working in such schools. On retention, it is important to note that retention of teachers per se is not the major issue facing schools; it is retaining motivated, committed teachers. As with recruitment, pupil intake is associated with increasing turnover (reducing retention) in schools with low socio-economic status intakes. Reasons given

9
for leaving schools include pressure, workload, pupil behaviour, lack of senior support, working in non-specialist subjects; and what were perceived to be devalued subjects. Conversely, factors associated with reducing turnover are dominated by providing adequate support, development opportunities, high quality leadership, and seeing the school as a learning environment. Methodology To try to meet the key aims, two main methods were used. These were:
• A full survey of primary, secondary and independent schools in the region. The questionnaire was based on the literature review and discussions with stakeholders and Local Authority representatives. Postal, online and telephone responses were permitted. 7981 schools
(663 primary, 111 secondary, and 20 independent) responded. This gave an overall response rate of 35%, with similar rates for primary schools (36%) and secondary schools (35%), with a smaller proportion (16.4%) of independent schools taking part.
• A range of qualitative methods to supplement the quantitative work were utilised:
o 4 focus groups with, in total, 32 initial teacher trainees across two contrasting Higher Education institutions
o 16 Newly Qualified Teachers interviews o Case Studies in 12 schools, including interviews with 24 Senior
Leadership Team members and 28 other teachers. Findings Unless noted otherwise, all findings relate to outcomes from the surveys and qualitative data collection from this study. Teacher recruitment We found that 14% of schools reported recruiting sufficient suitable teachers was difficult. 94% of permanent posts in primary schools and 88% of such posts in secondary schools advertised in the previous 18 months had been filled. Only 4% of primary schools but 30% of secondary schools that advertised posts had unfilled permanent posts. In some Local Authorities, there was a very high perception of difficulty filling posts even when the vast majority of posts were filled, indicating that less suitable teachers are being recruited, or there were excellent strategies in place to deal with the problems.
1 It is worth noting the discrepancy between the total number of schools and the types relate to the fact
that 4 of the independent schools are both primary and secondary and were treated as separate cases on the dataset.
10
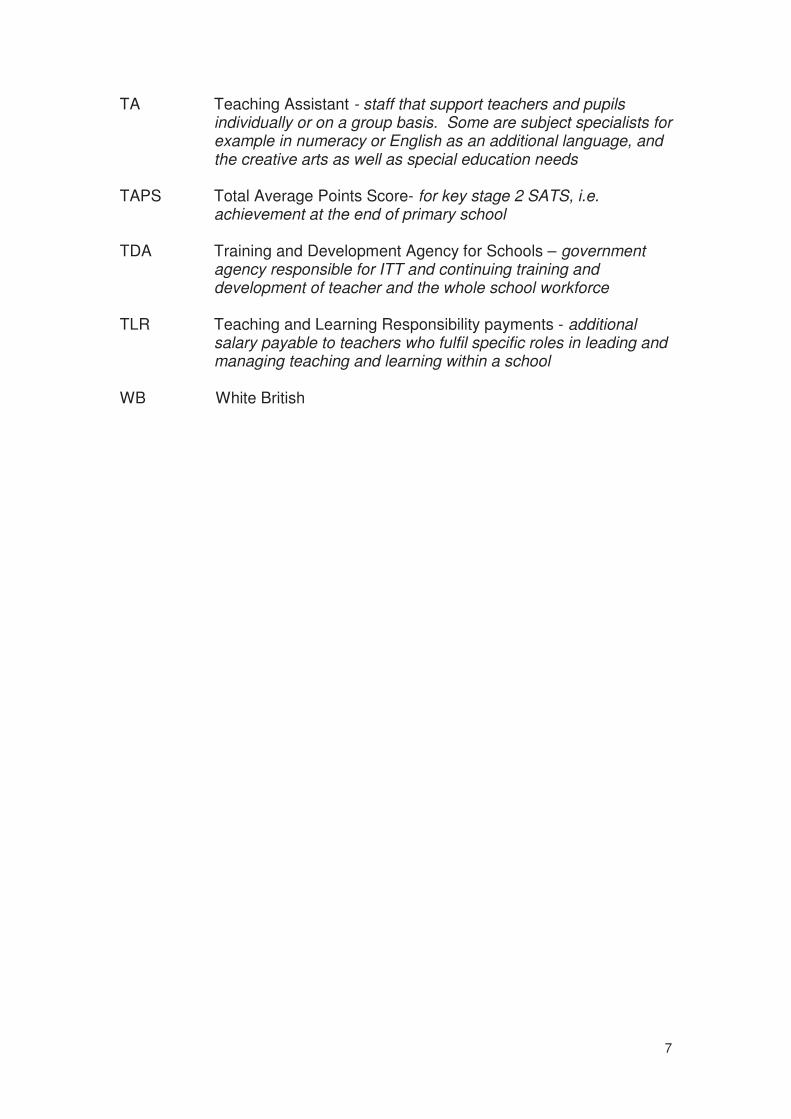
We found at least 90% of schools filled all chemistry and biology posts (approximately 20 of each), whereas at the other extreme, for mathematics, English and ICT (and engineering) 80% or less of schools filled all advertised posts. English and mathematics not only achieved low recruitment in percentage terms, but the unfilled posts represent large gaps in school staff as there were at least 80 posts advertised over the 18 month period we asked about for each subject. See Table E1 for more detail. Table E1 Secondary schools that advertised posts, and percentage with unfilled posts, in the previous 18 months in key subjects
Engineering
Physics Chemistry Biology D&T ICT
Combined science Maths English
Number of schools that advertised posts 4 21 22 26 49 55 79 88 92
Number of schools that did not fill all posts 1 6 3 3 10 15 15 20 19
% schools with unfilled posts 25.0 16.7 9.5 8.0 16.3 20.0 19.2 22.7 19.6
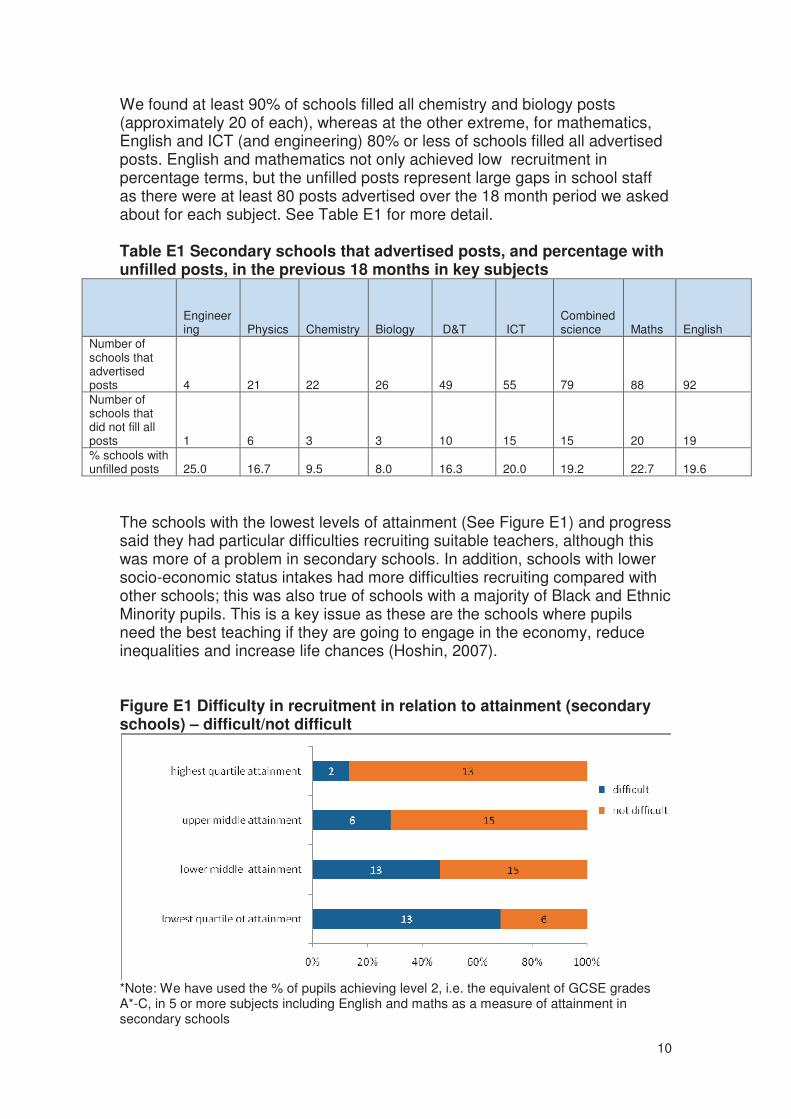
The schools with the lowest levels of attainment (See Figure E1) and progress said they had particular difficulties recruiting suitable teachers, although this was more of a problem in secondary schools. In addition, schools with lower socio-economic status intakes had more difficulties recruiting compared with other schools; this was also true of schools with a majority of Black and Ethnic Minority pupils. This is a key issue as these are the schools where pupils need the best teaching if they are going to engage in the economy, reduce inequalities and increase life chances (Hoshin, 2007). Figure E1 Difficulty in recruitment in relation to attainment (secondary schools) – difficult/not difficult
*Note: We have used the % of pupils achieving level 2, i.e. the equivalent of GCSE grades A*-C, in 5 or more subjects including English and maths as a measure of attainment in secondary schools

11
We found that the characteristics of newly recruited teachers varied by school type. The majority of new recruits to all schools were female, with more than 80% of newly recruited primary teachers female, compared with around 60% of secondary school new recruits. The age profiles of new recruits (mostly below 35) and ethnic background (virtually entirely white) were broadly in line across all types of schools. Primary schools were far more likely than secondary schools to appoint very experienced teachers, and secondaries much more likely to appoint Newly Qualified Teachers. We found that factors contributing to effective recruitment were identified as:
• putting time and effort into recruitment
• building links with ITT (Initial Teacher Training) providers (more so for secondaries)
• emphasising reputation
• utilising specific local strategies (secondaries)
• emphasising work life balance (more primaries). Teacher retention We found that only 5% of schools perceived they had a problem with teacher retention, indicating that it is not felt to be a major problem across the region in general terms. Looking at staff turnover in the past 18 months, schools reported a turnover rate of about 16% of staff during this period. In relation to retention, schools in more deprived circumstances perceived greater difficulties, and so did schools with high levels of Black and Ethnic Minority students (although this was not statistically significant). Secondary schools were more likely to perceive difficulties (18%) in retention compared with primaries (3%). There were higher turnover rates at Key Stage 1 and 2 compared with Foundation Stage in primary schools. The highest turnover rate in key subjects in secondary schools were in Biology and Chemistry; the lowest in ICT and Design and Technology. Schools in both primary and secondary schools with low levels of attainment and progression had more retention problems. Reasons given by Senior Leadership Team members for teachers leaving were dominated by retirement, promotion or other teaching jobs. Factors associated with positive retention included key relationships between teachers and the school, positive school ethos, support and opportunities for development and promotion. Factors associated with push factors to leave the profession were dominated by workload and government initiatives, poor reputation and lack of development opportunities and support. These issues support the view from the literature that institutional cultures, especially those that are supportive and encourage continuing professional development, are very important in retaining motivated teachers suited to the job and school.

12
Senior school leader recruitment Regarding senior leaders, we found that 242 primary and secondary schools in our sample – 31% of primary schools and 45% of secondary schools – had recruited a member of the school leadership team over the previous 18 months. Of these, 24 posts remained unfilled, so there is a clear issue relating to senior leader recruitment overall in the region. There were indications that more deprived schools, schools with a majority of Black Minority Ethnic (BME) students, schools with lower attainment and progression had more difficulties recruiting senior leaders, but further research would be needed to investigate these issues further. In relation to senior leaders, we found a range of strategies were in place in LAs to support senior leader recruitment and retention including systematic, LA-led reviews of needs for each HT vacancy; advice services offered by LA recruitment teams; comprehensive induction programmes; and offers of broader leadership opportunities to experienced leaders. Support staff recruitment and retention Overall, there were few perceived difficulties in recruiting and retaining support staff (although note that this overall picture may mask specific issues for particular support staff groups), and few differences between primary and secondary schools. It appeared that more deprived schools and schools with a majority of BME students had more difficulties in support staff recruitment and retention than other schools, but this was not statistically significant. Open questions on the survey indicated that where there are recruitment difficulties these are associated in more deprived areas with problems around loss of benefits related to taking on lower paid jobs; and in some more affluent areas with a lack of parents willing to take on such low paid work. There were some issues mentioned relating to attempting to retain well qualified Teaching Assistants. Possible courses of action The report concludes with a brief discussion and a set of broad principles for action, with some specific actions, suggested under the broad headings:
• Sharing Practice,
• Gathering data on the issues,
• Encouraging staff development,
• Valuing all schools, and
• Working together to support schools and teachers.

13
The set of more specific actions derived from the report that could be applied to ITT providers, schools, and policy makers to help improve teacher recruitment and retention are summarised in the diagram below:
As noted above, these are suggestions based on useful practice in some areas that could inform the thinking in others: For ITT providers and schools: Offering school-based placement opportunities for individuals considering a teaching career and exposing trainees to schools including disadvantaged schools. For ITT providers, schools, and policy makers: Improving the marketing of the disadvantaged schools. Sharing and celebrating good practice in teacher recruitment and retention. Training coaches and mentors to help support all staff (headteachers, teachers, and teaching assistants). For schools and policy makers: Gathering data on staff recruitment (such as, age, gender, ethnicity, experience, ITT route, and previous teaching and non teaching experience), staff turnover and wastage (why did the staff leave and where to), and recruitment and retention strategies. Evaluating staff recruitment and retention strategies. Utilising exit interviews to ascertain reasons for leaving.
- Gather data on:
(a) Recruited staff profile (b) Turnover (where & why), (c) Wastage (where & why), & (d) Recruitment and retention strategies,
- Evaluate staff recruitment & retention strategies.
- Offer financial & career recognition for staff working in high FSM & BME, & student behaviour problems - Offer financial support to high FSM & BME schools to help address staff recruitment & retention.
- Offer placement opportunities for prospective trainees & teachers in disadvantaged schools
POLICY MAKERS
ITT PROVIDERS
- Improve the marketing of disadvantaged schools. - Share & celebrate good practice. - Train coaches & mentors to support staff

14
For policy makers Offering financial and career recognition for staff working in schools facing challenging circumstances. Offering financial support to schools facing challenging circumstances to help address staff recruitment and retention. Ensuring - via publicity, policy statements, media communications - that the work of schools facing challenging circumstances is celebrated and supported

15
INTRODUCTION Background to the study Whilst recent data on teacher vacancies shows a rising trend from 2,040 in January 2007 to 2,510 in January 2008 (DCSF, 2008), these broad figures, in fact, hide variations. For example, some regions, such as Inner and Outer London, face severe difficulties (DCSF, 2007) and there are concerns in the UK over the ability to attract and retain in some subject areas, such as Mathematics and Science. The overall picture for Yorkshire and Humber in 2007/2008; however, has been relatively good: it ranks second behind the North of England in having low teacher vacancy rates (Ibid, 2007). However, the literature (summarised in the next section) indicates that these overall points mask a wider variation amongst schools. Despite this relative success in teacher recruitment, school-leavers' attainment levels in the region do not compare favourably with other parts of the country, and Yorkshire and Humber has a long history of underachievement. Hoshin (2007) emphasised that both socio-economic factors and the quality of teaching have important influences on pupils' attainment. To examine these issues in more detail in the Yorkshire and Humber region, a partnership led by Yorkshire Futures commissioned the research on which this document reports. Aims of the study This study aims to understand and explore the effects of a range of factors on the rates of teacher recruitment and retention. It assesses the variations between schools and teachers and aims to account for the issues arising in Yorkshire and Humber. In summary, the evaluation aims to:
1. Identify the different key variables (e.g., employment conditions, external, and personal factors) that contribute to the success in the recruitment and retention of teachers in the region;
2. Identify key issues and problems in the recruitment and retention of teachers in the region; and
3. Suggest possible course/s of action in response to the findings.
This report This is the final report into this study. Over the following pages, we set the study in context by considering the literature on recruitment and retention. We draw on this in the remainder of the report. We then move on to outline our methodology – research questions, methods, data collection and characteristics of the sample – and then present our findings organised by these key research questions. Unless noted otherwise, all findings relate to outcomes from the surveys and qualitative data collection from this study.

16
Finally, we conclude with a summary of key issues emerging and suggestions for action for schools and key stakeholders. The report is accompanied by a series of appendices including research tools and detailed case reports on the 12 case study schools we examined in more depth.

17
SECTION ONE: REVIEW OF THE LITERATURE
Key points On recruitment:
• The issue is not simply recruiting teachers, but recruiting appropriate teachers.
• Budgetary constraint is a major reason for use of temporary contracts, and this adversely affects non-core subjects.
• Status of schools in terms of recruitment is affected by potential recruits’ views of schools in terms of:
o Performance and standards, o Intake in terms of pupil background, and
• Negative views of working in challenging schools are reduced where there is previous experience of working in such schools.
On retention:
• Retention of teachers per se is not the major issue facing schools, it is retaining motivated, committed teachers.
• As with recruitment, pupil intake is associated with increasing turnover (reducing retention) in schools with low socio-economic status intakes.
• Reasons given for leaving schools include pressure, workload, pupil behaviour, lack of senior support, working in non-specialist subjects; and what are perceived to be devalued subjects.
• Conversely, factors associated with reducing turnover are dominated by providing adequate support, development opportunities, high quality leadership, and seeing the school as a learning environment.
Research into teacher supply and demand, including the possible barriers to teacher recruitment and retention and the types and level of support needed to enhance the experiences of both beginning and experienced teachers in primary and secondary schools, has received great attention nationally and internationally. This literature review highlights some of these studies and identifies some key points which warrant further investigation. Issues of teacher supply and demand have been the subject of much research both nationally and internationally. This literature review highlights some studies of the possible barriers to teacher recruitment and retention, and the types and level of support needed to enhance the experiences of both beginning and experienced teachers, in primary and secondary schools. We also identify some key points that warrant further investigation.

18
Teacher recruitment The literature on teacher recruitment is very rich especially in relation to the motives for teaching and factors influencing teachers' decisions to teach in particular types of schools. Some of the notable findings from the literature include the following.
Factors influencing teacher recruitment The 2007 edition of the OECD’s Education at a Glance identifies that disadvantaged schools, particularly in poorer neighbourhoods or with large proportions of students speaking other languages, are likely to have most trouble attracting teachers and are consequently more likely to employ those with least experience (OECD, 2007). A recent Jigsaw research project (Lack and Johnston, 2008) that sought to understand the barriers and motivations to teach and stay teaching at schools facing challenging circumstances (SfCC) found approximately 1 in 10 teachers and 1 in 8 headteachers stated they were very likely to apply to a SfCC within the next 5 years. The likelihood of staff applying to a SfCC was strongly linked to the amount of previous experience they had acquired in similar schools. This was particularly the case for trainees who cited prior experience at a SfCC as being a key factor behind applying for such schools or not. Other key reasons for contemplating applying to a SfCC were broadly similar across trainees, teachers and heads, with variations around relishing the challenge, a desire to make a difference and helping to change a school around all stated. Trainees often took a more pragmatic view about applying to a SfCC school because they felt it would increase their likelihood of getting a job. Reasons stated for being reluctant to apply to a SfCC included concerns regarding pupil behaviour and their own ability to manage that, fear of school closure, as well as anxieties about the level of support they would receive. Smithers and Robinson (2004) found that teachers tend to move away from schools in more challenging circumstances, particularly as a result of turnover (staff moving to other schools) rather than wastage (staff leaving the profession). The continuation stage of this project identified feeling valued and being supported as a strong factor in retaining staff (Smithers and Robinson, 2005). Noyes (2004) found that teachers were likely to gravitate towards the types of schools they themselves had attended, particularly in relation to socio-economic status. Bush (2005) argues that not enough is being done to specifically target trainee teachers who are motivated to teach in schools facing challenging circumstances. One scheme being run at the University of California, Los Angeles (UCLA) attempts to meet precisely this need through offering a 'specialised approach to urban teacher preparation that is sensitive to the context of high-poverty communities' (Quartz et al., 2001). The scheme was praised by the Commons Education and Skills Committee (2004) who claimed challenging schools have particular problems with recruitment and retention.

19
They believe the most beneficial way to address retention is to identify trainees who have some interest in working in such challenging schools and provide them with individual training and post qualification support (cited in Bush, 2005:36): Teacher retention Types of retention Before studying teacher retention, Sammons et al. (2007) suggest one needs to make a distinction between two types of retention:
1. Physical continuation in the role, which is the way that retention is predominantly defined; and
2. Motivation and commitment to the role which is a much more complex issue to both quantify and investigate.
Reasons teachers leave Barmby's (2006) study exposes some teacher's ambivalence towards whether to stay in the profession long term, with over a quarter of teachers sampled claiming to be considering leaving the profession within the next ten years. The same study revealed the most common reasons for considering leaving teaching to be workload and pupil discipline. Dadley and Edwards (2007) who also examined the reasons for teachers leaving the profession found: workload (heightened for non-curriculum subjects because of lack of available resources for staff) and behaviour, plus lack of support from senior managers, devaluing of the subject, and working with non-subject specialists lead to added pressures. Smithers and Robinson (2004) identified that leavers are more likely to be younger or older (i.e. nearing retirement) than from a mid-age range, more likely to be women (this may relate to Bird's, 2003, finding that leavers often move in and out of teaching, and Dadley and Edwards, 2007, finding that this is often related to starting a family), and is more frequent in schools in London, the East and the South East (Smithers and Robinson, 2004). Factors influencing teacher retention Rhodes et al. (2004) identified 5 most commonly raised factors likely to lead to retention in the next five years including: higher pay, feeling valued by stakeholders in education, desire to help children learn, less administration and more non-contact time for planning and preparation. Conversely, they acknowledged the five most likely factors to contribute towards leaving the

20
teaching profession in the next five years were increases in administration, increases in overall work load, poor pupil discipline and behaviour issues, worsening work/life balance and constant change and initiative overload. Budgetary concerns run through the issues of recruitment and retention. Castagnoli and Cook (2004) highlight headteachers' need for money to attract the right people to their schools, while a number of studies have indicated that budgetary constraints often mean that schools are unable to offer permanent contracts, and instead use fixed-term contracts, which tends to affect NQTs disproportionately (Williams 1997, cited in Bird, 2003). Smithers and Robinson (2004) found that an increasing number of teachers leave the profession due to non-renewal of fixed term contracts. Hobson et al (2007) found that secondary school NQTs were more likely to initially secure a permanent post than primary ones (76% compared to 58%); primary teachers were much more likely to have had difficulty securing a post (32% compared to 12%). Hobson et al.'s (2007) study further found that 24% of those intending to secure a post at a different school at the end of their NQT year were doing so because their present contract was ending, and the majority of those not intending to teach in the coming year had been unable to find a teaching post (24%). The status of teachers may also have some relevance to retention problems. Teachers’ positive attitudes towards the subject, workload and working with non-specialist teachers were all seen as crucial factor in determining retention in Dadley and Edward's (2007) study of Religious Education teachers. Hargreaves et al.'s study (2007) also found attitudes towards students and workload as positive catalysts for teacher satisfaction and teacher retention. They realised that the perception of teachers' status was similar to that of social workers in the eyes of schools' staff and the public. They noted variations in the perception of status between better and poorer performing schools and between some more marginalised groups of teachers (such as BME teachers or those with SEN - Special Educational Needs - responsibility). School standards as well as socio-economic characteristics of pupils appear to be significant factors in teachers’ preferences for particular schools and therefore this has a large effect on retention rates. Dolton and Newson’s (2003) study based on six London LAs found that a group of schools characterised by an 'economically deprived intake and low academic attainment' had considerably more difficulty in retaining teachers than did other schools. Consequently, a 'vicious circle' situation was said to have emerged whereby 'low attainment and high levels of social deprivation cause higher than average teacher turnover' which in turn leads to a 'rapid turnover of teachers' and 'continued low attainment and ongoing staffing problems'(p.139). Sammons et al.'s study (2007) identifies the need for more targeted CPD provision in schools to reflect the needs of teachers at various career stages, and the need for provision that reflects teachers' commitment, resilience and health needs. This was found to support pupil learning and achievement and represents what Sammons et al describe as quality retention. Bubb and

21
Earley (2006) describe the reasons that prevent teachers, particularly those early in their careers, from undertaking CPD as 'educational vandalism', which is insidious and far-reaching. This, in their view, has various causes: policy changes to remove ring fencing for CPD budgets, poor leadership and management of CPD in schools and teachers themselves, who do not take their personal responsibility for development seriously (Bubb and Earley, 2006). They recommend increased investment, increased emphasis on the CPD coordinator role and viewing the schools as a learning environment for adults as well as children (Bubb and Earley, 2006). Initiatives to encourage recruitment and retention A number of strategies have been launched in recent years to address teacher and headteacher recruitment and retention. This section provides a brief outline of some of these. Future Leaders aims to identify and develop the skills of existing or former teachers in order to help them progress into senior leaders (deputy or assistant headteachers) within 12 months and headteachers after 4 years. This scheme is currently restricted to Greater London, North West (Greater Manchester and Merseyside) and West Midlands (Birmingham and the Black Country) secondary schools in challenging circumstances. Launched in 2006, Future Leaders is supported by a partnership involving the National College of School Leadership (NCSL), Absolute Return for Kids (ARK) and the Specialist Schools and Academies Trust (SSAT). It offers an accelerated path to senior leadership in challenging secondary schools. Participants are offered intensive in-school and off site experiences, tailored mentoring, coaching and training in challenging urban schools throughout their first year residency. Additionally, participants visit exemplar urban schools in the UK and US along with a member of the schools SLT to share best practice. Although the onus is on participants to secure their own substantive post in the second year, Future Leader coordinators assist with this process. From the second year and beyond, participants continue to receive ongoing training and coaching to facilitate the ultimate aim of securing a headship within four years of starting the programme. An evaluation by Earling et al (2008) revealed a range of positive aspects to the programme including the training, coaching, networking and support offered amongst the Future Leaders themselves; the vision of the programme and the reflection and adaptation by the Future Leaders organisation itself. In contrast, the residency experience was identified as being ‘variable’ and the appropriateness of some of the host schools as effective ‘learning environments’ was questioned. Although in the majority of instances the residency offered a ‘very useful developmental opportunity,’ there were said to be a number of issues including the matching process, lack of teaching, lack of challenge, and limited or no management responsibility opportunities for some participants.

22
NCSL recently unveiled plans for a new Accelerate to Headship (AtH) programme to be launched in September 2010. It is hoped AtH will build on the work of the Future Leaders scheme and help identify up to 200 outstanding new school leaders in all areas of the country (DCSF 2009). The AtH forms part of a new package of initiatives outlined in the governments Working Together Public Service Reform Paper (HM government 2009) which aims to encourage and fast track outstanding graduates into teaching. From September 2009, there will be a new Fast-Track teaching route for ‘talented career switchers’ and graduates which will enable them to achieve a teaching qualification in six months instead of the traditional 12 month time period. Teach First is a ‘social change initiative’ run by an independent charity that aims to address educational disadvantage by transforming exceptional graduates into effective, inspirational teachers and leaders in all fields’ (Teach First 2009). Founded in 2002, Teach First is an intensive 2 year scheme allowing top graduates, who may not have considered teaching previously, the opportunity to spend two years working in secondary schools in challenging circumstances. The programme enables participants to acquire their QTS (Qualified Teacher Status) in conjunction with participating within an innovative programme of leadership development and management skills training, work experience and summer project opportunities with a host of leading employers affiliated to the scheme. Subject to successfully completing the requirements of the scheme, participants receive Ambassador (alumni) status and the option to work in schools or other sectors, utilising the experiences and insights the programme has provided them with. Irrespective of the career option pursued, Ambassadors’ relationships with Teach First and their fellow peers are expected to be retained through a structured programme of events/online activities. As of February 2008, Teach First had managed to retain 55% of its Ambassadors with 57% of these acquiring a school leadership position. As for the remaining Ambassadors who moved into other sectors, almost two thirds work as pupil mentors, school governors or undertake other school support positions (Teach First 2009). Teach First has recently began an expansion with both Leeds and Sheffield secondary schools being added to the programme during 2009. Challenging schools from the aforementioned regions join an existing pool of schools from London, Greater Manchester, Birmingham, Nottingham and Liverpool. Ofsted’s (2008) evaluation of the initiative (focused entirely on the London-based programme) revealed how Teach First has successfully managed to attract graduates who would not otherwise have considered teaching (p.4). The study found the calibre of the trainees was praised with around 50% achieving standards for QTS that were of an outstanding level, a third to a good level and the remaining trainees to a satisfactory level. These standards, the study concludes, compared favourably to other ITT courses. Trainees’ management of student behaviour was highlighted as the weakest area. The introductory six-week residential training course was particularly praised for being an innovative feature and for enabling trainees to cope successfully with classroom teaching at a surprisingly early stage in their teaching career (p.5). However, the study warns, the employment-based focus of the programme rests largely on the quality of the training provided by the schools and the challenging nature of the schools involved was said to make them vulnerable
23
to staffing changes which may affect the quality of the training they provide (p.5). Levels of funding were reported to be sufficient to permit schools to secure a high level of support through regular visits by experienced tutors from the university (p.5). Golden Hellos is another innovative initiative whereby financial incentives of £2,500 to £5,000 is offered to trainees of particular subject shortage areas provided they successfully complete a postgraduate ITT course and take up a permanent position in a maintained or non-maintained special school. Under this scheme, Mathematics and Science teachers are eligible for the £5,000 payment while ICT, DT, Modern Languages, Music and RE teachers are entitled to £2,500. There has been no formal evaluation of the Golden Hello initiative for secondary schools; however, Hopwood (2004) investigated their effectiveness in relation to the FE sector. The findings were somewhat inconclusive. On the one hand, the study found the initiative had some positive effects in terms of recipients feeling more valued and motivated. On the other, the evaluation found the initiative had negative effects in terms of the restricted availability of the Golden Hellos, which were seen by some as being ‘divisive’ and the payments were felt to be insufficient to affect teachers' longer term behaviour. Another scheme outlined in the government’s recent New opportunities: Fair Chances for the Future White Paper (HM government 2009a) is the Golden Handcuff which is due to be launched in September 2009 offering 500 of the most disadvantaged schools £10,000 on an incremental basis over 3 years (i.e. £2,000 after completing year one, another £2,000 after year two and the final £6,000 after completing the full three) per teacher to help recruit and retain excellent teachers. Schools already invited to participate include National Challenge schools and Academies/ maintained secondary schools in England where 30% or more of their pupils are entitled to free school meals and their leadership is rated as 'good' or 'better' by Ofsted (or judged by external advisers to have sufficient capacity to improve to that level). This brief review summarises some of the initiatives in place to help address the problems and issues relating to teacher and headteacher recruitment and retention. It also serves to illustrate the complexity of staff recruitment and retention, in terms of both its objective characteristics and the more subjective behavioural factors which underlie it. Despite the wealth of literature, there seems to be many gaps such as the effects of the LA, school characteristics, and teachers' commitment and demographic profile. These variations need not only to be identified but also to be understood. For example, how far are they due to supply factors: the availability and willingness of prospective and experienced teachers to enter and stay in particular types of educational contexts? Or do demand factors – the ability of schools to offer and fund working contexts that teachers find attractive – play a key role? And how do these factors interact? For example, do prospective teachers with particular characteristics gravitate to particular kinds of schools? It is important, therefore, to study recruitment and retention issues in more depth to examine variations by these and other factors. This is of course the focus of the current study in Yorkshire and Humber.
24
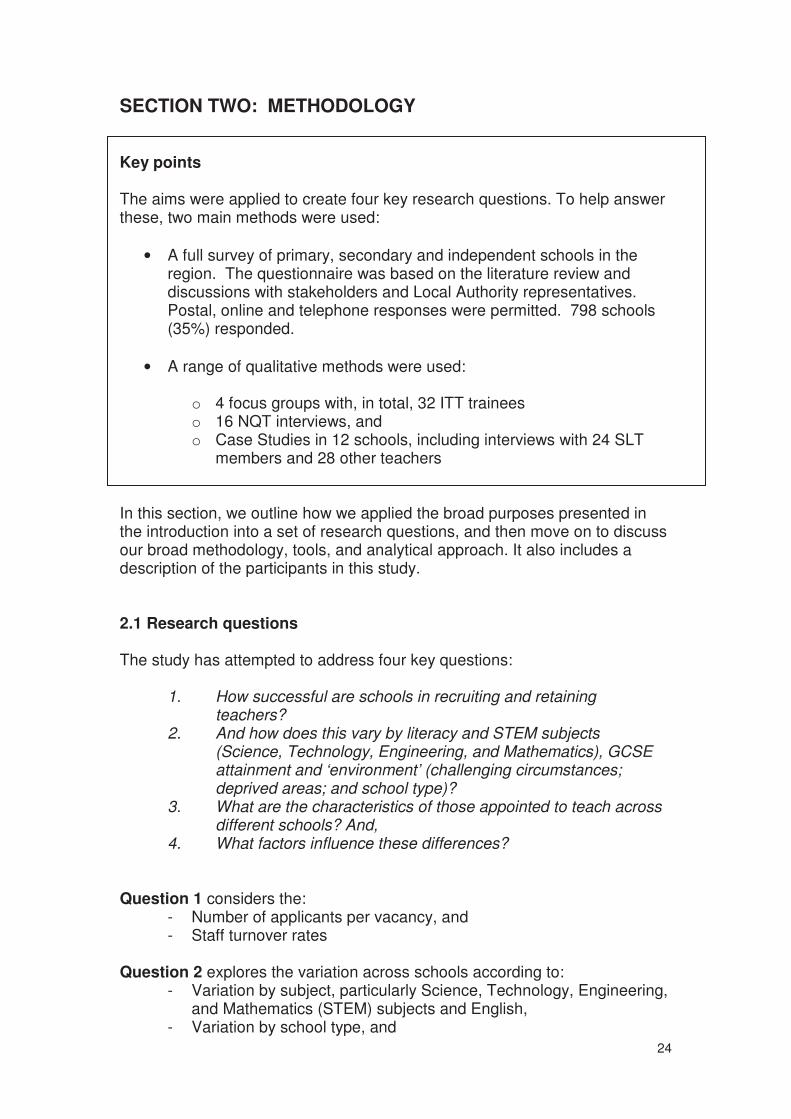
SECTION TWO: METHODOLOGY Key points The aims were applied to create four key research questions. To help answer these, two main methods were used:
• A full survey of primary, secondary and independent schools in the region. The questionnaire was based on the literature review and discussions with stakeholders and Local Authority representatives. Postal, online and telephone responses were permitted. 798 schools (35%) responded.
• A range of qualitative methods were used:
o 4 focus groups with, in total, 32 ITT trainees o 16 NQT interviews, and o Case Studies in 12 schools, including interviews with 24 SLT
members and 28 other teachers In this section, we outline how we applied the broad purposes presented in the introduction into a set of research questions, and then move on to discuss our broad methodology, tools, and analytical approach. It also includes a description of the participants in this study. 2.1 Research questions The study has attempted to address four key questions:
1. How successful are schools in recruiting and retaining teachers?
2. And how does this vary by literacy and STEM subjects (Science, Technology, Engineering, and Mathematics), GCSE attainment and ‘environment’ (challenging circumstances; deprived areas; and school type)?
3. What are the characteristics of those appointed to teach across different schools? And,
4. What factors influence these differences?
Question 1 considers the: - Number of applicants per vacancy, and - Staff turnover rates
Question 2 explores the variation across schools according to:
- Variation by subject, particularly Science, Technology, Engineering, and Mathematics (STEM) subjects and English,
- Variation by school type, and
25
- Variation by students’ socio-economic background (% entitlement to free school meals and ethnic mix)
Question 3 looks at:
- Variations in characteristics by gender, ethnicity, age, career break; and
- Variations by specialist/non specialist; Initial Teacher Training (ITT) route
Question 4 finally explores the motivations of Newly Qualified Teachers (NQTs) and teachers in deciding to take up posts and stay in different schools using all the above criteria. This also includes the perspective of schools on these issues. Questions 1 and 2 in this study were largely addressed via a survey (census) of all primary and secondary schools in Yorkshire and Humber, supplemented by 12 Case Studies of schools, in particular the views of members of the Senior Leadership Teams (SLTs). Questions 3 and 4 were addressed principally through qualitative means, via the school case studies including the views of the members of the SLTs as well as recently recruited and well established teachers in these schools; alongside views of additional samples of Newly Qualified Teachers NQTs and Initial Teacher Training (ITT) trainee. The study as a whole was also informed by Local Authority (LA) personnel, and examination of the literature. We discuss these methods in more detail in the next section.
26
2.2 The research process Note that all research tools are included in Appendix D. 2.2.1 The scoping phase The study began with a reflection on current literature and consideration of learning from our other work on NQTs' knowledge base concerning teacher recruitment and the early career experience of teachers (CEIR, 2008) These were supplemented by a series of interviews with LA personnel in two large metropolitan boroughs, one small metropolitan borough, one unitary, and one county council in the region. The 5 officers were interviewed by telephone, giving us an overview of the recruitment and retention situation in their local area, and helping scope the issues for the study. The questions explored with the LA officers included:
- The general nature of recruitment and retention issues in their LA;
- The quality of the data available to/collected by the LA;
- Perceived differences among schools with different characteristics; and
- Strategies for addressing these issues.
These two key activities - building on our NQT study and interviews with LA officers - helped provide a sound basis for the two following core elements of the study. 2.2.2 The quantitative phase The survey: sampling and administration overview From discussions with LA officials, DCSF and key researchers in the field, it became clear that LAs rarely collect recruitment data, and if they do, they are usually either outdated or are not detailed enough for the purposes of this study (nor is it collected in a consistent format). This removed the possibility of using LA data as a key element of the quantitative element. Therefore, we moved to use a full sample survey i.e. a census of schools. We utilised a range of methods to ensure a good response rate including:
• a prize draw incentive
• postal and online survey completion options
• 2 mail reminders
• and structured telephone interviews with randomly selected non-responding schools
Through these means, we secured 798 responses (a good 35% response rate).

27
Questionnaire content To answer Research Question 1 (see 2.1 above) in the broadest terms, a questionnaire addressed to the headteachers that asked them about:
1. Details of teaching posts offered (short and long term contracts and subject of specialisation), number of applicants and number of posts filled;
2. Current number of teachers ; and 3. Characteristics of leavers and their destination.
To help answer Research Question 2 and contribute to Question 3, we explored variations by:
1. LAs, 2. Subject, particularly STEM subjects and English; 3. School level; 4. Free School Meal (FSM) intake and ethnic mix; 5. Ppost (leadership and other positions) and non-teaching staff; and 6. GCSE attainment
and, for individuals appointed, we explored variations:
1. In characteristics by gender, ethnicity, and reasons for leaving; and 2. By specialist/non specialist.
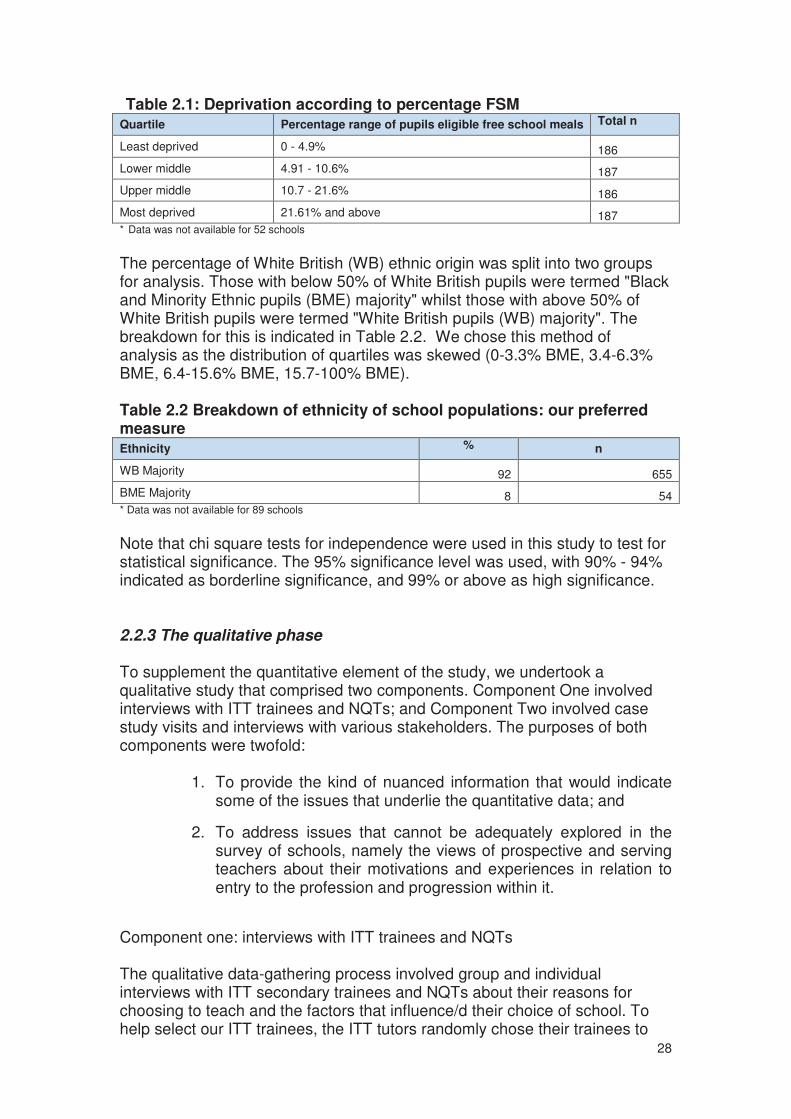
To examine variation in these rates (Research Questions 2 and 3) we examined each separately by subject and by post. Variation by social background (judged by Free School Meals (FSM) intake) and attainment (judged by 5 A*-C GCSE or equivalent including Mathematics and English results) were analysed at school level. Quantitative analysis The data was analysed using the Statistical Package for Social Scientists (SPSS) as follows. Questionnaire responses were merged with data from the DCSF national database of schools. Variables merged in were percentage of pupils eligible for free schools meals and percentage of pupils of White British ethnic origin. The percentage of pupils on free school meals was used as a proxy measure for deprivation of the school. The percentage of pupils of White British origin was used as an indication of the ethnic mix of the school. The percentage of pupils eligible for FSM was then broken down into quartiles and responses were analysed by this variable. Those in the lowest quartile were described as, "least deprived" whilst those in the upper quartile were described as, "most deprived". The two middle quartiles were termed as, "lower middle" and "upper middle". The breakdown for this is as follows (see Table 2.1 below):
28
Table 2.1: Deprivation according to percentage FSM Quartile Percentage range of pupils eligible free school meals Total n
Least deprived 0 - 4.9% 186
Lower middle 4.91 - 10.6% 187
Upper middle 10.7 - 21.6% 186
Most deprived 21.61% and above 187 * Data was not available for 52 schools
The percentage of White British (WB) ethnic origin was split into two groups for analysis. Those with below 50% of White British pupils were termed "Black and Minority Ethnic pupils (BME) majority" whilst those with above 50% of White British pupils were termed "White British pupils (WB) majority". The breakdown for this is indicated in Table 2.2. We chose this method of analysis as the distribution of quartiles was skewed (0-3.3% BME, 3.4-6.3% BME, 6.4-15.6% BME, 15.7-100% BME). Table 2.2 Breakdown of ethnicity of school populations: our preferred measure Ethnicity % n
WB Majority 92 655
BME Majority 8 54 * Data was not available for 89 schools
Note that chi square tests for independence were used in this study to test for statistical significance. The 95% significance level was used, with 90% - 94% indicated as borderline significance, and 99% or above as high significance. 2.2.3 The qualitative phase
To supplement the quantitative element of the study, we undertook a qualitative study that comprised two components. Component One involved interviews with ITT trainees and NQTs; and Component Two involved case study visits and interviews with various stakeholders. The purposes of both components were twofold:
1. To provide the kind of nuanced information that would indicate some of the issues that underlie the quantitative data; and
2. To address issues that cannot be adequately explored in the survey of schools, namely the views of prospective and serving teachers about their motivations and experiences in relation to entry to the profession and progression within it.
Component one: interviews with ITT trainees and NQTs The qualitative data-gathering process involved group and individual interviews with ITT secondary trainees and NQTs about their reasons for choosing to teach and the factors that influence/d their choice of school. To help select our ITT trainees, the ITT tutors randomly chose their trainees to

29
represent different specialisation, level, teaching qualifications (GTP, PGCE, and BSc (Bachelors of Sciences), gender, ethnicity, and age group. The NQTs were accessed through their previous ITT providers and also through their schools. Inclusion in both groups was voluntary, but those who agreed to participate were offered £15 as an incentive.
Component two: case studies Following discussions with the research funders, LA officers, and ITT tutors a list of potential schools fitting the following criteria were short listed to include in this component:
1. SFCCs (Schools Facing Challenging Circumstances) with difficulties recruiting/ retaining staff.
2. SFCCs with success in recruiting/ retaining staff. 3. Schools having difficulty recruiting for other reasons (e.g.,
subject specialism). 4. SFCCs with improving attainment. 5. Schools with innovative solutions to recruitment/ retention. 6. One successful school (not an SFCC) to contrast with the above
schools. After some discussions with headteachers and others, 12 schools (8 secondary and 4 primary schools) with these characteristics were selected. The case studies comprised:
1. An interview with the headteacher or other SLT (Senior Leadership Team) representative
2. A focus group and/or individual interviews with experienced well established teachers in the school;
3. A focus group and/ or individual interviews with newly qualified teachers; and
4. A focus group and/or individual interviews with experienced but recently appointed teachers.
The questions covered included:
1. Views about the seriousness of recruitment and retention issues in their school, the factors influencing these, and how they relate to their schools' characteristics and to schools of similar types; and
2. School’s strategies to address issues of recruitment and retention and the perceived success of these.

30
Qualitative analysis
Data gathered from the above interviews in Component One and Two were summarised, and examined thematically. In addition, cross-case analysis of views of the different groups was carried out to draw out issues specific to these groups. Finally, ‘case portraits’ summarising the experiences of individual schools was written up (see Appendix B).
2.3 Profile of the sample 2.3.1 The survey sample With the exception of special schools and pupil referral units (PRU), all 2,299 schools in Yorkshire and Humber were sent a questionnaire. Of these, 798 schools responded, giving an overall response rate of 35%. The highest response was from primary schools (36%) followed by secondary schools (35%). A smaller proportion (16.4%) of independent schools responded (see Table 2.3). Table 2.3 Response rate by school level School level Returns Schools in category Response rate
Primary 663 1856 35.7
Secondary 111 321 34.6
Independent 20 122 16.4
Total 798 2299 34.7
It is worth noting that some of the reasons given by schools declining to take part included:
1. The questionnaire was administered (December- January) at one of the busiest times of the year,
2. The school is in special measures, 3. The school is busy preparing for an impeding Ofsted inspection visit, 4. The school has no or little resources to release staff for interviews, and 5. The school has a clear written policy against involving staff in externally
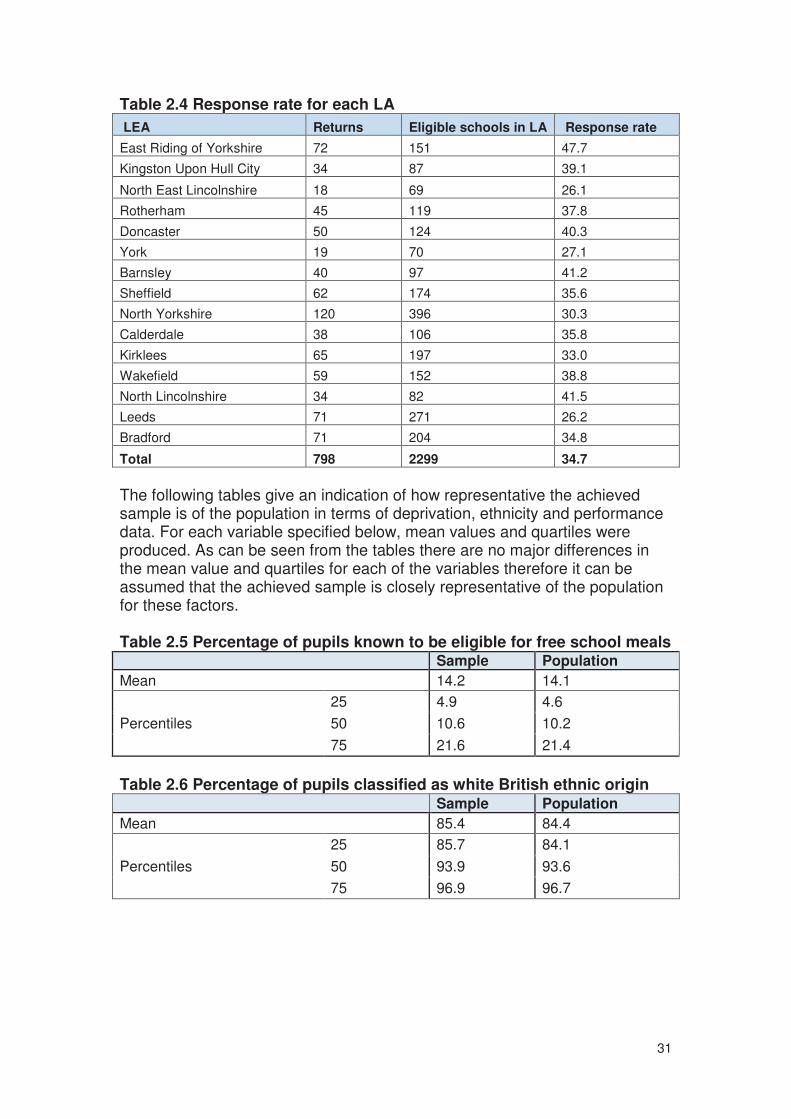
funded research. Table 2.4 shows the response rate for each LA. The highest response came from schools in East Riding of Yorkshire (48%). A lower proportion of schools in Leeds and North East Lincolnshire responded (both 26%). The data for the LAs with the lowest response rates and overall numbers should therefore be treated with caution in the analysis that follows.
31
Table 2.4 Response rate for each LA
LEA Returns Eligible schools in LA Response rate
East Riding of Yorkshire 72 151 47.7
Kingston Upon Hull City 34 87 39.1
North East Lincolnshire 18 69 26.1
Rotherham 45 119 37.8
Doncaster 50 124 40.3
York 19 70 27.1
Barnsley 40 97 41.2
Sheffield 62 174 35.6
North Yorkshire 120 396 30.3
Calderdale 38 106 35.8
Kirklees 65 197 33.0
Wakefield 59 152 38.8
North Lincolnshire 34 82 41.5
Leeds 71 271 26.2
Bradford 71 204 34.8
Total 798 2299 34.7
The following tables give an indication of how representative the achieved sample is of the population in terms of deprivation, ethnicity and performance data. For each variable specified below, mean values and quartiles were produced. As can be seen from the tables there are no major differences in the mean value and quartiles for each of the variables therefore it can be assumed that the achieved sample is closely representative of the population for these factors. Table 2.5 Percentage of pupils known to be eligible for free school meals Sample Population
Mean 14.2 14.1
Percentiles
25 4.9 4.6
50 10.6 10.2
75 21.6 21.4
Table 2.6 Percentage of pupils classified as white British ethnic origin Sample Population
Mean 85.4 84.4
Percentiles
25 85.7 84.1
50 93.9 93.6
75 96.9 96.7
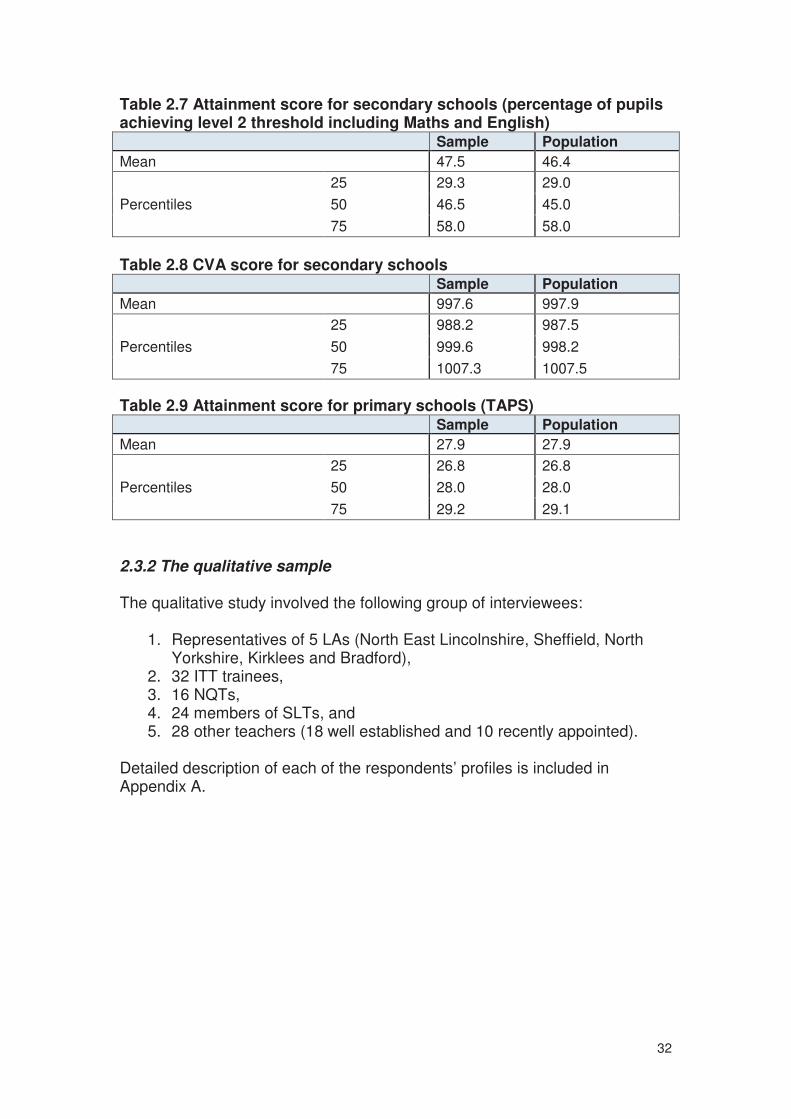
32
Table 2.7 Attainment score for secondary schools (percentage of pupils achieving level 2 threshold including Maths and English) Sample Population
Mean 47.5 46.4
Percentiles
25 29.3 29.0
50 46.5 45.0
75 58.0 58.0
Table 2.8 CVA score for secondary schools Sample Population
Mean 997.6 997.9
Percentiles
25 988.2 987.5
50 999.6 998.2
75 1007.3 1007.5
Table 2.9 Attainment score for primary schools (TAPS) Sample Population
Mean 27.9 27.9
Percentiles
25 26.8 26.8
50 28.0 28.0
75 29.2 29.1
2.3.2 The qualitative sample
The qualitative study involved the following group of interviewees:
1. Representatives of 5 LAs (North East Lincolnshire, Sheffield, North Yorkshire, Kirklees and Bradford),
2. 32 ITT trainees, 3. 16 NQTs, 4. 24 members of SLTs, and 5. 28 other teachers (18 well established and 10 recently appointed).
Detailed description of each of the respondents’ profiles is included in Appendix A.

33
SECTION THREE: TEACHER RECRUITMENT AND RETENTION 3.1 Teacher recruitment Key points
• 13.5% of schools reported that recruiting sufficient suitable teachers was difficult.
• 93.5% of all permanent posts in primary schools and 87.5% of such posts in secondary schools advertised in the previous 18 months had been filled.
• Only 4.3% of primary schools that advertised such posts but 30.3% of equivalent secondary schools had unfilled permanent posts.
• In some LAs there was a very high perception of difficulty filling posts even when the vast majority of posts were filled, indicating that less suitable teachers are being recruited, or there were excellent strategies in place to deal with the problems.
• The subjects with the most difficulty filling all posts were engineering, mathematics, English and ICT.
• Less than 50% of Physics teachers recruited were subject specialists, and less than 90% of ICT, Maths, Chemistry and English teachers were subject specialists.
• The schools with the lowest levels of attainment and progress said they had particular difficulties recruiting suitable teachers, although this was more of a problem in secondary schools.
• In addition, schools with lower socio-economic status intakes had more difficulties recruiting compared with other schools; this was also true of schools with higher levels of BME pupils.
• The characteristics of newly recruited teachers varied by school type: o The majority of new recruits to all schools were female. o The age profiles of new recruits (mostly below 35) and ethnic
background (virtually entirely white) were broadly in line across all types of schools.
o Primary schools were far more likely than secondary schools to appoint very experienced teachers, and secondaries much more likely to appoint NQTs.
• Compared with our sample of schools as a whole, the 85 schools with unfilled posts were more likely to be in a category associated with more deprived or difficult to teach intakes. There was a particularly high concentration of such schools in the primary category. However, for secondary schools it is clear that an additional factor affecting schools with a broader range of intakes is difficulty recruiting to particular subjects, specifically mathematics, English and ICT.
• Factors contributing to effective recruitment were identified as: o Putting time and effort into recruitment. o Building links with ITT providers (more so for secondaries). o Emphasising reputation. o Utilising specific local strategies (more so for secondaries). o Emphasising work life balance (more so for primaries).

34
3.1.1 Starting point: why do teachers join the profession in the region? As a starting point to understanding teacher recruitment in the region, it is worth considering motivations to enter the profession. We asked all teachers involved in the qualitative elements of the research why they decided to enter teaching, and we found key factors (mentioned by 3 ITT trainees: 2 ITT trainees- GTPs and 1BSC, and 16 teachers who were asked) included principally two, inter-related extrinsic motivational factors:
• benefits of the profession (holidays and job security)
• personal factors (such as, family commitments) A smaller group (in line with other research findings e.g. Hobson et al., 2004; Smethem, 2007) mentioned intrinsic motivational factors, principally:
• giving something back to society (3 ITT trainees: 2 GTPs and 1 PGCE mathematics)
• helping combat misconceptions and difficulties associated with learning what are often seen as unappealing, tough subjects such as mathematics and sciences (5 PGCEs mathematics and 3 ITT trainees- GTP).
The following are excerpts of what some had to say:
“I decided to come into teaching because I had a very mundane job, quite unrewarding and wanted to give something back to society and wanted to offer children effective teaching that I thought I didn't get when I was at school.” (ITT trainee- PGCE mathematics) “When I did my degree in Literature I got so passionate about it I decided that I wanted to inspire the students of a younger age group instead and share my enthusiasm.” (ITT trainee- GTP, English) “Basically, I wanted something that can work around my family commitment. When I had my child I was working at that time for one of the high street banks. I was earning a lot of money, but I was away a lot of the time from my son. Teaching I then thought with the financial security and holidays fit my son and me better.” (Secondary science teacher)
35
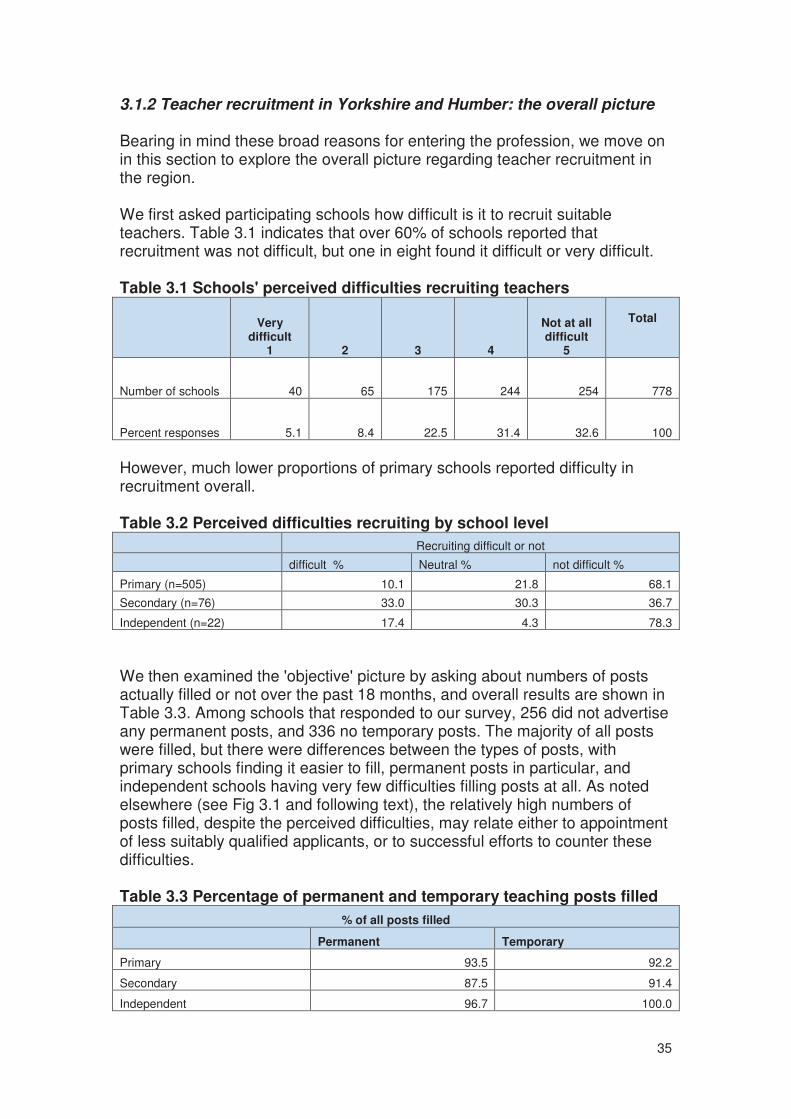
3.1.2 Teacher recruitment in Yorkshire and Humber: the overall picture Bearing in mind these broad reasons for entering the profession, we move on in this section to explore the overall picture regarding teacher recruitment in the region. We first asked participating schools how difficult is it to recruit suitable teachers. Table 3.1 indicates that over 60% of schools reported that recruitment was not difficult, but one in eight found it difficult or very difficult. Table 3.1 Schools' perceived difficulties recruiting teachers
Very difficult
1 2 3 4
Not at all difficult
5
Total
Number of schools 40 65 175 244 254 778
Percent responses 5.1 8.4 22.5 31.4 32.6 100
However, much lower proportions of primary schools reported difficulty in recruitment overall. Table 3.2 Perceived difficulties recruiting by school level
Recruiting difficult or not
difficult % Neutral % not difficult %
Primary (n=505) 10.1 21.8 68.1
Secondary (n=76) 33.0 30.3 36.7
Independent (n=22) 17.4 4.3 78.3
We then examined the 'objective' picture by asking about numbers of posts actually filled or not over the past 18 months, and overall results are shown in Table 3.3. Among schools that responded to our survey, 256 did not advertise any permanent posts, and 336 no temporary posts. The majority of all posts were filled, but there were differences between the types of posts, with primary schools finding it easier to fill, permanent posts in particular, and independent schools having very few difficulties filling posts at all. As noted elsewhere (see Fig 3.1 and following text), the relatively high numbers of posts filled, despite the perceived difficulties, may relate either to appointment of less suitably qualified applicants, or to successful efforts to counter these difficulties. Table 3.3 Percentage of permanent and temporary teaching posts filled
% of all posts filled
Permanent Temporary
Primary 93.5 92.2
Secondary 87.5 91.4
Independent 96.7 100.0

36
When we turn to how individual schools fare in filling posts (Table 3.4), we find that in fact the distribution of unfilled posts amongst schools is not even. Only 4% of primary schools that advertised permanent posts did not fill them all, indicating that this is not a major problem for the vast majority of primary schools. In contrast, almost a third of secondary schools advertising permanent posts in the region had difficulties filling at least one such post in the previous 18 months, indicating a much more widespread difficulty. Table 3.4 Teaching posts filled and unfilled in particular schools
% schools that did not fill all advertised permanent posts
Total number of schools that advertised permanent vacancies
% schools that did not fill all advertised temporary posts
Total number of schools that advertised temporary vacancies
Primary 4.3 414 3.2 373
Secondary 30.3 66 6.6 61
Independent 14.2 21 0.0 9
Interestingly, when we compare perceived problems with actual difficulties in filling posts, there are some large variations (see Figure 3.1 below). Figure 3.1 Perceived difficulties in recruiting teachers
Figure 3.1 shows little correspondence between the two figures. Whereas the York schools in our sample reported finding little difficulty in recruiting, and had no unfilled posts, 55% of schools that responded in North East Lincolnshire claimed they had difficulties, but ultimately 86% posts were filled (note though the low response rates in this area). By contrast, 11% of Sheffield schools reported difficulties in recruitment, yet they had one of the highest proportions of unfilled posts (16%).

37
The mismatch between the two figures is not necessarily an indication of a misreading of the situation by school leaders. For example, it may indicate that schools in some authorities have particularly good strategies for dealing with recruitment problems, or that some schools fill their posts with less suitable applicants. It may also link to LAs having positive strategies to deal with recruitment thereby reducing problems. For example, North East Lincolnshire uses a range of appropriate recruitment strategies to help attract teachers to their authority such as working alongside ITT providers to increase the number of placements in geographically isolated schools and employing ITT trainees on the Graduate Teacher Programme (GTP) to help fill some of their posts. The LA had also appointed an experienced primary teacher to assess their support for NQTs to help devise interventions and training programmes to help address their needs. Sheffield, too, has a range of measures including targeted programmes of publicising NQT opportunities in the region for a number of years including adverts and mail shots to local providers, an NQT pooling system for secondary English and Maths and a smaller pool for primary focusing on very highly qualified teachers. They have also devised a structured NQT induction programme that extends to second year teachers. It is worthwhile mentioning here the other strategies employed by other LAs in the region such as the setting up of a middle school working party to deal with retention and career maintenance issues in the context of re-organisation; and the appointing of a School Improvement Officer to support staff and deal with issues such as performance management, CPD (Continuing Professional Development), and career pathways. Some LAs offer training in recruitment for school governors and/or SLT, which were recommended as good practice by several respondents. Finally, in this section, we examined differences between schools with and without post-16 pupils. As Tables 3.5 and 3.6 indicate, there were no clear patterns: A greater proportion of 11-16 schools filled all their vacancies (75%) than 11-18 schools (59%), but they also reported more difficulty in recruitment. Table 3.5 A comparison of teaching posts unfilled between 11-16 and 11-18 schools
Of 11-16 schools (n=52)
25% did not fill all posts 54% reported difficulty recruiting
75% did fill all posts 46% reported no difficulty recruiting
Of 11-18 schools (n=41)
42% did not fill all posts 40% reported difficulty recruiting
59% did fill all posts 60% reported no difficulty recruiting
38
Table 3.6 Perceived difficulties recruiting between 11-16 and 11-18 schools
Of schools that reported difficulty recruiting (n=36)
61% were 11-16 schools
39% were 11-18 schools
Of schools that reported no difficulty recruiting (n=40)
48% were 11-16 schools
53% were 11-18 schools
Of schools that did not fill all posts (n=30)
43% were 11-16 schools
57% were 11-18 schools
Of schools that did fill all posts (n=63)
62% were 11-16 schools
38% were 11-18 schools
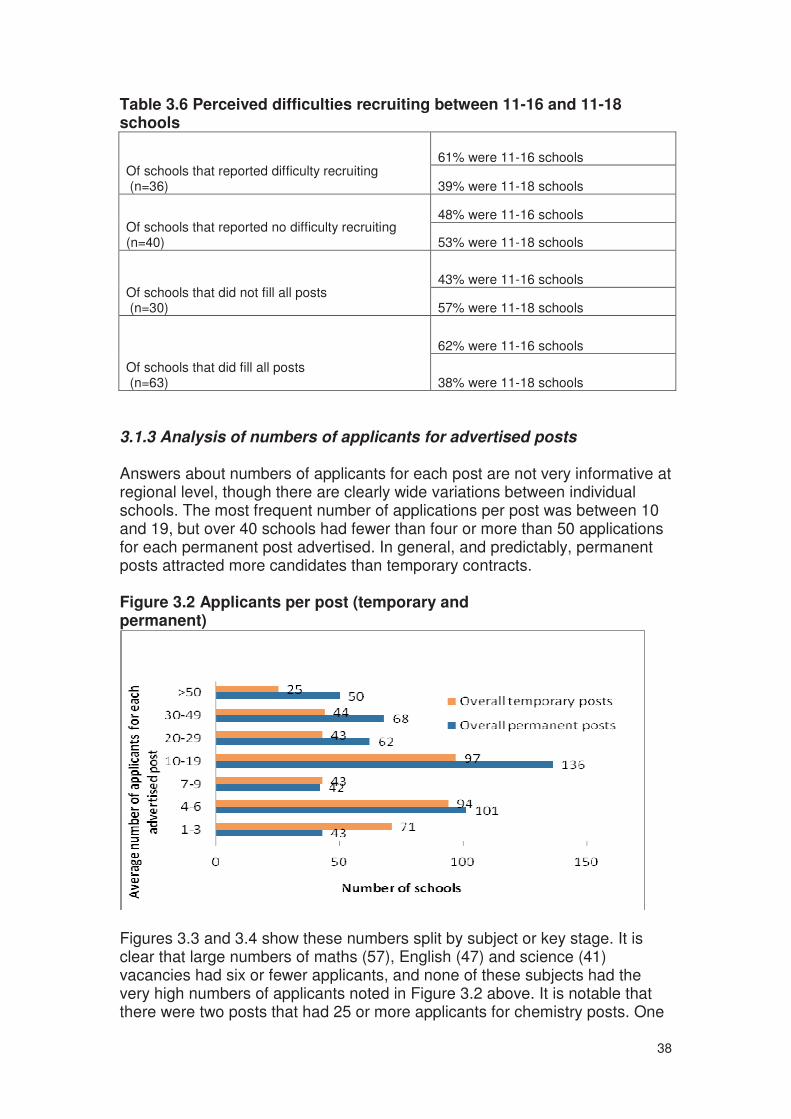
3.1.3 Analysis of numbers of applicants for advertised posts Answers about numbers of applicants for each post are not very informative at regional level, though there are clearly wide variations between individual schools. The most frequent number of applications per post was between 10 and 19, but over 40 schools had fewer than four or more than 50 applications for each permanent post advertised. In general, and predictably, permanent posts attracted more candidates than temporary contracts. Figure 3.2 Applicants per post (temporary and permanent)
Figures 3.3 and 3.4 show these numbers split by subject or key stage. It is clear that large numbers of maths (57), English (47) and science (41) vacancies had six or fewer applicants, and none of these subjects had the very high numbers of applicants noted in Figure 3.2 above. It is notable that there were two posts that had 25 or more applicants for chemistry posts. One

39
of these is an independent school and the other is an averagely performing school, though it does have post-16 provision. Figure 3.3 Numbers of applicants (grouped) for advertised vacancies by subject
In view of the somewhat higher reported difficulties in recruiting at KS2 than KS1 or Foundation stage, it is surprising to note that Key stage 2 posts appear to have had more applicants, as can be seen from Figure 3.4 below. Figure 3.4 Number of applicants to primary schools (grouped) by Key Stage
Analysing the numbers of applicants for posts in relation to school attainment scores, CVA, FSM and ethnic majority shows similar patterns to reported difficulty in recruitment and numbers of unfilled posts. For example primary schools in the top quartiles of attainment as measured by TAPS had fewer post receiving only 1-3 applicants and science posts in schools with higher proportions of pupils achieving level 2 threshold had more applicants (see Table 3.7 below). However numbers are too low for statistical analysis and one particularly successful or unsuccesful school can distort the pattern.
40
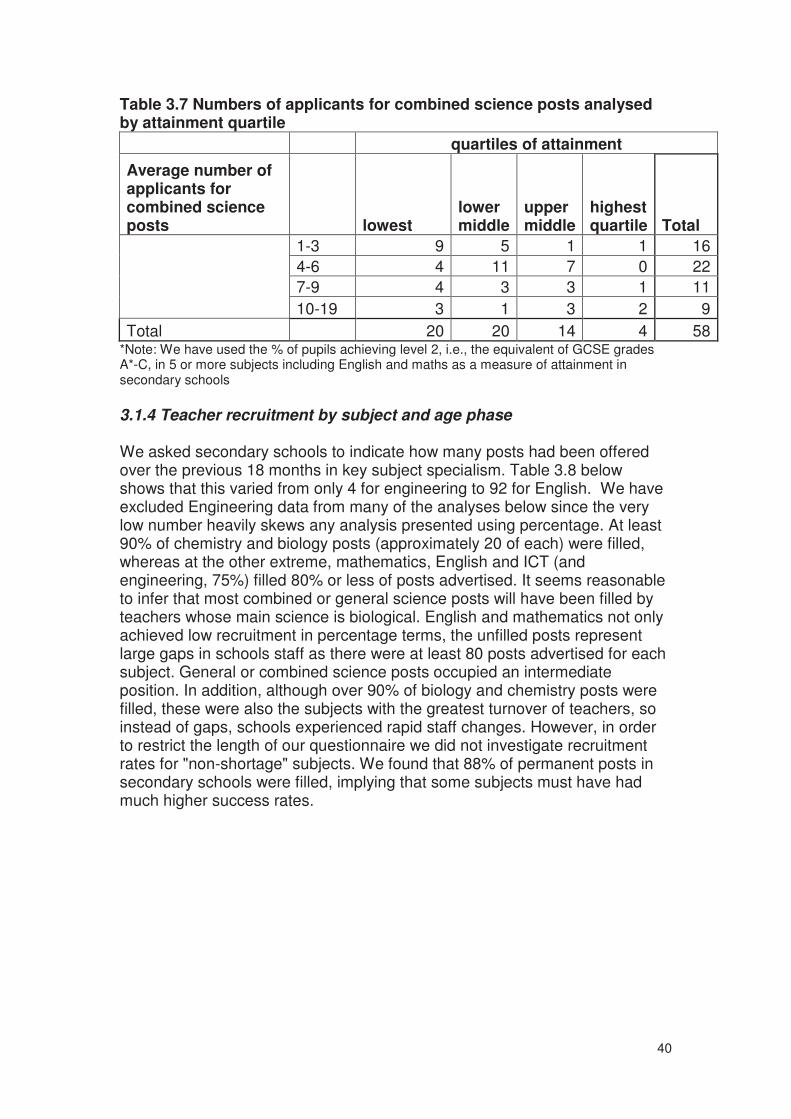
Table 3.7 Numbers of applicants for combined science posts analysed by attainment quartile
quartiles of attainment
Average number of applicants for combined science posts lowest
lower middle
upper middle
highest quartile Total
1-3 9 5 1 1 16
4-6 4 11 7 0 22
7-9 4 3 3 1 11
10-19 3 1 3 2 9
Total 20 20 14 4 58 *Note: We have used the % of pupils achieving level 2, i.e., the equivalent of GCSE grades A*-C, in 5 or more subjects including English and maths as a measure of attainment in secondary schools
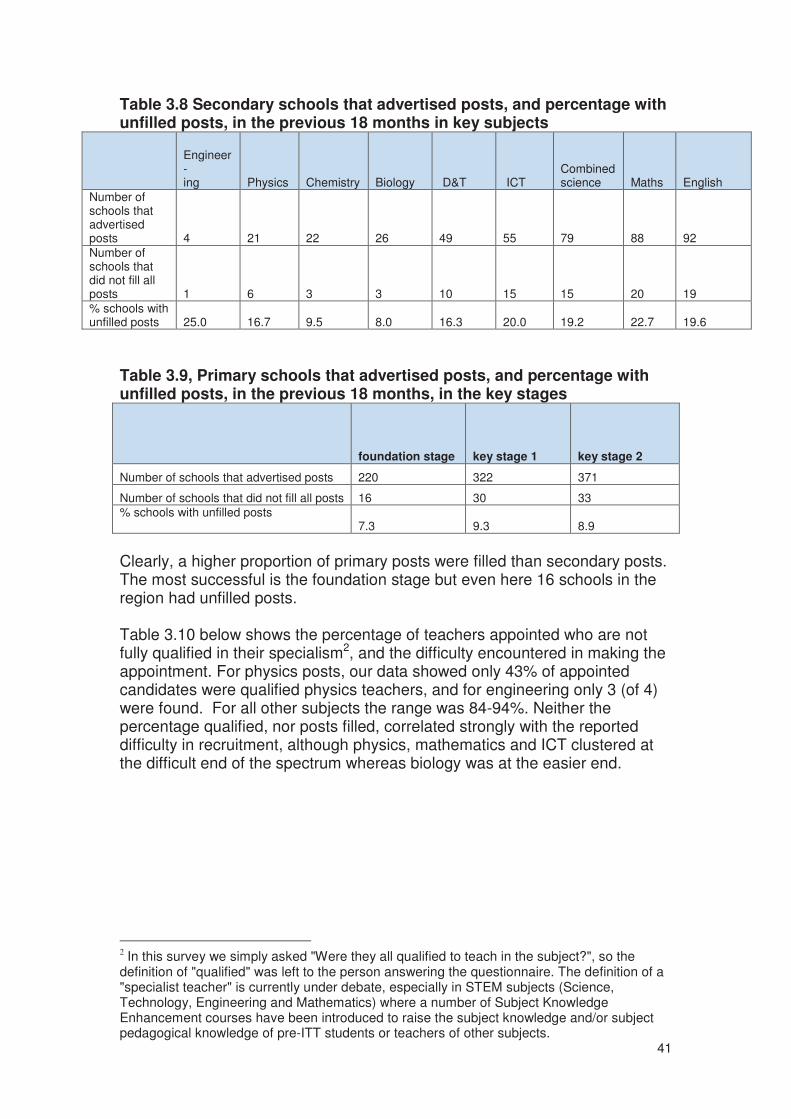
3.1.4 Teacher recruitment by subject and age phase We asked secondary schools to indicate how many posts had been offered over the previous 18 months in key subject specialism. Table 3.8 below shows that this varied from only 4 for engineering to 92 for English. We have excluded Engineering data from many of the analyses below since the very low number heavily skews any analysis presented using percentage. At least 90% of chemistry and biology posts (approximately 20 of each) were filled, whereas at the other extreme, mathematics, English and ICT (and engineering, 75%) filled 80% or less of posts advertised. It seems reasonable to infer that most combined or general science posts will have been filled by teachers whose main science is biological. English and mathematics not only achieved low recruitment in percentage terms, the unfilled posts represent large gaps in schools staff as there were at least 80 posts advertised for each subject. General or combined science posts occupied an intermediate position. In addition, although over 90% of biology and chemistry posts were filled, these were also the subjects with the greatest turnover of teachers, so instead of gaps, schools experienced rapid staff changes. However, in order to restrict the length of our questionnaire we did not investigate recruitment rates for "non-shortage" subjects. We found that 88% of permanent posts in secondary schools were filled, implying that some subjects must have had much higher success rates.
41
Table 3.8 Secondary schools that advertised posts, and percentage with unfilled posts, in the previous 18 months in key subjects
Engineer- ing
Physics Chemistry Biology D&T ICT
Combined science Maths English
Number of schools that advertised posts 4 21 22 26 49 55 79 88 92
Number of schools that did not fill all posts 1 6 3 3 10 15 15 20 19
% schools with unfilled posts 25.0 16.7 9.5 8.0 16.3 20.0 19.2 22.7 19.6
Table 3.9, Primary schools that advertised posts, and percentage with unfilled posts, in the previous 18 months, in the key stages
foundation stage key stage 1 key stage 2
Number of schools that advertised posts 220 322 371
Number of schools that did not fill all posts 16 30 33
% schools with unfilled posts 7.3 9.3 8.9
Clearly, a higher proportion of primary posts were filled than secondary posts. The most successful is the foundation stage but even here 16 schools in the region had unfilled posts. Table 3.10 below shows the percentage of teachers appointed who are not fully qualified in their specialism2, and the difficulty encountered in making the appointment. For physics posts, our data showed only 43% of appointed candidates were qualified physics teachers, and for engineering only 3 (of 4) were found. For all other subjects the range was 84-94%. Neither the percentage qualified, nor posts filled, correlated strongly with the reported difficulty in recruitment, although physics, mathematics and ICT clustered at the difficult end of the spectrum whereas biology was at the easier end.
2 In this survey we simply asked "Were they all qualified to teach in the subject?", so the
definition of "qualified" was left to the person answering the questionnaire. The definition of a "specialist teacher" is currently under debate, especially in STEM subjects (Science, Technology, Engineering and Mathematics) where a number of Subject Knowledge Enhancement courses have been introduced to raise the subject knowledge and/or subject pedagogical knowledge of pre-ITT students or teachers of other subjects.
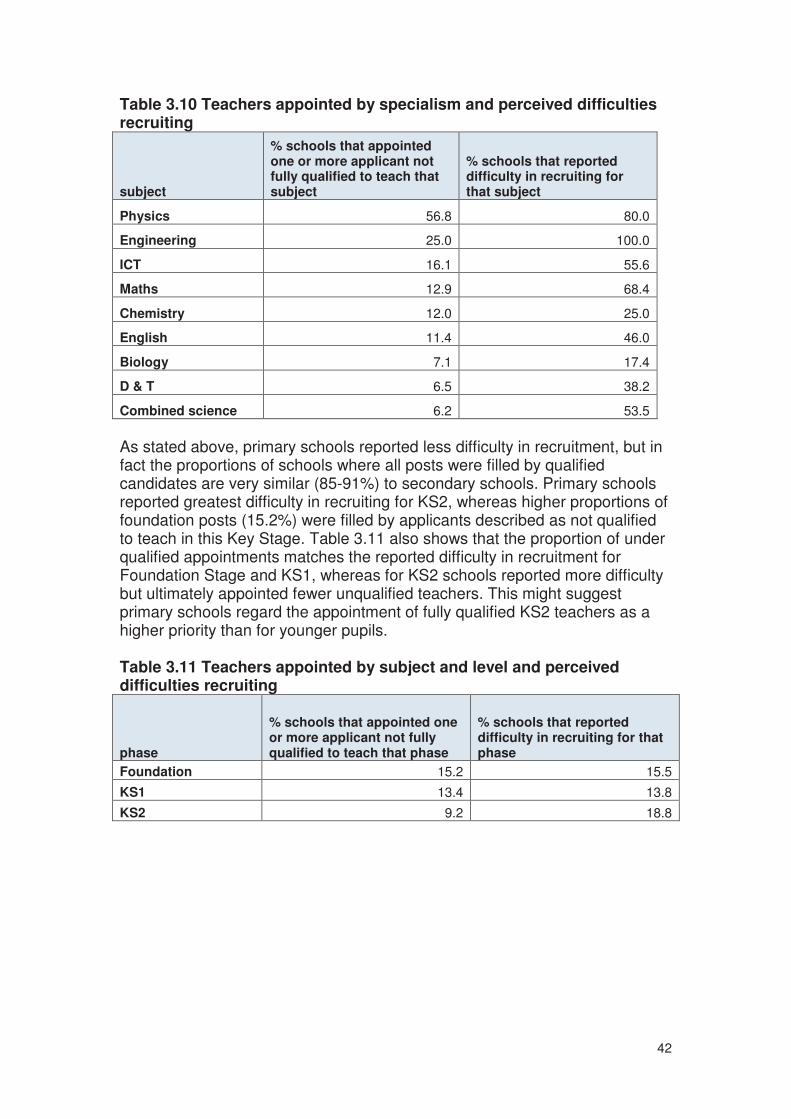
42
Table 3.10 Teachers appointed by specialism and perceived difficulties recruiting
subject
% schools that appointed one or more applicant not fully qualified to teach that subject
% schools that reported difficulty in recruiting for that subject
Physics 56.8 80.0
Engineering 25.0 100.0
ICT 16.1 55.6
Maths 12.9 68.4
Chemistry 12.0 25.0
English 11.4 46.0
Biology 7.1 17.4
D & T 6.5 38.2
Combined science 6.2 53.5
As stated above, primary schools reported less difficulty in recruitment, but in fact the proportions of schools where all posts were filled by qualified candidates are very similar (85-91%) to secondary schools. Primary schools reported greatest difficulty in recruiting for KS2, whereas higher proportions of foundation posts (15.2%) were filled by applicants described as not qualified to teach in this Key Stage. Table 3.11 also shows that the proportion of under qualified appointments matches the reported difficulty in recruitment for Foundation Stage and KS1, whereas for KS2 schools reported more difficulty but ultimately appointed fewer unqualified teachers. This might suggest primary schools regard the appointment of fully qualified KS2 teachers as a higher priority than for younger pupils. Table 3.11 Teachers appointed by subject and level and perceived difficulties recruiting
phase
% schools that appointed one or more applicant not fully qualified to teach that phase
% schools that reported difficulty in recruiting for that phase
Foundation 15.2 15.5
KS1 13.4 13.8
KS2 9.2 18.8

43
3.1.5 Teacher recruitment by attainment and pupil progress level
In terms of school characteristics, we first examined the relative difficulty of recruitment in relation to achievement (as measured by percentage of pupils gaining level 2 threshold including English and mathematics, or TAPS scores in primary schools) and progress (as measured by Contextual Value Added; below 1000 indicates poorer than expected progress, above 1000 indicates better than expected progress). As can be seen in the next two figures, in secondary schools both measurements show a similar picture, with the higher achieving schools (13.3% of the highest achieving quartile but 68.4% of the lowest achieving quartile reporting difficulty) and those with greater pupil progress experiencing less difficulty in recruitment and this is statistically significant. Figure 3.5 Difficulty in recruitment in relation to attainment (secondary schools) – difficult/not difficult
Figure 3.6 Difficulty in recruitment in relation to pupil progress (secondary schools) – difficult/not difficult
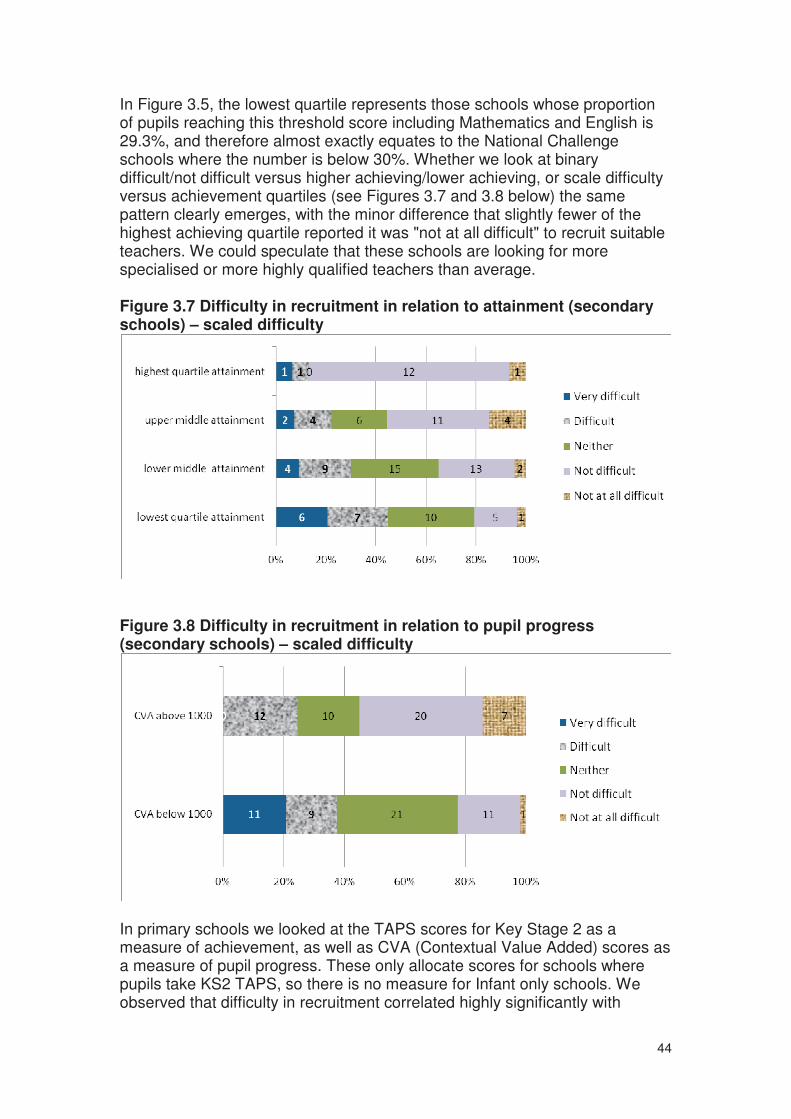
44
In Figure 3.5, the lowest quartile represents those schools whose proportion of pupils reaching this threshold score including Mathematics and English is 29.3%, and therefore almost exactly equates to the National Challenge schools where the number is below 30%. Whether we look at binary difficult/not difficult versus higher achieving/lower achieving, or scale difficulty versus achievement quartiles (see Figures 3.7 and 3.8 below) the same pattern clearly emerges, with the minor difference that slightly fewer of the highest achieving quartile reported it was "not at all difficult" to recruit suitable teachers. We could speculate that these schools are looking for more specialised or more highly qualified teachers than average. Figure 3.7 Difficulty in recruitment in relation to attainment (secondary schools) – scaled difficulty
Figure 3.8 Difficulty in recruitment in relation to pupil progress (secondary schools) – scaled difficulty
In primary schools we looked at the TAPS scores for Key Stage 2 as a measure of achievement, as well as CVA (Contextual Value Added) scores as a measure of pupil progress. These only allocate scores for schools where pupils take KS2 TAPS, so there is no measure for Infant only schools. We observed that difficulty in recruitment correlated highly significantly with

45
achievement, although it was less clearly associated with pupil progress (Figures 3.9 and 3.10 below). Figure 3.9 Difficulty in recruitment by attainment (primary schools)
*Note: We have used TAPS (Total Average Points Score) as a measure of attainment in primary schools
Figure 3.10 Difficulty in recruitment by pupil progress (primary schools)

46
3.1.6 Teacher recruitment and school population: deprivation and ethnic makeup In addition to looking at GCSE, TAPs and CVA, we examined the percentage of pupils eligible for Free School Meals (FSM), a proxy measure of social deprivation. We found 11% of schools with below average FSM intake and 16% of schools with above average FSM did not fill all their teaching posts (see Table 3.12). This has borderline statistical significance, however the findings do conform with other studies including our NQT study's findings (CEIR, 2008) that schools in low income communities have the most difficulties recruiting teachers. Table 3.12 Difficulties in filling all teaching posts by deprivation
Not all post filled All filled
% %
Below average FSM 33 11% 282 90%
Above average FSM 52 16% 272 84%
Table 3.13 Perceived difficulties in teacher recruitment by deprivation
Difficulties recruiting No difficulties
n % n %
Below average FSM 32 11% 273 90%
Above average FSM 67 27% 186 74%
There was a similar but more pronounced picture for perceived difficulties in recruitment. Here, we did find a statistically highly significant relationship between higher proportions of FSM and difficulty in recruitment. In schools with below average FSM, we found the number that described recruitment as difficult is almost exactly the number that failed to fill their posts. However, among schools with more deprived intakes a quarter said they had difficulty recruiting with around 16% having some unfilled posts. This emphasises that difficulties in recruitment extend beyond mere filling of vacancies to how they are filled and by whom. It is worth emphasising that these findings need to be approached with great care because schools with high FSM intake are not necessary a homogenous group. Their catchment patterns could differ in significant ways and the social and ethnic composition among them could be markedly distinct. In fact, although our findings indicate the additional problems of teacher recruitment in schools with high levels of deprivation as measured by eligibility of FSMs, they cannot explain the underlying reasons for this. There is of course a body of literature on this phenomenon (see for example, DCSF, 2005, Lupton, 2004, and Ingersoll, 2001). In addition, several of the schools in our Case Study sample were in this category. Of these, two members of the SLT team of School 4 and School 8, School 12 with a very high proportion of students eligible for FSMs noted the impact of perceived difficulties teaching pupils in these areas and associated external pressures:

47
" … Teachers are put off by our catchment area which is very deprived and has its own problems including students with low aspirations, extremely high unemployment rate, and high domestic violence…Not to mention teachers are under an enormous pressure to perform." "I am no stranger to the effort my staff put in. At the end of the day, I can see how warned out they are. Kids in our challenging school take a lot out of their teachers… I can tell you, it takes a lot to motivate them to achieve… This puts tremendous strain on our teachers. Teachers need to be given some incentive to work in SFCC. Schools at times are obliged to bend rules to provide some financial incentives to attract and help retain and reward good suitable teachers." "'It has been and still remains difficult (to recruit) because until we get a bright shiny building people are not going to want to come and work here."
We next turned to ethnic makeup in schools. Of the schools with a majority of Black and Minority Ethnic (BME) pupils, our survey found (see Table 3.14), 18% did not fill all advertised posts, compared with 12% of WB majority schools. This was not statistically significant. However, 35% of schools with a BME majority reported difficulty in recruiting teachers, compared with 16% of WB majority schools and this was statistically significant. This is not simply a reflection of deprivation, as the linear relation between %FSM and %BME is weak. These figures could indicate that teachers expect a school with a higher proportion of BME pupils to be more difficult to teach in, for a variety of reasons, for example higher proportions of pupils speaking English as an additional language. We have some evidence to support this from our qualitative data, for example one NQT told us about her experience:
"You can't walk through this door and have authority. You have to be tough and very able to teach an extremely large number of non English speaking students (out of her 27 students, she had 11 English speaking students). Ok, there are volunteers flocking our school offering their help from [our local ITT provider], but I don't think that is enough. I struggle to communicate with my students whom come from Poland, Iran, Yemen, Africa, etc. I have tried using visual aids- signing and gesturing to them, but I don't think I am getting anywhere. I have a teaching assistant with me, and she finds it impossible, too. I think the students need a lot more support than either I or my teaching assistant and the school can offer."

48
Table 3.14 Difficulties in filling all posts in schools by ethnic makeup
Not all post filled All filled
n % n %
WB majority 68 12% 485 88%
BME majority 9 18% 41 82%
Table 3.15 Perceived difficulties in recruitment by ethnic makeup
Difficult recruiting Not difficult
n % n %
WB majority 77 16% 418 84%
BME majority 12 35% 22 65%
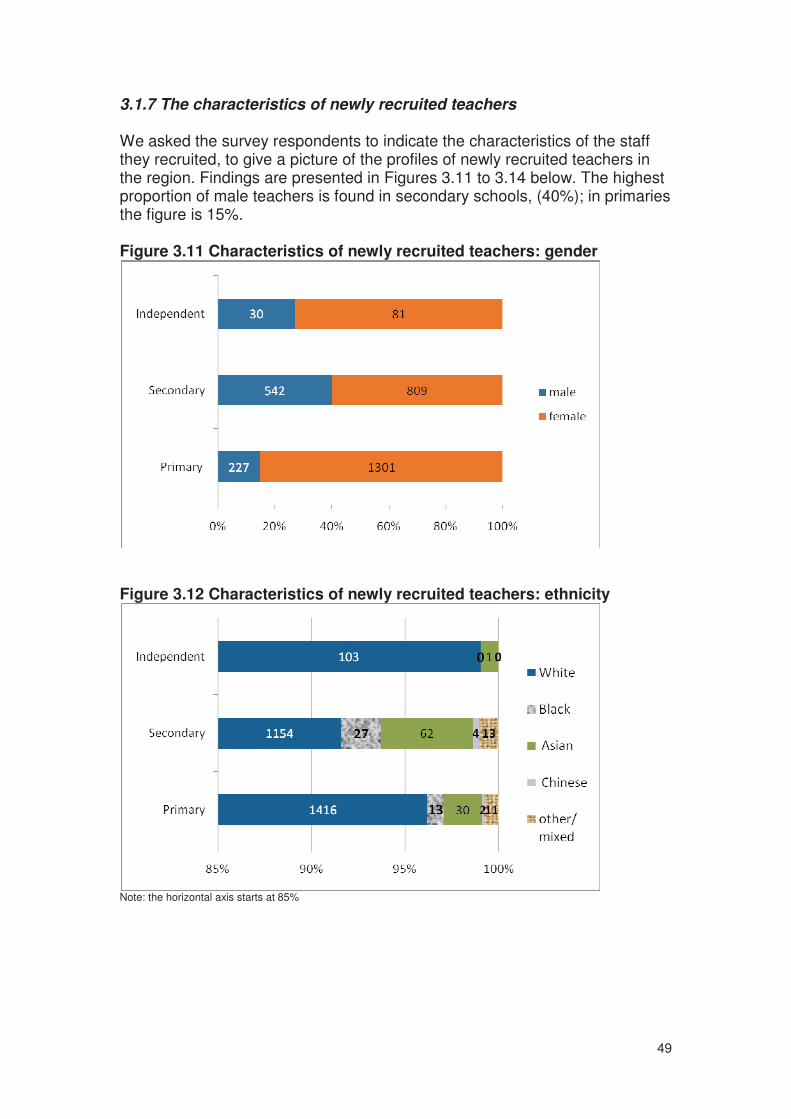
49
3.1.7 The characteristics of newly recruited teachers We asked the survey respondents to indicate the characteristics of the staff they recruited, to give a picture of the profiles of newly recruited teachers in the region. Findings are presented in Figures 3.11 to 3.14 below. The highest proportion of male teachers is found in secondary schools, (40%); in primaries the figure is 15%. Figure 3.11 Characteristics of newly recruited teachers: gender
Figure 3.12 Characteristics of newly recruited teachers: ethnicity
Note: the horizontal axis starts at 85%

50
Figure 3.13 Characteristics of newly recruited teachers: by age
Figure 3.14 Characteristics of newly recruited teachers: teaching experience
Some of these results are in line with what might be expected, such as higher proportions of female staff in primary schools, few over 55 years of age taking up new appointments, and more without formal teaching qualifications in independent schools. The age distribution of appointments is very similar in primary and secondary schools, but there does not appear to be any pattern in the amount of teaching experience. It is interesting to note that, of the three types of schools, the secondary schools took on the largest proportion of NQTs. The SLTs from 3 of our Case Study secondary schools (School 2, School 3, and School 5) discussed this. They noted that restricted budgets meant that schools have little option but to appoint the inexpensive NQTs. In addition, some headteachers added, NQTs are preferred because they bring in "a bit of flare" and "new blood" to schools. One SLT member said:

51
“As one goes out, you know budget wise and the head will always be thinking that ‘that is 12 thousand pounds saved straight away’ and if you see NQTs with the potential, the school will try to encourage them.”

52
3.1.8 The characteristics of the schools with unfilled posts
It is worth investigating, in this subsection, the characteristics of the schools that identified that they had unfilled posts. There were 85 such schools, and across the key characteristics of school type, deprivation of school intake, ethnic make-up, performance and progression in attainment, the group differs from the overall sample of schools as detailed in Box 3.1 below. On all school characteristics, schools with unfilled posts are more likely to be in a category associated with more deprived or difficult to teach intakes. There is a particularly high concentration of such schools in the primary category. However, for secondary schools it is clear that an additional factor affecting schools with a broader range of intakes is difficulty recruiting to particular subjects, specifically Physics and ICT. Box 3.1 Characteristics of schools with unfilled posts (SWUPs)
Our study found schools with unfilled posts to have particular characteristics such as:
• They are more two and half times more likely to be secondary schools compared with
our sample as a whole (35% of SWUPs compared with 14% of the full sample)
• They are 20% more likely to have higher than average entitlement to FSM (61% of
SWUPs compared with 50% of the full sample)
• They are over 50% more likely to be a majority BME school (11.7% of SWUPs
compared with 7.6% of the full sample)
• For primary schools, they are over 40% more likely to be in the lower half of schools
in terms of attainment measured by TAPs (73% of primary SWUPs compared with
51% of full sample primaries), and over 60% more likely to be in the bottom quarter
(40% of SWUP primaries, 25% of full sample primaries)
• For secondary schools, the difference is less stark - they are however still around
10% more likely to be National Challenge schools compared with the sample of
secondary schools as a whole
• For secondary schools, a key factor for such schools - whatever their intake - was
attracting teachers for key subjects, particularly Physics and ICT as can be seen in
the table below:
Percentage of schools able to fill all posts in key subjects
SWUPs Sample secondaries
Physics 62.5 83.3
D&T 87.7 83.7
Maths 79.9 77.3
English 82.7 80.4
ICT 52.5 80.0

53
3.1.9 Factors contributing to effective teacher recruitment We asked schools to identify any good practice in recruiting and/or retaining teachers. We tried - although this is sometimes difficult - to separate out the responses, and include here those pertaining to recruitment. Our data3 on factors contributing to teacher recruitment are presented in Figure 3.15 and Table 3.16 below: Figure 3.15 Successful teacher recruitment strategies by school level
Table 3.16 Successful teacher recruitment strategies by school level
These findings indicate that the most important set of strategies for good practice in recruitment revolved around putting time and effort into attracting and selecting the right candidates and "professionalising" the process. This included the value of advertising early, providing full and accurate information 3 Some schools listed several different points or comments in one reply, so the number of comments in
each category does not add up to the total number of respondents. In order to compare responses from primary and secondary, we converted them to both to percentages of the total number of schools of each phase that returned the survey, and of the numbers that replied to that question, but as the graphs were almost identical we have presented the data related only to those that replied to the relevant questions.
number of sec schools
% sec responses
number of pri schools
% pri responses
Team approach 1 2.6% 11 5.0%
Nice (rural) location or small school 1 2.6% 11 5.0%
Family friendly/ work life balance 1 2.6% 21 9.6%
Good facilities/ technology 2 5.3% 2 0.9%
Special local strategies 4 10.5% 4 1.8%
Good/excellent school reputation 5 13.2% 24 11.0%
Links with HEI (Higher Education Institutions) /ITT providers 7 18.4% 6 2.8%
Time and effort into recruitment 7 18.4% 37 17.0%
54
about the school, attending courses (some run by LAs (Local Authorities)) on successful or "safe" recruitment, devising thorough interviews and watching the candidates teach. Nearly one in five of respondents who replied to this question from both secondary and primary schools mentioned one or more of these (18.4% and 17% respectively). The item that showed the greatest difference between secondary and primary schools was the importance attributed to links with Teacher Training institutions, with 18.4% of secondary schools who responded to this question stating this was an important method of recruiting the right Newly Qualified Teachers (NQTs) compared with only 2.8% of responding primaries. This probably reflects the differences in size of schools; with a large secondary school having several trainee teachers on placement every year, and expecting to recruit some NQTs each year, whereas for primary schools, even if they have a trainee in the school each year, they will not have a job vacancy for them every year. It is apparent that some schools feel that they have no trouble in recruitment because of their reputation. In some cases this seems to relate merely to location (often rural, such as a small village primary school, (5% primaries)) but in others the schools actively promote their exam results and Ofsted reports as part of their recruitment publicity (13.2% of secondary schools, 11.0% primary schools) as well as to parents. Since we asked about "good practice" we have not acquired a representative sample of difficulties in recruitment - but some responses mentioned them anyway. We formed an impression that rural schools may have greater difficulty recruiting suitable staff but that, once in post, they have less problem with retention (see below), for example:
"Our problem is with advertising costs and the cost of local housing to attract suitable candidates to the area. Once here, they tend not to leave."
This would make sense in that fewer candidates live near to rural schools but, once they have made the decision to work in one (and possibly moved house and family to be near it) they are more likely to stay for many years. On the other hand, there are schools with particular local difficulties that they tackle head on. Strategies mentioned were employing NQTs from June as Teaching Assistants (TAs) to familiarise them with the school, seconding teachers from elsewhere in the LA, altering the school year or day to better meet the needs of the staff, and training up TAs "in-house" to Qualified Teacher Status (QTS). However, each of these approaches is only being used by one or two schools at most. Some even managed to offer higher salaries to meet particular needs, such as advertising for Advanced Skills Teachers (AST) in certain subjects, or restructuring the salary scheme as part of their transition to becoming an academy. Provision of good facilities is clearly an important attraction, since appropriate equipment makes teaching a number of subjects more successful. Some teachers may be attracted by shiny high-tech provision, but all teachers need a minimum of decent equipment and most will be able to teach better if

55
facilities are better than minimal. Good school equipment also shows that a school either invests in teaching resources or takes care of what they have already, both of which make statements about the nature of the school. In view of the fact that a teaching post ostensibly fits well with parental responsibilities, it is notable how many primary schools (9.6%) emphasised their family-friendliness or attention to work/life balance. It is also notable that, by contrast, only one secondary school mentioned this. The phrase "team approach" was used in a range of slightly different contexts, from actual team-teaching, to classroom teams of a teacher plus a TA, to a looser definition where the school staff are perceived as one or more teams working together to teach their pupils. However, we have tried to separate a "team approach" from a "friendly working environment", which we regard as more significant for retention than recruitment. Team work was mentioned by 5% of primary schools but only one secondary school.

56
3.2 Teacher retention Key points
• Only 5% of schools perceived they had a problem with teacher retention, indicating that it is not a major problem across the region in general terms.
• However, schools in more deprived circumstances perceived greater difficulties, and so did schools with high levels of BME students (although this was not statistically significant).
• Secondary schools were more likely to perceive difficulties in retention compared with primaries.
• Looking at staff turnover in the past 18 months, schools reported a turnover rate of about 16% of staff during this period.
• There were higher turnover rates at KS1 and 2 compared with Foundation Stage in primary schools.
• The highest turnover rate in key subjects in secondary schools were in Biology and Chemistry; the lowest in ICT (Information and Communication Technology) and D&T.
• Schools in both primary and secondary schools with low levels of attainment and progression had more retention problems.
• Reasons given by SLT members for teachers leaving were dominated by retirement, promotion or other teaching jobs.
• Factors associated with positive retention included key relationships between teachers and the school, positive school ethos, support and opportunities for development and promotion.
• Factors associated with push factors to leave the profession were dominated by workload and government initiatives, poor reputation and lack of development opportunities and support.
• These issues support the view from the literature that institutional culture especially supportive, developmental cultures are very important in retaining motivated teachers suited to the job and school.
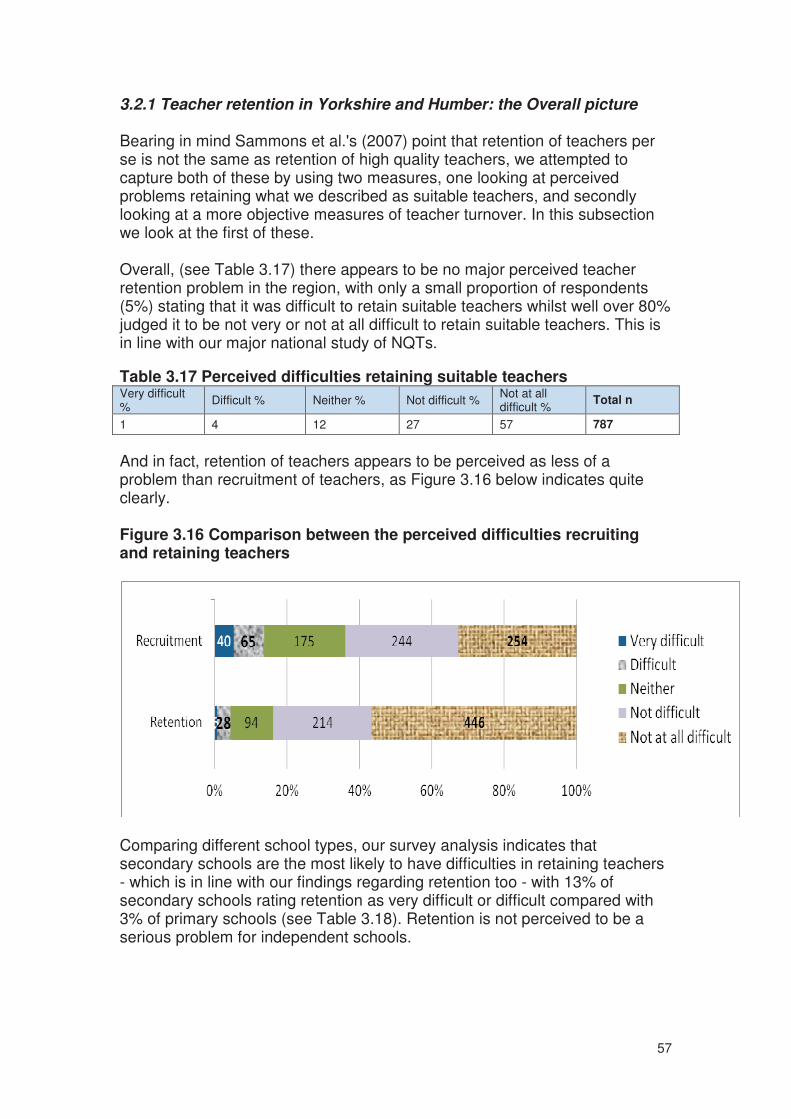
57
3.2.1 Teacher retention in Yorkshire and Humber: the Overall picture Bearing in mind Sammons et al.'s (2007) point that retention of teachers per se is not the same as retention of high quality teachers, we attempted to capture both of these by using two measures, one looking at perceived problems retaining what we described as suitable teachers, and secondly looking at a more objective measures of teacher turnover. In this subsection we look at the first of these. Overall, (see Table 3.17) there appears to be no major perceived teacher retention problem in the region, with only a small proportion of respondents (5%) stating that it was difficult to retain suitable teachers whilst well over 80% judged it to be not very or not at all difficult to retain suitable teachers. This is in line with our major national study of NQTs.
Table 3.17 Perceived difficulties retaining suitable teachers Very difficult %
Difficult % Neither % Not difficult % Not at all difficult %
Total n
1 4 12 27 57 787
And in fact, retention of teachers appears to be perceived as less of a problem than recruitment of teachers, as Figure 3.16 below indicates quite clearly. Figure 3.16 Comparison between the perceived difficulties recruiting and retaining teachers
Comparing different school types, our survey analysis indicates that secondary schools are the most likely to have difficulties in retaining teachers - which is in line with our findings regarding retention too - with 13% of secondary schools rating retention as very difficult or difficult compared with 3% of primary schools (see Table 3.18). Retention is not perceived to be a serious problem for independent schools.

58
Table 3.18 Perceived difficulties retaining teachers and school level
Level Very difficult
% Difficult % Neither %
Not difficult %
Not at all difficult %
Total n
Primary 0 3 9 25 63 655
Secondary 3 10 29 37 21 108
Independent 0 0 17 33 50 24
* Expected cell count too low to test for significance
As with recruitment, our data indicates that schools in North East Lincolnshire were the most likely to report problems with retention, 12% of schools in this LA rated retention as either very difficult or difficult. None of the schools in York rated retention as difficult (see Figure 3.17 below). Figure 3.17 Perceived difficulties in retention by schools, analysed by LA
Respondents were asked to give figures on the number of teachers in their school overall and by subject and the number of teachers who have left their school in the last 18 months. From these figures an overall turnover rate (i.e. the percentage of staff leaving in the last 18 months) was calculated. The average percentage of teachers leaving in the last 18 months was 16%.4 We asked about turnover in our Case Studies too. They noted that turnover varied year on year depending on student intake, teacher resignations and notice being given for maternity, illness, and retirement.
4 Although there have been few studies to compare this rate, the largest recent series of
studies – conducted by Smithers and Robinson (2003, 2004, 3005) - found a turnover rate of around 10-12% per year, which is in line with an 18 month turnover rate of 16%

59
Literature indicates, of course, that whilst low staff turnover may be viewed positively, it can equally cause problems if there is no opportunity for new ideas and approaches to come into the school as Ingersoll (2001:504) notes. Effective organisations, as Ingersoll puts it, need to both promote and benefit from some degree of turnover by getting rid of low performers and bringing in new blood to ease innovation. In fact, when teachers and some members of the SLTs in our case studies were asked to comment on their teacher turnover figures, they said.
• For School 11 which is classed as a good average size primary school
located in a leafy comfortable suburb, catering for middle class
families, high teacher turnover is the result of natural wastage such as
maternity leave.
• For School 8 which is a challenging but improving small secondary
school located in the most economically and socially deprived area in
the UK within the highest quartile of FSM, high teacher turnover is the
result of a combination of: (1) staff leaving the profession after realising
teaching is not for them, (2) staff seeking promotion opportunities
elsewhere and (3) staff struggling to cope with students' misconduct.
• For School 4 which is a smaller than average National Challenge
secondary school with occasional racially motivated fights breaking out
in school, the problems retaining teachers adds to their difficulties
recruiting teachers. Teacher turnover, according to experienced
teachers and NQTs, are: (1) staff struggling to cope with student
misconduct and students’ lack of aspiration; (2) unreasonable
workload; (3) feelings of being undervalued and disempowered and (4)
an inability to cope with constant change and unresponsive and
unsympathetic leaders.
• For School 7, which is a challenging larger than average primary
school located in the suburbs with a mix of NQTs and well established
teachers, teacher turnover was attributed to NQTs leaving their school
after completing their first induction year for what they see as a more
vibrant catchment area.
For School 1, the high rates of teacher turnover were due to natural wastage, but for Schools 4, 7, and 8 problems relating to school leadership and pupil behaviour dominated.

60
3.2.2 Teacher retention by subject and level By comparing staff in different key stages and subject departments with those leaving the school from these key stages and departments, we were able to calculate turnover rates at this level. In primary schools, we found a slightly higher turnover rate at Key Stage 2 compared with Foundation stage; an average of 24% of teachers left at Key Stage 2 compared with an average of 18% at Foundation stage. Table 3.19 Turnover rates for different key stages Stages percentage turnover
1. Foundation stage 18
2. Key stage 1 21
3. Key stage 2 24
Looking at turnover rates in secondary schools for key subjects, we found (see Table 3.20) - perhaps surprisingly - that the highest turnover rate was for Biology teachers with an average of 30% of teachers leaving in the past 18 months, compared with the lower rate of 13% for Design and Technology teachers left. Only a small proportion (3%) of Engineering teachers had left, however this figure should be treated with caution since there were only 11 responses to this question. Table 3.20 Turnover rates for key subjects
Subject Area % Turnover rate N
1. Biology 30 35
2. Chemistry 25 34
3. Maths 21 90
4. English 21 92
5. Science combined/General Science 20 76
6. Physics 19 34
7. ICT 17 81
8. Design and Technology 13 76
9. Engineering 3 11
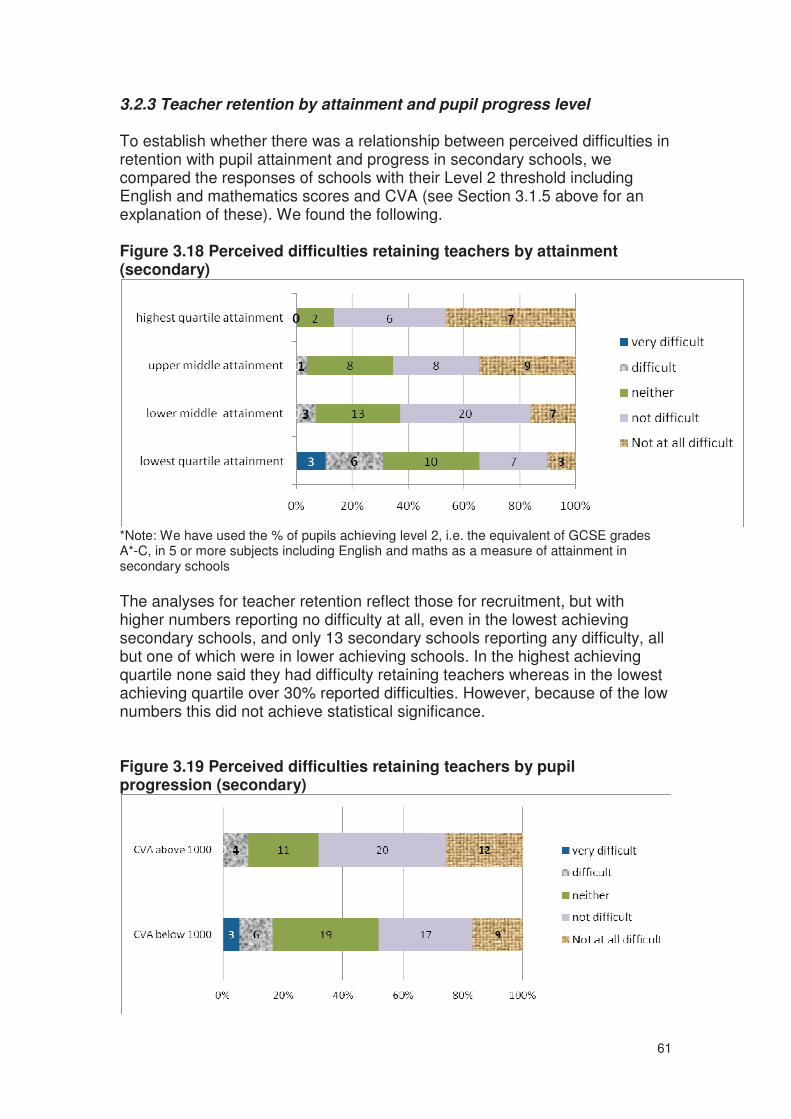
61
3.2.3 Teacher retention by attainment and pupil progress level To establish whether there was a relationship between perceived difficulties in retention with pupil attainment and progress in secondary schools, we compared the responses of schools with their Level 2 threshold including English and mathematics scores and CVA (see Section 3.1.5 above for an explanation of these). We found the following. Figure 3.18 Perceived difficulties retaining teachers by attainment (secondary)
*Note: We have used the % of pupils achieving level 2, i.e. the equivalent of GCSE grades A*-C, in 5 or more subjects including English and maths as a measure of attainment in secondary schools
The analyses for teacher retention reflect those for recruitment, but with higher numbers reporting no difficulty at all, even in the lowest achieving secondary schools, and only 13 secondary schools reporting any difficulty, all but one of which were in lower achieving schools. In the highest achieving quartile none said they had difficulty retaining teachers whereas in the lowest achieving quartile over 30% reported difficulties. However, because of the low numbers this did not achieve statistical significance. Figure 3.19 Perceived difficulties retaining teachers by pupil progression (secondary)

62
Only 19 out of over 540 primary schools for which we have TAPs (achievement) scores reported any difficulty with teacher retention. Ten of these include both of those that reported it was "very difficult" were schools in the lowest quartile of TAPS (Total Average Points Score), which was statistically highly significant. There was also an association with pupil progress (CVAMEA below 1000 - data not shown). Figure 3.20 Perceived difficulties retaining teachers by attainment (primary)
*Note: We have used TAPS (Total Average Points Score) as a measure of attainment in primary schools

63
3.2.4 Teacher retention and school population: deprivation and ethnic makeup When we look at differences in views of retention by deprivation using our FSM measure (Figure 3.21 below), we see that a higher proportion of respondents in the more deprived schools perceive that they find it difficult retaining teachers compared with those in the least deprived schools (10% and 1% respectively). This was found to be statistically significant.
Figure 3.21 Perceived difficulties retaining teachers in schools by deprivation
Our data also showed (Table 3.21 below), a slightly higher proportion of respondents in schools with a BME majority reported difficulties in retention compared with schools with a WB majority (8% and 4% respectively).
Table 3.21 Perceived difficulties retaining teachers and ethnicity
Very difficult
% Difficult % Neither %
Not difficult %
Not at all difficult %
Total n
WB majority 1 3 11 27 59 647
BME Majority 0 8 21 27 44 52
* Expected cell count too low to test for significance
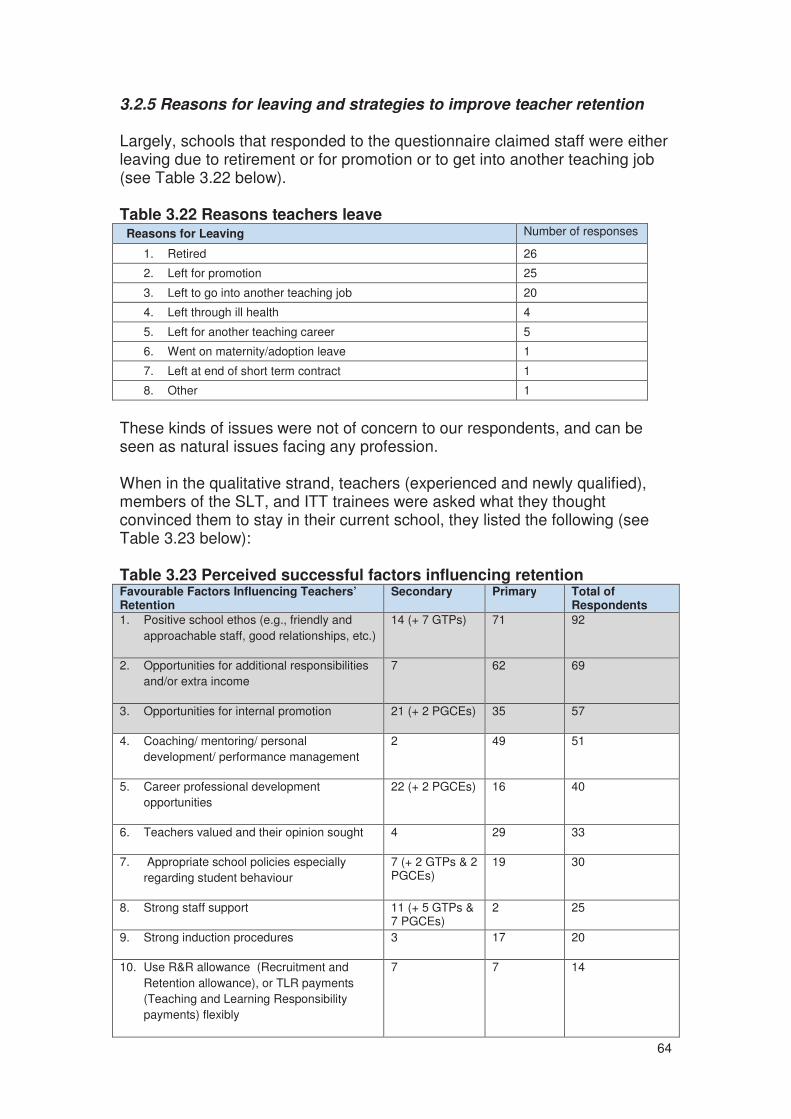
64
3.2.5 Reasons for leaving and strategies to improve teacher retention Largely, schools that responded to the questionnaire claimed staff were either leaving due to retirement or for promotion or to get into another teaching job (see Table 3.22 below). Table 3.22 Reasons teachers leave Reasons for Leaving Number of responses
1. Retired 26
2. Left for promotion 25
3. Left to go into another teaching job 20
4. Left through ill health 4
5. Left for another teaching career 5
6. Went on maternity/adoption leave 1
7. Left at end of short term contract 1
8. Other 1
These kinds of issues were not of concern to our respondents, and can be seen as natural issues facing any profession. When in the qualitative strand, teachers (experienced and newly qualified), members of the SLT, and ITT trainees were asked what they thought convinced them to stay in their current school, they listed the following (see Table 3.23 below): Table 3.23 Perceived successful factors influencing retention Favourable Factors Influencing Teachers’ Retention
Secondary Primary Total of Respondents
1. Positive school ethos (e.g., friendly and
approachable staff, good relationships, etc.)
14 (+ 7 GTPs) 71 92
2. Opportunities for additional responsibilities
and/or extra income
7 62 69
3. Opportunities for internal promotion 21 (+ 2 PGCEs) 35 57
4. Coaching/ mentoring/ personal
development/ performance management
2 49 51
5. Career professional development
opportunities
22 (+ 2 PGCEs) 16 40
6. Teachers valued and their opinion sought 4 29 33
7. Appropriate school policies especially
regarding student behaviour
7 (+ 2 GTPs & 2 PGCEs)
19 30
8. Strong staff support 11 (+ 5 GTPs & 7 PGCEs)
2 25
9. Strong induction procedures 3 17 20
10. Use R&R allowance (Recruitment and
Retention allowance), or TLR payments
(Teaching and Learning Responsibility
payments) flexibly
7 7 14

65
11. School location 4 GTPs & 6 PGCEs
1 11
12. ‘Reasonable’ workload 2 (+ 6 GTPs) 1 9
13. Strong leadership 4 1 5
14. Size of school and teaching staff 1 (+ 2 PGCEs) 1 4
15. Teacher autonomy and opportunity to
innovate
2 1 3
16. Pupils relate well with staff 2 1 3
17. Adequate school facilities and resources 1 (+ 2 BScs) 0 3
18. Strong relations with the community 1 1 2
19. Strong relations with other schools 0 1 1
20. Strong relations with the LA 1 0 1
Clearly, the key to retention according to our sample is linked to key relationships between teachers and the school; notably school ethos, opportunity for promotion development and extra responsibilities had a positive effect on retention rates. Wider relationships - with the community, the LA and other schools - are not seen as so important. Teachers, especially in primary schools, mentioned various factors that make up what they call their school ethos such as shared "Christian values," supportive head with a strong "Leadership vision," "warm and friendly environment," and staff interest in the social and cultural development of students. The following are excerpts of what some had to say:
"So many of the staff really do care about the children and have their best interest at heart educationally and pastorally. They are interested in the whole child really and I think they go the extra mile to support them if they can.” (School 2) "The headteacher does not dictate how things ought to be lead for that reason the heads of area think they are valued." (School 1) "It's the Christian ethos and the leadership vision which has helped retain some members of the teaching staff and the fact that the school has a transparent strong conduct of behaviour and standards of achievement makes it an attractive place to work and stay." (School 8) "It's the school ethos, the environment, the vibe you get when you walk through the door… Staff are very respectful and trustworthy. They are tremendously helpful and considerate to others. The school has a very helpful

66
behaviour policy that seems to prove fruitful almost all the time." (School 3)
Likewise, as is apparent from the above table, some stakeholders put a strong emphasis on the importance of offering opportunities for extra responsibilities and/ or extra income featured in various ways. In some, mainly secondary schools, respondents spoke of policies of rotating responsibility amongst staff, allowances to enable teachers to develop additional skills, and financial rewards for staff opting to run after school clubs or driving a minibus.
The other development-orientated strategies mentioned, such as coaching/ mentoring/ personal development/ performance management, valuing individuals, appropriate school policies, and strong induction were all mentioned more by primary than secondary schools. These activities mainly reflect personal interactions among staff and school "ethos", which can be more easily managed within a smaller staff group. Planning, Preparation and Assessment (PPA) time, an allowance of non-teaching time specifically provided to primary schools can be allocated according to individual needs within schools.
A small group of schools (7 secondary and 19 primary) made reference to school policies, especially behaviour policies. In some of these the emphasis was on staff agreement over policies, and not rushing from one policy to the next, whereas in others the emphasis was on implementation of consistent behaviour systems. Surprisingly, a modest number of schools (7 secondary and 7 primary) made reference to R&R allowance (including Golden Hello payments - 1 secondary) to difficult to staff subjects such as mathematics, and TLR payments. None of these schools, our data shows, is in a recognised "deprived area", though they have a range of FSM pupils (1st to 3rd quartile but none in highest quartile), and they have an average proportion of pupils of white British ethnicity (94%-99%). They are distributed across the region, from LAs with quite high levels of deprivation to those with the least deprivation. All have CVA scores above 1000 (>100 for the primary), and none is in the lowest quartile of attainment as measured by TAPS/GCSE (General Certificate of Secondary Education) scores. All five described their problems with recruitment as difficult or very difficult, and two had not filled all their advertised posts. Almost the only characteristic they have in common is that none of them is in a city, with some being quite rural. Overall, our case study respondents indicated that what is needed to help retain teachers is a professional learning community that fosters a positive, strong ethos that readily shares what it knows that promotes continuous learning; and that encourages collaboration and support between colleagues. A community whose leaders are, as 3 secondary school teachers said, “approachable,” “down to earth,” and has clear systems in place (such as a strong behaviour policy and induction support for NQTs (Newly Qualified Teachers)) to deal with misconduct and help nurture teachers.
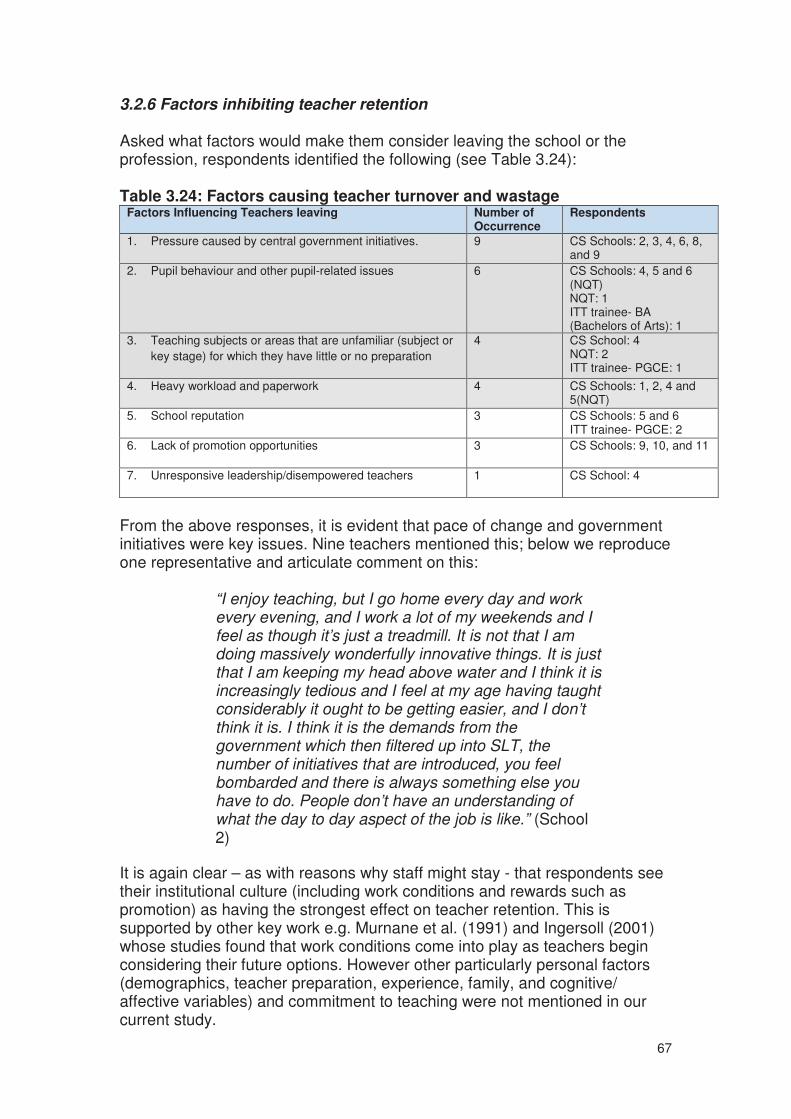
67
3.2.6 Factors inhibiting teacher retention Asked what factors would make them consider leaving the school or the profession, respondents identified the following (see Table 3.24): Table 3.24: Factors causing teacher turnover and wastage
Factors Influencing Teachers leaving Number of Occurrence
Respondents
1. Pressure caused by central government initiatives. 9 CS Schools: 2, 3, 4, 6, 8, and 9
2. Pupil behaviour and other pupil-related issues 6 CS Schools: 4, 5 and 6 (NQT) NQT: 1 ITT trainee- BA (Bachelors of Arts): 1
3. Teaching subjects or areas that are unfamiliar (subject or
key stage) for which they have little or no preparation
4 CS School: 4 NQT: 2 ITT trainee- PGCE: 1
4. Heavy workload and paperwork 4 CS Schools: 1, 2, 4 and 5(NQT)
5. School reputation 3 CS Schools: 5 and 6 ITT trainee- PGCE: 2
6. Lack of promotion opportunities 3 CS Schools: 9, 10, and 11
7. Unresponsive leadership/disempowered teachers 1 CS School: 4
From the above responses, it is evident that pace of change and government initiatives were key issues. Nine teachers mentioned this; below we reproduce one representative and articulate comment on this:
“I enjoy teaching, but I go home every day and work every evening, and I work a lot of my weekends and I feel as though it’s just a treadmill. It is not that I am doing massively wonderfully innovative things. It is just that I am keeping my head above water and I think it is increasingly tedious and I feel at my age having taught considerably it ought to be getting easier, and I don’t think it is. I think it is the demands from the government which then filtered up into SLT, the number of initiatives that are introduced, you feel bombarded and there is always something else you have to do. People don’t have an understanding of what the day to day aspect of the job is like.” (School 2)
It is again clear – as with reasons why staff might stay - that respondents see their institutional culture (including work conditions and rewards such as promotion) as having the strongest effect on teacher retention. This is supported by other key work e.g. Murnane et al. (1991) and Ingersoll (2001) whose studies found that work conditions come into play as teachers begin considering their future options. However other particularly personal factors (demographics, teacher preparation, experience, family, and cognitive/ affective variables) and commitment to teaching were not mentioned in our current study.

68
It would be interesting and certainly beneficial if one could research leavers' views on their actual reasons for migrating or leaving the teaching profession. This to some extent will not only help develop a profile of movers and leavers, but it will also help put effective support strategies in place for schools and teachers to reduce attrition and turnover. It worth noting here that, the participants in this study and indeed other researchers have a split view on the value of monetary incentives (such as Golden Handcuffs and retention allowances). For example, on one hand researchers (see for example, Murname and Olsen, 1999; and Dalton and Van der Klaaumi, 1999) and 6 headteachers and deputy and assistant headteachers in this study (School 3, 4, 5, 6, 8, and 9) believe offering financial incentives can help attract teacher recruits and help prolong their service in the school. On the other hand, 3 experienced secondary school teachers (School 4, 8, and 9) believe such a variable can do little to entice them to remain if other factors such as, the change of pace and manner of change by government initiatives and lack of staff support intervened. In fact, in our study, 1 experienced recently appointed secondary mathematics teacher (School 2) spoke of her decision to leave her previous challenging school and abandon her large pay for a more supportive school. Describing her decision, she said:
“I had landed a permanent post in another city that was very inappropriate for me despite it being a church school and a position of responsibility in the mathematics department. The school was put in special measures a year later, and 2 members of the SLTs were suspended pending investigation for bullying. It was an awful school… The students were very difficult and it was struggling to recruit and keep its teachers. The school was relying on supply teachers because half of the staff have left. The school was a troubled school. I then realised my quality of life was more important than the financial rewards offered to me, and I left the school. I took advice from other teachers and I applied to this lovely calm and much better school. I am on a basic grade now, but then my quality of life is more important… Everyone here is very supportive and very approachable and lovely.”

69
SECTION FOUR: SENIOR SCHOOL LEADER RECRUITMENT
Key points
• 193 primary and 49 secondary schools in our sample – 31% of primary schools and 45% of secondary schools – had recruited a member of the school leadership team over the previous 18 months. 24 of 333 posts across these schools (around 7%) remained unfilled.
• There were indications that more deprived schools, schools with large numbers of BME students, schools with lower attainment and progression had more difficulties recruiting senior leaders, but further research would be needed to investigate these issues further.
• A range of strategies were in place in LAs to support senior leader recruitment and retention including systematic, LA-led reviews of needs for each HT vacancy; advice services offered by LA recruitment teams; comprehensive induction programmes; offering broader leadership opportunities to experienced leaders.
According to the National College for School Leadership (NCSL) (2006), in 2005/06 around a quarter of secondary and a third of primary schools failed to fill their headship posts at the first round, noting that there are two main inter-related factors at work. One is purely demographic- there are simply not enough headteachers to go around. In fact, it is anticipated that the difficulties recruiting headteachers will worsen between 2009 and 2011 with many heads retiring. The other factor is school catchment area, with disadvantaged schools generally having the most difficulty recruiting headteachers. It is reasonable to assume that whilst the first of these factors is less of a problem for senior leadership posts below Headship, the second will still obtain (where there is greater supply and fewer pressures, although these are still considerable).
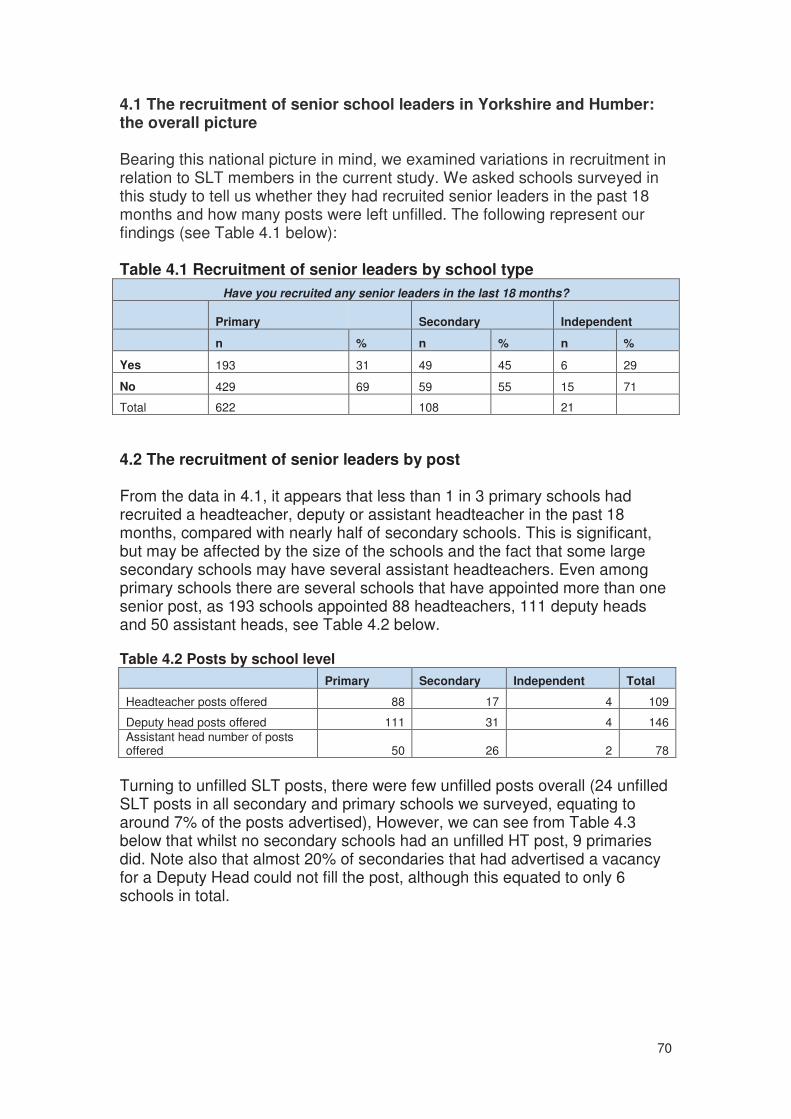
70
4.1 The recruitment of senior school leaders in Yorkshire and Humber: the overall picture Bearing this national picture in mind, we examined variations in recruitment in relation to SLT members in the current study. We asked schools surveyed in this study to tell us whether they had recruited senior leaders in the past 18 months and how many posts were left unfilled. The following represent our findings (see Table 4.1 below): Table 4.1 Recruitment of senior leaders by school type
Have you recruited any senior leaders in the last 18 months?
Primary Secondary Independent
n % n % n %
Yes 193 31 49 45 6 29
No 429 69 59 55 15 71
Total 622 108 21
4.2 The recruitment of senior leaders by post From the data in 4.1, it appears that less than 1 in 3 primary schools had recruited a headteacher, deputy or assistant headteacher in the past 18 months, compared with nearly half of secondary schools. This is significant, but may be affected by the size of the schools and the fact that some large secondary schools may have several assistant headteachers. Even among primary schools there are several schools that have appointed more than one senior post, as 193 schools appointed 88 headteachers, 111 deputy heads and 50 assistant heads, see Table 4.2 below. Table 4.2 Posts by school level
Primary Secondary Independent Total
Headteacher posts offered 88 17 4 109
Deputy head posts offered 111 31 4 146
Assistant head number of posts offered 50 26 2 78
Turning to unfilled SLT posts, there were few unfilled posts overall (24 unfilled SLT posts in all secondary and primary schools we surveyed, equating to around 7% of the posts advertised), However, we can see from Table 4.3 below that whilst no secondary schools had an unfilled HT post, 9 primaries did. Note also that almost 20% of secondaries that had advertised a vacancy for a Deputy Head could not fill the post, although this equated to only 6 schools in total.

71
Table 4.3 Unfilled SLT posts by school type (frequency and percentage of schools requiring posts unable to fill them)
School Type Headteacher Deputy head Assistant head
n % n % n %
Primary 9 10 4 4 3 6
Secondary 0 0 6 19 2 8
4.3 The recruitment of senior leaders and school population: deprivation and ethnic makeup When we look at differences between more and less deprived schools, and by ethnic makeup, (see Tables 4.4 and 4.5 below), there are few differences, except that it appears – although this is not statistically significant given small numbers - that DH (Deputy Head) and AH (Assistant Head) posts are more difficult to fill in more deprived schools. The numbers are so small in relation to schools with BME majority that it is not possible to comment on these findings other than to note they indicate that BME majority schools have higher proportions of unfilled leadership posts, and this result is worthy of further research. Table 4.4 Unfilled SLT posts by FSM (frequency and percentage of schools requiring posts unable to fill them)
Deprivation Headteacher Deputy head Assistant head
n % n % n %
Above average FSM 3 6 7 9 5 13
Below average FSM 5 10 3 4 0 0
Table 4.5: Unfilled SLT posts by school ethnic makeup (frequency and percentage of schools requiring posts unable to fill them)
Ethnic makeup Headteacher Deputy head Assistant head
n % n % n %
WB (White British) majority 5 5 8 6 2 3
BME majority 1 20 2 25 3 33

72
4.4 The recruitment of senior leaders, analysed by LA Looking at senior leadership posts advertised and unfilled within different LAs, (Table 4.6 below) it is again very hard to make judgements due to the small numbers. However, it does appear that some authorities did have particular problems, and that this affected areas that had higher numbers of posts advertised in general. Whether this just means that all have filled a similar percentage of posts, or whether it implies that some LAs have a high turnover of senior staff, and a greater number of unfilled positions, is unclear from these figures. Again, this suggests further investigation in the LAs that appear most affected.
Table 4.6 Leadership posts advertised by schools in each LA
Local Authority
Headteachers advertised
Deputy heads advertised
Assistant heads advertised
Not all filled Total
Not all filled Total
Not all filled Total
n % n % n %
Barnsley 0 0 3 1 17 6 0 0 7
Bradford 2 25 8 3 19 16 1 10 10
Calderdale 0 0 8 0 0 7 1 17 6
Doncaster 0 0 8 2 17 12 1 20 5
East Riding of Yorkshire 1 8 13 0 0 6 0 0 7
Kingston Upon Hull City 0 0 6 1 14 7 - - 0
Kirklees 0 0 4 0 0 11 0 0 2
Leeds 1 17 6 0 0 13 0 0 7
North East Lincolnshire - - 0 0 0 2 0 0 3
North Lincolnshire 1 17 6 0 0 7 0 0 3
North Yorkshire 2 13 16 1 10 10 0 0 8
Rotherham 0 0 5 0 0 14 1 50 2
Sheffield 1 9 11 2 12 17 1 9 11
Wakefield 1 8 13 0 0 9 0 0 4
York 0 0 2 0 0 7 - - 0
Total 9 - 109 10 - 144 5 - 75
*Note - The cells with dashes in the table refer to schools that responded to the questionnaire but they did not have any advertised senior posts.
Bearing in mind the caveats above, as with recruitment of teachers in general, the more urban LAs, particularly Sheffield and Bradford, had not only high numbers of posts advertised but also the most difficulty filling them. The LAs and the schools themselves are of course aware of these issues. LA staff interviewed discussed strategies to deal with the issues including:
1. Systematic review of every headteacher vacancy and consideration of the most appropriate approach, including considering new leadership models such as federations and executive headship which reduce the demand for heads.

73
2. An advice service for schools by the Recruitment Team. Part of the
process involves the collection of data on the success of the recruitment process (number of applicants, the strength of the shortlist and the experiences of those involved in selection). A second part aims to review the success of headship appointments after a period working with the LAs.
3. Comprehensive induction programme and support for new heads (including coaching) and experienced heads in new posts (including mentoring) using heads trained as local leaders by NCSL.
4. Attempts to retain the best heads by providing opportunities for system leadership or leadership beyond their own school offering career development and new professional challenge, including learning partnerships between schools. Also encouragement to become NCSL national leaders.
5. A strategic partnership with neighbouring LAs to supplement and
increase their own LA’s school leadership capacity.

74
SECTION FIVE: SUPPORT STAFF RECRUITMENT AND RETENTION
Key points
• Overall, there were few perceived difficulties in recruiting and retaining support staff (although note that this overall picture may mask specific issues for particular support staff groups), and few differences between primary and secondary schools.
• It appeared that more deprived schools and schools with higher numbers of BME students had more difficulties in support staff recruitment and retention than other schools, but this was not statistically significant.
• Open questions on the survey indicated that where there are recruitment difficulties these are associated in more deprived areas with problems around loss of benefits related to taking on lower paid jobs; and in some more affluent areas with a lack of parents willing to take on such low paid work.
• There were some issues relating to attempting to retain well qualified TAs mentioned.
5.1 Support staff recruitment Although the focus of this study is on teachers, we did ask some broad questions about support staff recruitment and retention. It is important to note that support staff are a large and disparate group covering a range of roles from school bursars to teaching assistants, caretakers to kitchen staff. Therefore this study can only point to broad trends. Further research would be required to examine more fine-grained issues relating to recruitment and retention in specific support staff groups. Note that for this section there were no significant differences by attainment or pupil progress, so these are not reported. 5.1.1 The recruitment of support staff in Yorkshire and Humber - the overall picture Overall, there were relatively few perceived problems in recruiting support staff with around 11 per cent of schools noting it was difficult or very difficult. Table 5.1 Perceived difficulties in recruiting support staff
Very difficult % Difficult % Neither % Not difficult % Not at all difficult %
Total n
3 8 19 31 40 782
It is worth noting that there are no clear differences by school type, with all primary, secondary, and independent schools expressing similar difficulty recruiting support staff (see Table 5.2 below).

75
Table 5.2 Perceived difficulties recruiting support staff analysed by school type
Level Very difficult % Difficult % Neither %
Not difficult %
Not at all difficult % Total
Primary 3 8 18 29 42 651
Secondary 2 7 25 36 30 109
Independent 0 9 9 41 41 22
Expected cell count too low to test for significance
If we look at the response rates, analysed by LA (see Figure 5.1 below), it appears that a higher proportion of schools in Calderdale, Leeds and Bradford have difficulties recruiting support staff; with 16% of schools in these areas rated this as either very difficult or difficult. Schools in North Lincolnshire had no difficulties in recruiting support staff.
Figure 5.1 Perceived difficulties recruiting support staff by schools, analysed by LA
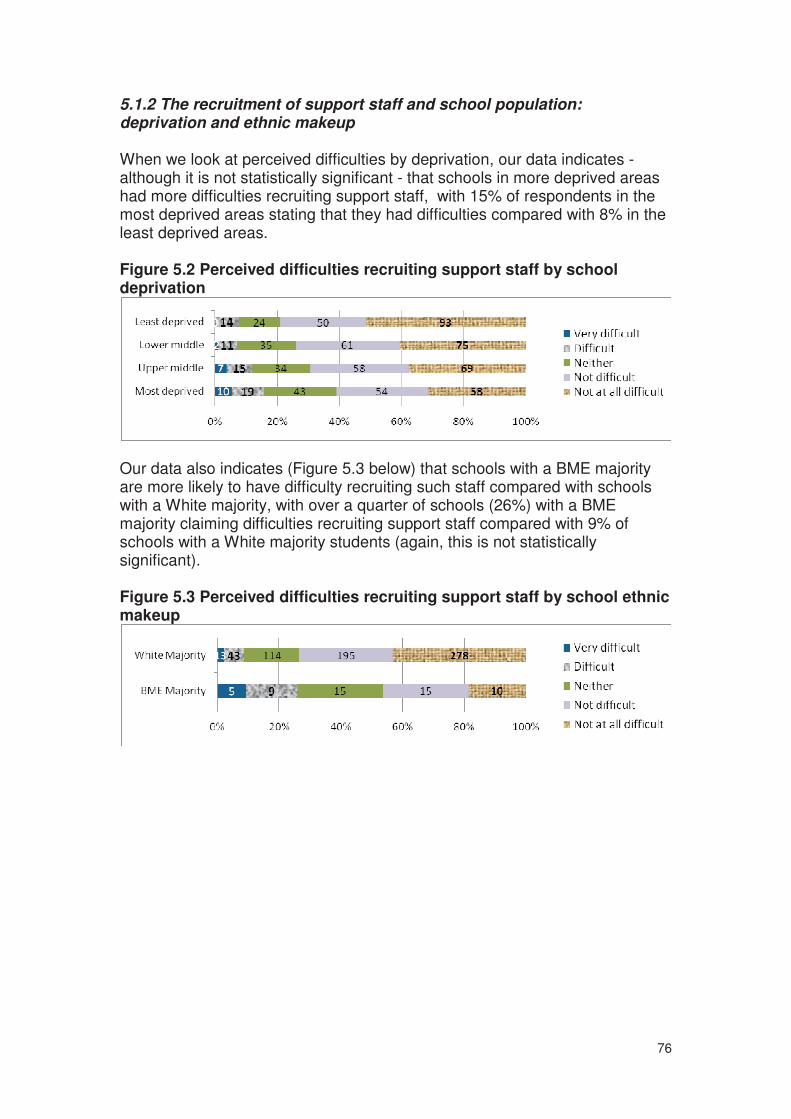
76
5.1.2 The recruitment of support staff and school population: deprivation and ethnic makeup When we look at perceived difficulties by deprivation, our data indicates - although it is not statistically significant - that schools in more deprived areas had more difficulties recruiting support staff, with 15% of respondents in the most deprived areas stating that they had difficulties compared with 8% in the least deprived areas. Figure 5.2 Perceived difficulties recruiting support staff by school deprivation
Our data also indicates (Figure 5.3 below) that schools with a BME majority are more likely to have difficulty recruiting such staff compared with schools with a White majority, with over a quarter of schools (26%) with a BME majority claiming difficulties recruiting support staff compared with 9% of schools with a White majority students (again, this is not statistically significant). Figure 5.3 Perceived difficulties recruiting support staff by school ethnic makeup

77
5.2 Support Staff Retention 5.2.1 The retention of support staff in Yorkshire and Humber - the overall picture The patterns of data relating to support staff retention and different school characteristics were broadly in line with those regarding recruitment. But there was no evidence of a very widespread problem with support staff retention across the piece, with only 4% of schools finding it difficult or very difficult to retain support staff, as indicated in Table 5.3 below: Table 5.3 Perceived difficulties in retaining support staff
Very difficult % Difficult % Neither % Not difficult % Not at all difficult %
Total n
1 3 12 29 57 781
Figure 5.4 below shows that retention is seen to be less of a problem compared with recruitment for these staff groups: Figure 5.4 Perceived difficulties in recruiting and retaining support staff
Turning to differences by school type, Table 5.4 below indicates that 575 (88.5%) primary schools found very few difficulties in retention, with 69 (63.3%) secondaries indicating a slightly higher level of difficulty, but this was not a statistically significant difference. Table 5.4 Perceived difficulties retaining support staff and school level
In your school how difficult is it to retain suitable support staff?
Table included to show data, not for final report Very difficult (n)
Difficult (n)
Neither (n)
Not difficult
(n)
Not at all difficult
(n) Total
Primary 4 12 59 175 400 650
Secondary 0 7 27 40 35 109
Independent 0 2 4 9 7 22
Looking at the support staff in the context of LAs, it is evident from Table 5.5 below that there is a slightly higher proportion of schools in East Riding of Yorkshire and North East Lincolnshire with difficulties retaining support staff, with no schools in York, Doncaster or Rotherham reporting difficulties.
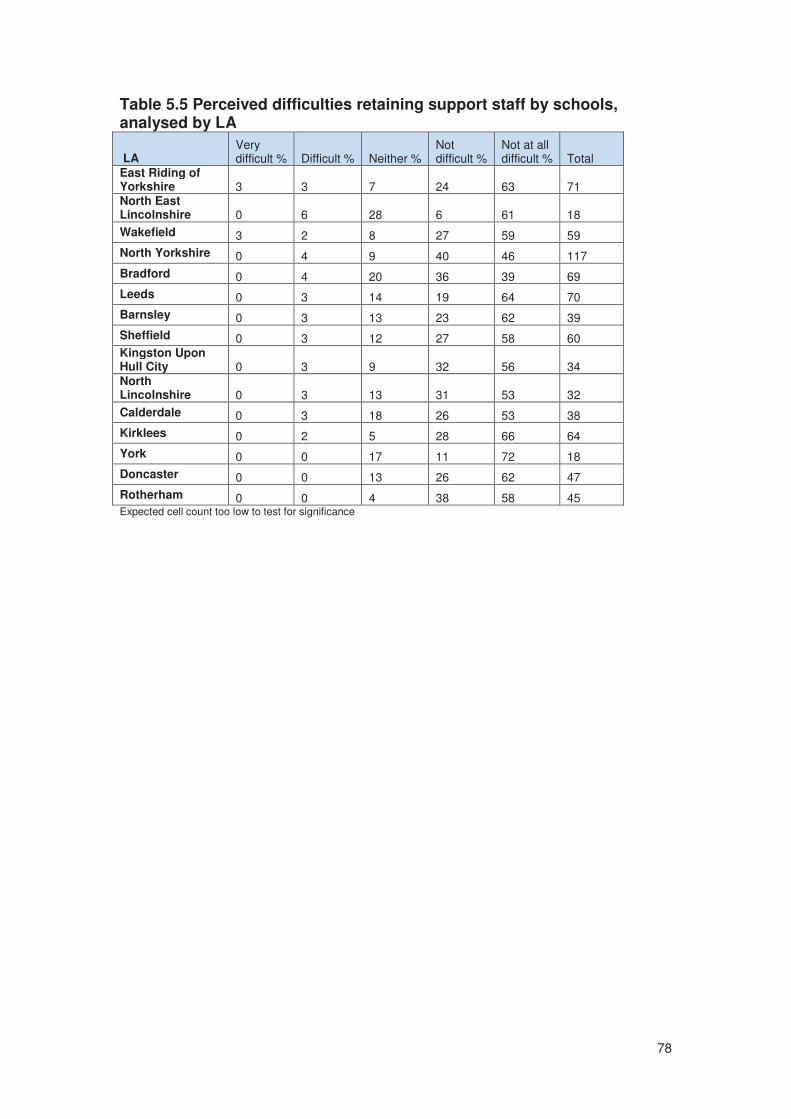
78
Table 5.5 Perceived difficulties retaining support staff by schools, analysed by LA
LA Very difficult % Difficult % Neither %
Not difficult %
Not at all difficult % Total
East Riding of Yorkshire 3 3 7 24 63 71 North East Lincolnshire 0 6 28 6 61 18
Wakefield 3 2 8 27 59 59
North Yorkshire 0 4 9 40 46 117
Bradford 0 4 20 36 39 69
Leeds 0 3 14 19 64 70
Barnsley 0 3 13 23 62 39
Sheffield 0 3 12 27 58 60 Kingston Upon Hull City 0 3 9 32 56 34 North Lincolnshire 0 3 13 31 53 32
Calderdale 0 3 18 26 53 38
Kirklees 0 2 5 28 66 64
York 0 0 17 11 72 18
Doncaster 0 0 13 26 62 47
Rotherham 0 0 4 38 58 45 Expected cell count too low to test for significance
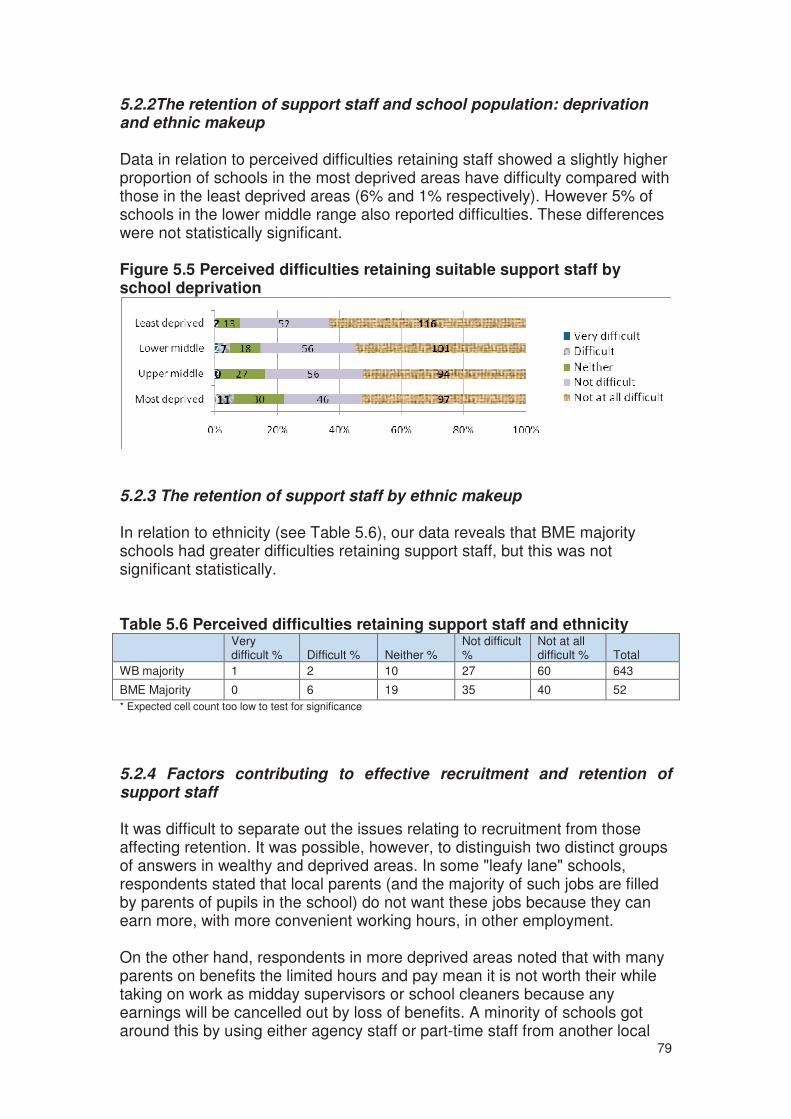
79
5.2.2The retention of support staff and school population: deprivation and ethnic makeup Data in relation to perceived difficulties retaining staff showed a slightly higher proportion of schools in the most deprived areas have difficulty compared with those in the least deprived areas (6% and 1% respectively). However 5% of schools in the lower middle range also reported difficulties. These differences were not statistically significant. Figure 5.5 Perceived difficulties retaining suitable support staff by school deprivation
5.2.3 The retention of support staff by ethnic makeup In relation to ethnicity (see Table 5.6), our data reveals that BME majority schools had greater difficulties retaining support staff, but this was not significant statistically. Table 5.6 Perceived difficulties retaining support staff and ethnicity
Very difficult % Difficult % Neither %
Not difficult %
Not at all difficult % Total
WB majority 1 2 10 27 60 643
BME Majority 0 6 19 35 40 52
* Expected cell count too low to test for significance
5.2.4 Factors contributing to effective recruitment and retention of support staff It was difficult to separate out the issues relating to recruitment from those affecting retention. It was possible, however, to distinguish two distinct groups of answers in wealthy and deprived areas. In some "leafy lane" schools, respondents stated that local parents (and the majority of such jobs are filled by parents of pupils in the school) do not want these jobs because they can earn more, with more convenient working hours, in other employment. On the other hand, respondents in more deprived areas noted that with many parents on benefits the limited hours and pay mean it is not worth their while taking on work as midday supervisors or school cleaners because any earnings will be cancelled out by loss of benefits. A minority of schools got around this by using either agency staff or part-time staff from another local

80
employer (in one case the police). Table 5.7 below gives more detail on issues mentioned in this regard. Table 5.7 Perceptions of schools on the recruitment of support staff
Some schools felt their location contributed to the difficulty of filling these part-time posts, and again these fell into two categories: either there was competition from another local school with a "better" reputation, or limited public transport made it unrealistic to travel to work for the short hours required. Several responses seemed to concentrate on one particular group of support staff; among secondary schools this was most often Teaching Assistants (TAs). The most common observation from secondary schools was that well-qualified TAs often leave for better paid jobs, sometimes moving on to teacher training programmes. However, in some schools they have continued along the Graduate Training Programme (GTP) and eventually gained teaching posts in the same school. This links with the frequent response (20.7% secondary, 22.3% primary) that CPD provision was important for retention of support staff as well as teaching staff. In many primary schools this was overtly the same training as the "good relations between teaching and support staff" was also identified as part of their recruitment and retention strategy (22.9% primary, but only 6.9% secondary). "Inaccurate expectations" or "under-qualified applicants" were a common difficulty, especially in primary schools. This related both to TAs, for whom the solution often seemed to be to provide good "on the job" training, and to office staff. The latter find working in a school very different from working in a commercial office.
number of sec schools
% sec schools
% sec responses
number of pri schools
% pri schools
% pri responses
Extra income opportunities 1 0.8% 3.4% 2 0.3% 1.1%
Quality of applicants improving 1 0.8% 3.4% 7 1.0% 4.0%
Use agency or another local p/t employer staff 2 1.6% 6.9% 4 0.6% 2.3%
Budget difficulties (or recruitment is expensive) 2 1.6% 6.9% 9 1.3% 5.1%
Applicants have inaccurate expectations/ are underqualified 2 1.6% 6.9% 35 5.2% 20.0%
Good relations between teaching & other staff 2 1.6% 6.9% 40 5.9% 22.9%
Location causes difficulties (local competition, rural transport,) 5 3.9% 17.2% 12 1.8% 6.9%
CPD opportunities 6 4.7% 20.7% 39 5.8% 22.3%
No demand for low paid, p/t, short-term work locally (too rich or on benefits) 7 5.5% 24.1% 50 7.4% 28.6%
Well-qualified TAs leave for better money or ITT/GTP (Graduate Teacher Programme) 8 6.3% 27.6% 11 1.6% 6.3%

81
SECTION SIX: DISCUSSION AND SUGGESTED ACTIONS In one sense, there are no major surprises in this report. The nationally produced data we referred to in the introduction indicated that Yorkshire and Humber is a region that does not have a major recruitment and retention problem overall, and this study largely confirms this. However we note that not all schools are able to appoint teachers with the right skills and experience for every post. From this study, it is difficult to predict whether the current economic conditions will change the status quo of teacher recruitment and retention in the region. Nationally, at this point (April 2009) TDA report slightly higher numbers of applications across subjects including shortage subjects onto ITT routes compared with previous years, which may filter into improved recruitment (although not necessarily retention, since some of the new recruits may well leave the profession once the economy picks up) in future years. Of course, it is true that alternative career opportunities and pay and working conditions offered by the teaching profession in comparison to other professions are factors that affect recruitment and retention, there are many others. Our study found that this broader range of factors included retirement, structural changes, and supply of well qualified staff in particular subjects. It is also dependent on the ease of entry into teaching, school-specific factors including perceived ease of teaching in that school for various reasons. Then of course there are individual issues such as personal commitment and satisfaction. All of the above variables, and others, can have an either positive or negative effect on the quality and magnitude of the teacher labour market in any given year. Whilst our findings cannot foretell the future trends of teacher recruitment and retention in the region, our study did identify that certain schools tend to have more difficulties recruiting teachers, and these are schools that are seen by potential recruits to have poor behaviour, low attainment and social and personal problems and issues that make teaching very challenging. Similarly, we have confirmed the particular difficulties around recruiting to some subjects, particularly Physics, ICT, English, Mathematics and Chemistry. In absolute terms the greatest shortages of suitably qualified teachers are in mathematics, English, science and ICT. The first three of these cause problems because not only do they fill lower proportions of vacancies but they are core subjects requiring numerous teachers in every school. The shortage of ICT teachers may be partly due to its relative newness as a school subject, therefore the total pool of teachers is smaller. The TDA has a number of schemes in progress to address training of additional STEM teachers. However, it is important to note that our study indicates that some schools in some authorities seem to cope with recruitment and retention difficulties better than others, and that a range of interesting practice is taking place, supported by key national, local and regional agencies.

82
In this final section, we draw on what we can learn about these schools alongside our wider understanding of the issues from the literature and our own reflections to produce a set of suggestions for action. We cannot consider all of these to be recommendations, because every school and authority is different, but they are ideas that we hope will be carefully considered within and beyond the region. 6.1 Sharing practice At the regional or sub-regional level We identified throughout this report that some schools have been able to cope with recruitment difficulties better than others, and local authorities provide and facilitate a range of useful support. An obvious response to this is to try to unearth good practice and share it broadly. The learning from the Case Studies and LA interviews included in the body and appendices of this report would make for a useful starting point. One might consider that the LA is the most appropriate level at which to organise this, and we will turn to this in a moment. But we feel there is a role for organisations slightly further removed for two reasons. The first is competition. Schools within an LA, and even neighbouring LAs, are competing with each other for the most suitable, skilled teachers. Individual schools, then, have an incentive to develop their own practice and have little incentive to share their secrets with their local competitors. LAs have a role here in identifying why sharing practice at a local level can benefit all schools, but clearly there is a potential role for regional organisations in supporting sharing of practice between schools across the region. The second reason is to support sharing of practice between LAs. All of the five LA representatives we spoke with identified useful practice in schools and at the LA level that could be considered by other authorities. Clearly, there is a role here again for regional or subregional groupings. How to facilitate this is more difficult. Whilst it is not difficult to work within existing for a for key LA representatives to share practice, and this doubtless takes place to some extent, it is more difficult to persuade schools that the costs of releasing a teacher from a school in one LA to spend a day in another 80 miles away talking about recruitment are worth the potential benefits. How this might work requires more consideration, but there is clearly potential for utilising existing networks, or investing in supporting the development of regional or subregional networks of schools that see these issues as a particular challenge. At the local level Local authorities clearly have a potential and often already existing role in supporting sharing of good practice within their locale. The competition
83
between local schools identified above may need to be addressed by LAs clearly articulating the benefits of sharing practice, which we feel the vast majority of headteachers would share (and doubtless many do already) once articulated. Some of these, for example, are:
• The fact that no matter how good a school’s practice, any organisation can learn from others
• The increasing focus on collaboration (for example the new diplomas; hard and soft school federations) is likely to see more cross-organisational working and teaching so it is increasingly in the interests of schools that their neighbours have high quality staff – who may well at some point teach their pupils
• Once teachers settle in a locality, they often settle for many years. So encouraging all schools in a local area to develop excellent recruitment practice is likely to benefit all local schools in the longer term as teachers move on for promotion
6.2 Gathering data on the issues Regional level This study is a laudable first attempt to gain a state of the region picture of teacher recruitment and retention in Yorkshire and Humber. When we set out, we hoped that we might build on local level data to build this picture, but conversations with LA officials quickly disabused of this notion: it was apparent that few LAs were able – at least at this point – to give us an accurate idea of teacher recruitment and retention in local schools. If Yorkshire Forward and partners feel this study merits further investigation and data gathering then they should consider how best to incentivise and support LAs in gathering such data in the future, for example by working with LAs to utilise the detailed data gathered for DCSF purposes on staffing in an effective way. But the details of how best to do this require working out. Local level As we note above, LAs - at least according to those we have spoken with - currently appear not to gather much in the way of accurate teacher recruitment and retention data (we exclude here data on headteachers). Some of our findings indicate this may be a missed opportunity, since without this accurate data it is difficult for LAs to know if there is a problem to be addressed. This kind of data is also an indicator of other positive work at LA level. For example, to pick out one positive finding from the study, there are some indications in our data that some of the most deprived LAs in the region do not have the recruitment and retention difficulties that might be expected. This could indicate positive work on the part of the LAs concerned; or it could be misleading. But without gathering more accurate data it is difficult to tell.

84
6.3 Encouraging staff development Regional level The literature on teacher recruitment and retention indicates, and our findings in this study concur, that schools need to attend carefully to ensuring every member of staff from newly qualified teachers to bursars, cleaners to headteachers is encouraged and enabled to develop in their roles. This is in the interests of the individuals and the school. This message is being pushed hard at the national level by TDA and Ofsted, and is supported by academic work going back many years (most recently from the multi-million pound Teaching and Learning Research Project and the Alexander and Rose Primary Education reviews, for example). Staff development does not just affect recruitment and retention; it supports high quality learning and makes staff feel skilled, valued and confident. These strong messages need to be supported at all levels, so where possible organisations such as RDAs and other partners involved in this project have a role to play here in working with LAs and national bodies, and where appropriate schools, to carry this message forward. Local and school level Local authorities supported by TDA and NCSL already do much to support staff development in schools. The key message here is that a real focus on working towards schools as learning communities for all can play a role in improving recruitment and retention of staff, in addition to the other benefits. 6.4 Valuing all schools For a variety of reasons, schools that face challenging circumstances can be seen as a problem. It is undeniable that many such schools are regularly denigrated in the media, and mistrusted by many parents, subject to intense scrutiny and pressure. Given this, it is of little wonder that such schools often find it more difficult than most to attract sufficient suitable teachers. There are national and local level initiatives to support such schools which are to be welcomed – National Challenge being a good example. However, these can have an adverse effect by reinforcing pressures and potentially even providing a handy shorthand for some parents – and teachers – to know which schools to avoid. We suggest some specific ways that such schools can help and be helped to improve recruitment and retention, but we want to begin by reinforcing that at all levels from the national to the local, public bodies should combat the negative picture that often emerges, emphasising the excellent work they do. This is not a simple issue to deal with, involving as it does national policy, opinion, and much broader social issues. But there is one relatively simple thing that can be done: allow and encourage people (teachers, parents, and

85
others) to experience for themselves a school, and they are far more likely to want to work there. The vast majority of parents are happy with the school their child attends once they get there; and the same principle applies to those who work there. 6.5 Working together to support schools and teachers: a final reflection and some specific learning to be considered Some schools have moved towards monetary incentives to help recruit and retain teachers, but clearly not all teachers are driven to remain in schools that offer them financial gains. Teachers claim they are happy to continue to teach if they feel supported, their work conditions are suitable, and if they feel they feel they are able to make a difference in children's education and social lives. The following is what one experienced teacher (School 8) had to say:
“Working here is a challenge, but that’s what keeps me here. I know these children, and I just know I can make a difference, and I do… What else would make me move out from here? I have everything I need just right here!”
It is these beliefs that are likely to sustain teachers throughout their career. The school community (leaders and teaching and non teaching staff), policy makers (LAs and government), and ITT providers will need to work together (see diagram below) if teachers are to prosper in their personal and work lives. Schools and policy makers will need to exercise their power to offer some type of recognition for their most successful teachers and help empower them as partners in teaching and learning. ITT providers will need to require prospective trainees and teachers the opportunity and the appropriate training and support to work in schools with high FSM and BME. All partners will also need to work together (See Figure 6.1) to help create a learning community that values cooperation between teachers and encourages innovation. And, finally, school leaders and policy makers will need to protect teachers' time and offer them the space and opportunity to engage in reflection.

86
Figure 6 Contributions needed from ITT providers, schools, and policy makers to address staff recruitment and retention
The above figure relates to learning derived from the report that could be applied to schools, policy makers (such as this project's steering partners), and ITT providers to help address staff recruitment and retention. As we note above, these are suggestions based on useful practice in some areas that could inform the thinking in others:
A. For ITT providers and schools: Offering school-based placement opportunities for individuals considering a teaching career and exposing trainees to several disadvantaged schools.
B. For ITT providers, schools, and policy makers: 1. Improving the marketing of the disadvantaged schools. 2. Sharing and celebrating good practice in teacher recruitment
and retention. 3. Training coaches and mentors to help support all staff
(headteachers, teachers, and teaching assistants).
C. For schools and policy makers: 1. Gathering data on staff recruitment (such as, age, gender,
ethnicity, experience, ITT route, and previous teaching and
- Gather data on:
(a) Recruited staff profile (b) Turnover (where & why), (c) Wastage (where & why),& (d) Recruitment and retention strategies,
- Evaluate staff recruitment & retention strategies.
- Offer financial & career recognition for staff working in high FSM & BME, & student behaviour problems - Offer financial support to high FSM & BME schools to help address staff recruitment & retention.
- Offer placement opportunities for prospective trainees & teachers in disadvantaged schools
POLICY MAKERS
ITT PROVIDERS
- Improve the marketing of disadvantaged schools. - Share & celebrate good practice. - Train coaches & mentors to support staff

87
non teaching experience), staff turnover and wastage (why did the staff leave and where to), and recruitment and retention strategies;.
2. Evaluating staff recruitment and retention strategies. 3. Utilise exit interviews to ascertain reasons for leaving.
D. For policy makers E.
1. Offering financial and career recognition for staff working in schools facing challenging circumstances.
2. Offering financial support to schools facing challenging circumstances to help address staff recruitment and retention.
3. Ensuring - via publicity, policy statements, media communications - that the work of schools facing challenging circumstances is celebrated and supported

88
BIBLIOGRAPHY Ashby, P. et al. (2009). Beginner Teachers’ Experiences of Initial Teacher Preparation, Induction and Early Professional Development: A Review of Literature. Available online at http://www.dcsf.gov.uk/research/data/uploadfiles/DCSF-RW076.pdf Barmby, P. (2006). “Improving Teacher Recruitment and Retention: The Importance of Workload and Pupil Behaviour.” Educational Research, 48 (3): 247-265. Barrington, R. (2000). An Investigation into the Induction Period which Considers the Perspectives of NQTs and Their Induction Tutors. Paper presented at the British Educational Research Association Annual Conference. Cardiff University September 7-10. Billingsley, B. S. (1993). “Teacher Retention and Attrition-in Special and General Education: A Critical Review of the Literature.” Journal of Special Education, 27(2): 137-174. Bird, E. (2003). “To What Extent Can Diversification of Routes to Qualified Teacher Status Contribute to the Supply of Mathematics Teachers? In Shortage of Mathematics Teachers - What Progress? Proceedings of a National Day Conference, pp. 71-106. Milton Keynes: The Open University. Bubb, S and Earley, P. (2006). “Induction Rites and Wrongs: The ‘Educational Vandalism’ of New Teachers’ Professional Development.” Journal of In-service Education, 32(1): 5–12. Bush, A. A. (2005). Choice and Equity in Teacher Supply. London: Institute for Public Policy Research. Carrington, B. et al. (2001). Ethnicity and the Professional Socialisation of Teachers. London. TDA. Castagnoli, P. and Cook, N. (2004). Growing Your Own Leaders: The Impact of Professional Development on School Improvement. Full Practitioner Report, Nottingham: National College for School Leadership. Centre for Educational Research and Innovation (2007). Education at a Glance 2007. OECD. CEIR (2008). NQT Quality Improvement Study. TDA. Available on-line at: http://www.nqtstudy.info/ CEIR (2009). Research Findings into Primary Schools Facing Challenging Circumstances in Yorkshire and Humber. TDA, PDS. Chapman, D.W. and Green, M. S. (1986). “Teacher Retention: A Further Examination.” Journal of Educational Research, 79: 273–279.

89
Dadley, E.M. and Edwards, B. (2007) “Where have All the Flowers Gone? An Investigation into the Retention of Religious Education Teachers.” British Journal of Religious Education, 29(3): 249-271. Dalton, P. and Van der Klaauw, W. (1999). “Leaving Teaching in the UK: A Duration Analysis." The Economic Journal, 105 (March): 431- 444.
DCSF (2009). New Fast Track into Teaching and Headship for the Best. Available on-line at: http://www.dcsf.gov.uk/pns/DisplayPN.cgi?pn_id=2009_0048
DCSF (2008). School Workforce in England (including Local Authority level figures). Available on-line at: http://www.dcsf.gov.uk/rsgateway/DB/SFR/s000813/index.shtml DCSF (2007). School Workforce in England (including pupil: teacher ratios and pupil: adult ratios). Available on-line at: http://www.dcsf.gov.uk/rsgateway/DB/SFR/s000743/index.shtml DCSF (2005). Responding to Challenging Circumstances: Evaluation of the 'Schools Facing Exceptionally Challenging Circumstances' Project." Accessed on 4th of January 2009. Available at: http://www.dcsf.gov.uk/research/data/uploadfiles/RW90.pdf Dolton, P. and Newson, D. (2003). “The Relationship between Teacher Turnover and School Performance.” London Review of Education, 1 (2): 131-40. Earling, P. et al. (2008). Evaluation of the Future Leaders Pilot Programme. Accessed 2nd of April 2009. Available at: http://www.ncsl.org.uk/evaluation-of-future-leaders-3.pdf Gewirtz, S., Ball, S., and Bowe, R. (1995). Markets, Choice and Equity in Education. Buckingham: Open University Press. Hargreaves, L., Cunningham, M., Hansen, A., McIntyre, D., Oliver, C., and Pell, T. (2007). The Status of Teachers and the Teaching Profession in England: Views from Inside and Outside the Profession. Final Report of the Teacher Status Project. DfES Research Report, 831A. Heilbronn, R. et al. (2002). The Whole School Management of Induction: Central Factors for Success. Paper presented at the Annual Conference of the British Educational Research Association. University of Exeter: September 12-14. HM Government (2009). Working Together: Public Services on Your Side. Accessed on 4th of April 2009. Available at: http://www.hmg.gov.uk/media/15556/workingtogether.pdf
90
HM Government (2009a). New Opportunities: Fair Chances for the Future. Accessed on 4th of April 2009. Available at: http://www.hmg.gov.uk/media/9102/NewOpportunities.pdf Hobson, A.J., Malderez, A., Tracey, L., Homer, M., Mitchell, N., Biddulph, M., Giannakaki, M.S., Rose, A., Pell, R.G., Roper, T., Chambers, G.N., and Tomlinson, P.D. (2007). Newly Qualified Teachers' Experiences of Their First Year of Teaching: Findings from Phase III of the 'Becoming a Teacher' Project. London, Department for Education and Skills. Hobson, A. J., Johnson, F., Kerr, K. et al. (2004). Why People Choose to Become Teachers and the Factors Influencing their Choice of Initial Teacher Training Route: Early Findings from the Becoming a Teacher (BaT) Project. DfES Research Brief RBX08-04 (London, DfES). Hopwood, V. (2004). Evaluation of the Golden Hello Initiative. DfES Research Report RR544. Accessed 3rd of April 2009. Available at: http://www.dcsf.gov.uk/research/data/uploadfiles/RR544.pdf Hoshin and Yorkshire Futures (2007) Learning to succeed: understanding and addressing Key Stage 4 (GCSE) underachievement in Yorkshire and Humber (http://www.yorkshirefutures.com/articledetail.aspx?page=409CC90F-8983-4F17-AEE5-8AF93874A0F9&article=81F3A654-C368-49DF-B58B-22D29342FA88)
Huat See, B.; Gorard, S. and White, P. (2004). “Teacher Demand: Crisis What Crisis?” Cambridge Journal of Education, 34 (1): 103-123. Ingersoll, R.M. (2001). "Teacher Turnover and Teacher Shortages: An Organizational Analysis." American Educational Research Journal, 38(3): 499- 534. Ingersoll, R.M. (1999). “Understanding the Problem of Teacher Quality in American Schools.” Education Statistics Quarterly, 1 (1): 15-18. Jackson, A. (2007). The Development of Questioning as an Enrichment to the Professionalism of Beginning Teachers. Paper presented at the British Educational Research Association Annual Conference. Institute of Education: University of London: September 5-8.
Lack, A. and Johnston, A. (2008) Schools Facing Challenging Circumstances: Quantitative Findings. Jigsaw Research. TDA. Lankford, H.; Loeb, S.; and Wyckoff, J. (2002). "Teacher Sting and the Plight of Urban Schools." Education Evaluation and Policy Analysis 24(1): 37-62. Lewis, P. et al. (2000). Monitoring the Induction Experience of Newly Qualified Teachers. Paper presented at the British Educational Research Association Annual Conference. Cardiff University. September 7-10.
91
Lightfoot, L. and Asthana, A. (2008). "Schools in Crisis Hunt for 1,000 New Heads." The Guardian. (14 September). Lipsett, A. (2008). “Teacher Shortage in Key Subject Feared.” The Guardian. (7 February). Lortie, D.C. (1975). Schoolteacher. Chicago: University of Chicago Press. Lupton, R. (2004). Schools in Disadvantaged Areas: Recognising Context and Raising Quality. London, Centre for Analysis of Social Exclusion, London School of Economics: 39. MacBeath, J.; Gray, G.; Cullen, J.; Cunningham, H.; Ebbutt, D.; Frost, D.; Stewart, S.; and Swaffield, S. (2005). Responding to Challenging Circumstances: Evaluation of the 'Schools Facing Exceptionally Challenging Circumstances' Project.' Cambridge, University of Cambridge. Murname, R. J.; Singer, J. D., Willett, J. B.; Kemple, J.J. and Olsen, R. J. (1991). Who Will Teach? Policies that Matter. Cambridge, MA: Harvard University Press. Noyes, A., (2004) “Where have All the Maths Teachers Gone?” Proceedings of the British Society for Research into the Learning of Mathematics 24 (3): 21-26. National College for School Leadership (2006). Recruiting Headteachers and Senior Leaders: Seven Steps to Success. Nottingham, NCSL. Accessed on 13/03/09. Available at: http://www.ncsl.org.uk/media-4a8-06-recruit-head.pdf National Foundation for Educational Research and Government Association (2008). Local Resignation and Recruitment Teacher Survey (Report No. 40). Slough: NFER Noyes, A., (2004) “Where Have All the Maths Teachers Gone?” Proceedings of the British Society for Research into the Learning of Mathematics 24 (3): 21-26. OECD (2007) Education at a Glance 2007. Available on-line at: http://www.oecd.org/document/30/0,3343,en_2649_39263238_39251550_1_1_1_1,00.html Ofsted (2008) Teach First Ofsted report. Accessed on 05/04/09. Available on-line at: http://www.teachfirst.org.uk/news/ofsted Pesk H. G., Liu, E., Johnson, S. M., Kauffman, D., and Kardos, S. M. (2001). “The Next Generation of Teachers: Changing Conceptions of a Career in Teaching.” The Phi Delta Kappan, 83 (4): 304-311. Parkinson, J. and Pritchard, J. (2005). “The Induction Experiences of Newly Qualified Secondary Teachers in England and Wales.” Journal of In-service Education, 31(1): 63-81.

92
PricewaterhouseCoopers (2001). Teacher Workload Study. Accessed 6th of March 2009 Available at: http://www.teachernet.gov.uk/_doc/3165/Final%20report%205%20December%20CK3dec2.doc Quartz, K. H., Thomas, A., Hasan, L., Kim, P., and Barraza-Lawrence, K. (2001) Urban Teacher Retention: (Phase One:1998-2001) Technical Report of the Center X/TEP Research Group UCLA: Institute For Democracy,Education and Access Rhodes, C. et al. (2004). “Valuing and Supporting Teachers: a Survey of Teacher Satisfaction, Dissatisfaction, Morale and Retention with an English Local Education Authority.” Research in Education, 71: 67-80 Sammons, P., Day, C., Kington, A., Gu, Q., Stobart, G., and Smees, R. (2007). “Exploring Variations in Teachers' Work, Lives and their Effects on Pupils: Key Findings and Implications from a Longitudinal Mixed-Method Study.” British Educational Research Journal - Special Issue, 33(5): 681-701. Smethem, Lindsey (2007). “Retention and Intention in Teaching Careers: Will the new Generation Stay?” Teachers and Teaching13 (5): 465- 480. Smethem, L. and Adey, K. (2005). “Some effects of statutory Induction on the Professional Development of Newly Qualified Teachers: A Comparative Study of Pre and Post Induction Experiences.” Journal of Education for Teaching 31 (3): 187-200. Smith, A. (2004). Making Mathematics Count. London: The Stationary Office. Smithers, A. and Robinson, P. (2003). Factors Affecting Teachers’ Decisions to Leave the Profession. DfES Research Report RR430. London: DfES. Smithers, A. and Robinson, P. (2004). Teacher Turnover, Wastage and Destinations. Nottingham, Department for Education and Skills. Smithers, A. and Robinson, P. (2005). Teacher Turnover, Wastage and Movements between Schools, Nottingham, Department for Education and Skills. Teach First (2009) Website available at: http://graduates.teachfirst.org.uk/Home.html Teacher Training Agency: Yorkshire and Humber - Regional partnerships projects phase III 2002/2004. (2004). Increasing ITT in Schools Facing Challenging Circumstances: Final Report Accessed on 20th of January 2009. Available at: http://partnerships.ttrb.ac.uk/attachments/9496913b-bb1a-4eeb-be2e-0f857285d5b4.doc Whitener, S.D. and Griber, K. (1997). Characteristics of Stayers, Movers, and Leavers: Results from the Teacher Follow-Up Survey: 1994-5. Washington, DC: National Center for Education Statistics, U.S. Department of Education.

93
Zumwalt, K.; and Craig, E. (2008). "Who is Teaching? Does it Matter?" In: Handbook of Research on Teacher Education: Enduring Questions in Changing Context." Third Edition. Edited by Cochran-Smith, Feiman- Nemser, McIntyre, J.; and Demers, K E. New York & London: Routledge/ Taylor & Francis Group and the Association of Teacher Educators.