Table of contents SAS AB Result Analyst Presentation Third ... · PDF fileRestructuring charge...
24
The SAS Group Investor Relations Tel. +46 (0) 8 797 1451 Fax: +46 (0)8 797 5110 e-mail: [email protected] --- Homepage: www.scandinavian.net -- Results Jan -Sep 2002 SAS AB Result Analyst Presentation Third Quarter 2002, November 13 Stockholm, London Table of contents 1. Summary of 3 rd Quarter 2002 2. Result improvement measures 3. Business area – Scandinavian Airlines 4. Business area –Subsidiary Airlines & Affilliates 5. Business area – Airline related 6. Business area – Rezidor SAS Hospitality 7. Financials 8. Outlook 2002 9. Appendices 3 rd Quarter 2002 – according to set out plan, yields and revenues under pressure 1 st Quarter – weak - according to plan 2 nd Quarter – according to plan – passenger load factors and yields better than expected 3 rd Quarter – according to plan – yields & revenues under pressure Pressure on revenues expected for 4 th Quarter Expected economic recovery delayed Restructuring charge of MSEK 600 Important events of note 3 rd Quarter Rezidor SAS investing in multi-brand concept Regent, Country Inns, Park Inn Scandinavian Airlines launches additional low price internet booking alternatives to most European cities SAS Flight Support to acquire ASG –name change to European Aeronautical Group Scandinavian Airlines structural improvement measures – Verification process completed – Increased target to MSEK 6 400 (4 000) – Restructuring charge of MSEK 600 Q4 ($7 500 million) ($7 500 million) ($7 500 million) ($7 500 million) Increased transparency through five Business Areas
Transcript of Table of contents SAS AB Result Analyst Presentation Third ... · PDF fileRestructuring charge...

The SAS Group Investor RelationsTel. +46 (0) 8 797 1451 Fax: +46 (0)8 797 5110
e-mail: [email protected] --- Homepage: www.scandinavian.net -- Results Jan -Sep 2002
SAS AB Result Analyst Presentation
Third Quarter 2002, November 13Stockholm, London
11/12/20022
Table of contents1. Summary of 3rd Quarter 20022. Result improvement measures3. Business area – Scandinavian Airlines4. Business area –Subsidiary Airlines & Affilliates5. Business area – Airline related6. Business area – Rezidor SAS Hospitality7. Financials8. Outlook 20029. Appendices
11/12/20023
3rd Quarter 2002 – according to set out plan, yields and revenues under pressure
1st Quarter – weak - according to plan2nd Quarter – according to plan – passenger load factors and yields better than expected3rd Quarter – according to plan – yields & revenues under pressurePressure on revenues expected for 4th Quarter
Expected economic recovery delayedRestructuring charge of MSEK 600
11/12/20024
Important events of note 3rd QuarterRezidor SAS investing in multi-brand concept
Regent, Country Inns, Park InnScandinavian Airlines launches additional low
price internet booking alternatives to most European cities
SAS Flight Support to acquire ASG –name change to European Aeronautical Group Scandinavian Airlines structural improvement measures– Verification process completed– Increased target to MSEK 6 400 (4 000) – Restructuring charge of MSEK 600 Q4
11/12/20025
($7 500 million)($7 500 million)($7 500 million)($7 500 million)
Increased transparency through five Business Areas

The SAS Group Investor RelationsTel. +46 (0) 8 797 1451 Fax: +46 (0)8 797 5110
e-mail: [email protected] --- Homepage: www.scandinavian.net -- Results Jan -Sep 2002
11/12/20027
Record cabin factors but pressure on yields in Scandinavian Airlines
�Total traffic increased by 32,2% vs. Q3 2001– Group passenger load factors at record levels
Scandinavian Airlines + 4,0 p.u. 72,2% Braathens + 9,0 p.u. 63,6% Spanair + 3,6 p.u. 68,5%
�Yields mixedScandinavian Airlines -2% Spanair +26%Braathens +/- 0%
11/12/20028
Significant uplift in 2nd and 3rd
Quarter compared with 1st Quarter 2002
Summary of income statement (MSEK)
Operating revenuesOperating costsEBITDAR
Operating lease cost externalEBITDA
Contr from affiliatedDepreciationGain on salesEBITNet financial itemsEBT
13 775 17 868 16 592 48 235-13 191 -14 620 -14 462 -42 273
584584584584 3 2483 2483 2483 248 2 1302 1302 1302 130 5 9625 9625 9625 9624,2% 18,2% 12,8% 12,4%
-878 -1 050 -932 -2 860----294294294294 2 1982 1982 1982 198 1 1981 1981 1981 198 3 1023 1023 1023 102
-328 -12 3 -337-651 -715 -781 -2 147-133 -141 625 351
----1 4061 4061 4061 406 1 3541 3541 3541 354 1 0411 0411 0411 041 989989989989-40 -291 -405 -736
-1 446 1 039 640 233----1 3131 3131 3131 313 1 1801 1801 1801 180 15151515 ----118118118118
Actual Actual Actual Actual Q1Q1Q1Q1 ActualActualActualActual Q2Q2Q2Q2 ActualActualActualActual Q3Q3Q3Q3 JanJanJanJan----Sep 02Sep 02Sep 02Sep 02
EBT EBT EBT EBT bef gainsbef gainsbef gainsbef gains
EBITDAR-marginal
11/12/20029
Jan-Sep 2002 vs 2001
MSEK MSEK MSEK MSEK JanJanJanJan----Sep 2002Sep 2002Sep 2002Sep 2002 JanJanJanJan----Sep 2001Sep 2001Sep 2001Sep 2001
� Revenue 48 235 38 623� EBIT 989 27� EBT 233 7� EBT excl. cap gains -118 -202
11/12/200210
SAS Group 2001/2002 EBITDAR– operating performance improved
EBITDAR MSEK million
� EBITDAR significantly stronger 3rd Quarter 2002 compared with 2001
EBITDAR 3rd quarter:– Positively affected by
Braathens of 428 MSEK– Spanair of 541 MSEK– Widerøe 95 MSEK– Air Botnia 58 MSEK
-500
0
500
1 000
1 500
2 000
2 500
3 000
3 500
Q1 Q2 Q3 Q4
2001 2002
11/12/200211
SAS Group 2002 – EBT
EBT bef gainsMSEK million
77 142
-421
-1313
1180
15
-1 500
-1 000
-500
0
500
1 000
1 500
Q1 Q2 Q3
2001 2002
11/12/200212
EBITDAR up 81% 9mEBITDAR margin up, but CFROI unchanged as capital increase
MSEK 200MSEK 200MSEK 200MSEK 2002222 2001200120012001 ChangeChangeChangeChange
� Revenue 48 235 38 623 25%
� EBITDAR 5 962 3 290 +81%
� EBITDAR 12% 7% +5 p.u.margin
� CFROI 13% 13% 0 p.u.

The SAS Group Investor RelationsTel. +46 (0) 8 797 1451 Fax: +46 (0)8 797 5110
e-mail: [email protected] --- Homepage: www.scandinavian.net -- Results Jan -Sep 2002
11/12/200213
in MSEK in MSEK+ 25% 5 962
3 290
2001 2002
+81%
48 235
38 623
2001 2002Total Revenues EBITDAR
Revenues driven by acquisitions EBITDAR up 81%
11/12/200214
11/12/200215
Group Group Group Group improvement improvement improvement improvement measuresmeasuresmeasuresmeasures
11/12/200216
5
10
15
600 800 1 000 1 200 1 400 1 600 1 800 2 000
Euro
Cen
ts/A
SK
British Airways
Air France
Lufthansa
Average Stage Length (Kms)
KLM
Target to reduce unit costs in Scandinavian Airlines by 20% by 2004
Scandinavian Airlines
Austrian Airlines Iberia
Low Cost Segment
Spanair
Braathens
11/12/200217
Structural improvement measures increased from 4 000 MSEK to 6 400 MSEK
6 400 MSEK
0
1000
2000
3000
4000
5000
6000
7000
Structural improvements Identified structural improvements
November 2002 Increased and identified structural measures
Distrubution of effects (net):2003: 3 000 MSEK2004: 5 500 MSEK2005: 6 400 MSEK
Spring 2002 identified structural measures
4 000 MSEK
Of which is revenue effect:2003: 600 MSEK2004: 1 300 MSEK2005: 1 600 MSEK
11/12/200218
The SAS Group’ improvement measures -target increased to SEK 12,8 billion
Target when fully implemented 2004/05 Reduce unit costs by 20% in Scandinavian Airlines Significantly improved cabin factorsEnable Scandinavian Airlines to manage lower prices
Short term measures = MSEK app. 6 400 (2002/03)Short term measures = MSEK app. 6 400 (2002/03)Short term measures = MSEK app. 6 400 (2002/03)Short term measures = MSEK app. 6 400 (2002/03)Short term measures = MSEK app. 6 400 (2002/03)Short term measures = MSEK app. 6 400 (2002/03)Short term measures = MSEK app. 6 400 (2002/03)Short term measures = MSEK app. 6 400 (2002/03)
Structural measures = MSEK app. 6 400 (2004/05)Structural measures = MSEK app. 6 400 (2004/05)Structural measures = MSEK app. 6 400 (2004/05)Structural measures = MSEK app. 6 400 (2004/05)Structural measures = MSEK app. 6 400 (2004/05)Structural measures = MSEK app. 6 400 (2004/05)Structural measures = MSEK app. 6 400 (2004/05)Structural measures = MSEK app. 6 400 (2004/05)

The SAS Group Investor RelationsTel. +46 (0) 8 797 1451 Fax: +46 (0)8 797 5110
e-mail: [email protected] --- Homepage: www.scandinavian.net -- Results Jan -Sep 2002
11/12/200219
Structural measures 5 areas of focus
130012001200
1600
0200400600800
10001200140016001800
Productionconcept
Management &Administration
Newcommercialstrategies
Distribution &Sales
Ground &TechnicalServices
1100
MSEK
Revenue Revenue Revenue Revenue enhancementenhancementenhancementenhancement
AESALC
ALF
AMS
ARN
BDU
BGO
BOO
BRU
CDG
CPH
DUB
DUSEVE
EW RFCO
FRA
GOT
HAU
KKN
KRS
LHR
M AN
MXP
NCE
SVG
TOSTRD
AA LAARAG PALCAM SARNBCN
B GOBHX
BKKBLQ
BRUBUD
CDGCGNDEL
DUBD US
EWRFCO
FRAGD N
G OTGVA
HAJHAM
HELIAD
JKGKGDKRKKSDLEDLHRLINM ADM ANM UCMXP
NCENRK
NRTORB
ORDOSL
PEKP MI
POZ
PRGSEA
SFJSTN
STR
SVGSVO
TLVTRD
TRFVIE
VNOVSTVXOWAWWROZRH
Nytt konceptAG H
AMSBRU
CDGCPH
DUB
DUS
EW R
FCO
FRA
GOT
GVA
HAM
HEL
KID
KLR
KRN
KSD
LEDLHR
LINLLAMM XM XPNCE
OER
ORD
OSD
OSL
RNB
SDL
SFT
STN
SVO
TKU
TLL
TMP
TXL
UM E
VNOVXO
WAWZRH
29 000
31 000
33 000
35 000
37 000
JAN
FEB
MA
R
APR
MA
J
JUN
JUL
AU
G
SEP
OK
T
NO
V
DEC JA
N
FEB
MA
R
APR
MA
J
JUN
JUL
AU
G
SEP
OK
T
NO
V
DEC
A 01 A 02 F1 02
4/7 %
SA
S P
rice
SA
S P
rice
Agentmark-up possibili ty
TodayTomorrow
SA
S P
rice
SAS direc t sal es
mark-up
(ROSA)
11/12/200220
Why will we succeed this time?
� Most ambitious improvement measures ever introduced in pipeline – Strong top management
commitment– Everything on plan so far
• Short term 2003• Structural 2004/05
� Healthy internal competition – If you deliver you expand!
� Increased transparency� New competitive arena
externally
AESALC
ALFAM S
ARN
BDU
BGO
BOO
BRU
CDG
CPH
DUBDUS
EVEEWR
FCOFRA
GOT
HAU
KKN
KRS
LHR
M AN
MXP
NCE
SVGTOS
TRD
AALAARA GPALCAMSA RN
BCNBGO
B HXBKK
B LQBRU
BUD
CD G
CGNDEL
DUBDUS
EWRFCO
FRAG DN
G OTGVA
H AJHAM
H ELIADJK GKG DKR KK SDLEDLHRLINMADMANMUCMXP
NC ENR K
NRTO RB
ORDO SL
PEKPMI
PO Z
PR GS EA
S FJSTN
STR
SV GS VO
TLVTRD
TRFVIE
V NOVSTVXOWAWWROZRH
Nytt konceptAGH
AMS BRUCDG
CPHDUB
DUS
EWR
FCO
FRA
GOT
GVA
HAM
HEL
KID
KLR
KRNKSD
LEDLHRLINLLAMM XMXPNCE
OERORD
OSD
O SL
RNB
SDL
SFT
STN
SVO
TKU
TLL
TM P
TXLUME
VNOVXO
WAW ZRH
11/12/200221
Changes in production concept MSEK 1 600 in savings
New production philosophy =Restructuring and improving aircraft rotations� Point to point rotation up from 40% to
95%� Improved aircraft utilization rates
– ABH/ Block hour up from 7,5 to 9 9 hrs.
– Legs/ a/c up� Improved capacity utilization
– +5 p.u. on average� Aircraft turn around by 5-10 min� Utilize peak/ off peak for maintenance etc.� Aircraft/ crew overnights reduced to
minimum� Pilot hours up from less than 500 hrs to
600hrs per annum
AESALC
ALF
AMS
ARN
BDU
BGO
BOO
BRU
CDG
CPH
DUBDUS
EVEEWR
FCOFRA
GOT
HAU
KKN
KRS
LHR
MAN
MX P
NCE
SVG
TOSTRD
AALAARAGPALCAMS
ARNBCN
BGOBHX
BKKBLQ
BRUBUD
CDG
CGNDEL
DUBDUS
EWRFCO
FRAGDN
GOTGVA
HAJHAM
HELIAD
JKGKGDKRKKSDLEDLHRLINMADMAN
MUCMXP
NCENRK
NRTORB
ORDOSL
PEKPMI
POZ
PRGSEA
SFJSTN
STR
SVGSVO
TLVTRD
TRFVIE
VNOVST
VXOWAWWROZRH
Nytt konceptAGH
AMS BRUCDG
CPH
DUB
DUS
EW R
FCO
FRA
GOT
GVA
HAM
HEL
KID
KLR
KRN
KSDLED
LHRLINLLAMMXMXP
NCEOER
ORD
OSD
OSL
RNB
SDL
SFT
STN
SVO
TKU
TLL
TMP
TXL
UME
VNOVXO
W AW ZRH
Scandinavian Airlines
Reduced peaks in Copenhagen hub will affect productivity positivelyTotal savings in Ground Services by MSEK 600
- Blue line current movements
- Grey area new schedule
Departures
Arrivals
11/12/200223
Scandinavian Airlines
Significant flight crew and a/c productivity improvements in pipeline 2002-2003
CurrentCurrentCurrentCurrent ShortShortShortShort----term term term term ChangeChangeChangeChangetargettargettargettarget 2003/04 _2003/04 _2003/04 _2003/04 _
Cockpit Cockpit Cockpit Cockpit crew utilizationcrew utilizationcrew utilizationcrew utilization 490 490 490 490 600600600600 +20%(BLH/pilot/year)Cabin Crew utilizationCabin Crew utilizationCabin Crew utilizationCabin Crew utilization 530530530530 600600600600 +13%
Legs /Legs /Legs /Legs /acacacac////daydaydayday 6,706,706,706,70 6,876,876,876,87 +2,5%Aircraft night stopsAircraft night stopsAircraft night stopsAircraft night stops 800800800800 500500500500 +60%
11/12/200224
Reduction Overhead Support & Administration –MSEK 1 200 in savings effect as from 2003
� Achieved: 32% reduction in administrative costs and personnel in group functions, business units and Scandinavian Airlines� Reduced ambition levels� Productivity
improvements�Personnel reductions well according to plan�Reduction of 900 full time employees by end 2005
29 000
31 000
33 000
35 000
37 000
JAN
FEB
MAR AP
R
MAJ
JUN
JUL
AUG
SEP
OKT
NO
V
DEC JAN
FEB
MAR AP
R
MAJ
JUN
JUL
AUG
SEP
OKT
NO
V
DEC
A 01 A 02 F1 02

The SAS Group Investor RelationsTel. +46 (0) 8 797 1451 Fax: +46 (0)8 797 5110
e-mail: [email protected] --- Homepage: www.scandinavian.net -- Results Jan -Sep 2002
11/12/200225
Short term measures redundancies
200200
3 500
500
200
700
1500
200
Estimated redundancies
fall 2001
Redundancies
Rest of Group
Effect during 2002
Transferred to structural
EmployeesIn other activities
Affect achieved
through other act
Halted Planned
Expansion
Will be effectuated
In 2003
11/12/200226
Structural measures redundancies
2700
700
300200
1500
0
500
1000
1500
2000
2500
3000
TOTAL Adm. Pilots Producingunits
2003-2004
Completed/agreed
In process
11/12/200227
Total group Total group Total group Total group shortshortshortshort term term term term measuresmeasuresmeasuresmeasures MSEK 6 400MSEK 6 400MSEK 6 400MSEK 6 400(Gross 2003 full year effect)
Whereas Subsidiaries & affiliates MSEK 1 300Scandinavian Airlines MSEK 5 100
Status Group short term Result Improvement measures 2002/2003
Network reductions MSEK 500Revenue enhancements1) MSEK 2 200Cost reductions MSEK 2 400
1) Price increase of 5% nominal and introduction of surcharge of 4 USD/ pax/legOffset by increased insurance cost, security costsand negative mix
Result effects 2003 MSEK 2400
2002 MSEK 1700
Distribution:1st Quarter 200-3002nd Quarter 300-4003rd Quarter 400-5004th Quarter 600-700
11/12/200228
Status improvement programsGross full Gross full Gross full Gross full year effect year effect year effect year effect JanJanJanJan----Sep 2002Sep 2002Sep 2002Sep 2002
Short term measuresReductions in traffic system 500 375Revenue enhancement 2 200 *)Cost reductions 2 400 1 000Other business areas than SK 1 300 700Total Approx. 6 400 2 075
*) = Revenue enhancements comprising a supplementary charge of USD 4/passenger/flight/and a general price increase of 5% are neutralized to a considerable extent by a negative passenger mix and higher insurance costs.
Structural measuresTotal Approx. 6 400 0
TOTAL ALL MEASURES Approx. 12 800 2 075
11/12/200229
Business areaBusiness areaBusiness areaBusiness area
11/12/200230
EBITDAR per business area
January - September2002 2001
Scandinavian Airlines +2 652 +2 230Subsidiary & aff. Airlines +2 694 +351Airline Related Businesses +370 +506Rezidor SAS Hospitality* +165 +203Group eliminations* +81 0EBITDAR +5 962 +3 290
* = Including leasing cost

The SAS Group Investor RelationsTel. +46 (0) 8 797 1451 Fax: +46 (0)8 797 5110
e-mail: [email protected] --- Homepage: www.scandinavian.net -- Results Jan -Sep 2002
11/12/200231
Earnings before taxes – EBTBef cap. gains
January - September2002 2001
Scandinavian Airlines -749 -552Subsidiary & aff. Airlines +374 +86Airline Related Businesses +77 +183Rezidor SAS Hospitality +98 +81Group eliminations +82 0EBT bef. gains -118 -202
11/12/200232
Scandinavian Airlines
11/12/200233
Turnaround in Scandinavian Airlines underway, but challenges lay ahead
JulyJulyJulyJuly----SeptemberSeptemberSeptemberSeptember January January January January –––– SeptemberSeptemberSeptemberSeptember2002002002002222 2001200120012001 2002200220022002 2001200120012001
Passenger revenues 8 052 8 383 25 399 25 801EBITDAR +758 +480 2 652 2 230
Net financials -316 43 -613 47
EBT 192 -294 -377 -350EBT bef gains -431 -501 -749 -552
Scandinavian Airlines
11/12/200234
Scandinavian Aielines key airline profitability drivers
Scandinavian Airlines
Traffic growth (RPK) down 1,0% down 0,6%Cabin Factor up 4,0 p.u. Up 2,8 p.u.Yields down 2,1% down 2,3%
Unit costs down 0,3% up 2,6%
JulJulJulJul----SepSepSepSep JanJanJanJan----SepSepSepSep
2002 vs 20012002 vs 20012002 vs 20012002 vs 2001
11/12/200235
Passenger Yield3rd Quarter 2002 vs 2001
Adjusted AdjustedRoute Sector yield Q3 yield Jan-Sep
Scandinavian Airline 98 98
Intercontinental 99 96Europe 101 98Intrascandinavian 101 102Denmark/Greenland 104 106Norway 130 128Sweden 102 103
Scandinavian Airlines
11/12/200236
Scandinavian Airlines passenger load factors close to AEA average
45
50
55
60
65
70
75
80
Jan
Apr Jul
Oct 1 4 7 10 13 16 19 22 25 28 31 34 37
Pas
s lo
ad f
acto
r (%
)
SK (GeograpicalEurope)
AEA (GeograpicalEurope)
Source: AEA
Average gap Scandinavian Airlines
vs AEA 5 p.u. in 2001
Scandinavian Airlines
MonthMonthMonthMonth 2001200120012001 Week 2002Week 2002Week 2002Week 2002

The SAS Group Investor RelationsTel. +46 (0) 8 797 1451 Fax: +46 (0)8 797 5110
e-mail: [email protected] --- Homepage: www.scandinavian.net -- Results Jan -Sep 2002
11/12/200237
-100
-50
0
50
100
150
200
35 39 43 47 51 3 7 11 15 19 23 27 31 35 39
Week SAS AEA
�Airbus A340 introduced on New York and Chicago from Copenhagen
– Strong load factors during summer
�Week 01-week 39:– European airlines
(AEA) traffic down 11,7%
– SAS traffic up 14,5%
�Airbus A340 introduced on New York and Chicago from Copenhagen
– Strong load factors during summer
�Week 01-week 39:– European airlines
(AEA) traffic down 11,7%
– SAS traffic up 14,5%
Source: AEA, SAS
Cabin factor (%) North Atlantic
60%65%70%75%80%85%90%95%
Novembe
r
Decem
ber
January
Februa
ryMarc
hApri
lJu
ne July
Augus
t
Septe
mber
Month
Recovery on North Atlantic traffic
RPKRPKRPKRPK
Scandinavian Airlines
11/12/200238
-30-20-10
01020304050
35 40 43 46 49 52 3 6 9 12 15 18 21 24 27 30 33 36 39
Week SAS AEA
� Scandinavian Airlines ranked high in customer surveys
� New capacity incremental growth in RPK
�Stable cabin factors
�Week 01-week 39:– AEA traffic down 3,1%– SAS traffic up 20,6%
� Scandinavian Airlines ranked high in customer surveys
� New capacity incremental growth in RPK
�Stable cabin factors
�Week 01-week 39:– AEA traffic down 3,1%– SAS traffic up 20,6%
Source: AEA, SAS
Cabin factor (%) Asia
70%75%80%85%90%95%
Novem
ber
Decem
ber
Janua
ry
Februa
ryMarc
hApri
lMay
June Ju
ly
Augus
t
Septem
ber
Month
Strong performance on Asian routes
RPKRPKRPKRPK
Scandinavian Airlines
11/12/200239
-20-15-10
-505
1015202530
37 40 43 46 49 52 3 6 9 12 15 18 21 24 27 30 33 36 39
Week SAS AEA
�Cabin factor improved significantly in Q2
�Seasonal effect in Jan, Feb
�Week 01-week 39:– AEA traffic down 3,8%– SAS traffic up 0,5%
�Cabin factor improved significantly in Q2
�Seasonal effect in Jan, Feb
�Week 01-week 39:– AEA traffic down 3,8%– SAS traffic up 0,5%
Source: AEA, SAS
European routes – strong load factors, but adverse mix
Cabin factor (%) Europe
40%45%50%55%60%65%70%75%
November
December
Janu
ary
Februa
ryMarc
hApri
lMay
June
July
Augus
t
Septem
ber
Month
RPKRPKRPKRPK
Scandinavian Airlines
11/12/200240
European routes Continued fall in Business Class –the challenge of Scandinavian Airlines
�Still negative mix compared with very weak October 01
�Slowdown accelerated after September11
�Total traffic Q3 –6,7%-40%
-30%
-20%
-10%
0%
10%
20%
January
Marsh
May
July
September
Novem
ber
January
March
May02
02-jul
02-sep
Business Class (RPK vs Last year) Europe
Scandinavian Airlines
11/12/200241
Yield development in Europe 2002�High cyclical pattern�Pressure on yield�Easy comparables Sep 02
-15%
-10%
-5%
0%
5%
10%
Jan Feb Mar Apr May Jun jul Aug Sep
Europe
2 per. Mov. Avg.(Europe)
11/12/200242
Contingency plan in case of Iraq war
� Implementation of plan as soon as conflicts start or when an escalation affect demand significantly
� Base case 10-15% capacity reduction� Plan can be escalated in additional steps if market conditions
weakens further� Short lead times for reinstalling of capacity
Scandinavian Airlines
-30,0%
-25,0%
-20,0%
-15,0%
-10,0%
-5,0%
0,0%Case1 Case 2 Case 3
ASKASKASKASK

The SAS Group Investor RelationsTel. +46 (0) 8 797 1451 Fax: +46 (0)8 797 5110
e-mail: [email protected] --- Homepage: www.scandinavian.net -- Results Jan -Sep 2002
11/12/200243
New competitors has entered the marketplace Small low cost carrier on Norwegian domesticNew player in Sweden – Swedish domestic from Oct02The Group takes threat seriouslyKey competitive advantages
Many frequencies, higher service levels, corporate accounts and strong networkMain strategy for low cost competition
Reduce costsPrice differentiation –internet salesRetain competitive advantagesUse of other group companies with lower costs
11/12/200244
Reduction in capacity since 2001 Reduction in capacity since 2001 Reduction in capacity since 2001 Reduction in capacity since 2001 ----4% in 2002 4% in 2002 4% in 2002 4% in 2002 vs vs vs vs 2001200120012001+1% in 2003 +1% in 2003 +1% in 2003 +1% in 2003 vs vs vs vs 2002200220022002
Domestic Domestic Domestic Domestic incl intrascanincl intrascanincl intrascanincl intrascan
EuropeEuropeEuropeEurope
IntercontinentalIntercontinentalIntercontinentalIntercontinental
TotalTotalTotalTotal
Significant reduction in capacity to continue in 2003 for Scandinavian Airlines
Surplus of aircraft summer 2003Surplus of aircraft summer 2003Surplus of aircraft summer 2003Surplus of aircraft summer 2003• Phase out of 8 DC9’s• Leased out 4 Boeing 737-800 and 3 MD 80's• 13 aircraft are fully depreciated Fokker 50 and Fokker 28's.• Remaining 18 aircraft (3 Boeing 767) will be sold or leased out
Summer 03Summer 03Summer 03Summer 03 November 01November 01November 01November 01
153153153153 199199199199 46464646
Number Number Number Number of aircraftof aircraftof aircraftof aircraft
----13%/ 13%/ 13%/ 13%/ ----9%9%9%9%
----9%/9%/9%/9%/----13%13%13%13%
+11%/+11%/+11%/+11%/----8%8%8%8%
----4% / 4% / 4% / 4% / ----10%10%10%10%
Expected 2002Expected 2002Expected 2002Expected 2002
ASK Single tripsASK Single tripsASK Single tripsASK Single trips
----17% 17% 17% 17% ----18% 18% 18% 18%
+5% +1%+5% +1%+5% +1%+5% +1%
+13% +7% +13% +7% +13% +7% +13% +7%
+1% +1% +1% +1% ----10% 10% 10% 10%
Plan 2003Plan 2003Plan 2003Plan 2003
ASK Single tripsASK Single tripsASK Single tripsASK Single trips
11/12/200245
Revenues 25 399 MSEK (-1,6%)
Whereas currency +1.4%volumes - 0.6%yields - 2.3%
Passenger revenues mainly affected by yield and currency Jan-Sep 2002
Price +6,1%Class mix -3,8%Other mix -1,6%
Scandinavian Airlines
11/12/200246
Yields under pressure 3rd Quarter2001-3rd Quarter 2002 Total system - currency adjusted
�Yields down 2,2% in 3rd Quarter 2002– Class mix negative– Campaigns– More RPK’s of
intercontinental traffic with lower yield
Scandinavian Airlines
-6%
-5%
-4%
-3%
-2%
-1%
0%
1%
2%
3rd Quarter2001
4th Quarter2001
1st Quarter2002
2nd Quarter2002
3rd Quarter2002
11/12/200247
Trend with increasing unit cost broken in 2nd and 3rd Quarter as improvement measures start to give effect
�After a period of increases units costs are down in spite of weaker volumes (ASK)
-4%
-2%
0%
2%
4%
6%
8%
10%
1stQuarter2001
2ndQuarter2001
3rd Q2001
4th Q2001
1st Q2002
2nd Q2002
3rd Q2002
Index last year(currency adjusted)
Scandinavian Airlines
11/12/200248
Unit Cost continued down in 3rd Quarter
-1,0%0,0%1,0%2,0%3,0%4,0%5,0%6,0%7,0%8,0%9,0%
1st Quarter 2nd Quarter2002
3rd Quarter
Index last year(currency adjusted) �In spite of capacity
reductions
�Unit Cost down 0,3% 3rd Quarter 2002
�Unit Cost up 2,3% Jan-Sep 2002
�In spite of capacity reductions
�Unit Cost down 0,3% 3rd Quarter 2002
�Unit Cost up 2,3% Jan-Sep 2002
Scandinavian Airlines

The SAS Group Investor RelationsTel. +46 (0) 8 797 1451 Fax: +46 (0)8 797 5110
e-mail: [email protected] --- Homepage: www.scandinavian.net -- Results Jan -Sep 2002
11/12/200249
All government insurance guarantees seized August 1, 2002�Government guarantees in place until June 30nd
2002�Danish Guarantee extended until July 31�As from August 1 all SAS aircraft insured in the
commercial insurance market– Costs neutral compared with guarantees
�Total insurance costs 8-10 times higher than prior to Sep 11
Scandinavian Airlines
11/12/200250
ECA –European cooperation agreement continued negative effects
�Tri-party Joint Venture agreement with BMI, Lufthansa and SAS signed November 9, 1999
�In effect from January 1, 2000�Main scope: To integrate the parties scheduled
pass. transport to/ from London/ Manchester�Negative result effect 2001: MSEK 335 �Effect Q1 2002 - MSEK 113�Effect Q2 2002 -MSEK 104�Effect Q3 2002 – MSEK 86
Scandinavian Airlines
11/12/200251
Brent Crude vs. Jet FuelJanuary 1998 - October 2002
0
10
20
30
40
50
60
1998
-01-02
1998
-03-30
1998
-06-26
1998
-09-21
1998
-12-16
1999
-03-16
1999
-06-15
1999
-09-08
1999
-12-01
2000
-02-29
2000
-05-26
2000
-08-21
2000
-11-14
2001
-02-12
2001
-05-10
2001
-08-03
2001
-10-30
2002
-01-25
2002
-04-24
2002
-07-23
2002
-10-15
US D
olla
r per
Bar
rel
0
50
100
150
200
250
300
350
400
450US Dollar per M
etric Ton
Brent 1st Nearby Close
Jet CIF Cargoes NWE
11/12/200252
Current outlook 2002 lowered by MSEK 200 vs 2nd Quarter
� Average rates:� 2000 270 USD/MT� 2001 255 USD/MT� Q1 2002 189 USD/MT� Q2 2002 224 USD/MT� Q3 2002 233 USD/MT
Current hedging ratio Next 12 months 50%Hedging until year end 70%
� Estimate Full year 2002 MSEK 3 200 (vs 3 400)(Based on current levels)
Scandinavian Airlines
11/12/200253
Scandinavian Airlines’ new net pricing concept as from 2003
• Estimated effect of 1 300 MSEK of which revenue enhancement 800 MSEK
• Net price concept to be introduced 1 January 2003
• Prices lowered with same amount as commissions
• Agent will set their own price to the customer
• Markup can vary from channel to channel
• Introduction of service fees in SAS’ direct channels
• Introduction of new agent program
4/7 %
SAS
Pric
e
SAS
Pric
e
Agentmark-up
possibility
Today Tomorrow
SAS
Pric
e
SAS direct sales
mark-up
SAS Price
SAS Price
SAS Price
SAS Price
SAS Price
SAS Price
SAS Price
SAS Price
SAS Price
SAS Price
SAS Price
SAS Price
4,7%
Scandinavian Airlines
11/12/200254
Electronic Channels steady at 21%
0%
5%
10%
15%
20%
25%
jan-0
0
mar
-00
maj-
00jul
-00
sep-00
nov-0
0
01-ja
n
01-mar
01-m
aj
01-no
v
Q1-20
02
Q3-20
02
% Sold - Travel Pass, Travel Pass Corporate,ETIX, Internet% Sold via Internet
� Total volume E-channels in Q3 MSEK 1 618
� 20% of total passenger sales in Q3
� New web site launched in May
Scandinavian Airlines

The SAS Group Investor RelationsTel. +46 (0) 8 797 1451 Fax: +46 (0)8 797 5110
e-mail: [email protected] --- Homepage: www.scandinavian.net -- Results Jan -Sep 2002
11/12/200255 11/12/200256
Income Subsidiary & Affiliated Airlines –Braathens and Spanair fully consolidated
(MSEK)
January – September2002 2001
Operating revenues 12 877 2 265
EBITDAR +2 694 +351
EBTEBTEBTEBT bef gainsbef gainsbef gainsbef gains +374*+374*+374*+374* +86+86+86+86
* = Includes Spanair as affiliated company Nov/Dec 2001 because of change of financial year
11/12/200257
Revenues 4 669* -3,3% 5 515 5,9% 1901 20,8% 781 14,5%
EBITDAR 853* 59% 1 298 180% 329 17% 202 231%
EBT 24* n.m 634 n.m 66 25% 77 n.m
* = Spanair accumelated figures for the period March-September
Jan-Sep in MSEK
Significant better earnings in Subsidiary & Affiliated Airlines Jan-Sep 2002 vs 2001
11/12/200258
Spanair on track but affected by weak charter market EBT in Q3 of 153 MSEK
� Spanish domestic market down 10% overall
� Increased market share from 22% to 27% on Spanish domestic
� Weak charter market (-15%)� Significantly increased yield -
27,2% Jan-Sep�Closure of intercontinental
traffic�Focus on high yield markets�Price increases in Spanish
market
� Spanish domestic market down 10% overall
� Increased market share from 22% to 27% on Spanish domestic
� Weak charter market (-15%)� Significantly increased yield -
27,2% Jan-Sep�Closure of intercontinental
traffic�Focus on high yield markets�Price increases in Spanish
market
MSEK MSEK MSEK MSEK JulJulJulJul----Sep 2002Sep 2002Sep 2002Sep 2002Passenger revenue 1 343 Other revenues 970
Operating revenues 2 313EBITDAR 541EBIT 220 EBT 153
11/12/200259
Spanair ready to join STARFull member as from 2003
SASSASSASSAS
LUFTHANSALUFTHANSALUFTHANSALUFTHANSA
UNITEDUNITEDUNITEDUNITED
AIR CANADA /AIR CANADA /AIR CANADA /AIR CANADA /
CANADIANCANADIANCANADIANCANADIAN
THAI THAI THAI THAI
VARIGVARIGVARIGVARIG
AIR NEW ZEALANDAIR NEW ZEALANDAIR NEW ZEALANDAIR NEW ZEALAND
ALL NIPPONALL NIPPONALL NIPPONALL NIPPON
AUSTRIANAUSTRIANAUSTRIANAUSTRIAN
LAUDA AIRLAUDA AIRLAUDA AIRLAUDA AIR
TYROLEANTYROLEANTYROLEANTYROLEAN
SINGAPORESINGAPORESINGAPORESINGAPORE
MEXICANAMEXICANAMEXICANAMEXICANA
BRITISH MIDLANDBRITISH MIDLANDBRITISH MIDLANDBRITISH MIDLAND
SSSSPANAIRPANAIRPANAIRPANAIR
11/12/200260
Spanair’s unit cost well in line with european low cost carriers
�Long-haul operations closed in March 2002
�Improved mix�Shift from low yield to
high yield markets
�Key Operating data:– Total Aicraft utiliz 9,2 hrs/ day– Cabin Crew 900 hrs/year
�Cost reductions�Capacity reductions�Unit cost in line with
low costs carriers�Positive operating profit
for 2002 (including capital gains)
�Cost reductions�Capacity reductions�Unit cost in line with
low costs carriers�Positive operating profit
for 2002 (including capital gains)

The SAS Group Investor RelationsTel. +46 (0) 8 797 1451 Fax: +46 (0)8 797 5110
e-mail: [email protected] --- Homepage: www.scandinavian.net -- Results Jan -Sep 2002
11/12/200261
Braathens – continues to perform well on Norwegian market
JulyJulyJulyJuly----SeptemberSeptemberSeptemberSeptember 2002200220022002 2001200120012001Passenger Passenger Passenger Passenger RevenueRevenueRevenueRevenue 1 5221 5221 5221 522 1 4131 4131 4131 413OtherOtherOtherOther RevenuesRevenuesRevenuesRevenues 421 421 421 421 374374374374
Operating RevenuesOperating RevenuesOperating RevenuesOperating Revenues 1 9431 9431 9431 943 1 7871 7871 7871 787EBITDAREBITDAREBITDAREBITDAR +428 +428 +428 +428 +164+164+164+164
EBTEBTEBTEBT +190 +190 +190 +190 ----69696969
� 9 % fall in the total domestic market compared withJan - Sept 2001
� Cabin factor Jan – Sept on scheduled was 58,6 % vs 52,1 % in same period 2001
� 9 % fall in the total domestic market compared withJan - Sept 2001
� Cabin factor Jan – Sept on scheduled was 58,6 % vs 52,1 % in same period 2001
11/12/200262
�New route schedule from April 2 and full effect of large capacityand cost cuts late 2001 gave significant improvements
�Jointly with Scandinavian Airlines provide a superior net work and good products to meet competition
�New route schedule from April 2 and full effect of large capacityand cost cuts late 2001 gave significant improvements
�Jointly with Scandinavian Airlines provide a superior net work and good products to meet competition
Strong performance in Braathens during Jan-Sep of 2002
11/12/200263
Widerøe and Air Botnia significantly improved results
Widerøe� Increased traffic by 21,5% in
Q3 and good performance.
Jan Jan Jan Jan –––– SepSepSepSep 2002200220022002� Total Revenues MSEK 1 901
(+21%)� EBITDAR MSEK 329 (+17%)
� EBT MSEK 66 (+25%)
Air Botnia� Strong performance and
increased traffic (RPK) by 36,6%.� Strengthened market position
Jan Jan Jan Jan –––– SepSepSepSep 2002200220022002� Total Revenues MSEK 781
(+15%)� EBITDAR MSEK 202 (+231%)
� EBT MSEK 77 (n.m)
11/12/200264
11/12/200265
Income Business Area Airline Related BusinessEBITDA down 27% mainly due to weak Cargo development
January - SeptemberMSEK 2002 2001
Operating revenues 6 419 5 841Operating expences -6 049 -5 335
EBITDA 370 506
Income before taxes 44 190
11/12/200266
SAS Cargo
� SAS Cargo was established as an independent corporation on June 1st 2001
� SAS Cargo offers together with the WOW Alliance (Lufthansa Cargo and Singapore Airlines Cargo) harmonized express products all over the world.
Key figures Jan-Sep 2002 2001Operating revenue 2 043 1 976
Traffic revenue, MSEK 1 632 1 588
EBITDA, MSEK -26 -
Number of employees 1 134 1 187
* = SAS Cargo was formed in 2001. Operating revenue figures are not available before.

The SAS Group Investor RelationsTel. +46 (0) 8 797 1451 Fax: +46 (0)8 797 5110
e-mail: [email protected] --- Homepage: www.scandinavian.net -- Results Jan -Sep 2002
11/12/200267
Scandinavian IT Group
www.www.www.www.scandinavianscandinavianscandinavianscandinavianITITITIT....comcomcomcom
One of Scandinavia's largest IT companies, with a turnover of 2 463 MSEK in 2001 and a total of more than 1300 employees in three countries
Scandinavian IT GroupCustomer driven - Airline focused - Technology based
Total Revenues 1 676 1 835
EBITDA 176 196
Profit before taxes 81 84
January-September2002 2001
11/12/200268
SAS Trading – turn around in prosess
www.www.www.www.scandinavianscandinavianscandinavianscandinavian....netnetnetnet
Total Revenues 1 560 1 734
EBITDA 36 7
Profit before taxes 4 -24
January-September2002 2001
SAS Trading is a business in the SAS Group and a operator within Travel Retail. SAS Trading had 658 employees at year end 2001 In 2001 SAS Trading lost its concessions for duty free sales and operation of stores at Swedish airports.
11/12/200269
SAS Flight Academy – EBITDA flat 2002 vs. 2001
Training centers for pilots andother personell. 35% ofrevenues outside SAS in 2001.
www.www.www.www.sasflightacademysasflightacademysasflightacademysasflightacademy....comcomcomcom
January-September2002 2001
Total Revenues 458 460
EBITDA 105 107
Profit before taxes 26 38
11/12/200270
Jetpak
Jetpak is one of the fastest growingcompanies withing expresslogistic in theNordic countries. The company is 100%owned by SAS Group and has 151employees
www.www.www.www.jetpakjetpakjetpakjetpak....comcomcomcom
January-September2002 2001
Total Revenues 280 265
EBITDA 2 16
Profit before taxes -3 12
11/12/200271 11/12/200272
Rezidor SAS Hospitality –current brand and market penetration
SIH
Number of hotelsNumber of hotelsNumber of hotelsNumber of hotels
020406080
100120140160180
'94 '95 '96 '97 '98 '99 '00 '01
FranchisedManagedLeasedOwned

The SAS Group Investor RelationsTel. +46 (0) 8 797 1451 Fax: +46 (0)8 797 5110
e-mail: [email protected] --- Homepage: www.scandinavian.net -- Results Jan -Sep 2002
11/12/200273
Revenues 2 599 2 561 +1,5%
Operating result 195 231 -15,6%
Adjusted EBITDA 192 196 -2,0%
Pre tax profit 103 81 -Including gains
Jan-Sep 2002
in MSEK
REZIDOR SAS Hospitality –negatively affected by weaker markets
Jan-Sep 2001 Change
11/12/200274
REZIDOR SAS Hospitality –REVPAR under pressure but better than industry
SIH
-25,00%-20,00%-15,00%-10,00%-5,00%0,00%5,00%
10,00%15,00%
MSEK
01-ju
l
01-s
ep
01-n
ov
02-ja
n
02-m
ar
may
02
02-ju
l
REVPAR - Rezidor REVPAR - Market
Pretax Pretax Pretax Pretax profit:profit:profit:profit:Jan-Sep 2002 103 MSEK
Jan-Sep 200181 MSEK
11/12/200275
�Capitalize on current brand �Platform for further growth – more brands
more choices�Streamlining of products with distinct profile�Capitalize on knowledge and experience�Economies of scale�Reduced cyclically and business risks
New step: Rezidor SAS to invest in new multi-brand concept
11/12/200276
Rezidor SAS signed 30 year partnership agreement with Carlson Companies Inc.�Master franchise agreement with exclusive rights
for Europe, Middle East and Africa with access to:�Global reservations system�Strong marketing network�Existing customer base�Loyalty program�IT and know how�30 year term with exclusivity
�Brand portfolio:�Regent, Radisson SAS, Country Inns and Park Inn
�Insignificant investment - 4,5 MEUR
11/12/200277
�Capitalize on current brand �Platform for further growth – more brands
more choices�Streamlining of products with distinct profile�Capitalize on knowledge and experience�Economies of scale�Reduced cyclically and business risks
New step: Rezidor SAS to invest in new multi-brand concept
11/12/200278
Rezidor SAS signed 30 year partnership agreement with Carlson Companies Inc.�Master franchise agreement with exclusive rights
for Europe, Middle East and Africa with access to:�Global reservations system�Strong marketing network�Existing customer base�Loyalty program�IT and know how�30 year term with exclusivity
�Brand portfolio:�Regent, Radisson SAS, Country Inn and Park Inn
�Insignificant investment - 4,5 MEUR

The SAS Group Investor RelationsTel. +46 (0) 8 797 1451 Fax: +46 (0)8 797 5110
e-mail: [email protected] --- Homepage: www.scandinavian.net -- Results Jan -Sep 2002
11/12/200279
�Regent– Established in 1970, 5-star deluxe, 10 hotels in North
America, Asia & Europe (1 in Berlin, Germany & 1 in Almaty, Kazakhstan)
�Country Inns– Established in 1987, Mid-market, 300 hotels in North
America & Asia, 12 hotels in Europe
�Park Inn– Included in Carlson Hotels in 2000, 3-star, limited service
business hotel, 60 hotels in North America & Asia
Three new brands acquired for MSEK 60
11/12/200280
Rezidor SAS Brand Positioningin Europe
FullFullServiceService
LuxuryLuxury
First ClassFirst Class
Limited ServiceLimited Service
MidMid--PricedPricedeconomyeconomy
“Hard” Budget“Hard” Budget
MinimumMinimumServiceService
Formula1
Ibis
Holiday InnNovotelScandic
HiltonMarriott
Radisson SASSheraton
Inter-ContinentalRegent
Four Seasons
Country InnsPark Inn
11/12/200281
Radisson SAS current growth strategy�Expansion in existing home markets –
Scandinavia, Finland, Germany
�Extend home markets to UK, France, Benelux & Poland
�Expand in capitals & other important cities - e.g. Athens, Barcelona, Cairo, Rome, Zagreb…
�Extend into leisure & resorts
�Focus on airport hotels
11/12/200282
Financials
11/12/200283
Clear targets to reduce indebtness2004
Current situation:Current situation:Current situation:Current situation:� Loss situation and peak in
investments and acquisitions� Key figures Q3/02 vs Q3/01
– Solidity: 22% (30%)– Net debt/ equity 0,79 (0,33)– Adj net debt to equity 1,47
(0,65)
� Financial position adequate, to be safeguarded
� Clear targets introduced
Target:Target:Target:Target:� Net debt to peak in 2002� Targets 2004
– Solidity >30%– Net debt/ equity <50%– Adj net debt/ equity
<150%� Surplus values in fleet
reduced after Sep 11� Relesase of main assets:
– Properties– Non-core subs
11/12/200284
Considerable surplus values despite reduced aircraft prices
Surplus value, aircraft
0100020003000400050006000
1992
1993
1994
1995
1996
1997
1998
1999
2000
2001
Q1 200
2
Q2 200
2
Q3 200
2
MS
EK
0%5%
10%15%20%25%30%35%40%45%
1996 1997 1998 1999 2000 2001 Q12002
Q22002
Q32002
Surplus value in relation to booked value

The SAS Group Investor RelationsTel. +46 (0) 8 797 1451 Fax: +46 (0)8 797 5110
e-mail: [email protected] --- Homepage: www.scandinavian.net -- Results Jan -Sep 2002
11/12/200285
Gearing level has peakedConsolidation ahead
�Leverage to peak during 2002
�Moody’s Baa3 Investment grade rating
0%
50%
100%
150%
200%
Dec-98
Mar-99
Jun-99
Sep-99
Dec-99
Mar-00
Jun-00
Sep-00
Dec-00
Mar-01
Jun-01
Sep-01
Dec-01
Mar-02
Jun-02
Sep-02
Net Debt / Equity Net Debt + NPV op lease / Equity
11/12/200286
Aircraft Investment Programme almost fully Completed
SAS Group CAPEX 1995-2005
0
200
400
600
800
1000
1200
1400
1995 1996 1997 1998 1999 2000 2001 2002 2003 2004 2005
MUSD
11/12/200287
Outlook 2002
11/12/200288
October figures includes all airlines in Group
�Group improved passenger load factor by 9,0 p.u.�Scandinavian Airlines improved load factor by 10,5 p.u
PassengerPassengerPassengerPassenger---- Seat capacitySeat capacitySeat capacitySeat capacity CabinCabinCabinCabin----traffic (RPK)traffic (RPK)traffic (RPK)traffic (RPK) (ASK)(ASK)(ASK)(ASK) factorfactorfactorfactor
SAS Group TotalSAS Group TotalSAS Group TotalSAS Group Total +6,8%+6,8%+6,8%+6,8% ----7,7%7,7%7,7%7,7% 66,5%66,5%66,5%66,5%IntercontinentalIntercontinentalIntercontinentalIntercontinental +19,0%+19,0%+19,0%+19,0% ----6,6%6,6%6,6%6,6%EuropeEuropeEuropeEurope +3,8%+3,8%+3,8%+3,8% ----6,0%6,0%6,0%6,0%Domestic andDomestic andDomestic andDomestic and ----1,0%1,0%1,0%1,0% ----10,8%10,8%10,8%10,8%IntrascandinavianIntrascandinavianIntrascandinavianIntrascandinavian
11/12/200289
Outlook –operating key figures - year 2002
Group Scandinavian AirlinesASK -9% -4%Frequencies -10%
RPK -2% +2%Passenger yield (currency adjusted) n.m. > –2,5%
Unit costs n.m. down
�Growth expectations reduced �Further capacity adjustments planned
Key figure
11/12/200290
Assessment for full year 2002:
The Board of Directors
�Yield lower than expected�Result improvement measures take effect
according to plan�Forecast from August 8 downgraded
– SAS Pre-tax profit before gains and restructuring charge negative
– Gains on sale approximately 250 MSEK– Restructuring charge of approximately MSEK 600

The SAS Group Investor RelationsTel. +46 (0) 8 797 1451 Fax: +46 (0)8 797 5110
e-mail: [email protected] --- Homepage: www.scandinavian.net -- Results Jan -Sep 2002
11/12/200291
Sum up – 3rd Quarter 2002
�Balance between supply and demand�Yields and revenues under pressure�Scandinavian Airline has forceful measures in
process– Short term 2002/2003– Structural 2003/2004/2005
�Braathens significant positive result�Spanair positive operating result�Pressure on yield expected 4th Quarter
11/12/200292
APPENDICES
11/12/200293
Scandinavian Airlines
Change in RPK, ASK, Cabin Factor vs. last year - Total Scandinavian Change in RPK, ASK, Cabin Factor vs. last year - Total Scandinavian Change in RPK, ASK, Cabin Factor vs. last year - Total Scandinavian Change in RPK, ASK, Cabin Factor vs. last year - Total Scandinavian AirlinesAirlinesAirlinesAirlines
-15%
-10%
-5%
0%
5%
10%
15%
jan-0
1
feb-0
1
mar-
01
apr-0
1
maj-01
jun-0
1jul
-01
aug-
01
sep-0
1
okt-0
1
nov-0
1
dec-0
1
jan-0
2
feb-0
2
mar-
02
apr-0
2
maj-02
jun-0
2jul
-02
aug-
02
sep-0
2
okt-0
2
RPKASKCabin factor
11/12/200294
Scandinavian Airlines
Change in RPK, ASK, and Cabin Factor vs. last year - EuropeChange in RPK, ASK, and Cabin Factor vs. last year - EuropeChange in RPK, ASK, and Cabin Factor vs. last year - EuropeChange in RPK, ASK, and Cabin Factor vs. last year - Europe
-20%
-15%
-10%
-5%
0%
5%
10%
15%
20%
jan-0
1
mar-
01
maj-
01
jul-0
1
sep-0
1
nov-0
1
jan-0
2
mar-
02
maj-
02
jul-0
2
sep-
02
RPKASKCabin factor
11/12/200295
Scandinavian Scandinavian Scandinavian Scandinavian AirlinesAirlinesAirlinesAirlines
Change in RPK, ASK, Cabin Factor vs. last year - I ntrascandinavianChange in RPK, ASK, Cabin Factor vs. last year - I ntrascandinavianChange in RPK, ASK, Cabin Factor vs. last year - I ntrascandinavianChange in RPK, ASK, Cabin Factor vs. last year - I ntrascandinavian
-15%
-10%
-5%
0%
5%
10%
15%
20%
jan-0
1
feb-0
1
mar-01
apr-0
1
maj-01
jun-0
1jul
-01
aug-
01
sep-0
1
okt-0
1
nov-0
1
dec-0
1
jan-0
2
feb-0
2
mar-02
apr-0
2
maj-02
jun-0
2jul
-02
aug-
02
sep-0
2
okt-0
2
RPKASKCabin factor
11/12/200296
Scandinavian Airlines
Change in RPK, ASK, and Cabin Factor vs. last year- IntercontinentalChange in RPK, ASK, and Cabin Factor vs. last year- IntercontinentalChange in RPK, ASK, and Cabin Factor vs. last year- IntercontinentalChange in RPK, ASK, and Cabin Factor vs. last year- Intercontinental
-20%
-10%
0%
10%
20%
30%
40%
50%
jan-01
mar-
01
maj-01
jul-0
1
sep-0
1
nov-0
1jan
-02
mar-
02
maj-02
jul-0
2
sep-0
2
RPKASKCabin factor

The SAS Group Investor RelationsTel. +46 (0) 8 797 1451 Fax: +46 (0)8 797 5110
e-mail: [email protected] --- Homepage: www.scandinavian.net -- Results Jan -Sep 2002
11/12/200297
Traffic and Yield 3rd Quarter 2002 vs 2001
Index
Air Botnia 2002 2001 variance
Production (mill ASK) 162 140 116Traffic (mill RPK) 90 66 137Cabin factor (%) 55.6 47.0 +8.6Yield 81
*) local currency
11/12/200298
Yield DevelopmentJanuary – September 2002 vs 2001(currency adjusted)
-3,0%
-2,0%
-1,0%
0,0%
1,0%
2,0%
3,0%
Jan-Sep 2001 Jan-Sep 2002
Scandinavian Airlines
11/12/200299
(currency adjusted)
Yield Development2001-2002
Yields are under pressure from negative class mix /route mix
-6%
-5%
-4%
-3%
-2%
-1%
0%
1%
2%
3rd Quarter2001
4th Quarter2001
1st Quarter2002
2nd Quarter2002
3rd Quarter2002
Scandinavian Airlines
11/12/2002100
Passenger YieldJanuary-September 2002 vs 2001
Nominal Currency AdjustedRoute Sector yield effect yield
Scandinavian Airline 99 99 98
Intercontinental 94 102 96Europe 99 99 98Intrascandinavian 104 98 102Denmark/Greenland 107 99 106Norway 134 94 128Sweden 103 100 103
Scandinavian Airlines
11/12/2002101
Traffic and Yield3rd Quarter 2002 vs 2001
Scandinavian Airline IndexTotal Scheduled 2002 2001 variance
Production (mill ASK) 8 701 9 310 93Traffic (mill RPK) 6 281 6 346 99Cabin factor (%) 72.2 68.2 +4.0 Yield (öre/RPK) 128.2 132.1 97Currency adj. yield 128.2 131.0 98
Scandinavian Airlines
11/12/2002102
Unit Cost January - September 2002 vs 2001
Volume = average decrease in ASK: -4.6%
MSEKAdjusted Share of
JAN-SEP 01 JAN-SEP 02 Var. % total var %
Commissions 1 686 1 531 -9,2% -0,7%Fuel 2 918 2 379 -18,5% -2,3%Government charges 2 794 2 793 0,0% 0,0%Personnel 9 378 10 482 11,8% 4,7%Other oper. net costs 6 887 7 099 3,1% 0,9%
TOTAL 23 663 24 284 2,6% 2,6%
Scandinavian Airlines

The SAS Group Investor RelationsTel. +46 (0) 8 797 1451 Fax: +46 (0)8 797 5110
e-mail: [email protected] --- Homepage: www.scandinavian.net -- Results Jan -Sep 2002
11/12/2002103
Unit Cost 3rd Quarter 2002 vs 2001
MSEK
Volume = average decrease in ASK: -6.5%
Adjusted Share ofJUL-SEP 01 JUL-SEP 02 Var. % total var %
Commissions 524 487 -7,1% -0,5%Fuel 893 792 -11,3% -1,3%Government charges 931 931 0,0% 0,0%Personnel 2 960 3 396 14,7% 5,5%Other oper. net costs 2 602 2 284 -12,2% -4,0%
TOTAL 7 910 7 890 -0,3% -0,3%
Scandinavian Airlines
11/12/2002104
Unit Cost DevelopmentJanuary - September 2002 vs 2001
0,0%
0,5%
1,0%
1,5%
2,0%
2,5%
3,0%
3,5%
4,0%
Jan-Sep 2001 Jan-Sep 2002
Index last year(currency adjusted)
Scandinavian Airlines
11/12/2002105
Unit Cost Development3rd Quarter 2002 vs 2001
-0,5%
0,0%
0,5%
1,0%
1,5%
2,0%
2,5%
Jul-Sep 2001 Jul-Sep 2002
Index last year(currency adjusted)
Scandinavian Airlines
11/12/2002106
Productivity DevelopmentJanuary -September 2002 vs 2001
Measure is change change of ASK vs number of full time employees
-3,0%
-2,0%
-1,0%
0,0%
1,0%
2,0%
3,0%
Jan-Sep 2001 Jan-Sep 2002
Index last year
Scandinavian Airlines
11/12/2002107
Operating CostsJanuary-September 2002 vs 2001
MSEK JAN-SEP02 JAN-SEP01*) curr adj 01
Personnel costs 10 482 9 893 10 087Leasing costs (aircraft) 1 381 1 632 1 594Sales costs 1 531 1 758 1 768Fuel 2 379 3 132 3 059Governmental charges 2 793 2 909 2 939Meal costs 1 131 1 256 1 270Handling costs 1 306 1 373 1 382Maintenance costs 1 475 1 947 1 944IT and Communication 1 039 1 133 1 137Other Costs 5 349 5 486 5 510
TOTAL COSTS 28 866 30 519 30 690
*) SAS Cargo is included in SAS Airline until May 2001
Scandinavian Airlines
11/12/2002108
Operating Costs3rd Quarter 2002 vs 2001
MSEK JUL-SEP02 JUL-SEP01*) curr adj 01
Personnel costs 3 396 3 144 3167Leasing costs (aircraft) 363 621 557Sales costs 487 570 561Fuel 792 1 086 955Governmental charges 931 1 007 996Meal costs 383 433 431Handling costs 425 466 459Maintenance costs 530 640 635IT and Communication 295 345 334Other Costs 1 711 1 721 1 950
TOTAL COSTS 9 313 10 033 9 945
*) SAS Cargo is included in SAS Airline until May 2001
Scandinavian Airlines
The SAS Group Investor RelationsTel. +46 (0) 8 797 1451 Fax: +46 (0)8 797 5110
e-mail: [email protected] --- Homepage: www.scandinavian.net -- Results Jan -Sep 2002
11/12/2002109
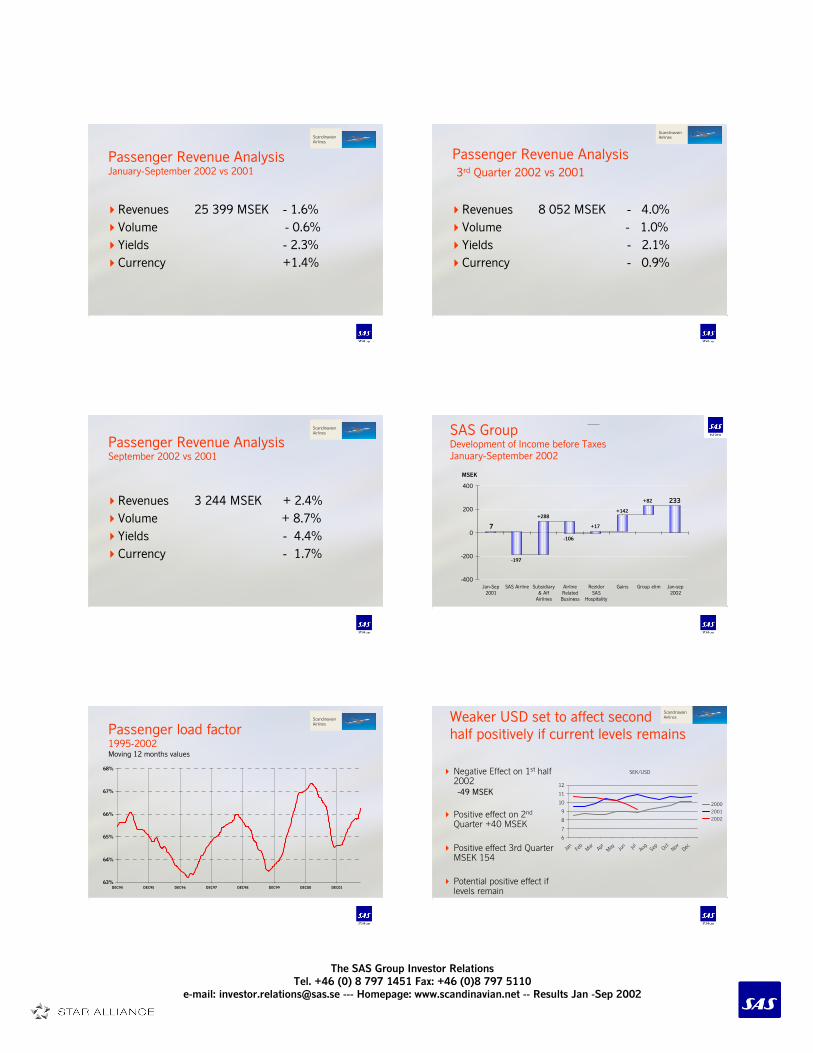
Passenger Revenue AnalysisJanuary-September 2002 vs 2001
�Revenues 25 399 MSEK - 1.6% �Volume - 0.6% �Yields - 2.3%�Currency +1.4%
Scandinavian Airlines
11/12/2002110
Passenger Revenue Analysis3rd Quarter 2002 vs 2001
�Revenues 8 052 MSEK - 4.0% �Volume - 1.0% �Yields - 2.1%�Currency - 0.9%
Scandinavian Airlines
11/12/2002111
Passenger Revenue AnalysisSeptember 2002 vs 2001
�Revenues 3 244 MSEK + 2.4% �Volume + 8.7% �Yields - 4.4%�Currency - 1.7%
Scandinavian Airlines
11/12/2002112
SAS Group Development of Income before Taxes January-September 2002
-400
-200
0
200
400
Jan-Sep2001
SAS Airline Subsidiary& Aff
Airlines
AirlineRelated
Business
RezidorSAS
Hospitality
Gains Group elim Jan-sep2002
233
MSEK
7 +17
-106
+288
-197
+82
+142
11/12/2002113
Passenger load factor 1995-2002Moving 12 months values
63%
64%
65%
66%
67%
68%
DEC94 DEC95 DEC96 DEC97 DEC98 DEC99 DEC00 DEC01
Scandinavian Airlines
11/12/2002114
SEK/USD
6
7
8
9
10
11
12
Jan
Feb
Mar Apr
May Jun jul Au
gSep Oct
Nov Dec
2000
2001
2002
Weaker USD set to affect second half positively if current levels remains
� Negative Effect on 1st half 2002-49 MSEK
� Positive effect on 2nd
Quarter +40 MSEK
� Positive effect 3rd Quarter MSEK 154
� Potential positive effect if levels remain
Scandinavian Airlines

The SAS Group Investor RelationsTel. +46 (0) 8 797 1451 Fax: +46 (0)8 797 5110
e-mail: [email protected] --- Homepage: www.scandinavian.net -- Results Jan -Sep 2002
11/12/2002115
Currency Effects January-September 2002 vs 2001
MSEK JAN-SEP
Total revenues +574Total costs -282Forward cover costs & working cap. -7
Income before depr. +285Financial items -258
Income before tax +27
11/12/2002116
Currency Effects July-September 2002 vs 2001
MSEK JUL-SEP
Total revenues -92Total costs +281Forward cover costs & working cap. -134
Income before depr. +55Financial items -187
Income before tax +132
11/12/2002117
Currency Effects January-September 2002 vs 2001
MSEK JAN-SEP
Total revenues +427Total costs -153Forward cover costs & working cap. -18
Income before depr. +256Financial items -301
Income before tax -45
Scandinavian Airlines
11/12/2002118
Currency Effects July-September 2002 vs 2001
MSEK JUL-SEP
Total revenues -88Total costs +262Forward cover costs & working cap. -126
Income before depr. +48Financial items -177
Income before tax -129
Scandinavian Airlines
11/12/2002119
Currency EffectsJanuary-September 2002 vs 2001
Total revenues & costs:(Total +274 MSEK)Major approx. effects:USD +105DKK -14NOK +197EUR +2Asian curr. -21All others +5
Forward cover costs:(Total -90 MSEK)2001 +912002 +1
Working capital:(Total +72 MSEK)2001 -362002 +36
Financial items:(Total –301 MSEK)2001 +2212002 -80
Grand total –45 MSEK
Scandinavian Airlines
11/12/2002120
Currency EffectsJuly-September 2002 vs 2001
Total revenues & costs:(Total +174 MSEK)Major approx. effects:USD +154DKK +6NOK +54EUR -1Asian curr. -14All others -25
Forward cover costs:(Total -66 MSEK)2001 +382002 -28
Working capital:(Total –60 MSEK)2001 +262002 -34
Financial items:(Total –177 MSEK)2001 +1142002 -63
Grand total –129 MSEK
Scandinavian Airlines

The SAS Group Investor RelationsTel. +46 (0) 8 797 1451 Fax: +46 (0)8 797 5110
e-mail: [email protected] --- Homepage: www.scandinavian.net -- Results Jan -Sep 2002
11/12/2002121
Costs
DKK16%
EUR15%
GBP2%
NOK21%
SEK22%
USD22%
Others2%
Revenues
DKK10%
EUR19%GBP
4%
NOK29%
SEK25%
USD10%
Others3%
Expected currency distribution in the SAS Group 2002
11/12/2002122
Considerable surplus values despite reduced aircraft prices
Surplus value, aircraft
0100020003000400050006000
1992
1993
1994
1995
1996
1997
1998
1999
2000
2001
Q1 200
2
Q2 200
2
Q3 200
2
MS
EK
0%5%
10%15%20%25%30%35%40%45%
1996 1997 1998 1999 2000 2001 Q12002
Q22002
Q32002
Surplus value in relation to booked value
11/12/2002123
Financials and aircraft fleet data
11/12/2002124
Balance SheetMSEKMSEKMSEKMSEK 30SEP02 30DEC01
Liquid funds 10 482 11 662Other interest-bearing assets 7 279 6 810Aircraft 26 429 22 076Other assets 24 621 22 214
Total assets 68 811 62 762
Operating liabilities 19 779 16 975Interest-bearing liabilities 29 027 25 204Subordinated debenture loan 902 920
Deferred tax 3 746 3 856Minority interests -57 263Equity 15 414 15 544
Total liabilities and equity 68 811 62762
Net debt 12 168 5 586
11/12/2002125
Changes in Financial Position
January – September2002 2001
Cash flow from operations +1 879 +407Change in working capital -505 -662
Net financing from operations +1 374 -255Investments, advance payments - 6 806 - 6 495Acquisition of subsidiaries -1 064 0Sell of subsidiaries +843 0Sales of fixed assets, etc. +3 100 +3 320
Financing surplus -2 553 -3 430Changes in external financing, net +1 373 +2 966
MSEKMSEKMSEKMSEK
11/12/2002126
The SAS Group Equity / Assets Ratio 9212-0209
0%5%
10%15%20%25%30%35%40%45%50%
92-12 93-12 94-12 95-12 96-12 97-12 98-12 99-12 00-12 01-12
Including pare nt company from January, 2000.Inc luding Braathe ns from De ce mbe r, 2001 and Spanair from March, 2002.

The SAS Group Investor RelationsTel. +46 (0) 8 797 1451 Fax: +46 (0)8 797 5110
e-mail: [email protected] --- Homepage: www.scandinavian.net -- Results Jan -Sep 2002
11/12/2002127
The SAS GroupNet Debt / Equity Ratio 9212-0209
0,00,30,50,81,01,31,51,82,02,32,5
92-12 93-12 94-12 95-12 96-12 97-12 98-12 99-12 00-12 01-12
Including pare nt company from January, 2000 .Including Braathe ns from De ce mbe r, 2001 and Spanair from March, 2002.
11/12/2002128
Development of net debt 9112-0209
0
2 000
4 000
6 000
8 000
10 000
12 000
14 000
16 000
18 000
91-12 92-12 93-12 94-12 95-12 96-12 97-12 98-12 99-12 00-12 01-12
MSE
K
Average -92 MSEK13.000
Average -93 MSEK 15.900
Average - 94 MSEK 9.700
Average -95 MSEK 4.950
Average -96 MSEK 2.350
Average -97 MSEK 1.850
Average -98 MSEK 1.950
Average -99 MSEK 4.900
Average -00 MSEK 2.400
Average -01MSEK 4.700
Including parents company from January,2000Including Braathens from December, 2001 and Spanair from March, 2002.
Average -02 MSEK 11.600
11/12/2002129
SAS Group Owne d Le as e d Total Le as e d On(Incl SK, BU, JK, KF, W S e p02 In Se p02 Out Orde rAirbus A340-300 5 2 7 0 0Airbus A330-300 0 0 0 0 4Airbus A321-200 5 3 8 0 8Airbus A320 0 5 5 0 11Boeing 767-300 3 6 9 0 0Boeing 737-400 0 5 5 0 0Boeing 737-500 0 15 15 0 0Boeing 737-600 12 18 30 0 0Boeing 737-700 9 4 13 0 0Boeing 737-800 14 5 19 4 4Douglas MD-81 5 10 15 0 0Douglas MD-82 17 29 46 0 0Douglas MD-83 2 20 22 0 0Douglas MD-87 10 8 18 0 0Douglas MD-90-30 8 0 8 0 0Douglas DC-9-41 0 9 9 0 0Avro RJ-85 0 5 5 0 0Embraer ERJ 145 0 3 3 0 0Fokker F28 7 0 7 0 0Fokker F50 7 0 7 2 0deHavilland Q100 16 1 17 0 0deHavilland Q300 0 9 9 0 0deHavilland Q400 15 13 28 0 0SAAB 2000 0 5 5 0 0Total 135 175 310 6 27
SAS Group fleet as of Sep 30, 2002
Scandinavian Airlines 115 83 198 6 12Spanair 0 45 45 0 15Braathens 4 23 27 0 0Wideroe 16 14 30 0 0Air Botnia 0 10 10 0 0
SAS Group Owne d Le as e d Total Le as e d On(Incl SK, BU, JK, KF, W S e p02 In Se p02 Out Orde r
11/12/2002130
Limited CAPEX beyond 2002Firm Order CAPEX MUSD 585Aircraft OrdersAircraft OrdersAircraft OrdersAircraft Orders
Total Total Total Total 2002200220022002 2003200320032003 2004 2004 2004 2004 2005200520052005as per 30/9-02 Q4Q4Q4Q4
Airbus A330 3 1 1 1Airbus A320/321 7 3 3 1Boeing 737 4 2 2 TOT No. of A/C 14 4 3 4 3
CAPEX (MUSD)CAPEX (MUSD)CAPEX (MUSD)CAPEX (MUSD) 585585585585 170170170170 145 145 145 145 190 190 190 190 80808080
Total CAPEX 2003Total CAPEX 2003Total CAPEX 2003Total CAPEX 2003----05 MUSD 41505 MUSD 41505 MUSD 41505 MUSD 415
11/12/2002131
Firm Order CAPEX MUSD 725Aircraft OrdersAircraft OrdersAircraft OrdersAircraft Orders
Total Total Total Total 2002200220022002 2003200320032003 2004 2004 2004 2004 2005 2005 2005 2005 as per 30/9-02 Q4Q4Q4Q4
Airbus A330 3 1 1 1Airbus A320/321 10 4 1 4 1Boeing 737 4 2 2Q400 3 3TOT No. of A/C 20 5 7 5 3
CAPEX (MUSD)CAPEX (MUSD)CAPEX (MUSD)CAPEX (MUSD) 725725725725 205 205 205 205 220 220 80 220 220 80 220 220 80 220 220 80
Total CAPEX 2003Total CAPEX 2003Total CAPEX 2003Total CAPEX 2003----05 MUSD 52005 MUSD 52005 MUSD 52005 MUSD 520
11/12/2002132
Strengthening of SAS financial position
�Equity MSEK 15 414�Equity ratio 22%
�Net debt MSEK 12,168�Net debt/ equity 79%
0%
5%
10%
15%
20%
25%
30%
35%
40%
Dec-98
Mar-99
Jun-99
Sep-99
Dec-99
Mar-00
Jun-00
Sep-00
Dec-00
Mar-01
Jun-01
Sep-01
Dec-01
Mar-02
Jun-02
Sep-02

The SAS Group Investor RelationsTel. +46 (0) 8 797 1451 Fax: +46 (0)8 797 5110
e-mail: [email protected] --- Homepage: www.scandinavian.net -- Results Jan -Sep 2002
11/12/2002133
Commited Credit Facilities of MSEK 10,450
MSEKMSEKMSEKMSEKLiquid Funds Liquid Funds Liquid Funds Liquid Funds 30/930/930/930/9----02020202 10,40010,40010,40010,400
Available Credit Facilites:Revolving Credit Facility (MUSD 700) 3,700
Aircraft Finance Lease Facility 3,700
Bi-lateral Facilities 1,200
ECA Facility 1,850
Total Total Total Total Available FundsAvailable FundsAvailable FundsAvailable Funds 20,850 20,850 20,850 20,850
11/12/2002134
SAS GroupFinancial Net January – September 2002(MSEK) (MSEK) (MSEK) (MSEK) Q3 2002 Q3 2002 Q3 2002 Q3 2002 Q3 2001 Q3 2001 Q3 2001 Q3 2001 Q1Q1Q1Q1----Q3 2002 Q1Q3 2002 Q1Q3 2002 Q1Q3 2002 Q1----Q3 2001Q3 2001Q3 2001Q3 2001
Interest net and Interest net and Interest net and Interest net and ----322 322 322 322 ----93 93 93 93 ----691 691 691 691 ----234234234234othersothersothersothers
Exchange rate effect Exchange rate effect Exchange rate effect Exchange rate effect ----84 84 84 84 ----67676767 ----45454545 ----254254254254
Currency movementsCurrency movementsCurrency movementsCurrency movements
Exchange rate effect 0 +170Exchange rate effect 0 +170Exchange rate effect 0 +170Exchange rate effect 0 +170 0000 +467+467+467+467Sale & LeasebackSale & LeasebackSale & LeasebackSale & LeasebackAircraftAircraftAircraftAircraft
Financial net Financial net Financial net Financial net ----406 +10 406 +10 406 +10 406 +10 ----736736736736 ----21212121
11/12/2002135
Scandinavian AirlinesFinancial Net January – September 2002(MSEK) (MSEK) (MSEK) (MSEK) Q3 2002 Q3 2002 Q3 2002 Q3 2002 Q3 2001 Q3 2001 Q3 2001 Q3 2001 Q1Q1Q1Q1----Q3 2002 Q1Q3 2002 Q1Q3 2002 Q1Q3 2002 Q1----Q3 2001Q3 2001Q3 2001Q3 2001
Interest net and Interest net and Interest net and Interest net and ----253 253 253 253 ----71 71 71 71 ----533 533 533 533 ----174174174174othersothersothersothers
Exchange rate effect Exchange rate effect Exchange rate effect Exchange rate effect ----63 63 63 63 ----56565656 ----80808080 ----246246246246Currency movementsCurrency movementsCurrency movementsCurrency movements
Exchange rate effect 0 +170Exchange rate effect 0 +170Exchange rate effect 0 +170Exchange rate effect 0 +170 0000 +467+467+467+467Sale & LeasebackSale & LeasebackSale & LeasebackSale & LeasebackAircraftAircraftAircraftAircraft
Financial net Financial net Financial net Financial net ----316 +43 316 +43 316 +43 316 +43 ----613613613613 +47+47+47+47
Scandinavian Airlines
11/12/2002136
SAS Group - Development and Break Down of Net Debt 020930
(MSEK)(MSEK)(MSEK)(MSEK) 020930020930020930020930 010930010930010930010930 DifferenceDifferenceDifferenceDifference
CashCashCashCash 10 48210 48210 48210 482 7 7617 7617 7617 761 2 7212 7212 7212 721
Other interest bearingOther interest bearingOther interest bearingOther interest bearingassetsassetsassetsassets 7 2797 2797 2797 279 7 8967 8967 8967 896 ----617617617617
Interest bearingInterest bearingInterest bearingInterest bearingliabilitiesliabilitiesliabilitiesliabilities ----29 92929 92929 92929 929 ----21 24321 24321 24321 243 ----8 686 8 686 8 686 8 686
Net debt Net debt Net debt Net debt ----12 16812 16812 16812 168 ----5 5865 5865 5865 586 ----6 5826 5826 5826 582
11/12/2002137
SAS share
11/12/2002138
* Peers: Alitalia, Air France, British Airways, Finnair, KLM, Lufthansa &Rynair
SAS share price vs. Peers 2002
55555555
65656565
75757575
85858585
95959595
105105105105
115115115115
125125125125
31-dec-31-dec-31-dec-31-dec-01010101
31- jan-31- jan-31- jan-31- jan-02020202
28-feb-28-feb-28-feb-28-feb-02020202
31-mar-31-mar-31-mar-31-mar-02020202
30-apr-30-apr-30-apr-30-apr-02020202
31-maj -31-maj -31-maj -31-maj -02020202
30- jun-30- jun-30- jun-30- jun-02020202
31-j ul-31-j ul-31-j ul-31-j ul-02020202
31-aug-31-aug-31-aug-31-aug-02020202
30-sep-30-sep-30-sep-30-sep-02020202
31-ok t-31-ok t-31-ok t-31-ok t-02020202
Index Peers Index SAS
SAS Market Capitalization vs. European Peers* measured in SEK(December28, 2001 - October 31, 2002)
76,978,9

The SAS Group Investor RelationsTel. +46 (0) 8 797 1451 Fax: +46 (0)8 797 5110
e-mail: [email protected] --- Homepage: www.scandinavian.net -- Results Jan -Sep 2002
1040145L 139
Volume in SAS 2002 vs 2001 in Stockholm
Average dai ly number of shares traded in Stockholm per monthAverage dai ly number of shares traded in Stockholm per monthAverage dai ly number of shares traded in Stockholm per monthAverage dai ly number of shares traded in Stockholm per month
0
50 000
100 000
150 000
200 000
250 000
300 000
Janu
ary
Febr
uary
March
April
May
June Ju
ly
Augu
st
Septe
mber
Octobe
r
2001
2002
1040145L 140
Weak volume in industry downturn SAS AB
Number of shares traded in SAS per monthNumber of shares traded in SAS per monthNumber of shares traded in SAS per monthNumber of shares traded in SAS per month
0
2 000 000
4 000 000
6 000 000
8 000 000
10 000 000
12 000 000
14 000 000
16 000 000
Janu
ary
Febr
uary
March
April
June
Ju
ly
Augu
st
Septe
mber
Octobe
r
2001 2002