Table of Contents - Results Washington Results WA report final.pdfResults Washington: Annual...
16
Transcript of Table of Contents - Results Washington Results WA report final.pdfResults Washington: Annual...

Table of Contents
Executive Summary .................................................................................................................... 1
Performance Management ................................................................................................ 1
Continuous Improvement ................................................................................................. 2
Creation Of Results Washington ........................................................................................... 3
Performance Management: Structure Of Results Washington Teams ................. 4
Performance Management: Examples Of Improvements ........................................ 4
EDUCATION ........................................................................................................................... 4
ECONOMY ............................................................................................................................. 5
ENVIRONMENT ...................................................................................................................... 5
HEALTH And SAFETY ........................................................................................................... 6
EFFECTIVE GOVERNMENT ..................................................................................................... 6
Performance management: Current status of objectives ......................................... 7
Continuous improvement: Building a Lean Culture ......................................................... 8
Continuous improvement: The Washington State Government
Lean Transformation Conference ................................................................................... 9
Continuous improvement: Agency Lean advisors .................................................... 10
Performance management and continuous improvement: Next steps ..................... 11
Appendix A: Examples of agency-level improvements ................................................. 12

Results Washington: Annual Progress Report 1
Executive summary
Results Washington, founded in 2013 within the Office of the Governor, is Washington state’s
performance system that integrates performance management, continuous improvement
and cross-agency collaboration to achieve key goals and improve government effectiveness.
Performance management
Results Washington and its dozens of state agency partners are driving measurable
improvements in five overarching goal areas:
World-class education
A prosperous economy
Sustainable energy and a clean environment
Healthy and safe communities
Efficient, effective and accountable government
Under those broad goal categories, Results Washington tracks 190 specific objectives and
convenes multi-agency teams to work collaboratively on data-driven improvement strategies.
Examples of these objectives and their current status are included in this report. For the
complete list, see Results Washington’s website at www.results.wa.gov.
Developed with input from stakeholders and state agencies, many of the objectives represent
complex challenges, such as homelessness, school- and college readiness, career-connected
learning, unemployment, air- and water quality and worker fatality rates.
Of the 190 objectives Results Washington is tracking:
52 percent are on track to meet targets.
41 percent need improvement to meet targets.
7 percent are in the early stage where agencies are collecting baseline data or are
trying to determine the best ways to measure progress. (In many cases, these are
objectives that were recently added.)
In addition, dozens of objectives have been retired or updated with new targets since
2013 because the original targets were met.

Results Washington: Annual Progress Report 2
Continuous improvement
Results Washington also fosters continuous improvement efforts, including Lean thinking,
throughout state government. The use of Lean principles and tools has spurred thousands of
localized improvement efforts at individual state agencies. These efforts have led to improved
quality, improved outcomes for customers and clients, better timeliness, cost avoidance,
increased employee engagement, improved safety and increased ability by agencies to
manage growing workloads and demands for services.
In many cases, these efforts improve multiple factors at once, such as timeliness, customer
satisfaction and cost savings. Of the 81 major improvement efforts reported by state agencies
in fiscal year 2017:
68 percent saved time
37 percent improved quality
28 percent reduced or avoided costs totalling $6.1 million
28 percent improved customer satisfaction
22 percent increased employee engagement
4 percent improved safety.
Specific examples of those recent improvement efforts are listed below; many more are
posted on the Results Washington website at www.results.wa.gov.
This work to improve government services and effectiveness has made Washington state a
nationally recognized leader in both performance management and the use of Lean
principles in the public sector, with multiple other jurisdictions across the U.S. developing
performance systems inspired by Results Washington.
Results Washington: Annual Progress Report 3
Creation of Results Washington
In September 2013, Gov. Jay Inslee issued Executive Order 13-04, which stated, in part, that:
Washington state and its public servants are committed to the continuous
improvement of services, outcomes and performance of state government, to realize a
safe, beautiful and healthy place to live and work. In order to achieve these aims,
“Results Washington,” an innovative, data-driven, performance management initiative
will drive the operations of state government through Lean thinking. This initiative will
aid state leaders in fact-based decision-making, enhancing the breadth of
understanding, focus and commitment to our customers — all Washingtonians.
The order laid out a framework for citizen and employee engagement, cross-agency
collaboration, reporting and sharing of results with the public.
Results Washington is built around five key goal areas:
1. World-class education: Preparing every Washingtonian for a healthy and productive
life, including success in a job or career, in the community and as a lifelong learner.
2. Prosperous economy: Fostering an innovative economy where businesses, workers
and communities thrive in every corner of our state.
3. Sustainable energy and a clean environment: Building a legacy of resource
stewardship for the next generation of Washingtonians.
4. Healthy and safe communities: Fostering the health of Washingtonians from a
healthy start to a safe and supported future.
5. Efficient, effective and accountable government: Fostering a Lean culture that
drives accountability and results for the people of Washington.
Progress within those five goal areas is reflected in 190 objectives created with input from
hundreds of Washingtonians, dozens of stakeholder groups and state agencies.
Results Washington: Annual Progress Report 4
Performance management: Structure of
Results Washington teams
Starting in 2013, for each goal area, Results Washington created a team known as a “goal
council.” These were typically comprised of 12–15 state agency directors. Each member
brought to bear the expertise, perspective and resources of his or her agency.
An agency was assigned as the lead for each of the 190 improvement objectives. In some
cases, multiple agencies and partners work together on an objective. This helps leverage
each other’s work, avoids redundant effort and maximizes the learned expertise of the group.
Since 2014, the five goal councils have met monthly to review progress, share data, refine
strategies and collaborate on action items. These meetings often include one or more
partner organizations from outside state government. They also often include customers,
clients or other Washingtonians who provide the perspective of their own experiences.
About 10 times a year, Gov. Inslee meets with individual goal councils to discuss what’s
working, what’s not and how to improve results. The meetings are open to the public and
streamed live over the internet. The agendas, data, presentations and video recordings are
available on Results Washington’s website.
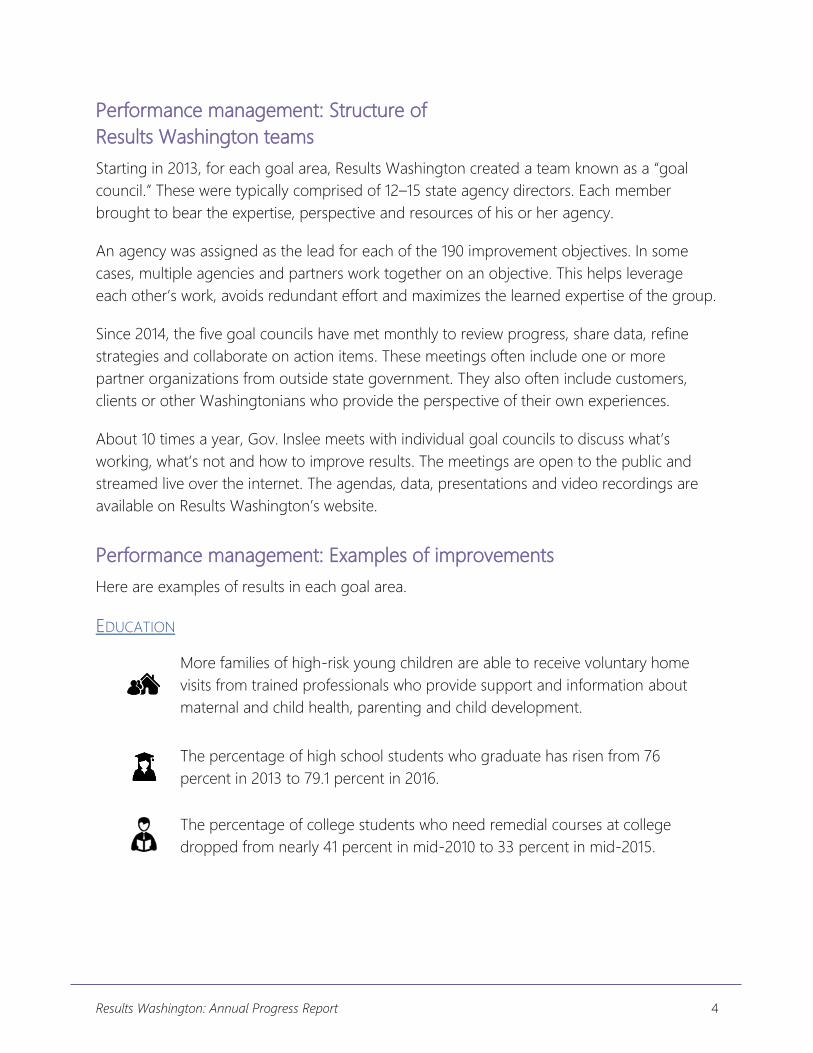
Performance management: Examples of improvements
Here are examples of results in each goal area.
EDUCATION
More families of high-risk young children are able to receive voluntary home
visits from trained professionals who provide support and information about
maternal and child health, parenting and child development.
The percentage of high school students who graduate has risen from 76
percent in 2013 to 79.1 percent in 2016.
The percentage of college students who need remedial courses at college
dropped from nearly 41 percent in mid-2010 to 33 percent in mid-2015.

Results Washington: Annual Progress Report 5
More students are taking online courses in two- and four-year colleges. At
four-year colleges, it nearly doubled from the 2010-11 school year through
2015-16.
ECONOMY
The percentage of people participating in WorkSource who find jobs rose
from less than 49 percent in 2010 to 66 percent in 2015.
Employment in key sectors continues to rise, including technology,
aerospace, maritime, clean technology and agriculture. From 2010 through
2015, employment in the information/communication technology sector rose
34 percent.
Small business employment rose by more than 70,000 jobs from late 2011
through late 2015.
ENVIRONMENT
Greenhouse gas emissions from buildings and industrial processes dropped
by more than 1 million metric tons from 2008 through 2015.
Nearly 1,000 more contaminated sites have been cleaned up in the past six
years.
All of the state is now meeting federal air quality standards.
Diesel soot in the air continues to decline.
Record numbers of Washingtonians are buying Discover Passes to access
outdoor recreation areas.

Results Washington: Annual Progress Report 6
HEALTH AND SAFETY
The percentage of toddlers receiving all recommended vaccinations grew
from 35 percent in 2013 to nearly 60 percent in 2016.
Cigarette smoking by 10th-graders declined from 10 percent in 2012 to 6.3
percent in 2016. The percentage of 10th-graders using an e-cigarette
declined from 18 percent in 2014 to 12.7 percent in 2016.
The percentage of clients with developmental disabilities who are being
served in home and community-based settings has risen from 96.1 percent in
2013 to 97.3 percent in 2017.
The percentage of Washingtonians without health insurance has dropped
from 14 percent in 2014 to 5.8 percent in 2016.
Washington has the third lowest worker fatality rate in the nation.
EFFECTIVE GOVERNMENT
91 percent of state agencies are measuring customer satisfaction and
timeliness for core services. Employee-driven improvements at dozens of
agencies have resulted in faster services, better outcomes, streamlined
processes, easier-to-use forms, and cost avoidance.
Improvements have also led to more transparency, engaged employees and
higher customer satisfaction.
The percentage of state contracts with small businesses has increased from
25.3 percent in 2016 to 37.8 percent in late 2017.

Results Washington: Annual Progress Report 7
Performance management: Current status of objectives
Each month, Results Washington assesses the status of all 190 objectives.
As of December 1, 2017:
94 objectives (52 percent) were on track to meet their targets.
59 objectives (41 percent) will need to improve if they are to meet their targets.
37 objectives (7 percent) are in the process of establishing baseline metrics.
Results Washington Objective Summary
52.1%
41.1%
4.7%2.1%
0%
10%
20%
30%
40%
50%
60%
On Track Needs Improvement Unable to DeterminePerformance
Baseline Year
Results Washington: Annual Progress Report 8
Continuous improvement: Building a Lean culture
Ultimately, Results Washington’s emphasis on continuous improvement is about building a
lasting culture of customer-focused problem-solving and innoovation throughout state
government. Lean focuses on eliminating waste in systems, viewing value through the eyes of
customers and clients, and identifying and addressing root causes of problems.
Washington state government is well on its way toward becoming a Lean organization. The
state is a recognized leader nationwide in adapting Lean principles and techniques to make
Washington a better place to live, work and do business.
A large part of this cultural transformation has consisted of hands-on improvement efforts by
employees..
From 2013 through June 2017:
More than 37,000 Washington state employees have had Lean knowledge and skills
training. Of those, more than 3,500 had more in depthproblem-solving training, which
was introduced in 2015.
More than 1,000 employees have been trained as Lean facilitators prepared to lead
project work.
More than 11,000 state employees have participated in a Lean improvement project.
During that same time period, agencies reported that their employees took part in 4,320
Lean improvement projects. Examples of improvement projects from fiscal year 2017 are
included in Appendix A of this report.

Results Washington: Annual Progress Report 9
Cumulative Number of Agency Lean Projects
January 2013 - June 2017
Continuous improvement: The Washington State Government Lean
Transformation Conference
A major part of Washington state’s strategy of developing Lean problem-solving skills among
the state workforce is Results Washington’s annual two-day Washington State Government
Lean Transformation Conference. This event brings together more than 2,000 people —
most of them state employees — to learn about Lean principles, tools and to share
experiences.
Presenters include a broad cross-section of nationally known experts in continuous
improvement principles from private-sector, public-sector and nonprofit organizations. All
volunteer their time to share their expertise at the conference.
Presenters at Results Washington’s October 2017 conference came from Harvard University,
the Bill and Melinda Gates Foundation, the U.S. Navy, the Boeing Company, the City and
County of San Francisco, Virginia Mason Medical Center, Seattle Children’s Hospital, the Lean
Enterprise Institute, the University of Washington, Seattle Public Utilities, the state of Arizona
and Premera Blue Cross, among many others.
505
1,179
2,067
3,349
4,320
0
1,000
2,000
3,000
4,000
5,000
2013 2014 2015 2016 2017
Results Washington: Annual Progress Report 10
The 2017 conference included more than 50 sessions, nearly 100 presenters, more than 1,700
state employees, as well as attendees from eight states, 14 city governments, 11 county
governments and 11 institutions of higher education.
As a results of private sector sponsorships, Results Washington is able to provide the
conference at a net cost of approximately $70 per participant. Similar conferences typically
cost participants $500 to $1,500, excluding travel.
Continuous improvement: Agency Lean advisors
A key link to agency leadership and a key driver of Results Washington’s strategy to foster
Lean principles across state government, the Lean Agency Advisor Community of Practice
comprises 54 advisors appointed by agency directors.
At the group’s monthly sessions, the Results Washington team provide training, learning
experiences, information and coaching to the advisors, who lead, model and share their
learning with their colleagues in the group and back in each individual’s agency.
The group also helps provide agency perspectives on strategies for continuing to advance
state government’s Lean transformation.
In addition to these group sessions, Lean experts on the Results Washington’s team offer
frequent coaching, consulting and advising for agency leadership in the areas of; change
leadership, Lean tools and techniques, people development, culutural transformation,
strategic planning and more. Results Washington will begin quantifying the value of our
technical assistance beginning in 2018.

Results Washington: Annual Progress Report 11
Performance management and continuous
improvement: Next steps
At the time this report is being written, in late 2017, Results Washington is continuing to
develop and evolve to better assist state agencies with achieving challenging goals.
Among the changes: In early 2018, Results Washington will launch a new support structure,
including new results teams to focus on achieving specific, key goals. These multi-agency and
public-private teams will be supported by the Results Washington team, which brings a
unique blend of skills in Lean, project management, facilitation, design thinking and other
areas.
In addition to continuing its popular Lean conference, Results Washington is also developing
a new learning experience program to respond to demand for training in Lean fundamentals,
as well as performance measurement and management.
This will serve Results Washington’s partners and mission better by facilitating cross-agency,
public-private efforts to achieve the state’s goals. Many of those partners have reported that
agencies continue to struggle with working in organizational “silos” and need structured
support to collaborate more effectively.
As Results Washington pilots these changes and learns from them, continued evolution and
changes are anticipated as the program strives to achieve meaningful results for
Washingtonians. These efforts will be a primary focus of Result’s Washington’s next report.

Results Washington: Annual Progress Report 12
Appendix A: Examples of Agency-Level
Improvements
The Department of Revenue improved their Refund Referral process. This
improvement resulted in taxpayers receiving refunds 26 days sooner, on
average.
The Department of Corrections improved vehicle purchasing, resulting in $2.5
million in cost avoidance in long-term vehicle replacement costs, as well as
boosting efficiency, environmental benefits and safety.
The Department of Ecology cut a backlog of overdue public disclosure
requests from 415 to 17.
The Health Care Authority used Lean improvements to handle a dramatic
influx of Medicaid applications with existing staff, avoiding $2.5 million in
additional staff labor costs annually.
The Washington Military Department’s 225th Air Defense Squadron improved
internal coordination and information flow to ensure that all aircraft coming
into U.S. airspace are identified, with authentication and clearance to enter.
The improvements reduced time needed for coordination, eliminated
unneeded steps and reduced errors and redundancies in processes.
Department of Corrections crews at Monroe Correctional Complex cut the
time to produce 1,250 breakfast trays each day by 75 percent, as well as
making changes that reduce 700 wasted food items per month and save
$333,000 a year.
The Department of Labor & Industries improved the phone system in its
Employer Services Program to help get customers to the right resource the
first time. On average, incoming calls are answered within eight seconds.

Results Washington: Annual Progress Report 13
The Washington State Department of Transportation improved inventory
management for Good to Go! Passes, which in late 2015 were taking up to
four weeks from when a customer ordered a pass to when it was shipped.
The improvements cut that turnaround time to one day.
The Washington State Patrol’s Toxicology Lab saved $218,000 by
implementing batch testing for casework.
The Washington State Department of Fish & Wildlife doubled production at
its shop that outfits trucks for its enforcement officers by increasing efficiency,
including shop and tool layouts.
The Department of Enterprise Services’ Buildings & Grounds Department cut
the percentage of repairs taking more than two weeks to complete from 76
percent to 18 percent.
The Department of Licensing improved its process for resolving particularly
complex customer calls to its Customer Service Center. The changes sped up
responses for 13,000 callers.
The Department of Ecology reduced the amount of time to process certain
permits for the Hanford tank waste treatment plant, shaving years off the
permit evaluation schedule, saving at least $90,000 in permit fees and saving
substantial time for contractors preparing application materials.
The Department of Retirement Systems cut in half the wait time for
customers wanting to speak with a staffer.
The Department of Labor & Industries cut wait times by 82 percent for a
hotline that answers calls from health care providers, injured workers and
billing companies.
The Department of Enterprise Services Custodial Services program decreased
the number of serious or severe injuries among workers by 43 percent.

Results Washington: Annual Progress Report 14
The Department of Agriculture cut the average time to issue a seed labeling
permit from 52 days to less than two.
The Department of Licensing improved the process for contracting with
subagents to manage vehicle licensing offices, cutting turnaround time from
108 business days to 59 business days. As a result, subagents can start doing
business 49 days sooner.
The Washington State Department of Transportation’s Rail Division cut in half
the average time between receiving invoices and paying vendors and
contractors. In addition to helping those businesses with faster cash flow, the
changes sped up state reimbursements from the Federal Railroad
Administration, freeing up state funds for other projects.
The Department of Licensing’s Business and Professions Division, which
regulates licensed professionals in industries such as transportation,
cosmetology and real estate, is processing customer complaints up to 26
days faster.
For more examples, please see Results Washington’s website: www.results.wa.gov.


![1 Information for Accountability EDUCATION MANAGEMENT BY RESULTS: SCHOOL REPORT CARDS Alcyone Vasconcelos [Saliba] alcyone.vasconcelos@terra.com.br Washington,](https://static.fdocuments.in/doc/165x107/56649f2f5503460f94c4a1ab/1-information-for-accountability-education-management-by-results-school-report.jpg)