Table of Contents - National Association of Insurance ... · PROPOSED 2015 NAIC BUDGET ... The...
253
2015 2015 NAIC BUDGET NAIC Executive (EX) Committee and Internal Administration (EX1) Subcommittee for Public Exposure October 2014
Transcript of Table of Contents - National Association of Insurance ... · PROPOSED 2015 NAIC BUDGET ... The...

20152015NAIC BUDGET
NAIC Executive (EX) Committee and Internal Administration (EX1) Subcommittee
for Public Exposure
October 2014


Table of Contents


PROPOSED 2015 NAIC BUDGET
TABLE OF CONTENTS Executive Summary ......................................................................................................................1 Appendix .................................................................................................................................7
Revenue and Expense Summaries ..............................................................................................23
Revenue Detail ............................................................................................................................29
Expense Detail ............................................................................................................................57
Investment Income Detail .........................................................................................................105
Business and Fiscal Impact Statement Summary .....................................................................119
Fiscal Impact 1 — State Based Systems (SBS) Software Enhancement And Technology Compliance Initiative – Phase III ............................121
Fiscal Impact 2 — Securities System Rewrite (SSR) – Expanded Phase I ........................131
Fiscal Impact 3 — SERFF Integration Expansion ..............................................................141
Fiscal Impact 4 — State Producer Licensing (SPL) Team Augmentation .........................149
Fiscal Impact 5 — Commercial Mortgage-Backed Securities (CMBS) Resource for Structured Securities Group (SSG) ......................................................155
Fiscal Impact 6 — Enhanced Support for Member Use of Electronic Workpapers ...........159
Fiscal Impact 7 — 2015 Revenue Modification .................................................................165
Unrestricted Net Assets ............................................................................................................173
2013 Annual Report ..................................................................................................................175


Executive Sum
mary

2015 Proposed Budget Executive Summary
The National Association of Insurance Commissioners (NAIC) is the U.S. standard-setting and regulatory support organization created and governed by the chief insurance regulators from the 50 states, the District of Columbia, and five U.S. territories. Through the NAIC, state insurance regulators establish standards and best practices, conduct peer reviews, and coordinate their regulatory oversight activities. NAIC staff supports these efforts and represents the collective views of state regulators domestically and internationally. NAIC members, together with the central resources of the NAIC, form the national system of state-based insurance regulation in the U.S. NAIC members are the elected or appointed state government officials who, along with their departments and staff, regulate the conduct of insurance companies and agents/brokers in their respective jurisdictions.
The mission of the NAIC is to assist state insurance regulators, individually and collectively, in serving the public interest and achieving the following fundamental insurance regulatory goals in a responsive, efficient, and cost effective manner, consistent with the wishes of its members to:
• Protect the public interest; • Promote competitive markets; • Facilitate the fair and equitable treatment of insurance consumers; • Promote the reliability, solvency and financial solidity of insurance entities; and • Support and improve state regulation of insurance.
The annual budget of the NAIC supports a wide variety of valuable services and benefits, which the NAIC provides to its members, insurance consumers, and the insurance industry. The NAIC offers its members training programs, publications, data and information systems, and many other services to assist them in achieving their fundamental insurance regulatory goals in a timely and cost-effective manner. The NAIC provides significant value to its members by reducing the investment and ongoing costs for each member’s insurance department, allowing them to leverage the regulatory tools, resources and technical infrastructure available through the NAIC. Without this significant cost savings, many systems would be cost-prohibitive for the states to implement on their own. Without membership in the NAIC, the amount of state funding required to provide or access the similar type of services and data the NAIC provides — often at no extra charge — would far exceed what a state pays in member dues to the NAIC. The NAIC provides important and timely information to consumers through a multitude of mediums to assist them in making informed decisions on insurance matters. The NAIC utilizes public service announcements (PSA) to educate consumers on important insurance issues, such as the long-term care PSA featuring Amy Grant. Launched in 2013, the PSA continues to reach new audiences. In 2014 the NAIC launched the Get Ready Resources campaign addressing insurance concerns triggered by major life events: new home, new car, wedding, birth of a child, new job, and turning 50. These consumer education efforts are enhanced with news releases, consumer alerts, radio media tours, a website for
1

insurance consumers (InsureUonline.org), mobile applications (e.g., WreckCheck, myHOMEScr.APP.book), and targeted social media outreach. The NAIC also hosts a consumer hotline to help consumers access their state insurance departments for assistance. In addition, the NAIC conducts national media relations efforts while providing each member’s public information office information and toolkits to complement these consumer outreach efforts. NAIC products and services create valuable efficiencies and significant cost-savings for insurers. This is accomplished through numerous initiatives involving automation, standardization, and streamlining of many regulatory processes through web-based systems to transmit data and regulatory transactions between insurers, consumers and state insurance regulators. These systems include, among others, the System for Electronic Rate & Form Filing (SERFF) which processed 648,150 transactions in 2013; the Automated Valuation Service (AVS) which gives users the ability to complete regulatory filings quickly and easily; Online Premium Tax for Insurance (OPTins) which gives users the ability to file state premium tax filings and processed 26,239 transactions in 2013; and State Based Systems (SBS) which is now licensed by 28 members. The NAIC is committed to maintaining and enhancing these systems to provide high-quality service to insurers. The Budget Process Each year, a zero-based budget proposal is developed by each NAIC department, ultimately consolidating into 11 NAIC divisions. Each department projects its current year results and begins to build its proposal for the coming year, carefully focusing on variances between the current year budget, current year projected results, and anticipated needs for the coming year. This process includes a review and evaluation of all projects, products, programs, services, committee charges, and technology initiatives in relation to the strategic priorities identified by the membership and is tied to the NAIC’s mission. The NAIC’s senior management team reviews each budget in detail with the respective Division Director to make adjustments according to the strategic and financial needs of the Association.
Following the extensive development and internal review process, the proposed budget is presented in detail to the NAIC Officers, the Executive (EX) Committee and Internal Administration (EX1) Subcommittee, and the full NAIC membership before being released for public review and comment. A public hearing is held to receive public comments before final consideration and adoption by the NAIC Executive (EX) Committee and Plenary. 2014 Projections Based on actual operating results through June 30, 2014, projections indicate a net negative operating margin of $1.1 million compared to a budgeted net negative operating margin of $3.6 million, an improvement of nearly $2.5 million. Including projected 2014 investment income (which includes a substantial positive return (realized/unrealized gain on assets) for the first six months of the year), the NAIC projects a total net revenue margin of nearly $5.8 million. Additional details of 2014 projected variances are included throughout the detailed footnotes of the budget proposal. 2015 Proposed Budget, including Business and Fiscal Impact Statements The NAIC operating budget (before adding investment income) reflects revenues of $90.6 million and total expenses of $96.1 million, which represent a 1.26% increase and a 3.35% increase, respectively, from the 2014 budget, resulting in $5,544,260 in projected expenses over revenues. Viewed in relation to the 2014 projected totals, the 2015 proposal represents an operating revenue decrease of 1.12% and operating expense increase of 3.68%. Detailed explanations of and support for the 2015 proposed budget are included in the detailed footnotes of this budget document.
2
The 2015 proposed budget includes nearly $3.7 million in investment income from the NAIC’s Long-Term Investment Portfolio. Investment income is comprised of interest earned and dividends received – investment gains and losses are not projected nor included in the proposed budget. Each year, the Executive (EX) Committee and Internal Administration (EX1) Subcommittee reviews each fiscal for proposed projects or initiatives before they are included in the operating budget. A number of initiatives were proposed for 2015 and are incorporated into the proposed 2015 budget as approved by EX/EX1 on October 3, 2014. The impact from these initiatives in 2015 is a reduction of $3,291,704 in revenues, an increase in expenses of $485,881 and an increase in capital of $3,401,427. While these proposals impact financial results in the proposed 2015 budget, these fiscals represent important investments in the NAIC’s products and services, many of which will generate net operating revenues in future years. A brief summary of each fiscal is provided in the next section. Business and Fiscal Impact Statements (Fiscals) Fiscals are prepared for new or enhanced business initiatives. Generally, a fiscal is prepared for any new NAIC project/initiative or existing project/initiative with revenue, expense or capital impacts of $25,000 or more. Key elements of a fiscal are: a description of the activity to be undertaken; its impact on the NAIC’s business, operations and finances; the benefits to key stakeholders; other options considered; and an assessment of risks. The 2015 proposed budget includes seven fiscals as follows: 1. State Based Systems (SBS) Software Enhancement and Technology Compliance
Initiative — Phase III – This is Phase III of an initiative to redesign the State Based System (SBS) technology platform by updating the SBS architecture and tool set, which will provide enhanced performance, stability, and scalability compared to the existing system. This multi-phase project began in early 2013 and is expected to be completed and placed into operation during the first half of 2016. The cost of this phase is $2,846,028 in capital and $865,958 in non-capital expense over two years, which includes implementation costs in the first half of 2016. The total capital cost of the SBS update is estimated to be nearly $7.1 million. Amortization of this new system begins when the new system is placed in service and is calculated over the life of the new system which is currently estimated to be 10 years.
2. Securities System Rewrite (SSR) – Expanded Phase I – This is an expanded Phase I of a multi-year project to redesign and replace the existing securities system and its components, while incorporating new business processes to support the Securities Valuation Office (SVO), the Capital Markets Bureau (CMB) and the Structured Securities Group (SSG). Much of the current system and its components were developed over 17 years ago. The code underlying the current system is a combination of JAVA and C++, the latter of which is an outdated, inflexible language which requires significant overhead to modify and maintain. The rewritten and redesigned system will support more robust securities data processing, analysis, reporting, and evaluation as well as have the flexibility to more easily adapt to evolving business needs and practices. While the core objectives of this rewrite have not changed, the scope of this phase has been increased to include a number of enhancements including: a new, significantly altered workflow design for all users; a more robust, sophisticated, and automated filing assignment process; a more robust billing process; a filing interface that supports new types of filings; and new file format to accept vendor formats. The cost of the expanded phase is now $1,521,907 higher in capital spending in 2015 and 2016 than the capital cost approved in the 2014 budget of $1,601,105 resulting in total project capital costs of $3,123,102. In addition, a small amount ($1,877) of expense is requested for minor NAIC hardware and software. The capital associated with this project will begin to amortize once it is placed in service, likely in late 2016.
3
3. SERFF Integration Expansion – This fiscal requests funding to allow third party vendor products to communicate with SERFF by permitting data to be pulled from SERFF. This application will impact a relatively small number of users (less than 3% of users) but a large number of SERFF filings (approximately 56%). The total cost of this project is $75,785 which will be recovered through license fees charged to users in 2016 and subsequent years.
4. State Producer Licensing (SPL) Team Augmentation – Since the State Producer Licensing
Reengineering Project was concluded in 2010, the NAIC has assumed more direct support of several key state producer licensing applications, including coordination with NIPR on the State Producer Licensing Common Architecture and Loads Application, which directly impact the State Producer Licensing Database. In addition, the NAIC SPL team supports a number products and programs such as Producer I-SITE reports, State Application Programming Interface (API), and E-commerce reports to name a few. This fiscal requests two additional staff members, one Software Quality Engineer and one Software Engineer, to augment the SPL team and ensure the products they support can continue to be enhanced and maintained in a timely and cost efficient manner. The 2015 cost of these two additional staff members beginning on March 1, 2015, is expected to be $156,702 in expense for salaries, benefits and other employee related costs as well as $14,659 in capital purchases related to HP’s Unified Functional Test (UFT) and Quality Center (QC).
5. Commercial Mortgage-Backed Securities (CMBS) Resource for Structured Securities
Group (SSG) – The NAIC began to financially model residential mortgage-backed securities (RMBS) owned by insurers in late 2009. This financial modeling effort was expanded in 2010 to include commercial mortgage-backed securities (CMBS). During the first several years of this project, most of the modeling effort was managed by consultants but this changed in mid-2013 with the establishment of the Structured Securities Group (SSG). The SSG is currently comprised of three NAIC staff but they continue to rely on an outside consultant to monitor and evaluate CMBS. This fiscal requests a headcount to replace the consulting expense with a full-time staff member. Commercial mortgages are a specialized field and commercial mortgages are a key component of an insurance investment portfolio; this addition would ensure the NAIC has commercial mortgage expertise on staff. The net cost of this staff addition in 2015 is expected to be $53,060 as this position will eliminate the need for a consultant.
6. Enhanced Support for Member Use of Electronic Workpapers – The NAIC Members are currently facing a number of challenges regarding their use of workpaper tools to conduct solvency and market conduct monitoring activities. These tools are necessary for the efficient documentation of analysis/examination activities and the sharing of results across departments. These challenges have been apparent for a number years and it has been difficult to address these challenges without a focal point within the NAIC. This fiscal requests the addition of a staff member beginning on March 1, 2015 – at a 2015 cost of $111,273 for salary, employee benefits and travel. In addition, this initiative also includes IT funding to develop a centralized TeamMate test environment for the purpose of evaluating the functionality and design of NAIC support services which may include hosting interested members. The cost of this IT infrastructure is estimated to be $142,058 (including $14,430 in depreciation and $8,646 in amortization) in 2015 expense plus $50,141 in capital spending. Additional funding may be requested in future years if the member demand for this limited IT infrastructure exceeds capacity.
7. 2015 Revenue Modification – The NAIC provides a large number of benefits to its members and funds these products and services in a multitude of ways including member assessments, database filing fees, evaluation of securities held by insurers, sales of publications, registration fees for education courses, and for national meetings to name a few. To ensure the NAIC has adequate financial resources, the Executive (EX) Committee continually monitors the NAIC’s liquid operating
4
reserve ratio. As of December 31, 2013, the Association’s liquid operating ratio was 106.0% and this ratio is expected to be 102.1% as of December 31, 2014, based on the current projection. Since this ratio is higher than the current target range of 80% - 91%, a number of changes are proposed to the NAIC’s revenue structure to reduce fees earned in 2015:
a. SVO Assessment – eliminate the assessment of $790,000. This assessment has been included in
the SVO budget since 2004. This assessment is applicable to insurance companies with total investments in non-government securities and preferred stock of $1 billion or more. In 2014, a total of 386 insurance companies were billed this assessment.
b. Database Filing Fees – the cost structure of the database filing fee is reduced by 5% including a 5% reduction in both company and group caps. The net impact of this revision is a reduction of $1,345,416 compared to the 2015 baseline budget.
c. Publications – revenues are reduced by $953,264 compared to the 2015 baseline budget by providing all consumer guides and low volume publications (excludes Top Ten publications) at no charge in an online, electronic delivery format. In addition, by moving to an electronic on-demand model, costs of printing, storage, shipping, and inventory management will be reduced by $105,379.
d. Member Assessments – the 2015/2016 member assessment will be reduced by 5% with a $125,000 cap. This will result in a fee reduction of $194,024 compared to the 2015 baseline budget.
The net impact of proposed revenue modification is a reduction of $3,291,704 in revenue and a $105,379 reduction in expense. The Executive (EX) Committee will continue to monitor the NAIC’s financial position. Continuation of these adjustments will depend on the NAIC’s financial position and further funding requirements.
Details of the above new initiatives are presented in the various “Fiscal Impact” tabs of this budget proposal. Other 2015 Considerations The budget proposal includes all known activities anticipated to occur in 2015. However, situations may occur during 2015 that require additional funding. When such a situation occurs, a funding request is prepared and presented to the Executive (EX) Committee and Internal Administration (EX1) Subcommittee. Funding for any approved project comes from the Regulatory Modernization and Initiatives Fund, which was established in 2005 to manage new budget requests that arise following the adoption and implementation of the annual budget. The Fund is based on 1.5% of the NAIC’s projected consolidated net assets as of December 31, 2015, or $1,788,588. NAIC Operating Reserve The NAIC’s operating reserve is designed to ensure the financial stability of the NAIC in the event of emerging business risks and uncertainties, and to absorb new priority initiatives pursued by NAIC membership. As such, the Association’s reserve status is of paramount consideration in the budgeting process, along with strong and prudent financial management of the NAIC’s assets. During 2011, the NAIC’s operating reserve policy was subject to an extensive review by the NAIC Executive (EX) Committee. An independent professional services firm having financial expertise with non-profit associations, financial planning, and reserving was retained to review the NAIC’s reserve
5

policy. On September 22, 2011, the Executive (EX) Committee and Internal Administration (EX1) Subcommittee approved a report from the consulting firm which revised the NAIC’s liquid operating reserve from a flat 80% target to a target range of 80% to 91%. This change was the result of a comprehensive review of current and future identified risks and comparisons to comparable organizations. The Executive (EX) Committee approved an updated review of the Association’s current operating reserve during its July 2014 committee meeting. A RFP was issued in August and the NAIC is in the process of selecting an independent professional service firm to update this review. It is anticipated this review will be completed and approved by early 2015. At the beginning of 2014, the Net Assets of the Structured Securities Project ($13,082,237) was combined with the Net Assets of the NAIC. Adjusting for this change, as of December 31, 2013, the NAIC maintained a liquid reserve ratio of 106.0%. Based upon 2014 projected results and the 2015 budget proposal, the liquid reserve is projected to be 102.1% at December 31, 2014 and 94.7% at December 31, 2015. Conclusion NAIC management appreciates the opportunity to present this 2015 budget proposal to the NAIC membership, and believes this proposal provides a comprehensive review of the NAIC’s business and financial operations for the current and upcoming fiscal year. A summary of key components of the 2015 budget proposal is included as an Appendix within the full budget document. Please feel free to contact Jim Woody, Chief Financial Officer, at (816) 783-8015, or Carol Hartley, Senior Controller, at (816) 783-8038, should you have any questions or need additional information.
6

Appendix

Pro
pose
d 20
15 B
udge
t
Oct
ober
201
4
7
•Pr
opos
ed 2
015
Budg
et H
ighl
ight
s
•20
15 P
ropo
sed
Budg
et C
ompa
red
to 2
014
Budg
et a
nd
2014
Pro
ject
ion
•Re
venu
e An
alys
is
•Ex
pens
e An
alys
is
•Pr
opos
ed F
iscal
Impa
ct S
tate
men
ts
•He
adco
unt S
umm
ary
•Li
quid
Ope
ratin
g Re
serv
e Ca
lcul
atio
n
8
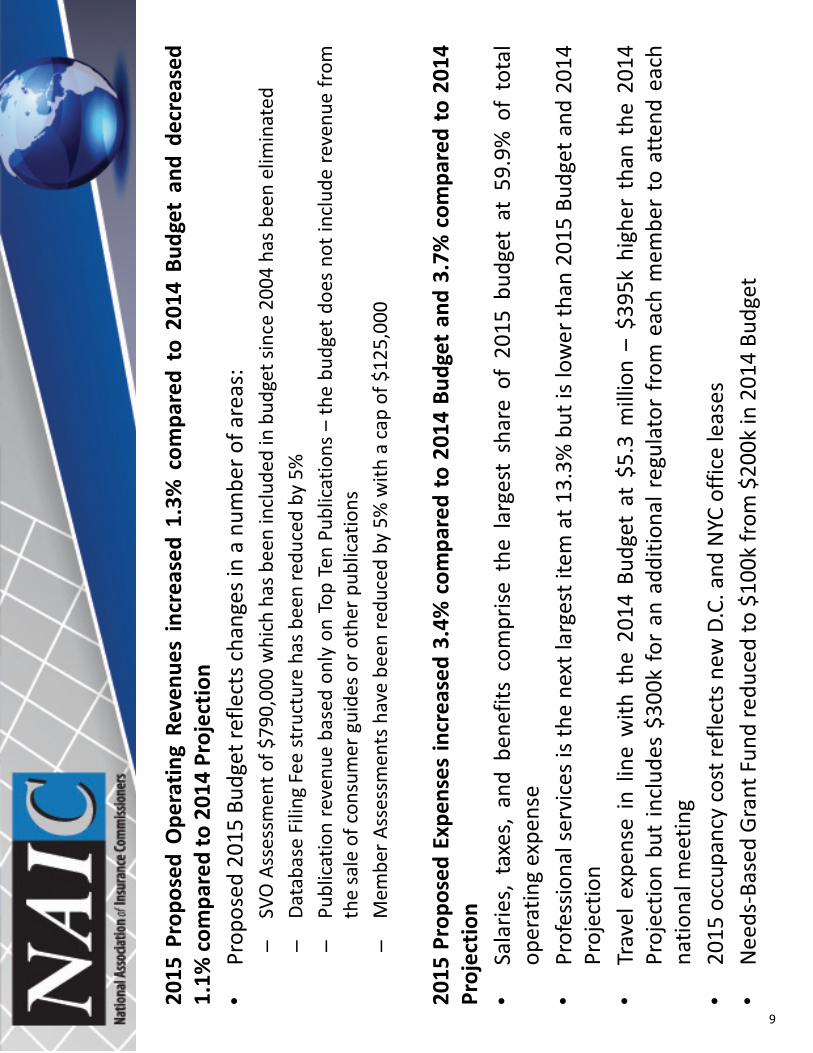
2015
Pro
pose
d O
pera
ting
Reve
nues
incr
ease
d 1.
3% c
ompa
red
to 2
014
Budg
et a
nd d
ecre
ased
1.
1% c
ompa
red
to 2
014
Proj
ectio
n •
Prop
osed
201
5 Bu
dget
refle
cts c
hang
es in
a n
umbe
r of a
reas
: –
SVO
Ass
essm
ent o
f $79
0,00
0 w
hich
has
bee
n in
clud
ed in
bud
get s
ince
200
4 ha
s bee
n el
imin
ated
–
Data
base
Fili
ng F
ee st
ruct
ure
has b
een
redu
ced
by 5
%
–Pu
blic
atio
n re
venu
e ba
sed
only
on
Top
Ten
Publ
icat
ions
– th
e bu
dget
doe
s no
t inc
lude
reve
nue
from
th
e sa
le o
f con
sum
er g
uide
s or o
ther
pub
licat
ions
–
Mem
ber A
sses
smen
ts h
ave
been
redu
ced
by 5
% w
ith a
cap
of $
125,
000
20
15 P
ropo
sed
Expe
nses
incr
ease
d 3.
4% c
ompa
red
to 2
014
Budg
et a
nd 3
.7%
com
pare
d to
201
4 Pr
ojec
tion
•Sa
larie
s, t
axes
, an
d be
nefit
s co
mpr
ise t
he l
arge
st s
hare
of
2015
bud
get
at 5
9.9%
of
tota
l op
erat
ing
expe
nse
•
Prof
essio
nal s
ervi
ces
is th
e ne
xt la
rges
t ite
m a
t 13.
3% b
ut is
low
er th
an 2
015
Budg
et a
nd 2
014
Proj
ectio
n •
Trav
el e
xpen
se in
line
with
the
201
4 Bu
dget
at
$5.3
mill
ion
– $3
95k
high
er t
han
the
2014
Pr
ojec
tion
but
incl
udes
$30
0k fo
r an
add
ition
al r
egul
ator
fro
m e
ach
mem
ber
to a
tten
d ea
ch
natio
nal m
eetin
g •
2015
occ
upan
cy c
ost r
efle
cts n
ew D
.C. a
nd N
YC o
ffice
leas
es
•N
eeds
-Bas
ed G
rant
Fun
d re
duce
d to
$10
0k fr
om $
200k
in 2
014
Budg
et
9

2014
Bud
get/
Proj
ectio
n ve
rsus
Pro
pose
d 20
15 B
udge
t (d
olla
rs in
thou
sand
s)
2014
Bud
get
2014
P
roje
ctio
nP
ropo
sed
2015
Bud
get
Cha
nge
- 20
14 B
udge
t vs
201
4 P
roje
ctio
n
Cha
nge
- 20
15 B
udge
t vs
201
4 B
udge
t
Cha
nge
- 20
15 B
udge
t vs
201
4 P
roje
ctio
n
Ope
rati
ng R
even
ue$8
9,45
0.1
$91,
606.
8$9
0,58
0.9
$2,1
56.6
$1,1
30.7
($1,
025.
9)O
pera
ting
Exp
ense
93,0
11.8
92,7
12.8
96,1
25.1
(299
.0)
3,
113.
3
3,
412.
3O
pera
ting
Rev
Ove
r/(U
nder
) Ex
pens
es(3
,561
.7)
(1,1
06.0
)
(5
,544
.3)
2,45
5.7
(1,9
82.6
)
(4
,438
.2)
Inve
stm
ent
Inco
me
3,79
5.8
6,85
6.6
3,68
7.0
3,06
0.8
(108
.8)
(3
,169
.6)
Net
Rev
enue
s O
ver/
(Und
er)
Expe
nses
$234
.1$5
,750
.6($
1,85
7.3)
$5,5
16.5
($2,
091.
4)($
7,60
7.9)
10
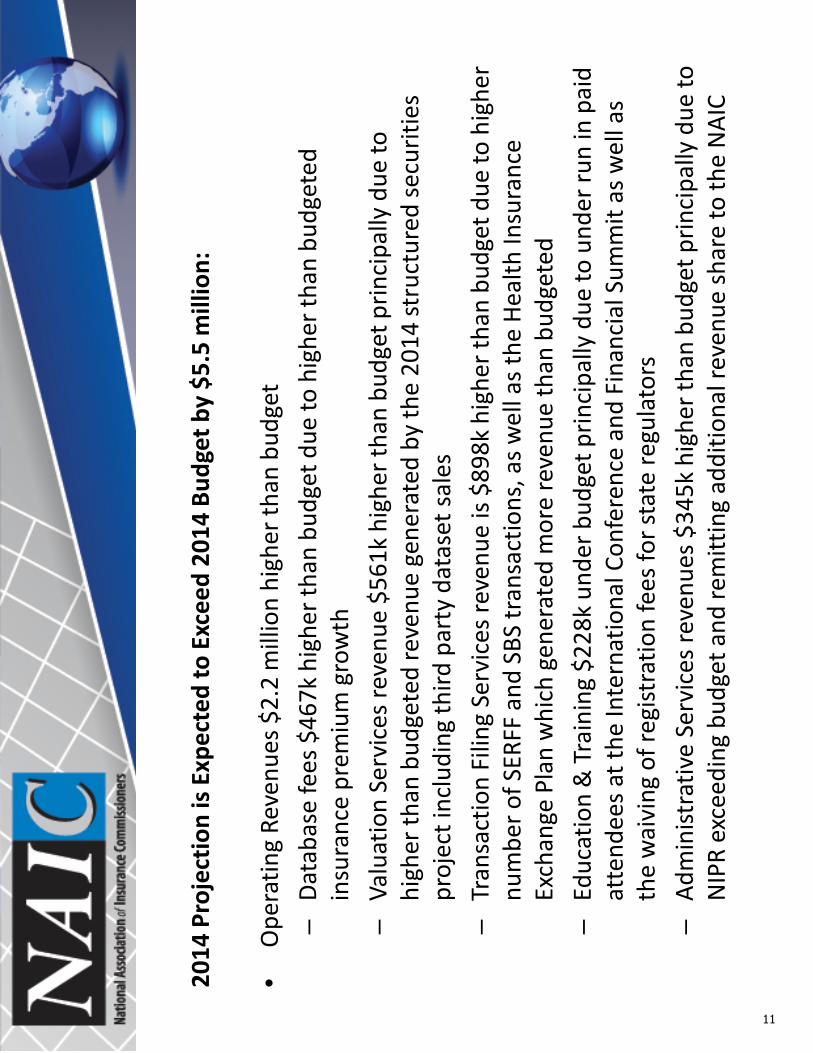
2014
Pro
ject
ion
is E
xpec
ted
to E
xcee
d 20
14 B
udge
t by
$5.5
mill
ion:
•
Ope
ratin
g Re
venu
es $
2.2
mill
ion
high
er th
an b
udge
t –
Data
base
fees
$46
7k h
ighe
r tha
n bu
dget
due
to h
ighe
r tha
n bu
dget
ed
insu
ranc
e pr
emiu
m g
row
th
–Va
luat
ion
Serv
ices
reve
nue
$561
k hi
gher
than
bud
get p
rinci
pally
due
to
high
er th
an b
udge
ted
reve
nue
gene
rate
d by
the
2014
stru
ctur
ed se
curit
ies
proj
ect i
nclu
ding
third
par
ty d
atas
et sa
les
–Tr
ansa
ctio
n Fi
ling
Serv
ices
reve
nue
is $8
98k
high
er th
an b
udge
t due
to h
ighe
r nu
mbe
r of S
ERFF
and
SBS
tran
sact
ions
, as w
ell a
s the
Hea
lth In
sura
nce
Exch
ange
Pla
n w
hich
gen
erat
ed m
ore
reve
nue
than
bud
gete
d –
Educ
atio
n &
Tra
inin
g $2
28k
unde
r bud
get p
rinci
pally
due
to u
nder
run
in p
aid
atte
ndee
s at t
he In
tern
atio
nal C
onfe
renc
e an
d Fi
nanc
ial S
umm
it as
wel
l as
the
wai
ving
of r
egist
ratio
n fe
es fo
r sta
te re
gula
tors
–
Adm
inist
rativ
e Se
rvic
es re
venu
es $
345k
hig
her t
han
budg
et p
rinci
pally
due
to
NIP
R ex
ceed
ing
budg
et a
nd re
mitt
ing
addi
tiona
l rev
enue
shar
e to
the
NAI
C
11
2014
Pro
ject
ion
is E
xpec
ted
to E
xcee
d 20
14 B
udge
t by
$5.5
mill
ion
(con
t.):
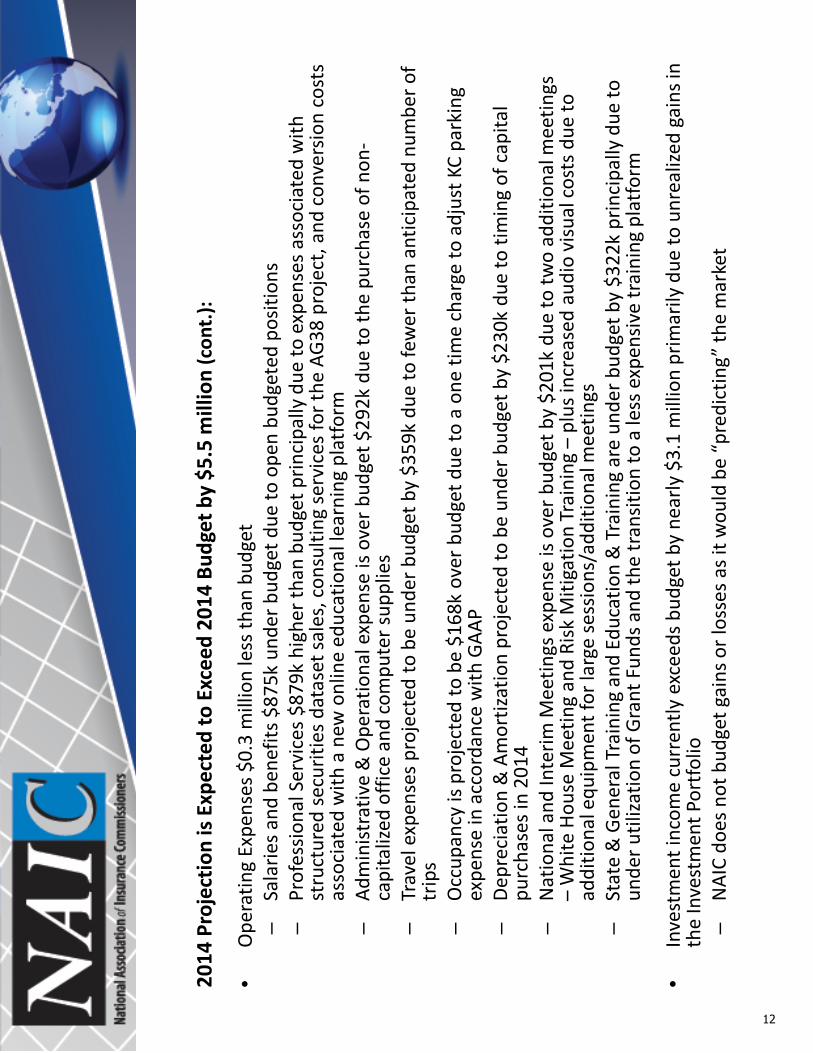
•O
pera
ting
Expe
nses
$0.
3 m
illio
n le
ss th
an b
udge
t –
Sala
ries a
nd b
enef
its $
875k
und
er b
udge
t due
to o
pen
budg
eted
pos
ition
s –
Prof
essio
nal S
ervi
ces
$879
k hi
gher
than
bud
get p
rinci
pally
due
to e
xpen
ses a
ssoc
iate
d w
ith
stru
ctur
ed s
ecur
ities
dat
aset
sale
s, c
onsu
lting
serv
ices
for t
he A
G38
proj
ect,
and
conv
ersio
n co
sts
asso
ciat
ed w
ith a
new
onl
ine
educ
atio
nal l
earn
ing
plat
form
–
Adm
inist
rativ
e &
Ope
ratio
nal e
xpen
se is
ove
r bud
get $
292k
due
to th
e pu
rcha
se o
f non
-ca
pita
lized
offi
ce a
nd co
mpu
ter s
uppl
ies
–Tr
avel
exp
ense
s pro
ject
ed to
be
unde
r bud
get b
y $3
59k
due
to fe
wer
than
ant
icip
ated
num
ber o
f tr
ips
–O
ccup
ancy
is p
roje
cted
to b
e $1
68k
over
bud
get d
ue to
a o
ne ti
me
char
ge to
adj
ust K
C pa
rkin
g ex
pens
e in
acc
orda
nce
with
GAA
P –
Depr
ecia
tion
& A
mor
tizat
ion
proj
ecte
d to
be
unde
r bud
get b
y $2
30k
due
to ti
min
g of
cap
ital
purc
hase
s in
2014
–
Nat
iona
l and
Inte
rim M
eetin
gs e
xpen
se is
ove
r bud
get b
y $2
01k
due
to tw
o ad
ditio
nal m
eetin
gs
– W
hite
Hou
se M
eetin
g an
d Ri
sk M
itiga
tion
Trai
ning
– p
lus i
ncre
ased
aud
io v
isual
cost
s due
to
addi
tiona
l equ
ipm
ent f
or la
rge
sess
ions
/add
ition
al m
eetin
gs
–St
ate
& G
ener
al T
rain
ing
and
Educ
atio
n &
Tra
inin
g ar
e un
der b
udge
t by
$322
k pr
inci
pally
due
to
unde
r util
izatio
n of
Gra
nt F
unds
and
the
tran
sitio
n to
a le
ss e
xpen
sive
trai
ning
pla
tform
•In
vest
men
t inc
ome
curr
ently
exc
eeds
bud
get b
y ne
arly
$3.
1 m
illio
n pr
imar
ily d
ue to
unr
ealiz
ed g
ains
in
the
Inve
stm
ent P
ortfo
lio
–N
AIC
does
not
bud
get g
ains
or l
osse
s as i
t wou
ld b
e “p
redi
ctin
g” th
e m
arke
t
12

Actu
al 2
013
– Pr
opos
ed 2
015
Budg
et R
even
ue C
ompo
sitio
n (d
olla
rs in
thou
sand
s)
20
13
Act
ua
l
20
13
C
om
po
site
M
ix2
01
4 B
ud
ge
t
20
14
B
ud
ge
t C
om
po
site
M
ix2
01
4
Pro
ject
ion
20
14
P
roje
ctio
n
Co
mp
osi
te
Mix
20
15
P
rop
ose
d
Bu
dg
et
20
15
C
om
po
site
M
ix
Da
tab
ase
Fe
es
$26,
363.
727
.2%
$26,
356.
629
.5%
$26,
823.
629
.3%
$25,
744.
128
.4%
Va
lua
tio
n S
erv
ice
s29
,225
.530
.2%
23,1
38.2
25.9
%23
,699
.025
.9%
24,4
41.6
27.0
%
Pu
bli
cati
on
s/ID
P15
,098
.215
.6%
15,3
36.1
17.2
%15
,382
.316
.8%
14,8
13.1
16.4
%
Tra
nsa
ctio
n F
ilin
g F
ee
s12
,735
.813
.2%
11,1
92.9
12.5
%12
,090
.613
.2%
11,9
03.5
13.1
%
Ad
min
istr
ati
ve/L
ice
nse
Fe
es
7,79
7.1
8.0%
7,97
4.0
8.9%
8,31
9.5
9.1%
8,55
8.1
9.5%
Me
mb
er
Ass
ess
me
nts
2,30
0.8
2.4%
2,34
4.5
2.6%
2,34
4.5
2.5%
2,19
3.8
2.4%
Na
tio
na
l M
ee
tin
gs
1,89
3.1
2.0%
1,90
0.6
2.1%
1,91
4.1
2.1%
1,93
9.8
2.1%
Ed
uca
tio
n &
Tra
inin
g
1,09
6.1
1.1%
1,18
0.5
1.3%
953.
01.
0%95
8.1
1.1%
Oth
er
Re
ven
ue
285.
50.
3%26
.70.
0%80
.30.
1%28
.70.
0%
TO
TA
L O
PE
RA
TIN
G R
EV
EN
UE
S$
96
,79
5.8
10
0.0
%$
89
,45
0.1
10
0.0
%$
91
,60
6.8
10
0.0
%$
90
,58
0.9
10
0.0
%
13

Reve
nue
Chan
ge –
201
4 Bu
dget
/201
4 Pr
ojec
tion/
2015
Pro
pose
d Bu
dget
(d
olla
rs in
thou
sand
s)
Pro
pose
d 20
15
Bud
get
to 2
014
Bud
get
Pro
pose
d 20
15
Bud
get
to 2
014
Pro
ject
ion
Dat
abas
e Fe
es
($61
2.4)
($1,
079.
5)V
alua
tion
Ser
vice
s1,
303.
4
742.
6
Pub
licat
ions
& I
nsur
ance
Dat
a P
rodu
cts
(523
.0)
( 569
.3)
Tra
nsac
tion
Fili
ng F
ees
710.
6
(187
.1)
Adm
inis
trat
ive/
Lice
nse
Fees
584.
1
238.
6
Mem
ber
Ass
essm
ents
(150
.7)
(150
.7)
Nat
iona
l Mee
ting
s R
egis
trat
ion
Fees
39.2
25.8
Educ
atio
n &
Tra
inin
g (2
22.4
)
5.1
Oth
er R
even
ue2.
0
(51.
6)
T
OT
AL
OP
ERA
TIN
G R
EVEN
UES
$1,1
30.7
($1,
025.
9)
14
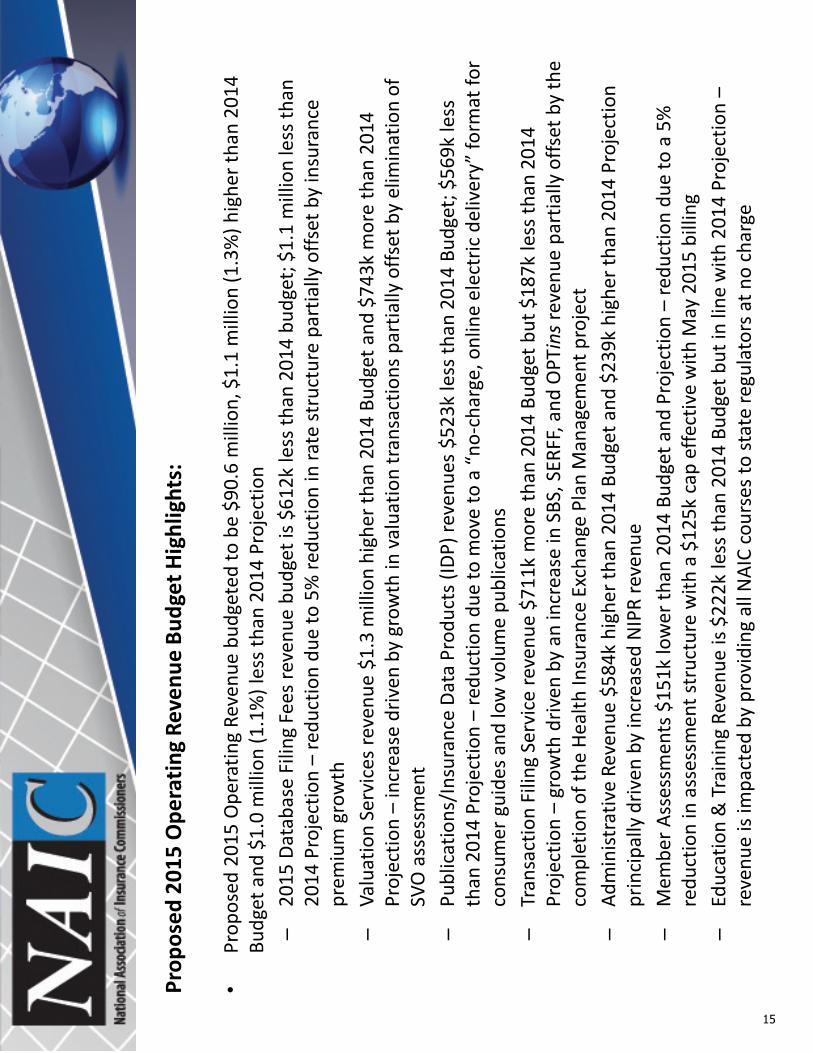
Prop
osed
201
5 O
pera
ting
Reve
nue
Budg
et H
ighl
ight
s:
•Pr
opos
ed 2
015
Ope
ratin
g Re
venu
e bu
dget
ed to
be
$90.
6 m
illio
n, $
1.1
mill
ion
(1.3
%) h
ighe
r tha
n 20
14
Budg
et a
nd $
1.0
mill
ion
(1.1
%) l
ess t
han
2014
Pro
ject
ion
–
2015
Dat
abas
e Fi
ling
Fees
reve
nue
budg
et is
$61
2k le
ss th
an 2
014
budg
et; $
1.1
mill
ion
less
than
20
14 P
roje
ctio
n –
redu
ctio
n du
e to
5%
redu
ctio
n in
rate
stru
ctur
e pa
rtia
lly o
ffset
by
insu
ranc
e pr
emiu
m g
row
th
–Va
luat
ion
Serv
ices
reve
nue
$1.3
mill
ion
high
er th
an 2
014
Budg
et a
nd $
743k
mor
e th
an 2
014
Proj
ectio
n –
incr
ease
driv
en b
y gr
owth
in v
alua
tion
tran
sact
ions
par
tially
offs
et b
y el
imin
atio
n of
SV
O a
sses
smen
t –
Publ
icat
ions
/Ins
uran
ce D
ata
Prod
ucts
(IDP
) rev
enue
s $5
23k
less
than
201
4 Bu
dget
; $56
9k le
ss
than
201
4 Pr
ojec
tion
– re
duct
ion
due
to m
ove
to a
“no
-cha
rge,
onl
ine
elec
tric
del
iver
y” fo
rmat
for
cons
umer
gui
des a
nd lo
w v
olum
e pu
blic
atio
ns
–Tr
ansa
ctio
n Fi
ling
Serv
ice
reve
nue
$711
k m
ore
than
201
4 Bu
dget
but
$18
7k le
ss th
an 2
014
Proj
ectio
n –
grow
th d
riven
by
an in
crea
se in
SBS
, SER
FF, a
nd O
PTin
s rev
enue
par
tially
offs
et b
y th
e co
mpl
etio
n of
the
Heal
th In
sura
nce
Exch
ange
Pla
n M
anag
emen
t pro
ject
–
Adm
inist
rativ
e Re
venu
e $5
84k
high
er th
an 2
014
Budg
et a
nd $
239k
hig
her t
han
2014
Pro
ject
ion
prin
cipa
lly d
riven
by
incr
ease
d N
IPR
reve
nue
–M
embe
r Ass
essm
ents
$15
1k lo
wer
than
201
4 Bu
dget
and
Pro
ject
ion
– re
duct
ion
due
to a
5%
re
duct
ion
in a
sses
smen
t str
uctu
re w
ith a
$12
5k c
ap e
ffect
ive
with
May
201
5 bi
lling
–
Educ
atio
n &
Tra
inin
g Re
venu
e is
$222
k le
ss th
an 2
014
Budg
et b
ut in
line
with
201
4 Pr
ojec
tion
– re
venu
e is
impa
cted
by
prov
idin
g al
l NAI
C co
urse
s to
stat
e re
gula
tors
at n
o ch
arge
15
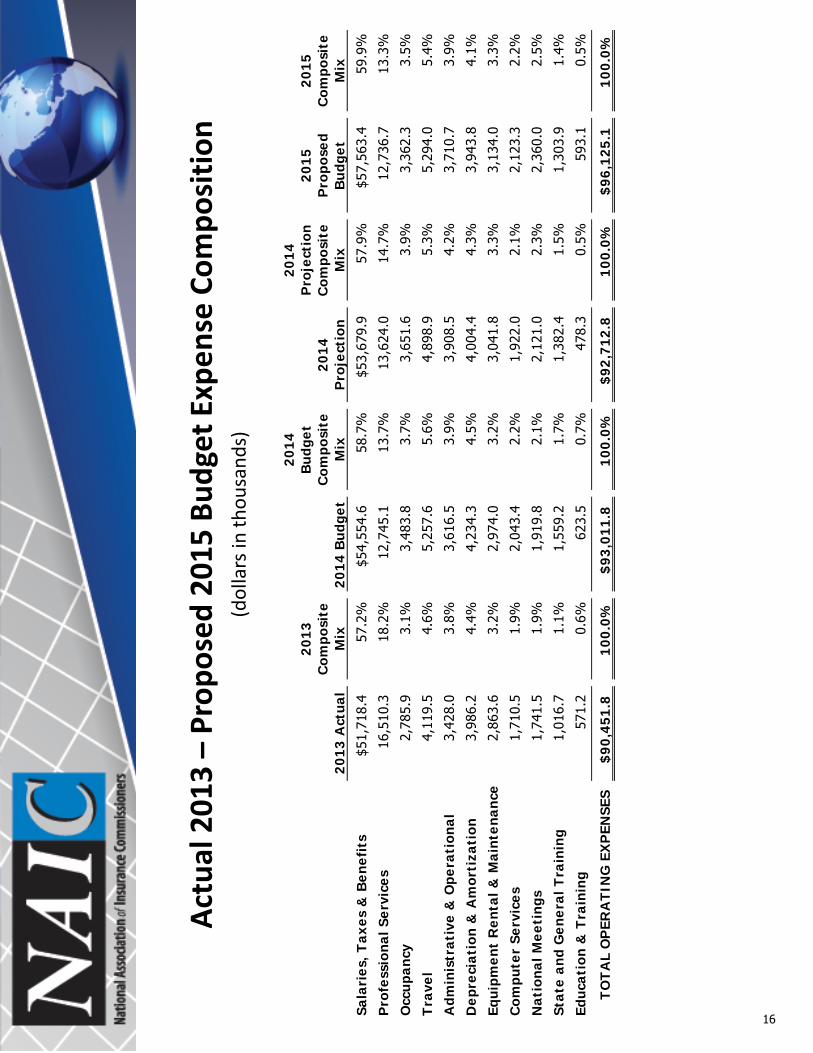
Actu
al 2
013
– Pr
opos
ed 2
015
Budg
et E
xpen
se C
ompo
sitio
n (d
olla
rs in
thou
sand
s)
20
13 A
ctua
l
2013
C
ompo
site
M
ix20
14 B
udge
t
2014
B
udge
t C
ompo
site
M
ix20
14
Pro
ject
ion
2014
P
roje
ctio
n C
ompo
site
M
ix
2015
P
ropo
sed
Bud
get
2015
C
ompo
site
M
ix
Sala
ries
, Tax
es &
Ben
efit
s$5
1,71
8.4
57.2
%$5
4,55
4.6
58.7
%$5
3,67
9.9
57.9
%$5
7,56
3.4
59.9
%
Pro
fess
iona
l Ser
vice
s16
,510
.318
.2%
12,7
45.1
13.7
%13
,624
.014
.7%
12,7
36.7
13.3
%
Occ
upan
cy2,
785.
93.
1%3,
483.
83.
7%3,
651.
63.
9%3,
362.
33.
5%
Tra
vel
4,11
9.5
4.6%
5,25
7.6
5.6%
4,89
8.9
5.3%
5,29
4.0
5.4%
Adm
inis
trat
ive
& O
pera
tion
al
3,42
8.0
3.8%
3,61
6.5
3.9%
3,90
8.5
4.2%
3,71
0.7
3.9%
Dep
reci
atio
n &
Am
orti
zati
on3,
986.
24.
4%4,
234.
34.
5%4,
004.
44.
3%3,
943.
84.
1%
Equi
pmen
t R
enta
l & M
aint
enan
ce2,
863.
63.
2%2,
974.
03.
2%3,
041.
83.
3%3,
134.
03.
3%
Com
pute
r Se
rvic
es1,
710.
51.
9%2,
043.
42.
2%1,
922.
02.
1%2,
123.
32.
2%
Nat
iona
l Mee
ting
s1,
741.
51.
9%1,
919.
82.
1%2,
121.
02.
3%2,
360.
02.
5%
Stat
e an
d G
ener
al T
rain
ing
1,01
6.7
1.1%
1,55
9.2
1.7%
1,38
2.4
1.5%
1,30
3.9
1.4%
Educ
atio
n &
Tra
inin
g 57
1.2
0.6%
623.
50.
7%47
8.3
0.5%
593.
10.
5%
TO
TA
L O
PER
AT
ING
EX
PEN
SES
$90,
451.
810
0.0%
$93,
011.
810
0.0%
$92,
712.
810
0.0%
$96,
125.
110
0.0%
16
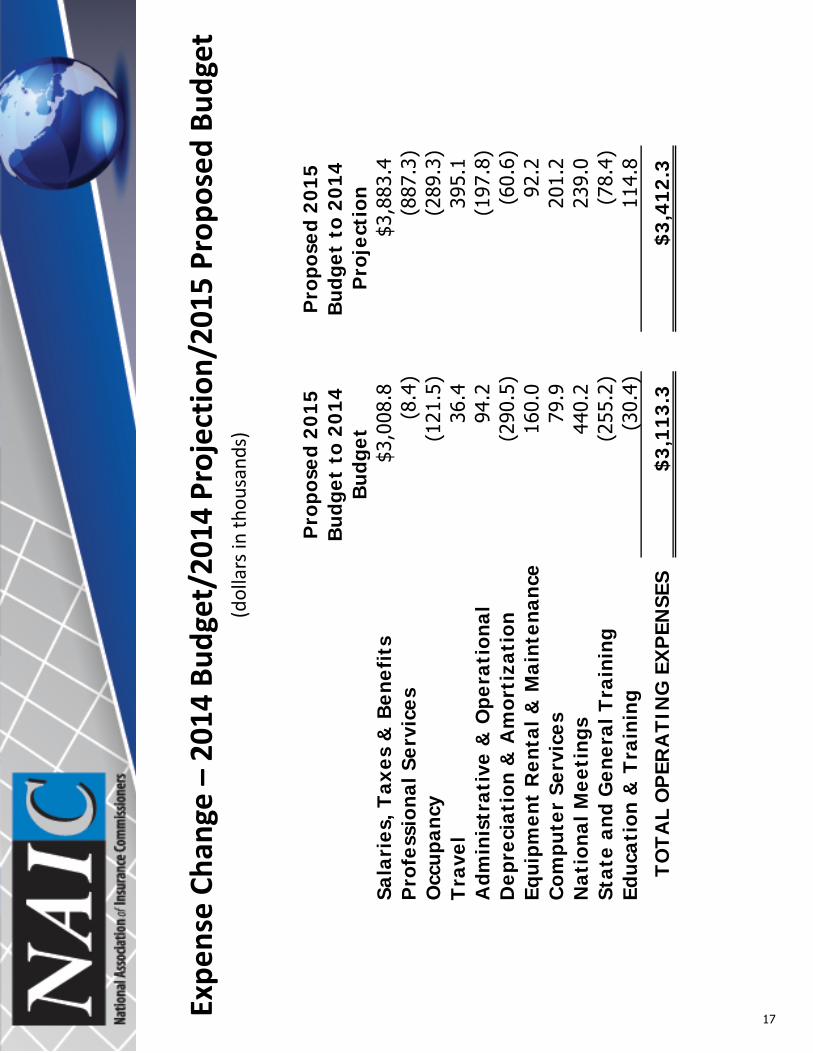
Expe
nse
Chan
ge –
201
4 Bu
dget
/201
4 Pr
ojec
tion/
2015
Pro
pose
d Bu
dget
(d
olla
rs in
thou
sand
s)
Pro
pose
d 20
15
Bud
get
to 2
014
Bud
get
Pro
pose
d 20
15
Bud
get
to 2
014
Pro
ject
ion
Sala
ries
, Tax
es &
Ben
efit
s$3
,008
.8$3
,883
.4P
rofe
ssio
nal S
ervi
ces
(8.4
)(8
87.3
)O
ccup
ancy
(121
.5)
(289
.3)
Tra
vel
36.4
395.
1A
dmin
istr
ativ
e &
Ope
rati
onal
94
.2(1
97.8
)D
epre
ciat
ion
& A
mor
tiza
tion
(290
.5)
(60.
6)Eq
uipm
ent
Ren
tal &
Mai
nten
ance
160.
092
.2C
ompu
ter
Serv
ices
79.9
201.
2N
atio
nal M
eeti
ngs
440.
223
9.0
Stat
e an
d G
ener
al T
rain
ing
(255
.2)
(78.
4)Ed
ucat
ion
& T
rain
ing
(30.
4)11
4.8
TO
TA
L O
PER
AT
ING
EX
PEN
SES
$3,1
13.3
$3,4
12.3
17
Prop
osed
201
5 O
pera
ting
Expe
nse
Budg
et:
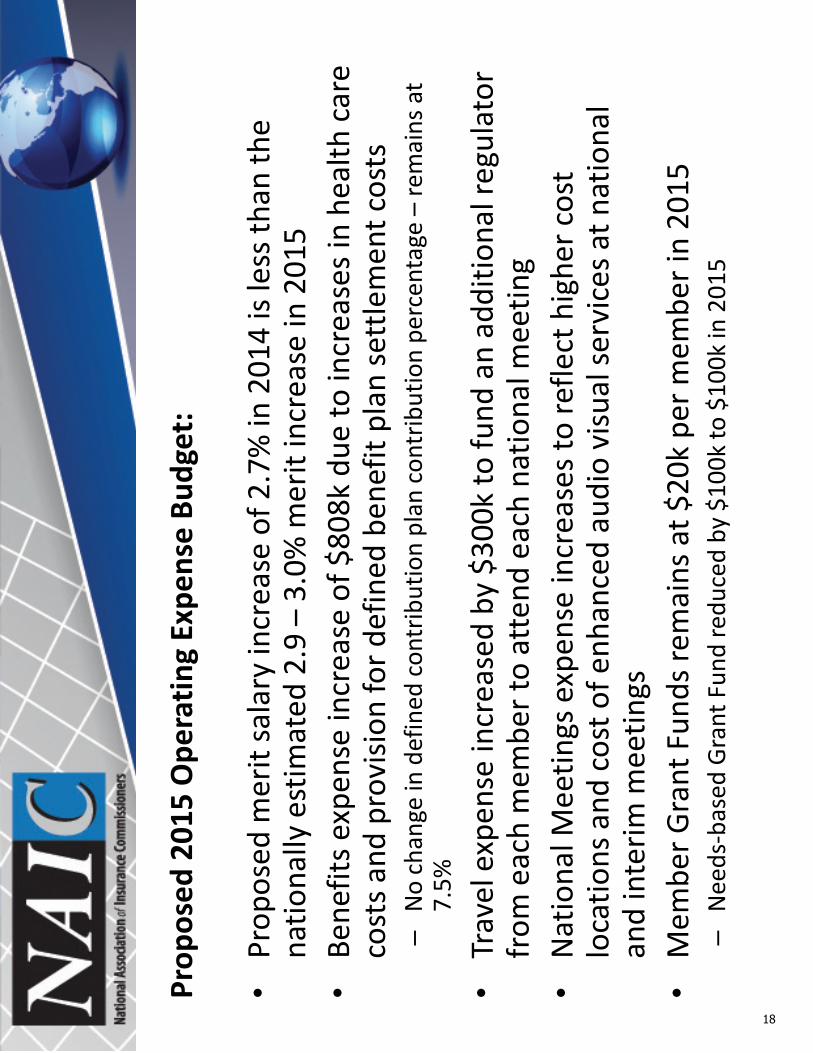
•Pr
opos
ed m
erit
sala
ry in
crea
se o
f 2.7
% in
201
4 is
less
than
the
natio
nally
est
imat
ed 2
.9 –
3.0
% m
erit
incr
ease
in 2
015
•Be
nefit
s exp
ense
incr
ease
of $
808k
due
to in
crea
ses i
n he
alth
car
e co
sts a
nd p
rovi
sion
for d
efin
ed b
enef
it pl
an se
ttle
men
t cos
ts
–N
o ch
ange
in d
efin
ed c
ontr
ibut
ion
plan
con
trib
utio
n pe
rcen
tage
– re
mai
ns a
t 7.
5%
•Tr
avel
exp
ense
incr
ease
d by
$30
0k to
fund
an
addi
tiona
l reg
ulat
or
from
eac
h m
embe
r to
atte
nd e
ach
natio
nal m
eetin
g •
Nat
iona
l Mee
tings
exp
ense
incr
ease
s to
refle
ct h
ighe
r cos
t lo
catio
ns a
nd c
ost o
f enh
ance
d au
dio
visu
al se
rvic
es a
t nat
iona
l an
d in
terim
mee
tings
•
Mem
ber G
rant
Fun
ds re
mai
ns a
t $20
k pe
r mem
ber i
n 20
15
–N
eeds
-bas
ed G
rant
Fun
d re
duce
d by
$10
0k to
$10
0k in
201
5
18

Prop
osed
201
5 Fi
scal
Impa
ct S
tate
men
ts:
20
15 R
even
ue20
15 E
xpen
seN
et I
mpa
ct o
n 20
15 B
udge
t20
15 C
apit
al
$50,
505
($50
,505
)$2
,846
,028
1,87
7
(1,8
77)
490,
599
75,7
85
(75,
785)
156,
702
(156
,702
)14
,659
53,0
60
(53,
060)
253,
331
(253
,331
)50
,141
($3,
291,
704)
(105
,379
)
(3,1
86,3
25)
Tot
al F
isca
l Im
pact
Sta
tem
ents
($3,
291,
704)
$485
,881
($3,
777,
585)
$3,4
01,4
27
93,8
72,5
65
95,6
39,2
40
(1,7
66,6
75)
$90,
580,
861
$96,
125,
121
($5,
544,
260)
Pro
pose
d 20
15 B
udge
t B
efor
e Fi
scal
s (B
efor
e In
vest
men
t In
com
e)
Pro
pose
d 20
15 B
udge
t A
fter
Fis
cals
(B
efor
e In
vest
men
t In
com
e)
Com
mer
cial
Mor
tgag
e-B
acke
d Se
curi
ties
(C
MB
S)
Res
ourc
e fo
r St
ruct
ured
Sec
urit
ies
Gro
up (
SSG
)
Enha
nced
Sup
port
for
Mem
ber
Use
of
Elec
tron
ic
Wor
kpap
ers
2015
Rev
enue
Mod
ific
atio
n
Init
iati
ve
Stat
e B
ased
Sys
tem
s (S
BS)
Sof
twar
e En
hanc
emen
t an
d T
echn
olog
y C
ompl
ianc
e In
itia
tive
- P
hase
III
Secu
riti
es S
yste
m R
ewri
te (
SSR
) -
Expa
nded
Pha
se I
SER
FF I
nteg
rati
on E
xpan
sion
Stat
e P
rodu
cer
Lice
nsin
g (S
PL)
Tea
m A
ugm
enta
tion
19

•Pr
opos
ed 2
015
Head
coun
t Add
ition
s bas
ed o
n fis
cals
:
–Ad
ditio
n of
2 st
aff (
both
IT su
ppor
t sta
ff) o
n St
ate
Prod
ucer
Lic
ensin
g (S
PL) T
eam
–
Addi
tion
of 1
staf
f (CM
BS v
alua
tion
expe
rt) a
s a m
embe
r of t
he
Stru
ctur
ed S
ecur
ities
Gro
up to
ove
rsee
com
mer
cial
mor
tgag
e-ba
cked
se
curit
ies (
CMBS
) and
com
mer
cial
loan
s •
Repl
aces
con
sulti
ng e
xpen
se
–
Addi
tion
of 1
staf
f to
supp
ort t
he M
embe
rs’ u
se o
f ele
ctro
nic
wor
kpap
ers f
or d
ocum
enta
tion
of a
naly
sis a
nd e
xam
inat
ion
activ
ities
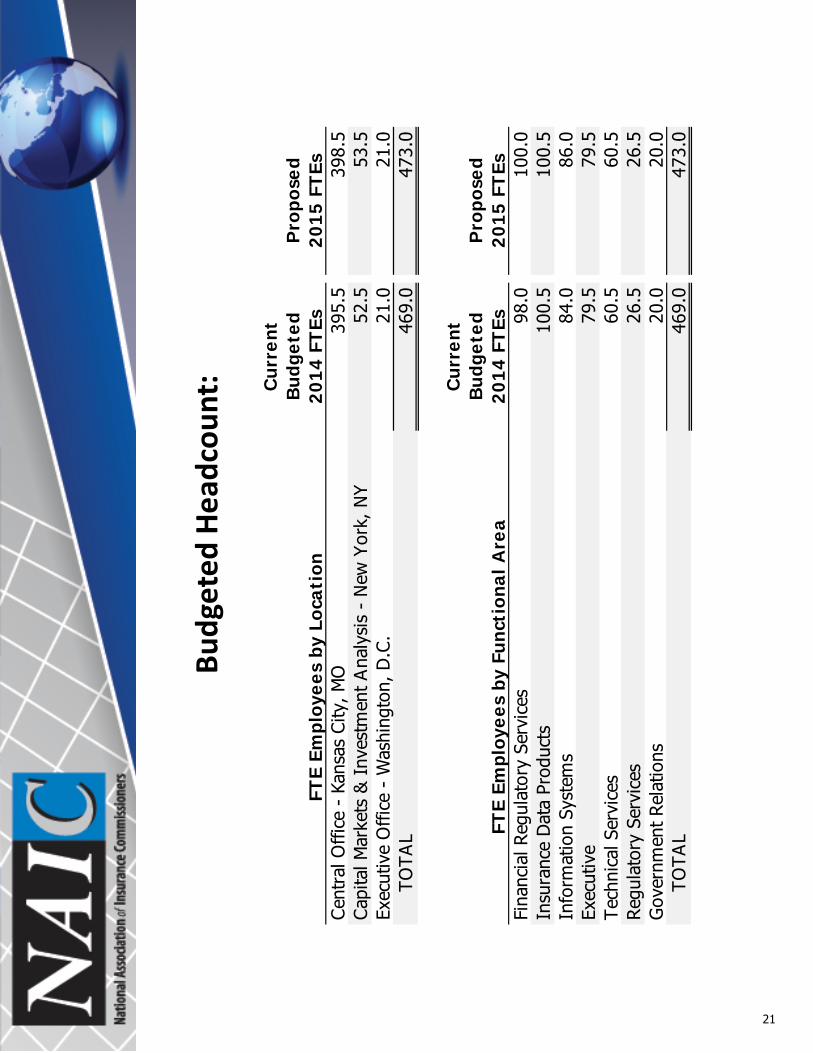
20
Budg
eted
Hea
dcou
nt:
C
urre
ntB
udge
ted
Pro
pose
dFT
E Em
ploy
ees
by L
ocat
ion
2014
FT
Es20
15 F
TEs
Cen
tral
Offi
ce -
Kan
sas
City
, M
O39
5.5
398.
5Cap
ital M
arke
ts &
Inv
estm
ent A
naly
sis
- N
ew Y
ork,
NY
52.5
53.5
Exec
utiv
e O
ffice
- W
ashi
ngto
n, D
.C.
21.0
21.0
TO
TA
L46
9.0
473.
0
Cur
rent
Bud
gete
dP
ropo
sed
FTE
Empl
oyee
s by
Fun
ctio
nal A
rea
2014
FT
Es20
15 F
TEs
Fina
ncia
l Reg
ulat
ory
Serv
ices
98.0
100.
0In
sura
nce
Dat
a Pr
oduc
ts10
0.5
100.
5In
form
atio
n Sy
stem
s84
.086
.0Ex
ecut
ive
79.5
79.5
Tec
hnic
al S
ervi
ces
60.5
60.5
Reg
ulat
ory
Serv
ices
26.5
26.5
Gov
ernm
ent Re
latio
ns20
.020
.0
T
OTA
L46
9.0
473.
0
21

Liqu
id O
pera
ting
Rese
rve
Ratio
: •
Actu
al R
eser
ve R
atio
at 1
2/31
/11:
65.
8%
•
Actu
al R
eser
ve R
atio
at 1
2/31
/12:
82.
2%
•
Actu
al R
eser
ve R
atio
at 1
2/31
/13:
106
.0%
•Pr
ojec
ted
Rese
rve
Ratio
at 1
2/31
/14:
102
.1%
•Pr
opos
ed 2
015
Rese
rve
Ratio
at 1
2/31
/15:
94.
7%
22

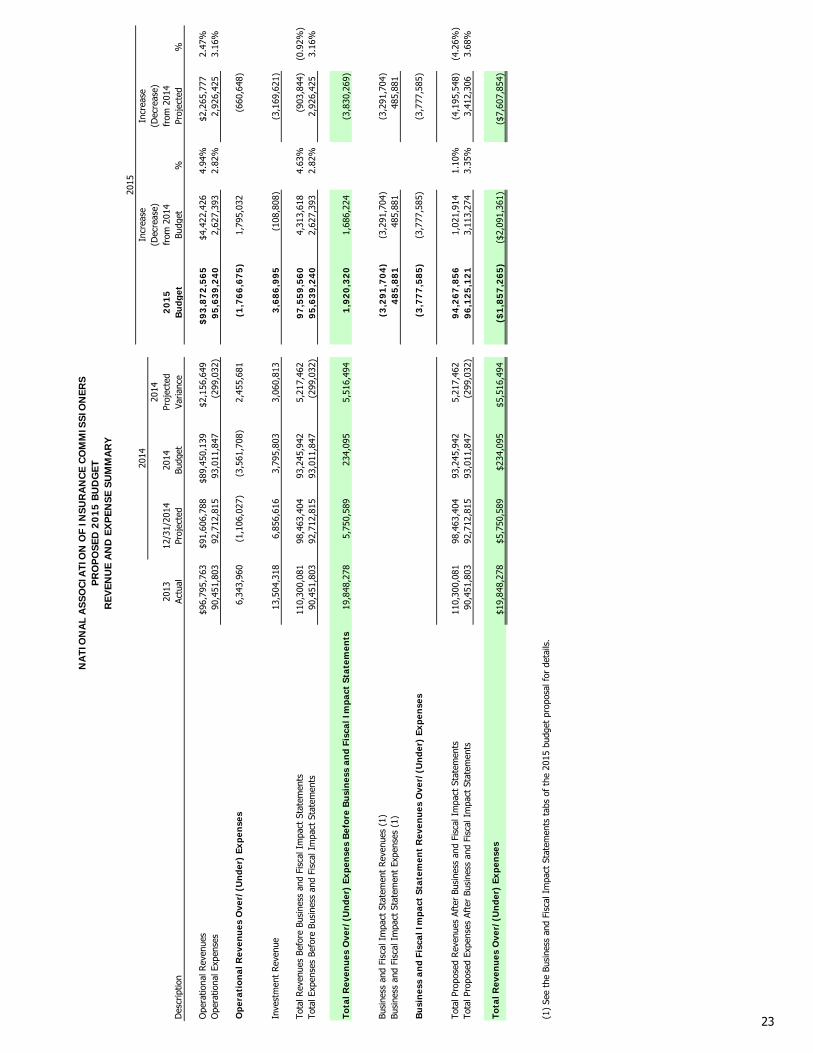
Revenue and Expense
Summ
aries

Incr
ease
Incr
ease
2014
(Dec
reas
e)(D
ecre
ase)
2013
12/3
1/20
1420
14Pr
ojec
ted
20
15
from
201
4fr
om 2
014
Des
crip
tion
Actu
alPr
ojec
ted
Budg
etVa
rianc
eB
udg
etBu
dget
%Pr
ojec
ted
%
Ope
ratio
nal R
even
ues
$96,
795,
763
$91,
606,
788
$89,
450,
139
$2,1
56,6
49$
93
,87
2,5
65
$4,4
22,4
264.
94%
$2,2
65,7
772.
47%
Ope
ratio
nal E
xpen
ses
90,4
51,8
0392
,712
,815
93,0
11,8
47
(2
99,0
32)
9
5, 6
39
,24
02,
627,
393
2.82
%2,
926,
425
3.16
%
Ope
rati
onal
Rev
enu
es O
ver/
(Un
der)
Exp
ense
s6,
343,
960
(1,1
06,0
27)
(3,5
61,7
08)
2,45
5,68
1(1
,76
6,6
75
)1,
795,
032
(660
,648
)
Inve
stm
ent
Reve
nue
13,5
04,3
186,
856,
616
3,79
5,80
33,
060,
813
3,6
86
,99
5(1
08,8
08)
(3,1
69,6
21)
Tota
l Rev
enue
s Be
fore
Bus
ines
s an
d Fi
scal
Im
pact
Sta
tem
ents
110,
300,
081
98,4
63,4
0493
,245
,942
5,21
7,46
29
7,5
59
,56
04,
313,
618
4.63
%(9
03,8
44)
(0.9
2%)
Tota
l Exp
ense
s Be
fore
Bus
ines
s an
d Fi
scal
Im
pact
Sta
tem
ents
90,4
51,8
0392
,712
,815
93,0
11,8
47(2
99,0
32)
95
,63
9,2
40
2,62
7,39
32.
82%
2,92
6,42
53.
16%
Tota
l Rev
enu
es O
ver/
(Un
der)
Exp
ense
s B
efor
e B
usi
nes
s an
d Fi
scal
Im
pact
Sta
tem
ents
19
,848
,278
5,75
0,58
923
4,09
55,
516,
494
1,9
20
,32
01,
686,
224
(3,8
30,2
69)
Busi
ness
and
Fis
cal I
mpa
ct S
tate
men
t Re
venu
es (
1)(3
,29
1,7
04
)(3
,291
,704
)(3
,291
,704
)Bu
sine
ss a
nd F
isca
l Im
pact
Sta
tem
ent
Expe
nses
(1)
48
5,8
81
485,
881
485,
881
Bu
sin
ess
and
Fisc
al I
mpa
ct S
tate
men
t R
even
ues
Ove
r/(U
nde
r) E
xpen
ses
(3,7
77
,58
5)
(3,7
77,5
85)
(3,7
77,5
85)
Tota
l Pro
pose
d Re
venu
es A
fter
Bus
ines
s an
d Fi
scal
Im
pact
Sta
tem
ents
110,
300,
081
98,4
63,4
0493
,245
,942
5,21
7,46
29
4,2
67
,85
61,
021,
914
1.10
%(4
,195
,548
)(4
.26%
)To
tal P
ropo
sed
Expe
nses
Aft
er B
usin
ess
and
Fisc
al I
mpa
ct S
tate
men
ts90
,451
,803
92,7
12,8
1593
,011
,847
(299
,032
)9
6,1
25
,12
13,
113,
274
3.35
%3,
412,
306
3.68
%
Tota
l Rev
enu
es O
ver/
(Un
der)
Exp
ense
s$1
9,84
8,27
8$5
,750
,589
$234
,095
$5,5
16,4
94($
1,8
57
,26
5)
($2,
091,
361)
($7,
607,
854)
(1)
See
the
Busi
ness
and
Fis
cal I
mpa
ct S
tate
men
ts t
abs
of t
he 2
015
budg
et p
ropo
sal f
or d
etai
ls.
NA
TIO
NA
L A
SSO
CIA
TIO
N O
F IN
SUR
AN
CE
CO
MM
ISSI
ON
ERS
2014
2015
PR
OP
OSE
D 2
015
BU
DG
ETR
EVEN
UE
AN
D E
XP
ENSE
SU
MM
AR
Y
23

24

Incr
ease
Incr
ease
2014
(Dec
reas
e)(D
ecre
ase)
2013
6/30
/201
412
/31/
2014
2014
Proj
ecte
d20
15fr
om 2
014
from
201
4D
escr
iptio
nRe
fere
nce
Actu
alAc
tual
Proj
ecte
dBu
dget
Varia
nce
Bud
get
Budg
et%
Proj
ecte
d%
Mem
ber
Asse
ssm
ents
R1$2
,300
,773
$1,1
64,9
22$2
,344
,462
$2,3
44,4
60$2
$2,1
93,7
84($
150,
676)
(6.4
3%)
($15
0,67
8)(6
.43%
)D
atab
ase
Fees
R226
,363
,745
26,8
23,6
2926
,823
,629
26,3
56,5
9346
7,03
625
,744
,147
(612
,446
)(2
.32%
)(1
,079
,482
)(4
.02%
)Pu
blic
atio
ns a
nd I
nsur
ance
Dat
a Pr
oduc
tsR3
15,0
98,2
034,
936,
334
15,3
82,3
1815
,336
,105
46,2
1314
,813
,061
(523
,044
)(3
.41%
)(5
69,2
57)
(3.7
0%)
Valu
atio
n Se
rvic
esR4
29,2
25,5
177,
463,
104
23,6
98,9
9723
,138
,201
560,
796
24,4
41,6
371,
303,
436
5.63
%74
2,64
03.
13%
Tran
sact
ion
Filin
g Fe
esR5
12,7
35,7
996,
700,
664
12,0
90,5
5511
,192
,926
897,
629
11,9
03,4
9871
0,57
26.
35%
(187
,057
)(1
.55%
)N
atio
nal M
eetin
g Re
gist
ratio
n Fe
esR6
1,89
3,10
063
1,80
01,
914,
050
1,90
0,62
513
,425
1,93
9,80
039
,175
2.06
%25
,750
1.35
%Ed
ucat
ion
and
Trai
ning
R71,
096,
089
536,
852
952,
978
1,18
0,49
6(2
27,5
18)
958,
106
(222
,390
)(1
8.84
%)
5,12
80.
54%
Adm
inis
trat
ive
Serv
ices
/Lic
ense
Fee
sR8
7,79
7,07
84,
196,
438
8,31
9,49
07,
974,
033
345,
457
8,55
8,12
858
4,09
57.
32%
238,
638
2.87
%O
ther
Rev
enue
R928
5,45
969
,209
80,3
0926
,700
53,6
0928
,700
2,00
07.
49%
(51,
609)
(64.
26%
)
Tot
al O
pera
ting
Reve
nues
96,7
95,7
6352
,522
,952
91,6
06,7
8889
,450
,139
2,15
6,64
990
,580
,861
1,13
0,72
21.
26%
(1,0
25,9
27)
(1.1
2%)
Sala
ries
E140
,349
,452
20,3
84,9
5542
,036
,198
42,8
97,1
34(8
60,9
36)
44,8
72,3
991,
975,
265
4.60
%2,
836,
201
6.75
%Te
mpo
rary
Per
sonn
elE2
382,
344
183,
756
389,
050
429,
134
(40,
084)
484,
602
55,4
6812
.93%
95,5
5224
.56%
Payr
oll T
axes
E32,
796,
262
1,65
4,46
12,
945,
701
3,02
5,77
3(8
0,07
2)3,
115,
614
89,8
412.
97%
169,
913
5.77
%Em
ploy
ee B
enef
its
E47,
467,
785
3,52
4,12
17,
483,
684
7,37
4,36
510
9,31
98,
182,
187
807,
822
10.9
5%69
8,50
39.
33%
Empl
oyee
Dev
elop
men
tE5
722,
575
543,
908
825,
289
828,
188
(2,8
99)
908,
559
80,3
719.
70%
83,2
7010
.09%
Prof
essi
onal
Ser
vice
sE6
16,5
10,2
773,
661,
536
13,6
24,0
0712
,745
,076
878,
931
12,7
36,6
75(8
,401
)(0
.07%
)(8
87,3
32)
(6.5
1%)
Com
pute
r Se
rvic
esE7
1,71
0,51
594
1,01
51,
922,
022
2,04
3,37
2(1
21,3
50)
2,12
3,26
079
,888
3.91
%20
1,23
810
.47%
Trav
elE8
4,11
9,45
72,
130,
482
4,89
8,93
25,
257,
624
(358
,692
)5,
294,
002
36,3
780.
69%
395,
070
8.06
%O
ccup
ancy
E92,
785,
913
1,82
8,40
83,
651,
642
3,48
3,81
716
7,82
53,
362,
330
(121
,488
)(3
.49%
)(2
89,3
12)
(7.9
2%)
Equi
pmen
t Re
ntal
and
Mai
nten
ance
E10
2,86
3,61
91,
481,
717
3,04
1,78
42,
974,
004
67,7
803,
133,
966
159,
962
5.38
%92
,182
3.03
%D
epre
ciat
ion
and
Amor
tizat
ion
E11
3,98
6,18
32,
090,
202
4,00
4,40
34,
234,
334
(229
,931
)3,
943,
807
(290
,527
)(6
.86%
)(6
0,59
6)(1
.51%
)In
sura
nce
E12
474,
336
250,
358
515,
457
496,
911
18,5
4655
1,31
354
,402
10.9
5%35
,856
6.96
%Te
leph
one
E13
344,
462
178,
126
385,
631
377,
108
8,52
345
8,60
781
,499
21.6
1%72
,976
18.9
2%Su
pplie
sE1
460
2,34
039
1,93
991
7,75
368
0,80
623
6,94
769
6,53
215
,726
2.31
%(2
21,2
21)
(24.
10%
)M
ail S
ervi
ces
E15
248,
730
125,
079
234,
641
237,
511
(2,8
70)
228,
122
(9,3
89)
(3.9
5%)
(6,5
19)
(2.7
8%)
Refe
renc
e M
ater
ials
E16
581,
461
305,
497
625,
438
625,
983
(545
)63
7,52
311
,540
1.84
%12
,085
1.93
%Pr
intin
g an
d Pr
oduc
tion
E17
322,
201
82,0
3718
7,27
018
7,30
8(3
8)13
2,95
8(5
4,35
0)(2
9.02
%)
(54,
312)
(29.
00%
)N
atio
nal a
nd I
nter
im M
eetin
gsE1
81,
741,
521
1,03
2,61
02,
120,
977
1,91
9,81
820
1,15
92,
360,
006
440,
188
22.9
3%23
9,02
911
.27%
Educ
atio
n an
d Tr
aini
ngE1
957
1,22
532
0,28
347
8,27
562
3,53
5(1
45,2
60)
593,
092
(30,
443)
(4.8
8%)
114,
817
24.0
1%St
ate
and
Gen
eral
Tra
inin
gE2
01,
016,
653
365,
224
1,38
2,37
71,
559,
161
(176
,784
)1,
303,
930
(255
,231
)(1
6.37
%)
(78,
447)
(5.6
7%)
Oth
er E
xpen
seE2
185
4,49
251
,409
1,04
2,28
51,
010,
885
31,4
001,
005,
638
(5,2
47)
(0.5
2%)
(36,
647)
(3.5
2%)
Tot
al O
pera
ting
Expe
nses
90,4
51,8
0341
,527
,123
92,7
12,8
1593
,011
,847
(299
,032
)96
,125
,121
3,11
3,27
43.
35%
3,41
2,30
63.
68%
Rev
enue
s O
ver/
(Und
er)
Expe
nses
bef
ore
Inve
stm
ent
Inco
me
6,34
3,96
010
,995
,829
(1,1
06,0
27)
(3,5
61,7
08)
2,45
5,68
1(5
,544
,260
)(1
,982
,553
)(4
,438
,233
)
Inve
stm
ent
Inco
me
II1
13,5
04,3
184,
796,
546
6,85
6,61
63,
795,
803
3,06
0,81
33,
686,
995
(108
,808
)(3
,169
,621
)
Reve
nues
Ove
r/(U
nder
) Ex
pens
es
$19,
848,
278
$15,
792,
375
$5,7
50,5
89$2
34,0
95$5
,516
,494
($1,
857,
265)
($2,
091,
361)
($7,
607,
854)
A de
taile
d an
alys
is o
f ea
ch li
ne it
em is
incl
uded
in t
he "
Reve
nue
Det
ail"
, "Ex
pens
e D
etai
l", a
nd "
Inve
stm
ent
Inco
me
Det
ail"
tab
s of
the
201
5 bu
dget
pro
posa
l.
2014
NA
TIO
NA
L A
SSO
CIA
TIO
N O
F IN
SUR
AN
CE
CO
MM
ISSI
ON
ERS
REV
ENU
E A
ND
EX
PEN
SE B
Y L
INE
2015
PR
OP
OSE
D 2
015
BU
DG
ET B
EFO
RE
BU
SIN
ESS
AN
D F
ISC
AL
IMP
AC
T ST
ATE
MEN
TS
25

26

Tech
nolo
gySe
rvic
esFi
nanc
ial
Mar
ket
Prod
ucts
Sy
stem
s an
dBu
sine
ssto
R
egul
ator
yR
egul
ator
yan
dD
escr
iptio
nR
efer
ence
Supp
ort
Ope
ratio
nsM
embe
rsAf
fairs
Serv
ices
Serv
ices
Tota
l
Sala
ries
E1
$10,
423,
870
$8,9
94,9
49$3
,884
,993
$11,
960,
901
$2,4
13,2
43$7
,194
,443
$44,
872,
399
Tem
pora
ry P
erso
nnel
E2
438,
382
46
,220
484,
602
Payr
oll T
axes
E3
824,
124
46
0,61
7
300,
589
79
4,47
3
169,
683
56
6,12
8
3,11
5,61
4
Empl
oyee
Ben
efits
E4
8,17
3,04
7
2,
500
6,
640
8,
182,
187
Em
ploy
ee D
evel
opm
ent
E5
144,
778
63
,506
434,
145
84
,400
74, 7
86
10
6,94
4
9 08,
559
Prof
essi
onal
Ser
vice
s E
654
4,33
8
3,27
6,54
3
1,
261,
491
6,64
9,15
6
31
,000
974,
147
12
,736
,675
Com
pute
r Se
rvic
es E
747
9,30
9
82,0
13
77
, 555
1,13
7,05
4
9,
473
33
7,85
6
2,12
3,26
0
Trav
el E
899
,926
1,96
0,59
1
99
2,66
1
1,14
6,14
9
55
6,90
7
537,
768
5,
294,
002
O
ccup
ancy
E9
16,0
04
1,
628,
558
871,
086
82
5,69
2
1,80
0
19, 1
90
3,
362,
330
Eq
uipm
ent
Ren
tal/M
aint
enan
ceE1
02,
899,
927
208,
744
15
,455
9,84
0
3,13
3,96
6
Dep
reci
atio
n an
d Am
ortiz
atio
nE1
13,
943,
807
3,94
3,80
7
Insu
ranc
eE1
255
1,31
3
551,
313
Tele
phon
eE1
385
,040
18,0
50
21
9,37
7
67,2
60
55
,935
12,9
45
45
8,60
7
Su
pplie
sE1
445
6,69
8
170,
778
28
,244
21,4
99
3,
965
15
,348
6 96,
532
Mai
l Ser
vice
sE1
52,
055
25
,036
99,1
97
12
,400
2,98
0
86,4
54
22
8,12
2
Li
brar
y M
ater
ials
E16
3,87
9
20,4
05
26
7,68
8
344,
346
50
0
70
5
6 3
7,52
3
Pr
intin
gE1
77,
025
6,
120
11
9,81
3
132,
958
Nat
iona
l and
Int
erim
Mee
tings
E18
215,
000
2,
145,
006
2,36
0,00
6
Educ
atio
n an
d Tr
aini
ngE1
924
2,87
6
228,
441
45
,000
76,7
75
59
3,09
2
St
ate
& G
ener
al T
rain
ing
E20
1,30
2,73
0
1,
200
1,
303,
930
O
ther
Exp
ense
E21
923,
105
4,
956
75
,577
2,00
0
1,00
5,63
8
Tota
l Ope
ratin
g Ex
pens
es$1
5,97
9,94
7$3
2,46
4,19
9$1
0,90
1,35
9$2
3,36
3,82
9$3
,365
,272
$10,
050,
516
$96,
125,
121
Com
pone
nts:
Info
rmat
ion
Syst
ems
Cent
ral O
ffic
eM
embe
r Se
rvic
esFi
nanc
ial R
egul
atio
nM
arke
t R
egul
atio
nIn
sura
nce
Prod
ucts
Tech
nica
l Ser
vice
sFi
nanc
eEd
ucat
ion
& T
rain
ing
SVO
Stat
istic
al a
nd a
nd S
ervi
ces
Fina
ncia
l Sys
tem
sO
ffic
e Se
rvic
esM
eetin
gsCa
pita
l Mar
kets
Bur
eau
Actu
aria
l Ser
vice
sSE
RFF
Hum
an R
esou
rces
Nat
iona
l Mee
tings
Stru
ctur
ed S
ecur
ities
Gro
upCI
PRSB
SLe
gal
Inte
rim M
eetin
gsCo
mm
unic
atio
nsEx
ecut
ive
Off
ice
EXP
ENSE
BU
DG
ET B
Y A
REA
NA
TIO
NA
L A
SSO
CIA
TIO
N O
F IN
SUR
AN
CE
CO
MM
ISSI
ON
ERS
PR
OP
OSE
D 2
015
BU
DG
ET B
EFO
RE
BU
SIN
ESS
AN
D F
ISC
AL
IMP
AC
T ST
ATE
MEN
TS
The
cate
gorie
spr
esen
ted
abov
ear
efo
rex
pens
eco
nsol
idat
ion
and
repo
rtin
gpu
rpos
eson
ly.
They
mer
ely
repr
esen
tth
egr
oupi
ngof
like
depa
rtm
ents
with
inth
eN
AIC
finan
cial
repo
rtin
gst
ruct
ure
and
the
man
ner
inw
hich
thes
eex
pens
esar
eac
tivel
ym
anag
edby
Div
isio
n D
irect
ors.
No
cost
allo
catio
ns o
r di
strib
utio
n of
exp
ense
s ar
e in
clud
ed h
erei
n.
27

28

Revenue Detail


2013
6/30
/14
12/3
1/14
2014
2015
Incr
ease
Des
crip
tion
Actu
alAc
tual
Proj
ecte
dBu
dget
Bu
dget
(Dec
reas
e)Pe
rcen
tage
Mem
ber
Asse
ssm
ents
(1)
$2,3
00,7
73$1
,164
,922
$2,3
44,4
62$2
,344
,460
$2,1
93,7
84($
150,
676)
(6.4
3%)
(1)
BUD
GET
ITE
M:
Mem
ber
Asse
ssm
ents
Inex
chan
gefo
ran
nual
mem
ber
asse
ssm
ents
,th
eN
AIC
deliv
ers
aw
ide
arra
yof
fund
ing,
info
rmat
ion,
prod
ucts
and
serv
ices
,ge
nera
llyat
noch
arge
tost
ate
insu
ranc
ere
gula
tors
,as
abe
nefit
of N
AIC
mem
bers
hip.
R1:
Mem
ber
Asse
ssm
ents
Item
Des
crip
tion:
Asse
ssm
ents
from
all
mem
bers
whi
char
eus
edto
fund
the
activ
ities
ofth
eN
AIC
offic
es.
Mem
bers
are
asse
ssed
base
dup
onth
ere
lativ
epr
emiu
mvo
lum
eof
thei
rre
spec
tive
dom
icile
d co
mpa
nies
to
tota
l pre
miu
m v
olum
e.
Seve
ralF
isca
lIm
pact
sw
ere
revi
ewed
indi
vidu
ally
and
appr
oved
byth
eEx
ecut
ive
(EX)
Com
mitt
eean
dIn
tern
alAd
min
istr
atio
n(E
X1)
Subc
omm
ittee
onO
ctob
er3,
2014
.Fo
rth
e20
15bu
dget
,on
efis
cal
incl
uded
the
rest
ruct
ure
ofm
embe
ras
sess
men
tfe
esre
sulti
ngin
are
duct
ion
of$1
94,0
24in
2015
proj
ecte
dre
venu
e(S
eeFi
scal
Impa
ct7)
.Th
isin
itiat
ive
low
ers
the
mem
ber
asse
ssm
ent
byfiv
e(5
)pe
rcen
tan
din
stitu
tes
aca
pof
$125
,000
.Th
isre
duct
ion
ispa
rtia
llyof
fset
bya
$43,
348
incr
ease
asa
resu
ltof
the
redi
strib
utio
nof
the
tota
las
sess
men
tba
sed
onpr
emiu
m v
olum
e an
d th
e re
appl
icat
ion
of t
he m
inim
um a
sses
smen
t.
The
asse
ssm
ent
stru
ctur
eis
base
don
each
mem
ber’s
shar
eof
tota
lins
uran
cepr
emiu
mvo
lum
ew
ithin
thei
rju
risdi
ctio
n.Pr
emiu
mvo
lum
eis
mea
sure
das
dire
ctw
ritte
npr
emiu
mby
com
pani
esdo
mic
iled
inea
chst
ate
for
the
cale
ndar
year
.Th
ebu
dget
edam
ount
isba
sed
onfo
urm
onth
sof
the
May
2014
-Ap
ril20
15as
sess
men
tan
dei
ght
mon
ths
ofth
eM
ay20
15-
April
2016
asse
ssm
ent.
The
May
2015
-Ap
ril20
16st
ate
asse
ssm
ents
are
illus
trat
edin
Exhi
bit
R1-O
ne.
Exhi
bit
R1-T
wo
illus
trat
esst
ate
asse
ssm
ents
and
data
base
filin
gfe
esas
ape
rcen
tage
ofto
tal
NAI
C re
venu
e.
29

30

Revised$7,339 Minimum Initial
Percent $125,000 Cap $7,725 Minimum $7,725 MinimumState Total Premiums To Total Assessment 2015/16 Amount 2015/16 Amount Difference 2014/15 Amount
Alabama $20,520,164,231 1.1736% $26,302 $26,302 $27,686 ($1,384) $26,634Alaska 3,573,878,850 0.2044% 4,581 7,339 7,725 (386) 7,725 Arizona 26,057,854,281 1.4903% 33,400 33,400 35,157 (1,757) 33,425 Arkansas 11,315,038,960 0.6471% 14,502 14,502 15,266 (764) 16,051 California 130,062,311,143 7.4384% 166,704 125,000 175,478 (50,478) 167,842 Colorado 28,379,558,739 1.6231% 36,376 36,376 38,290 (1,914) 36,905 Connecticut 32,471,313,755 1.8571% 41,620 41,620 43,811 (2,191) 41,160 Delaware 45,421,055,556 2.5977% 58,218 58,218 61,282 (3,064) 52,368 District of Columbia 8,298,958,535 0.4746% 10,636 10,636 11,196 (560) 11,143 Florida 116,162,043,058 6.6434% 148,887 125,000 156,723 (31,723) 151,902 Georgia 45,690,811,625 2.6131% 58,563 58,563 61,645 (3,082) 59,020 Hawaii 10,573,352,232 0.6047% 13,552 13,552 14,265 (713) 13,539 Idaho 6,739,292,040 0.3854% 8,637 8,637 9,092 (455) 8,708 Illinois 67,243,743,742 3.8457% 86,187 86,187 90,723 (4,536) 86,321 Indiana 29,180,204,486 1.6688% 37,400 37,400 39,368 (1,968) 39,882 Iowa 26,658,090,401 1.5246% 34,168 34,168 35,967 (1,799) 35,603 Kansas 18,410,563,996 1.0529% 23,597 23,597 24,839 (1,242) 21,418 Kentucky 21,829,501,825 1.2484% 27,978 27,978 29,451 (1,473) 28,514 Louisiana 25,951,379,649 1.4842% 33,263 33,263 35,014 (1,751) 32,723 Maine 6,498,840,095 0.3717% 8,330 8,330 8,769 (439) 8,897 Maryland 32,249,027,997 1.8444% 41,335 41,335 43,511 (2,176) 41,778 Massachusetts 49,767,511,526 2.8462% 63,787 63,787 67,144 (3,357) 67,405 Michigan 57,680,791,998 3.2988% 73,930 73,930 77,821 (3,891) 88,925 Minnesota 36,857,427,352 2.1079% 47,241 47,241 49,727 (2,486) 47,872 Mississippi 12,077,978,098 0.6908% 15,482 15,482 16,297 (815) 14,894 Missouri 33,342,265,241 1.9069% 42,736 42,736 44,985 (2,249) 42,790 Montana 4,048,587,762 0.2315% 5,188 7,339 7,725 (386) 7,725 Nebraska 11,408,599,857 0.6525% 14,623 14,623 15,393 (770) 14,878 Nevada 11,944,958,540 0.6831% 15,309 15,309 16,115 (806) 15,385 New Hampshire 7,336,547,848 0.4196% 9,404 9,404 9,899 (495) 9,106 New Jersey 63,820,995,868 3.6500% 81,801 81,801 86,107 (4,306) 84,564 New Mexico 10,146,557,170 0.5803% 13,005 13,005 13,690 (685) 13,248 New York 150,285,951,667 8.5950% 192,625 125,000 202,763 (77,763) 225,609 North Carolina 41,767,805,064 2.3887% 53,534 53,534 56,351 (2,817) 55,322 North Dakota 5,552,182,697 0.3175% 7,116 7,339 7,725 (386) 7,725 Ohio 64,618,603,886 3.6956% 82,823 82,823 87,182 (4,359) 85,244 Oklahoma 16,788,168,845 0.9601% 21,517 21,517 22,650 (1,133) 21,830 Oregon 20,166,026,983 1.1533% 25,847 25,847 27,207 (1,360) 26,257 Pennsylvania 95,049,084,515 5.4359% 121,826 121,826 128,238 (6,412) 129,171 Rhode Island 7,336,823,236 0.4196% 9,404 9,404 9,899 (495) 9,856 South Carolina 21,579,260,270 1.2341% 27,658 27,658 29,113 (1,455) 28,058 South Dakota 5,296,111,745 0.3029% 6,788 7,339 7,725 (386) 7,725 Tennessee 34,596,371,883 1.9786% 44,343 44,343 46,677 (2,334) 45,052 Texas 126,944,197,010 7.2601% 162,708 125,000 171,272 (46,272) 159,153 Utah 12,615,545,867 0.7215% 16,170 16,170 17,021 (851) 15,875 Vermont 3,446,109,257 0.1971% 4,417 7,339 7,725 (386) 7,725 Virginia 40,434,921,921 2.3125% 51,826 51,826 54,554 (2,728) 53,572 Washington 34,453,561,526 1.9704% 44,159 44,159 46,483 (2,324) 44,179 West Virginia 8,195,333,780 0.4687% 10,504 10,504 11,057 (553) 10,851 Wisconsin 33,735,590,838 1.9294% 43,240 43,240 45,516 (2,276) 44,686 Wyoming 2,534,270,538 0.1449% 3,247 7,339 7,725 (386) 7,725 American Samoa 4,560,903 0.0003% 7 7,339 7,725 (386) 7,725 Guam 486,878,345 0.0278% 623 7,339 7,725 (386) 7,725 Puerto Rico 10,548,810,953 0.6033% 13,521 13,521 14,232 (711) 14,220 U.S. Virgin Islands 351,023,227 0.0201% 450 7,339 7,725 (386) 7,725 Northern Mariana Islands 23,878,672 0.0014% 31 7,339 7,725 (386) 7,725
Total State Assessments $1,748,530,280,084 100.00% $2,241,126 $2,111,144 $2,402,176 ($291,032) $2,359,085
Four months of the May 2014-April 2015 assessment $786,362 $786,362 $0Eight months of the May 2015-April 2016 assessment 1,407,422 1,601,446 (194,024)
Total calendar year 2015 assessment $2,193,784 $2,387,808 ($194,024)
NAIC MEMBER ASSESSMENTS
Exhibit R1-One
31

32
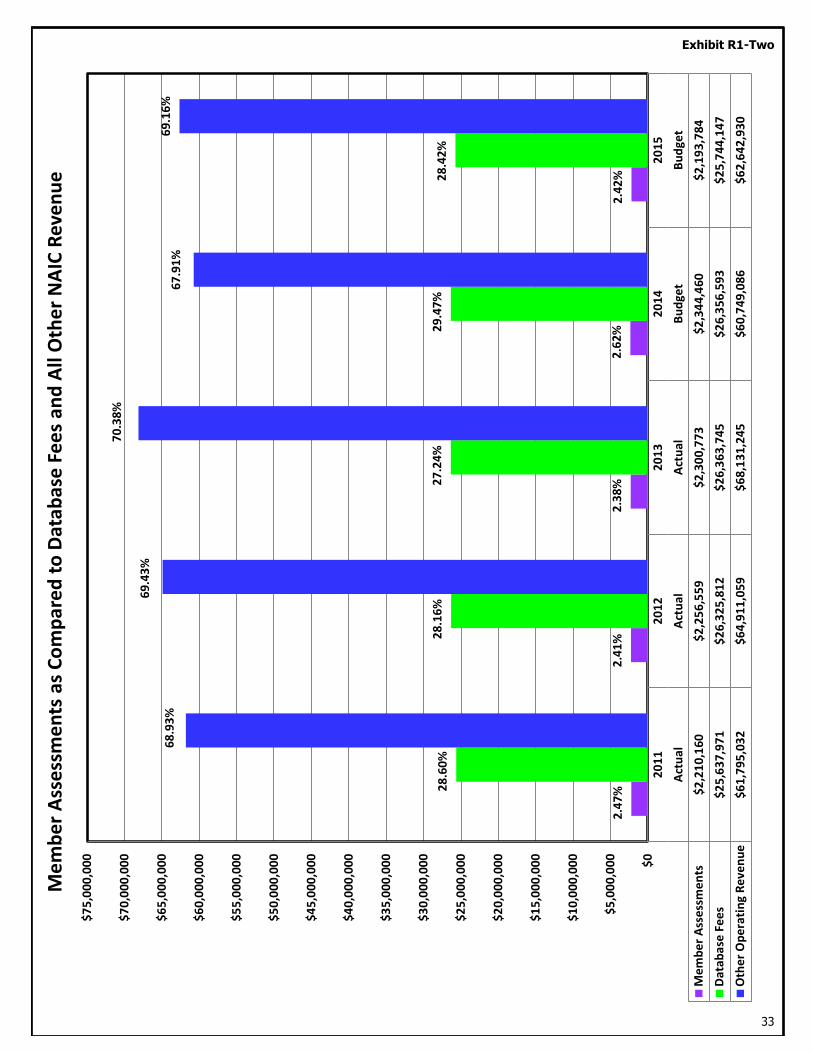
2011
2012
2013
2014
2015
Actu
alAc
tual
Actu
alBu
dget
Budg
etM
embe
r Ass
essm
ents
$2,2
10,1
60$2
,256
,559
$2,3
00,7
73$2
,344
,460
$2,1
93,7
84D
atab
ase
Fees
$25,
637,
971
$26,
325,
812
$26,
363,
745
$26,
356,
593
$25,
744,
147
Oth
er O
pera
ting
Reve
nue
$61,
795,
032
$64,
911,
059
$68,
131,
245
$60,
749,
086
$62,
642,
930
2.47
%
2.41
%
2.38
%
2.62
%
2.42
%
28.6
0%
28.1
6%
27.2
4%
29.4
7%
28.4
2%
68.9
3%
69.4
3%
70.3
8%
67.9
1%
69.1
6%
$0
$5,0
00,0
00
$10,
000,
000
$15,
000,
000
$20,
000,
000
$25,
000,
000
$30,
000,
000
$35,
000,
000
$40,
000,
000
$45,
000,
000
$50,
000,
000
$55,
000,
000
$60,
000,
000
$65,
000,
000
$70,
000,
000
$75,
000,
000
Mem
ber A
sses
smen
ts a
s Com
pare
d to
Dat
abas
e Fe
es a
nd A
ll O
ther
NAI
C Re
venu
e Exhibit R1-Two
33

34
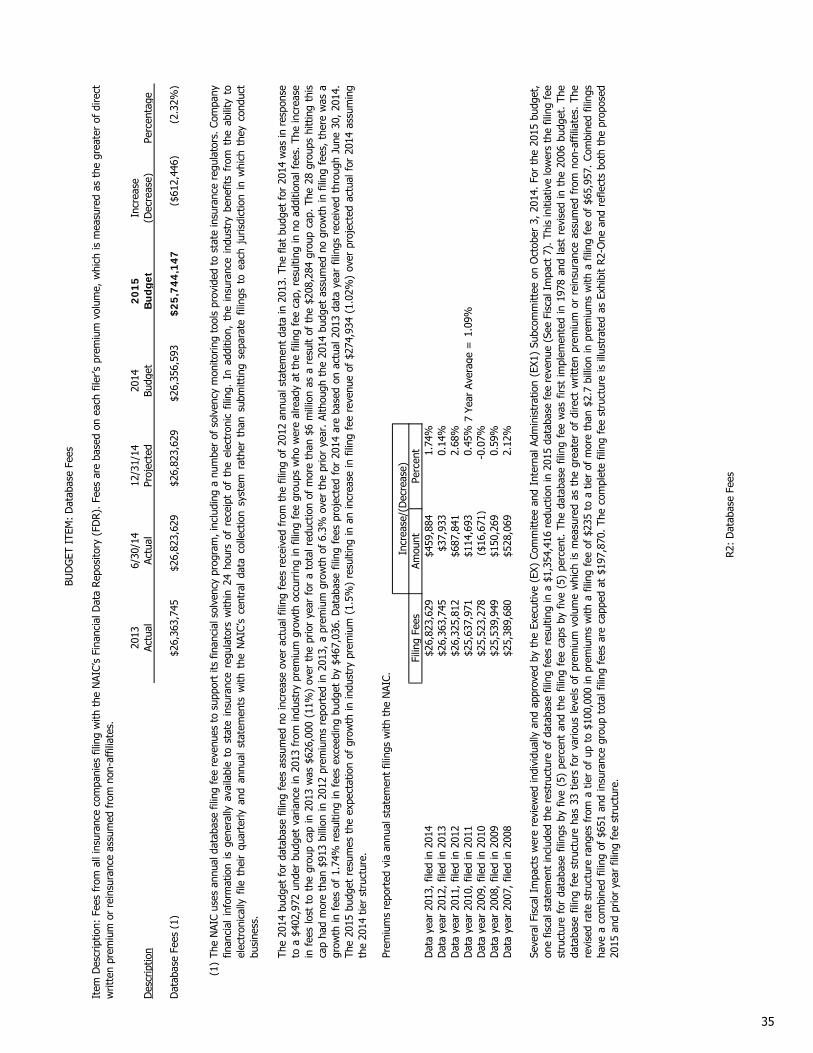
2013
6/30
/14
12/3
1/14
2014
2015
Incr
ease
Des
crip
tion
Actu
alAc
tual
Proj
ecte
dBu
dget
Bu
dget
(Dec
reas
e)Pe
rcen
tage
Dat
abas
e Fe
es (
1)$2
6,36
3,74
5$2
6,82
3,62
9$2
6,82
3,62
9$2
6,35
6,59
3$2
5,74
4,14
7($
612,
446)
(2.3
2%)
(1)
Filin
g Fe
esAm
ount
Perc
ent
Dat
a ye
ar 2
013,
file
d in
201
4$2
6,82
3,62
9$4
59,8
841.
74%
Dat
a ye
ar 2
012,
file
d in
201
3$2
6,36
3,74
5$3
7,93
30.
14%
Dat
a ye
ar 2
011,
file
d in
201
2$2
6,32
5,81
2$6
87,8
412.
68%
Dat
a ye
ar 2
010,
file
d in
201
1$2
5,63
7,97
1$1
14,6
930.
45%
7 Ye
ar A
vera
ge =
1.09
%D
ata
year
200
9, f
iled
in 2
010
$25,
523,
278
($16
,671
)-0
.07%
Dat
a ye
ar 2
008,
file
d in
200
9$2
5,53
9,94
9$1
50,2
690.
59%
Dat
a ye
ar 2
007,
file
d in
200
8$2
5,38
9,68
0$5
28,0
692.
12%
The
2014
budg
etfo
rda
taba
sefil
ing
fees
assu
med
noin
crea
seov
erac
tual
filin
gfe
esre
ceiv
edfr
omth
efil
ing
of20
12an
nual
stat
emen
tda
tain
2013
.Th
efla
tbu
dget
for
2014
was
inre
spon
seto
a$4
02,9
72un
der
budg
etva
rianc
ein
2013
from
indu
stry
prem
ium
grow
thoc
curr
ing
infil
ing
fee
grou
psw
how
ere
alre
ady
atth
efil
ing
fee
cap,
resu
lting
inno
addi
tiona
lfee
s.Th
ein
crea
sein
fees
lost
toth
egr
oup
cap
in20
13w
as$6
26,0
00(1
1%)
over
the
prio
rye
arfo
ra
tota
lred
uctio
nof
mor
eth
an$6
mill
ion
asa
resu
ltof
the
$208
,284
grou
pca
p.Th
e28
grou
pshi
ttin
gth
isca
pha
dm
ore
than
$913
billi
onin
2012
prem
ium
sre
port
edin
2013
,a
prem
ium
grow
thof
6.3%
over
the
prio
rye
ar.
Alth
ough
the
2014
budg
etas
sum
edno
grow
thin
filin
gfe
es,
ther
ew
asa
grow
thin
fees
of1.
74%
resu
lting
infe
esex
ceed
ing
budg
etby
$467
,036
.D
atab
ase
filin
gfe
espr
ojec
ted
for
2014
are
base
don
actu
al20
13da
taye
arfil
ings
rece
ived
thro
ugh
June
30,
2014
.Th
e20
15bu
dget
resu
mes
the
expe
ctat
ion
ofgr
owth
inin
dust
rypr
emiu
m(1
.5%
)re
sulti
ngin
anin
crea
sein
filin
gfe
ere
venu
eof
$274
,934
(1.0
2%)
over
proj
ecte
dac
tual
for
2014
assu
min
gth
e 20
14 t
ier
stru
ctur
e.
Seve
ralF
isca
lIm
pact
sw
ere
revi
ewed
indi
vidu
ally
and
appr
oved
byth
eEx
ecut
ive
(EX)
Com
mitt
eean
dIn
tern
alAd
min
istr
atio
n(E
X1)
Subc
omm
ittee
onO
ctob
er3,
2014
.Fo
rth
e20
15bu
dget
,on
efis
cals
tate
men
tin
clud
edth
ere
stru
ctur
eof
data
base
filin
gfe
esre
sulti
ngin
a$1
,354
,416
redu
ctio
nin
2015
data
base
fee
reve
nue
(See
Fisc
alIm
pact
7).
This
initi
ativ
elo
wer
sth
efil
ing
fee
stru
ctur
efo
rda
taba
sefil
ings
byfiv
e(5
)pe
rcen
tan
dth
efil
ing
fee
caps
byfiv
e(5
)pe
rcen
t.Th
eda
taba
sefil
ing
fee
was
first
impl
emen
ted
in19
78an
dla
stre
vise
din
the
2006
budg
et.
The
data
base
filin
gfe
est
ruct
ure
has
33tie
rsfo
rva
rious
leve
lsof
prem
ium
volu
me
whi
chis
mea
sure
das
the
grea
ter
ofdi
rect
writ
ten
prem
ium
orre
insu
ranc
eas
sum
edfr
omno
n-af
filia
tes.
The
revi
sed
rate
stru
ctur
era
nges
from
atie
rof
upto
$100
,000
inpr
emiu
ms
with
afil
ing
fee
of$2
35to
atie
rof
mor
eth
an$2
.7bi
llion
inpr
emiu
ms
with
afil
ing
fee
of$6
5,95
7.Co
mbi
ned
filin
gsha
vea
com
bine
dfil
ing
of$6
51an
din
sura
nce
grou
pto
talf
iling
fees
are
capp
edat
$197
,870
.Th
eco
mpl
ete
filin
gfe
est
ruct
ure
isill
ustr
ated
asEx
hibi
tR2
-One
and
refle
cts
both
the
prop
osed
2015
and
prio
r ye
ar f
iling
fee
str
uctu
re.
BUD
GET
ITE
M:
Dat
abas
e Fe
es
Item
Des
crip
tion:
Fees
from
alli
nsur
ance
com
pani
esfil
ing
with
the
NAI
C’s
Fina
ncia
lDat
aRe
posi
tory
(FD
R).
Fees
are
base
don
each
filer
’spr
emiu
mvo
lum
e,w
hich
ism
easu
red
asth
egr
eate
rof
dire
ctw
ritte
n pr
emiu
m o
r re
insu
ranc
e as
sum
ed f
rom
non
-aff
iliat
es.
R2:
Dat
abas
e Fe
es
The
NAI
Cus
esan
nual
data
base
filin
gfe
ere
venu
esto
supp
ort
itsfin
anci
also
lven
cypr
ogra
m,i
nclu
ding
anu
mbe
rof
solv
ency
mon
itorin
gto
ols
prov
ided
tost
ate
insu
ranc
ere
gula
tors
.Com
pany
finan
cial
info
rmat
ion
isge
nera
llyav
aila
ble
tost
ate
insu
ranc
ere
gula
tors
with
in24
hour
sof
rece
ipt
ofth
eel
ectr
onic
filin
g.In
addi
tion,
the
insu
ranc
ein
dust
rybe
nefit
sfr
omth
eab
ility
toel
ectr
onic
ally
file
thei
rqu
arte
rlyan
dan
nual
stat
emen
tsw
ithth
eN
AIC’
sce
ntra
lda
taco
llect
ion
syst
emra
ther
than
subm
ittin
gse
para
tefil
ings
toea
chju
risdi
ctio
nin
whi
chth
eyco
nduc
tbu
sine
ss.
Prem
ium
s re
port
ed v
ia a
nnua
l sta
tem
ent
filin
gs w
ith t
he N
AIC.
Incr
ease
/(D
ecre
ase)
35

36

NAIC Database Filing Fee StructureFor 2014 Data Year Filings Submitted in 2015
Premium Base Levels: Difference
$0 to $100,000 $235 $247 ($12)$100,001 to $1,000,000 $460 $484 ($24)
$1,000,001 to $2,500,000 $686 $722 ($36)$2,500,001 to $7,500,000 $1,372 $1,444 ($72)$7,500,001 to $25,000,000 $2,283 $2,403 ($120)
$25,000,001 to $100,000,000 $3,420 $3,600 ($180)$100,000,001 to $200,000,000 $4,783 $5,035 ($252)$200,000,001 to $300,000,000 $5,975 $6,289 ($314)$300,000,001 to $400,000,000 $7,337 $7,723 ($386)$400,000,001 to $500,000,000 $8,709 $9,167 ($458)$500,000,001 to $600,000,000 $10,487 $11,039 ($552)$600,000,001 to $700,000,000 $12,310 $12,958 ($648)$700,000,001 to $800,000,000 $14,133 $14,877 ($744)$800,000,001 to $900,000,000 $16,407 $17,271 ($864)$900,000,001 to $1,000,000,000 $18,690 $19,674 ($984)
$1,000,000,001 to $1,100,000,000 $20,965 $22,068 ($1,103)$1,100,000,001 to $1,200,000,000 $23,248 $24,472 ($1,224)$1,200,000,001 to $1,300,000,000 $25,523 $26,866 ($1,343)$1,300,000,001 to $1,400,000,000 $27,806 $29,269 ($1,463)$1,400,000,001 to $1,500,000,000 $30,080 $31,663 ($1,583)$1,500,000,001 to $1,600,000,000 $32,364 $34,067 ($1,703)$1,600,000,001 to $1,700,000,000 $34,638 $36,461 ($1,823)$1,700,000,001 to $1,800,000,000 $37,372 $39,339 ($1,967)$1,800,000,001 to $1,900,000,000 $40,107 $42,218 ($2,111)$1,900,000,001 to $2,000,000,000 $42,841 $45,096 ($2,255)$2,000,000,001 to $2,100,000,000 $45,576 $47,975 ($2,399)$2,100,000,001 to $2,200,000,000 $48,310 $50,853 ($2,543)$2,200,000,001 to $2,300,000,000 $51,045 $53,832 ($2,787)$2,300,000,001 to $2,400,000,000 $53,780 $56,610 ($2,831)$2,400,000,001 to $2,500,000,000 $56,515 $59,489 ($2,974)$2,500,000,001 to $2,600,000,000 $59,249 $62,367 ($3,118)$2,600,000,001 to $2,700,000,000 $61,984 $65,246 ($3,262)$2,700,000,001 or greater $65,957 $69,428 ($3,471)
Combined Filing Fee $651 $685 ($34)Individual Filing Fee Cap $65,957 $69,428 ($3,471)Group Filing Fee Cap $197,870 $208,284 ($10,414)
2015 Proposed Fee
2015 Fee at Prior Year Level
Exhibit R2-One
37

38
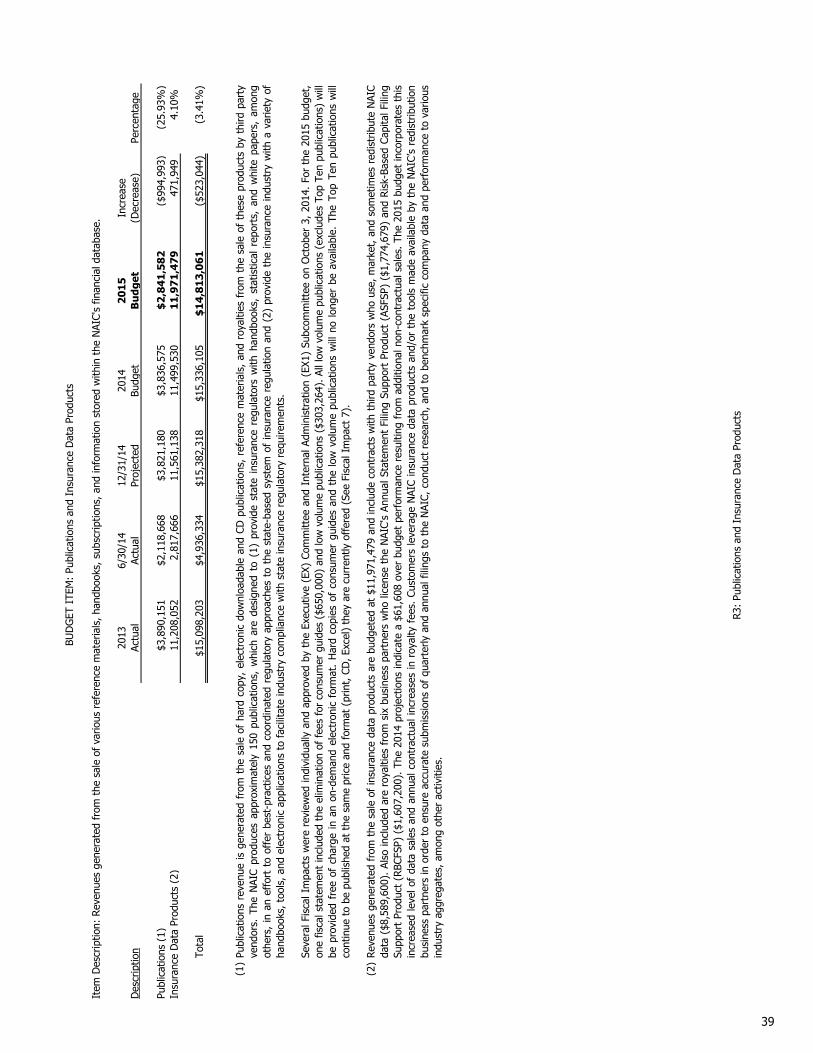
2013
6/30
/14
12/3
1/14
2014
2015
Incr
ease
Des
crip
tion
Actu
alAc
tual
Proj
ecte
dBu
dget
Bu
dget
(Dec
reas
e)Pe
rcen
tage
Publ
icat
ions
(1)
$3,8
90,1
51$2
,118
,668
$3,8
21,1
80$3
,836
,575
$2,8
41,5
82($
994,
993)
(25.
93%
)In
sura
nce
Dat
a Pr
oduc
ts (
2)11
,208
,052
2,81
7,66
611
,561
,138
11,4
99,5
3011
,971
,479
471,
949
4.10
%
Tota
l$1
5,09
8,20
3$4
,936
,334
$15,
382,
318
$15,
336,
105
$14,
813,
061
($52
3,04
4)(3
.41%
)
(1)
(2)
Reve
nues
gene
rate
dfr
omth
esa
leof
insu
ranc
eda
tapr
oduc
tsar
ebu
dget
edat
$11,
971,
479
and
incl
ude
cont
ract
sw
ithth
irdpa
rty
vend
ors
who
use,
mar
ket,
and
som
etim
esre
dist
ribut
eN
AIC
data
($8,
589,
600)
.Al
soin
clud
edar
ero
yalti
esfr
omsi
xbu
sine
sspa
rtne
rsw
holic
ense
the
NAI
C's
Annu
alSt
atem
ent
Filin
gSu
ppor
tPr
oduc
t(A
SFSP
)($
1,77
4,67
9)an
dRi
sk-B
ased
Capi
talF
iling
Supp
ort
Prod
uct
(RBC
FSP)
($1,
607,
200)
.Th
e20
14pr
ojec
tions
indi
cate
a$6
1,60
8ov
erbu
dget
perf
orm
ance
resu
lting
from
addi
tiona
lnon
-con
trac
tual
sale
s.Th
e20
15bu
dget
inco
rpor
ates
this
incr
ease
dle
velo
fda
tasa
les
and
annu
alco
ntra
ctua
linc
reas
esin
roya
ltyfe
es.
Cust
omer
sle
vera
geN
AIC
insu
ranc
eda
tapr
oduc
tsan
d/or
the
tool
sm
ade
avai
labl
eby
the
NAI
C’s
redi
strib
utio
nbu
sine
sspa
rtne
rsin
orde
rto
ensu
reac
cura
tesu
bmis
sion
sof
quar
terly
and
annu
alfil
ings
toth
eN
AIC,
cond
uct
rese
arch
,an
dto
benc
hmar
ksp
ecifi
cco
mpa
nyda
taan
dpe
rfor
man
ceto
vario
usin
dust
ry a
ggre
gate
s, a
mon
g ot
her
activ
ities
.
BUD
GET
ITE
M:
Publ
icat
ions
and
Ins
uran
ce D
ata
Prod
ucts
Item
Des
crip
tion:
Rev
enue
s ge
nera
ted
from
the
sal
e of
var
ious
ref
eren
ce m
ater
ials
, han
dboo
ks, s
ubsc
riptio
ns, a
nd in
form
atio
n st
ored
with
in t
he N
AIC'
s fin
anci
al d
atab
ase.
Seve
ralF
isca
lIm
pact
sw
ere
revi
ewed
indi
vidu
ally
and
appr
oved
byth
eEx
ecut
ive
(EX)
Com
mitt
eean
dIn
tern
alAd
min
istr
atio
n(E
X1)
Subc
omm
ittee
onO
ctob
er3,
2014
.Fo
rth
e20
15bu
dget
,on
efis
cals
tate
men
tin
clud
edth
eel
imin
atio
nof
fees
for
cons
umer
guid
es($
650,
000)
and
low
volu
me
publ
icat
ions
($30
3,26
4).A
lllo
wvo
lum
epu
blic
atio
ns(e
xclu
des
Top
Ten
publ
icat
ions
)w
illbe
prov
ided
free
ofch
arge
inan
on-d
eman
del
ectr
onic
form
at.
Har
dco
pies
ofco
nsum
ergu
ides
and
the
low
volu
me
publ
icat
ions
will
nolo
nger
beav
aila
ble.
The
Top
Ten
publ
icat
ions
will
cont
inue
to
be p
ublis
hed
at t
he s
ame
pric
e an
d fo
rmat
(pr
int,
CD
, Exc
el)
they
are
cur
rent
ly o
ffer
ed (
See
Fisc
al I
mpa
ct 7
).
Publ
icat
ions
reve
nue
isge
nera
ted
from
the
sale
ofha
rdco
py,
elec
tron
icdo
wnl
oada
ble
and
CDpu
blic
atio
ns,
refe
renc
em
ater
ials
,an
dro
yalti
esfr
omth
esa
leof
thes
epr
oduc
tsby
third
part
yve
ndor
s.Th
eN
AIC
prod
uces
appr
oxim
atel
y15
0pu
blic
atio
ns,
whi
char
ede
sign
edto
(1)
prov
ide
stat
ein
sura
nce
regu
lato
rsw
ithha
ndbo
oks,
stat
istic
alre
port
s,an
dw
hite
pape
rs,
amon
got
hers
,in
anef
fort
toof
fer
best
-pra
ctic
esan
dco
ordi
nate
dre
gula
tory
appr
oach
esto
the
stat
e-ba
sed
syst
emof
insu
ranc
ere
gula
tion
and
(2)
prov
ide
the
insu
ranc
ein
dust
ryw
itha
varie
tyof
hand
book
s, t
ools
, and
ele
ctro
nic
appl
icat
ions
to
faci
litat
e in
dust
ry c
ompl
ianc
e w
ith s
tate
insu
ranc
e re
gula
tory
req
uire
men
ts.
R3:
Publ
icat
ions
and
Ins
uran
ce D
ata
Prod
ucts
39

40

2013
6/30
/14
12/3
1/14
2014
2015
Incr
ease
Des
crip
tion
Actu
alAc
tual
Proj
ecte
dBu
dget
Bu
dget
(Dec
reas
e)Pe
rcen
tage
Capi
tal M
arke
ts a
nd I
nves
tmen
t An
alys
is F
ees
(1)
$10,
475,
909
$4,4
30,8
27$9
,876
,377
$10,
291,
400
$10,
187,
500
($10
3,90
0)(1
.01%
)St
ruct
ured
Sec
uriti
es (
2)14
,205
,132
658,
756
9,10
7,23
48,
335,
914
9,37
4,53
01,
038,
616
12.4
6%Au
tom
ated
Val
uatio
n Se
rvic
e (3
)4,
544,
476
2,37
3,52
14,
715,
386
4,51
0,88
74,
879,
607
368,
720
8.17
%
Tota
l$2
9,22
5,51
7$7
,463
,104
$23,
698,
997
$23,
138,
201
$24,
441,
637
$1,3
03,4
365.
63%
(1)
(2)
(3)
Stru
ctur
edSe
curit
ies
reve
nues
are
gene
rate
dfr
omth
esa
leof
mod
eled
com
mer
cial
mor
tgag
e-ba
cked
secu
ritie
s(C
MBS
)an
dre
side
ntia
lm
ortg
age-
back
edse
curit
ies
(RM
BS)
CUSI
Pshe
ldby
insu
ranc
eco
mpa
nies
atth
een
dof
each
year
.Re
venu
eis
base
don
per
CUSI
Psa
les
toin
sure
rsba
sed
onth
eth
eir
year
-end
hold
ings
asw
ell
asth
esa
leof
com
plet
eCM
BS,
RMBS
,or
CMBS
/RM
BSda
tase
tsto
third
part
yfin
anci
alin
stitu
tions
.Th
eCM
BSpr
ice
per
CUSI
Pof
$88.
00an
dRM
BSpr
ice
per
CUSI
Pof
$61.
60ha
vere
mai
ned
unch
ange
dsi
nce
2011
.Th
epr
ojec
ted
budg
etov
erpe
rfor
man
cefo
r20
14is
base
don
the
ratin
gof
addi
tiona
lCU
SIPs
for
insu
rers
plus
the
sale
ofan
addi
tiona
lco
mbi
ned
data
set.
The
2015
budg
etre
cogn
izes
the
incr
ease
inst
ruct
ured
sec
uriti
es a
ctiv
ity in
bot
h ca
tego
ries
whe
n co
mpa
red
to t
he 2
014
budg
et.
BUD
GET
ITE
M:
Valu
atio
n Se
rvic
es
The
Auto
mat
edVa
luat
ion
Serv
ice
(AVS
)is
the
NAI
C’s
elec
tron
icsy
stem
for
the
deliv
ery
ofse
curit
yde
sign
atio
nsas
sign
edby
the
SVO
.The
AVS
syst
emis
utili
zed
byco
mpa
nies
whe
npr
epar
ing
thei
rSc
hedu
leD
filin
gs.
InJa
nuar
y20
13,
anup
grad
eto
the
AVS
appl
icat
ion
was
rele
ased
.Th
isup
grad
ein
clud
eden
hanc
edfu
nctio
nalit
yre
ques
ted
byus
ers,
prim
arily
the
inco
rpor
atio
nof
hist
oric
alda
tacu
rren
tlypr
ovid
edin
the
Valu
atio
nof
Secu
ritie
s(V
OS)
CD-R
OM
.As
are
sult
the
VOS
CD-R
OM
prod
uct
was
disc
ontin
ued
inFe
brua
ry20
13.
The
cons
olid
atio
nof
thes
etw
opr
oduc
tsan
dth
eim
prov
edva
lue
ofth
eAV
Ssy
stem
resu
lted
ina
mod
est
incr
ease
inth
epr
icin
gtie
rsfo
rth
eAV
Spr
oduc
t.To
acco
mm
odat
ecu
stom
ers
who
purc
hase
don
lyth
eVO
SCD
-RO
Mpr
oduc
t,a
new
low
eren
try-
leve
lpric
ing
tier
was
intr
oduc
ed.
Inm
ost
case
s,AV
Ssu
bscr
iber
sw
hoal
sopu
rcha
sed
the
VOS
CD-R
OM
now
pay
less
for
AVS
than
for
both
prod
ucts
in20
12.
The
over
budg
etva
rianc
ein
2014
and
the
incr
ease
dre
venu
ebu
dget
for
2015
are
rela
ted
toa
grea
ter
cust
omer
resp
onse
toth
ene
wAV
Ssy
stem
than
expe
cted
and
the
succ
essf
ulco
nver
sion
offo
rmer
VO
S CD
-RO
M c
usto
mer
s to
the
new
AVS
pro
duct
.
Item
Des
crip
tion:
Fee
s re
late
d to
the
des
igna
tion
of s
ecur
ities
, inc
ludi
ng t
he S
ecur
ities
Val
uatio
n O
ffic
e (S
VO),
Cap
ital M
arke
ts B
urea
u (C
MB)
, and
Str
uctu
red
Secu
ritie
s G
roup
(SS
G).
Seve
ralF
isca
lIm
pact
sw
ere
revi
ewed
indi
vidu
ally
and
appr
oved
byth
eEx
ecut
ive
(EX)
Com
mitt
eean
dIn
tern
alAd
min
istr
atio
n(E
X1)
Subc
omm
ittee
onO
ctob
er3,
2014
.Fo
rth
e20
15bu
dget
,on
efis
cals
tate
men
tin
clud
edth
eel
imin
atio
nof
the
SVO
Asse
ssm
ent
Fee
($79
0,00
0)(S
eeFi
scal
Impa
ct7)
.Si
nce
2004
,Ca
pita
lMar
kets
and
Inve
stm
ent
Anal
ysis
reve
nues
have
been
base
don
abl
end
offe
e-fo
r-se
rvic
esan
da
fee
asse
ssm
ent
mod
el.
This
appr
oach
was
the
resu
ltof
wor
kby
the
Reve
nue
Cons
ider
atio
ns(E
X1)
Wor
king
Gro
up,
with
the
assi
stan
ceof
inte
rest
edpa
rtie
s,on
apr
opos
alto
ultim
atel
yex
empt
all
Nat
iona
llyRe
cogn
ized
Stat
istic
alRa
ting
Org
aniz
atio
n(N
RSRO
)ra
ted
secu
ritie
sfr
omfil
ing
with
the
SVO
,on
a“r
even
uene
utra
l”ba
sis.
The
Wor
king
Gro
up’s
reve
nue
blen
dap
proa
chw
asap
prov
edby
the
NAI
Cm
embe
rshi
pin
Sept
embe
r20
03an
dw
asef
fect
ive
Janu
ary
1,20
04.
The
reve
nue
blen
dap
proa
chin
clud
eda
$1,5
80,0
00as
sess
men
tto
the
indu
stry
allo
cate
d,on
apr
opor
tiona
teba
sis,
toth
ose
insu
rers
that
hold
$1bi
llion
orm
ore
ofno
n-go
vern
men
tan
dpr
efer
red
stoc
kin
vest
men
ts.
The
NAI
Cbi
lled
only
one-
half
($79
0,00
0) o
f th
is a
sses
smen
t si
nce
its in
cept
ion.
The
NAI
C’s
Capi
talM
arke
tsan
dIn
vest
men
tAn
alys
isO
ffic
ein
New
York
prov
ides
stat
ere
gula
tors
with
enha
nced
secu
rity
data
,ca
pita
lmar
kets
anal
ysis
,re
sear
ch,
and
eval
uatio
nsof
insu
rer
inve
stm
ent
port
folio
risks
.O
vera
ll,th
e20
14pr
ojec
tion
isin
-line
with
budg
etfo
r20
14,
with
the
exce
ptio
nof
corp
orat
ead
vanc
edra
ting
serv
ices
,w
hich
isfo
reca
sted
tobe
belo
wbu
dget
by$3
00,0
00,
and
stru
ctur
edse
curit
yad
vanc
edra
ting,
$145
,000
belo
wbu
dget
,as
are
sult
ofvo
lum
ede
clin
es.
The
2015
budg
etfo
rth
eSV
Ow
illin
crea
se$9
26,8
25as
are
sult
ofin
crea
ses
inre
ques
tsfo
rse
rvic
es,
mai
nly
inth
eco
rpor
ate
and
mun
icip
alad
vanc
edra
ting
lines
.Ad
ditio
nally
,as
illus
trat
edin
Exhi
bit
R4-O
ne,
the
SVO
will
impl
emen
tpr
ice
incr
ease
sfo
rfo
urpr
oduc
tlin
es.
Thes
epr
icin
gad
just
men
tsre
pres
ent
aco
ntin
ued
effo
rtto
alig
nfe
esw
ithth
eef
fort
expe
nded
tope
rfor
mra
tings
anal
ysis
and
toad
just
for
the
incr
ease
dco
stof
oper
atio
nsov
erth
epa
stse
vera
l yea
rs. T
hese
incr
ease
s ar
e pa
rtia
lly o
ffse
t by
$46
1,52
5 in
vol
ume
decr
ease
s w
ith t
he m
ajor
ity f
allin
g un
der
the
stru
ctur
ed s
ecur
ity a
nd c
orpo
rate
adv
ance
d ra
ting
area
s.
SVO
prod
ucts
and
serv
ices
reve
nues
incl
ude:
(1)
$8,3
34,6
00fo
rno
n-ra
ted
secu
rity
filin
gs;
(2)
$443
,400
for
the
proc
essi
ngof
subs
idia
ryva
luat
ion
filin
gs;
(3)
$1,0
60,0
00fo
rad
vanc
era
ting
serv
ices
;(4
)$9
1,50
0in
serv
ices
prov
ided
toba
nks
that
wis
hto
bepl
aced
onth
e“A
ppro
ved
Bank
List
”m
aint
aine
dby
the
SVO
;(5
)$1
18,5
00in
serv
ice
fees
for
the
revi
ewof
mon
eym
arke
tfu
nds;
(6)
$45,
000
inse
rvic
efe
esfo
rth
ere
view
ofex
chan
getr
aded
fund
s;(7
)$4
,000
inse
rvic
esfe
esfo
rth
ere
view
ofco
unte
rpar
tyde
rivat
ives
;an
d(8
)$4
0,50
0in
SVO
sove
reig
nfe
es,
repr
esen
ting
anof
fset
toth
eco
stof
the
SVO
’sre
quire
men
tto
cond
uct
aSo
vere
ign
anal
ysis
onth
ein
itial
subm
issi
onof
issu
ing
debt
ina
fore
ign
coun
try.
Inve
stm
ent
Anal
yst
Repo
rtfe
esof
$50,
000,
gene
rate
dth
roug
hth
ew
ork
ofth
eCa
pita
lMar
kets
Bure
auin
the
Capi
talM
arke
tsan
dIn
vest
men
tAn
alys
isO
ffic
e,ar
eal
soin
clud
edin
this
reve
nue
cate
gory
.Non
-rat
edse
curit
yfil
ing
reve
nues
are
illu
stra
ted
in E
xhib
it R4
-One
.
R4:
Valu
atio
n Se
rvic
es
41

42

2015 20152014 2015 Budgeted Budgeted
Product Description Filing Fee Filing Fee Volumes Revenue
CorporatesCorporate Initial Rated $150 $150 11 $1,650Corporate Annual Update Rated $150 $150 26 3,900Corporate Initial Common Stock $150 $150 100 15,000Corporate Annual Update Common Stock $150 $150 235 35,250Structured Credit Tenant Lease Annual Update Rated $175 $175 897 156,975Structured Credit Tenant Lease Annual Update Not Rated $1,350 $1,350 3 4,050Corporate Initial Foreign Stock $150 $150 125 18,750Corporate Annual Update Foreign Stock $150 $150 265 39,750Corporate Initial Issuer Not in VOS $3,500 $4,250 409 1,738,250Corporate Annual Update Not Rated $1,350 $1,350 2,080 2,808,000Annual Common Equity-Like Class $1,350 $1,350 2 2,700Corporate Initial Not Rated $1,350 $1,350 1,001 1,351,350Schedule BA Initial Not Rated $1,250 $1,500 6 9,000Schedule BA Initial Not in VOS $3,500 $4,250 17 72,250Schedule BA Annual Not Rated $1,350 $1,350 88 118,800Schedule BA Initial Surplus Note $250 $250 2 500Schedule BA Annual Surplus Note $125 $125 32 4,000
MunicipalsMunicipal Initial Rated $150 $150 7 1,050Municipal Annual Update Rated $150 $150 5 750Municipal Initial Issuer Not in VOS $3,500 $4,250 70 297,500Municipal Annual Update Not Rated $1,350 $1,350 260 351,000Municipal Initial Not Rated $1,350 $1,350 198 267,300
StructuredStructured Initial Rated $250 $250 99 24,750Structured CMBS Initial $250 $250 3 750Structured Annual Update Rated $175 $175 346 60,550Structured Replication Annual Update $175 $175 548 95,900Structured RMBS Annual Update Not Rated $500 $500 7 3,500Structured CMBS Annual Update $175 $175 45 7,875Structured Credit Tenant Lease Additional Notes $150 $150 17 2,550Structured Equity Linked Initial Rated $250 $250 3 750Structured Equity Linked Annual Update Rated $150 $150 5 750Structured RMBS Annual Update Guaranteed $150 $150 21 3,150Structured RMBS Initial Guaranteed $250 $250 7 1,750Military Housing Bonds Annual $1,350 $1,350 20 27,000Structured REIT Initial Not Rated $1,250 $1,250 2 2,500Structured Initial Filing Not Rated Not in VOS $1,400 $1,400 30 42,000Structured Credit Tenant Lease Bond Initial $1,350 $1,350 26 35,100Structured Credit Tenant Lease Initial $2,300 $2,300 80 184,000Structured RMBS Initial Non Guaranteed $1,250 $1,250 2 2,500Structured Annual Update Not Rated $1,350 $1,350 13 17,550Structured Replication Initial $1,250 $1,250 400 500,000Structured Equity Linked Initial Not Rated $1,350 $1,350 7 9,450Structured Equity Linked Annual Update Not Rated $1,250 $1,250 3 3,750Structured REIT Annual Update Not Rated $1,250 $1,250 1 1,250
CanadianCanadian Annual Update Not Rated $1,350 $1,350 2 2,700
GovernmentsGovernment Annual Update Not Rated $1,350 $1,350 5 6,750
7,531 $8,334,600
Securities Valuation OfficeNon-Rated Securities Revenues
Exhibit R4-One
43

44

2013
6/30
/14
12/3
1/14
2014
2015
Incr
ease
Des
crip
tion
Actu
alAc
tual
Proj
ecte
dBu
dget
Bu
dget
(Dec
reas
e)Pe
rcen
tage
SERF
F Fe
es (
1)$5
,003
,768
$2,5
22,5
15$4
,782
,076
$4,5
36,5
05$4
,765
,473
$228
,968
5.05
%H
ealth
Ins
uran
ce E
xcha
nge
Plan
Man
agem
ent
(2)
931,
319
405,
297
675,
100
296,
165
(296
,165
)(1
00.0
0%)
OPT
ins
Fees
(3)
194,
754
145,
191
243,
214
252,
107
344,
578
92,4
7136
.68%
SBS
Fees
(4)
5,92
0,98
32,
965,
661
5,71
8,66
55,
459,
149
6,13
0,94
767
1,79
812
.31%
IID
Fee
s (5
)68
4,97
566
2,00
067
1,50
064
9,00
066
2,50
013
,500
2.08
%
Tota
l$1
2,73
5,79
9$6
,700
,664
$12,
090,
555
$11,
192,
926
$11,
903,
498
$710
,572
6.35
%
(1)
(2)
(3)
(4)
(5)
Also
incl
uded
inth
eSE
RFF
reve
nue
line
isa
$25,
000
annu
allic
ense
fee
from
the
Inte
rsta
teIn
sura
nce
Prod
uct
Regu
latio
nCo
mm
issi
on(I
IPRC
).U
nder
this
serv
ices
agre
emen
t,th
eII
PRC
isal
sogr
ante
d25
0SE
RFF
deve
lopm
ent
hour
sea
chye
arto
mak
em
odifi
catio
nsto
SERF
Fin
orde
rto
acco
mm
odat
eII
PRC
filin
gsan
dth
eov
eral
lexp
ansi
on/e
nhan
cem
ents
ofII
PRC
prod
uct
filin
gop
erat
ions
.
R5:
Tran
sact
ion
Filin
g Fe
es
Item
Des
crip
tion:
Tran
sact
ion
fees
toas
sist
stat
ede
part
men
tsof
insu
ranc
ew
ithre
gula
tory
filin
gs,
incl
udin
gSy
stem
for
Elec
tron
icRa
tean
dFo
rmFi
ling
(SER
FF),
Onl
ine
Prem
ium
Tax
for
Insu
ranc
e(O
PTin
s), S
tate
Bas
ed S
yste
ms
(SBS
), a
nd t
he I
nter
natio
nal I
nsur
ers
Dep
artm
ent
(IID
).BUD
GET
ITE
M:
Tran
sact
ion
Filin
g Fe
es
SBS
prov
ides
aco
mpr
ehen
sive
web
-bas
edap
plic
atio
nfo
rus
eby
stat
ere
gula
tors
insu
ppor
tof
alls
tate
-bas
edin
sura
nce
regu
lato
ryfu
nctio
ns.
SBS
enab
les
stat
ein
sura
nce
regu
lato
rsto
mor
eef
ficie
ntly
and
effe
ctiv
ely
proc
ess
licen
seap
plic
atio
ns,
licen
sere
new
als,
cons
umer
inqu
iries
,co
nsum
erco
mpl
aint
s,en
forc
emen
tac
tions
,am
ong
othe
rre
gula
tory
appl
icat
ions
;an
dre
mai
nco
mpl
iant
with
natio
nal
insu
ranc
ere
gula
tion
unifo
rmity
initi
ativ
es.
SBS
islic
ense
dby
28ju
risdi
ctio
nsth
roug
hw
hich
both
regu
late
den
titie
san
dst
ate
insu
ranc
ere
gula
tors
expe
rienc
esi
gnifi
cant
cost
savi
ngs
and
effic
ienc
yby
auto
mat
ion
ofst
ate
insu
ranc
ere
gula
tory
proc
esse
san
dtr
ansa
ctio
ns.
The
valu
eof
SBS
serv
ices
toth
ein
dust
ryis
sign
ifica
ntin
term
sof
cost
savi
ngs
toin
sure
rs,
prod
ucer
s,an
dpr
ovid
ers
man
agin
gth
eco
stof
com
plia
nce,
and
far
exce
eds
the
insi
gnifi
cant
proc
essi
ngfe
esch
arge
dby
the
NAI
Cin
faci
litat
ing
elec
tron
ictr
ansa
ctio
ns.
Furt
her,
SBS
gene
rate
svo
lunt
ary
tran
sact
ion
fees
from
user
sw
hole
vera
geth
eSB
Ssy
stem
toco
mpl
ete
regu
lato
rytr
ansa
ctio
ns,
whi
chfu
rthe
rill
ustr
ates
the
bene
fitof
valu
e-ad
ded
serv
ices
tobo
thst
ate
insu
ranc
e re
gula
tors
and
the
insu
ranc
e in
dust
ry.
The
NAI
C's
onlin
epr
emiu
mta
xsu
bmis
sion
and
paym
ent
syst
em(O
PTin
s)au
tom
ates
and
sim
plifi
espr
emiu
mta
xre
turn
subm
issi
ons
byfil
ing
com
pani
esan
dth
ere
ceip
tof
filin
gsan
dco
llect
ion
ofpr
emiu
mta
xes
byst
ates
,in
exch
ange
for
atr
ansa
ctio
nfe
eon
asl
idin
gsc
ale
of$1
to$1
0pe
rtr
ansa
ctio
n.O
PTin
sha
s22
part
icip
atin
gju
risdi
ctio
ns,
repr
esen
ting
anot
her
NAI
Cin
itiat
ive
tom
oder
nize
and
impr
ove
the
effic
ienc
yof
the
stat
e-ba
sed
insu
ranc
ere
gula
tory
syst
em.
Com
pani
esex
perie
nce
cost
savi
ngs
and
effic
ienc
yth
roug
hth
eel
ectr
onic
subm
issi
onof
prem
ium
tax
ret
urns
and
ele
ctro
nic
paym
ent
of q
uart
erly
pre
miu
m t
axes
. The
201
5 bu
dget
sho
ws
cont
inue
d gr
owth
in t
his
area
and
the
add
ition
of
thre
e ne
w s
tate
s.
The
Hea
lthIn
sura
nce
Exch
ange
Plan
Man
agem
ent
Proj
ect
for
2013
incl
uded
paym
ents
ofju
stov
er$6
2,00
0fr
om15
juris
dict
ions
.Th
ispr
ojec
tca
rrie
dov
erin
toth
eea
rlypa
rtof
2014
with
addi
tiona
l rev
enue
rec
ogni
tion.
Rev
enue
in 2
014
exce
eded
bud
get
due
to p
artic
ipat
ion
by a
dditi
onal
sta
tes.
Thi
s pr
ojec
t is
exp
ecte
d to
be
com
plet
e by
the
end
of
2014
.
SERF
Fis
licen
sed
and
used
by52
juris
dict
ions
and
over
3,90
0in
sura
nce
com
pani
es,
third
-par
tyfil
ers,
ratin
gor
gani
zatio
ns,
and
othe
rco
mpa
nies
.SE
RFF
repr
esen
tsa
key
NAI
Cpr
oduc
tin
the
mod
erni
zatio
nan
def
ficie
ncy
ofth
est
ate-
base
din
sura
nce
regu
lato
rysy
stem
.Co
mpa
nies
expe
rienc
esi
gnifi
cant
cost
savi
ngs
and
effic
ienc
yth
roug
hth
eel
ectr
onic
subm
issi
onof
prod
uct
filin
gsto
mul
tiple
juris
dict
ions
thro
ugh
SERF
F,sa
ving
pers
onne
lan
dm
ailin
gco
sts
alon
gw
ithon
eel
ectr
onic
subm
issi
onan
dre
duci
ngre
gula
tory
revi
ewpe
riods
toan
aver
age
of25
days
for
Prop
erty
/Cas
ualty
fili
ngs
and
40 d
ays
for
Life
, Acc
iden
t, a
nd H
ealth
fili
ngs.
Just
over
50%
ofth
ere
venu
ein
this
cate
gory
isde
rived
thro
ugh
the
serv
ices
agre
emen
tbe
twee
nN
AIC
and
NIP
R,w
here
bySB
Sre
ceiv
es38
%of
NIP
Rre
venu
eth
atis
proc
esse
dth
roug
hth
eSB
Ssy
stem
.Pr
ojec
ted
perf
orm
ance
agai
nst
the
2014
budg
etis
the
resu
ltof
grow
thin
NIP
Rre
venu
es.
This
grow
th,
alon
gw
ithth
ead
ditio
nof
CEtr
ansa
ctio
nsas
are
sult
ofth
etw
o-ye
arcy
cle
for
seve
ral k
ey s
tate
s, a
ccou
nt f
or t
he in
crea
se in
the
201
5 bu
dget
.
Inte
rnat
iona
lIns
urer
sD
epar
tmen
t(I
ID)
reve
nues
are
gene
rate
dfr
ompr
oces
sing
initi
alap
plic
atio
nsan
dan
nual
upda
tefin
anci
alfil
ings
from
com
pani
eslis
ted
inth
eQ
uart
erly
List
ing
ofAl
ien
Insu
rers
.Co
mpa
nies
bene
fitfr
omth
islis
ting
inth
eir
abili
tyto
cond
uct
busi
ness
inth
ose
juris
dict
ions
who
rely
onth
eII
Dan
dQ
uart
erly
List
ing
ofAl
ien
Insu
rers
.Th
ebu
dget
isba
sed
on13
7fil
ings
from
com
pani
esan
dLl
oyd’
sSy
ndic
ates
,fiv
ene
wap
plic
atio
ns,
and
two
late
fees
.Th
epr
ojec
ted
varia
nce
in20
14re
sults
from
anin
crea
sein
the
num
ber
ofap
plic
atio
nsre
ceiv
edth
roug
h m
id-2
014.
The
201
5 bu
dget
for
fili
ngs,
app
licat
ions
, and
late
fee
s re
mai
n re
lativ
ely
cons
iste
nt w
ith t
hose
exp
ecte
d in
201
4.
45

46

Item
Des
crip
tion:
Fee
s re
ceiv
ed f
rom
att
ende
es a
t N
AIC
Nat
iona
l Mee
tings
.
2013
6/30
/14
12/3
1/14
2014
2015
Incr
ease
Des
crip
tion
Actu
alAc
tual
Proj
ecte
dBu
dget
Bu
dget
(Dec
reas
e)Pe
rcen
tage
Nat
iona
l Mee
ting
Regi
stra
tion
Fees
(1)
$1,8
93,1
00$6
31,8
00$1
,914
,050
$1,9
00,6
25$1
,939
,800
$39,
175
2.06
%
(1)
R6:
Nat
iona
l Mee
ting
Regi
stra
tion
Fees
Nat
iona
lm
eetin
gre
gist
ratio
nfe
esar
epr
ojec
ted
base
don
Exhi
bit
R6-O
ne,
and
are
char
ged
ona
mul
ti-tie
rba
sis
such
that
early
regi
stra
tions
rece
ive
adi
scou
ntan
dce
rtai
nin
cent
ives
are
offe
red
to f
irst-
time
and
loca
l att
ende
es. T
he in
crea
se in
201
5 is
the
res
ult
of in
crea
sed
regi
stra
tions
for
the
thr
ee N
AIC
Nat
iona
l Mee
tings
.
BUD
GET
ITE
M:
Nat
iona
l Mee
ting
Regi
stra
tion
Fees
47

48

Fee
Regi
stra
nts
Tota
lRe
gist
rant
sTo
tal
Regi
stra
nts
Tota
lRe
gist
rant
sTo
tal
Adva
nce
Regi
stra
tion
$650
854
$555
,100
898
$583
,700
921
$598
,650
2,67
3$1
,737
,450
Regi
stra
tion
afte
r 30
Day
s Pr
ior
$750
8866
,000
9067
,500
9369
,750
271
203,
250
Firs
t Ti
me,
Loc
al R
egis
tran
ts$3
7511
4,12
5
124,
500
11
4,12
5
3412
,750
Sub
tota
l95
362
5,22
5
1,
000
655,
700
1,02
567
2,52
5
2,
978
1,95
3,45
0
Canc
ella
tions
$325
(12)
(3,9
00)
(1
5)(4
,875
)
(15)
(4,8
75)
(4
2)(1
3,65
0)
Tot
al P
roje
cted
Pai
d At
tend
ance
and
Rev
enue
s94
1$6
21,3
2598
5$6
50,8
251,
010
$667
,650
2,93
6$1
,939
,800
Tot
al P
roje
cted
Reg
istr
atio
ns (
Paid
and
Unp
aid)
1,87
52,
025
2,07
55,
975
2014
att
enda
nce
proj
ectio
ns w
ere
dete
rmin
ed b
y ta
king
into
con
side
ratio
n lo
catio
n an
d pa
st a
tten
danc
e.
Prio
r Ye
ar P
aid
Atte
ndan
ce S
tatis
tics:
2014
957
O
rland
o92
6
Loui
svill
eT B
DW
ashi
ngto
n, D
.C.
2013
936
H
oust
on94
4
Indi
anap
oils
1,02
7W
ashi
ngto
n, D
.C.
N/A
2012
989
N
ew O
rlean
s91
8
Atla
nta
1,00
7
Was
hing
ton,
D.C
.N
/A20
1199
8
Aust
in(c
xl'd
)Ph
ilade
lphi
a1,
051
W
ashi
ngto
n, D
.C.
N/A
2010
796
D
enve
r87
1
Seat
tle91
4
Orla
ndo
N/A
2009
761
Sa
n D
iego
787
M
inne
apol
is88
3
Was
hing
ton,
D.C
.85
4
San
Fran
cisc
o20
0888
9
Orla
ndo
884
Sa
n Fr
anci
sco
914
W
ashi
ngto
n, D
.C.
798
D
alla
s20
071,
064
N
ew Y
ork
City
925
Sa
n Fr
anci
sco
898
W
ashi
ngto
n, D
.C.
818
H
oust
on4,
508
3,
467
4,
660
2,
470
Aver
age
atte
ndan
ce 2
011-
2013
974
93
1
1,02
8
N/A
Spri
ngSu
mm
erFa
llW
inte
r
Nat
iona
l Mee
ting
Reg
istr
atio
ns
Tota
lP
hoen
ix, A
ZC
hica
go, I
LW
ashi
ngto
n, D
.C.
Exhibit R6-One
49

50

Item
Des
crip
tion:
Rev
enue
fro
m N
AIC
educ
atio
n an
d tr
aini
ng p
rogr
ams.
2013
6/30
/14
12/3
1/14
2014
2015
Incr
ease
Des
crip
tion
Actu
alAc
tual
Proj
ecte
dBu
dget
Bu
dget
(Dec
reas
e)Pe
rcen
tage
Educ
atio
n Pr
ogra
ms-
Clas
sroo
m (
1)$2
27,6
35$1
85,4
02$2
53,0
10$3
05,6
50$2
13,2
20($
92,4
30)
(30.
24%
)Ed
ucat
ion
Prog
ram
s-O
nlin
e (2
)40
8,91
893
,116
269,
197
402,
250
237,
678
(164
,572
)(4
0.91
%)
Educ
atio
n Pr
ogra
ms-
Web
inar
(3)
249,
145
71,9
8123
4,41
825
1,27
632
7,04
575
,769
30.1
5%CI
PR S
ympo
sium
(4)
8,21
012
510
,125
10,0
0018
,315
8,31
583
.15%
Fina
ncia
l Sum
mit
(5)
134,
650
118,
783
118,
783
143,
250
104,
500
(38,
750)
(27.
05%
)E-
Reg
Conf
eren
ce (
6)67
,531
67,4
4567
,445
68,0
7057
,348
(10,
722)
(15.
75%
)
Tota
l$1
,096
,089
$536
,852
$952
,978
$1,1
80,4
96$9
58,1
06($
222,
390)
(18.
84%
)
(1)
(2)
(3)
(4) (5)
(6)
BUD
GET
ITE
M:
Educ
atio
n an
d Tr
aini
ng
The
purp
ose
ofth
eEd
ucat
ion
&Tr
aini
ngfu
nctio
nw
ithin
the
NAI
Cis
tom
anag
eth
eN
AIC’
sre
gula
tory
curr
icul
um.
The
core
focu
sis
onid
entif
ying
and
seiz
ing
oppo
rtun
ities
tode
velo
pju
st-in
-tim
e,on
-dem
and,
and/
orun
man
ned
trai
ning
and
deve
lopm
ent
ofpr
oduc
ts,
whi
leas
surin
gth
ein
tegr
ityan
dco
mpr
ehen
sive
ness
ofth
ecu
rric
ulum
asa
who
le.
Inth
eex
amin
atio
nof
educ
atio
nop
port
uniti
es,t
hego
alis
toac
hiev
ea
bala
nce
betw
een
mee
ting
the
regu
lato
rytr
aini
ngne
eds
ofD
epar
tmen
tof
Insu
ranc
eem
ploy
ees
and
assi
stin
gin
dust
rycl
ient
sth
roug
ha
broa
der
rang
eof
com
plia
nce
trai
ning
top
ics.
The
NAI
C ed
ucat
iona
l cur
ricul
um is
off
ered
to
Dep
artm
ent
of I
nsur
ance
em
ploy
ees
and
Cons
umer
Adv
ocat
es a
t no
cha
rge.
The
num
ber
ofw
ebin
artr
aini
ngse
ssio
nsw
illin
crea
se71
%,
from
7in
2014
to12
in20
15.
Whi
lere
gist
ratio
nfe
esw
illbe
wai
ved
for
regu
lato
rsan
dco
nsum
erad
voca
tes,
anin
crea
sein
regi
stra
tions
for
web
inar
cou
rses
is e
xpec
ted
from
out
side
par
ties.
The
num
ber
ofon
line
lear
ning
cour
ses
will
decr
ease
42%
,fro
m24
in20
14to
14in
2015
.Add
ition
ally
,re
venu
ew
illbe
sign
ifica
ntly
redu
ced
for
lear
ning
oppo
rtun
ities
offe
red
tore
gula
tors
and
cons
umer
adv
ocat
es a
t no
cha
nge.
The
2014
NAI
CFi
nanc
ial
Sum
mit
cont
inue
sto
besu
cces
sful
with
atte
ndee
sex
ceed
ing
thos
efo
rth
e20
13pr
ogra
m.
How
ever
,as
are
sult
ofno
char
geat
tend
ance
offe
red
toIn
sura
nce
Dep
artm
ent
empl
oyee
s th
e 20
14 b
udge
t w
as n
ot a
chie
ved.
The
201
5 bu
dget
has
bee
n re
duce
d to
ref
lect
thi
s po
licy.
The
regi
stra
tion
fee
for
the
2015
NAI
CE-
Reg
Conf
eren
cew
illin
crea
se$2
5to
$500
.Th
isin
crea
seis
nece
ssar
yin
orde
rto
cove
rth
eco
nsis
tent
lyin
crea
sing
cost
offo
odan
dbe
vera
ge,
hote
lse
rvic
es,
and
audi
o/vi
sual
equi
pmen
t.H
owev
er,
regi
stra
tion
fees
for
non-
fund
edre
gula
tors
have
been
rem
oved
asa
resu
ltof
NAI
C's
deci
sion
toof
fer
educ
atio
nan
dtr
aini
ngev
ents
tore
gula
tors
at
no c
harg
e.
Educ
atio
nan
dtr
aini
ngex
pens
esha
vebe
enco
nden
sed
for
ease
ofpr
esen
tatio
nan
dun
ders
tand
ing.
Giv
enth
eco
ntin
ued
mov
emen
tto
war
del
ectr
onic
deliv
ery
oftr
aini
ngm
ater
ials
and
the
resu
lting
redu
ctio
nin
cost
s,it
isno
long
erpr
actic
alto
view
the
cost
ofea
chco
urse
sepa
rate
lyfo
rth
epu
rpos
esof
the
budg
etdo
cum
ent.
Ther
efor
e,ed
ucat
ion
and
trai
ning
offe
rings
have
been
red
uced
to
thre
e gr
oups
, rep
rese
ntin
g th
e de
liver
y m
etho
d of
the
tra
inin
g m
ater
ial -
cla
ssro
om, o
nlin
e, a
nd w
ebin
ar.
The
2015
budg
etin
clud
esfiv
ecl
assr
oom
offe
rings
,eq
ualt
oth
e20
14bu
dget
and
proj
ectio
n.Re
venu
esfo
r20
14w
illfa
llbe
low
budg
etfo
rth
isca
tego
ryas
are
sult
ofth
ede
cisi
onto
wai
vetu
ition
for
Dep
artm
ent
ofIn
sura
nce
empl
oyee
s.W
aive
dtu
ition
for
regu
lato
rs($
995
in20
14)
and
are
duct
ion
inth
ere
gist
ratio
nfe
efo
rou
tsid
epa
rtie
s($
1,19
5to
$400
)fo
rth
eIn
tern
atio
nal
Insu
ranc
e Fo
rum
acc
ount
s fo
r th
e re
duct
ion
in b
udge
t fo
r 20
15.
Atte
ndan
ce f
or t
he C
IPR
Sym
posi
um is
exp
ecte
d in
incr
ease
in 2
015.
R7:
Educ
atio
n an
d Tr
aini
ng
51

52
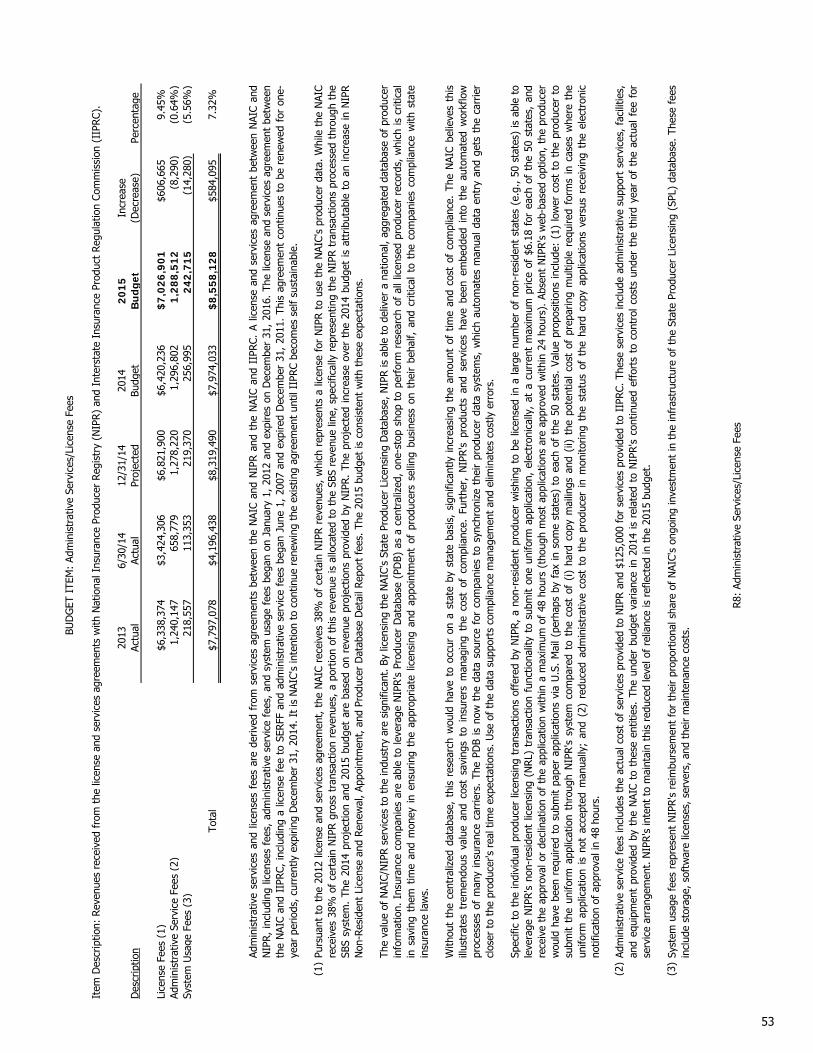
2013
6/30
/14
12/3
1/14
2014
2015
Incr
ease
Des
crip
tion
Actu
alAc
tual
Proj
ecte
dBu
dget
Bu
dget
(Dec
reas
e)Pe
rcen
tage
Lice
nse
Fees
(1)
$6,3
38,3
74$3
,424
,306
$6,8
21,9
00$6
,420
,236
$7,0
26,9
01$6
06,6
659.
45%
Adm
inis
trat
ive
Serv
ice
Fees
(2)
1,24
0,14
765
8,77
91,
278,
220
1,29
6,80
21,
288,
512
(8,2
90)
(0.6
4%)
Syst
em U
sage
Fee
s (3
)21
8,55
711
3,35
321
9,37
025
6,99
524
2,71
5(1
4,28
0)(5
.56%
)
Tota
l$7
,797
,078
$4,1
96,4
38$8
,319
,490
$7,9
74,0
33$8
,558
,128
$584
,095
7.32
%
(1)
(2)
(3)
Syst
emus
age
fees
repr
esen
tN
IPR'
sre
imbu
rsem
ent
for
thei
rpr
opor
tiona
lsha
reof
NAI
C's
ongo
ing
inve
stm
ent
inth
ein
fras
truc
ture
ofth
eSt
ate
Prod
ucer
Lice
nsin
g(S
PL)
data
base
.Th
ese
fees
incl
ude
stor
age,
sof
twar
e lic
ense
s, s
erve
rs, a
nd t
heir
mai
nten
ance
cos
ts.
R8:
Adm
inis
trat
ive
Serv
ices
/Lic
ense
Fee
s
Spec
ific
toth
ein
divi
dual
prod
ucer
licen
sing
tran
sact
ions
offe
red
byN
IPR,
ano
n-re
side
ntpr
oduc
erw
ishi
ngto
belic
ense
din
ala
rge
num
ber
ofno
n-re
side
ntst
ates
(e.g
.,50
stat
es)
isab
leto
leve
rage
NIP
R's
non-
resi
dent
licen
sing
(NRL
)tr
ansa
ctio
nfu
nctio
nalit
yto
subm
iton
eun
iform
appl
icat
ion,
elec
tron
ical
ly,
ata
curr
ent
max
imum
pric
eof
$6.1
8fo
rea
chof
the
50st
ates
,an
dre
ceiv
eth
eap
prov
alor
decl
inat
ion
ofth
eap
plic
atio
nw
ithin
am
axim
umof
48ho
urs
(tho
ugh
mos
tap
plic
atio
nsar
eap
prov
edw
ithin
24ho
urs)
.Ab
sent
NIP
R's
web
-bas
edop
tion,
the
prod
ucer
wou
ldha
vebe
enre
quire
dto
subm
itpa
per
appl
icat
ions
via
U.S
.M
ail(
perh
aps
byfa
xin
som
est
ates
)to
each
ofth
e50
stat
es.
Valu
epr
opos
ition
sin
clud
e:(1
)lo
wer
cost
toth
epr
oduc
erto
subm
itth
eun
iform
appl
icat
ion
thro
ugh
NIP
R's
syst
emco
mpa
red
toth
eco
stof
(i)ha
rdco
pym
ailin
gsan
d(ii
)th
epo
tent
ial
cost
ofpr
epar
ing
mul
tiple
requ
ired
form
sin
case
sw
here
the
unifo
rmap
plic
atio
nis
not
acce
pted
man
ually
;an
d(2
)re
duce
dad
min
istr
ativ
eco
stto
the
prod
ucer
inm
onito
ring
the
stat
usof
the
hard
copy
appl
icat
ions
vers
usre
ceiv
ing
the
elec
tron
icno
tific
atio
n of
app
rova
l in
48 h
ours
.
The
valu
eof
NAI
C/N
IPR
serv
ices
toth
ein
dust
ryar
esi
gnifi
cant
.By
licen
sing
the
NAI
C's
Stat
ePr
oduc
erLi
cens
ing
Dat
abas
e,N
IPR
isab
leto
deliv
era
natio
nal,
aggr
egat
edda
taba
seof
prod
ucer
info
rmat
ion.
Insu
ranc
eco
mpa
nies
are
able
tole
vera
geN
IPR'
sPr
oduc
erD
atab
ase
(PD
B)as
ace
ntra
lized
,on
e-st
opsh
opto
perf
orm
rese
arch
ofal
llic
ense
dpr
oduc
erre
cord
s,w
hich
iscr
itica
lin
savi
ngth
emtim
ean
dm
oney
inen
surin
gth
eap
prop
riate
licen
sing
and
appo
intm
ent
ofpr
oduc
ers
selli
ngbu
sine
sson
thei
rbe
half,
and
criti
cal
toth
eco
mpa
nies
com
plia
nce
with
stat
ein
sura
nce
law
s.
With
out
the
cent
raliz
edda
taba
se,
this
rese
arch
wou
ldha
veto
occu
ron
ast
ate
byst
ate
basi
s,si
gnifi
cant
lyin
crea
sing
the
amou
ntof
time
and
cost
ofco
mpl
ianc
e.Th
eN
AIC
belie
ves
this
illus
trat
estr
emen
dous
valu
ean
dco
stsa
ving
sto
insu
rers
man
agin
gth
eco
stof
com
plia
nce.
Furt
her,
NIP
R's
prod
ucts
and
serv
ices
have
been
embe
dded
into
the
auto
mat
edw
orkf
low
proc
esse
sof
man
yin
sura
nce
carr
iers
.Th
ePD
Bis
now
the
data
sour
cefo
rco
mpa
nies
tosy
nchr
oniz
eth
eir
prod
ucer
data
syst
ems,
whi
chau
tom
ates
man
uald
ata
entr
yan
dge
tsth
eca
rrie
rcl
oser
to
the
prod
ucer
's r
eal t
ime
expe
ctat
ions
. Use
of
the
data
sup
port
s co
mpl
ianc
e m
anag
emen
t an
d el
imin
ates
cos
tly e
rror
s.
Purs
uant
toth
e20
12lic
ense
and
serv
ices
agre
emen
t,th
eN
AIC
rece
ives
38%
ofce
rtai
nN
IPR
reve
nues
,w
hich
repr
esen
tsa
licen
sefo
rN
IPR
tous
eth
eN
AIC'
spr
oduc
erda
ta.
Whi
leth
eN
AIC
rece
ives
38%
ofce
rtai
nN
IPR
gros
str
ansa
ctio
nre
venu
es,
apo
rtio
nof
this
reve
nue
isal
loca
ted
toth
eSB
Sre
venu
elin
e,sp
ecifi
cally
repr
esen
ting
the
NIP
Rtr
ansa
ctio
nspr
oces
sed
thro
ugh
the
SBS
syst
em.
The
2014
proj
ectio
nan
d20
15bu
dget
are
base
don
reve
nue
proj
ectio
nspr
ovid
edby
NIP
R.Th
epr
ojec
ted
incr
ease
over
the
2014
budg
etis
attr
ibut
able
toan
incr
ease
inN
IPR
Non
-Res
iden
t Li
cens
e an
d Re
new
al, A
ppoi
ntm
ent,
and
Pro
duce
r D
atab
ase
Det
ail R
epor
t fe
es. T
he 2
015
budg
et is
con
sist
ent
with
the
se e
xpec
tatio
ns.
Adm
inis
trat
ive
serv
ice
fees
incl
udes
the
actu
alco
stof
serv
ices
prov
ided
toN
IPR
and
$125
,000
for
serv
ices
prov
ided
toII
PRC.
Thes
ese
rvic
esin
clud
ead
min
istr
ativ
esu
ppor
tse
rvic
es,
faci
litie
s,an
deq
uipm
ent
prov
ided
byth
eN
AIC
toth
ese
entit
ies.
The
unde
rbu
dget
varia
nce
in20
14is
rela
ted
toN
IPR'
sco
ntin
ued
effo
rts
toco
ntro
lco
sts
unde
rth
eth
irdye
arof
the
actu
alfe
efo
rse
rvic
e ar
rang
emen
t. N
IPR'
s in
tent
to
mai
ntai
n th
is r
educ
ed le
vel o
f re
lianc
e is
ref
lect
ed in
the
201
5 bu
dget
.
Adm
inis
trat
ive
serv
ices
and
licen
ses
fees
are
deriv
edfr
omse
rvic
esag
reem
ents
betw
een
the
NAI
Can
dN
IPR
and
the
NAI
Can
dII
PRC.
Alic
ense
and
serv
ices
agre
emen
tbe
twee
nN
AIC
and
NIP
R,in
clud
ing
licen
ses
fees
,ad
min
istr
ativ
ese
rvic
efe
es,
and
syst
emus
age
fees
bega
non
Janu
ary
1,20
12an
dex
pire
son
Dec
embe
r31
,20
16.
The
licen
sean
dse
rvic
esag
reem
ent
betw
een
the
NAI
Can
dII
PRC,
incl
udin
ga
licen
sefe
eto
SERF
Fan
dad
min
istr
ativ
ese
rvic
efe
esbe
gan
June
1,20
07an
dex
pire
dD
ecem
ber
31,
2011
.Th
isag
reem
ent
cont
inue
sto
bere
new
edfo
ron
e-ye
ar p
erio
ds, c
urre
ntly
exp
iring
Dec
embe
r 31
, 201
4. I
t is
NAI
C's
inte
ntio
n to
con
tinue
ren
ewin
g th
e ex
istin
g ag
reem
ent
until
IIP
RC b
ecom
es s
elf
sust
aina
ble.
Item
Des
crip
tion:
Rev
enue
s re
ceiv
ed f
rom
the
lice
nse
and
serv
ices
agr
eem
ents
with
Nat
iona
l Ins
uran
ce P
rodu
cer
Regi
stry
(N
IPR)
and
Int
erst
ate
Insu
ranc
e Pr
oduc
t Re
gula
tion
Com
mis
sion
(II
PRC)
.
BUD
GET
ITE
M:
Adm
inis
trat
ive
Serv
ices
/Lic
ense
Fee
s
53

54

Item
Des
crip
tion:
Rev
enue
s re
ceiv
ed f
rom
mis
cella
neou
s so
urce
s.
2013
6/30
/14
12/3
1/20
1420
1420
15In
crea
seD
escr
iptio
nAc
tual
Actu
alPr
ojec
ted
Budg
etB
udg
et(D
ecre
ase)
Perc
enta
ge
Oth
er I
ncom
e (1
) $2
85,4
59$6
9,20
9$8
0,30
9$2
6,70
0$2
8,70
0$2
,000
7.49
%
(1)
The
2015
budg
etco
nsis
tsof
(1)
$12,
000
for
ase
rvic
ele
vela
gree
men
tw
ithth
eN
ewYo
rkSt
ate
Insu
ranc
eD
epar
tmen
tto
acce
ptsu
pple
men
talf
iling
sto
the
Annu
alSt
atem
ent
subm
itted
toth
eD
epar
tmen
tby
New
York
licen
sed
insu
rers
thro
ugh
the
NAI
C’s
inte
rnet
filin
gap
plic
atio
n,(2
)$9
,000
for
reim
burs
emen
tfo
rSB
Sm
odifi
catio
nsto
faci
litat
epr
oces
sing
ofN
orth
Caro
lina
tran
sact
ions
ina
third
part
ypr
oduc
t,(3
)$4
,500
for
soft
war
em
aint
enan
cefe
es,a
nd(4
)$3
,200
inse
rvic
efe
esge
nera
ted
from
the
use
ofan
NAI
Cse
rver
for
sing
lest
ate
finan
cial
exam
inat
ions
cond
ucte
dby
the
stat
eof
dom
icile
.Th
e20
14pr
ojec
tion
incl
udes
$54,
000
for
SBS
mod
ifica
tions
for
Nor
thCa
rolin
atr
ansa
ctio
ns,
whi
chw
asno
tin
clud
edin
the
2014
budg
etas
itw
asan
ticip
ated
thi
s pr
ojec
t w
ould
be
com
plet
ed b
y th
e en
d of
201
3.
R9:
Oth
er R
even
ue
BUD
GET
ITE
M:
Oth
er R
even
ue
Actu
alfo
r20
13in
clud
es(1
)$1
26,3
95fo
rtw
oye
ars
ofa
tax
cred
itre
late
dto
the
relo
catio
nof
the
NAI
CCe
ntra
lO
ffic
es,
(2)
$85,
539
for
reim
burs
emen
tfo
rSB
Sm
odifi
catio
nsto
faci
litat
epr
oces
sing
of
Nor
th C
arol
ina
tran
sact
ions
in a
thi
rd p
arty
pro
duct
, and
(3)
$31
,201
for
the
tec
hnic
al im
plem
enta
tion
of a
dat
a fe
ed b
y an
out
side
par
ty a
mon
g ot
her
mis
cella
neou
s ite
ms.
55

56

Expense Detail

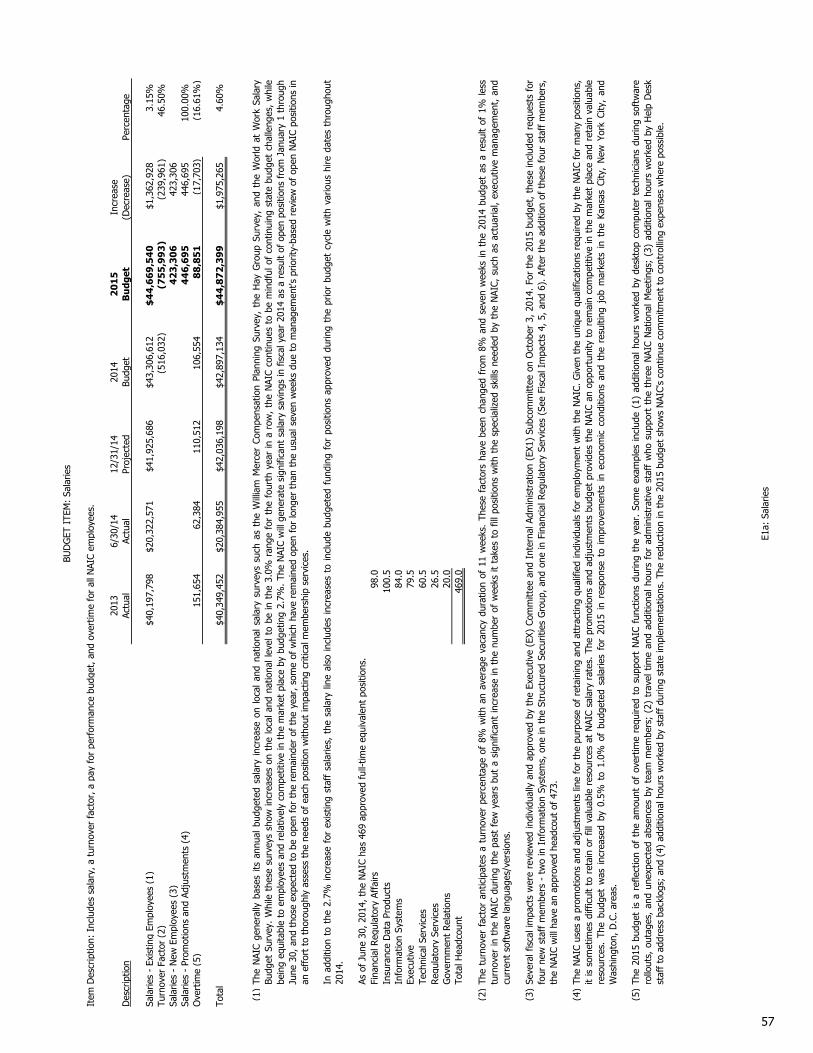
Item
Des
crip
tion:
Inc
lude
s sa
lary
, a t
urno
ver
fact
or, a
pay
for
per
form
ance
bud
get,
and
ove
rtim
e fo
r al
l NAI
C em
ploy
ees.
2013
6/30
/14
12/3
1/14
2014
20
15
Incr
ease
Des
crip
tion
Actu
alAc
tual
Proj
ecte
dBu
dget
Bu
dget
(Dec
reas
e)Pe
rcen
tage
Sala
ries
- Ex
istin
g Em
ploy
ees
(1)
$40,
197,
798
$20,
322,
571
$41,
925,
686
$43,
306,
612
$4
4,6
69
,54
0$1
,362
,928
3.15
%Tu
rnov
er F
acto
r (2
)(5
16,0
32)
(75
5,9
93
)(2
39,9
61)
46.5
0%Sa
larie
s -
New
Em
ploy
ees
(3)
42
3,3
06
423,
306
Sala
ries
- Pr
omot
ions
and
Adj
ustm
ents
(4)
44
6,6
95
446,
695
100.
00%
Ove
rtim
e (5
)15
1,65
462
,384
110,
512
106,
554
88
,85
1(1
7,70
3)(1
6.61
%)
Tota
l$4
0,34
9,45
2$2
0,38
4,95
5$4
2,03
6,19
8$4
2,89
7,13
4$
44
,87
2,3
99
$1,9
75,2
654.
60%
(1)
As o
f Ju
ne 3
0, 2
014,
the
NAI
C ha
s 46
9 ap
prov
ed f
ull-t
ime
equi
vale
nt p
ositi
ons.
Fina
ncia
l Reg
ulat
ory
Affa
irs98
.0
Insu
ranc
e D
ata
Prod
ucts
100.
5 In
form
atio
n Sy
stem
s84
.0
Exec
utiv
e79
.5
Tech
nica
l Ser
vice
s60
.5
Reg
ulat
ory
Serv
ices
26.5
G
over
nmen
t R
elat
ions
20.0
To
tal H
eadc
ount
469.
0
(2)
(3)
(4)
(5)
BUD
GET
ITE
M:
Sala
ries
E1a:
Sal
arie
s
The
NAI
Cge
nera
llyba
ses
itsan
nual
budg
eted
sala
ryin
crea
seon
loca
lan
dna
tiona
lsa
lary
surv
eys
such
asth
eW
illia
mM
erce
rCo
mpe
nsat
ion
Plan
ning
Surv
ey,
the
Hay
Gro
upSu
rvey
,an
dth
eW
orld
atW
ork
Sala
ryBu
dget
Surv
ey.
Whi
leth
ese
surv
eys
show
incr
ease
son
the
loca
land
natio
nall
evel
tobe
inth
e3.
0%ra
nge
for
the
four
thye
arin
aro
w,
the
NAI
Cco
ntin
ues
tobe
min
dful
ofco
ntin
uing
stat
ebu
dget
chal
leng
es,
whi
lebe
ing
equi
tabl
eto
empl
oyee
san
dre
lativ
ely
com
petit
ive
inth
em
arke
tpl
ace
bybu
dget
ing
2.7%
.Th
eN
AIC
will
gene
rate
sign
ifica
ntsa
lary
savi
ngs
infis
caly
ear
2014
asa
resu
ltof
open
posi
tions
from
Janu
ary
1th
roug
hJu
ne30
,an
dth
ose
expe
cted
tobe
open
for
the
rem
aind
erof
the
year
,so
me
ofw
hich
have
rem
aine
dop
enfo
rlo
nger
than
the
usua
lsev
enw
eeks
due
tom
anag
emen
t'spr
iorit
y-ba
sed
revi
ewof
open
NAI
Cpo
sitio
nsin
an e
ffor
t to
tho
roug
hly
asse
ss t
he n
eeds
of
each
pos
ition
with
out
impa
ctin
g cr
itica
l mem
bers
hip
serv
ices
.
Inad
ditio
nto
the
2.7%
incr
ease
for
exis
ting
staf
fsa
larie
s,th
esa
lary
line
also
incl
udes
incr
ease
sto
incl
ude
budg
eted
fund
ing
for
posi
tions
appr
oved
durin
gth
epr
ior
budg
etcy
cle
with
vario
ushi
reda
tes
thro
ugho
ut20
14.
The
NAI
Cus
esa
prom
otio
nsan
dad
just
men
tslin
efo
rth
epu
rpos
eof
reta
inin
gan
dat
trac
ting
qual
ified
indi
vidu
als
for
empl
oym
ent
with
the
NAI
C.G
iven
the
uniq
uequ
alifi
catio
nsre
quire
dby
the
NAI
Cfo
rm
any
posi
tions
,it
isso
met
imes
diff
icul
tto
reta
inor
fillv
alua
ble
reso
urce
sat
NAI
Csa
lary
rate
s.Th
epr
omot
ions
and
adju
stm
ents
budg
etpr
ovid
esth
eN
AIC
anop
port
unity
tore
mai
nco
mpe
titiv
ein
the
mar
ket
plac
ean
dre
tain
valu
able
reso
urce
s.Th
ebu
dget
was
incr
ease
dby
0.5%
to1.
0%of
budg
eted
sala
ries
for
2015
inre
spon
seto
impr
ovem
ents
inec
onom
icco
nditi
ons
and
the
resu
lting
job
mar
kets
inth
eKa
nsas
City
,N
ewYo
rkCi
ty,
and
Was
hing
ton,
D.C
. are
as.
The
2015
budg
etis
are
flect
ion
ofth
eam
ount
ofov
ertim
ere
quire
dto
supp
ort
NAI
Cfu
nctio
nsdu
ring
the
year
.So
me
exam
ples
incl
ude
(1)
addi
tiona
lhou
rsw
orke
dby
desk
top
com
pute
rte
chni
cian
sdu
ring
soft
war
ero
llout
s,ou
tage
s,an
dun
expe
cted
abse
nces
byte
amm
embe
rs;
(2)
trav
eltim
ean
dad
ditio
nalh
ours
for
adm
inis
trat
ive
staf
fw
hosu
ppor
tth
eth
ree
NAI
CN
atio
nalM
eetin
gs;
(3)
addi
tiona
lhou
rsw
orke
dby
Hel
pD
esk
staf
f to
add
ress
bac
klog
s; a
nd (
4) a
dditi
onal
hou
rs w
orke
d by
sta
ff d
urin
g st
ate
impl
emen
tatio
ns. T
he r
educ
tion
in t
he 2
015
budg
et s
how
s N
AIC'
s co
ntin
ue c
omm
itmen
t to
con
trol
ling
expe
nses
whe
re p
ossi
ble.
Seve
ralf
isca
lim
pact
sw
ere
revi
ewed
indi
vidu
ally
and
appr
oved
byth
eEx
ecut
ive
(EX)
Com
mitt
eean
dIn
tern
alAd
min
istr
atio
n(E
X1)
Subc
omm
ittee
onO
ctob
er3,
2014
.Fo
rth
e20
15bu
dget
,th
ese
incl
uded
requ
ests
for
four
new
staf
fm
embe
rs-
two
inIn
form
atio
nSy
stem
s,on
ein
the
Stru
ctur
edSe
curit
ies
Gro
up,
and
one
inFi
nanc
ialR
egul
ator
ySe
rvic
es(S
eeFi
scal
Impa
cts
4,5,
and
6).
Afte
rth
ead
ditio
nof
thes
efo
urst
aff
mem
bers
,th
e N
AIC
will
hav
e an
app
rove
d he
adco
ut o
f 47
3.
The
turn
over
fact
oran
ticip
ates
atu
rnov
erpe
rcen
tage
of8%
with
anav
erag
eva
canc
ydu
ratio
nof
11w
eeks
.Th
ese
fact
ors
have
been
chan
ged
from
8%an
dse
ven
wee
ksin
the
2014
budg
etas
are
sult
of1%
less
turn
over
inth
eN
AIC
durin
gth
epa
stfe
wye
ars
but
asi
gnifi
cant
incr
ease
inth
enu
mbe
rof
wee
ksit
take
sto
fillp
ositi
ons
with
the
spec
ializ
edsk
ills
need
edby
the
NAI
C,su
chas
actu
aria
l,ex
ecut
ive
man
agem
ent,
and
curr
ent
soft
war
e la
ngua
ges/
vers
ions
.
57

2015
Bud
get
by A
rea
Tech
nolo
gyFi
nanc
ial
Mar
ket
Prod
ucts
Sy
stem
s an
dBu
sine
ssSe
rvic
es t
oR
egul
ator
yR
egul
ator
yan
dD
escr
iptio
nSu
ppor
tO
pera
tions
Mem
bers
Affa
irsSe
rvic
esSe
rvic
esTo
tal
Sala
ries
- Ex
istin
g Em
ploy
ees
(1)
$10,
463,
138
$8,6
81,2
72$3
,926
,785
$11,
855,
481
$2,4
55,2
66$7
,287
,598
$4
4,6
69
,54
0Tu
rnov
er F
acto
r (2
)(1
79,0
85)
(140
,024
)(6
7,20
9)(2
02,9
16)
(42,
023)
(124
,736
)(7
55
,99
3)
Sala
ries
- N
ew E
mpl
oyee
s (3
)11
4,97
030
8,33
64
23
,30
6Sa
larie
s -
Prom
otio
ns a
nd A
djus
tmen
ts (
4)44
6,69
54
46
,69
5O
vert
ime
(5)
24,8
477,
006
25,4
1731
,581
88
,85
1
Tota
l$1
0,42
3,87
0$8
,994
,949
$3,8
84,9
93$1
1,96
0,90
1$2
,413
,243
$7,1
94,4
43$
44
,87
2,3
99
E1b:
Sal
arie
s
BUD
GET
ITE
M:
Sala
ries
(con
tinue
d fr
om E
1a)
58

Item
Des
crip
tion:
Fee
s pa
id t
o ou
tsid
e ag
enci
es a
nd w
ages
pai
d to
inte
rns
for
addi
tiona
l per
sonn
el d
urin
g pe
ak w
ork
perio
ds.
2013
6/30
/14
12/3
1/14
2014
20
15
Incr
ease
Des
crip
tion
Actu
alAc
tual
Proj
ecte
dBu
dget
Bu
dget
(Dec
reas
e)Pe
rcen
tage
Nat
iona
l Mee
tings
(1)
$33,
410
$20,
619
$49,
913
$43,
989
$4
6,2
20
$2,2
315.
07%
Inte
rns
(2)
271,
945
121,
347
272,
147
336,
145
39
9,4
19
63,2
7418
.82%
Oth
er (
3)76
,989
41,7
9066
,990
49,0
003
8,9
63
(10,
037)
(20.
48%
)
Tota
l$3
82,3
44$1
83,7
56$3
89,0
50$4
29,1
34$
48
4,6
02
$55,
468
12.9
3%
(1)
(2)
(3)
2015
Bud
get
by A
rea
Tech
nolo
gyFi
nanc
ial
Mar
ket
Prod
ucts
Sy
stem
s an
dBu
sine
ssSe
rvic
es t
oR
egul
ator
yR
egul
ator
yan
dD
escr
iptio
nSu
ppor
tO
pera
tions
Mem
bers
Affa
irsSe
rvic
esSe
rvic
esTo
tal
Nat
iona
l Mee
tings
(1)
$46,
220
$4
6,2
20
Inte
rns
(2)
$399
,419
39
9,4
19
Oth
er (
3)38
,963
38
,96
3
Tota
l$0
$438
,382
$46,
220
$0$0
$0$
48
4,6
02
E2:
Tem
pora
ry P
erso
nnel
BUD
GET
ITE
M:
Tem
pora
ry P
erso
nnel
Tem
pora
ryre
sour
ces
for
natio
nalm
eetin
gsar
eus
edfo
rse
curit
yan
ddo
orm
onito
ring
purp
oses
.H
otel
conf
igur
atio
nsan
dm
eetin
gsc
hedu
les
nece
ssita
tea
slig
htin
crea
sein
the
amou
ntof
tem
pora
ryse
rvic
esus
edat
natio
nal m
eetin
gs c
ompa
red
to t
he 2
014
Budg
et.
Oth
erte
mpo
rary
pers
onne
lar
ebu
dget
edto
prov
ide
addi
tiona
lre
sour
ces
durin
gbr
ief
perio
dsof
incr
ease
dde
man
d.Th
eov
erag
ein
2014
repr
esen
tsth
een
gage
men
tof
tem
pora
ryst
aff
toas
sist
durin
gm
ultip
leun
expe
cted
med
ical
leav
es o
f ab
senc
e.
The
NAI
Cin
tern
ship
prog
ram
isde
sign
edto
com
plem
ent
reso
urce
need
sin
vario
ushi
ghpr
iorit
yar
eas.
Som
eof
the
proj
ects
slat
edfo
rin
tern
assi
gnm
ent
incl
ude
SBS
syst
ems
test
ing;
SER
FFpr
oduc
tsu
ppor
t;Q
ualit
yAs
sura
nce
test
ing
ofN
AIC
appl
icat
ions
;su
ppor
tfo
rth
eH
uman
Res
ourc
esD
ivis
ion;
supp
ort
for
the
NAI
C's
digi
tall
ibra
ryco
llect
ion;
and
lega
lres
earc
h.Th
eus
eof
inte
rns
allo
ws
the
NAI
Cto
find
and
attr
act
tem
pora
ryre
sour
ces,
ina
com
petit
ive
mar
ketp
lace
,re
sulti
ngin
ave
rysu
cces
sful
prog
ram
for
the
NAI
Cw
ithre
spec
tto
iden
tifyi
ngan
dre
tain
ing
qual
ified
cand
idat
esfo
rfu
ll-tim
epo
sitio
ns.
The
belo
wbu
dget
perf
orm
ance
inth
islin
e pr
ojec
ted
for
2014
is r
elat
ed t
o di
ffic
ulty
in f
indi
ng q
ualif
ied
reso
urce
s at
the
NAI
C's
curr
ent
hour
ly r
ate
for
inte
rns.
The
incr
ease
in b
udge
t fo
r 20
15 is
des
igne
d to
add
ress
thi
s is
sue
by in
crea
sing
the
hou
rly w
age
for
cert
ain
hard
to
fill i
nter
n po
sitio
ns b
y $1
-$2.
The
201
5 in
tern
pro
gram
als
o in
clud
es t
he a
dditi
on o
f fiv
e ne
w in
tern
pos
ition
s to
ass
ist
with
the
NAI
C H
elp
Des
k, r
ecep
tioni
st c
over
age,
and
sta
tistic
al r
epor
ting.
59

60

Item
Des
crip
tion:
FIC
A an
d un
empl
oym
ent
com
pens
atio
n co
sts
incu
rred
for
all
NAI
C em
ploy
ees
and
inte
rns.
2013
6/30
/14
12/3
1/14
2014
20
15
Incr
ease
Des
crip
tion
Actu
alAc
tual
Proj
ecte
dBu
dget
Bu
dget
(Dec
reas
e)Pe
rcen
tage
FICA
(1)
$2,6
81,6
56$1
,547
,699
$2,8
29,9
86$2
,938
,297
$3
,03
5,3
33
$97,
036
3.30
%FI
CA T
urno
ver
(2)
(35,
176)
(36
,09
6)
(920
)2.
62%
Une
mpl
oym
ent
Com
pens
atio
n (3
)11
4,60
610
6,76
211
5,71
512
2,65
21
16
,37
7(6
,275
)(5
.12%
)
Tota
l$2
,796
,262
$1,6
54,4
61$2
,945
,701
$3,0
25,7
73$
3,1
15
,61
4$8
9,84
12.
97%
(1)
(2)
(3)
2015
Bud
get
by A
rea
Tech
nolo
gyFi
nanc
ial
Mar
ket
Prod
ucts
Sy
stem
s an
dBu
sine
ssSe
rvic
es t
oR
egul
ator
yR
egul
ator
yan
dD
escr
iptio
nan
d Su
ppor
tO
pera
tions
Mem
bers
Affa
irsSe
rvic
esSe
rvic
esTo
tal
FICA
(1)
$811
,096
$452
,369
$297
,247
$748
,898
$166
,451
$559
,272
$3
,03
5,3
33
FICA
Tur
nove
r (2
)(9
,720
)(5
,112
)(3
,579
)(8
,893
)(2
,018
)(6
,774
)(3
6,0
96
)U
nem
ploy
men
t Co
mpe
nsat
ion
(3)
22,7
4813
,360
6,92
154
,468
5,25
013
,630
11
6,3
77
Tota
l$8
24,1
24$4
60,6
17$3
00,5
89$7
94,4
73$1
69,6
83$5
66,1
28$
3,1
15
,61
4
FICA
expe
nse
will
beun
der
budg
etin
2014
,w
ithem
ploy
eetu
rnov
erbe
ing
the
prim
ary
reas
on.
The
incr
ease
inbu
dget
edFI
CAfo
r20
15is
rela
ted
toth
ein
crea
sein
the
2015
sala
rybu
dget
asde
scrib
edin
the
sala
ryse
ctio
nof
this
budg
etpr
opos
al,
annu
aliz
ing
empl
oyee
sad
ded
aspa
rtof
the
2014
budg
etpr
oces
s,an
incr
ease
inth
eex
pect
edFI
CAw
age
limit
for
2015
,an
dth
ead
ditio
nof
four
new
empl
oyee
sin
2015
(See
Fisc
alIm
pact
s 4,
5, a
nd 6
).
BUD
GET
ITE
M:
Payr
oll T
axes
E3:
Payr
oll T
axes
Une
mpl
oym
ent
com
pens
atio
nha
sbe
enbu
dget
edon
the
first
$13,
000
ofea
chin
divi
dual
sala
ryin
Mis
sour
i,th
efir
st$9
,000
inW
ashi
ngto
n,D
.C.,
and
the
first
$10,
300
inN
ewYo
rk.
The
decr
ease
inth
e20
14pr
ojec
tion
refle
cts
toa
decr
ease
inth
era
tefo
rM
isso
uria
ndN
ewYo
rkun
empl
oym
ent
tax
that
was
not
anno
unce
dby
the
stat
eun
tilaf
ter
the
2014
budg
etw
asco
mpl
eted
.Th
isde
crea
seco
ntin
ues
in20
15bu
tis
part
ially
offs
etby
the
addi
tion
of f
our
new
em
ploy
ees
in 2
015
(See
Fis
cal I
mpa
cts
4, 5
, and
6).
The
turn
over
fact
orap
plie
dto
annu
alsa
larie
sis
also
appl
ied
toth
epa
yrol
ltax
esre
late
dto
thos
esa
larie
s,us
ing
turn
over
and
vaca
ncy
rate
sco
nsis
tent
with
thos
ede
scrib
edin
the
sala
ryse
ctio
nof
this
budg
etpr
opos
al.
Actu
al a
nd p
roje
cted
tur
nove
r is
ref
lect
ed in
the
sal
ary
line.
The
incr
ease
in t
his
budg
et li
ne is
to
refle
ct a
n in
crea
se t
he t
urno
ver
fact
or, a
s di
scus
sed
in t
he s
alar
y se
ctio
n.
61

62

2013
6/30
/14
12/3
1/14
2014
20
15
Incr
ease
Des
crip
tion
Actu
alAc
tual
Proj
ecte
dBu
dget
Bu
dget
(Dec
reas
e)Pe
rcen
tage
Pens
ion
(1)
$2,9
69,9
00$1
,229
,791
$2,6
37,5
66$2
,644
,281
$2
,88
0,5
20
$236
,239
8.93
%H
ealth
Ben
efits
(2)
3,89
3,85
81,
985,
759
4,18
9,08
24,
133,
721
4,6
27
,71
749
3,99
611
.95%
Gro
up L
ife a
nd D
isab
ility
(3)
243,
091
147,
447
304,
362
305,
075
33
0,2
20
25,1
458.
24%
Empl
oyee
Rel
atio
ns (
4)36
0,93
616
1,12
435
2,67
429
1,28
83
43
,73
052
,442
18.0
0%
Tota
l$7
,467
,785
$3,5
24,1
21$7
,483
,684
$7,3
74,3
65$
8,1
82
,18
7$8
07,8
2210
.95%
(1)
(2)
(3)
(4)
2015
Bud
get
by A
rea
Tech
nolo
gyFi
nanc
ial
Mar
ket
Prod
ucts
Sy
stem
s an
dBu
sine
ssSe
rvic
es t
oR
egul
ator
yR
egul
ator
yan
dD
escr
iptio
nSu
ppor
tO
pera
tions
Mem
bers
Affa
irsSe
rvic
esSe
rvic
esTo
tal
Pens
ion
(1)
$2,8
80,5
20$
2,8
80
,52
0H
ealth
Ben
efits
(2)
4,62
7,71
74
,62
7,7
17
Gro
up L
ife a
nd D
isab
ility
(3)
330,
220
33
0,2
20
Empl
oyee
Rel
atio
ns (
4)33
4,59
0$2
,500
$6,6
403
43
,73
0
Tota
l$0
$8,1
73,0
47$2
,500
$6,6
40$0
$0$
8,1
82
,18
7
Empl
oyee
rela
tions
incl
udes
perf
orm
ance
reco
gniti
onpr
ogra
ms,
inci
dent
alem
ploy
eefu
nctio
nssu
chas
Empl
oyee
Appr
ecia
tion
Day
and
the
NAI
CW
elln
ess
Day
,an
dth
ean
nual
holid
aylu
nche
on.
The
2015
budg
etde
mon
stra
tes
cont
inue
d co
nfid
ence
in t
he b
enef
it of
the
se p
rogr
ams.
BUD
GET
ITE
M:
Empl
oyee
Ben
efits
Item
Des
crip
tion:
Inc
lude
s al
l pen
sion
, hea
lth in
sura
nce,
life
and
dis
abili
ty in
sura
nce
paid
by
the
NAI
C fo
r its
em
ploy
ees,
as
wel
l as
prog
ram
s de
sign
ed t
o re
duce
hea
lth in
sura
nce
cost
s an
d re
tain
NAI
C em
ploy
ees.
Gro
uplif
ean
ddi
sabi
lity
bene
fits
are
base
don
the
num
ber
ofem
ploy
ees
and
sala
ries.
The
incr
ease
in20
15is
dire
ctly
rela
ted
toth
ein
crea
sein
wag
esfo
r20
15,
conv
ersi
onof
staf
fing
addi
tions
appr
oved
with
the
2014
budg
et t
o a
full
year
, and
the
add
ition
of
four
new
em
ploy
ees
in 2
015
(See
Fis
cal I
mpa
cts
4, 5
, and
6).
Also
incl
uded
inth
islin
eis
the
NAI
C’s
defin
edbe
nefit
plan
(DBP
)w
itha
2015
budg
etof
$300
,000
for
estim
ated
sett
lem
ent
acco
untin
gfo
rth
ispl
an,
whi
chre
pres
ents
the
best
avai
labl
em
easu
rem
ent
ofad
ditio
nalc
osts
tobe
incu
rred
ifon
eor
mor
ese
vera
llon
g-te
rmem
ploy
ees
choo
seto
retir
edu
ring
2015
.Th
e20
15co
stof
this
plan
is$9
0,00
0hi
gher
than
the
2014
budg
etdu
eto
cont
inue
dm
atur
ityof
part
icip
ants
inth
ispl
an.
NAI
Cm
anag
emen
t w
orks
clo
sely
with
the
pla
n’s
actu
ary
and
the
NAI
C In
tern
al A
dmin
istr
atio
n (E
X1)
Subc
omm
ittee
to
care
fully
rev
iew
pla
n pe
rfor
man
ce in
rel
atio
n to
und
erly
ing
plan
ass
umpt
ions
.
Empl
oyee
heal
thbe
nefit
sar
eba
sed
upon
the
num
ber
ofcu
rren
tem
ploy
ees
and
thei
rbe
nefit
sele
ctio
ns.
The
incr
ease
in20
15is
due
toan
estim
ated
10%
incr
ease
inhe
alth
care
cost
sat
the
Augu
st1,
2015
rene
wal
date
and
a2%
incr
ease
inen
rollm
ent
inN
AIC
plan
s.Ad
ditio
nally
,th
e20
15bu
dget
has
been
incr
ease
dto
acco
mm
odat
ehe
alth
cove
rage
for
the
four
new
empl
oyee
requ
ests
incl
uded
inth
e20
15bu
dget
(See
Fisc
alIm
pact
s 4,
5, a
nd 6
).
E4:
Empl
oyee
Ben
efits
Pens
ion
incl
udes
the
defin
edco
ntrib
utio
npl
an(D
CP)
tow
hich
the
NAI
Cm
akes
a3%
disc
retio
nary
cont
ribut
ion
ofea
chem
ploy
ee’s
annu
alsa
lary
and
mat
ches
anem
ploy
ee’s
cont
ribut
ion
upto
4.5%
,fo
ran
estim
ated
$2.6
mill
ion
in 2
015.
Thi
s ex
pens
e is
bud
gete
d to
incr
ease
$14
6,23
9 fr
om t
he 2
014
budg
et b
ased
on
(1)
incr
ease
d sa
lary
bas
e in
201
5 an
d (2
) cu
rren
t st
aff
cont
ribut
ion
rate
s.
63

64

Item
Des
crip
tion:
Inc
lude
s fe
es f
or s
emin
ars,
pro
fess
iona
l tra
inin
g co
urse
s an
d pr
ofes
sion
al a
ssoc
iatio
n m
embe
rshi
ps p
aid
by t
he N
AIC.
2013
6/30
/14
12/3
1/14
2014
20
15
Incr
ease
Des
crip
tion
Actu
alAc
tual
Proj
ecte
dBu
dget
Bu
dget
(Dec
reas
e)Pe
rcen
tage
Educ
atio
n R
eim
burs
emen
ts (
1)$2
1,00
3$1
6,31
2$4
1,71
0$4
5,66
3$
45
,54
8($
115)
(0.2
5%)
Prof
essi
onal
Tra
inin
g (2
)28
7,50
099
,131
325,
541
325,
368
37
2,5
69
47,2
0114
.51%
Prof
essi
onal
Ass
ocia
tion
Due
s (3
)41
4,07
242
8,46
545
8,03
845
7,15
74
90
,44
233
,285
7.28
%
Tota
l$7
22,5
75$5
43,9
08$8
25,2
89$8
28,1
88$
90
8,5
59
$80,
371
9.70
%
(1)
(2)
(3)
2015
Bud
get
by A
rea
Tech
nolo
gyFi
nanc
ial
Mar
ket
Prod
ucts
Sy
stem
s an
dBu
sine
ssSe
rvic
es t
oR
egul
ator
yR
egul
ator
yan
dD
escr
iptio
nSu
ppor
tO
pera
tions
Mem
bers
Affa
irsSe
rvic
esSe
rvic
esTo
tal
Educ
atio
n R
eim
burs
emen
ts (
1)$1
7,14
4$1
,797
$3,5
20$1
2,70
2$1
0,38
5$
45
,54
8Pr
ofes
sion
al T
rain
ing
(2)
122,
067
32,7
30$1
6,62
559
,295
49,6
4592
,207
37
2,5
69
Prof
essi
onal
Ass
ocia
tion
Due
s (3
)5,
567
28,9
7941
7,52
021
,585
12,4
394,
352
49
0,4
42
Tota
l$1
44,7
78$6
3,50
6$4
34,1
45$8
4,40
0$7
4,78
6$1
06,9
44$
90
8,5
59
BUD
GET
ITE
M:
Empl
oyee
Dev
elop
men
t
Prof
essi
onal
trai
ning
repr
esen
tsre
gist
ratio
nfe
esfo
rpr
ofes
sion
alse
min
ars,
trad
ew
orks
hops
,an
ded
ucat
ion
prog
ram
sat
tend
edby
NAI
Cem
ploy
ees
who
requ
iresp
ecia
lized
trai
ning
orar
ere
quire
dto
rece
ive
cont
inui
nged
ucat
ion
tom
aint
ain
prof
essi
onal
licen
ses
orde
sign
atio
ns.
The
incr
ease
intr
aini
ngfo
r20
15is
requ
ired
toke
eppa
cew
ithne
wte
chno
logi
esde
ploy
edby
the
NAI
C.Al
soco
ntrib
utin
gto
this
incr
ease
istr
aini
ngre
quire
dto
supp
ort
new
syst
ems
curr
ently
unde
rde
velo
pmen
t,su
chas
Stat
eBa
sed
Syst
ems
(SBS
)re
writ
ean
dth
eSe
curit
ies
Syst
emR
ewrit
e(S
SR)
(See
Fisc
alIm
pact
s1
and
2),a
ndth
efo
urne
wem
ploy
eere
ques
tsin
clud
edin
the
2015
bud
get
(See
Fis
cal I
mpa
cts
4, 5
, and
6).
Educ
atio
nalr
eim
burs
emen
tsca
rry
anan
nual
cap
per
empl
oyee
,ar
eon
lyav
aila
ble
toth
ose
empl
oyee
sw
hoar
eac
tivel
ypu
rsui
ngco
llege
degr
ees
orpr
ofes
sion
alde
sign
atio
ns,
and
only
appl
yto
war
dtu
ition
for
cour
ses
that
spec
ifica
llyre
late
toan
den
hanc
eth
eem
ploy
ee’s
job
know
ledg
ean
d/or
skill
sfo
rth
ebe
nefit
ofth
eN
AIC.
The
2014
varia
nce
from
budg
etre
flect
sfe
wer
reim
burs
emen
tsth
anan
ticip
ated
inth
e20
14bu
dget
due
toem
ploy
ee w
orkl
oads
and
dep
artu
res.
The
201
5 bu
dget
dem
onst
rate
s th
e N
AIC'
s co
ntin
ued
com
mitm
ent
to t
he d
evel
opm
ent
of e
mpl
oyee
ski
lls t
o fu
rthe
r th
e w
ork
of s
tate
reg
ulat
ion
and
the
NAI
C.
Prof
essi
onal
asso
ciat
ion
dues
incl
ude
$407
,846
for
the
NAI
C’s
annu
alm
embe
rshi
pin
the
Inte
rnat
iona
lAss
ocia
tion
ofIn
sura
nce
Supe
rvis
ors
(IAI
S),
repr
esen
ting
anin
crea
seof
$21,
909
over
the
dues
paid
in20
14,w
hich
wer
e$1
1,52
3ov
erth
e20
14bu
dget
.Th
ebu
dget
also
incl
udes
empl
oyee
mem
bers
hips
inva
rious
prof
essi
onal
asso
ciat
ions
,su
chas
the
Amer
ican
Soci
ety
ofAs
soci
atio
nEx
ecut
ives
,Am
eric
anBa
rAs
soci
atio
n,lo
cala
ndst
ate
bar
asso
ciat
ions
, the
Am
eric
an I
nstit
ute
of C
ertif
ied
Publ
ic A
ccou
ntan
ts, a
nd s
tate
CPA
ass
ocia
tions
, am
ong
othe
rs.
E5:
Empl
oyee
Dev
elop
men
t
65

66

Item
Des
crip
tion:
Fee
s pa
id t
o ou
tsid
e co
nsul
tant
s fo
r le
gal,
actu
aria
l, in
form
atio
n te
chno
logy
, and
oth
er c
onsu
lting
ser
vice
s.
2013
6/30
/14
12/3
1/14
2014
20
15
Incr
ease
Des
crip
tion
Actu
alAc
tual
Proj
ecte
dBu
dget
Bu
dget
(Dec
reas
e)Pe
rcen
tage
Lega
l (1)
$1,0
72,5
41$7
5,99
8$4
56,1
98$5
25,0
00$
65
0,0
00
$125
,000
23.8
1%Ac
cred
itatio
n Te
am (
2)58
3,91
849
4,38
489
9,66
496
2,87
58
14
,69
3(1
48,1
82)
(15.
39%
)R
oyal
ties
(3)
8,76
9,60
631
4,05
06,
429,
916
6,07
1,94
06
,51
2,7
89
440,
849
100.
00%
Bene
fits
(4)
246,
252
115,
585
241,
420
241,
500
24
1,2
54
(246
)(0
.10%
)In
vest
men
t/Ba
nkin
g (5
)56
9,65
231
6,30
163
3,90
959
6,12
76
71
,52
475
,397
12.6
5%Au
dit
(6)
103,
245
37,2
7511
0,40
011
0,40
01
91
,91
981
,519
73.8
4%Co
nsum
er A
war
enes
s (7
)66
2,00
064
8,50
41,
212,
999
1,21
3,00
01
,57
3,0
00
360,
000
29.6
8%Im
plem
enta
tion/
Upg
rade
(8)
1,15
2,35
379
,538
251,
253
267,
137
1,2
05
,98
393
8,84
635
1.45
%O
ther
Pro
fess
iona
l Ser
vice
s (9
)3,
350,
710
1,57
9,90
13,
388,
248
2,75
7,09
78
75
,51
3(1
,881
,584
)(6
8.25
%)
Tota
l$1
6,51
0,27
7$3
,661
,536
$13,
624,
007
$12,
745,
076
$1
2,7
36
,67
5($
8,40
1)(0
.07%
)
(1)
(2)
(3)
(4)
(5)
(6)
(7)
(8)
The
Impl
emen
tatio
n/U
pgra
decl
assi
ficat
ion
cont
ains
amou
nts
budg
eted
for
cons
ultin
gan
dot
her
prof
essi
onal
serv
ices
rela
ted
toth
eup
grad
eof
soft
war
eto
am
ore
curr
ent
vers
ion,
data
mig
ratio
n,so
ftw
are
inst
alla
tions
,an
dSt
ate
Base
dSy
stem
s(S
BS)
stat
eim
plem
enta
tions
.Th
ede
crea
sein
budg
eted
and
proj
ecte
dsp
endi
ngin
2014
isre
late
dto
the
rew
rite
ofth
eSB
Ssy
stem
.Si
nce
the
plat
form
for
this
soft
war
ew
asin
flux,
only
the
plan
ning
phas
esfo
rth
eAr
izon
aan
dN
ewM
exic
oim
plem
enta
tions
took
plac
ein
2014
.Th
e20
15bu
dget
show
sa
retu
rnto
norm
alac
tiviti
esfo
rSB
Sw
ithco
nsul
ting
serv
ices
for
the
impl
emen
tatio
nof
thes
etw
ost
ates
asw
ella
sSo
uth
Caro
lina
and
Mas
sach
uset
tsof
$823
,485
.Add
ition
ally
,th
e20
15bu
dget
also
incl
udes
$157
,625
for
the
impl
emen
tatio
nof
reco
rds
man
agem
ent
and
wor
kflo
wpr
oces
ses.
Fina
lly,
seve
ralF
isca
lIm
pact
sw
ere
revi
ewed
indi
vidu
ally
and
appr
oved
byth
eEx
ecut
ive
(EX)
Com
mitt
eean
dIn
tern
alAd
min
istr
atio
n(E
X1)
Subc
omm
ittee
onO
ctob
er3,
2014
.Fo
rth
e20
15bu
dget
,th
ese
incl
ude
(1)
$73,
920
for
the
SER
FFIn
tegr
atio
nEx
pans
ion
proj
ect
(See
Fis
cal I
mpa
ct 3
), a
nd (
2) $
20,0
00 f
or E
nhan
ced
Supp
ort
of M
embe
r U
se o
f El
ectr
onic
Wor
kpap
ers
(See
Fis
cal I
mpa
ct 6
).
Roy
altie
sar
epa
idon
sale
sth
atco
ntai
nda
tam
odel
ing
onR
MBS
and
CMBS
CUSI
Psan
dre
venu
esh
arin
gfo
rda
tase
tsa
les
ofth
ese
CUSI
Ps.
Proj
ecte
dex
pens
ein
this
cate
gory
will
exce
edbu
dget
due
toth
esa
leof
a20
13 d
atas
et in
Jan
uary
201
4 an
d a
high
er n
umbe
r of
RM
BS C
USI
Ps m
odel
ed a
s pa
rt o
f th
e 20
14 S
truc
ture
d Se
curit
ies
proj
ect.
The
201
5 bu
dget
ass
umes
the
se t
rend
s w
ill c
ontin
ue.
The
2015
budg
etfo
rco
nsum
eraw
aren
ess
cont
ains
$873
,000
inpu
blic
rela
tions
cons
ultin
gse
rvic
esto
supp
ort
the
NAI
C's
core
cons
umer
awar
enes
san
ded
ucat
ion
med
iaca
mpa
ign.
Ital
soin
clud
es$7
00,0
00fo
rth
eN
AIC
Educ
atio
nalO
utre
ach
Prog
ram
.Thi
spr
ogra
mis
desi
gned
toed
ucat
edo
mes
tican
din
tern
atio
nalp
olic
ymak
ers
abou
tth
eac
tual
wor
king
sof
the
stat
e-ba
sed
regu
lato
rysy
stem
inth
eU
.S.,
aco
ntin
uatio
nof
the
2014
prog
ram
.
Inve
stm
ent
man
agem
ent
fees
of$5
54,8
50to
the
NAI
C's
inve
stm
ent
man
ager
san
dad
vise
ran
d$1
16,6
74in
bank
ing
fees
are
incl
uded
inth
isex
pens
elin
e.Th
ein
crea
sein
fees
for
2014
ispr
imar
ilyre
late
dto
incr
ease
sto
the
inve
stm
ent
port
folio
due
tom
arke
tva
lue
adju
stm
ents
.Th
ese
incr
ease
sar
eex
trap
olat
edth
roug
hth
een
dof
2015
.Th
ere
are
nopl
anne
din
fusi
ons
ofca
shin
toth
ein
vest
men
tpo
rtfo
lioin
2015
asa
resu
ltof
expe
cted
exp
endi
ture
s fo
r co
ntin
uing
maj
or s
yste
m r
ewrit
es.
E6a:
Pro
fess
iona
l Ser
vice
s
The
outs
ide
lega
lcou
nsel
budg
etre
flect
san
ticip
ated
lega
lexp
ense
sto
assi
stth
eLe
galD
ivis
ion
in:
(1)
need
edex
pert
ise
toas
sist
inco
mpl
exan
dsp
ecia
lized
regu
lato
ryis
sues
and
proj
ects
;(2
)la
bor
and
empl
oym
ent
issu
es;
(3)
corp
orat
em
atte
rsre
latin
gto
cont
ract
s,ta
x,an
dbe
nefit
s;an
d(4
)am
icus
brie
fsfil
edat
the
requ
est
ofN
AIC
mem
bers
.Th
ede
crea
sein
spen
ding
inth
isbu
dget
line
for
2014
refle
cts
the
reso
lutio
nof
asi
gnifi
cant
lega
l mat
ter
in 2
013.
The
incr
ease
in t
he b
udge
t fo
r 20
15 r
efle
cts
the
antic
ipat
ed u
se o
f le
gal c
ouns
el t
o co
nduc
t a
gove
rnan
ce r
evie
w a
nd a
n ex
pect
ed in
crea
se in
hou
rly r
ates
for
lega
l ser
vice
s in
201
5.
Audi
tfe
esin
clud
esam
ount
spa
idto
inde
pend
ent
acco
untin
gan
din
form
atio
nte
chno
logy
firm
sfo
rth
ean
nual
finan
cial
exam
inat
ion
($36
,794
),St
atem
ent
onSt
anda
rds
for
Atte
stat
ion
Enga
gem
ents
(SSA
E)N
o.16
,R
epor
ting
onCo
ntro
lsat
aSe
rvic
eO
rgan
izat
ion
(SO
C1)
audi
t($
40,0
00),
and
othe
rsy
stem
sex
amin
atio
ns.
The
2015
budg
etal
soin
clud
esad
ditio
nalf
undi
ngof
$75,
000
for
are
adin
ess
revi
ewof
the
NAI
C's
finan
cial
and
oper
atio
nal s
yste
ms.
BUD
GET
ITE
M:
Prof
essi
onal
Ser
vice
s
Not
e: R
ecla
ssifi
catio
ns h
ave
been
mad
e in
the
pro
fess
iona
l ser
vice
s ca
tego
ry t
o pr
ovid
e ad
ditio
nal t
rans
pare
ncy
in t
he f
inan
cial
rep
ortin
g fo
r th
ese
serv
ices
. Prio
r ye
ar a
ctua
ls a
nd b
udge
ts h
ave
been
res
tate
d fo
r co
mpa
rison
pu
rpos
es.
InJu
ne19
90,
the
Inte
rnal
Adm
inis
trat
ion
(EX1
)Su
bcom
mitt
eeau
thor
ized
the
NAI
Cto
com
pens
ate
inde
pend
ent
team
sw
hoco
nduc
tre
view
sof
insu
ranc
ede
part
men
tsse
ekin
gac
cred
itatio
nun
der
the
NAI
CFi
nanc
ial
Reg
ulat
ion
Stan
dard
san
dAc
cred
itatio
npr
ogra
m.T
hebu
dget
isco
mpo
sed
base
don
the
num
ber
ofex
amin
atio
nsto
beco
nduc
ted,
whi
chflu
ctua
tes
from
year
toye
ar.
The
2015
budg
etas
sum
es9
stat
esun
derg
oing
full
revi
ews,
thre
ele
ssth
anth
e20
14bu
dget
,12
stat
esun
derg
oing
pre-
revi
ews,
dow
nfr
om15
inth
e20
14bu
dget
,an
dtw
ost
ate
re-r
evie
ws,
one
less
than
the
2014
budg
et.
This
line
also
incl
udes
fund
ing
for
trai
ning
for
the
inde
pend
ent
team
mem
bers
todi
scus
spr
ogra
mgu
idel
ines
,st
anda
rds,
revi
ewte
ampr
actic
es,
chan
ges
toth
epr
ogra
m,
and
NAI
Cto
ols
used
bym
embe
rsto
com
ply
with
the
prog
ram
.Th
ede
crea
sein
spen
ding
in20
14 is
rel
ated
to
the
timin
g of
exa
min
atio
ns. T
he d
ecre
ase
for
2015
is r
elat
ed t
o th
e di
ffer
entia
l in
the
num
ber
and
size
of
stat
es t
o be
exa
min
ed in
201
5 ve
rsus
tho
se in
the
201
4 bu
dget
.
Cons
ultin
gan
dsu
ppor
tse
rvic
esin
the
bene
fits
cate
gory
incl
udes
assi
stan
cew
ith(1
)ad
min
istr
atio
nof
the
Def
ined
Cont
ribut
ion
Ret
irem
ent
Plan
,(2)
actu
aria
lser
vice
sfo
rth
eD
efin
edBe
nefit
Ret
irem
ent
Plan
,(3
)be
nefit
rene
wal
s, a
nd (
4) e
mpl
oyee
wel
lnes
s pl
ans.
67
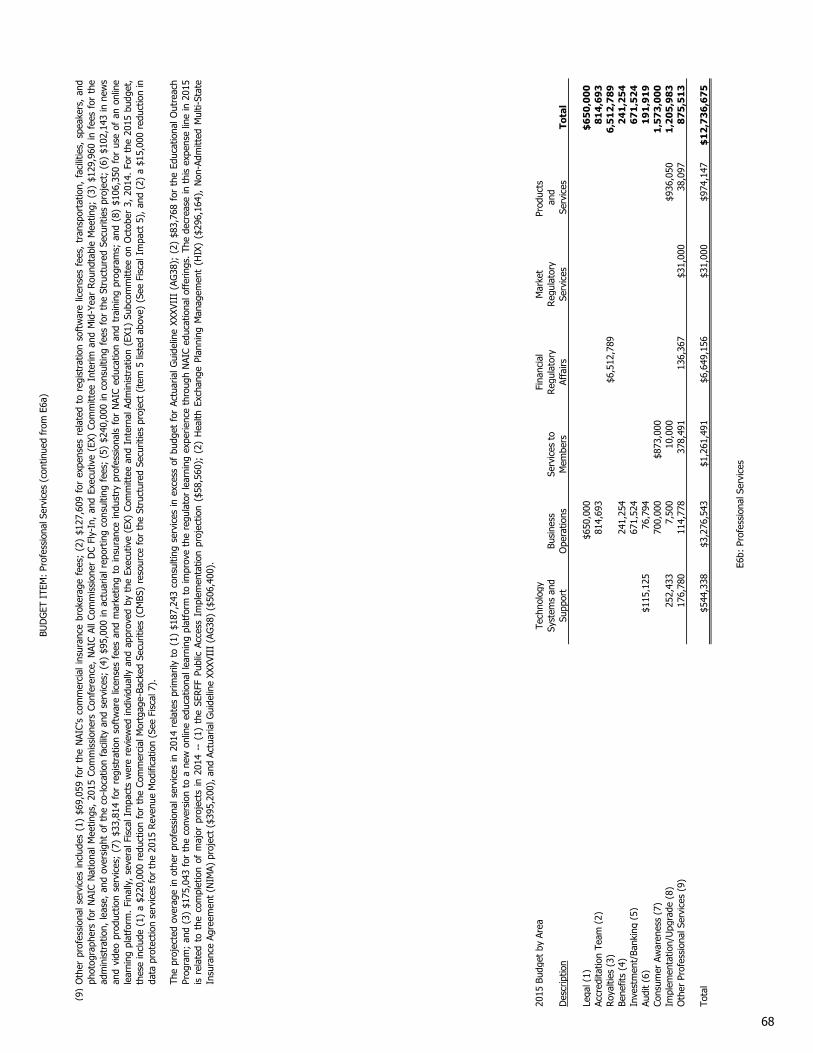
(9)
2015
Bud
get
by A
rea
Tech
nolo
gyFi
nanc
ial
Mar
ket
Prod
ucts
Sy
stem
s an
dBu
sine
ssSe
rvic
es t
oR
egul
ator
yR
egul
ator
yan
dD
escr
iptio
nSu
ppor
tO
pera
tions
Mem
bers
Affa
irsSe
rvic
esSe
rvic
esTo
tal
Lega
l (1)
$650
,000
$6
50
,00
0Ac
cred
itatio
n Te
am (
2)81
4,69
38
14
,69
3R
oyal
ties
(3)
$6,5
12,7
896
,51
2,7
89
Bene
fits
(4)
241,
254
24
1,2
54
Inve
stm
ent/
Bank
ing
(5)
671,
524
67
1,5
24
Audi
t (6
)$1
15,1
2576
,794
19
1,9
19
Cons
umer
Aw
aren
ess
(7)
700,
000
$873
,000
1,5
73
,00
0Im
plem
enta
tion/
Upg
rade
(8)
252,
433
7,50
010
,000
$936
,050
1,2
05
,98
3O
ther
Pro
fess
iona
l Ser
vice
s (9
)17
6,78
011
4,77
837
8,49
113
6,36
7$3
1,00
038
,097
87
5,5
13
Tota
l$5
44,3
38$3
,276
,543
$1,2
61,4
91$6
,649
,156
$31,
000
$974
,147
$1
2,7
36
,67
5
Oth
erpr
ofes
sion
alse
rvic
esin
clud
es(1
)$6
9,05
9fo
rth
eN
AIC’
sco
mm
erci
alin
sura
nce
brok
erag
efe
es;
(2)
$127
,609
for
expe
nses
rela
ted
tore
gist
ratio
nso
ftw
are
licen
ses
fees
,tr
ansp
orta
tion,
faci
litie
s,sp
eake
rs,
and
phot
ogra
pher
sfo
rN
AIC
Nat
iona
lMee
tings
,20
15Co
mm
issi
oner
sCo
nfer
ence
,N
AIC
AllC
omm
issi
oner
DC
Fly-
In,
and
Exec
utiv
e(E
X)Co
mm
ittee
Inte
riman
dM
id-Y
ear
Rou
ndta
ble
Mee
ting;
(3)
$129
,960
infe
esfo
rth
ead
min
istr
atio
n,le
ase,
and
over
sigh
tof
the
co-lo
catio
nfa
cilit
yan
dse
rvic
es;
(4)
$95,
000
inac
tuar
ialr
epor
ting
cons
ultin
gfe
es;
(5)
$240
,000
inco
nsul
ting
fees
for
the
Stru
ctur
edSe
curit
ies
proj
ect;
(6)
$102
,143
inne
ws
and
vide
opr
oduc
tion
serv
ices
;(7
)$3
3,81
4fo
rre
gist
ratio
nso
ftw
are
licen
ses
fees
and
mar
ketin
gto
insu
ranc
ein
dust
rypr
ofes
sion
als
for
NAI
Ced
ucat
ion
and
trai
ning
prog
ram
s;an
d(8
)$1
06,3
50fo
rus
eof
anon
line
lear
ning
plat
form
.Fi
nally
,se
vera
lFis
calI
mpa
cts
wer
ere
view
edin
divi
dual
lyan
dap
prov
edby
the
Exec
utiv
e(E
X)Co
mm
ittee
and
Inte
rnal
Adm
inis
trat
ion
(EX1
)Su
bcom
mitt
eeon
Oct
ober
3,20
14.
For
the
2015
budg
et,
thes
ein
clud
e(1
)a
$220
,000
redu
ctio
nfo
rth
eCo
mm
erci
alM
ortg
age-
Back
edSe
curit
ies
(CM
BS)
reso
urce
for
the
Stru
ctur
edSe
curit
ies
proj
ect
(item
5lis
ted
abov
e)(S
eeFi
scal
Impa
ct5)
,an
d(2
)a
$15,
000
redu
ctio
nin
data
pro
tect
ion
serv
ices
for
the
201
5 R
even
ue M
odifi
catio
n (S
ee F
isca
l 7).
The
proj
ecte
dov
erag
ein
othe
rpr
ofes
sion
alse
rvic
esin
2014
rela
tes
prim
arily
to(1
)$1
87,2
43co
nsul
ting
serv
ices
inex
cess
ofbu
dget
for
Actu
aria
lGui
delin
eXX
XVII
I(A
G38
);(2
)$8
3,76
8fo
rth
eEd
ucat
iona
lOut
reac
hPr
ogra
m;
and
(3)
$175
,043
for
the
conv
ersi
onto
ane
won
line
educ
atio
nall
earn
ing
plat
form
toim
prov
eth
ere
gula
tor
lear
ning
expe
rienc
eth
roug
hN
AIC
educ
atio
nalo
ffer
ings
.Th
ede
crea
sein
this
expe
nse
line
in20
15is
rela
ted
toth
eco
mpl
etio
nof
maj
orpr
ojec
tsin
2014
--(1
)th
eSE
RFF
Publ
icAc
cess
Impl
emen
tatio
npr
ojec
tion
($58
,560
);(2
)H
ealth
Exch
ange
Plan
ning
Man
agem
ent
(HIX
)($
296,
164)
,N
on-A
dmitt
edM
ulti-
Stat
eIn
sura
nce
Agre
emen
t (N
IMA)
pro
ject
($3
95,2
00),
and
Act
uaria
l Gui
delin
e XX
XVII
I (A
G38
) ($
506,
400)
.
BUD
GET
ITE
M:
Prof
essi
onal
Ser
vice
s (c
ontin
ued
from
E6a
)
E6b:
Pro
fess
iona
l Ser
vice
s
68

2013
6/30
/14
12/3
1/14
2014
20
15
Incr
ease
Des
crip
tion
Actu
alAc
tual
Proj
ecte
dBu
dget
Bu
dget
(Dec
reas
e)Pe
rcen
tage
Dat
abas
e N
etw
ork
(1)
$375
,955
$211
,696
$447
,651
$441
,438
$4
79
,30
9$3
7,87
18.
58%
Secu
rity
Dat
a Fe
es (
2)58
9,46
341
7,53
893
8,28
81,
024,
250
1,1
07
,25
083
,000
8.10
%Cr
edit
Card
Fee
s (3
)36
3,86
314
7,54
131
6,15
034
8,01
73
05
,65
2(4
2,36
5)(1
2.17
%)
Oth
er (
4)38
1,23
416
4,24
021
9,93
322
9,66
72
31
,04
91,
382
0.60
%
Tota
l$1
,710
,515
$941
,015
$1,9
22,0
22$2
,043
,372
$2
,12
3,2
60
$79,
888
3.91
%
(1) (2)
(3)
(4)
2015
Bud
get
by A
rea
Tech
nolo
gyFi
nanc
ial
Mar
ket
Prod
ucts
Sy
stem
s an
dBu
sine
ssSe
rvic
es t
oR
egul
ator
yR
egul
ator
yan
dD
escr
iptio
nSu
ppor
tO
pera
tions
Mem
bers
Affa
irsSe
rvic
esSe
rvic
esTo
tal
Dat
abas
e N
etw
ork
(1)
$479
,309
$4
79
,30
9Se
curit
y D
ata
Fees
(2)
$1,0
99,7
50$7
,500
1,1
07
,25
0Cr
edit
Card
Fee
s (3
)$1
6,34
9$5
0,78
727
,434
1,97
3$2
09,1
093
05
,65
2O
ther
(4)
65,6
6426
,768
9,87
012
8,74
72
31
,04
9
Tota
l$4
79,3
09$8
2,01
3$7
7,55
5$1
,137
,054
$9,4
73$3
37,8
56$
2,1
23
,26
0
BUD
GET
ITE
M:
Com
pute
r Se
rvic
es
Cred
itca
rdfe
esin
clud
ech
arge
sfr
omve
ndor
san
dba
nks
tose
ttle
NAI
Ccu
stom
ercr
edit
card
tran
sact
ions
and
depo
sit
fund
sin
the
NAI
Cba
nkac
coun
t.Th
eun
der
budg
etpe
rfor
man
cein
2014
rela
tes
totr
ansa
ctio
nsbe
ing
proc
esse
d th
roug
h N
IPR
rat
her
than
SBS
and
a d
ecre
ase
in t
he u
se o
f cr
edit
card
s to
pay
dat
abas
e fil
ing
fees
. The
201
5 bu
dget
rec
ogni
zes
the
cont
inua
tion
of t
hese
tre
nds.
Oth
erco
mpu
ter
serv
ices
incl
uded
inth
e20
15bu
dget
repr
esen
t:(1
)th
eco
stof
outs
ourc
ing
the
prep
arat
ion
ofN
AIC’
spa
yrol
l($6
3,41
4);
(2)
fees
for
proc
essi
ngon
line
regi
stra
tions
for
natio
nalm
eetin
gs($
12,4
74);
(3)
fees
for
the
use
ofa
libra
ryca
talo
ging
serv
ice
($13
,965
);(4
)Co
mm
ittee
onU
nifo
rmSe
curit
ies
Iden
tific
atio
nPr
oced
ures
(CU
SIP)
and
Inte
rnat
iona
lSec
uriti
esId
entif
icat
ion
Dire
ctor
y(I
SID
)ro
yalty
paym
ents
($10
3,95
3);
and
(5)
FOLI
O r
oyal
ty p
aym
ents
($2
4,79
4). T
he I
SID
and
FO
LIO
roy
altie
s ar
e pa
id a
s a
resu
lt of
NAI
C sa
les
of p
rodu
cts
that
leve
rage
CU
SIP,
ISI
D, a
nd F
OLI
O d
ata
and/
or t
echn
olog
y.
E7:
Com
pute
r Se
rvic
es
Secu
ritie
s da
ta f
eeds
rep
rese
nts
the
purc
hase
of
NR
SRO
rat
ings
and
sec
urity
dat
a fe
eds
used
to
prod
uce
SVO
des
igna
tions
for
NR
SRO
-rat
ed s
ecur
ities
, inc
ludi
ng m
unic
ipal
bon
d pr
icin
g, c
orpo
rate
bon
d pr
icin
g,
Bloo
mbe
rg, a
nd M
oody
’s. T
hese
dat
a fe
eds
are
also
use
d to
pop
ulat
e th
e AV
S da
taba
se w
ith N
RSR
O r
atin
gs f
or u
se b
y AV
S cu
stom
ers
in p
repa
ring
cert
ain
inve
stm
ent
sche
dule
s. T
he d
ecre
ase
in 2
014
spen
ding
is t
he
resu
lt of
del
ays
in p
urch
asin
g fin
anci
al m
odel
ing
soft
war
e fo
r th
e St
ruct
ured
Sec
uriti
es G
roup
. Thi
s so
ftw
are
was
bud
gete
d fo
r a
full
year
but
not
pla
ced
in s
ervi
ce u
ntil
May
. Add
ition
al d
ata
feed
s w
ill b
e pu
rcha
sed
in
2015
to
furt
her
the
effic
ienc
ies
of t
he S
VO.
Dat
abas
eN
etw
ork
expe
nses
incl
ude
(1)
Inte
rnet
conn
ectiv
ity($
68,6
23);
(2)
New
York
and
Was
hing
ton,
D.C
.of
fice
circ
uits
and
back
ups
toth
eKa
nsas
City
offic
e($
129,
090)
;(3
)w
irele
ssde
vice
s($
133,
994)
;an
d(4
)da
talin
eci
rcui
tsfo
rda
tare
plic
atio
nan
dne
twor
ksy
nchr
oniz
atio
nbe
twee
nth
eN
AIC’
sco
-loca
tion
site
and
allt
hree
NAI
CO
ffic
e's
($13
3,13
7).
The
incr
ease
inne
twor
kex
pens
esfo
r20
14an
d20
15is
base
don
ast
rate
gyto
elim
inat
e si
ngle
poi
nts
of f
ailu
re in
the
cor
e ne
twor
k.
Item
Des
crip
tion:
Fees
paid
toou
tsid
epr
ovid
ers
for
com
pute
rpr
oces
sing
,pa
yrol
lpro
cess
ing,
cred
itca
rdpr
oces
sing
,ev
ent
regi
stra
tions
for
natio
nalm
eetin
gsan
ded
ucat
ion
prog
ram
s,an
dse
curit
yda
tafe
eds
from
ratin
gag
enci
es.
69

70
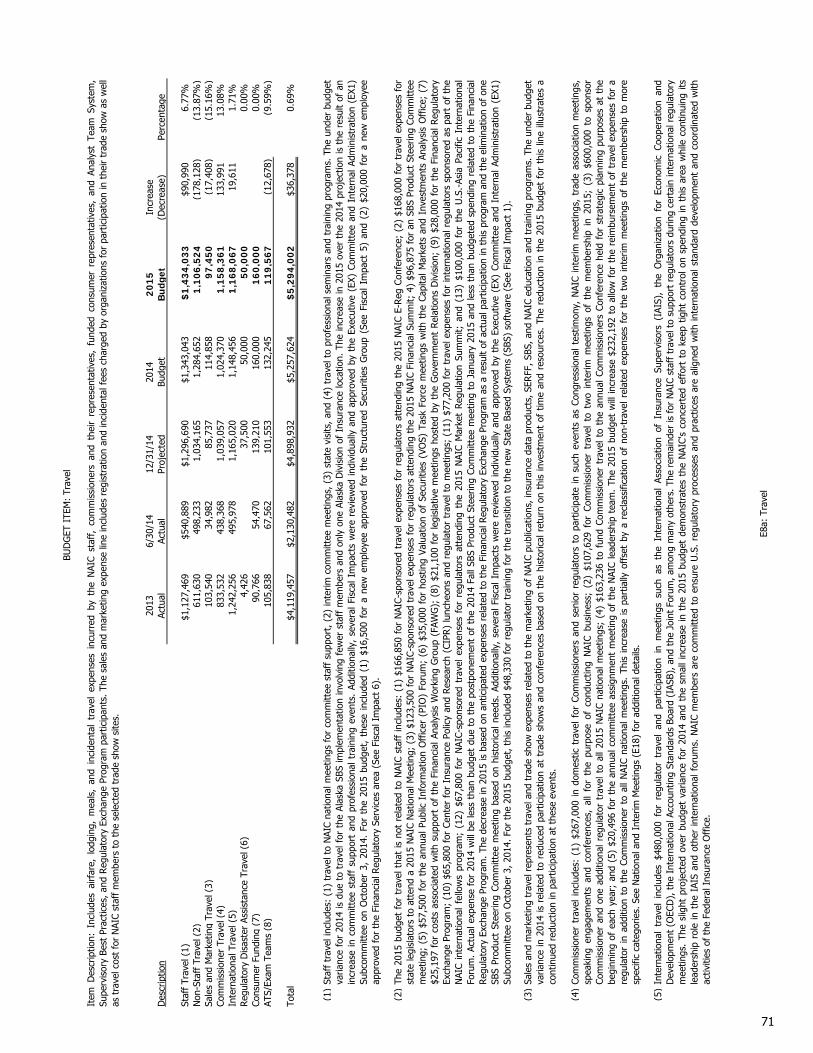
2013
6/30
/14
12/3
1/14
2014
20
15
Incr
ease
Des
crip
tion
Actu
alAc
tual
Proj
ecte
dBu
dget
Bu
dget
(Dec
reas
e)Pe
rcen
tage
Staf
f Tr
avel
(1)
$1,1
27,4
69$5
40,8
89$1
,296
,690
$1,3
43,0
43$
1,4
34
,03
3$9
0,99
06.
77%
Non
-Sta
ff T
rave
l (2)
611,
630
498,
233
1,03
4,16
51,
284,
652
1,1
06
,52
4(1
78,1
28)
(13.
87%
)Sa
les
and
Mar
ketin
g Tr
avel
(3)
103,
540
34,9
8285
,737
114,
858
97
,45
0(1
7,40
8)(1
5.16
%)
Com
mis
sion
er T
rave
l (4)
833,
532
438,
368
1,03
9,05
71,
024,
370
1,1
58
,36
113
3,99
113
.08%
Inte
rnat
iona
l Tra
vel (
5)1,
242,
256
495,
978
1,16
5,02
01,
148,
456
1,1
68
,06
719
,611
1.71
%R
egul
ator
y D
isas
ter
Assi
stan
ce T
rave
l (6)
4,42
637
,500
50,0
005
0,0
00
0.00
%Co
nsum
er F
undi
ng (
7)90
,766
54,4
7013
9,21
016
0,00
01
60
,00
00.
00%
ATS/
Exam
Tea
ms
(8)
105,
838
67,5
6210
1,55
313
2,24
51
19
,56
7(1
2,67
8)(9
.59%
)
Tota
l$4
,119
,457
$2,1
30,4
82$4
,898
,932
$5,2
57,6
24$
5,2
94
,00
2$3
6,37
80.
69%
(1)
(2)
(3)
(4)
(5)
BUD
GET
ITE
M:
Trav
el
The
2015
budg
etfo
rtr
avel
that
isno
tre
late
dto
NAI
Cst
aff
incl
udes
:(1
)$1
66,8
50fo
rN
AIC-
spon
sore
dtr
avel
expe
nses
for
regu
lato
rsat
tend
ing
the
2015
NAI
CE-
Reg
Conf
eren
ce;
(2)
$168
,000
for
trav
elex
pens
esfo
rst
ate
legi
slat
ors
toat
tend
a20
15N
AIC
Nat
iona
lMee
ting;
(3)
$123
,500
for
NAI
C-sp
onso
red
trav
elex
pens
esfo
rre
gula
tors
atte
ndin
gth
e20
15N
AIC
Fina
ncia
lSum
mit;
4)$9
6,87
5fo
ran
SBS
Prod
uct
Stee
ring
Com
mitt
eem
eetin
g;(5
)$5
7,50
0fo
rth
ean
nual
Publ
icIn
form
atio
nO
ffic
er(P
IO)
Foru
m;
(6)
$35,
000
for
host
ing
Valu
atio
nof
Secu
ritie
s(V
OS)
Task
Forc
em
eetin
gsw
ithth
eCa
pita
lMar
kets
and
Inve
stm
ents
Anal
ysis
Off
ice;
(7)
$25,
197
for
cost
sas
soci
ated
with
supp
ort
ofth
eFi
nanc
ialA
naly
sis
Wor
king
Gro
up(F
AWG
);(8
)$2
1,10
0fo
rle
gisl
ativ
em
eetin
gsho
sted
byth
eG
over
nmen
tR
elat
ions
Div
isio
n;(9
)$2
8,00
0fo
rth
eFi
nanc
ialR
egul
ator
yEx
chan
gePr
ogra
m;
(10)
$65,
800
for
Cent
erfo
rIn
sura
nce
Polic
yan
dR
esea
rch
(CIP
R)
lunc
heon
san
dre
gula
tor
trav
elto
mee
tings
;(1
1)$7
7,20
0fo
rtr
avel
expe
nses
for
inte
rnat
iona
lreg
ulat
ors
spon
sore
das
part
ofth
eN
AIC
inte
rnat
iona
lfe
llow
spr
ogra
m;
(12)
$67,
800
for
NAI
C-sp
onso
red
trav
elex
pens
esfo
rre
gula
tors
atte
ndin
gth
e20
15N
AIC
Mar
ket
Reg
ulat
ion
Sum
mit;
and
(13)
$100
,000
for
the
U.S
.-As
iaPa
cific
Inte
rnat
iona
lFo
rum
.Ac
tual
expe
nse
for
2014
will
bele
ssth
anbu
dget
due
toth
epo
stpo
nem
ent
ofth
e20
14Fa
llSB
SPr
oduc
tSt
eerin
gCo
mm
ittee
mee
ting
toJa
nuar
y20
15an
dle
ssth
anbu
dget
edsp
endi
ngre
late
dto
the
Fina
ncia
lR
egul
ator
yEx
chan
gePr
ogra
m.
The
decr
ease
in20
15is
base
don
antic
ipat
edex
pens
esre
late
dto
the
Fina
ncia
lReg
ulat
ory
Exch
ange
Prog
ram
asa
resu
ltof
actu
alpa
rtic
ipat
ion
inth
ispr
ogra
man
dth
eel
imin
atio
nof
one
SBS
Prod
uct
Stee
ring
Com
mitt
eem
eetin
gba
sed
onhi
stor
ical
need
s.Ad
ditio
nally
,se
vera
lFis
calI
mpa
cts
wer
ere
view
edin
divi
dual
lyan
dap
prov
edby
the
Exec
utiv
e(E
X)Co
mm
ittee
and
Inte
rnal
Adm
inis
trat
ion
(EX1
)Su
bcom
mitt
ee o
n O
ctob
er 3
, 201
4. F
or t
he 2
015
budg
et, t
his
incl
uded
$48
,330
for
reg
ulat
or t
rain
ing
for
the
tran
sitio
n to
the
new
Sta
te B
ased
Sys
tem
s (S
BS)
soft
war
e (S
ee F
isca
l Im
pact
1).
Sale
s an
d m
arke
ting
trav
el r
epre
sent
s tr
avel
and
tra
de s
how
exp
ense
s re
late
d to
the
mar
ketin
g of
NAI
C pu
blic
atio
ns, i
nsur
ance
dat
a pr
oduc
ts, S
ERFF
, SBS
, and
NAI
C ed
ucat
ion
and
trai
ning
pro
gram
s. T
he u
nder
bud
get
varia
nce
in20
14is
rela
ted
tore
duce
dpa
rtic
ipat
ion
attr
ade
show
san
dco
nfer
ence
sba
sed
onth
ehi
stor
ical
retu
rnon
this
inve
stm
ent
oftim
ean
dre
sour
ces.
The
redu
ctio
nin
the
2015
budg
etfo
rth
islin
eill
ustr
ates
aco
ntin
ued
redu
ctio
n in
par
ticip
atio
n at
the
se e
vent
s.
Inte
rnat
iona
ltr
avel
incl
udes
$480
,000
for
regu
lato
rtr
avel
and
part
icip
atio
nin
mee
tings
such
asth
eIn
tern
atio
nal
Asso
ciat
ion
ofIn
sura
nce
Supe
rvis
ors
(IAI
S),
the
Org
aniz
atio
nfo
rEc
onom
icCo
oper
atio
nan
dD
evel
opm
ent
(OEC
D),
the
Inte
rnat
iona
lAcc
ount
ing
Stan
dard
sBo
ard
(IAS
B),a
ndth
eJo
int
Foru
m,a
mon
gm
any
othe
rs.T
here
mai
nder
isfo
rN
AIC
staf
ftr
avel
tosu
ppor
tre
gula
tors
durin
gce
rtai
nin
tern
atio
nalr
egul
ator
ym
eetin
gs.
The
slig
htpr
ojec
ted
over
budg
etva
rianc
efo
r20
14an
dth
esm
alli
ncre
ase
inth
e20
15bu
dget
dem
onst
rate
sth
eN
AIC'
sco
ncer
ted
effo
rtto
keep
tight
cont
rolo
nsp
endi
ngin
this
area
whi
leco
ntin
uing
itsle
ader
ship
role
inth
eIA
ISan
dot
her
inte
rnat
iona
lfor
ums.
NAI
Cm
embe
rsar
eco
mm
itted
toen
sure
U.S
.re
gula
tory
proc
esse
san
dpr
actic
esar
eal
igne
dw
ithin
tern
atio
nals
tand
ard
deve
lopm
ent
and
coor
dina
ted
with
activ
ities
of
the
Fede
ral I
nsur
ance
Off
ice.
E8a:
Tra
vel
Com
mis
sion
ertr
avel
incl
udes
:(1
)$2
67,0
00in
dom
estic
trav
elfo
rCo
mm
issi
oner
san
dse
nior
regu
lato
rsto
part
icip
ate
insu
chev
ents
asCo
ngre
ssio
nal
test
imon
y,N
AIC
inte
rimm
eetin
gs,
trad
eas
soci
atio
nm
eetin
gs,
spea
king
enga
gem
ents
and
conf
eren
ces,
all
for
the
purp
ose
ofco
nduc
ting
NAI
Cbu
sine
ss;
(2)
$107
,629
for
Com
mis
sion
ertr
avel
totw
oin
terim
mee
tings
ofth
em
embe
rshi
pin
2015
;(3
)$6
00,0
00to
spon
sor
Com
mis
sion
eran
don
ead
ditio
nalr
egul
ator
trav
elto
all2
015
NAI
Cna
tiona
lmee
tings
;(4
)$1
63,2
36to
fund
Com
mis
sion
ertr
avel
toth
ean
nual
Com
mis
sion
ers
Conf
eren
cehe
ldfo
rst
rate
gic
plan
ning
purp
oses
atth
ebe
ginn
ing
ofea
chye
ar;
and
(5)
$20,
496
for
the
annu
alco
mm
ittee
assi
gnm
ent
mee
ting
ofth
eN
AIC
lead
ersh
ipte
am.
The
2015
budg
etw
illin
crea
se$2
32,1
92to
allo
wfo
rth
ere
imbu
rsem
ent
oftr
avel
expe
nses
for
are
gula
tor
inad
ditio
nto
the
Com
mis
sion
erto
allN
AIC
natio
nalm
eetin
gs.
This
incr
ease
ispa
rtia
llyof
fset
bya
recl
assi
ficat
ion
ofno
n-tr
avel
rela
ted
expe
nses
for
the
two
inte
rimm
eetin
gsof
the
mem
bers
hip
tom
ore
spec
ific
cate
gorie
s. S
ee N
atio
nal a
nd I
nter
im M
eetin
gs (
E18)
for
add
ition
al d
etai
ls.
Staf
ftr
avel
incl
udes
:(1
)tr
avel
toN
AIC
natio
nalm
eetin
gsfo
rco
mm
ittee
staf
fsu
ppor
t,(2
)in
terim
com
mitt
eem
eetin
gs,
(3)
stat
evi
sits
,an
d(4
)tr
avel
topr
ofes
sion
alse
min
ars
and
trai
ning
prog
ram
s.Th
eun
der
budg
etva
rianc
efo
r20
14is
due
totr
avel
for
the
Alas
kaSB
Sim
plem
enta
tion
invo
lvin
gfe
wer
staf
fm
embe
rsan
don
lyon
eAl
aska
Div
isio
nof
Insu
ranc
elo
catio
n.Th
ein
crea
sein
2015
over
the
2014
proj
ectio
nis
the
resu
ltof
anin
crea
sein
com
mitt
eest
aff
supp
ort
and
prof
essi
onal
trai
ning
even
ts.
Addi
tiona
lly,
seve
ralF
isca
lIm
pact
sw
ere
revi
ewed
indi
vidu
ally
and
appr
oved
byth
eEx
ecut
ive
(EX)
Com
mitt
eean
dIn
tern
alAd
min
istr
atio
n(E
X1)
Subc
omm
ittee
onO
ctob
er3,
2014
.Fo
rth
e20
15bu
dget
,th
ese
incl
uded
(1)
$16,
500
for
ane
wem
ploy
eeap
prov
edfo
rth
eSt
ruct
ured
Secu
ritie
sG
roup
(See
Fisc
alIm
pact
5)an
d(2
)$2
0,00
0fo
ra
new
empl
oyee
appr
oved
for
the
Fin
anci
al R
egul
ator
y Se
rvic
es a
rea
(See
Fis
cal I
mpa
ct 6
).
Item
Des
crip
tion:
Incl
udes
airf
are,
lodg
ing,
mea
ls,
and
inci
dent
altr
avel
expe
nses
incu
rred
byth
eN
AIC
staf
f,co
mm
issi
oner
san
dth
eir
repr
esen
tativ
es,
fund
edco
nsum
erre
pres
enta
tives
,an
dAn
alys
tTe
amSy
stem
,Su
perv
isor
yBe
stPr
actic
es,
and
Reg
ulat
ory
Exch
ange
Prog
ram
part
icip
ants
.Th
esa
les
and
mar
ketin
gex
pens
elin
ein
clud
esre
gist
ratio
nan
din
cide
ntal
fees
char
ged
byor
gani
zatio
nsfo
rpa
rtic
ipat
ion
inth
eir
trad
esh
owas
wel
las
tra
vel c
ost
for
NAI
C st
aff
mem
bers
to
the
sele
cted
tra
de s
how
site
s.
71

(6)
(7)
(8)
2015
Bud
get
by A
rea
Tech
nolo
gyFi
nanc
ial
Mar
ket
Prod
ucts
Sy
stem
s an
dBu
sine
ssSe
rvic
es t
oR
egul
ator
yR
egul
ator
yan
dD
escr
iptio
nSu
ppor
tO
pera
tions
Mem
bers
Affa
irsSe
rvic
esSe
rvic
esTo
tal
Staf
f Tr
avel
(1)
$99,
626
$286
,495
$291
,932
$414
,075
$219
,529
$122
,376
$1
,43
4,0
33
Non
-Sta
ff T
rave
l (2)
300
186,
600
173,
635
287,
807
136,
978
321,
204
1,1
06
,52
4Sa
les
and
Mar
ketin
g Tr
avel
(3)
3,26
294
,188
97
,45
0Co
mm
issi
oner
Tra
vel (
4)88
7,49
627
0,86
51
,15
8,3
61
Inte
rnat
iona
l Tra
vel (
5)55
0,00
025
2,96
732
4,70
040
,400
1,1
68
,06
7R
egul
ator
y D
isas
ter
Assi
stan
ce T
rave
l (6)
50,0
005
0,0
00
Cons
umer
Fun
ding
(7)
160,
000
16
0,0
00
ATS/
Exam
Tea
ms
(8)
119,
567
11
9,5
67
Tota
l$9
9,92
6$1
,960
,591
$992
,661
$1,1
46,1
49$5
56,9
07$5
37,7
68$
5,2
94
,00
2
The
cons
umer
fund
ing
budg
etis
allo
cate
dfo
rth
eN
AIC'
sfu
nded
cons
umer
repr
esen
tativ
esto
atte
ndna
tiona
lmee
tings
,par
ticip
ate
inN
AIC
conf
eren
ceca
lls,
and
pay
for
the
NAI
CCo
nsum
erBo
ard
ofTr
uste
eslu
nche
on.
The
2014
proj
ectio
nis
near
ly$2
1,00
0un
der
budg
etdu
eto
sche
dule
conf
licts
and
resi
gnat
ions
.In
2014
anad
ditio
nal$
40,0
00w
asad
ded
toth
eor
igin
al$1
20,0
00pr
ogra
mbu
dget
toco
ver
inte
rnat
iona
ltra
vel.
The
budg
et r
emai
ns a
t th
is le
vel f
or 2
015.
E8b:
Tra
vel
Actu
alex
pens
efo
rre
gula
tory
disa
ster
assi
stan
cetr
avel
repr
esen
tstr
avel
fund
ing
for
volu
ntee
rre
gula
tors
tosu
ppor
tdi
sast
erre
lief
effo
rts
that
may
occu
rin
the
latt
erha
lfof
2014
.Li
keth
e20
14bu
dget
,th
e20
15bu
dget
incl
udes
$50
,000
to
ensu
re n
eeds
of
this
nat
ure
will
be
met
, sho
uld
they
aris
e.
Anal
yst
Team
Syst
em(A
TS)
expe
nses
($55
,100
)re
pres
ent:
(1)
trav
elan
dtr
ansp
orta
tion
expe
nses
for
upto
17st
ate
regu
lato
rsto
part
icip
ate
intw
ose
ssio
nsof
the
annu
alAT
Spr
ojec
t;(2
)sa
larie
spa
idfo
rre
gula
tors
from
thos
est
ates
that
requ
iresa
lary
reim
burs
emen
tfo
ran
alys
tpa
rtic
ipat
ion
inth
ispr
ogra
m;
and
(3)
am
inor
amou
ntof
mis
cella
neou
sex
pens
esto
supp
ort
the
proj
ect.
Part
icip
atin
gre
gula
tor
sala
ries
are
reim
burs
edat
ara
teno
tto
exce
edth
eSe
nior
Insu
ranc
eEx
amin
erCF
Era
te.
The
varia
nce
in20
14is
rela
ted
to:
(1)
the
early
com
plet
ion
ofth
epr
ojec
t;(2
)on
epa
rtic
ipan
tw
aslo
cals
ono
trav
elco
sts
wer
ein
curr
ed;
and
(3)
anun
antic
ipat
ed in
crea
se in
the
num
ber
of p
artic
ipan
ts e
lect
ing
to r
emai
n in
Kan
sas
City
ove
r th
e w
eeke
nd r
athe
r th
an t
rave
ling
hom
e. T
he h
isto
rical
occ
urre
nce
of t
hese
sav
ings
has
bee
n fa
ctor
ed in
to
the
2015
bud
get.
This
expe
nse
line
also
incl
udes
the
Supe
rvis
ory
Best
Prac
tices
Prog
ram
for
Ris
k-Fo
cuse
dEx
ams
($46
,300
).Ap
prov
edin
the
2012
budg
et,
this
prog
ram
incl
udes
trav
elfo
rst
ate
exam
iner
sto
the
NAI
CCe
ntra
lOff
ice
inKa
nsas
City
to
part
icip
ate
in t
his
prog
ram
.
BUD
GET
ITE
M:
Trav
el (
cont
inue
d fr
om E
8a)
72

Item
Des
crip
tion:
Inc
lude
s al
l ren
t, b
uild
ing
oper
atin
g ex
pens
es, m
aint
enan
ce f
ees,
cle
anin
g, a
nd w
areh
ouse
sto
rage
fee
s in
curr
ed b
y al
l NAI
C of
fices
.
2013
6/30
/14
12/3
1/14
2014
20
15
Incr
ease
Des
crip
tion
Actu
alAc
tual
Proj
ecte
dBu
dget
Bu
dget
(Dec
reas
e)Pe
rcen
tage
Ren
t (1
)$2
,139
,862
$1,4
40,5
99$2
,787
,214
$2,7
99,1
48$
2,5
99
,81
9($
199,
330)
(7.1
2%)
Util
ities
& P
arki
ng (
2)61
5,41
837
8,02
784
2,04
665
8,06
57
39
,10
581
,040
12.3
1%W
areh
ouse
30,6
339,
782
22,3
8226
,604
23
,40
6(3
,198
)(1
2.02
%)
Tota
l$2
,785
,913
$1,8
28,4
08$3
,651
,642
$3,4
83,8
17$
3,3
62
,33
0($
121,
488)
(3.4
9%)
(1)
(2)
2015
Bud
get
by A
rea
Tech
nolo
gyFi
nanc
ial
Mar
ket
Prod
ucts
Sy
stem
s an
dBu
sine
ssSe
rvic
es t
oR
egul
ator
yR
egul
ator
yan
dD
escr
iptio
nSu
ppor
tO
pera
tions
Mem
bers
Affa
irsSe
rvic
esSe
rvic
esTo
tal
Ren
t (1
)$7
88$1
,032
,049
$777
,990
$777
,992
$300
$10,
700
$2
,59
9,8
19
Util
ities
& P
arki
ng (
2)30
059
6,50
993
,096
47,7
001,
500
73
9,1
05
War
ehou
se14
,916
8,49
02
3,4
06
Tota
l$1
6,00
4$1
,628
,558
$871
,086
$825
,692
$1,8
00$1
9,19
0$
3,3
62
,33
0
Inac
cord
ance
with
Gen
eral
lyAc
cept
edAc
coun
ting
Prin
cipl
es(G
AAP)
,th
eto
tal
cost
ofea
chle
ase
isre
cord
edas
expe
nse
even
lyth
roug
hout
the
life
ofth
ele
ase.
The
annu
albu
dget
for
rent
expe
nse
isde
rived
byca
lcul
atin
gth
eto
talc
ost
ofth
ele
ase,
incl
udin
gsc
hedu
led
incr
ease
sin
rent
alpa
ymen
ts,a
nddi
vidi
ngby
the
num
ber
ofye
ars
cove
red
byth
ele
ase.
Addi
tiona
lren
tch
arge
sfo
rco
mm
onar
eam
aint
enan
cean
dre
ales
tate
taxe
s ar
e re
cord
ed a
s in
curr
ed a
nd in
add
ition
to
the
cont
ract
ual r
ent
expe
nse.
E9:
Occ
upan
cy
Base
rent
for
the
Cent
ralO
ffic
ein
Kans
asCi
ty,
MO
atTo
wn
Pavi
lion
is$1
75,2
17m
onth
lyfo
r13
1,57
6re
ntab
lesq
uare
feet
($15
.98
per
squa
refo
ot),
with
ale
ase
expi
ratio
nof
Febr
uary
2024
.Th
ele
ase
atTo
wn
Pavi
lion
also
incl
udes
ince
ntiv
eal
low
ance
s,w
hich
reim
burs
edth
eN
AIC
for
leas
ehol
dim
prov
emen
ts,
furn
iture
and
equi
pmen
tan
da
base
rent
diff
eren
tial.
Gen
eral
lyAc
cept
edAc
coun
ting
Prin
cipl
es(G
AAP)
requ
ireth
atle
aseh
old
ince
ntiv
e al
low
ance
s be
rec
orde
d on
the
bal
ance
she
et a
nd a
mor
tized
aga
inst
ren
t ex
pens
e ov
er t
he li
fe o
f th
e le
ase
(12
year
s). T
his
ince
ntiv
e al
low
ance
red
uces
the
bas
e re
nt a
mou
nt b
y $9
4,07
8 pe
r m
onth
.
The
over
age
in20
14is
rela
ted
tout
ility
chan
ges
exce
edin
gex
pect
atio
nsfo
rth
efir
stye
arof
the
leas
efo
rth
eN
AIC
Cent
ral
Off
ices
inKa
nsas
City
.Ad
ditio
nally
ther
eis
aon
etim
ech
arge
in20
14to
adju
stpa
rkin
gex
pens
e in
acc
orda
nce
with
Gen
eral
ly A
ccep
ted
Acco
untin
g Pr
inci
ples
(G
AAP)
. The
incr
ease
in t
he 2
015
budg
et is
the
res
ult
of in
crea
sed
utili
ty c
osts
for
the
NAI
C Ce
ntra
l Off
ices
in K
ansa
s Ci
ty.
Base
rent
for
Capi
talM
arke
ts&
Inve
stm
ent
Anal
ysis
Off
ice
inN
ewYo
rkCi
ty,
NY
is$6
3,99
1m
onth
lyfo
r18
,844
rent
able
squa
refe
et($
40.7
5pe
rsq
uare
foot
aver
age)
,w
itha
leas
eex
pira
tion
ofJu
ne20
27.
With
the
expi
ratio
nof
the
prio
rle
ase
at48
Wal
lStr
eet
inJu
ly20
14,
the
Exec
utiv
e(E
X)Co
mm
ittee
and
Inte
rnal
Adm
inis
trat
ion
(EX1
)Su
bcom
mitt
eeap
prov
edth
ere
loca
tion
ofth
eCa
pita
lMar
kets
and
Inve
stm
ent
Anal
ysis
Off
ice
to O
ne N
ew Y
ork
Plaz
a. T
he t
erm
of
this
leas
e is
just
ove
r 13
yea
rs, e
ndin
g Ju
ne 3
0, 2
027.
Toac
com
mod
ate
the
cons
truc
tion
ofth
ene
wCa
pita
lMar
kets
and
Inve
stm
ents
Anal
ysis
Off
ice
inea
rly20
14it
was
nece
ssar
yfo
rth
eN
AIC
topa
yre
ntfo
rtw
olo
catio
ns;
the
exis
ting
offic
eat
48W
allS
tree
tan
dth
eof
fice
unde
r co
nstr
uctio
n at
One
New
Yor
k Pl
aza.
Thi
s du
plic
atio
n of
ren
t ex
pens
e w
ill n
ot r
ecur
in 2
015.
Base
rent
for
the
Exec
utiv
eO
ffic
ein
Was
hing
ton,
D.C
.in
the
Hal
lof
the
Stat
esis
$64,
723
mon
thly
for
11,5
12re
ntab
lesq
uare
feet
($67
.47
per
squa
refo
ot).
Asa
resu
ltof
the
expi
ratio
nof
the
prio
rle
ase
with
Hal
lof
the
Stat
esin
Janu
ary
2014
,the
Exec
utiv
e(E
X)Co
mm
ittee
and
Inte
rnal
Adm
inis
trat
ion
(EX1
)Su
bcom
mitt
eeap
prov
edth
ene
gotia
tion
ofa
leas
eto
rem
ain
inth
eex
istin
gbu
ildin
g,bu
tw
ithen
hanc
emen
tsto
the
floor
plan
toin
crea
se u
sabl
e sq
uare
foo
tage
. The
leas
e te
rm is
10
year
s be
ginn
ing
Febr
uary
1, 2
014
and
endi
ng o
n Ja
nuar
y 31
, 202
4.
BUD
GET
ITE
M:
Occ
upan
cy
73

74

Item
Des
crip
tion:
Ren
tal a
nd m
aint
enan
ce f
ees
for
offic
e eq
uipm
ent,
har
dwar
e, a
nd s
oftw
are,
incl
udin
g pe
rson
al c
ompu
ters
, prin
ters
, cop
iers
, etc
.
2013
6/30
/14
12/3
1/14
2014
20
15
Incr
ease
Des
crip
tion
Actu
alAc
tual
Proj
ecte
dBu
dget
Bu
dget
(Dec
reas
e)Pe
rcen
tage
Equi
pmen
t R
enta
l (1)
$180
,031
$70,
490
$138
,278
$143
,677
$1
33
,22
7($
10,4
50)
(7.2
7%)
Nat
iona
l Mee
ting
Equi
pmen
t R
enta
l (2)
2,84
03,
452
5,85
31
5,4
55
9,60
216
4.05
%Eq
uipm
ent,
Har
dwar
e &
Sof
twar
e M
aint
enan
ce (
3)2,
680,
748
1,41
1,22
72,
900,
054
2,82
4,47
42
,98
5,2
84
160,
810
5.69
%
Tota
l$2
,863
,619
$1,4
81,7
17$3
,041
,784
$2,9
74,0
04$
3,1
33
,96
6$1
59,9
625.
38%
(1)
(2) (3)
2015
Bud
get
by A
rea
Tech
nolo
gyFi
nanc
ial
Mar
ket
Prod
ucts
Sy
stem
s an
dBu
sine
ssSe
rvic
es t
oR
egul
ator
yR
egul
ator
yan
dD
escr
iptio
nSu
ppor
tO
pera
tions
Mem
bers
Affa
irsSe
rvic
esSe
rvic
esTo
tal
Equi
pmen
t R
enta
l (1)
$65,
439
$63,
888
$3,9
00$
13
3,2
27
Nat
iona
l Mee
ting
Equi
pmen
t R
enta
l (2)
$15,
455
15
,45
5Eq
uipm
ent,
Har
dwar
e &
Sof
twar
e M
aint
enan
ce (
3)2,
834,
488
144,
856
5,94
02
,98
5,2
84
Tota
l$2
,899
,927
$208
,744
$15,
455
$9,8
40$
3,1
33
,96
6
E10:
Equ
ipm
ent
Ren
tal a
nd M
aint
enan
ce
The
decr
ease
inna
tiona
lmee
ting
equi
pmen
tre
ntal
cost
sin
2014
rela
tes
tosa
ving
sat
the
NAI
C20
14Sp
ring
Nat
iona
lMee
ting.
The
rent
alof
regi
stra
tion
coun
ters
was
less
expe
nsiv
eth
anth
equ
ote
rece
ived
durin
gth
ebu
dget
proc
ess.
The
decr
ease
in20
14is
also
rela
ted
toth
eSp
ring
Nat
iona
lMee
ting.
The
hote
ldid
not
char
gefo
rth
eus
eof
regi
stra
tion
coun
ters
.A
conv
entio
nce
nter
will
beus
eddu
ring
the
NAI
C20
15Sp
ring
Nat
iona
lM
eetin
g, r
esul
ting
in in
crea
sed
rent
al c
osts
.
Equi
pmen
t,ha
rdw
are
and
soft
war
em
aint
enan
cein
clud
esm
aint
enan
ceon
hard
war
e,so
ftw
are,
and
othe
req
uipm
ent
owne
dor
rent
edby
the
NAI
C.Th
eN
AIC
gene
rally
secu
res
mai
nten
ance
and
serv
ice
agre
emen
tson
the
offic
eeq
uipm
ent,
hard
war
e,an
dso
ftw
are
that
have
exce
eded
the
initi
alw
arra
nty
perio
dw
hen
the
cost
and
risk
ofeq
uipm
ent
failu
res
exce
eds
the
cost
ofth
ese
rvic
eag
reem
ent.
Exam
ples
ofsu
chin
clud
epr
inte
rs,
com
pute
rha
rdw
are
(e.g
.,ro
uter
s,sw
itche
s,se
rver
s,et
c.)
and
supp
ort
agre
emen
tsfo
rhe
avily
used
soft
war
epr
oduc
ts,
amon
got
hers
.Th
eov
erbu
dget
varia
nce
in20
14,
whi
chco
ntin
ues
in20
15,
isdi
rect
lydu
eto
the
elim
inat
ion
offa
vora
ble
pric
ing
disc
ount
sby
am
ajor
soft
war
esu
pplie
ran
dth
eex
pans
ion
ofau
dio
visu
alca
pabi
litie
sw
ithth
eco
nstr
uctio
nof
thre
ene
wle
aseh
olds
inth
epa
sttw
oye
ars.
Thes
ein
crea
ses
are
part
ially
offs
et b
y sa
ving
s re
late
d to
the
mig
ratio
n to
a n
ew f
ront
-end
web
ser
ver
envi
ronm
ent.
BUD
GET
ITE
M:
Equi
pmen
t R
enta
l and
Mai
nten
ance
Equi
pmen
tre
ntal
incl
udes
the
cost
tore
ntco
pier
sfo
rth
eN
AIC
copy
cent
ers,
cert
ain
com
pute
req
uipm
ent,
leas
edso
ftw
are,
and
othe
rre
ntal
sw
here
aca
pita
lpu
rcha
seis
not
asco
stef
fect
ive.
The
unde
rbu
dget
varia
nce
in20
14an
dth
ere
duct
ion
ofex
pens
ein
2015
isre
late
dto
the
elim
inat
ion
ofco
pier
rent
alw
ithth
em
ove
ofth
eCa
pita
lMar
kets
and
Inve
stm
ent
Anal
ysis
Off
ice
toO
neN
ewYo
rkPl
aza.
Copy
ing
will
bedo
neon
mul
ti-fu
nctio
n pr
inte
rs a
t th
e ne
w lo
catio
n.
75

76

2013
6/30
/14
12/3
1/14
2014
20
15
Incr
ease
Des
crip
tion
Actu
alAc
tual
Proj
ecte
dBu
dget
Bu
dget
(Dec
reas
e)Pe
rcen
tage
Dep
reci
atio
n (1
)$2
,590
,181
$1,3
21,7
42$2
,463
,749
$2,6
90,6
77$
2,3
69
,38
9($
321,
288)
(11.
94%
)Am
ortiz
atio
n (2
) 1,
396,
002
768,
460
1,54
0,65
41,
543,
657
1,5
74
,41
830
,761
1.99
%
Tota
l$3
,986
,183
$2,0
90,2
02$4
,004
,403
$4,2
34,3
34$
3,9
43
,80
7($
290,
527)
(6.8
6%)
(1)
(2)
See
Exhi
bit
E11-
One
for
a li
st o
f pr
opos
ed c
apita
l pur
chas
es a
nd E
xhib
it E1
1-Tw
o fo
r de
taile
d in
form
atio
n on
pur
chas
es w
ith a
uni
t co
st o
f $2
5,00
0 or
gre
ater
.
Dep
reci
atio
nis
calc
ulat
edon
ast
raig
ht-li
neba
sis
over
the
usef
ullif
eof
capi
tala
sset
sow
ned
byth
eN
AIC,
whi
chis
five
year
sfo
rfu
rnitu
rean
deq
uipm
ent,
and
thre
eye
ars
for
com
pute
rha
rdw
are
and
soft
war
e.Th
eam
ount
ofde
prec
iatio
nex
pens
ein
agi
ven
year
isre
late
dto
the
purc
hase
ofca
pita
las
sets
inth
ecu
rren
tan
dpr
eced
ing
year
s.Th
ede
crea
sein
budg
eted
depr
ecia
tion
expe
nse
in20
15is
dire
ctly
attr
ibut
edto
the
amou
ntan
dtim
ing
ofca
pita
lpur
chas
es.
Ove
rth
epa
stfe
wye
ars,
the
NAI
Cha
sbe
enim
plem
entin
ga
stra
tegy
tom
igra
teto
asu
bsta
ntia
llym
ore
cost
effe
ctiv
ew
ebse
rver
oper
atin
gsy
stem
and
hard
war
epl
atfo
rmto
miti
gate
the
fut
ure
subs
tant
ially
neg
ativ
e fin
anci
al im
pact
of
the
prio
r fr
amew
ork.
The
se c
ost
savi
ngs
are
evid
ent
in t
he d
ecre
ases
in d
epre
ciat
ion
expe
nse
from
201
3 to
201
5.
Amor
tizat
ion
isal
soco
mpu
ted
ona
stra
ight
-line
basi
sfo
rth
ose
capi
taliz
edas
sets
such
asle
aseh
old
impr
ovem
ents
and
cons
ultin
gse
rvic
eson
maj
orco
mpu
ter
appl
icat
ion
proj
ects
and
syst
emup
grad
es.
The
usef
ulliv
esof
thes
eas
sets
are
appr
oxim
atel
yte
nye
ars,
but
are
assi
gned
tosp
ecifi
cas
sets
base
don
each
asse
t’sus
eful
life.
The
incr
ease
begi
nnin
gin
2014
isdi
rect
lyat
trib
uted
toth
eN
AIC
Exec
utiv
eH
eadq
uart
ers
Off
ice
and
Capi
tal M
arke
ts a
nd A
naly
sis
Off
ice
reno
vatio
ns in
late
201
3 an
d ea
rly 2
014.
Item
Des
crip
tion:
Inc
lude
s de
prec
iatio
n fo
r al
l fur
nitu
re a
nd e
quip
men
t ow
ned
as o
f Ju
ne 3
0, 2
014,
with
pro
ject
ed p
urch
ases
thr
ough
Dec
embe
r 31
, 201
4, a
nd d
epre
ciat
ion
for
budg
eted
201
5 ca
pita
l out
lays
.
BUD
GET
ITE
M:
Dep
reci
atio
n an
d Am
ortiz
atio
n
Anad
ditio
nal$
8,64
6in
amor
tizat
ion
expe
nse
for
cons
ultin
gse
rvic
esis
incl
uded
inth
e20
15bu
dget
for
the
Enha
nced
Supp
ort
for
Mem
ber
Use
ofEl
ectr
onic
Wor
kpap
ers
(See
Fisc
alIm
pact
6).T
his
Fisc
alIm
pact
,pl
ussi
xm
ore
wer
ere
view
edin
divi
dual
lyan
dap
prov
edby
the
Exec
utiv
e(E
X)Co
mm
ittee
and
Inte
rnal
Adm
inis
trat
ion
(EX1
)Su
bcom
mitt
eeon
Oct
ober
3,20
14.
Two
syst
emup
grad
es,
incl
uded
as20
15fis
cali
mpa
cts,
incl
ude
sign
ifica
ntca
pita
lcon
sulti
ngre
ques
tsth
atw
illno
tbe
gin
toam
ortiz
eun
tilth
ese
upda
ted
syst
ems
are
plac
edin
serv
ice
insu
bseq
uent
year
s-
(1)
Stat
eBa
sed
Syst
ems
(SBS
)So
ftw
are
Enha
ncem
ent
and
Tech
nolo
gyCo
mpl
ianc
e In
itiat
ive
- Ph
ase
III
($2,
846,
028,
See
Fis
cal I
mpa
ct 1
) an
d (2
) Se
curit
ies
Syst
em R
ewrit
e (S
SR)
- Ex
pand
ed P
hase
I (
$490
,599
, See
Fis
cal I
mpa
ct 2
).
E11a
: D
epre
ciat
ion
and
Amor
tizat
ion
The
2015
budg
etin
clud
es$1
8,09
3ad
ditio
nald
epre
ciat
ion
expe
nse
for
com
pute
rha
rdw
are
and
soft
war
efo
rth
e(1
)St
ate
Prod
ucer
Lice
nsin
g(S
PL)
Team
Augm
enta
tion
(See
Fisc
alIm
pact
4)an
d(2
)En
hanc
edSu
ppor
tfo
rM
embe
rU
seof
Elec
tron
icW
orkp
aper
s(S
eeFi
scal
Impa
ct6)
.Fis
calI
mpa
cts
wer
ere
view
edin
divi
dual
lyan
dap
prov
edby
the
Exec
utiv
e(E
X)Co
mm
ittee
and
Inte
rnal
Adm
inis
trat
ion
(EX1
)Su
bcom
mitt
eeon
Oct
ober
3,20
14.
77
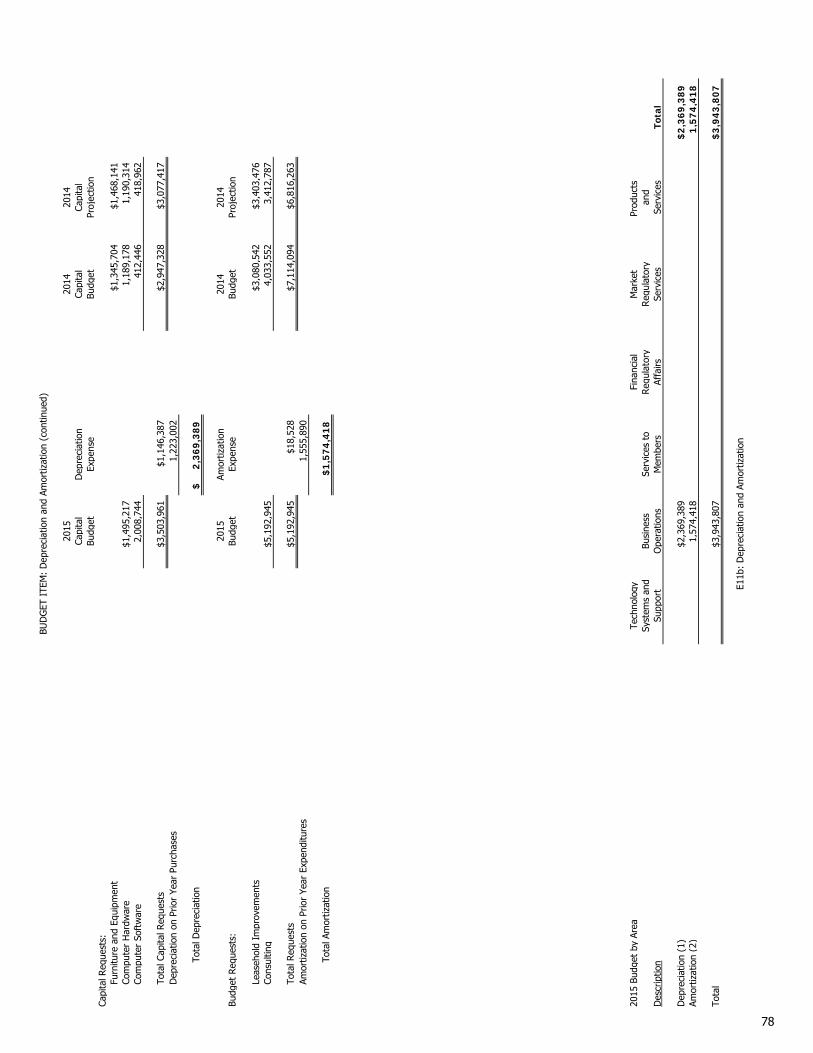
2015
2014
2014
Capi
tal
Dep
reci
atio
nCa
pita
lCa
pita
lBu
dget
Expe
nse
Budg
etPr
ojec
tion
Capi
tal R
eque
sts:
Furn
iture
and
Equ
ipm
ent
$1,3
45,7
04$1
,468
,141
Com
pute
r H
ardw
are
$1,4
95,2
171,
189,
178
1,19
0,31
4Co
mpu
ter
Soft
war
e2,
008,
744
412,
446
418,
962
Tota
l Cap
ital R
eque
sts
$3,5
03,9
61$1
,146
,387
$2,9
47,3
28$3
,077
,417
Dep
reci
atio
n on
Prio
r Ye
ar P
urch
ases
1,22
3,00
2
Tota
l Dep
reci
atio
n2
,36
9,3
89
$
2015
Amor
tizat
ion
2014
2014
Budg
et R
eque
sts:
Budg
etEx
pens
eBu
dget
Proj
ectio
n
Leas
ehol
d Im
prov
emen
ts$3
,080
,542
$3,4
03,4
76Co
nsul
ting
$5,1
92,9
454,
033,
552
3,41
2,78
7
Tota
l Req
uest
s$5
,192
,945
$18,
528
$7,1
14,0
94$6
,816
,263
Amor
tizat
ion
on P
rior
Year
Exp
endi
ture
s1,
555,
890
Tota
l Am
ortiz
atio
n$
1,5
74
,41
8
2015
Bud
get
by A
rea
Tech
nolo
gyFi
nanc
ial
Mar
ket
Prod
ucts
Sy
stem
s an
dBu
sine
ssSe
rvic
es t
oR
egul
ator
yR
egul
ator
yan
dD
escr
iptio
nSu
ppor
tO
pera
tions
Mem
bers
Affa
irsSe
rvic
esSe
rvic
esTo
tal
Dep
reci
atio
n (1
)$2
,369
,389
$2
,36
9,3
89
Amor
tizat
ion
(2)
1,57
4,41
81
,57
4,4
18
Tota
l$3
,943
,807
$3
,94
3,8
07
BUD
GET
ITE
M:
Dep
reci
atio
n an
d Am
ortiz
atio
n (c
ontin
ued)
E11b
: D
epre
ciat
ion
and
Amor
tizat
ion
78

D
escr
iptio
nQ
tyCo
stTo
tal
Qty
Cost
Tota
lQ
tyCo
stTo
tal
Tota
l Cos
t
Flas
h St
orag
e So
lutio
n1
$410
,000
$410
,000
$410
,000
SPL
Appl
icat
ion
Serv
ers
3$9
,748
29,2
4429
,244
Linu
x Vi
rtua
lizat
ion
Gro
wth
3$9
,748
29,2
4429
,244
APC
Rack
s2
$4,5
409,
080
9,08
0Re
plac
emen
t of
Exc
hang
e Se
rver
s3
$10,
000
30,0
0030
,000
Core
Inf
rast
ruct
ure
Phys
ical
Ser
ver
Refr
esh
3$5
,500
16,5
0016
,500
Cent
ral O
ffic
e 36
TB D
isk
Back
up A
pplia
nce
6$3
1,01
318
6,07
818
6,07
8Co
-Loc
atio
n 40
TB D
isk
Back
up A
pplia
nce
1$4
8,59
248
,592
48,5
92Co
-Loc
atio
n Re
dund
ant
Core
Sw
itch
1$1
33,0
5513
3,05
513
3,05
5Ci
sco
Nex
t G
ener
atio
n Fi
rew
all U
pgra
de4
$47,
440
189,
760
189,
760
Cisc
o N
etw
ork
Switc
hes
Repl
acem
ent
7$1
0,07
570
,525
70,5
25D
MZ
Refr
esh-
Cisc
o N
exus
224
8 Sw
itche
s7
$5,8
5040
,950
40,9
50U
pgra
de M
PLS
Rout
er1
$2,6
952,
695
2,69
5Lo
g-Rh
ythy
m A
pplia
nce
Refr
esh
1$2
2,24
022
,240
22,2
40M
obile
Rou
ter
1$9
,900
9,90
09,
900
Smar
t Bo
ard
1$1
0,28
110
,281
10,2
81La
ptop
s11
$1,1
0012
,100
12,1
00N
atio
nal M
eetin
g iP
ads
70$7
2951
,030
51,0
30N
atio
nal M
eetin
g La
ptop
s30
$1,1
0033
,000
33,0
00PC
for
201
5 Ro
llout
5$9
504,
750
4,75
0Ci
sco
UCS
612
0 U
pgra
des
4$2
0,88
083
,520
83,5
20Co
lor
Mul
ti-Fu
nctio
n Pr
inte
r1
$9,5
009,
500
9,50
0Co
lor
Mul
ti-Fu
nctio
n Pr
inte
r2
$5,1
0010
,200
10,2
00N
etw
ork
Prin
ter
4$3
,800
15,2
0015
,200
Mob
ile V
ideo
Uni
t 1
$5,7
735,
773
5,77
3Se
rver
Bla
des/
Stor
age-
Fisc
al 6
2$1
6,00
032
,000
32,0
00O
racl
e D
atab
ase
Lice
nse
1$1
,552
,848
$1,5
52,8
481,
552,
848
Ora
cle
Man
agem
ent
Tool
s1
$8,9
388,
938
8,93
8Se
curit
y In
fras
truc
ture
Exp
ansi
on1
$140
,963
140,
963
140,
963
Shar
ePoi
nt 2
013
Upg
rade
2
$7,6
4515
,290
15,2
90W
indo
ws
Serv
er 2
012
Dat
a Ce
nter
18$5
,874
105,
732
105,
732
SQL
Serv
er S
tand
ard
Core
Lic
ense
s8
$3,4
2127
,368
27,3
68Ba
ckup
App
lianc
es (
DAS
D)
Lice
nses
3$7
,414
22,2
4222
,242
Com
plia
nce
Soft
war
e1
$50,
000
50,0
0050
,000
Met
alog
ix S
tora
gePo
int
for
Shar
ePoi
nt1
$8,3
538,
353
8,35
3G
imm
al U
pgra
de t
o 50
0 se
ats
1$4
4,21
044
,210
44,2
10H
P U
nifie
d Fu
nctio
nal T
estin
g Li
cens
e-Fi
scal
41
$11,
550
11,5
5011
,550
HP
Qua
lity
Cont
rol L
icen
se-F
isca
l 41
$3,1
093,
109
3,10
9VM
War
e Li
cens
e-Fi
scal
62
$6,9
9013
,980
13,9
80Sy
man
tec
Lice
nse-
Fisc
al 6
1$4
,161
4,16
14,
161
Hum
an R
esou
rces
Inf
orm
atio
n Sy
stem
Upg
rade
1$1
85,2
70$1
85,2
7018
5,27
0Se
curit
ies
Syst
ems
Rew
rite
(Pha
se I
)1
$1,6
71,0
481,
671,
048
1,67
1,04
8St
ate
Base
d Sy
stem
s (S
BS)
Rew
rite
Phas
e II
I-Fi
scal
11
$2,8
46,0
282,
846,
028
2,84
6,02
8Se
curit
ies
Syst
ems
Rew
rite
(Ext
ende
d Ph
ase
I)-F
isca
l 21
$490
,599
490,
599
490,
599
$1,4
95,2
172,
008,
744
$
5,19
2,94
5$
$8
,696
,906
2015
Cap
ital
Exp
endi
ture
s
Com
pute
r H
ardw
are
Com
pute
r So
ftw
are
Con
sult
ing
Exhibit E11-One
79

80

2015 Proposed Capital Expenditures Unit Cost $25,000 or Greater
Maintenance of the NAIC technology infrastructure falls into four primary categories (1) cost or labor saving; (2) high availability or disaster recovery; (3) useful life; and (4) technology trend. A technology trend is a project that would better utilize an existing resource or to address a current issue. Consulting costs may be incurred in the development of software code for major systems with a life greater than one year.
Cost or Labor Saving
• Oracle Database License ($1,552,848) – The NAIC began using Oracle database products in 1997. Over the last 18 years many other Oracle products have been purchased to complement the database environment or add additional functionality in other areas of the organization. Major initiatives in 2013 and 2014 resulted in the migration of two key areas away from Oracle products, returning the environments to a database only solution. Oracle’s business practices revolve around maintenance contracts, and although the NAIC has had minor increases in cost each year of 3%, the accumulated impact over 18 years has produced an annual Oracle maintenance renewal of $637,854. By purchasing the licenses required for the database at an estimated cost of $1,552,848 the annual maintenance costs will drop to $341,627. Assuming the same 3% annual increase in maintenance costs would continue the combined annual savings will exceed the capital purchase in five years and would continue indefinetly.
• Compliance Software ($50,000) – This represents the cost to purchase an automated solution for IT governance, risk, and compliance (GRC). Such a product gives the NAIC the ability to manage internal security and regulatory compliance policies and procedures that support the unique security and compliance goals related to exchanging information with states and the federal government (e.g., the healthcare exchange initiative SSP, SSAE 16 SOC 1, etc.). Solutions such as this include templates based on common frameworks that would allow the NAIC to implement a comprehensive security program that addresses multiple regulatory compliance and internal policy frameworks. NAIC is obligated to refresh the complete SSP developed for the healthcare exchange every three years.
High Availability or Disaster Recovery
• Cisco Next-Gen Firewall Upgrade ($189,760) – This provides for the purchase of two pairs of highly available network firewalls to increase aggregate bandwidth between the web servers and the database servers. The current firewalls are limited to 1.2 Gbps of throughput, which is often achieved during monthly backups of the web servers. The Next-Gen firewalls are rated at 10 Gbps and also have two 10 Gbps network ports that would allow for maximum throughput when connected to existing Nexus 7010 switches in the core network. These devices have redundant power supplies to eliminate down time due to a failed power supply.
• Redundant Core Switch for Co-Location ($133,055) – This provides for the purchase of a redundant Cisco Nexus 7004 switch for the Co-Location facility. This switch will increase network uptime and minimize network outages by adding redundant paths between the
Exhibit E11-Two
81

distribution switches and the core switch engines in an active/active configuration. Without this device a core switch failure would be a catastrophic event that would impact all traffic in and out of the Co-Location facility.
Useful Life
• Six 36TB Disk Backup Appliance – Central Office ($186,078)/One 40TB Disk Backup Appliance - Co-Location ($48,592) – In 2011, the NAIC upgraded from a tape based enterprise backup solution to a disk based solution. This purchase is the refresh of the backup hardware appliances. These devices replicate for disaster recovery, eliminating the need for new off-site tape storage. In 2013, NAIC purchased new disk backup appliances for the remote offices and the new models cannot replicate with NAIC legacy backup appliances, forcing an interim solution to replicate data between the remote offices and the central office/co-location for disaster recovery. In 2014, one appliance was purchased for the co-location to accommodate the remote office backup. This purchase will complete the compatibility across all locations and devices.
Technology Trend
• Flash Storage Solution ($410,000) – Flash storage is a high performance low latency solution that has been an emerging technology for several years. In 2013, many of the flash storage offerings became fully mature products with enterprise level offerings. These offerings have the potential to significantly boost performance and decrease the run times for large data refreshes. This solution will primarily benefit the NAIC/NIPR database environments with additional capacity being leveraged for virtualized servers and desktops. Overall this solution will provide 12 usable TBs of space. Data moved to this solution will free up the same amount of storage on existing arrays to provide for the 2015 non-database growth of the NAIC/NIPR/CIPR environments.
• Gimmal Information Governance Suite Upgrade to 500 Seats ($44,210) – In 2014,
the NAIC purchased 250 seats of Gimmal for a phased approach implementation. This software provides the NAIC with enhancements to the SharePoint electronic records management system, giving it Department of Defense Certification, rules-based classification of records, automated metadata assignment, and enhanced search tools. This purchase will complete the implementation, replacing the current paper records system.
• Security Infrastructure Expansion ($140,963) – NetIQ Access and Identity products
were deployed in 2013 as the security infrastructure for the NAIC and NIPR. These products are licensed based on the number of active production users stored in the enterprise user (e.g. LDAP) repository. In 2015, the NAIC will begin the migration of the SERFF application into this same security infrastructure. This purchase will license an additional 25,000 users for the NetIQ products to compensate for the additional SERFF users as well as annual growth in the NAIC’s user base.
Consulting
• Human Resource Information System (HRIS) Upgrade ($185,270) – The 2014 budget included funding to modernize and upgrade the human resources management and
Exhibit E11-Two
82
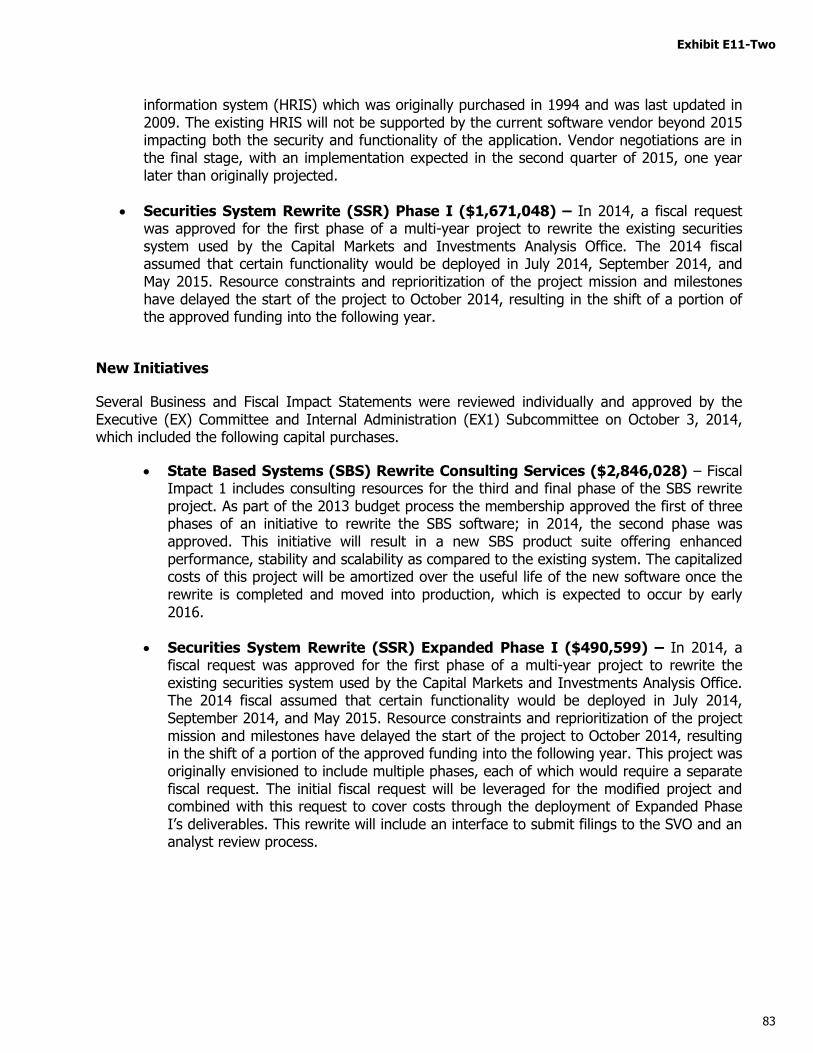
information system (HRIS) which was originally purchased in 1994 and was last updated in 2009. The existing HRIS will not be supported by the current software vendor beyond 2015 impacting both the security and functionality of the application. Vendor negotiations are in the final stage, with an implementation expected in the second quarter of 2015, one year later than originally projected.
• Securities System Rewrite (SSR) Phase I ($1,671,048) – In 2014, a fiscal request was approved for the first phase of a multi-year project to rewrite the existing securities system used by the Capital Markets and Investments Analysis Office. The 2014 fiscal assumed that certain functionality would be deployed in July 2014, September 2014, and May 2015. Resource constraints and reprioritization of the project mission and milestones have delayed the start of the project to October 2014, resulting in the shift of a portion of the approved funding into the following year.
New Initiatives
Several Business and Fiscal Impact Statements were reviewed individually and approved by the Executive (EX) Committee and Internal Administration (EX1) Subcommittee on October 3, 2014, which included the following capital purchases.
• State Based Systems (SBS) Rewrite Consulting Services ($2,846,028) – Fiscal Impact 1 includes consulting resources for the third and final phase of the SBS rewrite project. As part of the 2013 budget process the membership approved the first of three phases of an initiative to rewrite the SBS software; in 2014, the second phase was approved. This initiative will result in a new SBS product suite offering enhanced performance, stability and scalability as compared to the existing system. The capitalized costs of this project will be amortized over the useful life of the new software once the rewrite is completed and moved into production, which is expected to occur by early 2016.
• Securities System Rewrite (SSR) Expanded Phase I ($490,599) – In 2014, a fiscal request was approved for the first phase of a multi-year project to rewrite the existing securities system used by the Capital Markets and Investments Analysis Office. The 2014 fiscal assumed that certain functionality would be deployed in July 2014, September 2014, and May 2015. Resource constraints and reprioritization of the project mission and milestones have delayed the start of the project to October 2014, resulting in the shift of a portion of the approved funding into the following year. This project was originally envisioned to include multiple phases, each of which would require a separate fiscal request. The initial fiscal request will be leveraged for the modified project and combined with this request to cover costs through the deployment of Expanded Phase I’s deliverables. This rewrite will include an interface to submit filings to the SVO and an analyst review process.
Exhibit E11-Two
83

84
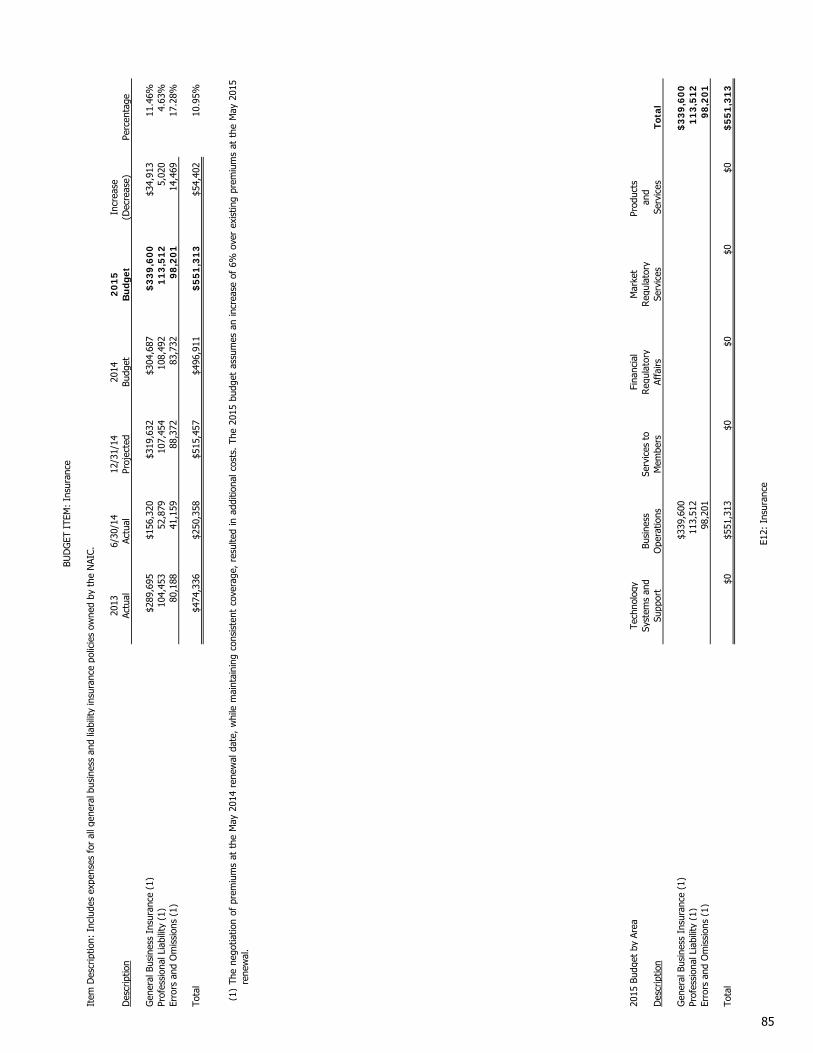
Item
Des
crip
tion:
Inc
lude
s ex
pens
es f
or a
ll ge
nera
l bus
ines
s an
d lia
bilit
y in
sura
nce
polic
ies
owne
d by
the
NAI
C.
2013
6/30
/14
12/3
1/14
2014
20
15
Incr
ease
Des
crip
tion
Actu
alAc
tual
Proj
ecte
dBu
dget
Bu
dget
(Dec
reas
e)Pe
rcen
tage
Gen
eral
Bus
ines
s In
sura
nce
(1)
$289
,695
$156
,320
$319
,632
$304
,687
$3
39
,60
0$3
4,91
311
.46%
Prof
essi
onal
Lia
bilit
y (1
)10
4,45
352
,879
107,
454
108,
492
11
3,5
12
5,02
04.
63%
Erro
rs a
nd O
mis
sion
s (1
)80
,188
41,1
5988
,372
83,7
329
8,2
01
14,4
6917
.28%
Tota
l$4
74,3
36$2
50,3
58$5
15,4
57$4
96,9
11$
55
1,3
13
$54,
402
10.9
5%
(1)
2015
Bud
get
by A
rea
Tech
nolo
gyFi
nanc
ial
Mar
ket
Prod
ucts
Sy
stem
s an
dBu
sine
ssSe
rvic
es t
oR
egul
ator
yR
egul
ator
yan
dD
escr
iptio
nSu
ppor
tO
pera
tions
Mem
bers
Affa
irsSe
rvic
esSe
rvic
esTo
tal
Gen
eral
Bus
ines
s In
sura
nce
(1)
$339
,600
$3
39
,60
0Pr
ofes
sion
al L
iabi
lity
(1)
113,
512
11
3,5
12
Erro
rs a
nd O
mis
sion
s (1
)98
,201
98
,20
1
Tota
l$0
$551
,313
$0$0
$0$0
$5
51
,31
3
E12:
Ins
uran
ce
The
nego
tiatio
nof
prem
ium
sat
the
May
2014
rene
wal
date
,w
hile
mai
ntai
ning
cons
iste
ntco
vera
ge,
resu
lted
inad
ditio
nalc
osts
.Th
e20
15bu
dget
assu
mes
anin
crea
seof
6%ov
erex
istin
gpr
emiu
ms
atth
eM
ay20
15re
new
al.
BUD
GET
ITE
M:
Insu
ranc
e
85

86
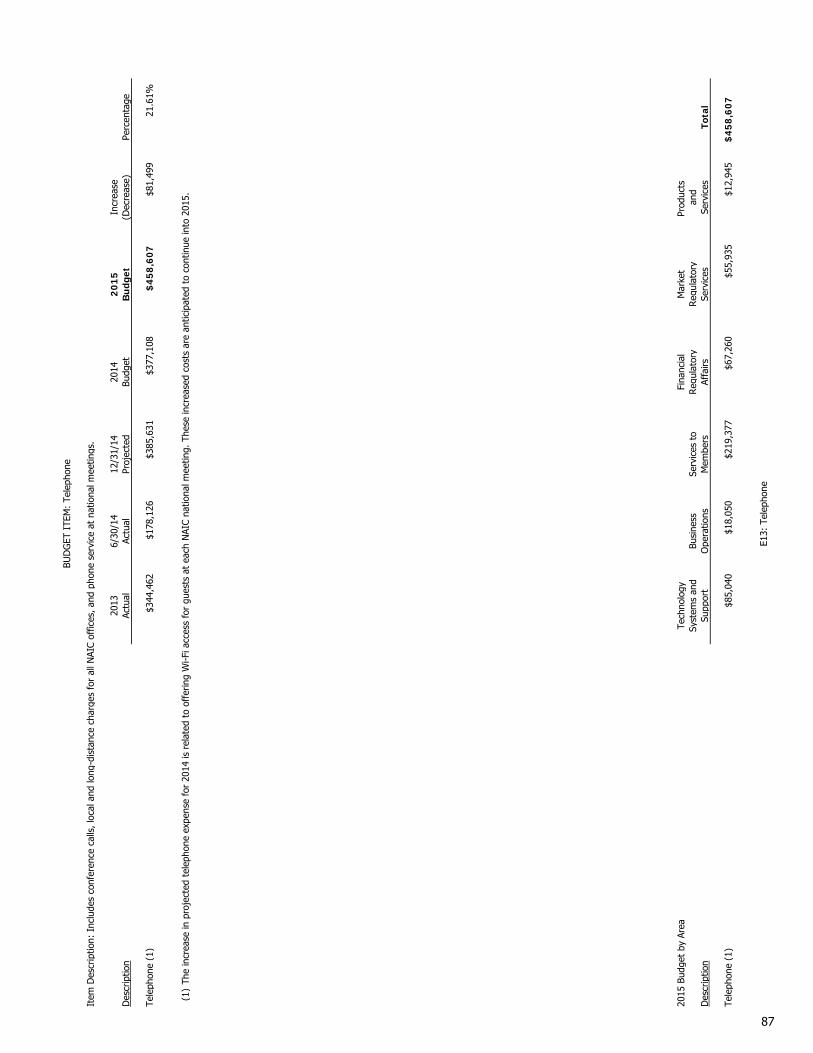
Item
Des
crip
tion:
Inc
lude
s co
nfer
ence
cal
ls, l
ocal
and
long
-dis
tanc
e ch
arge
s fo
r al
l NAI
C of
fices
, and
pho
ne s
ervi
ce a
t na
tiona
l mee
tings
.
2013
6/30
/14
12/3
1/14
2014
20
15
Incr
ease
Des
crip
tion
Actu
alAc
tual
Proj
ecte
dBu
dget
Bu
dget
(Dec
reas
e)Pe
rcen
tage
Tele
phon
e (1
)$3
44,4
62$1
78,1
26$3
85,6
31$3
77,1
08$
45
8,6
07
$81,
499
21.6
1%
(1)
2015
Bud
get
by A
rea
Tech
nolo
gyFi
nanc
ial
Mar
ket
Prod
ucts
Sy
stem
s an
dBu
sine
ssSe
rvic
es t
oR
egul
ator
yR
egul
ator
yan
dD
escr
iptio
nSu
ppor
tO
pera
tions
Mem
bers
Affa
irsSe
rvic
esSe
rvic
esTo
tal
Tele
phon
e (1
)$8
5,04
0$1
8,05
0$2
19,3
77$6
7,26
0$5
5,93
5$1
2,94
5$
45
8,6
07
E13:
Tel
epho
ne
BUD
GET
ITE
M:
Tele
phon
e
The
incr
ease
in p
roje
cted
tel
epho
ne e
xpen
se f
or 2
014
is r
elat
ed t
o of
ferin
g W
i-Fi a
cces
s fo
r gu
ests
at
each
NAI
C na
tiona
l mee
ting.
The
se in
crea
sed
cost
s ar
e an
ticip
ated
to
cont
inue
into
201
5.
87

88

2013
6/30
/14
12/3
1/14
2014
20
15
Incr
ease
Des
crip
tion
Actu
alAc
tual
Proj
ecte
dBu
dget
Bu
dget
(Dec
reas
e)Pe
rcen
tage
Copi
er S
uppl
ies
(1)
$72,
244
$34,
100
$76,
900
$85,
600
$6
5,4
12
($20
,188
)(2
3.58
%)
Oth
er S
uppl
ies
(2)
241,
826
137,
297
255,
186
238,
604
24
9,9
02
$11,
298
4.74
%N
on-C
apita
l Equ
ipm
ent
(3)
288,
270
220,
542
585,
667
356,
602
38
1,2
18
24,6
166.
90%
Tota
l$6
02,3
40$3
91,9
39$9
17,7
53$6
80,8
06$
69
6,5
32
$15,
726
2.31
%
(1)
(2)
(3)
2015
Bud
get
by A
rea
Tech
nolo
gyFi
nanc
ial
Mar
ket
Prod
ucts
Sy
stem
s an
dBu
sine
ssSe
rvic
es t
oR
egul
ator
yR
egul
ator
yan
dD
escr
iptio
nSu
ppor
tO
pera
tions
Mem
bers
Affa
irsSe
rvic
esSe
rvic
esTo
tal
Copi
er S
uppl
ies
(1)
$65,
412
$6
5,4
12
Oth
er S
uppl
ies
(2)
$95,
406
100,
366
$22,
644
$20,
100
$3,9
65$7
,421
24
9,9
02
Non
-Cap
ital E
quip
men
t (3
)36
1,29
25,
000
5,60
01,
399
7,92
73
81
,21
8
Tota
l$4
56,6
98$1
70,7
78$2
8,24
4$2
1,49
9$3
,965
$15,
348
$6
96
,53
2
Copi
ersu
pplie
sin
clud
espa
per,
tone
r,an
dot
her
supp
lies
need
edby
the
NAI
CCo
pyCe
nter
for
the
prep
arat
ion
ofco
mm
ittee
mat
eria
lsfo
rna
tiona
lan
din
terim
mee
tings
,th
epr
intin
gof
NAI
Cpu
blic
atio
ns,
and
am
ultit
ude
of a
dditi
onal
pro
ject
s.
Item
Des
crip
tion:
Inc
lude
s co
mpu
ter
supp
lies,
cop
y pa
per,
sta
tione
ry, p
erfo
rate
d in
voic
e pa
per,
oth
er s
uppl
ies,
com
pute
r ha
rdw
are
and
soft
war
e, a
nd f
urni
ture
and
equ
ipm
ent
purc
hase
s un
der
$2,0
00.
Oth
ersu
pplie
sin
clud
esm
isce
llane
ous
offic
esu
pplie
ssu
chas
pens
,st
aple
rs,
pape
rcl
ips,
etc.
for
staf
f,in
tern
s,co
nsul
tant
s,an
dte
mpo
rarie
sat
allN
AIC
offic
es.
The
incr
ease
insp
endi
ngin
2014
ispr
imar
ilyre
late
dto
mis
cella
neou
s ca
blin
g an
d ot
her
supp
lies
need
ed f
or t
he c
onst
ruct
ion
of t
he W
ashi
ngto
n, D
.C. a
nd N
ew Y
ork
offic
es. T
he in
crea
se in
the
bud
get
for
2015
is b
ased
on
hist
oric
al s
pend
ing
in t
his
cate
gory
.
Non
-cap
itale
quip
men
tpu
rcha
ses
incl
ude
min
orso
ftw
are
upgr
ades
and
purc
hase
sas
wel
las
min
orof
fice
equi
pmen
tan
dco
mpu
ter
supp
lies
need
edto
furn
ish
staf
fm
embe
rsw
ithth
eto
ols
nece
ssar
yto
com
plet
eth
eir
assi
gned
task
s.Pr
ojec
ted
expe
nse
for
2014
will
exce
edbu
dget
due
toth
epu
rcha
seof
ase
cond
mon
itor
for
wor
ksta
tions
and
offic
es,
mon
itor
arm
exte
nsio
ns,s
it/st
and
units
for
cubi
cles
,and
vario
usot
her
item
sre
late
dto
the
new
Was
hing
ton,
D.C
. and
New
Yor
k of
fices
. The
201
5 bu
dget
will
incr
ease
slig
htly
as
a re
sult
of t
he N
AIC'
s el
ectr
onic
rec
ords
man
agem
ent
initi
ativ
e.
E14:
Sup
plie
s
Addi
tiona
lly,
seve
ralF
isca
lIm
pact
sw
ere
revi
ewed
indi
vidu
ally
and
appr
oved
byth
eEx
ecut
ive
(EX)
Com
mitt
eean
dIn
tern
alAd
min
istr
atio
n(E
X1)
Subc
omm
ittee
onO
ctob
er3,
2014
.Fo
rth
e20
15bu
dget
,th
ese
incl
uded
a re
duct
ion
in c
opie
r su
pplie
s. B
y m
ovin
g to
an
elec
tron
ic o
n-de
man
d m
odel
to
allo
w d
ownl
oadi
ng o
f se
lect
ed p
ublic
atio
ns, c
osts
for
prin
ting
will
dec
line
by $
20,1
88 in
201
5 (S
ee F
isca
l Im
pact
7).
BUD
GET
ITE
M:
Supp
lies
89

90

Item
Des
crip
tion:
Inc
lude
s m
eter
mai
l, U
PS, e
xpre
ss, a
nd o
ther
car
rier
char
ges.
2013
6/30
/14
12/3
1/14
2014
20
15
Incr
ease
Des
crip
tion
Actu
alAc
tual
Proj
ecte
dBu
dget
Bu
dget
(Dec
reas
e)Pe
rcen
tage
Mai
l Ser
vice
s (1
)$2
48,7
30$1
25,0
79$2
34,6
41$2
37,5
11$
22
8,1
22
($9,
389)
(3.9
5%)
(1)
2015
Bud
get
by A
rea
Tech
nolo
gyFi
nanc
ial
Mar
ket
Prod
ucts
Sy
stem
s an
dBu
sine
ssSe
rvic
es t
oR
egul
ator
yR
egul
ator
yan
dD
escr
iptio
nSu
ppor
tO
pera
tions
Mem
bers
Affa
irsSe
rvic
esSe
rvic
esTo
tal
Mai
l Ser
vice
s (1
)$2
,055
$25,
036
$99,
197
$12,
400
$2,9
80$8
6,45
4$
22
8,1
22
BUD
GET
ITE
M:
Mai
l Ser
vice
s
E15:
Mai
l Ser
vice
s
Seve
ralF
isca
lIm
pact
sw
ere
revi
ewed
indi
vidu
ally
and
appr
oved
byth
eEx
ecut
ive
(EX)
Com
mitt
eean
dIn
tern
alAd
min
istr
atio
n(E
X1)
Subc
omm
ittee
onO
ctob
er3,
2014
.Fo
rth
e20
15bu
dget
,th
ese
incl
uded
are
duct
ion
inm
ail
serv
ices
.By
mov
ing
toan
elec
tron
icon
-dem
and
mod
elto
allo
wdo
wnl
oadi
ngof
sele
cted
publ
icat
ions
,co
sts
for
publ
icat
ions
mai
ling
will
decr
ease
by$5
5,81
9in
2015
(See
Fisc
alIm
pact
7).
This
decr
ease
ispa
rtia
llyof
fset
by$2
0,00
0re
late
dto
anin
crea
sein
the
cost
tosh
ipeq
uipm
ent
and
mat
eria
lsto
thre
ena
tiona
lmee
tings
and
the
Com
mis
sion
ers
Conf
eren
cean
dth
efe
esch
arge
dby
the
hote
lto
hand
leth
efr
eigh
ton
ceit
arriv
esat
the
hote
l.Th
ere
mai
ning
incr
ease
isth
ere
sult
ofa
recl
assi
ficat
ion
ofm
eetin
gex
pens
es.
Inor
der
topr
ovid
etr
ansp
aren
cyin
finan
cial
repo
rtin
g,ce
rtai
nre
venu
ean
dex
pens
elin
esar
edi
vide
din
toad
ditio
nal
clas
sific
atio
nson
ceth
eto
tals
pend
ing
inth
atar
eabe
com
esto
ocu
mbe
rsom
eto
mon
itor
easi
ly.
Such
isth
eca
sew
ithth
ean
nual
NAI
CAl
lCom
mis
sion
erD
CFl
y-In
inM
ayan
dth
eEx
ecut
ive
(EX)
Com
mitt
eeIn
terim
Mee
ting
and
AllC
omm
issi
oner
Rou
ndta
ble
held
each
July
.Th
ese
even
tsw
ere
prev
ious
lyco
ded
asa
lum
psu
min
the
inte
rimm
eetin
gsex
pens
elin
esh
own
unde
rN
atio
nala
ndIn
terim
Mee
tings
(E18
).Th
islin
ecu
rren
tlysh
ows
a si
gnifi
cant
red
uctio
n in
the
201
5 bu
dget
.
91

92

Item
Des
crip
tion:
Inc
lude
s co
sts
for
book
s, p
erio
dica
ls, a
nd o
n-lin
e re
fere
nce
serv
ices
.
2013
6/30
/14
12/3
1/14
2014
20
15
Incr
ease
Des
crip
tion
Actu
alAc
tual
Proj
ecte
dBu
dget
Bu
dget
(Dec
reas
e)Pe
rcen
tage
Ref
eren
ce M
ater
ials
(1)
$374
,780
$199
,360
$410
,029
$417
,818
$4
30
,08
8$1
2,27
02.
94%
Perio
dica
ls48
,733
19,3
4538
,617
39,8
203
9,3
93
(427
)(1
.07%
)O
nlin
e R
esea
rchi
ng (
2)15
7,94
886
,792
176,
792
168,
345
16
8,0
42
(303
)(0
.18%
)
Tota
l$5
81,4
61$3
05,4
97$6
25,4
38$6
25,9
83$
63
7,5
23
$11,
540
1.84
%
(1) (2)
2015
Bud
get
by A
rea
Tech
nolo
gyFi
nanc
ial
Mar
ket
Prod
ucts
Sy
stem
s an
dBu
sine
ssSe
rvic
es t
oR
egul
ator
yR
egul
ator
yan
dD
escr
iptio
nSu
ppor
tO
pera
tions
Mem
bers
Affa
irsSe
rvic
esSe
rvic
esTo
tal
Ref
eren
ce M
ater
ials
(1)
$3,8
79$2
0,40
5$6
3,54
8$3
41,0
51$5
00$7
05$
43
0,0
88
Perio
dica
ls36
,098
3,29
53
9,3
93
Onl
ine
Res
earc
hing
(2)
168,
042
16
8,0
42
Tota
l$3
,879
$20,
405
$267
,688
$344
,346
$500
$705
$6
37
,52
3
Onl
ine
rese
arch
ing
incl
udes
serv
ices
such
asW
estla
wan
dLe
xis/
Nex
is,
whi
char
eus
edex
tens
ivel
yby
the
Lega
lDiv
isio
nan
dse
vera
loth
erar
eas
with
inth
eN
AIC.
Use
ofel
ectr
onic
rese
arch
tool
sha
sou
tpac
edbu
dget
in20
14 a
s a
resu
lt of
add
ition
al s
ervi
ces
beco
min
g av
aila
ble
that
aid
in t
he r
esea
rch
of c
ompl
ex a
nd u
niqu
e le
gal m
atte
rs. T
he le
vel o
f us
age
is e
xpec
ted
to s
ubsi
de in
201
5.
E16:
Ref
eren
ce M
ater
ials
BUD
GET
ITE
M:
Ref
eren
ce M
ater
ials
Stat
istic
alre
fere
nce
mat
eria
lsin
clud
ere
fere
nce
sour
ces
onCD
-RO
Man
dsu
bscr
iptio
nse
rvic
esfo
rre
sour
ces
used
inpe
rfor
min
gre
sear
chin
the
NAI
CR
esea
rch
Libr
ary
and
Capi
talM
arke
tsan
dIn
vest
men
tAn
alys
isO
ffic
e.Th
ere
fere
nce
colle
ctio
nis
avi
tals
ourc
eof
up-t
o-da
tein
form
atio
non
insu
ranc
e,bu
sine
ss,
finan
ce,
and
tech
nolo
gy-r
elat
edis
sues
and
supp
orts
the
NAI
C's
fulfi
llmen
tof
rese
arch
ques
tions
from
NAI
Cm
embe
rs,
NAI
Cst
aff,
and
inte
rest
edpa
rtie
s.Th
epr
ojec
ted
varia
nce
from
the
2014
budg
etre
late
sto
anan
alys
isof
refe
renc
em
ater
ialn
eeds
inth
eSV
O.
The
mod
est
incr
ease
in20
15is
rela
ted
toth
ene
edfo
rad
ditio
nalr
efer
ence
mat
eria
ls in
spe
cific
are
as f
or t
he S
ecur
ities
Val
uatio
n an
d Ca
pita
l Mar
kets
off
ices
.
93

94

Item
Des
crip
tion:
Out
side
cos
ts in
curr
ed f
or p
rintin
g bo
oks,
sub
scrip
tion
upda
tes,
mar
ketin
g m
ater
ials
, and
oth
er p
ublic
atio
ns.
2013
6/30
/14
12/3
1/14
2014
20
15
Incr
ease
Des
crip
tion
Actu
alAc
tual
Proj
ecte
dBu
dget
Bu
dget
(Dec
reas
e)Pe
rcen
tage
Publ
icat
ions
(1)
$313
,048
$80,
047
$177
,090
$179
,368
$1
19
,81
3($
59,5
55)
(33.
20%
)O
utsi
de P
rintin
g (2
)9,
153
1,99
010
,180
7,94
01
3,1
45
5,20
565
.55%
Tota
l$3
22,2
01$8
2,03
7$1
87,2
70$1
87,3
08$
13
2,9
58
($54
,350
)(2
9.02
%)
(1)
(2)
2015
Bud
get
by A
rea
Tech
nolo
gyFi
nanc
ial
Mar
ket
Prod
ucts
Sy
stem
s an
dBu
sine
ssSe
rvic
es t
oR
egul
ator
yR
egul
ator
yan
dD
escr
iptio
nSu
ppor
tO
pera
tions
Mem
bers
Affa
irsSe
rvic
esSe
rvic
esTo
tal
Publ
icat
ions
(1)
$119
,813
$1
19
,81
3O
utsi
de P
rintin
g (2
)$7
,025
$6,1
201
3,1
45
Tota
l$7
,025
$6,1
20$1
19,8
13$
13
2,9
58
Seve
ralF
isca
lIm
pact
sw
ere
revi
ewed
indi
vidu
ally
and
appr
oved
byth
eEx
ecut
ive
(EX)
Com
mitt
eean
dIn
tern
alAd
min
istr
atio
n(E
X1)
Subc
omm
ittee
onO
ctob
er3,
2014
.Fo
rth
e20
15bu
dget
,th
ese
incl
uded
are
duct
ion
in p
ublic
atio
ns p
rintin
g of
$9,
000.
By
mov
ing
to a
n el
ectr
onic
on-
dem
and
mod
el t
o al
low
dow
nloa
ding
of
sele
cted
pub
licat
ions
, cos
ts f
or p
ublic
atio
ns p
rintin
g w
ill d
ecre
ase
in 2
015
(See
Fis
cal I
mpa
ct 7
).
Out
side
prin
ting
incl
udes
the
cost
ofpr
intin
gpr
oduc
tca
talo
gs,
natio
nalm
eetin
gsi
gnag
e,an
dm
arke
ting
mat
eria
lsth
atre
quire
outs
ide
prin
ting
due
tosi
zean
dpa
per
requ
irem
ents
.Th
eov
erbu
dget
varia
nce
in20
14is
rela
ted
to a
dditi
onal
prin
t jo
bs t
hat
wer
e no
t an
ticip
ated
at
the
time
the
2014
bud
get
was
pre
pare
d. I
t is
ant
icip
ated
add
ition
al r
equi
rem
ents
will
con
tinue
to
occu
r in
201
5.
E17:
Prin
ting
and
Prod
uctio
n
BUD
GET
ITE
M:
Prin
ting
and
Prod
uctio
n
Publ
icat
ions
prin
ting
expe
nse
repr
esen
tsth
eco
stof
allp
ublic
atio
nin
vent
ory
item
sso
ld,
incl
udin
gth
eco
stof
spec
ialp
aper
and
othe
rsu
pplie
sus
edto
prod
uce
apu
blic
atio
nan
dth
eco
stof
exte
rnal
prin
ting
and
bind
ing
serv
ices
.D
urin
gth
e20
13in
vent
ory
proc
ess
addi
tiona
lite
ms
cons
ider
edob
sole
tew
ere
mar
ked
for
dest
ruct
ion.
The
elim
inat
ion
ofth
ese
item
sfr
omth
epu
blic
atio
nsin
vent
ory
bala
nce
acco
unts
for
the
decr
ease
inth
isex
pens
e lin
e in
201
4 an
d 20
15.
95

96
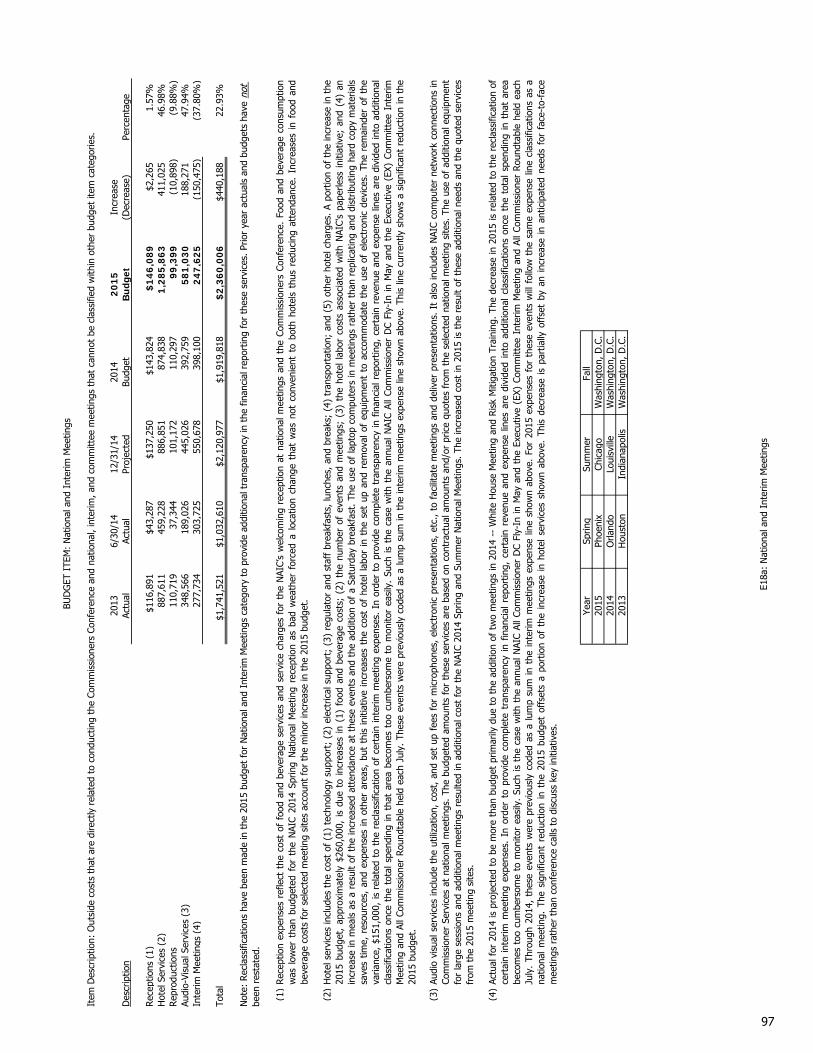
2013
6/30
/14
12/3
1/14
2014
20
15
Incr
ease
Des
crip
tion
Actu
alAc
tual
Proj
ecte
dBu
dget
Bu
dget
(Dec
reas
e)Pe
rcen
tage
Rec
eptio
ns (
1)$1
16,8
91$4
3,28
7$1
37,2
50$1
43,8
24$
14
6,0
89
$2,2
651.
57%
Hot
el S
ervi
ces
(2)
887,
611
459,
228
886,
851
874,
838
1,2
85
,86
341
1,02
546
.98%
Rep
rodu
ctio
ns11
0,71
937
,344
101,
172
110,
297
99
,39
9(1
0,89
8)(9
.88%
)Au
dio-
Visu
al S
ervi
ces
(3)
348,
566
189,
026
445,
026
392,
759
58
1,0
30
188,
271
47.9
4%In
terim
Mee
tings
(4)
277,
734
303,
725
550,
678
398,
100
24
7,6
25
(150
,475
)(3
7.80
%)
Tota
l$1
,741
,521
$1,0
32,6
10$2
,120
,977
$1,9
19,8
18$
2,3
60
,00
6$4
40,1
8822
.93%
(1)
(2)
(3)
(4)
Year
Sprin
gSu
mm
erFa
ll 20
15Ph
oeni
xCh
icag
oW
ashi
ngto
n, D
.C.
2014
Orla
ndo
Loui
svill
eW
ashi
ngto
n, D
.C.
2013
Hou
ston
Indi
anap
olis
Was
hing
ton,
D.C
.
E18a
: N
atio
nal a
nd I
nter
im M
eetin
gs
Hot
else
rvic
esin
clud
esth
eco
stof
(1)
tech
nolo
gysu
ppor
t;(2
)el
ectr
ical
supp
ort;
(3)
regu
lato
ran
dst
aff
brea
kfas
ts,
lunc
hes,
and
brea
ks;
(4)
tran
spor
tatio
n;an
d(5
)ot
her
hote
lcha
rges
.A
port
ion
ofth
ein
crea
sein
the
2015
budg
et,
appr
oxim
atel
y$2
60,0
00,
isdu
eto
incr
ease
sin
(1)
food
and
beve
rage
cost
s;(2
)th
enu
mbe
rof
even
tsan
dm
eetin
gs;
(3)
the
hote
lla
bor
cost
sas
soci
ated
with
NAI
C's
pape
rless
initi
ativ
e;an
d(4
)an
incr
ease
inm
eals
asa
resu
ltof
the
incr
ease
dat
tend
ance
atth
ese
even
tsan
dth
ead
ditio
nof
aSa
turd
aybr
eakf
ast.
The
use
ofla
ptop
com
pute
rsin
mee
tings
rath
erth
anre
plic
atin
gan
ddi
strib
utin
gha
rdco
pym
ater
ials
save
stim
e,re
sour
ces,
and
expe
nses
inot
her
area
s,bu
tth
isin
itiat
ive
incr
ease
sth
eco
stof
hote
lla
bor
inth
ese
tup
and
rem
oval
ofeq
uipm
ent
toac
com
mod
ate
the
use
ofel
ectr
onic
devi
ces.
The
rem
aind
erof
the
varia
nce,
$151
,000
,is
rela
ted
toth
ere
clas
sific
atio
nof
cert
ain
inte
rimm
eetin
gex
pens
es.
Inor
der
topr
ovid
eco
mpl
ete
tran
spar
ency
infin
anci
alre
port
ing,
cert
ain
reve
nue
and
expe
nse
lines
are
divi
ded
into
addi
tiona
lcl
assi
ficat
ions
once
the
tota
lspe
ndin
gin
that
area
beco
mes
too
cum
bers
ome
tom
onito
rea
sily
.Su
chis
the
case
with
the
annu
alN
AIC
AllC
omm
issi
oner
DC
Fly-
Inin
May
and
the
Exec
utiv
e(E
X)Co
mm
ittee
Inte
rimM
eetin
gan
dAl
lCom
mis
sion
erR
ound
tabl
ehe
ldea
chJu
ly.
Thes
eev
ents
wer
epr
evio
usly
code
das
alu
mp
sum
inth
ein
terim
mee
tings
expe
nse
line
show
nab
ove.
This
line
curr
ently
show
sa
sign
ifica
ntre
duct
ion
inth
e20
15 b
udge
t.
Not
e: R
ecla
ssifi
catio
ns h
ave
been
mad
e in
the
201
5 bu
dget
for
Nat
iona
l and
Int
erim
Mee
tings
cat
egor
y to
pro
vide
add
ition
al t
rans
pare
ncy
in t
he f
inan
cial
rep
ortin
g fo
r th
ese
serv
ices
. Prio
r ye
ar a
ctua
ls a
nd b
udge
ts h
ave
not
been
res
tate
d.
Actu
alfo
r20
14is
proj
ecte
dto
bem
ore
than
budg
etpr
imar
ilydu
eto
the
addi
tion
oftw
om
eetin
gsin
2014
--W
hite
Hou
seM
eetin
gan
dR
isk
Miti
gatio
nTr
aini
ng.
The
decr
ease
in20
15is
rela
ted
toth
ere
clas
sific
atio
nof
cert
ain
inte
rimm
eetin
gex
pens
es.
Inor
der
topr
ovid
eco
mpl
ete
tran
spar
ency
infin
anci
alre
port
ing,
cert
ain
reve
nue
and
expe
nse
lines
are
divi
ded
into
addi
tiona
lcl
assi
ficat
ions
once
the
tota
lsp
endi
ngin
that
area
beco
mes
too
cum
bers
ome
tom
onito
rea
sily
.Su
chis
the
case
with
the
annu
alN
AIC
AllC
omm
issi
oner
DC
Fly-
Inin
May
and
the
Exec
utiv
e(E
X)Co
mm
ittee
Inte
rimM
eetin
gan
dAl
lCom
mis
sion
erR
ound
tabl
ehe
ldea
chJu
ly.
Thro
ugh
2014
,th
ese
even
tsw
ere
prev
ious
lyco
ded
asa
lum
psu
min
the
inte
rimm
eetin
gsex
pens
elin
esh
own
abov
e.Fo
r20
15ex
pens
esfo
rth
ese
even
tsw
illfo
llow
the
sam
eex
pens
elin
ecl
assi
ficat
ions
asa
natio
nal
mee
ting.
The
sign
ifica
ntre
duct
ion
inth
e20
15bu
dget
offs
ets
apo
rtio
nof
the
incr
ease
inho
tel
serv
ices
show
nab
ove.
This
decr
ease
ispa
rtia
llyof
fset
byan
incr
ease
inan
ticip
ated
need
sfo
rfa
ce-t
o-fa
cem
eetin
gs r
athe
r th
an c
onfe
renc
e ca
lls t
o di
scus
s ke
y in
itiat
ives
.
BUD
GET
ITE
M:
Nat
iona
l and
Int
erim
Mee
tings
Audi
ovi
sual
serv
ices
incl
ude
the
utili
zatio
n,co
st,
and
set
upfe
esfo
rm
icro
phon
es,
elec
tron
icpr
esen
tatio
ns,
etc.
,to
faci
litat
em
eetin
gsan
dde
liver
pres
enta
tions
.It
also
incl
udes
NAI
Cco
mpu
ter
netw
ork
conn
ectio
nsin
Com
mis
sion
erSe
rvic
esat
natio
nalm
eetin
gs.
The
budg
eted
amou
nts
for
thes
ese
rvic
esar
eba
sed
onco
ntra
ctua
lam
ount
san
d/or
pric
equ
otes
from
the
sele
cted
natio
nalm
eetin
gsi
tes.
The
use
ofad
ditio
nale
quip
men
tfo
rla
rge
sess
ions
and
addi
tiona
lmee
tings
resu
lted
inad
ditio
nalc
ost
for
the
NAI
C20
14Sp
ring
and
Sum
mer
Nat
iona
lMee
tings
.Th
ein
crea
sed
cost
in20
15is
the
resu
ltof
thes
ead
ditio
naln
eeds
and
the
quot
edse
rvic
esfr
om t
he 2
015
mee
ting
site
s.
Rec
eptio
nex
pens
esre
flect
the
cost
offo
odan
dbe
vera
gese
rvic
esan
dse
rvic
ech
arge
sfo
rth
eN
AIC’
sw
elco
min
gre
cept
ion
atna
tiona
lmee
tings
and
the
Com
mis
sion
ers
Conf
eren
ce.
Food
and
beve
rage
cons
umpt
ion
was
low
erth
anbu
dget
edfo
rth
eN
AIC
2014
Sprin
gN
atio
nal
Mee
ting
rece
ptio
nas
bad
wea
ther
forc
eda
loca
tion
chan
geth
atw
asno
tco
nven
ient
tobo
thho
tels
thus
redu
cing
atte
ndan
ce.
Incr
ease
sin
food
and
beve
rage
cos
ts f
or s
elec
ted
mee
ting
site
s ac
coun
t fo
r th
e m
inor
incr
ease
in t
he 2
015
budg
et.
Item
Des
crip
tion:
Out
side
cos
ts t
hat
are
dire
ctly
rel
ated
to
cond
uctin
g th
e Co
mm
issi
oner
s Co
nfer
ence
and
nat
iona
l, in
terim
, and
com
mitt
ee m
eetin
gs t
hat
cann
ot b
e cl
assi
fied
with
in o
ther
bud
get
item
cat
egor
ies.
97

2015
Bud
get
by A
rea
Tech
nolo
gyFi
nanc
ial
Mar
ket
Prod
ucts
Sy
stem
s an
dBu
sine
ssSe
rvic
es t
oR
egul
ator
yR
egul
ator
yan
dD
escr
iptio
nSu
ppor
tO
pera
tions
Mem
bers
Affa
irsSe
rvic
esSe
rvic
esTo
tal
Rec
eptio
ns (
1)$1
46,0
89$
14
6,0
89
Hot
el S
ervi
ces
(2)
1,28
5,86
31
,28
5,8
63
Rep
rodu
ctio
ns99
,399
99
,39
9Au
dio-
Visu
al S
ervi
ces
(3)
581,
030
58
1,0
30
Inte
rim M
eetin
gs (
4)$2
15,0
0032
,625
24
7,6
25
Tota
l$2
15,0
00$2
,145
,006
$2
,36
0,0
06
BUD
GET
ITE
M:
Nat
iona
l and
Int
erim
Mee
tings
(Co
ntin
ued
from
E18
a)
E18b
: N
atio
nal a
nd I
nter
im M
eetin
gs
98

Item
Des
crip
tion:
Exp
ense
s in
curr
ed b
y th
e N
AIC
for
educ
atio
n pr
ogra
ms.
2013
6/30
/14
12/3
1/14
2014
20
15
Incr
ease
Des
crip
tion
Actu
alAc
tual
Proj
ecte
dBu
dget
Bu
dget
(Dec
reas
e)Pe
rcen
tage
Educ
atio
n Pr
ogra
ms-
Clas
sroo
m (
1)$1
41,9
55$1
05,5
19$1
79,7
31$1
74,3
67$
18
7,9
19
$13,
552
7.77
%Ed
ucat
ion
Prog
ram
s-O
nlin
e (2
)40
,858
3,97
127
,816
16,6
711
2,4
00
(4,2
71)
(25.
62%
)Ed
ucat
ion
Prog
ram
s-W
ebin
ar (
3)38
,638
10,1
2345
,558
48,8
594
2,5
57
(6,3
02)
(12.
90%
)CI
PR S
ympo
sium
(4)
50,9
388,
485
32,9
8532
,000
45
,00
013
,000
40.6
3%Fi
nanc
ial S
umm
it (5
)24
1,43
113
9,27
113
9,27
128
2,19
62
28
,44
1(5
3,75
5)(1
9.05
%)
E-R
eg C
onfe
renc
e (6
)57
,405
52,9
1452
,914
69,4
427
6,7
75
7,33
310
.56%
Tota
l$5
71,2
25$3
20,2
83$4
78,2
75$6
23,5
35$
59
3,0
92
($30
,443
)(4
.88%
)
(1)
(2)
(3)
(4)
(5)
(6)
2015
Bud
get
by A
rea
Tech
nolo
gyFi
nanc
ial
Mar
ket
Prod
ucts
Sy
stem
s an
dBu
sine
ssSe
rvic
es t
oR
egul
ator
yR
egul
ator
yan
dD
escr
iptio
nSu
ppor
tO
pera
tions
Mem
bers
Affa
irsSe
rvic
esSe
rvic
esTo
tal
Educ
atio
n Pr
ogra
ms-
Clas
sroo
m (
1)$1
87,9
19$
18
7,9
19
Educ
atio
n Pr
ogra
ms-
Onl
ine
(2)
12,4
001
2,4
00
Educ
atio
n Pr
ogra
ms-
Web
inar
(3)
42,5
574
2,5
57
CIPR
Sym
posi
um (
4)$4
5,00
04
5,0
00
Fina
ncia
l Sum
mit
(5)
$228
,441
22
8,4
41
E-R
eg C
onfe
renc
e (6
)$7
6,77
57
6,7
75
Tota
l$2
42,8
76$2
28,4
41$4
5,00
0$7
6,77
5$
59
3,0
92
The
budg
etfo
rth
eN
AIC
2014
Fina
ncia
lSum
mit
was
base
don
the
cost
sof
the
2013
even
the
ldin
San
Die
go.
How
ever
,th
e20
14su
mm
itw
ashe
ldin
Kans
asCi
ty,
MO
whi
chsi
gnifi
cant
lyre
duce
dco
sts
rela
ted
toth
isev
ent
such
asfo
odan
dbe
vera
ge,
hote
lser
vice
s,re
gula
tor
trav
el,
etc.
Ital
soel
imin
ated
the
need
for
NAI
CFi
nanc
ialR
egul
ator
ySe
rvic
esst
aff
totr
avel
toth
eev
ent.
The
cost
topr
oduc
eth
isev
ent
in20
15ha
sbe
enin
crea
sed
in a
ntic
ipat
ion
of in
crea
sed
regu
lato
r at
tend
ance
as
a re
sult
of t
he e
limin
atio
n of
fee
s fo
r re
gula
tors
to
atte
nd N
AIC
trai
ning
eve
nts.
The
purp
ose
ofth
eEd
ucat
ion
&Tr
aini
ngfu
nctio
nw
ithin
the
NAI
Cis
tom
anag
eth
eN
AIC’
sre
gula
tory
curr
icul
um.
The
core
focu
sis
onid
entif
ying
and
seiz
ing
oppo
rtun
ities
tode
velo
pju
st-in
-tim
e,on
-dem
and,
and/
orun
man
ned
trai
ning
and
deve
lopm
ent
ofpr
oduc
ts,
whi
leas
surin
gth
ein
tegr
ityan
dco
mpr
ehen
sive
ness
ofth
ecu
rric
ulum
asa
who
le.
Inth
eex
amin
atio
nof
educ
atio
nop
port
uniti
es,
the
goal
isto
achi
eve
aba
lanc
ebe
twee
nm
eetin
gth
ere
gula
tory
trai
ning
need
sof
Dep
artm
ent
ofIn
sura
nce
empl
oyee
san
das
sist
ing
indu
stry
clie
nts
thro
ugh
abr
oade
rra
nge
ofco
mpl
ianc
etr
aini
ngto
pics
.The
NAI
Ced
ucat
iona
lcur
ricul
umis
offe
red
toD
epar
tmen
t of
Ins
uran
ce e
mpl
oyee
s an
d Co
nsum
er A
dvoc
ates
at
no c
harg
e.
Educ
atio
nan
dtr
aini
ngex
pens
esha
vebe
enco
nden
sed
for
ease
ofpr
esen
tatio
nan
dun
ders
tand
ing.
Giv
enth
eco
ntin
ued
mov
emen
tto
war
del
ectr
onic
deliv
ery
oftr
aini
ngm
ater
ials
and
the
resu
lting
redu
ctio
nin
cost
s,it
isno
long
erpr
actic
alto
view
the
cost
ofea
chco
urse
sepa
rate
lyfo
rth
epu
rpos
esof
the
budg
etdo
cum
ent.
Ther
efor
e,ed
ucat
ion
and
trai
ning
offe
rings
have
been
redu
ced
toth
ree
grou
psre
pres
entin
gth
ede
liver
ym
etho
d of
the
tra
inin
g m
ater
ial -
cla
ssro
om, o
nlin
e, a
nd w
ebin
ar.
The
num
ber
of o
nlin
e le
arni
ng c
ours
es w
ill d
ecre
ase
42%
, fro
m 2
4 in
201
4 to
14
in 2
015.
The
num
ber
of w
ebin
ar t
rain
ing
sess
ions
will
incr
ease
71%
, fro
m 7
in 2
014
to 1
2 in
201
5. H
owev
er, t
he c
ost
of t
his
deliv
ery
met
hod
will
dec
reas
e w
ith t
he m
igra
tion
to a
mor
e co
st e
ffec
tive
conf
eren
ce c
all t
ool.
Atte
ndan
ce f
or t
he C
IPR
Sym
posi
um is
exp
ecte
d in
incr
ease
in 2
015,
thu
s in
crea
sing
the
cos
ts a
ssoc
iate
d w
ith t
he p
rese
ntat
ion
of t
his
even
t.
The
2015
budg
etin
clud
esfiv
ecl
assr
oom
offe
rings
,eq
ualt
oth
e20
14bu
dget
and
proj
ectio
n.Th
eco
stto
pres
ent
the
Inte
rnat
iona
lIss
ues
Foru
mw
illin
crea
sein
2015
asa
resu
ltof
the
antic
ipat
ednu
mbe
rof
atte
ndee
san
d th
e fo
od a
nd b
ever
age
min
imum
s at
the
sel
ecte
d si
te.
E19
: Ed
ucat
ion
and
Trai
ning
BUD
GET
ITE
M:
Educ
atio
n an
d Tr
aini
ng
The
2014
pro
ject
ion
refle
cts
savi
ngs
as a
res
ult
of r
educ
ing
the
NAI
C 20
14 E
-Reg
Con
fere
nce
by o
ne d
ay. A
dditi
onal
ly, t
he h
otel
gra
nted
a g
ener
ous
disc
ount
on
the
use
of a
udio
/vis
ual e
quip
men
t. T
he 2
015
budg
et
assu
mes
the
con
fere
nce
will
ret
urn
to t
hree
day
s an
d sa
ving
s in
the
aud
io/v
isua
l are
a w
ill n
ot b
e of
fere
d.
99

100

Item
Des
crip
tion:
Util
izat
ion
of g
rant
and
zon
e fu
nds
and
expe
nses
incu
rred
by
the
NAI
C fo
r st
ate
and
gene
ral N
AIC
trai
ning
eve
nts.
2013
6/30
/14
12/3
1/14
2014
20
15
Incr
ease
Des
crip
tion
Actu
alAc
tual
Proj
ecte
dBu
dget
Bu
dget
(Dec
reas
e)Pe
rcen
tage
Gra
nt F
unds
(1)
$954
,002
$339
,145
$1,3
00,8
39$1
,320
,000
$1
,22
0,0
00
($10
0,00
0)(7
.58%
)Zo
ne F
unds
(2)
21,8
8338
,600
159,
900
43
,40
0(1
16,5
00)
(72.
86%
)G
ener
al T
rain
ing
(3)
40,7
6826
,079
42,9
3879
,261
40
,53
0(3
8,73
1)(4
8.87
%)
Tota
l$1
,016
,653
$365
,224
$1,3
82,3
77$1
,559
,161
$1
,30
3,9
30
($25
5,23
1)(1
6.37
%)
(1) (2)
(3)
2015
Bud
get
by A
rea
Tech
nolo
gyFi
nanc
ial
Mar
ket
Prod
ucts
Sy
stem
s an
dBu
sine
ssSe
rvic
es t
oR
egul
ator
yR
egul
ator
yan
dD
escr
iptio
nSu
ppor
tO
pera
tions
Mem
bers
Affa
irsSe
rvic
esSe
rvic
esTo
tal
Gra
nt F
unds
(1)
$1,2
20,0
00$
1,2
20
,00
0Zo
ne F
unds
(2)
43,4
004
3,4
00
Gen
eral
Tra
inin
g (3
)39
,330
$1,2
004
0,5
30
Tota
l$1
,302
,730
$1,2
00$
1,3
03
,93
0
BUD
GET
ITE
M:
Stat
e an
d G
ener
al T
rain
ing
E20:
Sta
te a
nd G
ener
al T
rain
ing
Gen
eral
trai
ning
expe
nse
incl
udes
(1)
the
cost
sof
natio
nally
prod
uced
trai
ning
prog
ram
san
din
stru
ctio
nalv
ideo
sus
edby
the
Hum
anR
esou
rces
Dep
artm
ent
for
asso
ciat
ion
staf
ftr
aini
ngne
eds
and
(2)
regu
lato
rtr
avel
expe
nses
reim
burs
edun
der
the
DeA
ngel
oan
dD
esig
natio
nsc
hola
rshi
ppr
ogra
ms
of$2
0,00
0an
d$3
3,00
0,re
spec
tivel
y.D
ueto
ach
ange
inpo
licy
inw
hich
tuiti
onis
wai
ved
for
regu
lato
rsen
rolli
ngin
man
yN
AIC
cour
ses,
the
over
allu
sage
ofsc
hola
rshi
psbe
gan
tode
clin
ein
late
2012
and
have
rem
aine
dlo
wth
roug
h20
14.
With
the
elim
inat
ion
oftu
ition
for
stat
ere
gula
tors
tovi
rtua
llyal
lNAI
Ctr
aini
ngco
urse
s,th
ese
scho
lars
hips
will
nolo
nger
be
nece
ssar
y an
d ha
ve b
een
rem
oved
fro
m t
he 2
015
budg
et.
Zone
fund
sre
pres
ent
the
utili
zatio
nof
the
trai
ning
dolla
rsal
loca
ted
toea
chm
embe
rby
the
four
Zone
s.Th
ede
crea
sein
the
utili
zatio
nof
zone
fund
ing
in20
14is
rela
ted
toth
ead
ditio
nala
lloca
tions
ofgr
ant
fund
ing
toea
ch N
AIC
mem
ber
durin
g th
e 20
14 b
udge
t pr
oces
s.
Mul
tiple
chan
ges
inth
eG
rant
Fund
ing
prog
ram
for
2014
crea
ted
ane
tin
crea
sein
the
gran
tfu
ndbu
dget
of$1
18,0
00.
Chan
ges
togr
ant
fund
sin
clud
edin
crea
sing
the
per
mem
ber
gran
tfr
om$1
3,00
0es
tabl
ishe
din
2009
,to
$20,
000
per
mem
ber,
anin
crea
seof
$392
,000
.As
are
sult
ofth
isin
crea
sein
indi
vidu
alst
ate
gran
tfu
ndba
lanc
es,
need
s-ba
sed
fund
ing
for
regu
lato
rsne
edin
gas
sist
ance
topa
rtic
ipat
ein
NAI
Cna
tiona
lm
eetin
gsw
asre
duce
dfr
om$2
50,0
00to
$200
,000
and
the
Educ
atio
nan
dTr
aini
ngG
rant
prog
ram
esta
blis
hed
in20
12at
$4,0
00pe
rju
risdi
ctio
n($
224,
000)
aim
edat
prov
idin
gin
crea
sed
trai
ning
oppo
rtun
ities
for
stat
ein
sura
nce
regu
lato
rsto
deve
lop
prof
icie
ncie
sin
spec
ific
area
sw
asel
imin
ated
.Th
eel
imin
ated
fund
sw
ere
incl
uded
aspa
rtof
the
$7,0
00pe
rm
embe
rin
crea
sein
gran
tfu
ndin
gal
low
ing
for
abr
oade
rus
eof
fund
ing
prov
ided
byth
eN
AIC.
Anad
ditio
nal$
2,50
0pe
rm
embe
r($
140,
000)
was
appr
oved
atth
eN
AIC
2013
Fall
Nat
iona
lMee
ting,
tobe
used
byth
eZo
nes
topr
ovid
ead
ditio
nalt
rain
ing
oppo
rtun
ities
for
thei
rm
embe
rs(s
eeE2
1: O
ther
Exp
ense
s -
Zone
Exp
ense
s). W
ith t
he n
et a
dditi
on o
f $2
60,5
00 in
fun
ding
in 2
014,
the
201
5 ne
eds-
base
d gr
ant
fund
ing
will
be
redu
ced
by h
alf
to $
100,
000.
101

102

Item
Des
crip
tion:
Cos
ts in
curr
ed f
or r
ecru
iting
exp
ense
s, b
ad d
ebt
allo
wan
ce a
nd w
rite-
offs
, zon
e sp
onso
red
even
ts, J
IR r
esea
rch
gran
ts, a
nd m
embe
r re
latio
ns.
2013
6/30
/14
12/3
1/14
2014
20
15
Incr
ease
Des
crip
tion
Actu
alAc
tual
Proj
ecte
dBu
dget
Bu
dget
(Dec
reas
e)Pe
rcen
tage
Rec
ruiti
ng a
nd R
eloc
atio
n (1
)$1
90,1
00$4
6,41
5$2
98,4
15$2
88,1
35$
22
6,6
05
($61
,530
)(2
1.35
%)
Bad
Deb
t Ex
pens
e (2
)47
0,29
9(1
0,34
4)53
0,73
056
6,10
05
75
,57
79,
477
1.67
%Zo
ne E
xpen
ses
(3)
182,
402
15,3
3820
3,53
815
1,50
01
96
,50
045
,000
29.7
0%R
esea
rch
Gra
nts
(4)
2,00
02,
000
2,00
02
,00
00.
00%
Mem
ber
Rel
atio
ns (
5)9,
691
7,60
23,
150
4,9
56
1,80
657
.33%
Tota
l$8
54,4
92$5
1,40
9$1
,042
,285
$1,0
10,8
85$
1,0
05
,63
8($
5,24
7)(0
.52%
)
(1) (2)
(3)
(4)
(5)
2015
Bud
get
by A
rea
Tech
nolo
gyFi
nanc
ial
Mar
ket
Prod
ucts
Sy
stem
s an
dBu
sine
ssSe
rvic
es t
oR
egul
ator
yR
egul
ator
yan
dD
escr
iptio
nSu
ppor
tO
pera
tions
Mem
bers
Affa
irsSe
rvic
esSe
rvic
esTo
tal
Rec
ruiti
ng a
nd R
eloc
atio
n (1
)$2
26,6
05$
22
6,6
05
Bad
Deb
t Ex
pens
e (2
)50
0,00
0$7
5,57
75
75
,57
7Zo
ne E
xpen
ses
(3)
196,
500
19
6,5
00
Res
earc
h G
rant
s (4
)$2
,000
2,0
00
Mem
ber
Rel
atio
ns (
5)$4
,956
4,9
56
Tota
l$9
23,1
05$4
,956
$75,
577
$2,0
00$
1,0
05
,63
8
E21:
Oth
er E
xpen
se
The
proj
ecte
d an
d bu
dget
ed a
mou
nts
repr
esen
t gr
ant
paym
ents
to
indi
vidu
als
for
the
subm
issi
on o
f ar
ticle
s fo
r Th
e Jo
urna
l of
Insu
ranc
e R
egul
atio
n (J
IR).
BUD
GET
ITE
M:
Oth
er E
xpen
se
Bad
debt
exp
ense
is a
pro
visi
on f
or f
utur
e un
colle
ctib
le c
usto
mer
acc
ount
s re
ceiv
able
. The
201
4 pr
ojec
tion
refle
cts
a tr
end
tow
ard
few
er u
ncol
lect
ible
acc
ount
s. T
he 2
015
budg
et a
ssum
es t
his
tren
d w
ill n
ot c
ontin
ue.
Rec
ruiti
ngag
enci
esar
eus
edto
fillo
pen
posi
tions
with
qual
ified
indi
vidu
als
with
aun
ique
/spe
cific
skill
set
and
thos
eat
the
high
erle
vels
ofm
anag
emen
tw
ithin
the
asso
ciat
ion
whe
nst
anda
rdm
etho
dsof
recr
uitm
ent
prov
eun
succ
essf
ul.
The
over
budg
etva
rianc
ein
2014
isdi
rect
lyre
late
dto
relo
catio
nex
pens
esfo
rhi
ghly
qual
ified
cand
idat
es.
The
2015
budg
etas
sum
esa
decr
ease
inre
lianc
eon
exte
rnal
recr
uitin
gse
rvic
esfo
rth
eat
trac
tion
of N
AIC
empl
oyee
s in
201
5.
Zone
expe
nses
are
fund
sus
edby
each
ofth
efo
urN
AIC
Zone
sto
supp
ort
trai
ning
func
tions
and
mee
tings
ofth
ezo
ne.
Budg
eted
expe
nditu
res
ofth
ese
fund
s,as
wel
las
Zone
fund
ssh
own
onE2
0:St
ate
and
Gen
eral
Trai
ning
,re
pres
ent
the
estim
ated
use
ofFu
nds
allo
cate
dto
the
four
NAI
CZo
nes:
(1)
$147
,500
-$2
,500
per
Zone
mem
ber,
with
am
inim
umof
$35,
000
per
Zone
.Ap
prov
ed-
June
2010
;an
d(2
)$1
40,0
00-
$2,5
00pe
rZo
nem
embe
rsto
beus
edby
the
Zone
sto
prov
ide
addi
tiona
ltra
inin
gop
port
uniti
esfo
rth
eir
mem
bers
.Ap
prov
ed-
Dec
embe
r20
13.
The
Sout
heas
tZo
nehe
ldtw
oZo
neCo
nfer
ence
sin
2014
but
only
one
was
antic
ipat
edat
the
time
the
2014
budg
etw
aspr
epar
ed.
The
2015
budg
etas
sum
esth
isZo
new
illag
ain
hold
two
conf
eren
ces.
Zone
Conf
eren
ceex
pend
iture
sar
eex
pect
edto
incr
ease
slig
htly
in20
15ba
sed
ona
gene
rali
ncre
ase
info
od a
nd b
ever
age
and
hote
l ser
vice
cos
ts.
The
mem
ber
rela
tions
acco
unt
incl
udes
expe
nses
asso
ciat
edw
ithth
eD
inee
nAw
ard
reci
pien
tan
dre
cogn
ition
ofN
AIC
mem
bers
and
the
NAI
CO
ffic
ers.
The
2014
proj
ectio
nin
clud
esun
plan
ned
but
appr
oved
appr
ecia
tion
gift
s pr
esen
ted
to C
omm
issi
oner
s du
ring
the
Com
mis
sion
ers
Conf
eren
ce.
103

104

Investm
ent Income Detail

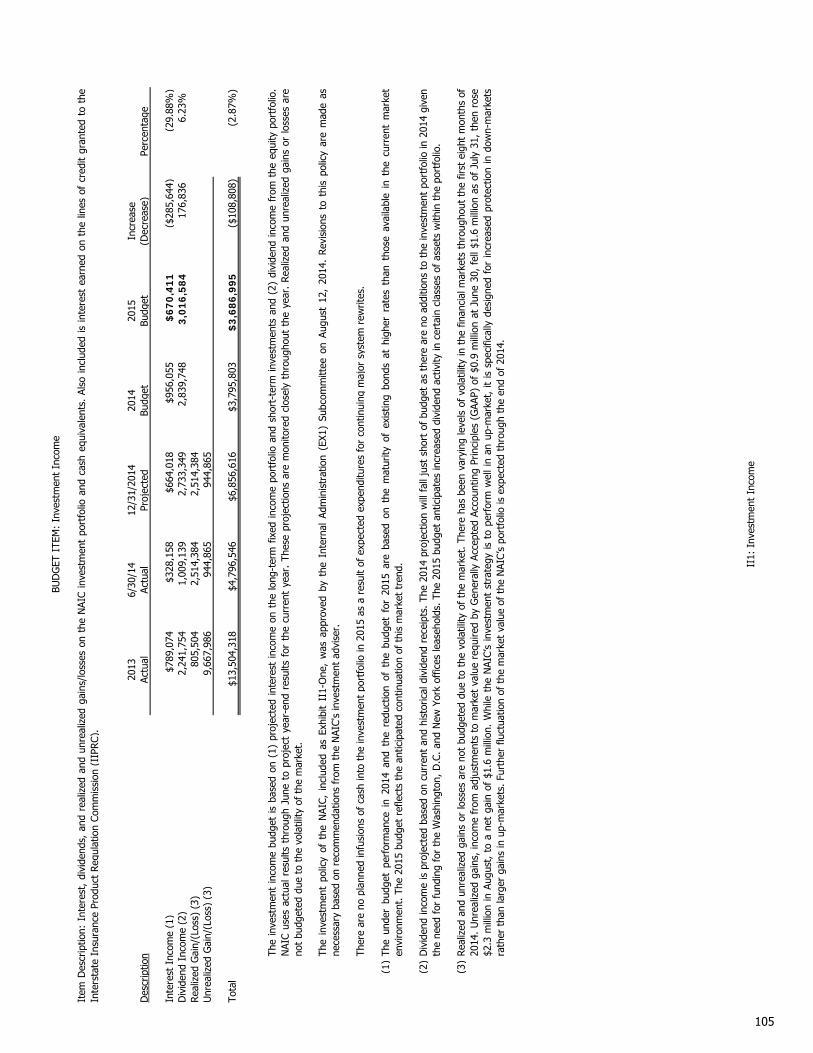
2013
6/30
/14
12/3
1/20
1420
1420
15In
crea
seD
escr
iptio
nAc
tual
Actu
alPr
ojec
ted
Budg
etBu
dget
(Dec
reas
e)Pe
rcen
tage
Inte
rest
Inc
ome
(1)
$789
,074
$328
,158
$664
,018
$956
,055
$670
,411
($28
5,64
4)(2
9.88
%)
Div
iden
d In
com
e (2
)2,
241,
754
1,00
9,13
92,
733,
349
2,83
9,74
83,
016,
584
176,
836
6.23
%Re
aliz
ed G
ain/
(Los
s) (
3)80
5,50
42,
514,
384
2,51
4,38
4U
nrea
lized
Gai
n/(L
oss)
(3)
9,66
7,98
694
4,86
594
4,86
5
Tota
l$1
3,50
4,31
8$4
,796
,546
$6,8
56,6
16$3
,795
,803
$3,6
86,9
95($
108,
808)
(2.8
7%)
(1)
(2)
(3)
II1:
Inv
estm
ent
Inco
me
BUD
GET
ITE
M:
Inve
stm
ent
Inco
me
Item
Des
crip
tion:
Inte
rest
,di
vide
nds,
and
real
ized
and
unre
aliz
edga
ins/
loss
eson
the
NAI
Cin
vest
men
tpo
rtfo
lioan
dca
sheq
uiva
lent
s.Al
soin
clud
edis
inte
rest
earn
edon
the
lines
ofcr
edit
gran
ted
toth
eIn
ters
tate
Ins
uran
ce P
rodu
ct R
egul
atio
n Co
mm
issi
on (
IIPR
C).
The
unde
rbu
dget
perf
orm
ance
in20
14an
dth
ere
duct
ion
ofth
ebu
dget
for
2015
are
base
don
the
mat
urity
ofex
istin
gbo
nds
athi
gher
rate
sth
anth
ose
avai
labl
ein
the
curr
ent
mar
ket
envi
ronm
ent.
The
201
5 bu
dget
ref
lect
s th
e an
ticip
ated
con
tinua
tion
of t
his
mar
ket
tren
d.
Div
iden
din
com
eis
proj
ecte
dba
sed
oncu
rren
tan
dhi
stor
ical
divi
dend
rece
ipts
.Th
e20
14pr
ojec
tion
will
fall
just
shor
tof
budg
etas
ther
ear
eno
addi
tions
toth
ein
vest
men
tpo
rtfo
lioin
2014
give
nth
e ne
ed f
or f
undi
ng f
or t
he W
ashi
ngto
n, D
.C. a
nd N
ew Y
ork
offic
es le
aseh
olds
. The
201
5 bu
dget
ant
icip
ates
incr
ease
d di
vide
nd a
ctiv
ity in
cer
tain
cla
sses
of
asse
ts w
ithin
the
por
tfol
io.
The
inve
stm
ent
inco
me
budg
etis
base
don
(1)
proj
ecte
din
tere
stin
com
eon
the
long
-ter
mfix
edin
com
epo
rtfo
lioan
dsh
ort-
term
inve
stm
ents
and
(2)
divi
dend
inco
me
from
the
equi
typo
rtfo
lio.
NAI
Cus
esac
tual
resu
ltsth
roug
hJu
neto
proj
ect
year
-end
resu
ltsfo
rth
ecu
rren
tye
ar.
Thes
epr
ojec
tions
are
mon
itore
dcl
osel
yth
roug
hout
the
year
.Re
aliz
edan
dun
real
ized
gain
sor
loss
esar
eno
t bu
dget
ed d
ue t
o th
e vo
latil
ity o
f th
e m
arke
t.
The
inve
stm
ent
polic
yof
the
NAI
C,in
clud
edas
Exhi
bit
II1-
One
,w
asap
prov
edby
the
Inte
rnal
Adm
inis
trat
ion
(EX1
)Su
bcom
mitt
eeon
Augu
st12
,20
14.
Revi
sion
sto
this
polic
yar
em
ade
asne
cess
ary
base
d on
rec
omm
enda
tions
fro
m t
he N
AIC'
s in
vest
men
t ad
vise
r.
Real
ized
and
unre
aliz
edga
ins
orlo
sses
are
not
budg
eted
due
toth
evo
latil
ityof
the
mar
ket.
Ther
eha
sbe
enva
ryin
gle
vels
ofvo
latil
ityin
the
finan
cial
mar
kets
thro
ugho
utth
efir
stei
ght
mon
ths
of20
14.
Unr
ealiz
edga
ins,
inco
me
from
adju
stm
ents
tom
arke
tva
lue
requ
ired
byG
ener
ally
Acce
pted
Acco
untin
gPr
inci
ples
(GAA
P)of
$0.9
mill
ion
atJu
ne30
,fe
ll$1
.6m
illio
nas
ofJu
ly31
,th
enro
se$2
.3m
illio
nin
Augu
st,
toa
net
gain
of$1
.6m
illio
n.W
hile
the
NAI
C’s
inve
stm
ent
stra
tegy
isto
perf
orm
wel
lin
anup
-mar
ket,
itis
spec
ifica
llyde
sign
edfo
rin
crea
sed
prot
ectio
nin
dow
n-m
arke
tsra
ther
tha
n la
rger
gai
ns in
up-
mar
kets
. Fur
ther
flu
ctua
tion
of t
he m
arke
t va
lue
of t
he N
AIC’
s po
rtfo
lio is
exp
ecte
d th
roug
h th
e en
d of
201
4.
Ther
e ar
e no
pla
nned
infu
sion
s of
cas
h in
to t
he in
vest
men
t po
rtfo
lio in
201
5 as
a r
esul
t of
exp
ecte
d ex
pend
iture
s fo
r co
ntin
uing
maj
or s
yste
m r
ewrit
es.
105

106

STATEMENT OF INVESTMENT POLICY, OBJECTIVES AND
GUIDELINES FOR THE NATIONAL ASSOCIATION OF INSURANCE COMMISSIONERS
August 12, 2014
Exhibit II1-One
107
NATIONAL ASSOCIATION OF INSURANCE COMMISSIONERS STATEMENT OF INVESTMENT POLICY & OBJECTIVES
I. MISSION The mission of the National Association of Insurance Commissioners (NAIC) is to assist state insurance regulators, individually and collectively, in serving the public interest and achieving the following fundamental insurance regulatory goals in a responsive, efficient and cost effective manner, consistent with the wishes of its members:
• Protect the public interest; • Promote competitive markets; • Facilitate the fair and equitable treatment of insurance consumers; • Promote the reliability, solvency and financial solidity of insurance institutions; and • Support and improve state regulation of insurance.
To accomplish these objectives, the NAIC is required to maintain and support a full-time staff and fund a number of different activities (such as data processing collection and analysis; coordinate national, international, and ad hoc meetings; and the coordination of state insurance department accreditation). The funding for these activities is received from a variety of sources and any funds generated not required for supporting current projects and activities is available for investment in the NAIC’s investment portfolio. The primary objective of the NAIC investment portfolio is preservation of capital adjusted for inflation with an emphasis on the long-term growth of principal, with a risk profile generally deemed to be prudent by institutional fiduciaries. II. PURPOSE OF THIS INVESTMENT POLICY STATEMENT The Executive (EX) Committee of the NAIC sets forth this Investment Policy Statement in order to:
• Define and assign the responsibilities of all parties involved in the oversight, management and control of the investment portfolio.
• Establish investment goals and objectives for the investment portfolio that are clear, concise and understood by all parties.
• Manage fund assets according to prudent standards. • Offer guidance and limitations to all Investment Managers regarding the investment of the
assets. • Establish a basis for evaluating investment results. • Establish a relevant investment time horizon for which the assets will be managed.
In general, the purpose of this policy statement is to outline a philosophy and framework that will guide the investment management of the assets toward the desired results. It is intended to be sufficiently specific to be meaningful, yet flexible. III. DELEGATION OF AUTHORITY A. RESPONSIBILITIES OF THE NAIC INTERNAL ADMINISTRATION (EX1) SUBCOMMITTEE The NAIC Executive (EX) Committee has assigned responsibility for the oversight of the NAIC investment portfolio to the Internal Administration (EX1) Subcommittee (referred to hereafter as the “Subcommittee”). The Subcommittee is charged with responsibility for managing the assets of the
Exhibit II1-One
108
NAIC investment portfolio. The members of the Subcommittee shall discharge their duties solely in the interests of the NAIC, with the care, skill, prudence and diligence under the circumstances then prevailing, that a prudent person, acting in a like capacity and familiar with such matters would use in the conduct of an enterprise of a like character with like aims. The specific responsibilities of the Subcommittee include:
1. Establishing reasonable and consistent investment objectives, policies and guidelines that will direct the investment of the NAIC investment portfolio.
2. Determining the appropriate risk tolerance and investment time horizon for the NAIC investment portfolio and communicating these decisions to the appropriate parties.
3. The Subcommittee is authorized to delegate certain responsibilities to professional experts in various fields, including an Investment Advisor, an Investment Manager, a Custodian, and a Co-Trustee.
4. Evaluating on a regular basis the performance of any Investment Manager(s) to assure adherence to policy guidelines and monitor progress towards achieving investment objectives.
5. Developing and enacting proper control procedures. For example, replacing Investment Managers due to a fundamental change in the firm’s investment management process, or a failure to comply with established guidelines or significant changes in the firm’s personnel.
6. Evaluating on a regular basis the performance of the Investment Advisor. Other than as stated in Paragraph 3 above, the Subcommittee will not reserve any control over direct investment decisions, with the exception of specific limitations described in these statements. Investment Managers will be held responsible and accountable to achieve the investment objectives herein stated. While it is not believed that the limitations will hamper Investment Managers, each Manager should request from the Subcommittee any modifications deemed appropriate. B. RESPONSIBILITIES OF THE INVESTMENT ADVISOR The Investment Advisor role is that of a non-discretionary advisor to the Executive (EX) Committee and the Subcommittee of the NAIC. Investment advice concerning the investment management of the assets will be offered by the Investment Advisor, and will be consistent with the investment objectives, policies, guidelines and constraints as established in this statement. Specific responsibilities of the Investment Advisor include:
1. Assisting in the development and annual review of the investment policy. 2. Conducting investment manager searches when requested by the Subcommittee. 3. Providing research on the Investment Managers on an ongoing basis. 4. Monitoring the performance of the Investment Managers quarterly and reporting to the
Subcommittee on the progress of the Managers relative to the investment objectives. 5. Communicating matters of policy, manager research, relevant organizational changes at the
manager, and manager performance to the Subcommittee. 6. Reviewing the NAIC’s investment history, capital market performance and the contents of this
investment policy statement with any newly appointed Trustee(s). 7. Assisting the Subcommittee in the development of a strategic asset allocation plan and its
implementation. 8. Negotiation of fees with the Investment Managers on behalf of the Subcommittee. 9. Establishing customized investment performance benchmarks for the overall NAIC portfolio and
for each component (Investment Manager) and monitoring the portfolio on an ongoing basis. 10. Recommending the termination and/or change of any Investment Manager(s). 11. Periodic rebalancing of the NAIC portfolio to be approved by the Subcommittee.
Exhibit II1-One
109

In addition, the Investment Advisor’s role will include the following administrative responsibilities:
1. Overseeing the day-to-day operational investment activities of the NAIC subject to the policies established by the Subcommittee.
2. Implementing the allocation and reallocation of NAIC investments among asset classes, investment styles and investment management firms in accordance with the decisions of the Subcommittee and within the guidelines of allocation targets set forth in this policy statement.
3. Receive, review and distribute reports from outside professionals regarding the status of the NAIC portfolios.
4. Interface with Investment Managers, the custodian and other outside professionals and communicate with the Subcommittee.
5. Periodically issue status reports to the Subcommittee. 6. Timely communication of any major changes to economic outlook, investment strategy, or any
other factors affecting the implementation of the investment process or the progress toward meeting performance objectives.
C. RESPONSIBILITIES OF THE INVESTMENT MANAGER(S) Each Investment Manager managing an individually managed account for the NAIC will have full discretion to make all investment decisions for the assets placed under its jurisdiction, while observing and operating within all policies, guidelines, constraints and philosophies as outlined in this statement. Specific responsibilities of the Investment Manager(s) shall include:
1. Discretionary investment management, including decisions to buy, sell or hold individual securities and to alter asset allocation within the asset classes selected by the Managers in order to generate favorable returns given the level of risk employed by the Manager.
2. Reporting, on a timely basis, quarterly investment performance results. 3. Informing the Subcommittee and the Investment Advisors of any qualitative changes to the
investment management organization. Examples include changes in portfolio management personnel, ownership structure, and investment philosophy or investment discipline.
4. Voting proxies, if requested by the Subcommittee, on behalf of the NAIC and communicating such voting records to the Subcommittee when requested.
5. Timely communication of trading information to the Subcommittee and the Investment Advisors.
6. Quarterly communication confirming the manager is in compliance with the NAIC Statement of Investment Policy/Objectives and Guidelines for the most recent quarter. If not in compliance, the manager must list each “out of compliance” item and steps that will be taken to bring into compliance.
7. Manager must communicate annually that the fee being charged for the management of the NAIC portfolio(s) is the lowest fee in place for any account at the manager of a similar size using a similar investment strategy.
IV. GENERAL INVESTMENT PRINCIPLES Management of the NAIC financial assets will follow the general investment guidelines set forth below:
1. Investments shall be made solely in the interests of the NAIC. 2. The NAIC financial assets shall be invested with the care, skill, prudence, and diligence under
the circumstances then prevailing that a prudent person acting in like capacity and familiar with such matters would use in managing the investments of an institution of like character and with like aims.
Exhibit II1-One
110

3. Investment of the financial assets shall be so diversified as to minimize the risk of large losses. 4. The Subcommittee may employ one or more Investment Managers of varying styles and
philosophies to attain the NAIC’s objectives. V. INVESTMENT STRATEGY & OBJECTIVES In order to achieve its goals in perpetuity, the investment strategy for the Executive (EX) Committee of the NAIC will emphasize total return; that is, the aggregate return from capital appreciation and dividend and interest income. Specifically, the primary objective in the investment management for the NAIC financial assets shall be: To maximize long-term total returns consistent with prudent levels of risk. Returns are expected to preserve and/or enhance the real value of the NAIC after funds are distributed for current use. In order to accomplish its objectives, the NAIC may invest primarily in (1) domestic and international equities, (2) domestic and global bonds and (3) alternative investments (see Section VI Investment Guidelines). Any investment which is not easily marketable will require written Subcommittee approval. Investment risks will be considered within the context of the entire investment portfolio. Understanding that differing economic conditions may produce periods of relative underperformance and outperformance, there will be an attempt to diversify the NAIC by both asset class (e.g. stocks, bonds, cash, alternative investments) and investment style (e.g. growth versus value). A. SPECIFIC INVESTMENT GOALS The goal of the NAIC investment portfolio is: Generate a long-term (Three-year running time period) target rate of return of the Consumer Price Index plus at least five percent. This goal is for the entire NAIC investment portfolio – it is not intended to be imposed on each individual Investment Manager. The goal of each Investment Manager, over the investment horizon, shall be to:
1. Exceed the market index, or blended market index, selected and agreed upon by the Subcommittee that most closely corresponds to the manager’s style of investment management net of fees over a full market cycle. In addition, the Manager should perform in the top half of an appropriate peer group over the past three and five year annualized periods.
2. Display an overall level of risk in the portfolio, which is consistent with the risk associated with the benchmark specified above. Risk will be measured by the standard deviation of quarterly returns.
B. VOLATILITY OF RETURNS The Subcommittee, with the assistance of the Investment Advisor selected by the Subcommittee, will structure a diversified portfolio that is designed to consistently achieve the return target over an investment horizon defined as a three year period. The return target and the portfolio structure are based on certain assumptions and expectations deemed reasonable by the Subcommittee and the Investment Advisors. The Subcommittee has given consideration to the risk associated with the NAIC’s investments. The Subcommittee understands that in order to achieve its investment objectives over a full market cycle, the NAIC investment portfolio will experience volatility of returns and fluctuations of market value.
Exhibit II1-One
111
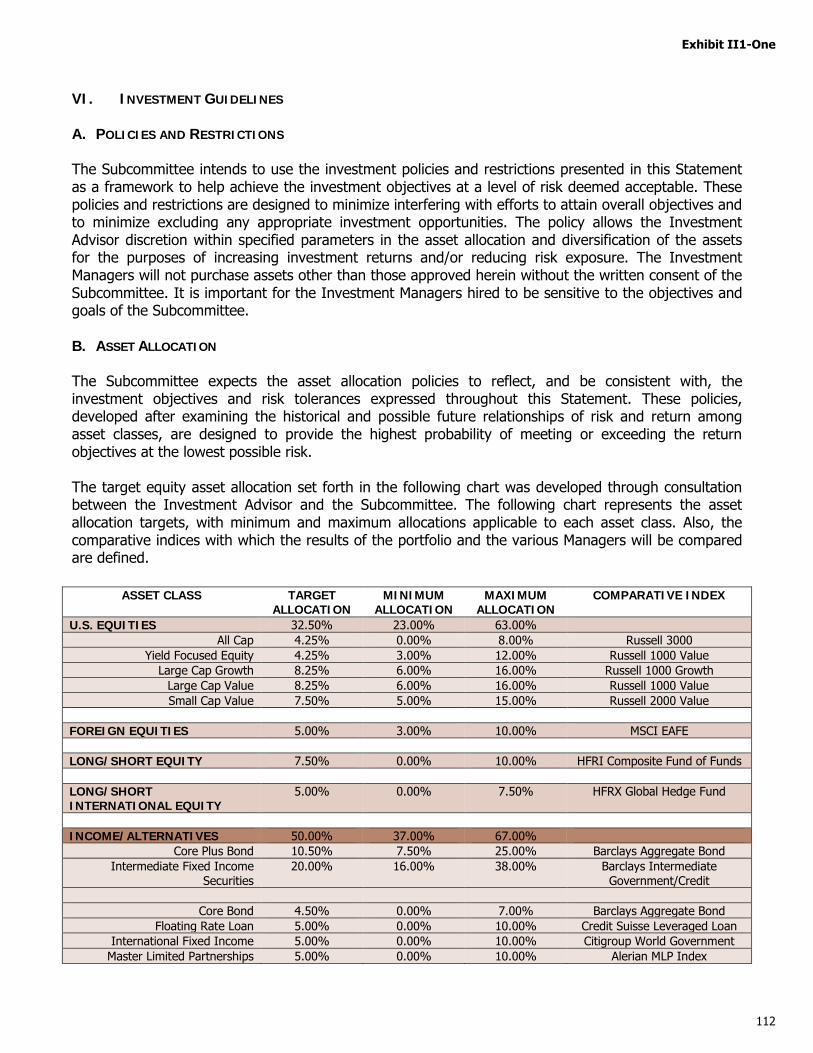
VI. INVESTMENT GUIDELINES A. POLICIES AND RESTRICTIONS The Subcommittee intends to use the investment policies and restrictions presented in this Statement as a framework to help achieve the investment objectives at a level of risk deemed acceptable. These policies and restrictions are designed to minimize interfering with efforts to attain overall objectives and to minimize excluding any appropriate investment opportunities. The policy allows the Investment Advisor discretion within specified parameters in the asset allocation and diversification of the assets for the purposes of increasing investment returns and/or reducing risk exposure. The Investment Managers will not purchase assets other than those approved herein without the written consent of the Subcommittee. It is important for the Investment Managers hired to be sensitive to the objectives and goals of the Subcommittee. B. ASSET ALLOCATION The Subcommittee expects the asset allocation policies to reflect, and be consistent with, the investment objectives and risk tolerances expressed throughout this Statement. These policies, developed after examining the historical and possible future relationships of risk and return among asset classes, are designed to provide the highest probability of meeting or exceeding the return objectives at the lowest possible risk. The target equity asset allocation set forth in the following chart was developed through consultation between the Investment Advisor and the Subcommittee. The following chart represents the asset allocation targets, with minimum and maximum allocations applicable to each asset class. Also, the comparative indices with which the results of the portfolio and the various Managers will be compared are defined.
ASSET CLASS TARGET
ALLOCATION MINIMUM
ALLOCATION MAXIMUM
ALLOCATION COMPARATIVE INDEX
U.S. EQUITIES 32.50% 23.00% 63.00% All Cap 4.25% 0.00% 8.00% Russell 3000
Yield Focused Equity 4.25% 3.00% 12.00% Russell 1000 Value Large Cap Growth 8.25% 6.00% 16.00% Russell 1000 Growth
Large Cap Value 8.25% 6.00% 16.00% Russell 1000 Value Small Cap Value 7.50% 5.00% 15.00% Russell 2000 Value
FOREIGN EQUITIES 5.00% 3.00% 10.00% MSCI EAFE LONG/SHORT EQUITY 7.50% 0.00% 10.00% HFRI Composite Fund of Funds LONG/SHORT INTERNATIONAL EQUITY
5.00% 0.00% 7.50% HFRX Global Hedge Fund
INCOME/ALTERNATIVES 50.00% 37.00% 67.00%
Core Plus Bond 10.50% 7.50% 25.00% Barclays Aggregate Bond Intermediate Fixed Income
Securities 20.00% 16.00% 38.00% Barclays Intermediate
Government/Credit
Core Bond 4.50% 0.00% 7.00% Barclays Aggregate Bond Floating Rate Loan 5.00% 0.00% 10.00% Credit Suisse Leveraged Loan
International Fixed Income 5.00% 0.00% 10.00% Citigroup World Government Master Limited Partnerships 5.00% 0.00% 10.00% Alerian MLP Index
Exhibit II1-One
112
Although dynamic capital markets may cause fluctuating risk/return opportunities over a market cycle, the comparative indices set forth in the prior chart will be used to evaluate the asset allocation (as measured at market value) over a three-year moving time period. C. GENERAL ASSET ALLOCATION RESTRICTIONS
1. The investment returns of the asset allocation will be measured against those of both a target portfolio consisting of 7.50% long/short equity fund of funds, 5.00% long/short international equity, 4.25% all cap equities, 4.25% yield focused equities, 8.25% large cap growth equities, 8.25% large cap value equities, 7.50% small cap value equities, 5.00% international equities, and 50.00% income/income alternative securities, including 5.00% floating rate loan, 5.00% master limited partnerships, and an actual weighted portfolio index blend. Equity and income market performance will be compared to the returns of the indices specified above. Other more appropriate indices may be used at the discretion of the Investment Advisor after consulting with the Subcommittee.
2. U.S. publicly traded equities will be represented in the portfolio up to 63.00% with a minimum requirement of 23.00%.
3. Foreign equities will not exceed 10.00% of the account’s market value, with a minimum requirement of 3.00%.
4. Long/Short Equity will be represented in the portfolio up to 10.00% with no minimum requirement.
5. Long/Short International Equity will be represented in the portfolio up to 7.50% with no minimum requirement.
6. Income/income alternative securities will not exceed 67.00% of the account’s market value with a minimum requirement of 37.00%. The principal subcomponent of income securities, U.S. publicly traded domestic fixed income securities will not exceed 38.00% of the account’s market value, with a minimum requirement of 16.00%.
7. Financial Sector allocation may be based on an individual Investment Manager’s discretionary allocation to sector, rather than pursuant to the stated target allocation.
8. The Subcommittee foresees the possibility of using limited partnerships and/or mutual funds and understands that it would not have any control over the management of such funds with regard to guidelines and restrictions, and would be subject to the investment provisions set forth in the respective investment vehicle prospectus.
Because securities market conditions can vary greatly throughout a market cycle, it is expected that the Investment Advisor shall from time to time recommend that the Subcommittee change the asset mix within the above ranges or make asset allocations outside the limits prescribed above, for the purpose of increasing investment returns and/or reducing risk. However, the written consent of the Subcommittee is required to change the asset mix through reallocation beyond the minimum and maximum parameters set forth herein. D. U.S. PUBLICLY TRADED EQUITIES In keeping with the general investment philosophy, the Subcommittee expects the Investment Advisor to monitor the U.S. equity Managers to see that they maintain the publicly traded equity portfolio at a risk level similar to that of the benchmark equity indices as a whole, with the objective of meeting or exceeding its results as represented by the relevant equity indices over a three-year moving time period. Equity holdings in individually managed accounts may be selected from the New York, American and Regional Stock Exchanges, or the NASDAQ markets. U.S. equity Managers are generally prohibited from investing in private placements, letter stock, and options; or from engaging in short sales, margin
Exhibit II1-One
113

transactions or other specialized investment activities unless the Subcommittee agrees in writing under the terms of the Equity Managers’ investment management agreements. In addition, Investment Managers are prohibited from investing in derivatives. Within the above guidelines, the Subcommittee gives the Investment Managers full responsibility for security selection and diversification. However, Investment Managers should carefully review any position exceeding a 10% commitment of the account’s market value for an individual security and the lesser of a 50% commitment or three times the normal sector weighting for a particular economic sector. Such limits should not be exceeded on an ongoing basis, but may, from time to time be exceeded on a short-term basis. Investment Managers also will have full discretion over turnover and allocation of equity holdings among selected securities and industry groups, within the limits described above. While it is understood that Investment Managers will deviate from the representative indices, the Subcommittee wishes to limit the extent of potential underperformance. Because of the inherent difficulty in defining specific restrictions, which would cover all possibilities, the Subcommittee instructs Investment Managers to invest the equity component of the account to attempt to prevent the returns for that component from underperforming the relevant equity indices by more than 15% in any three consecutive quarters. All equity securities and cash held in individually managed equity accounts will be held in custody at a fully disclosed clearing broker-dealer. Alternatively, the Subcommittee may custody securities at a bank or other financial institution, although the Subcommittee will bear the additional costs of any such arrangements. All Investment Managers of individually managed accounts will be instructed to trade equity securities, whenever possible, through the designated custodians. The parties realize that this may not be possible in certain circumstances, for example when the designated custodian does not inventory an over the counter security. Securities in the designated custodians’ accounts will be protected up to the full value of the account for RMA and BSA accounts ($500,000 provided by SIPC, not in excess of $100,000 for claims relating to cash, and the remainder provided by a leading U.S. insurance carrier). E. FOREIGN EQUITIES In keeping with the general investment philosophy, the Subcommittee expects the Investment Advisor to monitor the foreign equity Managers/Mutual Funds to see that they maintain the equity portfolio at a risk level similar to that of the benchmark equity indices as a whole, with the objective of meeting or exceeding its results as represented by the relevant equity indices over a three-year moving time period. Foreign equity Managers are generally prohibited from investing in private placements, letter stock, and options; or from engaging in short sales, margin transactions or other specialized investment activities unless the Subcommittee agrees in writing under the terms of the equity Managers’ or Mutual Fund investment management agreements. In addition, Investment Managers are prohibited from investing in derivatives. Notwithstanding the foregoing, Mutual Funds may buy or sell option contracts and may hedge currencies. Within the above guidelines, the Subcommittee gives the Investment Managers full responsibility for security selection and diversification. However, an individual security should not have a position exceeding a 10% commitment of the account’s market value for an individual security. Such limits should not be exceeded on an ongoing basis, but may, from time to time be exceeded on a short-term basis. Managers/Mutual Funds also will have full discretion over turnover and allocation of equity holdings among selected securities and countries, within the limits described above.
Exhibit II1-One
114

While it is understood that Managers/Mutual Funds will deviate from the representative indices, the Subcommittee wishes to limit the extent of potential underperformance. Because of the inherent difficulty in defining specific restrictions, which would cover all possibilities, the Subcommittee instructs Manager/Mutual Funds to invest the equity component of the account to attempt to prevent the returns for that component from underperforming the relevant equity indices by more than 15% in any three consecutive quarters. F. FIXED INCOME Investments in fixed income securities will be managed actively by the Investment Managers to pursue opportunities presented by changes in interest rates, credit ratings and maturity premiums. Investment Managers may select from appropriately liquid, corporate debt securities and obligations of the U.S. Government and its agencies, foreign governments and their agencies, and securities convertible to equities. Investments in municipal or other federal tax-exempt securities are prohibited. The Subcommittee gives the Investment Managers full responsibility for security selection and diversification. Notwithstanding the foregoing, the Subcommittee desires to create a portfolio that is consistent with the duration of the Barclays Government/Corporate Intermediate Bond Index. The Investment Managers shall follow the following guidelines.
1. The Investment Managers shall invest in fixed-income obligations with maturities or expected life from zero to 20 years. The portfolio duration shall be no longer than that of the Barclays Government/Corporate Intermediate Bond Index plus six months.
2. Securities of a single issuer, the security for which is the same source (with the exception of the U.S. Government and its agencies) should not exceed 5% of the market value of the fixed income portfolio.
3. Corporate debt issues that are not investment grade quality (that do not have a credit rating of at least BBB or Baa or better from Standard & Poor’s or Moody’s, respectively); corporate debt issues with a BBB or Baa credit rating from Standard & Poor’s or Moody’s, respectively, should not constitute more than 5% of the income portfolio. In the event of a split between Standard & Poor’s and Moody’s, the higher shall be the qualified determinant.
Investment Managers are specifically prohibited from investing in private placements, from speculating in fixed income or interest rate futures, and interest rate options. In addition, the Managers will not engage in investment transactions involving stock options, short sales, purchases on margin, letter stocks, private placement securities or commodities.
While it is understood that the Investment Managers will deviate from the representative indices, the Subcommittee wishes to limit the extent of potential underperformance. Because of the inherent difficulty in defining specific restrictions, which would cover all possibilities, the Subcommittee instructs the Investment Managers to invest the domestic fixed income component of the account so as to attempt to prevent the returns for that component from underperforming the relevant fixed income indices by more than 15% in any three consecutive quarters.
Within the above restrictions, the Investment Managers have complete discretion over timing and selection of fixed income securities. G. ALTERNATIVE INVESTMENTS Alternative investments should be selected to provide the Subcommittee with diversification through less correlated asset classes. The Subcommittee foresees the possibility of using mutual
Exhibit II1-One
115
funds/collective trust funds/limited partnerships that may serve as alternatives to either equity or income investments, and understands that the Subcommittee would not have any control over the management of such funds with regard to specific guidelines and restrictions. Specifically, Subcommittee anticipates utilizing hedge fund of funds to allocate assets across long/short equity and multi-strategy hedge fund strategies. Underlying managers within alternative investment strategies may invest in private placements, letter stock and options, short sales, margin transactions, derivative contracts and any other strategy permitted within the offering documents of the investment vehicle. The Subcommittee and the Investment Advisor shall review the permitted investment strategies of such vehicles prior to investing in such vehicles. The performance of alternative investments will be expected to meet or exceed the performance of the benchmark determined by the Investment Advisor, over a full market cycle. H. CASH AND EQUIVALENTS The Investment Managers may invest in commercial paper, repurchase agreements, Treasury Bills, certificates of deposit, and money market funds to provide income, liquidity for expense payments, and preservation of the account’s principal value. Commercial paper assets must be rated A-1 or P-1 by Standard & Poor’s or Moody’s, respectively. The Investment Managers may not purchase short-term financial instruments considered to contain speculative characteristics (uncertainty of principal and/or interest). Uninvested cash reserves should be kept to minimum levels. Within the limitations mentioned above, the Investment Managers have complete discretion to allocate and select short-term cash and equivalent securities. I. OTHER ASSETS Investment Managers will not purchase assets other than those mentioned above without the written consent of the Subcommittee. Investments not specifically addressed by this Statement are prohibited without the Subcommittee’s written consent. J. COMMUNICATIONS The Investment Advisor and Investment Managers shall provide a regular account review detailing investment performance, strategy, and account value, with the following provision to ensure management of the financial and health care sectors of the portfolio is performed with limited knowledge of the Subcommittee and NAIC senior management. The only employees authorized to receive investment reports, purchase or sale confirmations, or brokerage statements shall be the Assistant Controller, Accounting Manager, and other Senior Finance Department staff members. No information regarding individual holdings in the financial and health care sectors shall be communicated to any member of the Subcommittee or any member of NAIC or their staff. Sale and purchase strategies with respect to the financial and health care sectors shall not be discussed with or otherwise communicated. Investment reports provided to personnel other than the Assistant Controller, Accounting Manager, or other Senior Finance Department staff member, and to the Subcommittee and NAIC members shall not include information regarding any of the individual holdings in the financial and health care sectors. The above restrictions shall only be waived or modified in writing by the Chief Financial Officer.
Exhibit II1-One
116

VII. INVESTMENT MANAGER SELECTION AND EVALUATION A. INVESTMENT MANAGER SELECTION The Subcommittee will rely on the Investment Advisor to select/recommend, and monitor the Investment Managers according to the stated policy guidelines and objectives contained within this document. Investment Managers will be screened for superiority of qualitative characteristics such as investment process and discipline, personnel and ownership structure. Quantitative characteristics such as absolute returns and risk-adjusted performance, consistency of returns and performance in both up and down markets will also be analyzed. The following chart sets forth the allocation to the selected Investment Managers in all equity and income asset classes. Note that specific descriptions of the styles of U.S. equity managers are provided herein. Managers may be changed from time to time without any amendment of this document, with notice to an agreement of the Subcommittee.
ASSET CLASS TARGET ALLOCATION
MANAGER COMPARATIVE INDEX
EQUITY/ALTERNATIVES U.S. EQUITIES
All Cap 4.25% Russell 3000 Yield Focused Equity 4.25% Schafer Cullen Capital
Management Russell 1000 Value
Large Cap Growth 8.25% Mitchell Capital Management Russell 1000 Growth Large Cap Value 8.25% Eagle Capital Management Russell 1000 Value Small Cap Value 7.50% Cardinal Capital Management Russell 2000 Value
FOREIGN EQUITIES 5.00% Tweedy Browne Global Value
Fund MSCI EAFE
LONG/SHORT EQUITY 7.50% Protégé Partners QP Ltd. HFRI Composite Fund of Funds LONG/SHORT INTERNATIONAL EQUITY
5.00% HFRX Global Hedge Fund
INCOME/ALTERNATIVES Core Bond 10.50% Metropolitan West Total
Return Barclays Aggregate Bond
Intermediate Fixed Income Securities
20.00% Mitchell Capital Management Barclays Intermediate Government/Credit
Core Bond 4.50% Loomis Sayles Investment Grade Bond
Barclays Aggregate Bond
Floating Rate Loan 5.00% Oppenheimer Senior Floating Rate
Credit Suisse Leveraged Loan
International Fixed Income 2.50% Templeton Global Bond Citigroup World Government International Fixed Income 2.50% Oppenheimer International
Bond Citigroup World Government
Master Limited Partnerships 5.00% Tortoise Capital Advisors/Kayne Anderson
Alerian MLP Index
Past performance is no guarantee of future results B. INVESTMENT MANAGER PERFORMANCE REVIEW AND EVALUATION Performance reports generated by the Investment Advisor shall be compiled at least quarterly and communicated to the Subcommittee for review. The investment performance of the total NAIC portfolio, as well as individual Investment Managers, will be measured against commonly accepted
Exhibit II1-One
117
performance benchmarks. Consideration shall be given to the extent to which the investment results are consistent with the investment objectives set forth in this statement. The Subcommittee intends to evaluate the NAIC portfolio over at least a three-year period, but will closely monitor performance throughout the year. The Subcommittee reserves the right to terminate an Investment Manager for any reason including but not limited to the following:
1. Investment performance significantly less than anticipated given the discipline employed and the risk parameters established or unacceptable justification of poor results.
2. Failure to adhere to any aspect of this statement of investment policy, including communication and reporting requirements.
3. Significant qualitative changes to the Investment Management organization. Investment Managers shall be reviewed regularly regarding performance, personnel, strategy, research capabilities, organizational and business matters and other qualitative factors that may impact their ability to achieve the desired investment results.
VIII. CONCLUSION This Policy will become effective upon adoption by the Executive (EX) Committee and will be adhered to by the Subcommittee, Investment Advisors and Investment Managers. Any proposed revisions must be approved by the Subcommittee before they are presented to the Executive (EX) Committee for final approval.
Exhibit II1-One
118

Business and Fiscal Impact
Statement Sum
mary


Fisc
alIm
pact
Capi
tal
Net
Im
pact
Capi
tal
Net
Im
pact
Num
ber
Des
crip
tion
Expe
nditu
reR
even
ueEx
pens
e20
14 B
udge
tEx
pend
iture
Rev
enue
Expe
nse
2015
Bu
dget
NAI
C 20
14 P
roje
ctio
ns/2
015
Budg
et B
efor
e Bu
sine
ss a
nd F
isca
l Im
pact
Sta
tem
ents
$98,
463,
404
$92,
712,
815
$5,7
50,5
89$9
7,55
9,56
0$9
5,63
9,24
0$1
,920
,320
Prop
osed
Bus
ines
s an
d Fi
scal
Im
pact
Sta
tem
ents
1St
ate
Base
d Sy
stem
s (S
BS)
Soft
war
e En
hanc
emen
t an
d Te
chno
logy
Com
plia
nce
Initi
ativ
e-Ph
ase
III
$2,8
46,0
2850
,505
(50,
505)
2Se
curit
ies
Syst
em R
ewrit
e (S
SR)-
Expa
nded
Pha
se I
490,
599
1,87
7(1
,877
)3
SER
FF I
nteg
ratio
n Ex
pans
ion
75,7
85(7
5,78
5)4
Stat
e Pr
oduc
er L
icen
sing
(SP
L) T
eam
Aug
men
tatio
n14
,659
156,
702
(156
,702
)5
Com
mer
cial
Mor
tgag
e-Ba
cked
Sec
uriti
es (
CMBS
) R
esou
rce
for
Stru
ctur
ed S
ecur
ities
Gro
up (
SSG
)53
,060
(53,
060)
6En
hanc
ed S
uppo
rt f
or M
embe
r U
se o
f El
ectr
onic
Wor
kpap
ers
50,1
4125
3,33
1(2
53,3
31)
720
15 R
even
ue M
odifi
catio
n(3
,291
,704
)(1
05,3
79)
(3,1
86,3
25)
Sub
tota
l Pro
pose
d Bu
sine
ss a
nd F
isca
l Im
pact
Sta
tem
ents
3,40
1,42
7(3
,291
,704
)48
5,88
1(3
,777
,585
)
NAI
C 20
14 P
roje
ctio
ns/2
015
Budg
et A
fter
Bus
ines
s an
d Fi
scal
Im
pact
Sta
tem
ents
$0$9
8,46
3,40
4$9
2,71
2,81
5$5
,750
,589
$3,4
01,4
27$9
4,26
7,85
6$9
6,12
5,12
1($
1,85
7,26
5)
NA
TIO
NA
L A
SSO
CIA
TIO
N O
F IN
SUR
AN
CE
CO
MM
ISSI
ON
ERS
2014
PR
OJE
CTI
ON
S/20
15 B
UD
GET
BU
SIN
ESS
AN
D F
ISC
AL
IMP
AC
T ST
ATE
MEN
TS
2014
Pro
ject
ion
2015
Bud
get
119

120

Fiscal Im
pact 1

BUSINESS AND FISCAL IMPACT STATEMENT DATE SUBMITTED: SEPTEMBER 5, 2014 NAME OF PROJECT/INITIATIVE: STATE BASED SYSTEMS (SBS) SOFTWARE
ENHANCEMENT AND TECHNOLOGY COMPLIANCE INITIATIVE – PHASE III
REGULATOR/BUSINESS SPONSOR: INTERNAL ADMINISTRATION (EX1) SUBCOMMITTEE NAIC STAFF SUPPORT JULIE FRITZ, CHIEF BUSINESS STRATEGY AND
DEVELOPMENT OFFICER, NAIC REQUESTED PROJECT START DATE: JANUARY 1, 2015 ANTICIPATED COMPLETION DATE: JUNE 30, 2016 TOTAL REVENUE GENERATED (2015): $0 (2016): $0 TOTAL EXPENSE REQUESTED (2015): $50,505 (2016): $1,524,384* TOTAL CAPITAL REQUESTED (2015): $2,846,028 *Includes amortization of $284,603 in 2016 for this phase of the project. Total amortization in 2016, $708,931, is based on the entire capitalized cost of this project over the expected 10-year useful life of the resulting software.
I. Executive Summary: As part of the 2013 budget process the membership approved the first of three phases of an initiative to rewrite the SBS software; in 2014, the second phase was approved; the 2015 request represents the third and final phase of the project. This initiative will result in a new SBS product suite offering enhanced performance, stability, and scalability as compared to the existing system. Phase I, occurring from February 2013-March 2014, involved the documentation of “as is” business requirements and “to be” requirements, evaluating database design and system architecture. The majority of work on this phase was complete by the end of March 2014 with only one consultant continuing with Phase I user interface work through June 2014. As anticipated in the Phase II proposal covering calendar year 2014, the vast array of user defined requirements across SBS services were finalized and resources were allocated to specified work teams known as scrum teams. Best practices were established to ensure that the five scrum teams stayed synchronized throughout the rest of the project. These teams focused
121

on developing the implementation plan, establishing the system’s design, refining the business requirements and database design, initiating the software development process, and analyzing the final phase of development. Phase III, presented as part of the 2015 budget process, covers the remaining tasks for deployment of the project during the period January 1, 2015, through June 30, 2016. These tasks include completion of development, testing, training, and implementation of licensed states on the new SBS platform. The system is expected to deploy between January 1 and March 31, 2016, followed by post-implementation support. Several consultants will be retained through June 2016 to assist with any post-release issues. The final phase of the project contains the following objectives:
• Consolidate all state-specific databases and applications. • Leverage a new technical infrastructure and new software development tool set. • Develop and implement a new uniform user interface across all licensing and market
regulation SBS applications, including expansion of functionality. • Rewrite all industry applications, including providing the ability to conduct business with
multiple states through the same log-in credentials. • Incorporate the structure to consolidate a master entity type. • Rewrite and test producer licensing data transfer processes integrated with NIPR and
the State Producer Licensing Database (SPLD). • Incorporate the NAIC State Interface leveraged for NIPR transactions into SBS,
ensuring continued access and support for non-SBS states. • Code and utilize SBS Enforcement interface to address NAIC Transaction Utility
functions for RIRS upload in SBS states and non-SBS states to eliminate duplicative processes.
• Add responsive technology where applicable and feasible across SBS applications to enable access via mobile devices.
• Map, migrate, and test all state data to the new tables. • Modify and test all 200-plus vendor state-specific file exchanges. • Incorporate automated testing in behavior-driven context for all code.
To accomplish these goals, this fiscal includes a capital request for $2,846,028 for 17 consulting resources. In addition, expenses will be incurred in 2015 and 2016 related to the finalization of the project, including $814,253 in consulting for post-implementation support in 2016. The total cost of the project is expected to be $7.9 million, $600,000 more than the 2014 fiscal projected. Of this $7.9 million, nearly $7.1 million is in capitalized consulting which will be amortized over 10 years, beginning when the new system is placed in service in 2016. The increased project cost reflects more detailed analysis and a slightly expanded technical scope, such as incorporation of a master entity concept; user interface adaptations to incorporate recently established common design concepts across all NAIC applications; addition of SBS staging project responsibility; fusion with mobile application technology; inclusion of dashboard reporting; and the addition of a concept of providing one set of code for use in multiple applications in a manner that is transparent to the users. In addition, the estimated effort to ensure successful conversion to the new SBS product suite, while minimizing interruptions with NIPR processes, is larger than originally anticipated and the transition to new development tools and methodology has had a larger-than-anticipated learning curve However, the new tools and methodology will result in reduced support efforts over the longer term.
122

II. Benefits of Project/Initiative to NAIC Members: The mission of the NAIC is to assist state insurance regulators in serving the public interest and achieving fundamental insurance regulatory goals in a responsive, efficient, and cost-effective manner, consistent with the wishes of its members. The SBS initiative is one tool that enables the NAIC to fulfill its mission by providing an application that ensures the success of insurance regulatory goals for states licensed to use SBS. The benefits of the SBS initiative are described below.
• Compliance with NAIC Initiatives: SBS offers a back-office solution for states to comply with national state regulatory initiatives. Initially, the focus was on streamlining producer licensing. Over time, continuing education, company licensing, consumer complaints, enforcement, and investigation functionality has been added. One example is the implementation of producer uniform application changes that have been implemented periodically over time. Another recent example is related to revised consumer complaint coding, which was completed in 2013. As these initiatives are approved, SBS will be enhanced to accommodate each initiative, thus allowing all states utilizing the affected market regulation services within SBS to be in compliance. Today there are 28 states licensed for SBS, 25 of which currently utilize SBS services that support NAIC uniformity initiatives or model laws, and one more jurisdiction in the process of a service implementation in late 2014. Two additional states will be deployed in 2016 following the conversion of all existing states using SBS services in a production environment. More states have recently expressed interest in leveraging SBS.
• Ability to meet State Business Needs: Each state has varying business needs, most of which are mandated by law. SBS is currently able to fill the wide variety of needs across states but with the current application it can be time consuming and cumbersome. This rewrite of SBS will enhance the NAIC’s ability to accommodate these different business needs more quickly and efficiently.
• Cost Savings to the States: States have chosen SBS as their back-office solution as it provides a way to reduce costs. In some cases, states are able to utilize resources to prioritize other responsibilities they had not been able to address in the past, or to work on important but lower priority projects. Other states have been able to process more applications and consumer complaints due to efficiencies within SBS. Nearly all states have been able to eliminate or reduce their hardware and software costs, since SBS is hosted by the NAIC’s Central Office in Kansas City, and they are able to rely on NAIC staff to handle system issues and help desk calls.
• Streamlined Data Entry Processes: Implementing the online functionality for SBS, which includes using NIPR resident and non-resident producer licensing, significantly reduces the amount of data entry required of state insurance department staff. These interfaces allow data entry by the applicant. This functionality provides significant labor cost savings to state insurance departments. The same benefit accrues to complaints processing when complaints are submitted to the state online.
• Speed to Market: By improving the efficiency of the licensing and appointment process, insurance companies and producers benefit by being able to market products faster.
• Modernization: A web application eliminates or significantly reduces time and effort required to maintain software, operating system, and processor issues encountered using client-server systems. The SBS system includes the advantage of increasing customer satisfaction and reducing demands on states’ licensing/customer service personnel, as licensees are able to initiate licensing applications/changes and
123

continuing education providers are able to upload course rosters online 24 hours a day, seven days a week and are able to obtain status checks online.
As demonstrated in the benefits above, SBS as it exists today is a viable solution and offers the states a cost-effective solution for many of its back-office functions. However, its antiquated code and inflexible design have translated into greater maintenance and support costs for the NAIC and have prevented the system from achieving its full potential. This system rewrite will result in a number of additional benefits as outlined below.
• Expanded State Usage: The matrix for the SBS software products, functionality, and
users has grown exponentially over the years. Growth of the number of SBS states has been a challenge for the current version of SBS software, which originally encompassed a handful of services for fewer than five jurisdictions. The code has encountered significant difficulties accommodating this growth. The result is although the system functions it does not do so efficiently. The SBS software redesign must continue in order to accommodate SBS users’ need for compliance with NAIC initiatives, state statutes, and the changing needs of the state users.
• NAIC Application Integration: Today, the current system has links to other NAIC applications, such as I-SITE, SERFF, and OPTins but does not fully integrate the functionality within SBS. This rewrite will allow full integration with NAIC applications, leveraging a single security infrastructure and tying revenue collection and reporting such that these functions could occur within SBS and not require state personnel to log in to different applications.
• Product Efficiencies: State users have provided feedback over the past decade as to improvements that could be made in the system as a whole that cannot truly be considered without rewriting the entire system. Thus the rewrite will enable the NAIC to address these improvements and gain efficiencies in handling changes in workflow, presentation, and user preferences.
• NAIC Standards: There are several benefits of moving SBS to the standard NAIC Technology platform and toolset. 1) Gain the standard set of application development environments to allow better
quality management throughout the development life cycle, resulting in faster delivery of products.
2) Satisfy the NAIC development best practices for separation of responsibilities (e.g., separation of code deployment).
3) Fully utilize current NAIC software quality management techniques that incorporate testing and test case development from start to finish.
4) Ability to use rapid development tools that are currently unavailable with the JAVA platform used today by SBS developers.
III. Stakeholders: There are a number of different stakeholders impacted by the rewrite of the SBS system. Each stakeholder is highlighted below:
• SBS Licensees/NAIC Members: The key stakeholders are the NAIC members that have licensed SBS and those interested in participating in the SBS initiative, as they would receive the benefit of utilizing the low-cost, web-based system for licensing, market regulation, consumer services, legal, enforcement, investigations, revenue, project tracking, regulated industries, and financial examinations business areas incorporated into SBS. The goal of this project is to pursue the rewrite while continuing
124
to meet the business needs of the licensees utilizing the current system and the licensees in the midst of implementation. SBS has a Product Steering Committee composed of business users from each licensed state who meet regularly to determine the expansion of functionality to meet business needs or to address efficiency improvements. This group has been repurposed during the life of the rewrite project to play a key role in determining business requirements and state synergies.
• NIPR: NIPR is a key stakeholder for resident and nonresident licensing, appointment and termination, attachment warehouse, and address change data needs that flow through the NIPR and SBS systems for SBS states.
• Insurance Companies, Insurance Agencies, Producers, Providers, and other Regulated Entities: Licensed entities have the advantage of being able to submit their licensing applications, renewals, registrations, and reports online; which reduces the time for approval and receiving the license or certificate of authority. It also eliminates the potential for data errors that can occur with hardcopy submissions to states which require data entry. Providers benefit from the ability to submit provider applications, course applications, instructor applications, and course rosters online, thus streamlining the process of meeting regulatory requirements.
• Consumers: Licensee Lookup and complaints functionality make Consumers stakeholders as well. Consumers are able to query the SBS database and confirm that a producer has an active license and/or utilize the system to file complaints against insurance entities online.
• NAIC Staff: There are a number of NAIC staff who are participating in the rewrite either in a limited role or full time. This includes the current SBS team of managers, business analysts, software engineers, data migration specialists, systems liaisons, and software quality engineers. In addition, staff members from other departments and divisions are also participating, including database analysts, application architects, the data modeler, and the quality assurance staff. Upon completion of the project, support and maintenance of the system should be reduced compared to the legacy system, although the growing number of states will require significant resources to support.
IV. Business and Operational Impact: The primary impact of this initiative has been to the stakeholders listed above. In terms of the impact on the business and operations of the NAIC, it has been the hiring of the necessary consulting staff and the provision of office space and equipment to accommodate these resources. That said, it should be noted that the NAIC Finance Department will not need to add any processes to the workflow to accommodate this project, nor will NAIC Human Resources need to expend resources to recruit and hire new permanent staff. From an enterprise perspective, this project has required the assistance from an NAIC application architect, database administrator, and data modeler. The SBS team is allocating a portion of its workload to the oversight and deployment of this initiative. The current technology restricts SBS staff’s ability to add new states efficiently. Without this rewrite, it is more than likely additional headcount would be requested in the future in order to accommodate additional state licensees. The rewrite is, therefore, expected to streamline the application to the degree additional headcount would not be necessary.
125

V. Financial Impact: Expenses: Amortization ($284,603 in 2016 for Phase III CAPEX associated with this project, total amortization costs for this project in 2016 including all capital expenditures incurred since 2013 will be $708,931): Upon implementation of the software, the 10-year amortization period for the full project will begin. This fiscal assumes amortization will start on January 1, 2016. Professional Services-Consulting ($814,253 in 2016): Following the implementation of the software for the first state in January 2016, consulting will be expensed through June in support of the remaining implementations. Summit Training ($48,330 in 2015): In lieu of the annual SBS Product Steering Committee meeting normally held in the fall, training will be held in late 2015 and early 2016 to assist regulators with the transition to the new system. Conference Room Rental ($1,375 in 2015): Space in office building housing the NAIC Central Office will be rented for the Summit Training session held in November. Telephone ($800 in 2015; $1,200 in 2016): The SBS team will conduct webinars in late 2015 and early 2016 to educate state and industry users of the new system. Capital: Included in this fiscal is a capital request of $2,846,028, for consulting services in 2015. This incurrence, along with the capital expenditures from 2013 and 2014, will be amortized over a 10-year period, once the rewrite is completed and the new system is placed in service in January 2016. With a total expected capital outlay for this project of roughly $7.1 million, annual amortization expense will be $710,000. The NAIC annual expense impact per existing licensed state is approximately $25,357. For most of these states, SBS provides producer licensing, continuing education, company licensing, consumer services, and complaint handling. For many of the states, it also provides additional market regulatory services such as enforcement, case investigations, and market examinations. Taking into account the variety and breadth of services that SBS offers, it would not be possible for a state to build and support a similar back-office system for a 10-year period for $253,210, illustrating the value provided to states with this NAIC initiative. In addition, it is anticipated this project will result in ongoing support savings of $100,000 per year for hardware and related expenses. While licensing new states is not guaranteed, the track record for SBS demonstrates growth on a consistent basis. In recent years, SBS has implemented at least two states per year. The improved code is expected to increase the attractiveness to more states, thereby resulting in additional revenues. In fact, a number of states have expressed significant interest in moving to SBS, some of which have encouraged the NAIC to begin implementation projects prior to the release of the new software. See Attachment I for the financial impact details.
126

VI. Alternatives or Partnerships: It is a best business practice for the NAIC to maintain ownership and control over future applications and services. As a result, the only alternative to this project is to cease support of the systems and require states to assume the responsibility to develop and maintain similar systems. VII. Risk Management: There are a number of risks associated with rewriting the system:
• Initially, difficulties marketing SBS while rewriting the application were anticipated, thereby resulting in a state delaying its decision to implement SBS or deciding to go with an alternative option. However, the current risk is that several states have requested expedited implementation prior to the implementation of the new software, which is placing tremendous pressure on the resources allocated to the project. Discussions are continuing with the new states to determine the best approach for addressing their needs.
• The rewrite may require more resources than are currently contemplated to successfully complete the next phase of the project, which will increase the costs, or it may take longer than expected to complete the project. This will be especially true if SBS staff is required to undertake any additional legacy SBS implementations for states with pressing needs.
• It will continue to be challenging to build a new system as well as continue to provide customer support and enhancements to the current system. Maintaining the existing systems has required more resources to support than originally anticipated, resulting in resources transitioning to the rewrite in slower manner.
• Current state implementations may experience unexpected delays and thus interfere with the rewrite timeline. Alaska was successfully implemented in late 2013 without delays; Arkansas is on track to be implemented in the fall of 2014 without causing delay in the system rewrite. Two additional states are in initial implementation stages and these projects may impact resource allocations for the rewrite.
• The system may not produce the efficiencies expected.
If this proposal is not approved, the NAIC is subject to the following risks: • The current set of software runs the risk of not being able to deploy new
enhancements for state implementations in a timely manner. • The current set of software runs the risk of not being able to deploy new
enhancements and fixes for existing state services. • The current set of software will run unsupported on its existing infrastructure, as the
vendor providing portions of the hardware/software will cease offering support. • The complexity of the current system increases with every state that implements SBS,
which makes future implementations more difficult, more costly, and more time consuming. The rewrite eliminates this complexity by developing, designing, and implementing a system to accommodate all of the services and options required today rather than continuing to enhance a system designed primarily to support producer licensing.
• The amount of time required to support and maintain the current system is high and has led to significant turnover in staff. If this issue is not addressed, the SBS Department will continue to lose staff and will find it difficult to attract the necessary resources to maintain the system.
127

128

20
15
Bu
dget
Bu
sin
ess
and
Fisc
al I
mpa
ct S
tate
men
t P
roje
ct C
ost
An
alys
isR
even
ues
, Exp
ense
s an
d C
apit
al E
xpen
ditu
res
Pro
ject
/In
itia
tive
: S
tate
Bas
ed S
yste
ms
(SB
S) S
oftw
are
Enh
ance
men
t an
d Te
chn
olog
y C
ompl
ian
ce I
nit
iati
ve -
Ph
ase
III
20
15
An
nu
al2
01
52
01
62
01
7D
escr
ipti
onB
udg
etJa
nu
ary
Febr
uar
yM
arch
Apr
ilM
ayJu
ne
July
Au
gust
Sept
embe
rO
ctob
erN
ovem
ber
Dec
embe
rTo
tal
Bu
dget
Bu
dget
Rev
enu
es:
Non
e
T
otal
Rev
enu
es-
-
-
-
-
-
-
-
-
-
-
-
-
-
-
-
Expe
nse
s:Po
st-im
plem
enta
tion
cons
ultin
g-
$814
,253
Sum
mit
Trai
ning
exp
ense
s$4
8,33
0$4
8,33
0$4
8,33
0Co
nfer
ence
Roo
m R
enta
l1,
375
1,37
5
1,37
5
Web
inar
s fo
r st
ate
and
indu
stry
tra
inin
g80
0
400
$400
800
1,20
0
Amor
tizat
ion
(Beg
ins
with
impl
emen
tatio
n)-
708,
931
$708
,931
T
otal
Exp
ense
s5
0,5
05
-
-
-
-
-
-
-
-
-
-
50
,10
5
4
00
50
,50
5
1,5
24
,38
4
70
8,9
31
Rev
enu
es O
ver
(Un
der)
Exp
ense
s($
50
,50
5)
$0
$0
$0
$0
$0
$0
$0
$0
$0
$0
($5
0,1
05
)($
40
0)
($5
0,5
05
)($
1,5
24
,38
4)
($7
08
,93
1)
Cap
ital
Pu
rch
ases
:Ca
pita
l Con
sulti
ng$2
,846
,028
$237
,169
$214
,581
$248
,463
$248
,463
$225
,875
$248
,463
$248
,463
$237
,169
$237
,169
$248
,463
$214
,581
$237
,169
$2,8
46,0
28
T
otal
Cap
ital
Pu
rch
ases
$2
,84
6,0
28
$2
37
,16
9$
21
4,5
81
$2
48
,46
3$
24
8,4
63
$2
25
,87
5$
24
8,4
63
$2
48
,46
3$
23
7,1
69
$2
37
,16
9$
24
8,4
63
$2
14
,58
1$
23
7,1
69
$2
,84
6,0
28
$0
$0
20
15
Bu
dget
Spr
ead
129
ATTACHMENT I

130

Fiscal Impact 2

BUSINESS AND FISCAL IMPACT STATEMENT DATE SUBMITTED: SEPTEMBER 5, 2014 NAME OF PROJECT/INITIATIVE: SECURITIES SYSTEM REWRITE (SSR) – EXPANDED
PHASE I REGULATOR/BUSINESS SPONSOR: INTERNAL ADMINISTRATION (EX1) SUBCOMMITTEE NAIC STAFF SUPPORT JEFF JOHNSTON, SR. DIRECTOR, FINANCIAL
REGULATORY AFFAIRS JULIE FRITZ, CHIEF BUSINESS STRATEGY AND
DEVELOPMENT OFFICER REQUESTED PROJECT START DATE: IN PROGRESS ANTICIPATED COMPLETION DATE: AUGUST 31, 2016 TOTAL REVENUE GENERATED (2015): $0 (2016): $0 TOTAL EXPENSE REQUESTED (2015): $1,877 (2016): $50,730* TOTAL CAPITAL REQUESTED (2015): $490,599 (2016): $1,031,308 *2016 expense is amortization of capital requested in this fiscal only. I. Executive Summary: In 2014, a fiscal request was approved for the first phase of a multi-year project to rewrite the existing NAIC securities related systems, including the Integrated Securities Information System and its components, while incorporating new business processes to support the Capital Markets and Investment Analysis Office in New York, NY comprised of the Securities Valuation Office (SVO), the Capital Markets Bureau (CMB), and the Structured Securities Group (SSG). The business and technology issues with the current system, including the outdated, inflexible language in which it is written and the need to streamline the processes of capturing, storing, and evaluating securities-related data were outlined in the fiscal. These functions support existing industry services that are critical for regulatory compliance and oversight such as the processing of securities valuation regulatory treatment analysis requests submitted to the NAIC. The approved fiscal included one short-term and eight full-time consulting positions, for a total capital outlay of $1.6 million.
131

The fiscal assumed an April 2014 start date, with initial functionality to be delivered in three releases: July 2014, September 2014, and May 2015. The objectives of the initial phase of this project were to design a new technology structure for the project, build a preliminary data model, conduct analysis, and design for the next phase of the project and analyze, design, develop, and deploy key functionality that had been specified as first priority by the SVO. In late 2013, the technical team responsible for the redesigned system experienced significant, unforeseen resource constraints. In addition, system modifications originally identified in the first phase of the fiscal were reprioritized by the new directors of the SVO and SSG, who had been hired shortly before the submission of the fiscal. Recovery of the technical team’s resources and an in-depth evaluation of the new directors’ priorities were necessary before commencing the project. Therefore, in early 2014, a decision was made to delay the start of the project until October 2014. An extensive road mapping session was held in April 2014 with the three business areas to provide a better understanding of the reprioritized business needs. A demonstration of the NAIC’s SERFF system was conducted, allowing the business users to visualize how components of the proposed new system might function in a similar fashion, to facilitate the efficient filing of securities information and effective communication with the filers. Based on the discussions during this session, new business needs were identified which altered the scope of the project. To summarize, the business needs identified were as follows:
• A completely new, significantly altered workflow design for all system users (external users, analysts, and administrators) that brings together the filing process, the communication of missing components, the searching of securities on the various databases at the NAIC, and the determination of the status of the credit analysis.
• A more robust, sophisticated, and automated filing assignment process based on information within data feeds currently purchased but not fully utilized as well as data feeds not currently available.
• An incentive-based billing process in order to improve the timing of the filings to the NAIC. Such a change to the billing process was beyond that envisioned with the original fiscal; however, the design of such a process must be incorporated into the initial stages of the project.
• A billing process that incorporates group billing in addition to individual company billing. • A filing interface that is able to support new types of filings such as Structured Agency
Credit Risk transactions (STACRS) and Exchange Traded Funds (ETFs). • An increase in the number of data fields that are leveraged from vendor feeds. The
business need is to leverage 100% of the data that is available in these feeds, but this is not possible with the current system. Utilizing the full volume of data will require significant effort to store the data and to appropriately disseminate it to the analysts through the system.
• The addition of several new vendor feeds such as CUSIP’s Syndicated Loans and Business Entity Cross-Reference Service.
• The adaptation to a new file format for at least two of the vendor feeds, which is required by the vendors and has a specific deadline that must be addressed as a priority not originally envisioned with the submitted fiscal in 2014.
With the emergence of the new business needs, it is necessary to revise the initial proposal priorities, deliverables, and approach as well as incorporate new information into the project.
132
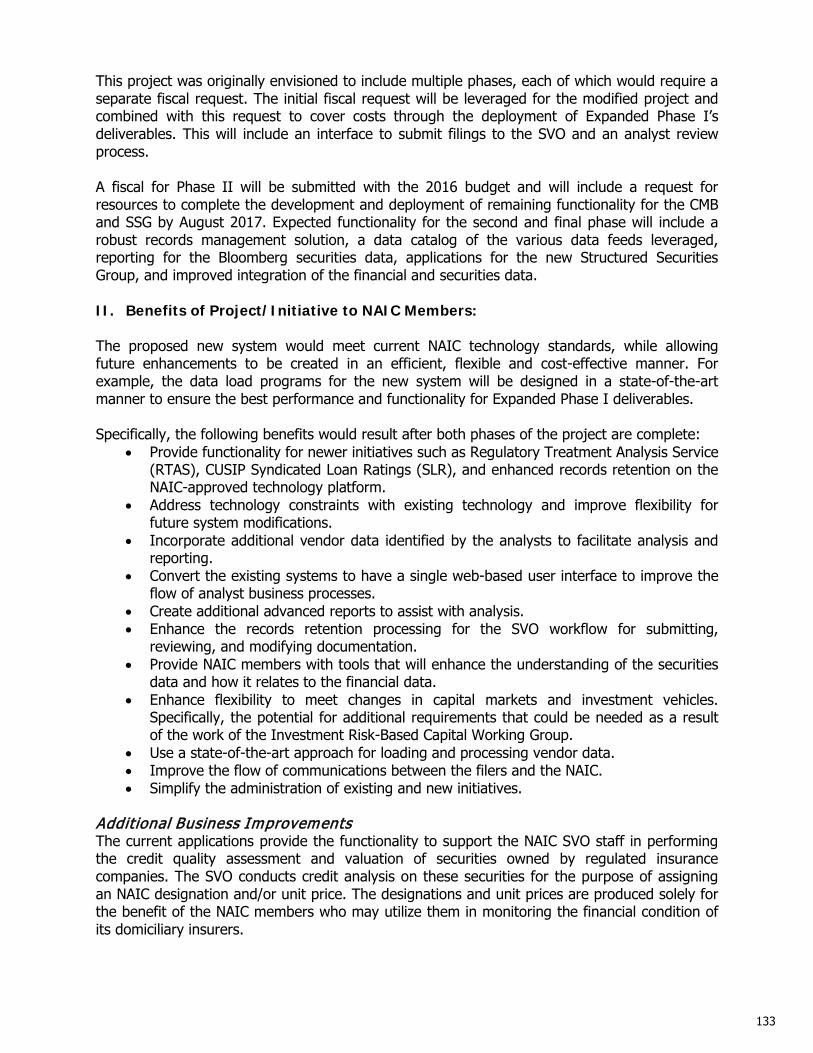
This project was originally envisioned to include multiple phases, each of which would require a separate fiscal request. The initial fiscal request will be leveraged for the modified project and combined with this request to cover costs through the deployment of Expanded Phase I’s deliverables. This will include an interface to submit filings to the SVO and an analyst review process. A fiscal for Phase II will be submitted with the 2016 budget and will include a request for resources to complete the development and deployment of remaining functionality for the CMB and SSG by August 2017. Expected functionality for the second and final phase will include a robust records management solution, a data catalog of the various data feeds leveraged, reporting for the Bloomberg securities data, applications for the new Structured Securities Group, and improved integration of the financial and securities data. II. Benefits of Project/Initiative to NAIC Members: The proposed new system would meet current NAIC technology standards, while allowing future enhancements to be created in an efficient, flexible and cost-effective manner. For example, the data load programs for the new system will be designed in a state-of-the-art manner to ensure the best performance and functionality for Expanded Phase I deliverables. Specifically, the following benefits would result after both phases of the project are complete:
• Provide functionality for newer initiatives such as Regulatory Treatment Analysis Service (RTAS), CUSIP Syndicated Loan Ratings (SLR), and enhanced records retention on the NAIC-approved technology platform.
• Address technology constraints with existing technology and improve flexibility for future system modifications.
• Incorporate additional vendor data identified by the analysts to facilitate analysis and reporting.
• Convert the existing systems to have a single web-based user interface to improve the flow of analyst business processes.
• Create additional advanced reports to assist with analysis. • Enhance the records retention processing for the SVO workflow for submitting,
reviewing, and modifying documentation. • Provide NAIC members with tools that will enhance the understanding of the securities
data and how it relates to the financial data. • Enhance flexibility to meet changes in capital markets and investment vehicles.
Specifically, the potential for additional requirements that could be needed as a result of the work of the Investment Risk-Based Capital Working Group.
• Use a state-of-the-art approach for loading and processing vendor data. • Improve the flow of communications between the filers and the NAIC. • Simplify the administration of existing and new initiatives.
Additional Business Improvements The current applications provide the functionality to support the NAIC SVO staff in performing the credit quality assessment and valuation of securities owned by regulated insurance companies. The SVO conducts credit analysis on these securities for the purpose of assigning an NAIC designation and/or unit price. The designations and unit prices are produced solely for the benefit of the NAIC members who may utilize them in monitoring the financial condition of its domiciliary insurers.
133

This project will meet the newly identified business needs for enhancements currently considered by the Capital Markets and Investment Analysis Office such as the records retention project, advanced reporting tools, and processes for RTAS and CUSIP Syndicated Loan Ratings. The project will also provide a platform for performing research and analysis to consider loading additional data from the various vendor feeds to increase reporting power for several entities such as the SVO, the Financial Regulatory Affairs Division, the Capital Markets Bureau, and the Structured Securities Group. In addition, the project is envisioned to include a workflow system for insurance company filers, a suite of tools that does not exist in the current system, but should further enhance the regulatory compliance processes associated with securities valuation. Technology Constraints Addressed: The proposed upgrade will replace the current C/C++ and Microsoft VB.NET technology platforms for the NAIC securities systems. Both technologies are costly to program and support and are on the NAIC’s obsolete software list. Another NAIC standard that the current system/components do not currently meet is the ability for a program to retrieve data from various locations in an efficient manner, thus enhancing the development, testing, and production release processes. Modifying existing systems to be able to do this would take at least 15 months with a minimum cost of $347,820. This project includes this functionality thus avoiding this cost. Rewriting the systems will allow the NAIC to comply with standards and leverage other enterprise tools to include automated builds, code auditing, developer metrics, and testing, which are designed to heighten the quality of the delivered product. Increased Efficiencies: The code used to develop the system, C/C++, has many limitations for code builds and upgrades to servers. This can relate to issues when multiple software engineers work on a project and deploy the code to a specific environment at the same time. Changing to an all-JAVA application will reduce this type of error. The deployment process for the desktop application is also error-prone due to the different structure and technology base currently utilized for that process. Eliminating the need for VB.NET will also reduce time and resources for deploying the desktop application and technical setup. Creating the new application will allow automation of unit tests within the system by software engineers. This process should greatly reduce errors for development and promote a higher quality product. Automated regression scripts will be developed to provide a standard User Interface (UI) test for the new functionality created for the system. All processes will be reviewed to ensure that a streamlined approach will be used to find ways to improve and enhance the user experience and processing timeframes. An example of this is the Authorization to File (ATF) process. What should be considered a simple business change such as an updated header on a template is in fact currently a complex modification that requires a code deployment with extensive testing. This kind of fragility in a system prevents the NAIC from quickly responding to business needs or marketplace changes. The design of the new system will allow an approach to be used which will require fewer templates and use metadata and business rules to drive changes. This will in turn reduce maintenance costs in the future for these changes.
134

Research will also be performed during Expanded Phase I to create an online catalog approach to allow the securities metadata repository to be used with a web-based tool by staff at the NAIC. This will carry forward the data dictionary project initiated by the Capital Markets Bureau in early 2013. III. Stakeholders: The primary stakeholders are:
• NAIC Membership: One of the primary stakeholders are the NAIC members who will have the benefit of utilizing the securities-related data or have business needs that will be meet via the new system. Work performed by the SVO analysts is directed by the Valuation of Securities (E) Task Force, the members of which will benefit from the improved flexibility of changes deployed with the new system.
• Insurance Companies, Third-Party Administrators, other Regulated Entities, and Financial Institutions: Insurers will have the advantage of filing securities for review with the NAIC in a streamlined interface with improved search capabilities. These entities will also gain a benefit from the automated RTAS processing and the additional CUSIP Syndicated Loans Ratings data.
• NAIC Staff: With regard to the technical resources, this project will utilize NAIC Central Office staff in Kansas City as well as several Capital Markets and Investment Analysis Office staff in New York. NAIC staff will also benefit from the improved technology and reduced overhead currently required to manage an antiquated system. As functionality is deployed, the SVO, Financial Regulatory Affairs, and Information Systems business units of the NAIC will benefit from the new system. Other departments and divisions, such as the database analysts, application architects, and the quality assurance staff, will be positively impacted by improved processes.
• Vendors providing data feeds: During the course of this project, it is anticipated that the NAIC will streamline the process whereby data is received, thus creating efficiencies for both the NAIC and data vendors.
IV. Business and Operational Impact: This proposal will impact the business, operations, and technical areas of the NAIC. Consulting staff will be used for the first phase of the project while using existing staff to supplement these resources. From an enterprise perspective, this project will require support from the application architects, security and database administrators, data modeler, and quality assurance staff. They will be involved in the new project for application design, code review, database modifications and creation, system access, and testing and promotion of code for the new application while providing support for the current applications during both phases. The securities data is also utilized for reporting mechanisms by the Information Systems and the Financial Regulatory Affairs divisions. V. Financial Impact: Expenses: Amortization ($50,730 in 2016 for this portion of the project): Upon implementation of the software in Expanded Phase I, the 10-year amortization period of the new Securities System will begin. This fiscal assumes amortization of all of Expanded Phase I’s consulting capital will start on September 1, 2016.
135

Non-capital equipment ($1,877 in 2015): Equipment and software is required to support two additional consultants for Expanded Phase I’s work, which includes a zero client computer set up with dual monitors, Visio, and Visual Paradigm. Capital: This fiscal addresses the following additional capital needs that have been identified for Expanded Phase I:
• A Scrum Master/Implementation Tester consultant has been added to the request in order to assist with the additional analytical and testing needs.
• A Software Engineer position has been added to backfill the current primary work of the Senior Developer on the team who will be serving on the project’s technical leadership team. Many new business needs identified in the April road mapping necessitates the use of an internal staff member, who was not allocated to this project full time in the original fiscal.
• Increased cost for the consultant technical lead for this project as the rate for that consultant is higher than originally proposed.
• Extension of nine retained consultants through the end of the Expanded Phase I and delivery of core securities systems for the SVO.
The request for the additional $1,521,907 in capital to complete the Expanded Phase I work is summarized in the following table.
Expanded Phase I Consulting Summary
Phase 1 Consulting
Original Request
Additional Amount
Requested for this Fiscal
Project Manager/Architect/SE $522,272 $305,500 $216,772 Business Analyst 208,040 396,800 (188,760) Systems Liaison 227,400 170,625 56,775 Software Quality Engineer 263,700 172,500 91,200 Software Engineers (five) 1,570,128 540,000 1,030,128 Scrum Master/ Implementation Tester 315,792 315,792 Web Designer 15,680 15,680
Total $3,123,012 $1,601,105 $1,521,907 See Attachment I for the financial impact details. VI. Alternatives or Partnerships: The primary alternative to this request is to maintain the current C/C++ and VB.NET applications and incur the additional costs for implementing new initiatives into antiquated systems with obsolete technology. The initial estimate to modify the existing system to incorporate enhanced functionality was nearly $1.5 million. Given the change in project scope, it is not possible to modify the existing system to address all previously and newly identified project needs. Therefore, there are no feasible alternatives or partnerships that would result in a comparable outcome.
136

VII. Risk Management: There are three primary risks for not upgrading the current systems.
1. Supporting outdated technology – Required system upgrades in the future may result in the functionality not being available. This risk will increase as upgrades occur and additional complex functionality is added to the current systems. Not only is there a risk of system failure but also of being unable to quickly respond to regulatory requirements in a timely manner.
2. Locating qualified programmers – Qualified C/C++ programmers in the current job
market are difficult to find and/or train as technology trends in general have shifted away from this platform.
3. From a business perspective, supporting a progressively fragile system for even simple
business requirements is increasingly difficult. During the life of this project, the implementation of the new software will be monitored by management to ensure it is completed accurately and on schedule.
137

138
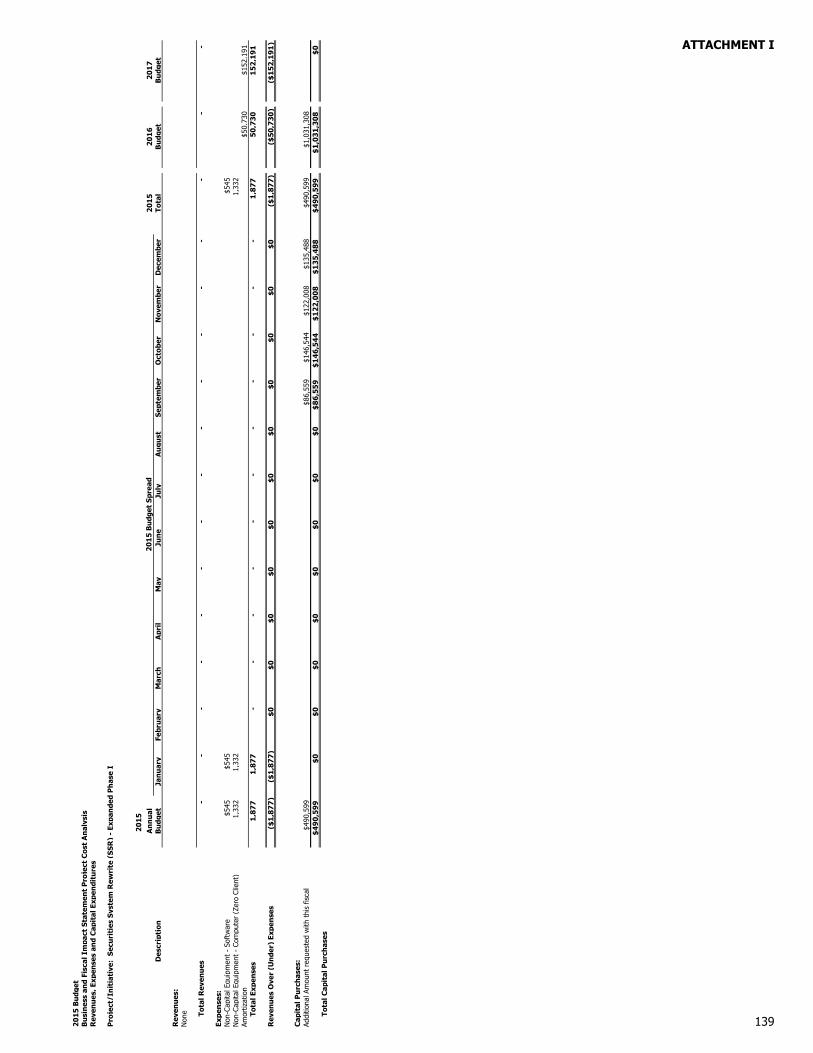
20
15
Bu
dget
Bu
sin
ess
and
Fisc
al I
mpa
ct S
tate
men
t P
roje
ct C
ost
An
alys
isR
even
ues
, Exp
ense
s an
d C
apit
al E
xpen
ditu
res
Pro
ject
/In
itia
tive
: S
ecu
riti
es S
yste
m R
ewri
te (
SS
R)
- Ex
pan
ded
Ph
ase
I
20
15
An
nu
al2
01
52
01
62
01
7D
escr
ipti
onB
udg
etJa
nu
ary
Febr
uar
yM
arch
Apr
ilM
ayJu
ne
July
Au
gust
Sep
tem
ber
Oct
ober
Nov
embe
rD
ecem
ber
Tota
lB
udg
etB
udg
et
Rev
enu
es:
Non
e
T
otal
Rev
enu
es-
-
-
-
-
-
-
-
-
-
-
-
-
-
-
-
Expe
nse
s:N
on-C
apita
l Equ
ipm
ent
- So
ftw
are
$545
$545
$545
Non
-Cap
ital E
quip
men
t -
Com
pute
r (Z
ero
Clie
nt)
1,33
2
1,
332
1,
332
Amor
tizat
ion
$50,
730
$152
,191
T
otal
Exp
ense
s1
,87
7
1
,87
7
-
-
-
-
-
-
-
-
-
-
-
1
,87
7
50
,73
0
15
2,1
91
Rev
enu
es O
ver
(Un
der)
Exp
ense
s($
1,8
77
)($
1,8
77
)$
0$
0$
0$
0$
0$
0$
0$
0$
0$
0$
0($
1,8
77
)($
50
,73
0)
($1
52
,19
1)
Cap
ital
Pu
rch
ases
:Ad
ditio
nal A
mou
nt r
eque
sted
with
thi
s fis
cal
$490
,599
$86,
559
$146
,544
$122
,008
$135
,488
$490
,599
$1,0
31,3
08$
49
0,5
99
$0
$0
$0
$0
$0
$0
$0
$0
$8
6,5
59
$1
46
,54
4$
12
2,0
08
$1
35
,48
8$
49
0,5
99
$1
,03
1,3
08
$0
T
otal
Cap
ital
Pu
rch
ases
20
15
Bu
dget
Spr
ead
139
ATTACHMENT I

140

Fiscal Impact 3


BUSINESS AND FISCAL IMPACT STATEMENT DATE SUBMITTED: SEPTEMBER 5, 2014 NAME OF PROJECT/INITIATIVE: SERFF INTEGRATION EXPANSION REGULATOR/BUSINESS SPONSOR: SPEED TO MARKET (EX) TASK FORCE NAIC STAFF SUPPORT: JULIE FRITZ, CHIEF BUSINESS STRATEGY AND DEVELOPMENT OFFICER ESTIMATED PROJECT START DATE: JULY 1, 2015 ANTICIPATED COMPLETION DATE: DECEMBER 15, 2015 TOTAL REVENUE GENERATED (2015): $0 (2016): $75,000 TOTAL EXPENSE REQUESTED (2015): $75,785 (2016): $0 TOTAL CAPITAL REQUESTED: $0
I. Executive Summary: Currently, the SERFF product suite includes components that enable a third-party vendor product to communicate with SERFF. These components were developed many years ago in an effort to support insurance company filers that used a specific third-party tool in the filing creation process. Introducing this component enabled the insurance companies to leverage SERFF with less disruption to their workflow, making the entire regulatory compliance effort more efficient. Integration services currently offered include the ability to send filings from the third-party product directly to SERFF (without using the SERFF user interface) and to pull SERFF related data back into the third-party product as the review process is undertaken and finalized. The current tools do not support IIPRC filings or Plan Management functionality that supports Qualified Health Plans. While the available integration services have been in use for one vendor for more than a decade, the services have never been expanded to include additional vendors or insurance companies. There have been occasional requests for use of the services but other priorities, mainly related to the Patient Protection and Affordability Care Act (PPACA), have taken precedence. The competing priorities served to create an unintentional exclusivity, which is not the preferred course of business for the NAIC. In July 2013, representatives from another third-party vendor approached the NAIC requesting an integration between their product and SERFF. Their product is used to track all the filing projects they undertake on behalf of their clients. The third-party vendor’s primary request was
141

to automate the process of pulling filings from SERFF and populating client filing records in their product; the premise being elimination of duplicative data entry and minimization of errors. The third-party vendor is also interested in using SERFF provided services to automate the submission of filings, directly from the vendor’s own system. Their first priority, and that which is provided for with this fiscal request, would be to automate the data pull from SERFF, a subsequent phase could cover the push of data from the vendor product into SERFF, and in a final stage, services that would allow pull and push of SERFF Plan Management binders submitted as part of the Affordable Care Act reforms. Only the first phase, automation of the data pull from SERFF, is considered in this fiscal request. In many respects, the vendor request is very similar to how the current integration services are used with the existing third party, with the exception of the IIPRC and Plan Management functions. However, while the request seems straightforward, there are larger implications for the NAIC and the SERFF application. Even with only one vendor using the services the required support takes time away from development of the SERFF user interface. The proposed expansion is intended to allow vendor and/or insurance company SERFF customers to use the integration services to pull and/or push data to/from SERFF. The first phase would include a refactor of an existing state web service that allows states to pull filing data from SERFF. The service would be modified so that it works for industry data. This phase provides for complete documentation so that vendors and insurance companies can implement the services efficiently. The first portion of the project has been estimated at six (6) months and would include consulting services of $73,920 for a technical writer in addition to the use of existing NAIC resources. Based on current usage patterns and interest generated by this request, it is anticipated that at least 50 entities will be interested in using this service. While these 50 companies represent only 2.8% of the customer base, they submitted approximately 56% of total filings in 2013. Not all of these entities are expected to implement immediately as there is a moderately sized investment of technical resources on each entity’s part in order to use this service. Existing NAIC resources allocated throughout this project will include the equivalent of 1.8 developers, one (1) business analyst, 0.35 project manager, and one (1) software quality engineer. Development hours are not expected to change drastically based on vendor needs but support staff hours (Business Analyst, Software Quality Engineer, and Systems Support Analyst) could vary based on vendor needs. It is difficult to estimate the potential impact without knowing which vendor(s) will use the services and what timelines they will consider. This project is scheduled to begin on July 1, 2015 but could change depending on the priorities of the Speed to Market Task Force. An expansion of SERFF’s integration services may provide benefits to the users of these services, but it will likely impact the ability for the NAIC to react quickly to changes in future member initiatives. The service level agreement with the current vendor guarantees them six (6) months to adjust their system to meet major changes to the SERFF system. This requires the NAIC to dedicate resources to the development of the appropriate documentation for the vendor that would trigger the six-month window for change, adding additional time to the project duration. In addition, resources must be divided between building the new functionality for the SERFF user interface and including those modifications in the web services so they can be used by the vendors. For applications that are mature and are enhanced infrequently, the process is manageable, but when business needs drive more significant change as has occurred over the last few years the coding and testing effort nearly doubles (coding and testing once for
142

the user interface and then again for the web services) and the support increases with every new user of the web services. If the existing vendor had desired the services be expanded for IIPRC filings or for SERFF Plan Management functionality it would have been a huge impediment in meeting the requested production dates for either of those projects. This problem will grow as functionality is added to the user interface and users are added to the web services. As a result, when the next important initiative emerges, the ability to quickly react to member requests is likely to be impacted by the expansion of the SERFF Programming Interface (SPI). From a vendor’s perspective, large scale system changes can be challenging and potentially create a period of time when their services are not linked to SERFF because the vendor is unable to make the changes in time to meet the release of the modified SERFF web services. Ongoing support is going to be critical to keeping users of the web services synchronized with modifications to the SERFF user interface. Notwithstanding the above, the integration expansion will allow customers to have automated access to their SERFF data. Many of the large insurance companies are hand-keying information from SERFF into their own systems. Automating the process can save time and money and reduce errors. In addition, for some insurers this may ultimately reduce the cost of leveraging SERFF as this may enable them to eliminate the use of a separate vendor to host SERFF data. II. Benefits of Project/Initiative to NAIC Members: The benefits of this initiative are:
• Increased services/customers (wider range of services) – the expansion of SERFF integration tools broadens the services offered to allow for their use by industry customers and vendors which may, in turn, improve the quality of response to state data calls.
• Savings from business process improvements – industry customers should see some savings and greater efficiencies from the services expansion.
• Industry customers and vendors should be able to replace duplicate data entry and hand-keyed data entry with automated data imports.
Overall, the project should increase customer satisfaction by allowing users more access to their data. III. Stakeholders: The following stakeholders are impacted by this initiative:
• Regulators – Beyond the reduction in flexibility, the ability for the NAIC to react quickly to changes in future member initiatives described above, there will be no significant impact to the regulators. Integration services are already offered to NAIC members. Regulators may benefit from improvements to the web services documentation. The overall quality of filings submitted may improve if the industry achieves some consistency and efficiency in filing creation as a result of using the integration services.
• Vendors – While there is currently only one vendor requesting to use the integration services expansion may bring more. Vendors will benefit from the automation of tasks that are currently hand-keyed or duplicated between systems.
143
• Insurance companies – These customers also stand to benefit from the automation of tasks that are currently hand-keyed or duplicated between systems. It is expected that approximately 50 insurance company SERFF customers will want to take advantage of the integration expansion.
• NAIC – The NAIC has the responsibility to deliver services that provide the requested integration while protecting the integrity of the software and state data hosted by the NAIC. The NAIC may decide to use the integration expansion to generate revenue.
IV. Business and Operational Impact: No new business or operational impacts to the NAIC will result from this fiscal request. There is a possible impact to the flexibility of the SERFF application to quickly adapt to member requests due to the potential ties to integration customers but that impact is to SERFF and should not affect any other areas of the NAIC. There is no impact to enterprise-wide staff nor is there a need for the NAIC Finance Department to change any of its practices or procedures as a result of this request. V. Financial Impact: Users of the services are expected to cover the cost associated with initial implementation and ongoing maintenance through an established fee structure. The proposed fee structure is as follows: Use of Phase I services: $5,000 per year, per licensee. The project anticipates consulting services and related minor equipment and software costs for a technical writer of $75,785 in 2015. There are no capital expenditures anticipated.
2015* 2016** Revenues $0 $75,000 Expenses 75,785 Net ($75,785) $75,000
*2015: Expenses are consulting services plus non-capitalized equipment and software costs. **2016: Assumes 15 licensees of Phase I services. Any existing management, development, technical support, business analyst or testing resources that may be required in the event of needed system modifications or customer support will be provided by existing NAIC/SERFF staff members. See Attachment I for the financial impact details. VI. Alternatives or Partnerships: The possible alternatives to this project are:
• Permit the vendor requesting integration to use existing integration services with minor modifications, understanding this would limit the NAIC’s ability to offer this to additional requestors without system modifications and resources.
• Decide to eliminate any third party integration with SERFF, including Oracle, and require all users to use SERFF interfaces and functionality to complete filings, recognizing the impact could be less efficiency on the insurer and/or third party.
144
VII. Risk Management: The project will be measured using standard tools used by the SERFF team on all of its projects. The team will use a project tracking tool to detail sprint plans and track the delivery of scheduled functionality. This tool also tracks testing and correction of defects. The largest risk in moving forward with this project is the likelihood of a decrease in the flexibility of SERFF to meet regulator needs as a Speed to Market tool. There are some opportunity costs in that some work planned for 2015 will have to be delayed or perhaps completed in smaller phases over a longer period of time. While no specific work has been agreed upon by the Product Steering Committee (PSC) and the SERFF Advisory Board, some of the following enhancements may be deferred:
• A reporting tool • User administration self-service features • Some enhancements to Plan Management that are not required by the federal
guidelines for health insurance marketplaces but that would improve usability for regulators and carriers
• Email notifications from SERFF vetted by the PSC in 2013 and not pursued, has a small but persistent base of proponents
Additionally, there are some potential Plan Management changes for 2015 that may be required by Centers for Medicare & Medicaid Services (CMS). These would have to be completed based on federal timelines and to federal specifications and would have to be prioritized ahead of the SERFF integration expansion project, causing a delay in the release schedule. As of this time, these changes have not been detailed by CMS so NAIC staff has not been able to estimate their impact on other projects.
145

146

2015
Bud
get
Bus
ines
s an
d Fi
scal
Im
pact
Sta
tem
ent
Pro
ject
Cos
t A
naly
sis
Rev
enue
s, E
xpen
ses
and
Cap
ital
Exp
endi
ture
s
P
roje
ct/I
niti
ativ
e: S
ERFF
Int
egra
tion
Exp
ansi
on
2015
Ann
ual
2015
2016
2017
Des
crip
tion
Bud
get
Janu
ary
Febr
uary
Mar
chA
pril
May
June
July
Aug
ust
Sept
embe
rO
ctob
erN
ovem
ber
Dec
embe
rTo
tal
Bud
get
Bud
get
Rev
enue
s:Li
cens
e Fe
e$7
5,00
0$7
5,00
0
T
otal
Rev
enue
s-
-
-
-
-
-
-
-
-
-
-
-
-
-
75,0
00
75,0
00
Expe
nses
:Pr
ofes
sion
al S
ervi
ces
- Co
nsul
ting
$73,
920
$12,
880
$11,
760
$12,
320
$12,
880
$11,
200
$12,
880
$73,
920
Non
-Cap
ital E
quip
men
t -
Phon
e61
7$6
1761
7N
on-C
apita
l Equ
ipm
ent
- Co
mpu
ter
(Zer
o Cl
ient
)74
874
874
8N
on-C
apita
l Equ
ipm
ent
- So
ftw
are
500
500
500
T
otal
Exp
ense
s75
,785
1,
365
13,3
8011
,760
12,3
2012
,880
11,2
0012
,880
75,7
85
Rev
enue
s O
ver
(Und
er)
Expe
nses
($75
,785
)($
1,36
5)$0
$0$0
$0$0
($13
,380
)($
11,7
60)
($12
,320
)($
12,8
80)
($11
,200
)($
12,8
80)
($75
,785
)$7
5,00
0$7
5,00
0
2015
Bud
get
Spre
ad
147
ATTACHMENT I

148

Fiscal Im
pact 4


BUSINESS AND FISCAL IMPACT STATEMENT DATE SUBMITTED: SEPTEMBER 5, 2014 NAME OF PROJECT/INITIATIVE: STATE PRODUCER LICENSING (SPL) TEAM
AUGMENTATION REGULATOR/BUSINESS SPONSOR: PRODUCER LICENSING (EX) TASK FORCE NAIC STAFF SUPPORT: DENISE MATTHEWS, NAIC INFORMATION SYSTEMS
DIRECTOR REQUESTED PROJECT START DATE: MARCH 1, 2015 ANTICIPATED COMPLETION DATE: ON-GOING TOTAL REVENUE GENERATED (2015): $0 (2016): $0 TOTAL EXPENSE REQUESTED (2015): $156,702* (2016): $187,287 TOTAL CAPITAL REQUESTED (2015): $14,659 *Includes $3,663 in depreciation expense on capital requested in this fiscal
I. Executive Summary: This proposal requests the addition of two staff members – one Software Quality Engineer and one Software Engineer – to the NAIC’s State Producer Licensing (SPL) Team. Since the State Producer Licensing Reengineering Project concluded in 2010, NAIC has taken on more direct support of certain key state producer licensing applications including working with the National Insurance Producer Registry (NIPR) staff to support the NAIC’s State Producer Licensing Common Architecture and Loads applications that transforms and loads state data to the State Producer Licensing Database (SPLD). In addition, the NAIC SPL Team supports producer I-SITE reports, State Application Programming Interface (API), Transmission Viewer, electronic commerce reports, and State Process. These applications are all important to the states’ license approval and fee reconciliation processes. In 2014, these application areas have required maintenance to support a new security framework implementation and web server upgrade. In addition, work on the SPL Loads Rewrite project has continued. As the Loads Rewrite project concludes in 2015, the NAIC SPL team will take on more of the Common Architecture support currently performed by NIPR, assist NIPR in moving Gateway processing (where state business rules are applied to producer licensing application transactions) to the State Data Mart, or a data mart of its own, enabling the completion of data
149
model changes required to support improved data reporting from the SPLD, and support the Linux server upgrade project. In addition, the NAIC SPL team will continue to support ongoing data requests from external parties such as the Center for Consumer Information and Insurance Oversight (CCIIO) and other related state reporting needs. The purpose of this team is to complement the NIPR state producer licensing services to the states, allowing a greater focus on state data management and on-going improvements to core state producer licensing assets. The two additional staff members are specifically needed to ensure the Loads Rewrite can be completed and the Common Architecture and Gateway processes are adequately supported in the future. II. Benefits of Project/Initiative to NAIC Members: This staffing request ensures there are adequate resources to continue critical infrastructure support and maintenance. It ensures state and industry producer licensing needs are not compromised or delayed due to significant infrastructure projects such as server obsolescence and upgrades, database upgrades, security framework upgrades, and application server upgrades. Tangible examples of work this team has done to benefit members includes (1) rewriting Common Architecture which significantly reduced production issues and allowed a small team to maintain the code base and easily create new implementations; (2) improving State Process code minimizing errors resulting in a system that now requires very little developer intervention; and (3) implementing improvements that allow every state’s data to be loaded each night prior to the opening of the next business day. Additional projects and benefits resulting from the addition of resources to this team include: 1. The Loads Rewrite project currently underway:
• Simplify and further improve the timeliness of the state data load process. • Improve flexibility by enabling the separation of market information systems (MIS) and
licensing data processing • Reduce the impact and cost of making much-needed changes to the underlying data
structures. • Allow for the creation of better test data for external parties who interface producer
licensing systems with the NAIC and the NIPR.
2. The team will position itself to independently support the producer licensing Common Architecture code base once the Loads Rewrite project has been completed with assistance from NIPR on new state implementations.
3. NAIC staff will be knowledgeable, prepared, and able to support SPL applications, giving
NIPR the opportunity to focus on improving industry facing applications and processes that ultimately improve the states’ ability to license producers, adjusters, and certify or register navigators in a timely manner. In addition, as the passage of National Association of Registered Agents and Brokers (NARAB) II legislation appears to be close, NAIC and NIPR will be able to focus on protecting states’ interests and ensure it is a viable option to become the NARAB clearinghouse.
4. The move of Gateway processing to the State Data Mart, or a data mart of its own, will also
enable efforts related to minimizing the need for social security numbers in the processing of producer licensing transactions by moving National Producer Number (NPN) assignment
150

into the Gateway System Process. The NAIC SPL Team will also continue to focus on improving the process that currently exists today.
5. Allow NIPR to be responsive to current and changing events in the licensing landscape,
service Authorized Business Partners and Direct Senders needs, and support changes to the uniform applications, new features, and information required by regulators such as the Contact Change Request (CCR) while NAIC assists in supporting ongoing infrastructure and longer term improvement projects.
All of this will provide:
• Better customer, stakeholder, and supplier service and satisfaction; • Increased knowledge of technologies, resulting in improved staff efficiency; • Improved efficiency and effectiveness of department resources; • Enhanced ability of the department to meet member directed strategic goals; • Improved quality of information and decision-support capabilities; and • Continued regulatory compliance.
III. Stakeholders: The following stakeholders will be affected or will benefit from this project:
• NAIC Information Systems Business Application Development and Quality Assurance Teams – Both teams will add one new staff person. The positions will have to be recruited, on-boarded, trained, and managed from an administrative and project perspective.
• NIPR – NIPR staff would likely assist in training and would be involved in project
prioritization activities. Coordination and collaboration in the State Producer Licensing area between the NAIC and NIPR is ongoing and critical to efficient staff utilization.
• State Insurance Departments – State department personnel will benefit from the
improved support and resources available to provide maintenance, enhancements, and new products and features related to the producer licensing process. Focus on the core applications required to process licensing applications will also ensure better products and service to the industry producer licensing community.
IV. Business and Operational Impact: The following entities will be impacted by these staff additions:
• Human Resources and Finance Departments – Human Resources will need to be involved in recruiting and orientation for these positions. Finance will be involved from a staff administrative perspective related to payroll.
• Technical and Office Services – Both teams will be impacted by providing work
space, equipment, and software for these positions.
The addition of these resources will not directly generate revenue or reduce cost in another area; however, electronic producer licensing is a revenue-producing activity and the ongoing quality, flexibility, and maintenance of those systems is critical to maintaining this revenue stream.
151

V. Financial Impact: In addition to the salary related expenses, this fiscal proposes funding for software licensing, training, and professional association dues. Software licensing includes a developer tool for editing required for all developers who work on the Common Architecture project. In addition, HP’s Unified Functional Test (UFT) and Quality Center (QC), used for automated testing and management of testing scenarios and associated scripts, is also requested. These tools represent the standard toolset for NAIC and NIPR Software Quality Engineers (SQE). Training dollars are included so these positions can remain up-to-date on the ever changing technology used in their areas. Additionally, these positions will also benefit from participating in associations focused on their particular disciplines, which will require membership dues. See Attachment I for the financial impact details. VI. Alternatives or Partnerships: Alternatives to this proposal would include:
• Outsourcing the work to a third party. This would be costly given the steep learning curve for these systems and the required coordination effort with NAIC and NIPR. This work could be performed by NIPR; however, that would mean either long delays to completion of infrastructure and/or new product and feature enhancement deliverables, or support and quality degradation. In addition, either option would impact NAIC’s ability to provide knowledgeable support of the state producer licensing assets and process.
• It is not an option to buy this software commercially as no other entity currently offers this type of electronic producer licensing system that supports the ability for a “one stop shopping” licensing solution.
VII. Risk Management: The risks associated with approving this request are fairly limited. There is minimal risk associated with management’s ability to find resources with the skills needed to perform the responsibilities outlined in this request or that it will take longer to recruit and hire the positions than anticipated. Other priorities may continue to delay some of this work such as the Loads Rewrite project. The risks associated with not approving this funding request are primarily related to projects being delayed. Resources who could be working on new projects, features and functionality will have to split time between support projects and working on required new functionality and products.
152
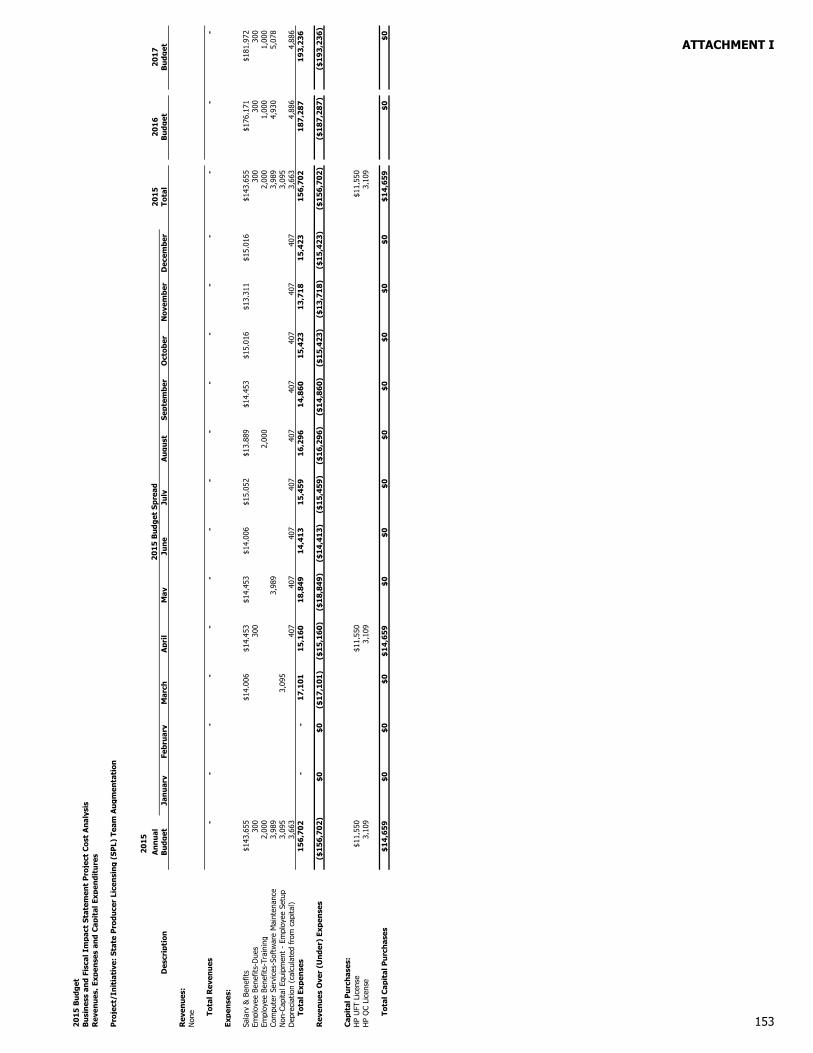
2015
Bud
get
Bus
ines
s an
d Fi
scal
Im
pact
Sta
tem
ent
Pro
ject
Cos
t A
naly
sis
Rev
enue
s, E
xpen
ses
and
Cap
ital
Exp
endi
ture
s
P
roje
ct/I
niti
ativ
e: S
tate
Pro
duce
r Li
cens
ing
(SP
L) T
eam
Aug
men
tati
on
2015
Ann
ual
2015
2016
2017
Des
crip
tion
Bud
get
Janu
ary
Febr
uary
Mar
chA
pril
May
June
July
Aug
ust
Sept
embe
rO
ctob
erN
ovem
ber
Dec
embe
rTo
tal
Bud
get
Bud
get
Rev
enue
s:
N
one
T
otal
Rev
enue
s-
-
-
-
-
-
-
-
-
-
-
-
-
-
-
-
Expe
nses
:
Sala
ry &
Ben
efits
$143
,655
$14,
006
$14,
453
$14,
453
$14,
006
$15,
052
$13,
889
$14,
453
$15,
016
$13,
311
$15,
016
$143
,655
$176
,171
$181
,972
Empl
oyee
Ben
efits
-Due
s30
0
300
300
30
0
300
Em
ploy
ee B
enef
its-T
rain
ing
2,00
0
2,
000
2,
000
1,00
0
1,
000
Com
pute
r Se
rvic
es-S
oftw
are
Mai
nten
ance
3,98
9
3,
989
3,
989
4,93
0
5,
078
Non
-Cap
ital E
quip
men
t -
Empl
oyee
Set
up3,
095
3,09
5
3,09
5
D
epre
ciat
ion
(cal
cula
ted
from
cap
ital)
3,66
3
40
7
40
7
40
7
40
7
40
7
40
7
40
7
40
7
40
7
3,
663
4,88
6
4,
886
T
otal
Exp
ense
s15
6,70
2
-
-
17
,101
15,1
60
18
,849
14,4
13
15
,459
16,2
96
14
,860
15,4
23
13
,718
15,4
23
15
6,70
2
18
7,28
7
19
3,23
6
Rev
enue
s O
ver
(Und
er)
Expe
nses
($15
6,70
2)$0
$0($
17,1
01)
($15
,160
)($
18,8
49)
($14
,413
)($
15,4
59)
($16
,296
)($
14,8
60)
($15
,423
)($
13,7
18)
($15
,423
)($
156,
702)
($18
7,28
7)($
193,
236)
Cap
ital
Pur
chas
es:
HP
UFT
Lic
ense
$11,
550
$11,
550
$11,
550
HP
QC
Lice
nse
3,10
9
3,
109
3,
109
T
otal
Cap
ital
Pur
chas
es$1
4,65
9$0
$0$0
$14,
659
$0$0
$0$0
$0$0
$0$0
$14,
659
$0$0
2015
Bud
get
Spre
ad
153
ATTACHMENT I

154

Fiscal Impact 5


BUSINESS AND FISCAL IMPACT STATEMENT DATE SUBMITTED: SEPTEMBER 5, 2014 NAME OF PROJECT/INITIATIVE: COMMERCIAL MORTGAGE-BACKED SECURITIES
(CMBS) RESOURCE FOR STRUCTURED SECURITIES GROUP (SSG)
REGULATOR/BUSINESS SPONSOR: VALUATION OF SECURITIES (E) TASK FORCE NAIC STAFF SUPPORT: ERIC KOLCHINSKY, DIRECTOR, STRUCTURED
SECURITIES GROUP REQUESTED PROJECT START DATE: FEBRUARY 1, 2015 ANTICIPATED COMPLETION DATE: ONGOING TOTAL REVENUE GENERATED (2015): $0 (2016): $0 TOTAL EXPENSE REQUESTED (2015): $53,060 (2016): $61,975 TOTAL CAPITAL REQUESTED (2015): $0
I. Executive Summary: The NAIC began modeling residential mortgage-backed securities (RMBS) owned by insurance companies in late 2009. This project was expanded in 2010 with the addition of commercial mortgage-backed securities (CMBS) owned by insurance companies. In mid-2013, the NAIC established the Structured Securities Group (SSG) at its Capital Markets and Investment Analysis Office in New York, NY reflecting the NAIC’s commitment to this area of financial analysis. Since its inception, the SSG has had three full-time employees (Director, Analyst III and Analyst II). Additional resources include a consultant and assistance from two financial modeling firms. To ensure continual focus on both CMBS and RMBS as well as monitoring other areas of structured securities, this fiscal proposes the conversion of the consultant position to a full-time employee of the NAIC. II. Benefits of Project/Initiative to NAIC Members: The current role of the consultant is to oversee the year-end modeling project and to provide specific oversight of the CMBS portion of the process. Converting the consulting position to a full-time employee would not only bolster SSG, but would also augment the SSG’s ability to
155

support members with respect to insurance company investments in commercial real estate which is a growing area of insurance company investment. III. Stakeholders: The key stakeholder is the Valuation of Services Task Force (VOSTF), who oversees the annual structured securities project conducted at the end of each year, as well as any other groups who require assistance in gauging the performance of commercial mortgages or CMBS. In addition, the insurance companies would benefit by having expertise on the SSG who is focused on the commercial real estate market. IV. Business and Operational Impact: Human Resources will need to expend resources to recruit and hire an individual for this position and Finance will need to establish them in the payroll system. Additionally, a budget will be established for administrative expenses associated with this position including phone, office supplies, professional fees and travel. There is no system impact associated with this position. V. Financial Impact: As delineated in Attachment I the annual cost of a full-time employee including related travel expenses will exceed the cost of a consultant by approximately $53,000. However the benefits of having a dedicated resource will far exceed this incremental cost. See Attachment I for the financial impact details. VI. Alternatives or Partnerships: The NAIC could continue utilizing a consultant in this position. However, given the permanent need for this expertize, this is a not an appropriate long-term strategy. The NAIC would lose expertise every time a consultant was replaced and would need to expend a large amount of time on-boarding a new consultant. Also, the NAIC could depend on the financial modeling firms to provide this expertise; however, this option does not provide the level of independence necessary to support the financial modeling activity and does not provide the NAIC with direct control over the selection and management of the individual. VII. Risk Management: The primary risk involved with this project is the risk of employee retention. This position will have a very high profile with exposure to state insurance regulatory bodies, insurance companies, and financial market entities. Insurance entities and financial market participants, both domestic and international, could attempt to hire this individual away from the NAIC, to leverage the employee’s experience in this role.
156

2015
Bud
get
Bus
ines
s an
d Fi
scal
Im
pact
Sta
tem
ent
Pro
ject
Cos
t A
naly
sis
Rev
enue
s, E
xpen
ses
and
Cap
ital
Exp
endi
ture
s
P
roje
ct/I
niti
ativ
e: C
omm
erci
al M
ortg
age-
Bac
ked
Secu
riti
es (
CM
BS)
Res
ourc
e fo
r St
ruct
ured
Sec
urit
ies
Gro
up (
SSG
)
2015
Ann
ual
2015
2016
2017
Des
crip
tion
Bud
get
Janu
ary
Febr
uary
Mar
chA
pril
May
June
July
Aug
ust
Sept
embe
rO
ctob
erN
ovem
ber
Dec
embe
rTo
tal
Bud
get
Bud
get
Rev
enue
s:N
one
T
otal
Rev
enue
s-
-
-
-
-
-
-
-
-
-
-
-
-
-
-
-
Expe
nses
:Sa
lary
& B
enef
its$2
55,1
95$2
3,10
9$2
3,19
2$2
4,23
6$2
4,23
6$2
2,53
5$2
4,38
6$2
1,91
8$2
2,90
2$2
3,88
6$2
0,90
8$2
3,88
6$2
55,1
95$2
89,9
75$2
98,3
95Pr
ofes
sion
al S
ervi
ces-
Cons
ultin
g(2
20,0
00)
(2
0,00
0)
(20,
000)
(2
0,00
0)
(20,
000)
(2
0,00
0)
(20,
000)
(2
0,00
0)
(20,
000)
(2
0,00
0)
(20,
000)
(2
0,00
0)
(220
,000
)
(2
46,0
00)
(253
,200
)
St
aff
Trav
el16
,500
1,50
0
1,
500
1,50
0
1,
500
1,50
0
1,
500
1,50
0
1,
500
1,50
0
1,
500
1,50
0
16
,500
18
,000
18
,000
N
on-C
apita
l Equ
ipm
ent-
Empl
oyee
Set
up1,
365
1,36
5
1,
365
T
otal
Exp
ense
s53
,060
-
5,97
4
4,69
2
5,73
6
5,73
6
4,03
5
5,88
6
3,41
8
4,40
2
5,38
6
2,40
8
5,38
6
53,0
60
61,9
75
63,1
95
Rev
enue
s O
ver
(Und
er)
Expe
nses
($53
,060
)$0
($5,
974)
($4,
692)
($5,
736)
($5,
736)
($4,
035)
($5,
886)
($3,
418)
($4,
402)
($5,
386)
($2,
408)
($5,
386)
($53
,060
)($
61,9
75)
($63
,195
)
2015
Bud
get
Spre
ad
157
ATTACHMENT I

158

Fiscal Im
pact 6


BUSINESS AND FISCAL IMPACT STATEMENT DATE SUBMITTED: SEPTEMBER 10, 2014 NAME OF PROJECT/INITIATIVE: ENHANCED SUPPORT FOR MEMBER USE OF
ELECTRONIC WORKPAPERS REGULATOR/BUSINESS SPONSOR: FINANCIAL CONDITION (E) COMMITTEE NAIC STAFF SUPPORT: DAN DAVELINE, ASSISTANT DIRECTOR – FINANCIAL
REGULATORY SERVICES REQUESTED PROJECT START DATE: FEBRUARY 1, 2015 ANTICIPATED COMPLETION DATE: ONGOING TOTAL REVENUE GENERATED (2015): $0 (2016): $0 TOTAL EXPENSE REQUESTED (2015): $253,331* (2016): $314,861 TOTAL CAPITAL REQUESTED (2015): $50,141 *2015 expense includes depreciation of $14,430 and amortization of $8,646 I. Executive Summary: State insurance departments are currently facing a number of challenges regarding their use of electronic workpaper tools to conduct financial solvency and market conduct monitoring activities. To address this issue, this fiscal proposes the addition of resources, including the development of a centralized TeamMate testing environment, an additional staff position, and updates to technology support, to help manage current tools and more effectively and efficiently support member needs in this area. Electronic workpaper tools are necessary to facilitate the efficient documentation of analysis and examination activities and to share the results across state insurance departments. Most states utilize TeamMate software offered by WoltersKluwer/CCH, through a sub-license agreement with the NAIC, to serve as their primary workpaper documentation tool. The sub-license agreement allows each state to receive a significant volume discount by bundling their purchases through the NAIC. Currently, more than 2,500 state employees and their contractors maintain TeamMate licenses through the NAIC at an annual renewal cost of approximately $500,000. NAIC staff facilitates state use of TeamMate by administering the licenses, offering
159

high-level support and training, developing regulatory content (e.g., audit programs) for use in the software, and offering limited hosting services to states conducting coordinated exam activities. Through acting in these support roles, staff has recently become aware of a number of challenges states are facing in utilizing the TeamMate software, some of which are described below.
• The TeamMate software tool was initially designed for use by large corporations or government agencies in conducting internal audit activities and these groups continue to be the primary users. States have attempted to work with WoltersKluwer/CCH over the years to maximize TeamMate’s utility in documenting regulatory activities, which has yielded limited results. WoltersKluwer/CCH has at times been reluctant to adjust its product to meet regulator needs or to follow through on service commitments without proposing additional fees.
• As with any software, new releases are produced from time to time and not all states are on the same release today. Further complicating the issue is the fact that new releases are not backward compatible, which makes it difficult to share work across states using different versions of the tool. As the ability to share work across states is a key component of the regulatory framework, these version issues negatively impact one of the primary uses of the software.
• TeamMate is currently transitioning from a distributed installation on local machines, or accessed remotely through a Citrix setup, to a cloud-based, centralized database environment hosted on a web-server. The transition to the centralized format will require greater expertise, knowledge, and state resources. It could also complicate the sharing of work across states. In light of this impending transition, a number of states are unsure of how to proceed in terms of expending local resources to develop a centralized environment or contracting a third-party to host TeamMate services at a significant cost.
Given the NAIC’s traditional roles of encouraging uniformity and consistency across states as well as offering high-quality IT services to reduce the cost burden and technical resources required of the states, the NAIC is proposing an expansion of its member services in this area. This fiscal proposes to bring focus to this matter through the creation of an Electronic Workpaper Program Manager position to provide enhanced support for states in their use of electronic workpaper tools. This position would act as a technical liaison with: (1) state users and their IT support; (2) business managers (e.g., financial exam, financial analysis, market conduct) and IT resources at the NAIC; and (3) software developers, technical support, and client relations staff at WoltersKluwer/CCH. By dedicating a staff resource with IT knowledge and background as a central point of contact to lead support in this area, the NAIC will be able to significantly improve the services to members in this area. In particular, enhanced support would allow the NAIC to work with states and WoltersKluwer/CCH to maximize TeamMate’s utility in documenting regulatory activities, work with states to encourage consistency in the use of TeamMate versions, and support state decision making in transitioning to a centralized environment. In addition to requesting funding for a new staff position, this initiative also includes a request for funding to develop a centralized TeamMate test environment for purposes of evaluating functionality and designing related NAIC support services. Depending on the results of this
160

evaluation and state interest, additional support services may include the expansion of existing hosting services offered by the NAIC to its members. Therefore, it is necessary to include in this budget proposal some flexibility to incur costs associated with a limited expansion of the existing hosting services. If the interest of states ultimately results in further expansion of the NAIC hosting services additional amounts will be required for additional headcount and hardware/software resources to support this expansion. II. Benefits of Project/Initiative to NAIC Members: The primary benefit of this initiative would be to increase the effectiveness of the NAIC in supporting state use of electronic workpaper software tools. The establishment of a primary point of contact at the NAIC for electronic workpaper software issues will allow the NAIC to clarify roles and responsibilities and respond more effectively and efficiently to regulator inquiries and concerns. This initiative would also allow for enhanced support for states in implementation and improved communication between end users/subject matter experts and general IT support available at the NAIC, as well as improved communication with WoltersKluwer/CCH. In addition, the funds allocated to improving the NAIC’s IT infrastructure in this area will allow for the development of additional knowledge regarding the functionality of exam workpapers to support long-term planning, the development of NAIC support services, and the ability of NAIC staff to assist members in this area. III. Stakeholders: Stakeholders include an existing NAIC group studying issues in this area (the Electronic Workpaper (E) Working Group), various NAIC staff currently supporting electronic workpaper tools, TeamMate champions, IT directors/managers of state insurance departments, and the more than 2,500 regulators and their contractors using these tools to conduct solvency and market conduct monitoring activities on a daily basis. IV. Business and Operational Impact: The impact to business and operations would include the transition of certain staff support responsibilities to this new position as well as the development of new reporting and coordination relationships at the NAIC. In addition, this proposal will improve the IT infrastructure in place at the NAIC for supporting the use of electronic workpapers and has the potential to significantly enhance hosting and other support services provided. V. Financial Impact: The overall financial impact of this proposal for 2015 would be approximately $253,000, consisting of (1) 10 months of salary, travel, and related expenses for the Electronic Workpaper Program Manager ($116,800); (2) $20,000 in consulting services to establish the testing environment; and (3) approximately $116,500 to create the centralized workpaper test environment and enhancement the IT infrastructure to support additional hosting services for states. See Attachment I for the financial impact details.
161

VI. Alternatives or Partnerships: Alternatives to devoting additional staff resources to supporting states in this area would be to continue with the current support made available to states in this area, which could limit the ability of the NAIC to address these emerging issues and put more of the support and decision-making burden on individual states. Another option would be for the NAIC to remove itself from electronic workpaper software licensing and support entirely and to encourage states to contract directly with vendors to obtain software that most fully meets their individual needs. However, this could result in the utilization of various software packages that do not allow for effective and efficient coordination of work across states. VII. Risk Management: Risks associated with the proposal include the potential for support provided by the NAIC to not meet regulator needs in this area. To ensure this does not occur, this proposal requires the support and coordination of various NAIC departments and staff currently involved in electronic workpaper support efforts. In addition, this proposal requires the support of state insurance departments and end user regulators to improve the overall quality and function of electronic workpaper tools.
162

2015
Bud
get
Bus
ines
s an
d Fi
scal
Im
pact
Sta
tem
ent
Pro
ject
Cos
t A
naly
sis
Rev
enue
s, E
xpen
ses
and
Cap
ital
Exp
endi
ture
s
P
roje
ct/I
niti
ativ
e: E
nhan
ced
Supp
ort
for
Mem
ber
Use
of
Elec
tron
ic W
orkp
aper
s
2015
Ann
ual
2015
2016
2017
Des
crip
tion
Bud
get
Janu
ary
Febr
uary
Mar
chA
pril
May
June
July
Aug
ust
Sept
embe
rO
ctob
erN
ovem
ber
Dec
embe
rTo
tal
Bud
get
Bud
get
Rev
enue
s:N
one
T
otal
Rev
enue
s-
-
-
-
-
-
-
-
-
-
-
-
-
-
-
-
Expe
nses
:Sa
lary
& B
enef
its$9
1,27
3$8
,897
$9,1
90$9
,190
$8,8
78$9
,560
$8,8
18$9
,188
$9,5
58$8
,438
$9,5
56$9
1,27
3$1
14,7
56$1
21,5
82Tr
aini
ng -
Tea
mM
ate
Use
r Fo
rum
2,00
0
2,
000
2,
000
2,00
0
2,
000
Prof
essi
onal
Ser
vice
s -
Cons
ultin
g20
,000
-
5,00
0
5,00
0
5,00
0
5,00
0
20,0
00
20,0
00
20,0
00
Staf
f Tr
avel
(w
orki
ng w
ith e
nd u
sers
)20
,000
2,
000
2,
000
2,
000
2,
000
2,
000
2,
000
2,
000
2,
000
2,
000
2,
000
20
,000
20
,000
20
,000
Co
mpu
ter
Serv
ices
- H
ardw
are
mai
nten
ance
52
2
$522
-
-
-
-
-
-
-
-
-
-
522
522
522
Com
pute
r Se
rvic
es -
Sof
twar
e m
aint
enan
ce
92,8
99
4,31
8
4,31
8
4,31
8
4,42
4
4,42
4
11,8
50
11
,850
11,8
50
11
,850
11,8
50
11
,850
92,8
99
130,
240
110,
816
Dep
reci
atio
n14
,430
1,
000
1,
000
1,
278
1,
394
1,
394
1,
394
1,
394
1,
394
1,
394
1,
394
1,
3 94
14
,430
16
,715
16
,715
Am
ortiz
atio
n8,
646
388
388
388
504
504
504
504
504
504
504
504
8,64
6
10
,028
10
,028
N
on-C
apita
l Equ
ipm
ent
- St
aff
setu
p56
1
51
51
51
51
51
51
51
51
51
51
51
561
Non
-Cap
ital E
quip
men
t -
Soft
war
e lic
ense
3,00
0
3,
000
3,
000
600
600
T
otal
Exp
ense
s25
3,33
1
-
9,27
9
16,6
54
22
, 225
17,5
63
22
,250
25,3
59
31
,616
24, 9
87
30
,357
24,2
37
25
,355
253,
331
314 ,
861
302,
263
Rev
enue
s O
ver
(Und
er)
Expe
nses
($25
3,33
1)$0
($9,
279)
($16
,654
)($
22,2
25)
($17
,563
)($
22,2
50)
($25
,359
)($
31,6
16)
($24
,987
)($
30,3
57)
($24
,237
)($
25,3
55)
($25
3,33
1)($
314,
861)
($30
2,26
3)
Cap
ital
Pur
chas
es:
Serv
er b
lade
for
Tea
mM
ate
-v11
cen
tral
ized
$11,
000
$11,
000
$11,
000
Serv
er b
lade
for
Tea
mM
ate
-pro
d hi
ghly
ava
ilabl
e11
,000
11
,000
11,0
00
Stor
age
for
Team
Mat
e -
v11
cent
raliz
ed5,
000
$5,0
005,
000
Stor
age
for
Team
Mat
e -
pro
d hi
ghly
ava
ilabl
e 5,
000
5,00
0
5,00
0
VM
War
e Li
cens
e -
v11
cent
raliz
ed
6,99
0
6,
990
6,
990
VMW
are
Lice
nse
- pr
od h
ighl
y av
aila
ble
6,99
0
6,
990
6,
990
Sym
ante
c Li
cens
e fo
r ba
ckup
- 1
TB4,
161
$4,1
614,
161
T
otal
Cap
ital
Pur
chas
es$5
0,14
1$0
$35,
980
$0$1
0,00
0$4
,161
$0$0
$0$0
$0$0
$0$5
0,14
1$0
$0
2015
Bud
get
Spre
ad
163
ATTACHMENT I

164

Fiscal Impact 7

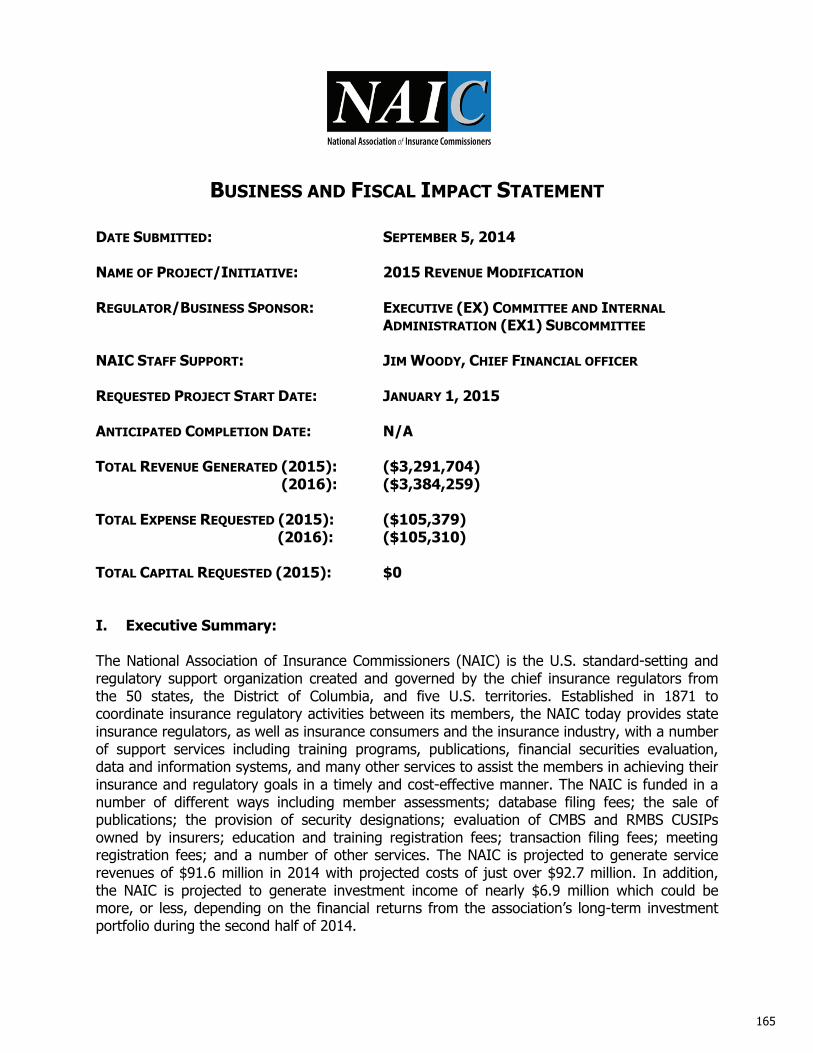
BUSINESS AND FISCAL IMPACT STATEMENT DATE SUBMITTED: SEPTEMBER 5, 2014 NAME OF PROJECT/INITIATIVE: 2015 REVENUE MODIFICATION REGULATOR/BUSINESS SPONSOR: EXECUTIVE (EX) COMMITTEE AND INTERNAL ADMINISTRATION (EX1) SUBCOMMITTEE NAIC STAFF SUPPORT: JIM WOODY, CHIEF FINANCIAL OFFICER REQUESTED PROJECT START DATE: JANUARY 1, 2015 ANTICIPATED COMPLETION DATE: N/A TOTAL REVENUE GENERATED (2015): ($3,291,704) (2016): ($3,384,259) TOTAL EXPENSE REQUESTED (2015): ($105,379) (2016): ($105,310) TOTAL CAPITAL REQUESTED (2015): $0 I. Executive Summary: The National Association of Insurance Commissioners (NAIC) is the U.S. standard-setting and regulatory support organization created and governed by the chief insurance regulators from the 50 states, the District of Columbia, and five U.S. territories. Established in 1871 to coordinate insurance regulatory activities between its members, the NAIC today provides state insurance regulators, as well as insurance consumers and the insurance industry, with a number of support services including training programs, publications, financial securities evaluation, data and information systems, and many other services to assist the members in achieving their insurance and regulatory goals in a timely and cost-effective manner. The NAIC is funded in a number of different ways including member assessments; database filing fees; the sale of publications; the provision of security designations; evaluation of CMBS and RMBS CUSIPs owned by insurers; education and training registration fees; transaction filing fees; meeting registration fees; and a number of other services. The NAIC is projected to generate service revenues of $91.6 million in 2014 with projected costs of just over $92.7 million. In addition, the NAIC is projected to generate investment income of nearly $6.9 million which could be more, or less, depending on the financial returns from the association’s long-term investment portfolio during the second half of 2014.
165

The management of the NAIC is committed to providing its products and services in a professional, timely, and cost-effective manner. This objective is achieved by constantly monitoring and carefully managing all of the NAIC’s revenues and expenses. An important consideration in this process is ensuring the NAIC has adequate financial resources to fulfill its mission and make prudent adjustments to either revenues or expenses as deemed appropriate. As a result of this prudent financial management and, in large part driven by the returns generated by the NAIC’s Long-Term Investment Portfolio, the NAIC had Net Assets (including the Net Assets from the Structured Securities Project) of $115,345,895 at the end of 2013. The NAIC’s liquid operating reserve ratio at the end of 2013 was 106.0%. This ratio is calculated by subtracting Net Fixed Assets from Total Net Assets and then dividing by projected expenses for the next year. This ratio is a useful gauge in determining the level of funding available to an association in times of financial distress. In September 2011, the NAIC Executive (EX) Committee and Internal Administration (EX1) Subcommittee approved a report from the independent firm hired to review the NAIC’s operating reserves, which recommended a target liquid operating reserve ratio in the range of 80 – 91%. This targeted ratio was based on current and future identified risks and was benchmarked to comparable organizations. A new review will be undertaken in the latter part of 2014 to update this report and recommend a target ratio for the Association; this report should be completed in the latter part of 2014 or early part of 2015. Given the liquid operating ratio at the end of 2013 and the NAIC’s financial results for the first half of 2014, it is an appropriate time to review the Association’s revenue streams and make a recommendation to modify the current structure. The main objective of the proposed modification is to take into consideration all funding sources and develop an approach that is fair, equitable and viable in the future. This fiscal proposes changes in four major areas:
1. Securities Valuation Office (SVO) – remove the SVO Assessment. This assessment was instituted in 2004 when the SVO restructured product pricing with the Filing Exempt Rule which eliminated the charge for securities rated by a nationally recognized securities rating organization (NRSRO). Given the significance of the price restructuring and the uncertainty associated with predicting the SVO’s revenue in subsequent years, an assessment of $1,580,000 was implemented to ensure the NAIC had adequate financial resources to provide services. This assessment is allocated to insurance companies with total investments in non-government securities and preferred stock of $1 billion or more. Although the NAIC budget included an assessment of $1,580,000 from 2005 through 2011, insurance companies were only billed half of this amount, $790,000. In the 2012 and subsequent budgets the assessment was reduced to $790,000 and the entire amount has been billed in July of each year.
2. Database Filing Fees – reduce the filing fee structure for database filings by five (5) percent and the filing fee caps by five (5) percent. The database filing fee was first implemented in 1978 and last revised in the 2006 budget. The current database filing fee structure has 33 tiers for various levels of premium volume which is measured as the greater of direct written premium or reinsurance assumed from non-affiliates. The current rate structure ranges from a bottom tier of up to $100,000 in premiums with a filing fee of $247 to a top tier of more than $2.7 billion in premiums with a filing fee of $69,428. Combined filings have a combined filing of $685 and insurance group total filing fees are capped at $208,284. In 2014, 4,817 companies, including 29 groups, were assessed a total
166

of $26,823,629. Database filing fees are used to support the NAIC’s financial solvency program, solvency monitoring tools provided to state insurance regulators, and other programs. In addition, the insurance industry benefits from the ability to electronically file their quarterly and annual statements with the NAIC’s central data collection system rather than submitting separate filings to each jurisdiction in which they conduct business. A five (5) percent reduction in the filing fee structure with a five (5) percent reduction in filing fee caps would result in a $1,354,416 reduction of projected 2015 revenue.
3. Publications – eliminate fees for consumer guides and all publications provided in an on-
demand electronic format, except the top ten publications reducing 2015 budgeted revenues by $953,264. Hard copies of consumer guides and the non-top ten publications will no longer be available. The largest volume publications (top ten) will continue to be published at the same price and format (print, CD, Excel) they are currently offered today. The top ten publications are listed below: • Accounting Practices and Procedures Manual • Accounting Practices and Procedures CD-Rom • Annual and Quarterly Statement Blanks • Annual and Quarterly Statement Instructions • Compendium of State Laws on Insurance Topics • Financial Condition Examiners Handbook • Market Regulation Handbook • Model Laws, Regulations and Guidelines Compilation • Purposes and Procedures Manual of the NAIC Investment Analysis Office • Risk-Based Capital Forecasting Products
All other publications will be posted in electronic form on the NAIC’s website for regulator and public use. No hard copy version will be made available. Moving to this new structure will allow the NAIC to provide electronic copies of consumer guides and low volume publications at no charge while eliminating the cost of printing, storing, shipping and managing these items. This approach should satisfy the desire of those preferring the convenience and timeliness of accessing this information on demand.
4. Member Assessments – lower the member assessment by five (5) percent and institute a
cap of $125,000. The current assessment structure was implemented in 2001 and is based on each member’s share of total insurance premium volume within their jurisdiction. This new structure would reduce each member’s assessment by at least five (5) percent and would result in a reduction of $194,024 in 2015 projected revenue.
The continuation of these reductions in future years is contingent upon the NAIC being able to maintain a solid financial foundation, enabling support to state insurance regulators in a professional, timely, and cost-effective manner. One of the key factors in the NAIC being able to maintain its financial position is the continuing positive returns from the Long-Term Investment Portfolio. The NAIC will continue to exercise close oversight of this portfolio and invest in a prudent manner but it is impossible to predict the timing, length, and size of a financial downturn if it were to occur. II. Benefits of Project/Initiative to NAIC Members: NAIC members will continue to receive the same quality services they have always received from the NAIC. The NAIC will continue to make the necessary improvements in its IT systems and infrastructure as demonstrated by the NAIC’s continuing investment in initiatives such as
167
State Based Systems (SBS), the Securities System Rewrite (SSR) and electronic workpaper project. In addition, the members will benefit from a reduction in their member assessment while benefitting from the NAIC’s continued commitment to provide its products and services in a cost-effective manner. III. Other Stakeholders: This initiative is structured in a manner to provide benefits to multiple parties. The insurance industry will benefit through the elimination of the SVO Assessment, a reduction in database filing fees, and no-cost publications. Consumers and third parties will benefit as they will be able to receive many publications, including consumer guides, at no charge. NAIC members would benefit from a lower annual assessment. All of these reductions would be achieved without impacting the services provided by the NAIC. IV. Business and Operational Impact: The two primary impacts are financial systems and operational. There will be modifications required to ensure the new rate structures are properly entered into the billing and financial systems. Since rate and assessment changes are an ongoing part of the Association’s activities, these changes can be implemented seamlessly. From an operational perspective, the NAIC will continue to focus on delivering its products and services in an efficient and cost-effective manner which will require a move to an electronic delivery format that will allow the NAIC to provide a number of publications and whitepapers at no cost. Excluding the publications listed on the previous page of this fiscal, which the NAIC will continue to publish in print version, all other publications will only be available online and will not be made available in print version to members or third parties. V. Financial Impact: The financial impact of this fiscal is as follows: 1. SVO Assessment – this fee is eliminated in the 2015 budget resulting in a reduction of
$790,000 from the baseline budget. This assessment is included in the Valuation Services category in the NAIC’s Revenue and Expense statement. In 2014, a total of 386 insurance companies were billed this assessment.
2. Database Filing Fees – the fee is reduced by $1,354,416 compared to the 2015 baseline
budget. There will continue to be 33 tiers but the cost of each tier will be reduced by 5%. In addition, the cap for single companies, groups and combined billing will be reduced by 5%.
3. Publications – revenue is reduced by $953,264 compared to the baseline budget. Of this
amount, $650,000 is attributable to consumer guides and the remaining $303,264 is attributable to no longer charging for low volume publications. In addition, by moving to an electronic on-demand model to allow downloading of the selected publication, costs (printing, storage, shipping, and inventory management) are expected to decline by $105,379 in 2015.
4. Member Assessment – this fee is reduced by $194,024 in 2015 compared to the 2015
baseline budget. Member Assessment revenue will become $2,193,791 in the 2015 budget. The assessment of each member will be reduced by 5% with a $125,000 cap.
168

The total financial impact of this fiscal is a revenue reduction of $3,291,704 and an expense reduction of $105,379 resulting in a bottom line reduction of $3,186,325. This is a 3.5% reduction in proposed 2015 budgeted revenues and a 0.1% reduction in proposed 2015 budgeted expenses. In addition, the impact on the NAIC’s liquid operating reserve ratio is a -3.2% thereby reducing the projected ratio to 94.7% at the end of 2015.
It is important to note these revenue revisions are expected to remain in place for the foreseeable future; however, the database filing fee structure would be restored to the current 2014 fee structure for the filing year following a liquid operating reserve ratio decline of 300 or more basis points below the lower end of the target range in place at NAIC’s fiscal year end. For example, if the liquid operating reserve ratio at the end of year is below 77%, measured by the current target range of 80% - 91%, the 2014 database filing fee structure would be restored. See Attachment I for the financial impact details. VI. Alternatives or Partnerships: The main objective of this fiscal is to reduce the fees received from a number of constituents (insurance companies, consumers, third parties, and members) and ensure the revenue reduction is conducted in a thoughtful and prudent manner while maintaining an appropriate liquid operating reserve. The revenue categories selected can be implemented within the 2015 budget and will provide immediate savings to a number of constituents. Additional adjustments may be considered in the future depending on the NAIC’s financial situation and future cash requirements. VII. Risk Management: The most significant risk to the NAIC is a significant decline in revenues generated by NAIC products and services or the NAIC’s Long-Term Investment Portfolio which would impair the NAIC’s financial position and require the NAIC to increase revenues or reduce services. The Long-Term Investment Portfolio is closely monitored by the Internal Administration (EX1) Subcommittee and is prudently managed with professional investment advice from an independent financial advisor; the NAIC’s primary investment objective is to be positioned to participate in positive financial markets with a slight trade-off for over performance in down markets. Given the NAIC’s continuing revenue streams and careful management of the Long-Term Investment Portfolio, the NAIC should be able to weather negative financial markets for a reasonable period of time without impacting the Association’s ability to meet its financial and operational obligations. NAIC management and the Executive (EX) Committee will continuously monitor the Association’s financial position and take appropriate action if required.
169

170
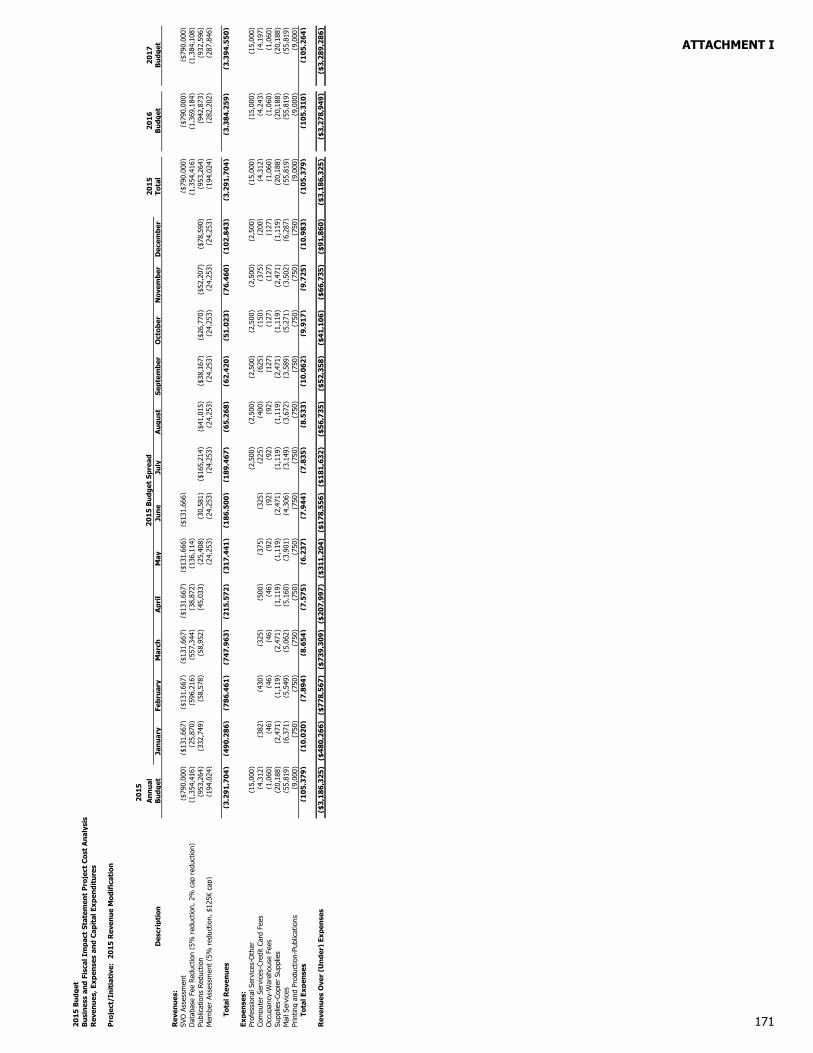
2015
Bud
get
Bus
ines
s an
d Fi
scal
Im
pact
Sta
tem
ent
Pro
ject
Cos
t A
naly
sis
Rev
enue
s, E
xpen
ses
and
Cap
ital
Exp
endi
ture
s
P
roje
ct/I
niti
ativ
e: 2
015
Rev
enue
Mod
ific
atio
n
2015
Ann
ual
2015
2016
2017
Des
crip
tion
Bud
get
Janu
ary
Febr
uary
Mar
chA
pril
May
June
July
Aug
ust
Sept
embe
rO
ctob
erN
ovem
ber
Dec
embe
rTo
tal
Bud
get
Bud
get
Rev
enue
s:SV
O A
sses
smen
t($
790,
000)
($13
1,66
7)($
131,
667)
($13
1,66
7)($
131,
667)
($13
1,66
6)($
131,
666)
($79
0,00
0)($
790,
000)
($79
0,00
0)D
atab
ase
Fee
Redu
ctio
n (5
% r
educ
tion,
2%
cap
red
uctio
n)(1
,354
,416
)(2
5,87
0)(5
96,2
16)
(557
,344
)(3
8,87
2)(1
36,1
14)
(1,3
54,4
16)
(1,3
69,1
84)
(1,3
84,1
08)
Publ
icat
ions
Red
uctio
n(9
53,2
64)
(332
,749
)(5
8,57
8)(5
8,95
2)(4
5,03
3)(2
5,40
8)(3
0,58
1)($
165,
214)
($41
,015
)($
38,1
67)
($26
,770
)($
52,2
07)
($78
,590
)(9
53,2
64)
(942
,873
)(9
32,5
96)
Mem
ber
Asse
ssm
ent
(5%
red
uctio
n, $
125K
cap
)(1
94,0
24)
(24,
253)
(24,
253)
(24,
253)
(24,
253)
(24,
253)
(24,
253)
(24,
253)
(24,
253)
(194
,024
)(2
82,2
02)
(287
,846
)
T
otal
Rev
enue
s(3
,291
,704
)(4
90,2
86)
(786
,461
)(7
47,9
63)
(215
,572
)(3
17,4
41)
(186
,500
)(1
89,4
67)
(65,
268)
(62,
420)
(51,
023)
(76,
460)
(102
,843
)(3
,291
,704
)(3
,384
,259
)(3
,394
,550
)
Expe
nses
:Pr
ofes
sion
al S
ervi
ces-
Oth
er(1
5,00
0)(2
,500
)(2
,500
)(2
,500
)(2
,500
)(2
,500
)(2
,500
)(1
5,00
0)(1
5,00
0)(1
5,00
0)Co
mpu
ter
Serv
ices
-Cre
dit
Card
Fee
s(4
,312
)(3
82)
(430
)(3
25)
(500
)(3
75)
(325
)(2
25)
(400
)(6
25)
(150
)(3
75)
(200
)(4
,312
)(4
,243
)(4
,197
)O
ccup
ancy
-War
ehou
se F
ees
(1,0
60)
(46)
(46)
(46)
(46)
(92)
(92)
(92)
(92)
(127
)(1
27)
(127
)(1
27)
(1,0
60)
(1,0
60)
(1,0
60)
Supp
lies-
Copi
er S
uppl
ies
(20,
188)
(2,4
71)
(1,1
19)
(2,4
71)
(1,1
19)
(1,1
19)
(2,4
71)
(1,1
19)
(1,1
19)
(2,4
71)
(1,1
19)
(2,4
71)
(1,1
19)
(20,
188)
(20,
188)
(20,
188)
Mai
l Ser
vice
s(5
5,81
9)(6
,371
)(5
,549
)(5
,062
)(5
,160
)(3
,901
)(4
,306
)(3
,149
)(3
,672
)(3
,589
)(5
,271
)(3
,502
)(6
,287
)(5
5,81
9)(5
5,81
9)(5
5,81
9)Pr
intin
g an
d Pr
oduc
tion-
Publ
icat
ions
(9,0
00)
(750
)(7
50)
(750
)(7
50)
(750
)(7
50)
(750
)(7
50)
(750
)(7
50)
(750
)(7
50)
(9,0
00)
(9,0
00)
(9,0
00)
T
otal
Exp
ense
s(1
05,3
79)
(10,
020)
(7,8
94)
(8,6
54)
(7,5
75)
(6,2
37)
(7,9
44)
(7,8
35)
(8,5
33)
(10,
062)
(9,9
17)
(9,7
25)
(10,
983)
(105
,379
)(1
05,3
10)
(105
,264
)
Rev
enue
s O
ver
(Und
er)
Expe
nses
($3,
186,
325)
($48
0,26
6)($
778,
567)
($73
9,30
9)($
207,
997)
($31
1,20
4)($
178,
556)
($18
1,63
2)($
56,7
35)
($52
,358
)($
41,1
06)
($66
,735
)($
91,8
60)
($3,
186,
325)
($3,
278,
949)
($3,
289,
286)
2015
Bud
get
Spre
ad
171
ATTACHMENT I

172

Unrestricted
Net Assets

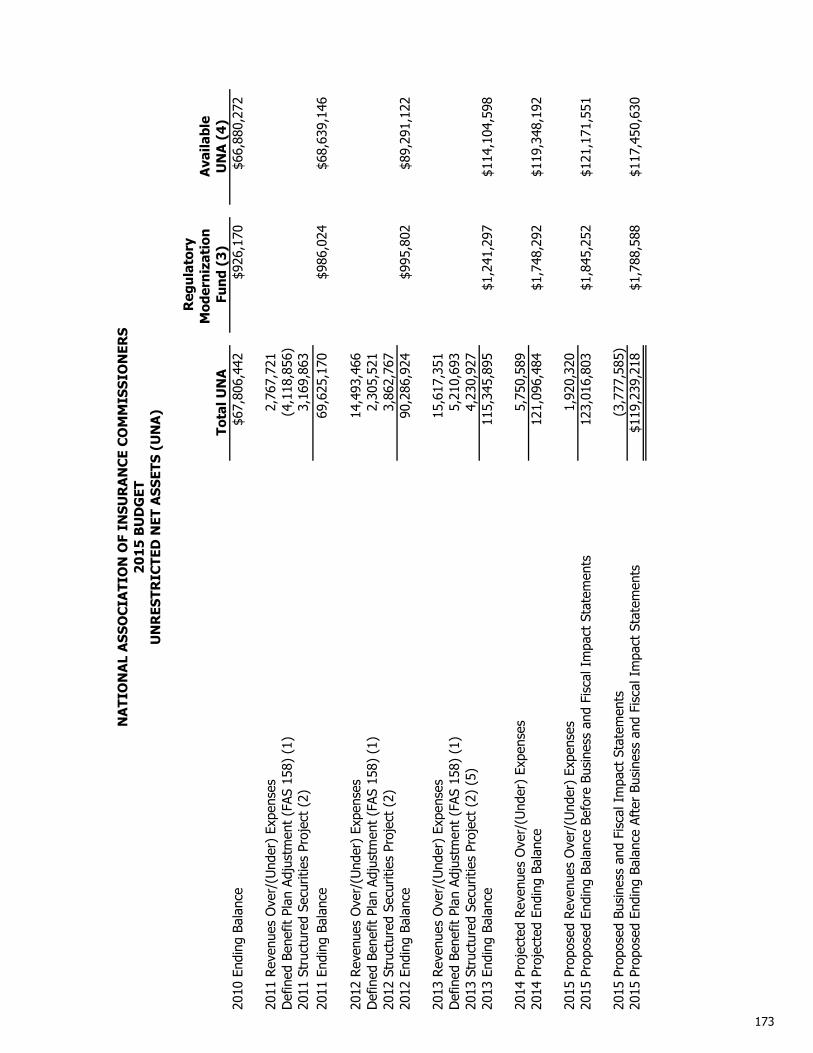
Reg
ulat
ory
Mod
erni
zati
on
Ava
ilabl
eTo
tal U
NA
Fund
(3)
UN
A (
4)20
10 E
ndin
g Ba
lanc
e$6
7,80
6,44
2$9
26,1
70$6
6,88
0,27
2
2011
Rev
enue
s O
ver/
(Und
er)
Expe
nses
2,76
7,72
1D
efin
ed B
enef
it Pl
an A
djus
tmen
t (F
AS 1
58)
(1)
(4,1
18,8
56)
2011
Str
uctu
red
Secu
ritie
s Pr
ojec
t (2
)3,
169,
863
2011
End
ing
Bala
nce
69,6
25,1
70$9
86,0
24$6
8,63
9,14
6
2012
Rev
enue
s O
ver/
(Und
er)
Expe
nses
14,4
93,4
66D
efin
ed B
enef
it Pl
an A
djus
tmen
t (F
AS 1
58)
(1)
2,30
5,52
120
12 S
truc
ture
d Se
curit
ies
Proj
ect
(2)
3,86
2,76
720
12 E
ndin
g Ba
lanc
e90
,286
,924
$995
,802
$89,
291,
122
2013
Rev
enue
s O
ver/
(Und
er)
Expe
nses
15,6
17,3
51D
efin
ed B
enef
it Pl
an A
djus
tmen
t (F
AS 1
58)
(1)
5,21
0,69
320
13 S
truc
ture
d Se
curit
ies
Proj
ect
(2)
(5)
4,23
0,92
720
13 E
ndin
g Ba
lanc
e11
5,34
5,89
5$1
,241
,297
$114
,104
,598
2014
Pro
ject
ed R
even
ues
Ove
r/(U
nder
) Ex
pens
es5,
750,
589
2014
Pro
ject
ed E
ndin
g Ba
lanc
e12
1,09
6,48
4$1
,748
,292
$119
,348
,192
2015
Pro
pose
d Rev
enue
s O
ver/
(Und
er)
Expe
nses
1,92
0,32
020
15 P
ropo
sed
Endi
ng B
alan
ce B
efor
e Bu
sine
ss a
nd F
isca
l Im
pact
Sta
tem
ents
123,
016,
803
$1,8
45,2
52$1
21,1
71,5
51
2015
Pro
pose
d Bu
sine
ss a
nd F
isca
l Im
pact
Sta
tem
ents
(3,7
77,5
85)
2015
Pro
pose
d En
ding
Bal
ance
Aft
er B
usin
ess
and
Fisc
al I
mpa
ct S
tate
men
ts$1
19,2
39,2
18$1
,788
,588
$117
,450
,630
NA
TIO
NA
L A
SSO
CIA
TIO
N O
F IN
SUR
AN
CE
CO
MM
ISSI
ON
ERS
2015
BU
DG
ETU
NR
ESTR
ICTE
D N
ET A
SSET
S (U
NA
)
173

The
SFAS
158
adju
stm
ents
atD
ecem
ber
31,
2013
,de
crea
sed
the
liabi
lity
$4,2
82,5
50an
din
crea
sed
net
asse
ts$5
,210
,693
.Th
isin
crea
sew
asdr
iven
bym
arke
t pe
rfor
man
ce d
urin
g 20
13.
(5)
On
Augu
st24
,20
13th
eEx
ecut
ive
(EX)
Com
mitt
eean
dIn
tern
alAd
min
istr
atio
n(E
X1)
Subc
omm
ittee
vote
dto
cons
olid
ate
the
net
asse
tsof
the
Stru
ctur
edSe
curit
ies
Proj
ect
with
the
gene
ral
net
asse
tsof
the
NAI
C.Th
isco
nsol
idat
ion
will
mor
eac
cura
tely
refle
ctho
wth
eN
AIC
man
ages
the
finan
cial
posi
tion
ofth
eor
gani
zatio
nan
dw
illsi
mpl
ifyac
coun
ting
and
audi
ting
proc
esse
s.Th
etim
ing
ofth
isco
nsol
idat
ion
isim
port
ant
give
nth
ees
tabl
ishm
ent
ofth
eSt
ruct
ured
Secu
ritie
sG
roup
inth
eN
ewYo
rkO
ffic
e,w
hich
refle
cts
the
NAI
C’s
on-g
oing
com
mitm
ent
toth
eSt
ruct
ured
Secu
ritie
sPr
ojec
tan
dfu
rthe
rex
pand
sth
e sc
ope
of t
his
proj
ect
beyo
nd it
s or
igin
al R
MBS
cha
rter
.
(3)
The
NAI
Cin
stitu
ted
the
Reg
ulat
ory
Mod
erni
zatio
nan
dIn
itiat
ives
Fund
durin
gth
e20
05bu
dget
proc
ess
tom
anag
esp
endi
ngbe
yond
the
prop
osed
budg
etby
esta
blis
hing
spen
ding
guid
elin
efo
rne
win
itiat
ives
and
prop
osal
ssu
bmitt
edsu
bseq
uent
toth
ean
nual
budg
etpr
esen
tatio
n.Th
efu
ndba
lanc
ew
ases
tabl
ishe
d at
1.5
% o
f pr
ojec
ted
cons
olid
ated
net
ass
ets
for
that
yea
r.
UN
RES
TRIC
TED
NET
ASS
ETS
(4)
From
2005
until
2010
,th
eN
AIC’
sop
erat
ing
rese
rve
polic
ypr
ovid
edfo
ra
targ
eted
liqui
dre
serv
eeq
ualt
o80
%of
the
next
year
’sbu
dget
edex
pens
es.O
nSe
ptem
ber
22,
2011
,th
eEx
ecut
ive
(EX)
Com
mitt
eean
dIn
tern
alAd
min
istr
atio
n(E
X1)
Subc
omm
ittee
appr
oved
are
port
from
the
cons
ultin
gfir
mhi
red
tore
view
the
NAI
C’s
oper
atin
gre
serv
es,
whi
chch
ange
dth
eN
AIC’
sliq
uid
rese
rve
targ
etfr
oma
flat
80%
,to
ata
rget
rang
eof
80%
to91
%.
This
chan
geis
the
resu
lt of
cur
rent
and
fut
ure
iden
tifie
d ris
ks a
nd c
ompa
rison
s to
com
para
ble
orga
niza
tions
.
(1)
Stat
emen
tof
Fina
ncia
lAc
coun
ting
Stan
dard
s(S
FAS)
No.
158,
Empl
oyer
s'Ac
coun
ting
for
Def
ined
Bene
fitPe
nsio
nsan
dO
ther
Post
retir
emen
tPl
ans
requ
ires
plan
spon
sors
tore
flect
the
fund
edst
atus
ofth
eir
defin
edbe
nefit
plan
son
aco
mpa
nyba
lanc
esh
eet
ona
proj
ecte
dbe
nefit
oblig
atio
nba
sis.
This
isac
com
plis
hed
thro
ugh
anad
just
men
tto
unal
loca
ted
net
asse
ts,
orne
teq
uity
ofth
eN
AIC,
and
resu
ltsfr
omth
eac
tual
perf
orm
ance
ofth
eN
AIC'
sde
fined
bene
fit p
lan
com
pare
d to
ass
umed
per
form
ance
of in
vest
men
ts, d
isco
unt
rate
s, a
nd c
over
ed p
artic
ipan
ts.
The
plan
expe
rienc
edan
over
alll
oss
in20
11du
eto
alo
wer
disc
ount
rate
,w
hich
impa
cts
the
pres
ent
valu
eof
futu
rebe
nefit
liabi
litie
s,an
da
decr
ease
inth
eas
sets
held
inth
epl
anas
are
sult
ofm
arke
tpe
rfor
man
ce.
The
SFAS
158
adju
stm
ent
for
2011
incr
ease
dth
ede
fined
bene
fitpl
anlia
bilit
yby
$5,6
96,6
21an
dde
crea
sed
net
asse
ts b
y $4
,118
,855
.
In20
12,
the
defin
edbe
nefit
plan
expe
rienc
eda
loss
due
toa
low
erdi
scou
ntra
teim
pact
ing
the
pres
ent
valu
eof
futu
rebe
nefit
liabi
litie
s.O
ffse
ttin
gth
elo
sson
liabi
litie
sw
asan
asse
tga
inas
are
sult
ofm
arke
tpe
rfor
man
ce.
Inad
ditio
n,as
ofD
ecem
ber
31,
2012
,ac
crue
dbe
nefit
sfo
ral
lac
tive
empl
oyee
sw
ere
froz
en.
Asa
resu
ltof
the
elim
inat
ion
offu
ture
accr
uals
,an
imm
edia
tega
inin
com
preh
ensi
vein
com
ew
asre
cogn
ized
equa
lto
the
decr
ease
inpr
ojec
ted
bene
fitob
ligat
ions
.Th
ene
tSF
AS15
8ad
just
men
tfo
r20
12de
crea
sed
the
defin
edbe
nefit
plan
liabi
lity
by$4
,326
,836
and
incr
ease
dne
tas
sets
by$2
,305
,521
.
(2)
The
amou
ntof
dire
ctre
venu
esin
exce
ssof
dire
ctex
pens
esfo
rth
eSt
ruct
ured
Secu
ritie
sPr
ojec
tis
allo
cate
dfo
ran
ticip
ated
furt
her
wor
kin
the
area
ofre
side
ntia
lm
ortg
age-
back
edse
curit
ies
(RM
BS),
com
mer
cial
mor
tgag
e-ba
cked
secu
ritie
s(C
MBS
)an
dot
her
stru
ctur
edas
set
clas
ses.
Furt
her,
the
indi
rect
cost
sof
staf
fsu
ppor
tto
this
initi
ativ
eis
allo
cate
dto
war
dth
eto
tal
cost
sof
this
proj
ect.
This
proj
ect
was
com
bine
dw
ithth
ene
tas
sets
ofth
eN
AIC
onJa
nuar
y 1,
201
4.
174

2013 Annual Report


2013ANNUALREPORT
State-BasedInsurance Regulation:
THE SYSTEMAT WORK
175
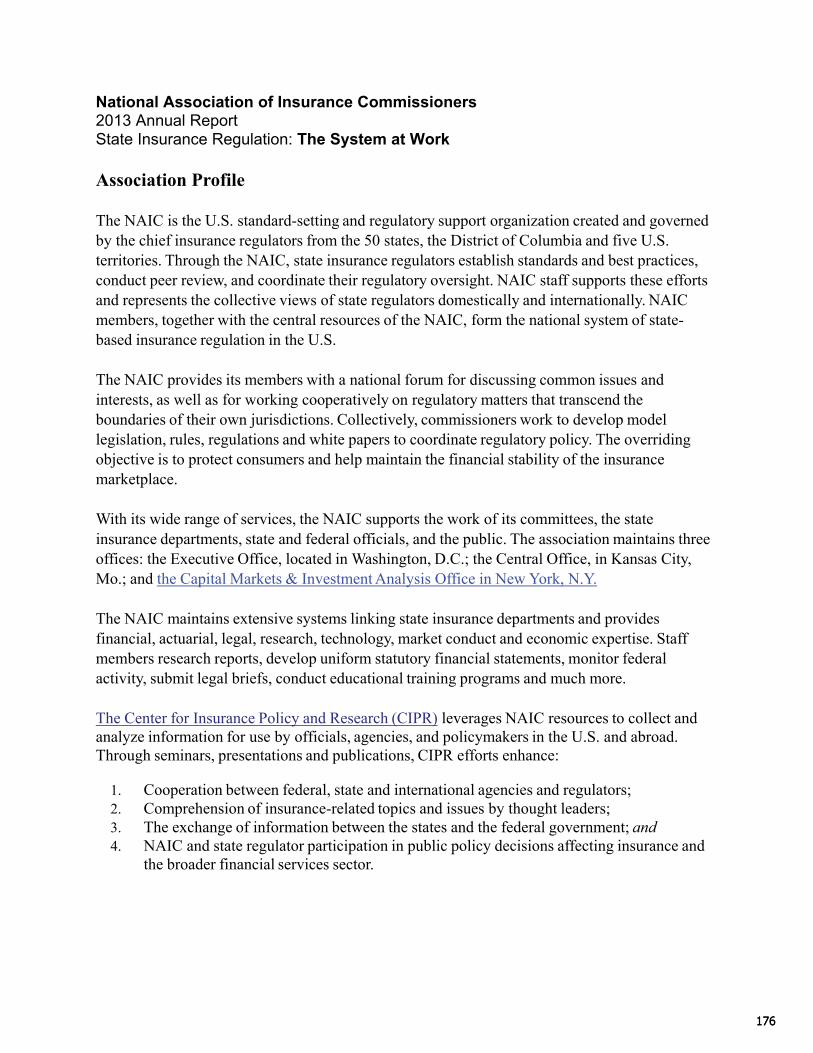
176
National Association of Insurance Commissioners 2013 Annual Report State Insurance Regulation: The System at Work
Association Profile
The NAIC is the U.S. standard-setting and regulatory support organization created and governed by the chief insurance regulators from the 50 states, the District of Columbia and five U.S. territories. Through the NAIC, state insurance regulators establish standards and best practices, conduct peer review, and coordinate their regulatory oversight. NAIC staff supports these efforts and represents the collective views of state regulators domestically and internationally. NAIC members, together with the central resources of the NAIC, form the national system of state- based insurance regulation in the U.S.
The NAIC provides its members with a national forum for discussing common issues and interests, as well as for working cooperatively on regulatory matters that transcend the boundaries of their own jurisdictions. Collectively, commissioners work to develop model legislation, rules, regulations and white papers to coordinate regulatory policy. The overriding objective is to protect consumers and help maintain the financial stability of the insurance marketplace.
With its wide range of services, the NAIC supports the work of its committees, the state insurance departments, state and federal officials, and the public. The association maintains three offices: the Executive Office, located in Washington, D.C.; the Central Office, in Kansas City, Mo.; and the Capital Markets & Investment Analysis Office in New York, N.Y.
The NAIC maintains extensive systems linking state insurance departments and provides financial, actuarial, legal, research, technology, market conduct and economic expertise. Staff members research reports, develop uniform statutory financial statements, monitor federal activity, submit legal briefs, conduct educational training programs and much more.
The Center for Insurance Policy and Research (CIPR) leverages NAIC resources to collect and analyze information for use by officials, agencies, and policymakers in the U.S. and abroad. Through seminars, presentations and publications, CIPR efforts enhance:
1. Cooperation between federal, state and international agencies and regulators; 2. Comprehension of insurance-related topics and issues by thought leaders; 3. The exchange of information between the states and the federal government; and 4. NAIC and state regulator participation in public policy decisions affecting insurance and
the broader financial services sector.
176

177
2013 NAIC Organizational Chart
Senator Ben Nelson, Chief Executive Officer
Andrew J. Beal, Chief Operating Officer & Chief Legal Officer
Kay Noonan General Counsel
Jim Woody Chief Financial Officer
Julie Fritz Chief Business Strategy &
Development Officer
Jeff Johnston Senior Director, Financial
Regulatory Affairs, Domestic Policy & Implementation
Elise Liebers Senior Director, Financial Regulatory Affairs, International Policy & Market
Surveillance
Ethan Sonnichsen Director,
Government Relations
Eric Nordman Director, Regulatory Services and
Center for Insurance Policy & Research
Trish Schoettger Director,
Member Services
Scott Holeman Director,
Communications
Todd Sells Director, Financial Regulatory
Services
Tim Mullen Director,
Market Regulation
Charles Therriault Director,
Securities Valuation Office
Eric Kolchinsky Director,
Structured Securities Group
Ed Toy Director, Capital Markets
Bureau
Ramon Calderon Director,
International Policy
Denise Matthews Director,
Information Systems
Kris DeFrain Director, Research
& Actuarial Services
Frosty Mohn Director,
Technical Services
Brent Roper Director,
Human Resources
177
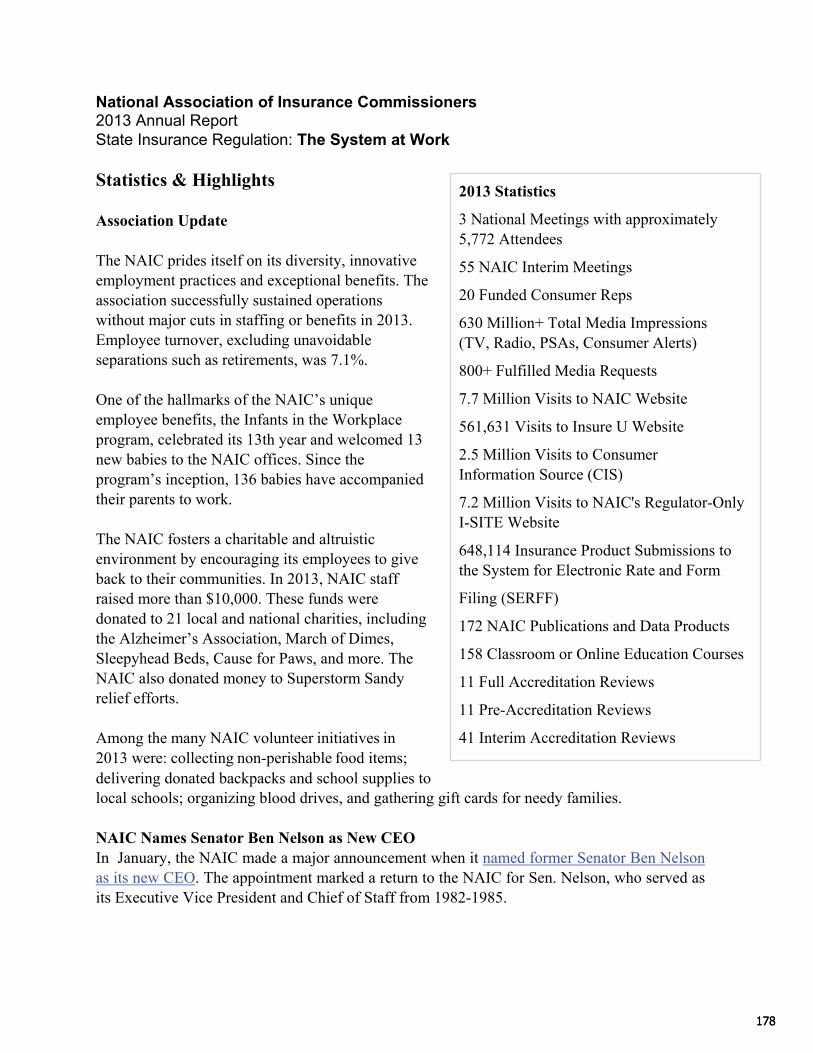
178
National Association of Insurance Commissioners 2013 Annual Report State Insurance Regulation: The System at Work
Statistics & Highlights
Association Update
The NAIC prides itself on its diversity, innovative employment practices and exceptional benefits. The association successfully sustained operations without major cuts in staffing or benefits in 2013. Employee turnover, excluding unavoidable separations such as retirements, was 7.1%.
One of the hallmarks of the NAIC’s unique employee benefits, the Infants in the Workplace program, celebrated its 13th year and welcomed 13 new babies to the NAIC offices. Since the program’s inception, 136 babies have accompanied their parents to work.
The NAIC fosters a charitable and altruistic environment by encouraging its employees to give back to their communities. In 2013, NAIC staff raised more than $10,000. These funds were donated to 21 local and national charities, including the Alzheimer’s Association, March of Dimes, Sleepyhead Beds, Cause for Paws, and more. The NAIC also donated money to Superstorm Sandy relief efforts.
Among the many NAIC volunteer initiatives in 2013 were: collecting non-perishable food items; delivering donated backpacks and school supplies to
2013 Statistics
3 National Meetings with approximately 5,772 Attendees
55 NAIC Interim Meetings
20 Funded Consumer Reps
630 Million+ Total Media Impressions (TV, Radio, PSAs, Consumer Alerts)
800+ Fulfilled Media Requests
7.7 Million Visits to NAIC Website
561,631 Visits to Insure U Website
2.5 Million Visits to Consumer Information Source (CIS)
7.2 Million Visits to NAIC's Regulator-Only I-SITE Website
648,114 Insurance Product Submissions to the System for Electronic Rate and Form
Filing (SERFF)
172 NAIC Publications and Data Products
158 Classroom or Online Education Courses
11 Full Accreditation Reviews
11 Pre-Accreditation Reviews
41 Interim Accreditation Reviews
local schools; organizing blood drives, and gathering gift cards for needy families. NAIC Names Senator Ben Nelson as New CEO In January, the NAIC made a major announcement when it named former Senator Ben Nelson as its new CEO. The appointment marked a return to the NAIC for Sen. Nelson, who served as its Executive Vice President and Chief of Staff from 1982-1985.
178
179
Soon after assuming his role, Sen. Nelson stated his goals as CEO, voiced his ardent support for state-based regulation, discussed the importance of engaging in dialogues with international regulators, . He has led the NAIC’s efforts to meet the needs of its members and represent their interests at the federal level by reaching out to federal and international governmental entities as well as state government associations, consumers and insurance industry representatives.
Robert Dineen Award The NAIC Robert Dineen Award is given each year to a state insurance department staff member who has made an outstanding contribution to insurance regulation. In 2013, two regulators received this prestigious award.
As Connecticut’s chief financial regulator, Kathy Belfi has worked to position the state as a worldwide leader in group supervision and the use of Supervisory Colleges. She manages the state’s participation in 15 supervisory colleges and serves as lead for eight of these colleges. Belfi was recognized for her outstanding national leadership on critical group supervision and supervisory college issues.
Frederick Heese has been the Chief Financial Examiner and Division Director at the Missouri Department since 2007. His experience and expertise have been essential in the enhancement of solvency regulation, and he has provided critical insight into the state’s work on captives and special purpose vehicles, the development and implementation of the ORSA requirements and holding company model law revisions. In addition, Heese provides essential support to Director John M. Huff in his work on the Financial Stability Oversight Council (FSOC).
179

180
National Association of Insurance Commissioners 2013 Annual Report State Insurance Regulation: The System at Work
Government Affairs
The insurance industry continues to grow as a vibrant source of financial strength in the U.S. Not surprisingly, as a key element in the financial machine, policymakers in Washington, D.C. continue their engagement in the insurance sector. The Government Relations Leadership Council (GRLC) is responsible for coordinating the NAIC’s work with, Congress, federal agencies and the administration. As federal legislative and regulatory developments evolve, GRLC is engaged in shaping policy and educating the NAIC’s federal counterparts. When the mechanics of the federal government shut down - as it did for 16 days in October - state regulation continued to operate effectively, providing stability and protection of policyholders.
TRIA
The NAIC continues to support efforts in Congress to reauthorize the Terrorism Risk Insurance Act (TRIA), set to expire at the end of 2014. The NAIC has maintained its support that terrorism insurance be available and affordable, and continuity of the program offers stability to the market. At the Summer National Meeting, the NAIC passed a resolution articulating support for TRIA reauthorization. In September, the NAIC sent a letter to the Treasury Department further urging the President’s Working Group on Financial Markets to consider the ramifications of a lapse in the program. The NAIC also sent letters to leadership in the U.S. House of Representatives and U.S. Senate.
NARAB II
Another initiative in Congress that the NAIC supports is the creation of the National Association of Registered Agents and Brokers, often referred to as NARAB II. The current legislation pending in Congress largely represents negotiations and consensus between regulators and industry producer groups as to how such an association would be structured to best meet the goal of streamlined producer licensing while assuring state regulatory authority is preserved. 2013 NAIC Vice President and Montana Insurance Commissioner Monica Lindeen testified before Congress on behalf of the NAIC in support of passage of NARAB II in March. The House of Representatives passed the bill in early September, but the Senate did not take action in 2013.
Systemically Important Financial Institutions (SIFIs)
The 2008 financial crisis highlighted how interconnected the gears between financial institutions have become, and the damage that can be done when regulation is out of alignment. In order to better coordinate regulatory action and identify risk, Congress created the Financial Stability Oversight Council (FSOC). Director John Huff from Missouri serves as the state insurance regulator representative to the Council. In 2013, FSOC designated two insurance companies as being systematically important; AIG and Prudential. Some concerns in Director
180

181
Huff’s dissenting opinion on Prudential’s Designation raise questions regarding transparency of process and methodology used in the designations. The NAIC continues to monitor the impact that these designations have on the companies as well as the broader insurance markets in which they operate.
Ongoing Coordination and Education
The importance of a coordinated approach between states and the federal government was evident when President Obama requested a meeting with insurance commissioners in November to discuss health insurance reform issues. The group discussed practical implications of implementing the delay in enforcement as well as outstanding questions regarding what specific provisions would be impacted.
Following that meeting, in December, NAIC leadership met with Treasury Secretary Jacob Lew. The focus of the meeting was on significant international developments, including the ongoing EU-U.S. dialogue and Solvency II, the inclusion of state regulators in the work of the Financial Stability Board, and efforts to develop a global capital standard.
In addition to the legislative and regulatory issues that require immediate engagement, there are a number of opportunities for the NAIC to work with members of Congress and the administration to ensure that they understand the insurance regulator perspective as they shape federal policy. For example, in November, Kurt Regner, Assistant Director of the Arizona Department of Insurance, testified before Congress on behalf of the NAIC on housing finance reform issues.
As the Federal Reserve asserts new holding company authorities over thrift holding companies with insurance operations, state regulators continue to meet with Federal Reserve representatives to exchange information and discuss how to best work together going forward.
Regulators continue to monitor other federal activity and work with agencies such as the Securities and Exchange Commission, the Federal Deposit Insurance Corporation, the Consumer Financial Protection Bureau and the Departments of Commerce and Labor as matters that touch the insurance sector arise.
181

182
National Association of Insurance Commissioners2013 Annual Report State Insurance Regulation: The System at Work
Health Insurance Policy
Since the passage of the Affordable Care Act (ACA) in 2010, states have been gearing up for a slew of reforms. In 2013, the health insurance sector underwent a near complete transformation when health exchange marketplaces opened in every state. Regulators across the country coordinated to meet statutory deadlines and align regulatory policy in a new paradigm. State insurance departments, coordinated through the NAIC, worked with federal agencies on countless reforms.
The NAIC provided insight, guidance and information to the federal government, and supported insurance regulators regardless of the exchange model pursued in their state. While the ACA greatly expanded federal involvement in health insurance standards and oversight, states continue to regulate the health insurance industry. Nevertheless, the NAIC weighed in with the President, Congress and federal agencies on implementation issues that had the potential to destabilize the marketplace.
The Regulatory Alternatives Working Group continued to analyze the impact of the ACA on the regulatory authority of state insurance regulators. The NAIC also adopted a white paper on specific and unique challenges facing the territories.
The Regulatory Framework Task Force reviewed all current models to determine whether they need amending in light of the ACA and will begin making such amendments in 2014. The Task Force has also developed model acts to implement the ACA and is working on model regulations to implement the law in the states. In addition, the ERISA Working Group is developing a White Paper on the potential impact of stop loss coverage in the new small group marketplace and the Health Insurance and Managed Care Committee, along with the Producer Licensing Task Force and the Anti-Fraud Task Force, is in the process of writing a paper to help states address fraud and misleading marketing practices.
To assist regulators in educating consumers through the ACA changes, the NAIC created a Frequently Asked Questions document for states to customize and share with consumers. The NAIC also issued consumer alerts to help individuals make informed decision when shopping on an exchange and gave guidance to avoid fraud when reviewing health care insurance options.
Outside of health reform, the NAIC continues to address challenges in the long-term care market. In June the NAIC held an interim meeting and invited stakeholders to weigh in on the challenges of old policies, as well as addressing market reforms necessary going forward. In December, the NAIC adopted a model bulletin and continues to work on possible amendments to the long-term care insurance models.
182

183
National Association of Insurance Commissioners2013 Annual Report State Insurance Regulation: The System at Work
International Insurance Supervision
International leadership is a critical focus for NAIC members. The U.S. leads the global insurance market in regulatory advancements and insurance premiums – due largely to the state- based approach to regulation coordinated through the NAIC. State regulators are committed to working with its international counterparts to encourage regulatory innovation and cooperation without undermining the strong U.S. system.
Throughout 2013, NAIC members led and participated in a number of fronts to serve the U.S. insurance marketplace and advance effective regulatory frameworks globally. NAIC CEO Senator Ben Nelson updated Congress on these efforts when he testified before Congress in June. Nelson urged Congress to be wary of international regulatory approaches that are too rigid, or apply a “one-size-fits-all” approach to issues like group supervision.
International Insurance Forum
In May, the NAIC hosted the 6th annual International Insurance Forum in Washington, D.C. The two-day conference featured NAIC members, representatives from the International Monetary Fund and the Federal Reserve Board, and CEOs from internationally active insurance companies. More than 200 people attended the forum to discuss issues such as effective group supervision, policyholder protection structures and financial stability in the insurance sector.
International Association of Insurance Supervisors
As a founding member of the International Association of Insurance Supervisors (IAIS), U.S. regulators remain committed to using the association as a forum for coordination and global standard-setting. IAIS members continue to work on a regulatory framework for Internationally Active Insurance Groups (IAIGs). In August 2013, the NAIC released a position paper on ComFrame to articulate the views of U.S. state insurance regulators, who believe the goal of ComFrame should be to support flexible approaches that achieve common regulatory outcomes instead of rigid guidance that could impose additional and unwarranted new requirements on IAIGs.
EU-U.S. Insurance Dialogue Project
For more than a decade, U.S. regulators have engaged their European counterparts on ways to increase cooperation and harmonize regulatory approaches where appropriate. In 2012, regulators were joined by representatives from Treasury, the European Commission and European Insurance and Occupational Pensions Authority (EIOPA) in a formalized dialogue, with specific objectives outlined in a joint report and set of common objectives. The EU-U.S. Dialogue Project Steering Committee convened a public forum on December 14 in conjunction
183
184
with the NAIC Fall National Meeting in Washington, D.C. Participants discussed international
insurance issues including international group supervision and supervisory colleges. Regulatory Cooperation
The NAIC remains committed to both educating and learning from insurance supervisors globally. U.S. regulators and NAIC staff participated in technical trainings and dialogues with regulators from the Association of Latin American Insurance Supervisors (ASSAL), China and Thailand. In addition, regulator-to-regulator dialogues were held with supervisors from Bermuda, Canada, China, Japan, and Switzerland. These meetings allow for cross-border insurance information sharing, coordination of policy and standard-setting.
International Fellows
The NAIC International Fellows Program continued in 2013 with two classes. The purpose of the Fellows Program is to advance relationships with foreign regulators and emphasize the exchange of effective regulatory techniques and tools. The conclusion of the fall session brings total participation to 198 regulators from 28 countries since the program’s inception in 2004. Thirty-seven U.S. jurisdictions have hosted fellows.
184

185
National Association of Insurance Commissioners 2013 Annual Report State Insurance Regulation: The System at Work
Financial Regulation
Financial examinations and analysis are central to solvency oversight. By utilizing comprehensive tools and resources (e.g. Financial Analysis Solvency Tools (FAST) scores and handbooks) regulators are able to minimize insolvencies and their corresponding impact on policyholders. In addition, state regulators carry out periodic risk-focused, on-site financial examinations in which they evaluate the insurer’s corporate governance, management oversight and financial strength.
In addition to encompassing important solvency-related considerations related to the U.S. state- based system of insurance regulation, major efforts in financial regulation highlight the NAIC’s continuing efforts to be responsive to the challenges and needs of a global marketplace. Highlights from 2013 include the following:
Group Supervision — Twenty-four jurisdictions passed key amendments to their holding company statutes, which will aid them in better assessing the contagion risks present in the business enterprise that include insurers. U.S. insurance regulators are modifying the group supervisory framework and have been increasingly involved in leading the development of an international group supervisory framework.
Reinsurance — The NAIC adopted the Process for Developing and Maintaining the NAIC List of Qualified Jurisdictions in August 2013, which was developed to evaluate the reinsurance supervisory systems of non-U.S. jurisdictions for reinsurance collateral reduction purposes. Under the NAIC model law and regulation regarding credit for reinsurance, reinsurers licensed and domiciled in a qualified jurisdiction are eligible to be certified for reduced reinsurance collateral requirements. Based on the review and recommendation by the Qualified Jurisdiction (E) Working Group, the NAIC approved the reinsurance supervisory authorities in Bermuda (for limited classes of (re)insurers), Germany, Switzerland and United Kingdom as conditional qualified jurisdictions, to be effective January 1, 2014. While the NAIC list is not binding, it must be considered by the states in making qualified jurisdiction determinations.
Additionally, the Reinsurance Financial Analysis (E) Working Group was established to provide a peer review process for individual states’ certified reinsurer designations. The working group’s procedures are intended to facilitate consistency among the states in the process of certifying reinsurers, as well as promote and coordinate multi-state efforts in addressing related issues. To date, the working group has conducted peer reviews with respect to 30 certifications issued thus far by various states.
185
186
Principle-Based Reserving (PBR) — With the adoption of the Standard Valuation Law (#820) and Valuation Manual, the NAIC directed its efforts to the implementation of PBR. An implementation plan was developed which addresses regulatory and NAIC staff resources, the process of collecting company experience data using a statistical agent, development of analysis and examination procedures, statutory blanks changes and the creation of a Valuation Analysis (EX) Working Group to provide oversight and consistent application of PBR across each jurisdiction.
Reserving for Universal Life Insurance Policies — The NAIC successfully negotiated the proper valuation methodology for universal life insurance policies with secondary guarantees and has implemented the oversight mechanism to help ensure application by insurers and insurance regulators of Actuarial Guideline XXXVIII—The Application of the Valuation of Life Insurance Policies (AG 38), which is commonly referred to as Regulation AXXX.
Use of Captives — The NAIC adopted a white paper evaluating the use of insurer-owned captives and forwarded its recommendations to the Principle-Based Reserving Implementation (EX) Task Force and the Reinsurance (E) Task Force. The Principle-Based Reserving Implementation (EX) Task Force is utilizing an outside consultant to mediate a consensus framework for life insurers’ use of captives for business subject to Regulation AXXX and/or the Valuation of Life Insurance Policies Model Regulation (#830), which is commonly referred to as Regulation XXX. The Financial Regulation Standards and Accreditation (F) Committee is considering changes to the definition of “multi-state” with regard to any reinsurance ceded from an insurer to a captive (excluding pure captives), and these potential changes would address many of the remaining recommendations from the white paper.
Financial Regulation Standards and Accreditation Program The NAIC Financial Regulation Standards and Accreditation Program was established to maintain standards to promote effective financial solvency regulation. NAIC accreditation allows non-domestic jurisdictions to rely on the accredited domestic regulator to fulfill a baseline level of financial regulatory oversight. This creates substantial efficiencies for insurance regulators, who are then able to coordinate and rely on each other’s work. It also creates far greater efficiencies for insurance companies licensed in accredited states, which are then not subject to financial examinations or other financial oversight by multiple jurisdictions. During 2013, 11 full accreditation reviews, 41 interim annual reviews, and 11 pre-accreditation reviews were conducted.
Financial Examination File Review Project The NAIC supports the Financial Examination Peer File Review Project to assist the jurisdictions in implementing the risk-focused approach to financial examinations. This project involves NAIC staff and examination supervisors from various jurisdictions working together to review and discuss completed exam files. It also provides the opportunity for regulators to develop best practices for conducting risk-focused exams, give and receive feedback for
186
187
consideration on future exams, and offer input on how enhancements can be made to the guidance and training made available by the NAIC to improve the implementation of risk- focused examinations.
Three sessions of the project were completed in 2013, with 27 exam files from 21 different jurisdictions reviewed. Since the project began in 2011, nine sessions have been completed with a total of 81 exam files reviewed from 46 different jurisdictions.
International Insurers Department (IID)
The International Insurers Department (IID) functions as a national gatekeeper for non-U.S. insurers to gain access to the U.S. excess and surplus lines markets. This function includes solvency monitoring and trust account maintenance of all NAIC-listed insurers, as well as oversight and analysis with respect to the process for considering new applications. Eight new insurers were added to the NAIC list during 2013. The most recent financial statistics (2012) reflect that listed insurers wrote direct surplus lines premiums of more than $9.0 billion, or approximately 26% of the $34.3 billion in total U.S. surplus lines premiums written for the year. At year-end 2013, listed insurers maintained $4.4 billion in trust assets which are held as collateral against gross claim liabilities estimated at $14.3 billion.
Structured Securities Group The NAIC established a Structured Securities Group (SSG), housed at the Capital Markets and Investment Analysis Office in New York. The SSG is an internal team of investment professionals that builds upon the NAIC’s technical expertise to provide specialized analysis, valuation, research and reporting for structured securities. The NAIC first began modeling expected losses for non-agency residential mortgage-backed securities (RMBS) CUSIPs owned by insurance companies at the end of 2009. This project was successful and expanded in 2010 to include commercial mortgage-backed securities (CMBS) CUSIPs owned by insurance companies. During 2013, the NAIC continued to monitor insurers’ investments in all types of structured securities, with 1,838 insurers in 52 jurisdictions utilizing NAIC structured securities modeling for the purposes of completing their annual statement and risk-based capital filings. Modeled results were delivered via the NAIC’s Automated Valuation Service (AVS+), traditionally used for delivery of NAIC designations and unit prices, through which each insurer could view and download their specific RMBS and CMBS holdings via a secure web-based environment.
187

188
National Association of Insurance Commissioners 2013 Annual Report State Insurance Regulation: The System at Work
MARKET REGULATION
Consumer protection is the hallmark of the NAIC’s mission. Through the work of the Market Regulation and Consumer Affairs (D) Committee, state regulators ensure that insurance products and services are subject to continuous improvement and informed by the importance of access and affordability of insurance.
Through tracking, compiling, review and oversight, the comprehensive market regulatory process addresses issues that can have a broad impact, such as streamlined producer licensing legislation. In March 2013, NAIC Vice President and Montana Insurance Commissioner Monica J. Lindeen testified before Congress at a hearing entitled Streamlining Regulation, Improving Consumer Protection and Increasing Competition in Insurance Markets. Lindeen’s testimony outlined a number of key components of the National Association of Registered Agents and Brokers Reform Act of 2013 (NARAB II). She conveyed the NAIC’s support of legislation that is intended to preserve state-based insurance regulation and consumer protections and allows states to retain their regulatory authority over consumer protection, market conduct and unfair trade practices.
Market Conduct Annual Statement (MCAS)
MCAS provides a uniform system of collecting market-related information. The NAIC began hosting MCAS in 2009 for 29 members. In 2013, there were 46 participating jurisdictions. Through MCAS, the NAIC assists the jurisdictions with receiving MCAS filings, provides data validation, and enhances the analysis of market conduct information across all participating jurisdictions. There were 26,149 MCAS filings submitted and centrally stored at the NAIC in 2013.
Complaints Database System (CDS)
There were 182,782 complaints submitted by the jurisdictions to the CDS in 2013.The CDS contains information about closed consumer complaints filed against insurance entities and producers. Data contained within the CDS is submitted by state insurance departments on a regular basis in an automated manner. The jurisdictions are able to leverage nationwide data through CDS that would not otherwise be available to individual jurisdictions. There are four closed consumer complaint reports: Closed Complaint Counts by Code; Closed Complaint Counts by State; Closed Complaint Trend Report; and Closed Complaint Index.
188
189
Special Activities Database (SAD) The SAD contains information related to market activities and legal actions involving entities engaged in the business of insurance. This database contains suspicious activities, legal cases, indictments and issues of regulatory concern researched and obtained from state insurance regulators or other legitimate resources, including the Financial Industry Regulatory Authority (FINRA). There were 1,758 special activities added in 2013.
Online Fraud Report System (OFRS)
The OFRS is used by NAIC-member jurisdictions to receive referrals of suspected fraud from consumers and the insurance industry. The NAIC also receives reports from the National Insurance Crime Bureau (NICB). The NICB receives reports from more than 90% of the property/casualty carriers doing business in the United States. The NAIC received 59,501 reports in 2013 that were distributed to members. Increased reporting of fraud to the jurisdictions helps reduce fraud, which, in turn, cut insurers’ expenses, protects consumers and reduces costs passed along to consumers through insurance premiums and costs of services.
Life Claims Settlement and MAWG
The Investigations of Life Insurance and Annuities Claims Settlement Practices (D) Task Force is actively coordinating investigations of the use of the Social Security Death Master File (DMF) by annuity companies and life insurers. The Task Force is leading a review to determine if companies asymmetrically used the DMF to stop annuity payments while not using the DMF to determine if life insurance proceeds should have been paid to beneficiaries. To date, the Task Force has completed investigations of 15 of the largest life insurance groups, which wrote 60% of the national direct written premium for life and annuities products in 2010, the year the Task Force determined the need to conduct the investigations.
The Market Actions (D) Working Group provides a forum for market conduct collaboration between jurisdictions and conducts national level analysis initiatives. The Working Group oversees ongoing multi-state market conduct examinations and conducts a formal review of companies identified in the Market Conduct Annual Statement process. In 2013, the analysis process included the identification of 41 individual companies that required additional review. After further analysis, jurisdictions entered into collaborative investigations, thus reducing the number of single state actions and duplication of effort. In addition, jurisdictions noted that the analysis project itself was able to resolve several concerns that might have led to examinations.
189

190
National Association of Insurance Commissioners 2013 Annual Report State Insurance Regulation: The System at Work
Consumer Education
Protecting policyholders remains one of the NAIC’s top priorities, and to accomplish this charge, the NAIC focuses on consumer education. When consumers are aware of their insurance needs, they are able to make well-informed decisions that will ensure they are protected—and may even save them money. In 2013, the NAIC expanded on its already extensive consumer education program and reached out to more demographics using new, different channels.
Amy Grant Performs an Encore for the NAIC After a successful 2012 campaign that included her popular radio PSA for baby boomers, singer- songwriter Amy Grant returned as the NAIC’s celebrity spokesperson for 2013. In the spring, Grant filmed a television PSA at her home in Nashville. Using her personal experience of caring for her aging parents as they battle dementia, Grant continued to emphasize the importance of preparing for the complex financial decisions—many with insurance implications—that boomers face as they care for aging parents, get their children ready to leave the nest, and plan for their own retirement. The new PSA debuted at the 2013 Spring National Meeting in Houston as part of a special “Backstage with Amy Grant” event.
Teens Get a Crash Course At Insure U According to AAA, more teenage motor vehicle fatalities happen in the summer than any other time of year. Teen drivers are also at increased risk for fatal crashes with each additional passenger. To counter these statistics, research shows that teens whose parents set rules for behavior behind the wheel are half as likely to get into an accident. This research compelled the NAIC to focus its summer Insure U campaign on educating parents of teen drivers about the risks and insurance implications of unsafe driving. The NAIC used an infographic to show eye- opening facts for parents of new drivers, and created a customizable teen driver contract that allows parents and teens to clearly define the rules and consequences associated with driving privileges. Tyler Presnell, an advocate for safer teen driving, partnered with the NAIC to educate parents by doing a radio media tour (RMT) that aired on more than 1,200 stations and reached more than 15 million consumers.
Insure U Says “I Do” In the fall, the NAIC conducted a survey among newlyweds and recently engaged couples, and found that for couples embarking on the journey to combine their financial lives, the real adventure often begins after the honeymoon is over. To help brides and grooms get smart about insurance together without tearing each other apart, the NAIC launched the “I Do” Adventures. This integrated initiative includes a number of resources for newlyweds to learn about buying or combining insurance, including the Insurance Survival Guide for Newlyweds, a consumer alert, and two interactive games that entertain while also teaching important lessons about auto and
190

191
homeowners insurance. In just two months, the games received more than 2,500 visits. The NAIC also partnered with financial expert Manisha Thakor for a radio media tour (RMT). Thakor’s interviews, which featured essential money-saving tips for young couples, were aired in major markets such as Boston and Chicago, and reached an audience of more than 500,000 consumers.
NAIC’s Mobile Apps WRECKCHECK, the NAIC’s free accident checklist mobile app, celebrated its first anniversary in August. In just one year, WRECKCHECK has earned more than 17,500 downloads. The NAIC’s award-winning home inventory app, MyHome Scr.APP.book surpassed 42,000 downloads in 2013. Together, both apps have been downloaded more than 60,000 times on iPhones and Android devices.
Communications Outreach Recognized In October, the NAIC Communications Division won 10 PRISM awards—a clean sweep—from the Kansas City chapter of the Public Relations Society of America (PRSA). Four Gold awards went to the NAIC’s WRECKCHECK app, the 2012 Annual Report, and “Senator to CEO: NAIC Transition,” which earned a perfect score under Reputation & Brand Management. The NAIC also won Silver PRISM awards for the 2012 PIO Forum; Insure U’s InsureThis? campaign; KidCast: WreckCheck Edition; the NAIC Daily News newsletters; the Amy Grant radio PSA; and the Amy Grant Consumer Education Partnership.
191

2013ANNUALREPORT
State-BasedInsurance Regulation:
THE SYSTEMAT WORK
192

193
National Association of Insurance Commissioners
Financial Report December 31, 2013
193

194
Contents
Independent Auditor’s Report 1 Financial Statements
Statements of Financial Position 2 Statements of Activities 3 Statements of Cash Flows 4
Notes to Financial Statements 5
194

195
Independent Auditor’s Report Honorable Members National Association of Insurance Commissioners Kansas City, Missouri
Report on the Financial Statements
We have audited the accompanying financial statements of the National Association of Insurance Commissioners (the NAIC), which comprise the statements of financial position as of December 31, 2013 and 2012, and the related statements of activities and cash flows for the years then ended, and the related notes to the financial statements.
Management’s Responsibility for the Financial Statements
Management is responsible for the preparation and fair presentation of these financial statements in accordance with accounting principles generally accepted in the United States of America; this includes the design, implementation, and maintenance of internal controls relevant to the preparation and fair presentation of financial statements that are free from material misstatement, whether due to fraud or error.
Auditor’s Responsibility
Our responsibility is to express an opinion on these financial statements based on our audits. We conducted our audits in accordance with auditing standards generally accepted in the United States of America. Those standards require that we plan and perform the audit to obtain reasonable assurance about whether the financial statements are free of material misstatement.
An audit involves performing procedures to obtain audit evidence about the amounts and disclosures in the financial statements. The procedures selected depend on the auditor’s judgment, including the assessment of the risks of material misstatement of the financial statements, whether due to fraud or error. In making those risk assessments, the auditor considers internal control relevant to the entity’s preparation and fair presentation of the financial statements in order to design audit procedures that are appropriate in the circumstances, but not for the purpose of expressing an opinion on the effectiveness of the entity’s internal control. Accordingly, we express no such opinion. An audit also includes evaluating the appropriateness of accounting policies used and the reasonableness of significant accounting estimates made by management, as well as evaluating the overall presentation of the financial statements.
We believe that the audit evidence we have obtained is sufficient and appropriate to provide a basis for our audit opinion.
Opinion
In our opinion, the financial statements referred to above present fairly, in all material respects, the financial position of the National Association of Insurance Commissioners as of December 31, 2013 and 2012, and the changes in its net assets and its cash flows for the years then ended, in conformity with accounting principles generally accepted in the United States of America.
Kansas City, Missouri February 21, 2014
195
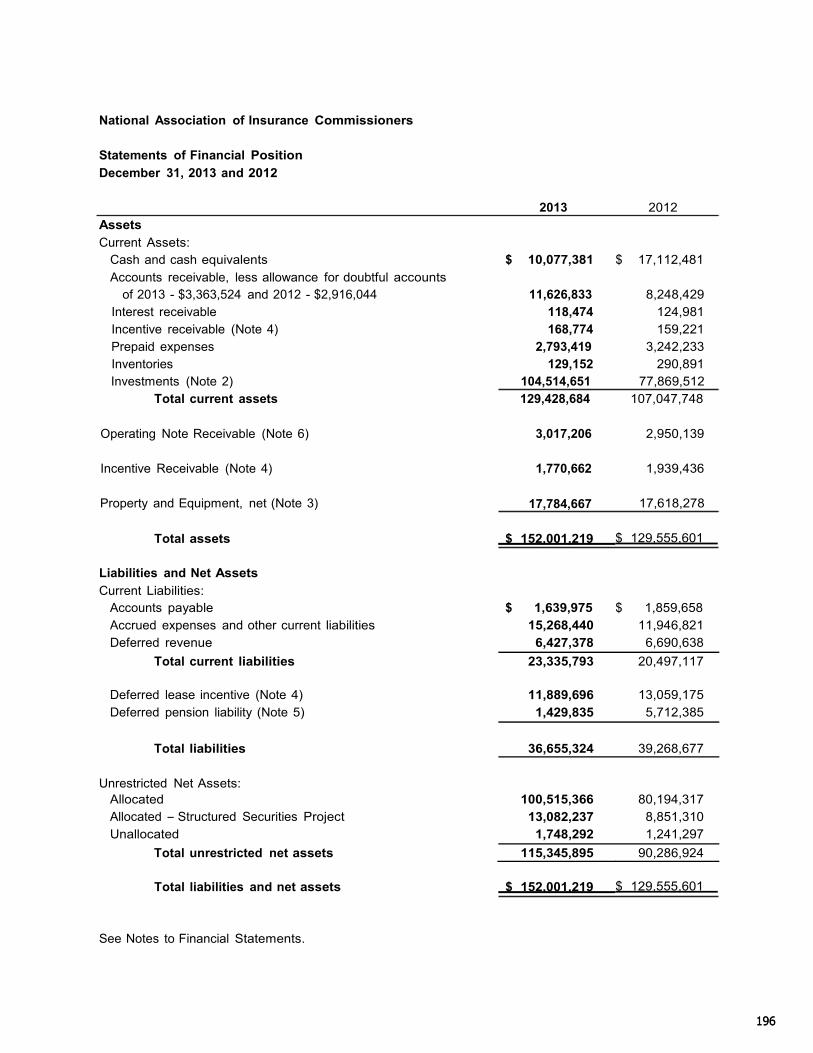
196
National Association of Insurance Commissioners
Statements of Financial Position
December 31, 2013 and 2012
Assets
Current Assets:
2013 2012
Cash and cash equivalents
Accounts receivable, less allowance for doubtful accounts $ 10,077,381 $ 17,112,481
of 2013 - $3,363,524 and 2012 - $2,916,044 11,626,833 8,248,429 Interest receivable 118,474 124,981 Incentive receivable (Note 4) 168,774 159,221 Prepaid expenses 2,793,419 3,242,233 Inventories 129,152 290,891 Investments (Note 2) 104,514,651 77,869,512
Total current assets 129,428,684 107,047,748
Operating Note Receivable (Note 6) 3,017,206 2,950,139
Incentive Receivable (Note 4) 1,770,662 1,939,436
Property and Equipment, net (Note 3) 17,784,667 17,618,278
Total assets $ 152,001,219 $ 129,555,601
Liabilities and Net Assets
Current Liabilities:
Accounts payable $ 1,639,975 $ 1,859,658 Accrued expenses and other current liabilities 15,268,440 11,946,821 Deferred revenue 6,427,378 6,690,638
Total current liabilities 23,335,793 20,497,117
Deferred lease incentive (Note 4) 11,889,696 13,059,175 Deferred pension liability (Note 5) 1,429,835 5,712,385
Total liabilities 36,655,324
39,268,677
Unrestricted Net Assets:
Allocated 100,515,366 80,194,317 Allocated – Structured Securities Project 13,082,237 8,851,310 Unallocated 1,748,292 1,241,297
Total unrestricted net assets 115,345,895 90,286,924
Total liabilities and net assets $ 152,001,219 $ 129,555,601
See Notes to Financial Statements.
196
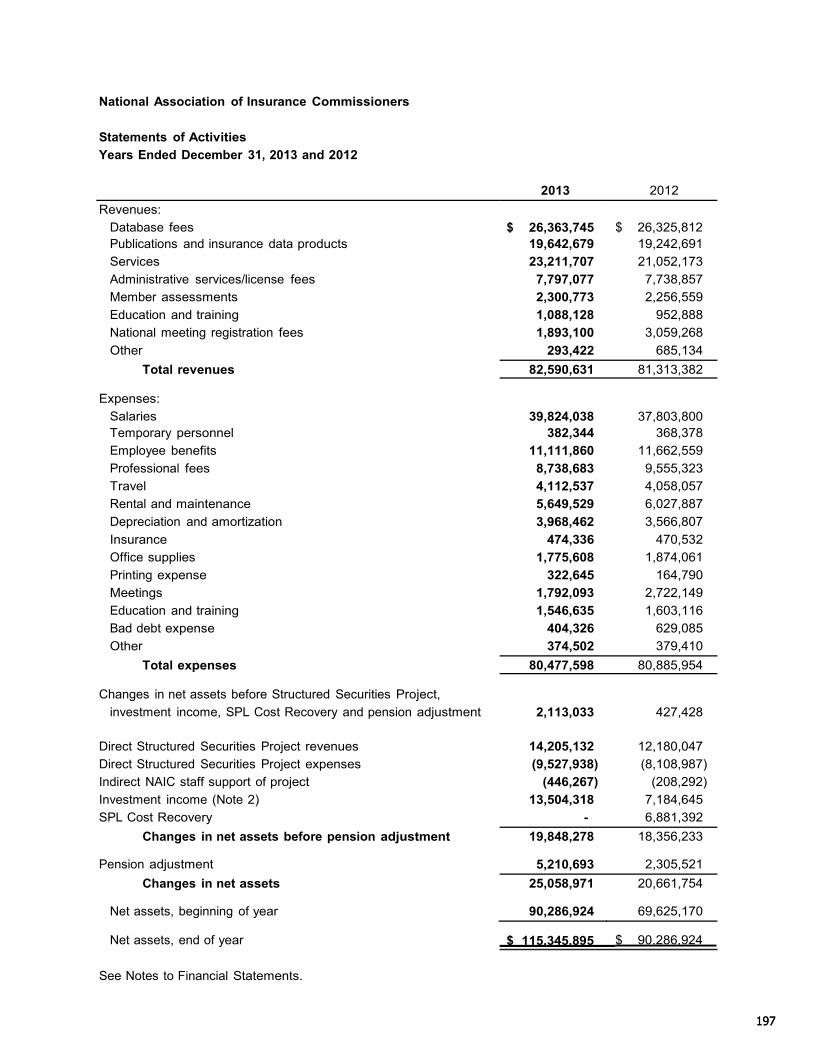
197
National Association of Insurance Commissioners
Statements of Activities
Years Ended December 31, 2013 and 2012
2013
2012
Revenues:
Database fees $ 26,363,745
$ 26,325,812 Publications and insurance data products 19,642,679 19,242,691
Services 23,211,707 21,052,173
Administrative services/license fees 7,797,077 7,738,857
Member assessments 2,300,773 2,256,559
Education and training 1,088,128 952,888
National meeting registration fees 1,893,100 3,059,268
Other 293,422 685,134
Total revenues 82,590,631 81,313,382 Expenses:
Salaries
39,824,038
37,803,800 Temporary personnel 382,344 368,378
Employee benefits 11,111,860 11,662,559
Professional fees 8,738,683 9,555,323
Travel 4,112,537 4,058,057
Rental and maintenance 5,649,529 6,027,887
Depreciation and amortization 3,968,462 3,566,807
Insurance 474,336 470,532
Office supplies 1,775,608 1,874,061
Printing expense 322,645 164,790
Meetings 1,792,093 2,722,149
Education and training 1,546,635 1,603,116
Bad debt expense 404,326 629,085
Other 374,502 379,410
Total expenses 80,477,598 80,885,954 Changes in net assets before Structured Securities Project,
investment income, SPL Cost Recovery and pension adjustment
2,113,033
427,428
Direct Structured Securities Project revenues 14,205,132
12,180,047
Direct Structured Securities Project expenses (9,527,938) (8,108,987)
Indirect NAIC staff support of project (446,267) (208,292)
Investment income (Note 2)
SPL Cost Recovery
13,504,318
-
7,184,645
6,881,392
Changes in net assets before pension adjustment 19,848,278 18,356,233
Pension adjustment 5,210,693
2,305,521
Changes in net assets 25,058,971 20,661,754
Net assets, beginning of year 90,286,924
69,625,170
Net assets, end of year $ 115,345,895 $ 90,286,924
See Notes to Financial Statements.
197

198
National Association of Insurance Commissioners
Statements of Cash Flows Years Ended December 31, 2013 and 2012
Cash Flows from Operating Activities:
2013 2012
Changes in net assets Adjustments to reconcile changes in net assets
to net cash flows from operating activities:
$ 25,058,971 $ 20,661,754
Interest income included in operating note receivable (67,067) (61,397) Depreciation and amortization 3,968,462 3,566,887 Net realized and unrealized (gains) on investments (10,473,490) (3,752,072) (Gain) loss on sale of property and equipment 6,530 (98,040)
Changes in operating assets and liabilities: Accounts receivable, net (3,378,404) 2,638,748 Incentive receivable 159,221 150,208 Interest receivable 6,507 (7,879) Prepaid expenses 448,814 (52,132) Inventories 161,739 (11,431) Accounts payable (219,683) 344,609 Accrued expenses and other current liabilities 3,321,619 2,154,207 Deferred revenue (263,260) 702,756 Deferred lease incentive (1,169,479) 2,812,426 Deferred pension liability (4,282,550) (4,326,836)
Net cash provided by operating activities 13,277,930 24,721,808
Cash Flows from Investing Activities:
Advances made on operating note receivable - (250,000) Purchase of property and equipment (4,158,907) (14,708,145) Proceeds from disposition of property and equipment - 9,794,642 Purchase of investments (40,267,655) (26,101,634) Proceeds from disposition of investments 24,113,532 18,527,349
Net cash (used in) investing activities (20,313,030) (12,737,788)
Net increase (decrease) in cash and cash equivalents (7,035,100) 11,984,020
Cash and Cash Equivalents:
Beginning of year 17,112,481 5,128,461 End of year $ 10,077,381 $ 17,112,481
See Notes to Financial Statements.
198
199
National Association of Insurance Commissioners
Notes to Financial Statements
Note 1. Nature of Operations and Summary of Significant Accounting Policies
Nature of operations: The National Association of Insurance Commissioners (the NAIC) is the U.S. standard-setting and regulatory support organization created and governed by the chief insurance regulators from the 50 states, the District of Columbia and five U.S. territories. Through the NAIC, state insurance regulators establish standards and best practices, conduct peer review, and coordinate their regulatory oversight. NAIC staff supports these efforts and represents the collective views of state regulators domestically and internationally. NAIC members, together with the central resources of the NAIC, form the national system of state-based insurance regulation in the U.S.
Cash and cash equivalents: The NAIC considers all liquid investments with original maturities of one year or less to be cash equivalents. At December 31, 2013 and 2012, cash equivalents consisted of money market funds and discount notes. The NAIC, at times, maintains deposits with banks in excess of the insured limits, but has not experienced any losses in such accounts.
Accounts receivable: Accounts receivable are stated at the amounts billed to customers. The NAIC provides an allowance for doubtful accounts, which is based upon a review of outstanding receivables, historical collection information and existing economic conditions. Past-due accounts are periodically reviewed by management. Delinquent and/or uncollectible receivables are written off based on individual credit evaluation and specific circumstances of the customer.
Inventory pricing: Inventories are stated at the lower of cost, determined by the first-in, first-out (FIFO) method, or market.
Investments: The NAIC carries its investments in marketable securities with readily determinable fair values, and all investments in debt securities, at their fair values determined by reference to public exchanges. The NAIC reports the fair value of alternative investments using the practical expedient. Unrealized gains and losses are included in the change in net assets in the accompanying financial statements.
Investments may be exposed to various risks, such as interest rate, market and credit risks. As a result, it is at least reasonably possible that changes in risks in the near term could affect investment balances, and those effects could be significant.
Financial instruments: Financial instruments consist of cash and cash equivalents, investments, accounts receivable, accounts payable, accrued expenses and deferred revenue. The carrying amounts reported in the statement of financial position for these financial instruments approximate fair value due to the short-term maturity of these instruments. The fair values of fixed income and equity investments are based on quoted market prices at the reporting date for those or similar investments. The fair values of alternative investments are reported using the practical expedient. The practical expedient allows for use of the net asset value (NAV), either as reported by the investee fund or as adjusted by the NAIC based on various factors.
199

200
National Association of Insurance Commissioners
Notes to Financial Statements
Note 1. Nature of Operations and Summary of Significant Accounting Policies (Continued)
Fair value measurements: Fair value is defined as the price that would be received to sell an asset or paid to transfer a liability in an orderly transaction between market participants at the measurement date in its principal market, or in the absence of a principal market, the most advantageous market for the investment or liability. The NAIC accounts for its investments at fair value. In accordance with the guidance, the NAIC has categorized its investments, based on the priority of the inputs to the valuation technique which gives the highest priority to unadjusted quoted prices in active markets for identical assets (Level 1 measurements) and the lowest priority to unobservable inputs (Level 3 measurements). The three levels of the fair value hierarchy are described below:
Level 1 – Quoted prices for identical instruments traded in active markets.
Level 2 – Quoted prices for similar instruments in active markets; quoted prices for identical or similar
instruments in inactive markets; or derived from inputs that are observable. Also included in Level 2 are investments measured using net asset value (NAV) per share, or its equivalent, that may be redeemed at NAV at or near the reporting date.
Level 3 – Primarily all Level 3 investments are valued using the practical expedient and include those
investments that cannot be redeemed at NAV at or near the reporting date, or for which redemption at NAV is uncertain due to lock-up periods or other investment restrictions.
Investments and concentrations of credit risk: Financial instruments that potentially subject the NAIC to significant concentrations of credit risk consist principally of cash and investments. The NAIC maintains deposits in financial institutions in excess of federally insured limits. Management monitors the soundness of these financial institutions and believes the NAIC’s risk is negligible.
Alternative investments are redeemable with the fund at net asset value under the original terms of the partnership and/or subscription agreements. However, it is possible that these redemption rights may be restricted or eliminated by the funds in the future, in accordance with the fund agreements. Due to the nature of the investments held by the funds, changes in market conditions and the economic environment may significantly impact the net asset value of the funds and, consequently, the fair value of the NAIC’s interests in the funds. Although a secondary market exists for these investments, it is not active and individual transactions are typically not observable. When transactions do occur in this limited secondary market, they may occur at discounts to the reported net asset value. It is, therefore, reasonably possible that, if the NAIC were to sell these investments in the secondary market, a buyer may require a discount to the reported net asset value, and the discount could be significant.
Property, plant and equipment: Property and equipment are stated at cost. Depreciation is computed using the straight-line method over the estimated useful life of each asset. Leasehold improvements are depreciated over the shorter of the lease term or their respective estimated useful lives.
200
201
National Association of Insurance Commissioners
Notes to Financial Statements
Note 1. Nature of Operations and Summary of Significant Accounting Policies (Continued)
The cost of internally developed software is expensed until the technological feasibility of the software has been established. Thereafter, all software development costs are capitalized until such time as the product is available for general release to customers. The development costs of enhancements that extend the life or improve the marketability of the original product are capitalized. The establishment of technological feasibility and the ongoing assessment of recoverability of capitalized software development costs require considerable judgment by management with respect to certain external factors, including, but not limited to, anticipated future revenues, estimated economic life and changes in software and hardware technologies. The cost of capitalized software is amortized on the straight-line method over the products' estimated useful lives.
Estimated
Useful Lives Furniture and equipment 5 - 12 years Computer and related equipment 3 years Computer software 3 - 10 years Leasehold improvements 12 years
Uses of estimates: The preparation of financial statements in conformity with U.S. generally accepted accounting principles requires management to make estimates and assumptions that affect the reported amounts of assets and liabilities and disclosure of contingent assets and liabilities at the date of the financial statements, and the reported amounts of revenues and expenses during the reporting period. Actual results could differ from those estimates.
Basis of accounting for revenues: Revenue is recognized as follows:
• Database fee revenue is recognized upon the filing of insurance companies' annual statements.
• Publications and insurance data products revenue is recognized when the product is shipped to the customer.
• Services revenue is recognized when the service has been performed.
• License fees consist of revenue earned from a related party for the use of the NAIC’s producer data. Administrative services consist of revenues earned from related parties for administrative services and the use of the NAIC’s facilities and equipment. Revenue from administrative services/license fees is recognized as revenue when the services are performed and when the use of the NAIC’s assets occurs, in accordance with the terms contained in written agreements in effect with related parties.
• Revenue from fees for member assessments apply to an assessment fiscal year ended April 30, and are recorded in the calendar year assessed as receivables and deferred revenue. At December 31 of each year, 1/3 of the assessments are accounted for as deferred revenue.
Income taxes: The NAIC has been granted exemption from income taxes by the Internal Revenue Service under the provisions of Section 501(c)(3) of the Internal Revenue Code and a similar provision of state law. However, the NAIC is subject to federal income tax on any unrelated business taxable income.
201
202
National Association of Insurance Commissioners
Notes to Financial Statements
Note 1. Nature of Operations and Summary of Significant Accounting Policies (Continued)
Uncertain tax positions, if any, are recorded in accordance with FASB ASC 740, Income Taxes. FASB ASC 740 requires the recognition of a liability for tax positions taken that do not meet the more-likely- than-not standard that the position will be sustained upon examination by the taxing authorities. There is no liability for uncertain tax positions recorded at December 31, 2013 or 2012.
Net assets: The NAIC operating reserve is based on a liquid reserve, defined as total net assets, less net property and equipment, as a percentage of the future year’s budgeted operating expenses. On September 22, 2011, following a comprehensive review by an outside consultant to reflect the NAIC’s current operating environment, the NAIC adopted a target liquid reserve range of 80% to 91%. Net assets are allocated by the Executive (EX) Committee and Internal Administration (EX1) Subcommittee as a function of the budgeting process. As of December 31, 2013 and 2012, net assets were fully allocated, with the exception of an amount maintained as unallocated equal to 1.5% of the next year's projected net assets. The unallocated balance will be used to fund priority initiatives that may arise in the next year.
As of December 31, 2013 and 2012, the amount of direct revenues in excess of direct and indirect expenses arising from the NAIC's Structured Securities project, which includes residential mortgage backed securities and commercial mortgage backed securities, has been allocated for anticipated future work in the area of structured securities and related regulatory services during 2013 and future years. Given the ongoing nature of this activity, the net assets of this project will be combined with the NAIC’s net assets on January 1, 2014.
Pension plan: The Compensation-Retirement Benefits topic of the FASB ASC requires employers to recognize on their statements of financial position a liability and/or an asset equal to the under-funded or over-funded status of their defined benefit pension and other postretirement benefit plans. The funded status that the NAIC has reported on the statements of financial position under the topic is measured as the difference between the fair value of plan assets and the benefit obligation. The topic also requires that for each under-funded plan, an amount equal to the present value of the next 12 months' expected benefit payments in excess of the fair value of the plan's assets be classified as a current liability. The remainder is classified as a non-current liability.
Functional expenses: The Not-for-Profit Entities topic of the FASB ASC requires not-for-profit organizations to disclose expenses by functional classification. The NAIC presents expenses only by their natural classification in the December 31, 2013 and 2012 statements of activities. Management believes that disclosing expenses by function is insignificant to the financial statements taken as a whole, and therefore does not apply the provision of the topic as it relates to the disclosure of expenses by functional classification.
202

203
National Association of Insurance Commissioners
Notes to Financial Statements
Note 2. Investments and Investment Income
2013 2012
Cost
Fair
Value Cost
Fair
Value
Government bonds $ 3,793,154 $ 3,887,247 $ 3,233,175 $ 3,422,318 Treasury inflation protected bonds 3,550,997 3,628,588 3,077,052 3,417,862
Corporate bonds 11,030,830 10,821,367 8,816,575 8,744,454
Fixed income mutual funds 18,176,521 18,524,162 14,944,787 15,901,567
Foreign fixed income funds 5,809,976 5,478,455 4,400,563 4,348,119
International bonds
Common stock:
491,957 493,930 491,957 506,355
Industrials 2,433,922 3,817,014 1,812,758 2,362,362
Consumer discretionary 1,669,227 4,237,783 1,879,643 3,607,121
Financials 3,236,080 4,547,921 3,027,305 3,720,020
Information technology 4,722,747 6,748,983 4,213,729 4,966,797
Other Industries 12,285,122 19,066,658 5,718,239 8,293,423
Foreign common stock 1,130,843 1,980,656 1,305,478 1,659,179
American depository receipts 583,544 1,036,336 1,516,328 2,066,481
Foreign equity mutual funds 5,989,121 7,191,383 4,434,395 4,868,782
Master limited partnerships 4,650,670 6,318,727 4,695,369 4,759,911
Alternative equity funds 6,065,000 6,735,441 5,065,000 5,224,761
$ 85,619,711 $ 104,514,651 $ 68,632,353 $ 77,869,512
Total investment income (loss) comprises the following:
2013 2012
Interest and dividend income $ 3,030,828 $ 3,432,573 Net realized gains 805,504 854,424 Net unrealized gains (losses) 9,667,986 2,897,648
$ 13,504,318 $ 7,184,645
203
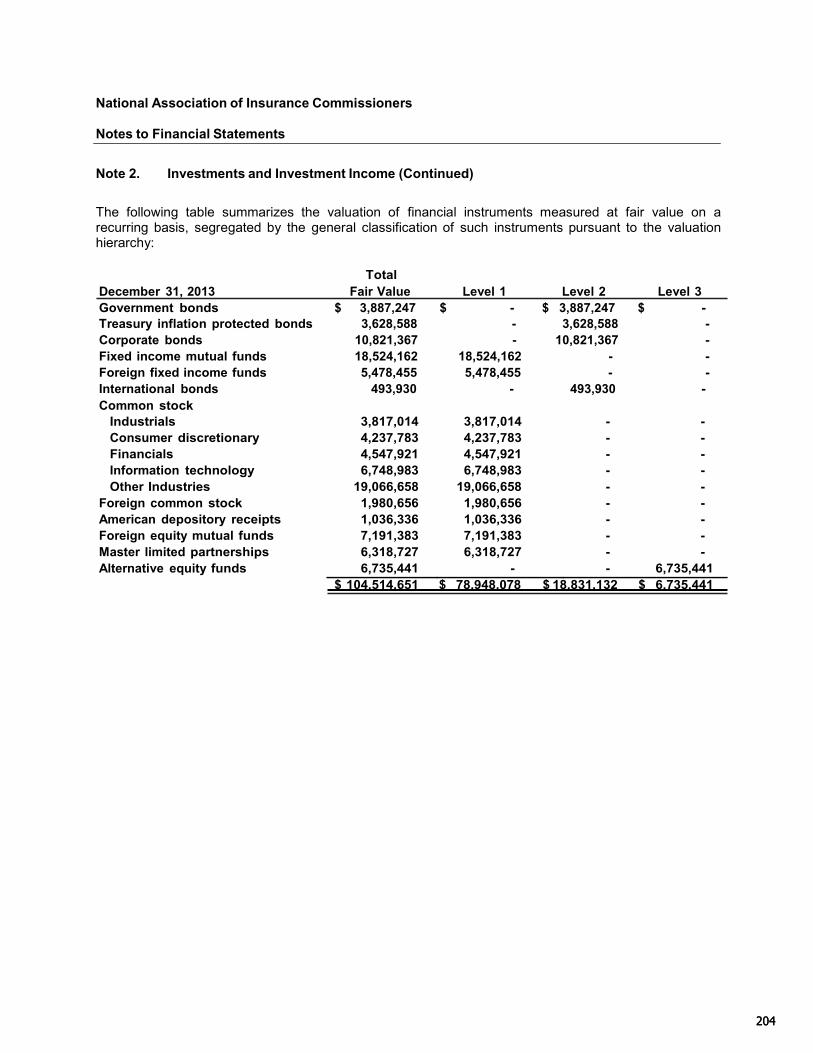
204
National Association of Insurance Commissioners
Notes to Financial Statements
Note 2. Investments and Investment Income (Continued)
The following table summarizes the valuation of financial instruments measured at fair value on a recurring basis, segregated by the general classification of such instruments pursuant to the valuation hierarchy:
Total
December 31, 2013 Fair Value Level 1 Level 2 Level 3 Government bonds $ 3,887,247 $ - $ 3,887,247 $ - Treasury inflation protected bonds 3,628,588 - 3,628,588 - Corporate bonds 10,821,367 - 10,821,367 - Fixed income mutual funds 18,524,162 18,524,162 - - Foreign fixed income funds 5,478,455 5,478,455 - - International bonds 493,930 - 493,930 - Common stock
Industrials 3,817,014 3,817,014 - - Consumer discretionary 4,237,783 4,237,783 - - Financials 4,547,921 4,547,921 - - Information technology 6,748,983 6,748,983 - - Other Industries 19,066,658 19,066,658 - -
Foreign common stock 1,980,656 1,980,656 - - American depository receipts 1,036,336 1,036,336 - - Foreign equity mutual funds 7,191,383 7,191,383 - - Master limited partnerships 6,318,727 6,318,727 - - Alternative equity funds 6,735,441 - - 6,735,441
$ 104,514,651 $ 78,948,078 $ 18,831,132 $ 6,735,441
204
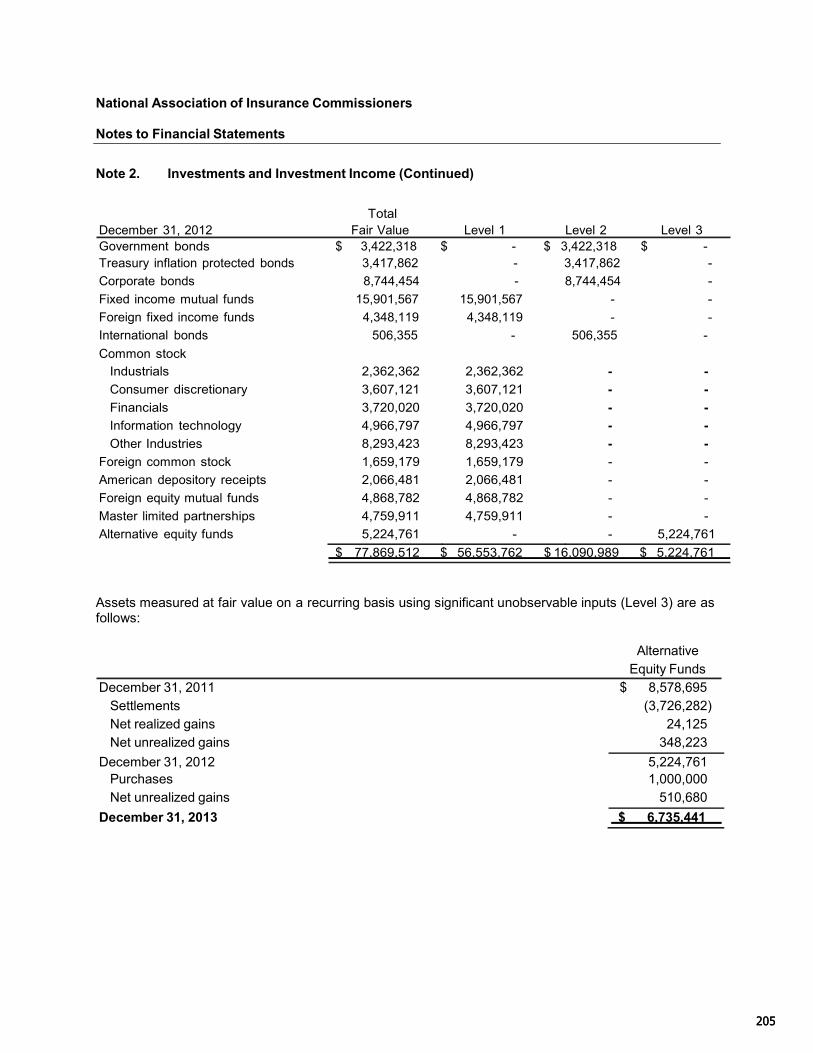
205
National Association of Insurance Commissioners
Notes to Financial Statements
Note 2. Investments and Investment Income (Continued)
Total December 31, 2012 Fair Value Level 1 Level 2 Level 3 Government bonds $ 3,422,318 $ - $ 3,422,318 $ - Treasury inflation protected bonds 3,417,862 - 3,417,862 -
Corporate bonds 8,744,454 - 8,744,454 -
Fixed income mutual funds 15,901,567 15,901,567 - -
Foreign fixed income funds 4,348,119 4,348,119 - -
International bonds 506,355 - 506,355 -
Common stock
Industrials 2,362,362 2,362,362 - -
Consumer discretionary 3,607,121 3,607,121 - -
Financials 3,720,020 3,720,020 - -
Information technology 4,966,797 4,966,797 - -
Other Industries 8,293,423 8,293,423 - -
Foreign common stock 1,659,179 1,659,179 - -
American depository receipts 2,066,481 2,066,481 - -
Foreign equity mutual funds 4,868,782 4,868,782 - -
Master limited partnerships 4,759,911 4,759,911 - -
Alternative equity funds 5,224,761 - - 5,224,761
$ 77,869,512 $ 56,553,762 $ 16,090,989 $ 5,224,761
Assets measured at fair value on a recurring basis using significant unobservable inputs (Level 3) are as follows:
December 31, 2011
Alternative Equity Funds
$ 8,578,695 Settlements (3,726,282) Net realized gains 24,125 Net unrealized gains 348,223
December 31, 2012 5,224,761 Purchases 1,000,000 Net unrealized gains 510,680
December 31, 2013 $ 6,735,441
205

206
National Association of Insurance Commissioners
Notes to Financial Statements
Note 2. Investments and Investment Income (Continued)
Total gains (losses), net, included in earnings attributable
to the change in unrealized gains (losses), net, relating to
Alternative Equity Funds
2013 2012
financial instruments still held $ 670,441 $ 159,761
The following tables set forth additional disclosure of the NAIC’s investments whose fair value is estimated using net asset value (NAV) per share (or its equivalent) as of December 31, 2013 and 2012:
Fair Value
Investment December 31, 2013
Unfunded
Commitment
Redemption
Frequency
Redemption
Notice Period
Alternative equity funds (A) $ 6,735,441 $ - Quarterly 95 days
Investment
Fair Value
December 31, 2012
Unfunded
Commitment
Redemption
Frequency
Redemption
Notice Period Alternative equity funds (A) $ 5,224,761 $ - Quarterly 95 days
(A) This fund aims to generate consistent absolute returns by investing in assets with a diversified group of investment managers through managed account structures (“Managed Account Structures”) or in the private investment funds sponsored by investment managers (collectively, “Hedge Fund Managers” or “Hedge Funds”).
Note 3. Property and Equipment
Property and equipment at December 31 consisted of the following:
2013 2012
Furniture and equipment $ 4,427,273 $ 4,263,048 Computer and related equipment 13,756,669 13,533,508 Computer software 23,027,388 21,113,898 Leasehold improvements 13,917,500 13,328,367
55,128,830 52,238,821 Less accumulated depreciation and amortization 37,344,164 34,620,543
$ 17,784,666 $ 17,618,278
206

207
National Association of Insurance Commissioners
Notes to Financial Statements
Note 4. Operating Leases
The NAIC leases its office space in Kansas City, New York, and Washington D.C. under noncancellable operating leases. Certain parts of the agreements contain escalation clauses providing increased rentals based on maintenance, utility and tax increases. The NAIC also leases certain office equipment under noncancellable operating leases, which expire at various dates through 2014. The accompanying financial statements reflect rent expense on the straight-line method over the terms of the leases. Total rental expenses under all leases for the years ended December 31, 2013 and 2012 were $2,128,464 and $2,452,054, respectively.
The Kansas City office space lease includes various lease incentives, free rent and scheduled rent increases. The lessor agreed to pay the NAIC base rental differential payments totaling $2,390,571 plus 6% interest over the course of the initial lease term. Annual payments of $285,140 are being made to the NAIC through fiscal year 2022. The outstanding non-current principal balance of this receivable is reported as an Incentive Receivable on the statement of financial position and had a balance of $1,770,662 and $1,939,436 as of December 31, 2013 and 2012, respectively. This outstanding receivable is being recognized in the statement of activities on a straight-line basis over the life of the lease and is included in the deferred lease incentive described below.
Deferred lease incentives consist primarily of reimbursements for leasehold improvements, parking costs and moving costs. U.S. generally accepted accounting principles require that the above items be recognized as a reduction of rental expense over the term of the lease. The unamortized balance in deferred lease incentive was $11,889,696 and $13,059,175 as of December 31, 2013 and 2012, respectively.
Future minimum lease payments at December 31, 2013 are as follows: Year Ending December 31,
2014 $ 2,911,370 2015 2,681,352
2016 2,686,202
2017 2,655,239
2018 2,674,144
Thereafter 15,261,056
Total future minimum lease payments $ 28,869,363
Note 5. Employee Retirement Plans
The NAIC has a noncontributory defined benefit plan (Plan A) covering all employees with a hire date prior to January 1, 2000. The benefits are based on years of service and the employee's compensation for the five consecutive years of the ten latest years of employment that give the highest average.
207
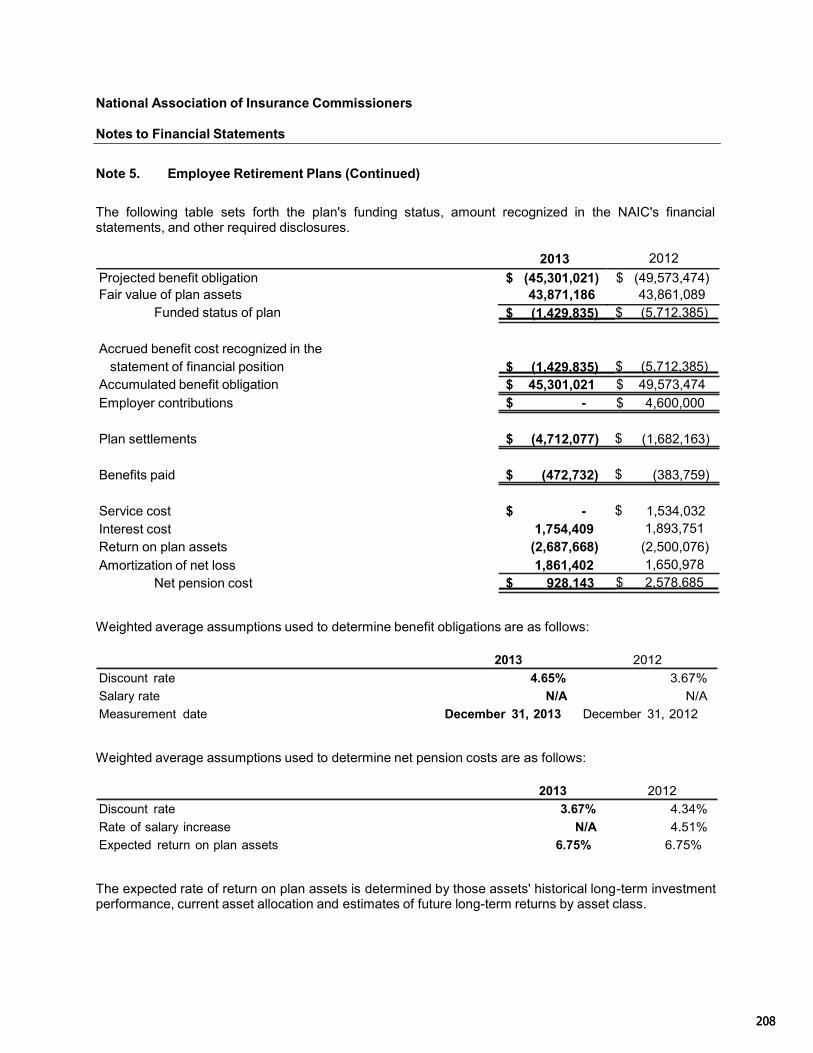
208
National Association of Insurance Commissioners
Notes to Financial Statements
Note 5. Employee Retirement Plans (Continued)
The following table sets forth the plan's funding status, amount recognized in the NAIC's financial statements, and other required disclosures.
2013 2012
Projected benefit obligation $ (45,301,021) $ (49,573,474) Fair value of plan assets 43,871,186 43,861,089
Funded status of plan $ (1,429,835) $ (5,712,385)
Accrued benefit cost recognized in the statement of financial position
$ (1,429,835) $ (5,712,385)
Accumulated benefit obligation Employer contributions
$ 45,301,021 $ -
$ 49,573,474 $ 4,600,000
Plan settlements $ (4,712,077) $ (1,682,163)
Benefits paid $ (472,732) $ (383,759)
Service cost $ - $ 1,534,032
Interest cost 1,754,409 1,893,751 Return on plan assets (2,687,668) (2,500,076) Amortization of net loss 1,861,402 1,650,978
Net pension cost $ 928,143 $ 2,578,685
Weighted average assumptions used to determine benefit obligations are as follows:
2013 2012
Discount rate 4.65% 3.67%
Salary rate N/A N/A
Measurement date December 31, 2013 December 31, 2012
Weighted average assumptions used to determine net pension costs are as follows:
2013 2012
Discount rate 3.67% 4.34%
Rate of salary increase N/A 4.51%
Expected return on plan assets 6.75% 6.75%
The expected rate of return on plan assets is determined by those assets' historical long-term investment performance, current asset allocation and estimates of future long-term returns by asset class.
208

209
National Association of Insurance Commissioners
Notes to Financial Statements
Note 5. Employee Retirement Plans (Continued)
The following is the plan's weighted average asset allocation by asset category as of December 31, 2013 and 2012 (the measurement date of the plan assets):
2013 2012
Equity securities 52.31% 52.55% Debt securities 47.69% 47.45%
Plan assets are held by an insurance company, which invests the plan assets in accordance with the provisions of the plan agreement. The plan agreement permits investment in common stocks, corporate bonds, U.S. Government securities and other specified investments, based on certain target allocation percentages. Asset allocation is primarily based on a strategy to provide stable earnings while still permitting the plan to recognize potentially higher returns through a limited investment in equity securities. Plan assets are rebalanced as necessary based upon the minimum and maximum restrictions set forth in the plan's investment policy statement. Plan assets are valued using Level 1 inputs and are based on unadjusted quoted market prices within active markets.
The benefits expected to be paid to participants over the next 10 years which reflect expected future services as appropriate, as of December 31, 2013 are as follows:
Year Ending December 31, 2014 $ 3,586,166 2015 3,046,424
2016 2,653,258
2017 2,704,816
2018 3,020,110
2019-2023 16,466,061
Total $ 31,476,835
While there is no obligation to contribute to Plan A, the NAIC is considering a contribution of approximately $1.4 million in 2014. The annual amount is actuarially calculated by the NAIC's independent consultant firm and represents the amount necessary to fully fund the actuarial accrued liability and normal cost of the plan.
The NAIC provides a defined contribution 401(a) plan (Plan B) that covers substantially all employees with one year or more of service. Each year, the Executive (EX) Committee and Internal Administration (EX1) Subcommittee determine the contribution for the next year. The NAIC matched up to 3.5% of compensation of employees who contributed to Plan B and contributed 2% of all employees' compensation in 2012 and 3% in 2013. The pension expense related to Plan B for the years ended December 31, 2013 and 2012 was $2,128,193 and $1,704,492, respectively.
209
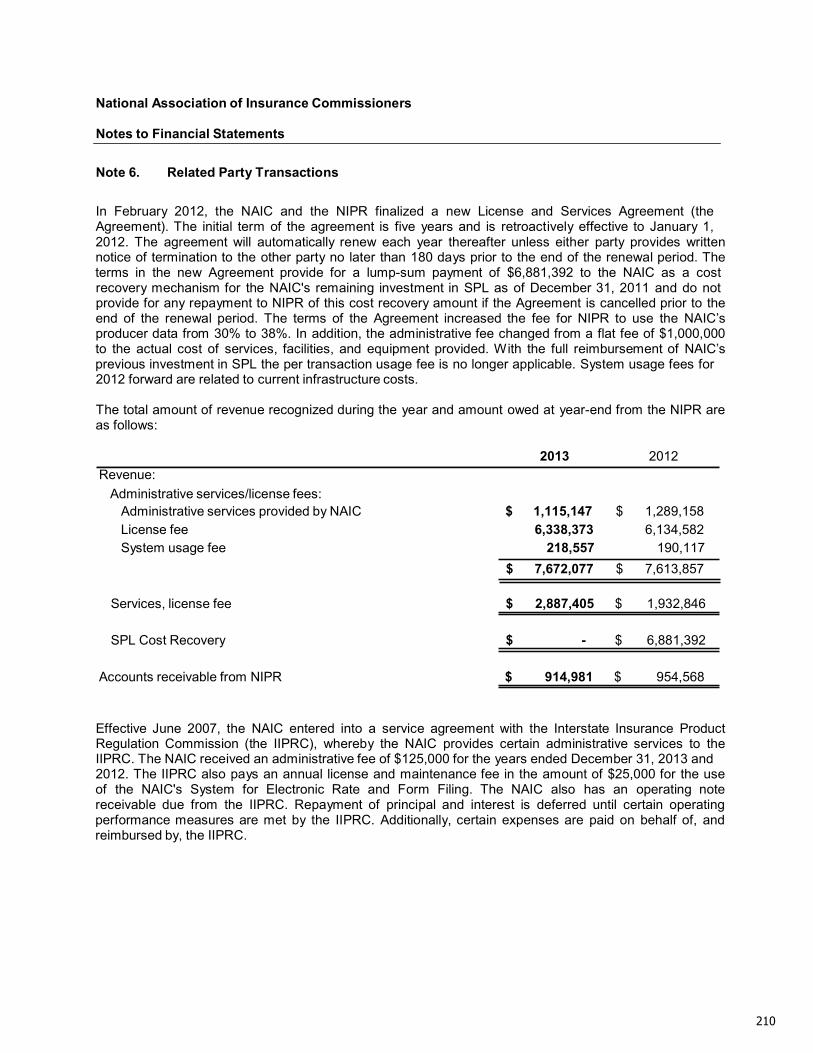
National Association of Insurance Commissioners
Notes to Financial Statements
210
Note 6. Related Party Transactions
In February 2012, the NAIC and the NIPR finalized a new License and Services Agreement (the Agreement). The initial term of the agreement is five years and is retroactively effective to January 1, 2012. The agreement will automatically renew each year thereafter unless either party provides written notice of termination to the other party no later than 180 days prior to the end of the renewal period. The terms in the new Agreement provide for a lump-sum payment of $6,881,392 to the NAIC as a cost recovery mechanism for the NAIC's remaining investment in SPL as of December 31, 2011 and do not provide for any repayment to NIPR of this cost recovery amount if the Agreement is cancelled prior to the end of the renewal period. The terms of the Agreement increased the fee for NIPR to use the NAIC’s producer data from 30% to 38%. In addition, the administrative fee changed from a flat fee of $1,000,000 to the actual cost of services, facilities, and equipment provided. With the full reimbursement of NAIC’s previous investment in SPL the per transaction usage fee is no longer applicable. System usage fees for 2012 forward are related to current infrastructure costs.
The total amount of revenue recognized during the year and amount owed at year-end from the NIPR are as follows:
Revenue:
Administrative services/license fees:
2013 2012
Administrative services provided by NAIC $ 1,115,147 $ 1,289,158 License fee 6,338,373 6,134,582 System usage fee 218,557 190,117
$ 7,672,077 $ 7,613,857
Services, license fee $ 2,887,405 $ 1,932,846
SPL Cost Recovery $ - $ 6,881,392
Accounts receivable from NIPR $ 914,981 $ 954,568
Effective June 2007, the NAIC entered into a service agreement with the Interstate Insurance Product Regulation Commission (the IIPRC), whereby the NAIC provides certain administrative services to the IIPRC. The NAIC received an administrative fee of $125,000 for the years ended December 31, 2013 and 2012. The IIPRC also pays an annual license and maintenance fee in the amount of $25,000 for the use of the NAIC's System for Electronic Rate and Form Filing. The NAIC also has an operating note receivable due from the IIPRC. Repayment of principal and interest is deferred until certain operating performance measures are met by the IIPRC. Additionally, certain expenses are paid on behalf of, and reimbursed by, the IIPRC.
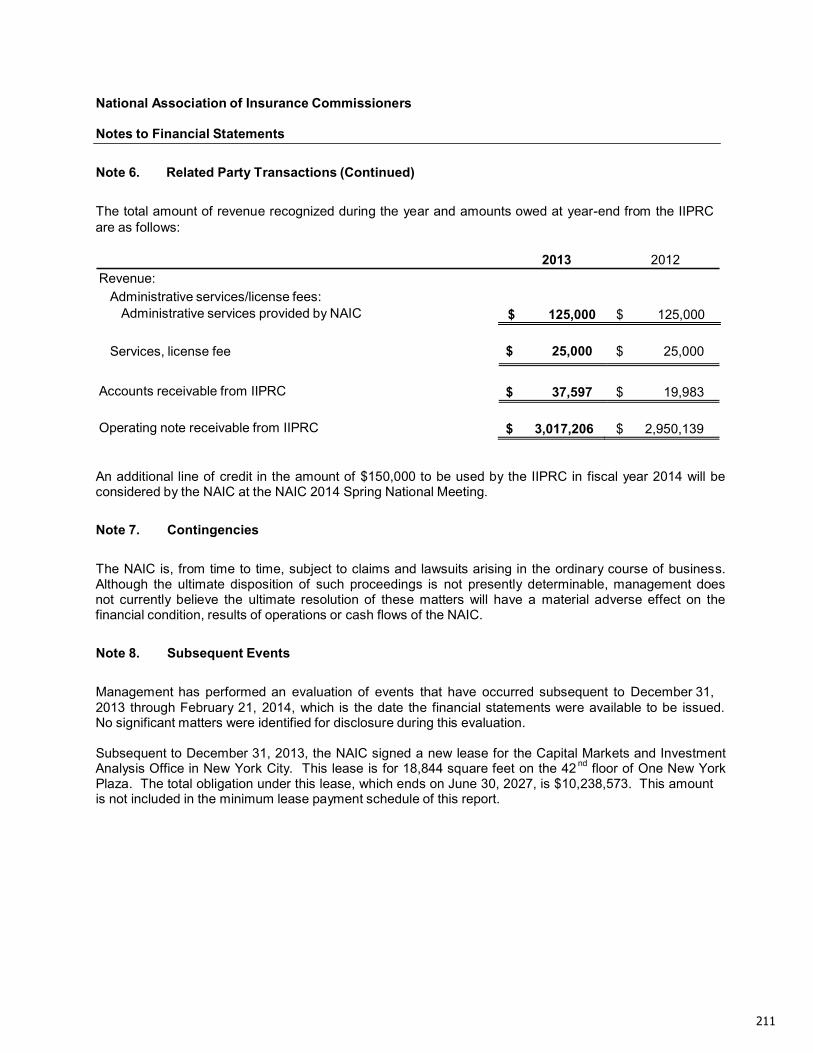
National Association of Insurance Commissioners
Notes to Financial Statements
211
Note 6. Related Party Transactions (Continued)
The total amount of revenue recognized during the year and amounts owed at year-end from the IIPRC are as follows:
Revenue:
Administrative services/license fees: Administrative services provided by NAIC
2013 2012 $ 125,000 $ 125,000
Services, license fee
$ 25,000
$ 25,000
Accounts receivable from IIPRC
$ 37,597
$ 19,983
Operating note receivable from IIPRC
$ 3,017,206
$ 2,950,139
An additional line of credit in the amount of $150,000 to be used by the IIPRC in fiscal year 2014 will be considered by the NAIC at the NAIC 2014 Spring National Meeting.
Note 7. Contingencies
The NAIC is, from time to time, subject to claims and lawsuits arising in the ordinary course of business. Although the ultimate disposition of such proceedings is not presently determinable, management does not currently believe the ultimate resolution of these matters will have a material adverse effect on the financial condition, results of operations or cash flows of the NAIC.
Note 8. Subsequent Events
Management has performed an evaluation of events that have occurred subsequent to December 31, 2013 through February 21, 2014, which is the date the financial statements were available to be issued. No significant matters were identified for disclosure during this evaluation.
Subsequent to December 31, 2013, the NAIC signed a new lease for the Capital Markets and Investment Analysis Office in New York City. This lease is for 18,844 square feet on the 42 nd floor of One New York Plaza. The total obligation under this lease, which ends on June 30, 2027, is $10,238,573. This amount is not included in the minimum lease payment schedule of this report.

212
212