TABLE OF CONTENTS Mule Deer Page Numbers Elk · 2016-08-04 · white-tailed deer 149 8 Sep. 15 Nov....
200
- 1 - TABLE OF CONTENTS Mule Deer Page Numbers Targhee (MD 101) – Areas 149……..……..……...…..……..………................1 Wyoming Range (MD 131) – Areas 134, 135,143-145……………....9 Elk Targhee (E 101) – Areas 73…..………………………………….…..43 Jackson (E 102) – Areas 70-72, 74-83.………………………………51 Fall Creek (E 103) – Areas 84, 85…….……………………………...95 Afton (E 105) – Areas 88-91….……………………………………..107 Moose Targhee (M 101) – Areas 16, 37……….…………………………….117 Jackson (M103) – Areas 7,14,15,17-19,28,32……………………….127 Bighorn Sheep Targhee (BHS 106) – Area 6……….……………………………… 139 Jackson (BHS 107) – Area 7………………………………………...149 Mountain Goat Palisades (MG 102) – Area 2……………………………………….171 Bison Jackson (B102) – Area 2……………………………………………191
Transcript of TABLE OF CONTENTS Mule Deer Page Numbers Elk · 2016-08-04 · white-tailed deer 149 8 Sep. 15 Nov....

- 1 -
TABLE OF CONTENTS
Mule Deer Page Numbers Targhee
(MD 101) – Areas 149……..……..……...…..……..………................1
Wyoming Range (MD 131) – Areas 134, 135,143-145……………....9
Elk
Targhee (E 101) – Areas 73…..………………………………….…..43 Jackson (E 102) – Areas 70-72, 74-83.………………………………51 Fall Creek (E 103) – Areas 84, 85…….……………………………...95 Afton (E 105) – Areas 88-91….……………………………………..107
Moose
Targhee (M 101) – Areas 16, 37……….…………………………….117 Jackson (M103) – Areas 7,14,15,17-19,28,32……………………….127
Bighorn Sheep
Targhee (BHS 106) – Area 6……….……………………………… 139 Jackson (BHS 107) – Area 7………………………………………...149
Mountain Goat
Palisades (MG 102) – Area 2……………………………………….171
Bison
Jackson (B102) – Area 2……………………………………………191


2015 - JCR Evaluation Form
SPECIES: Mule Deer PERIOD: 6/1/2015 - 5/31/2016
HERD: MD101 - TARGHEE
HUNT AREAS: 149 PREPARED BY: ALYSON COURTEMANCH
2010 - 2014 Average 2015 2016 Proposed
Hunter Satisfaction Percent 40% 40% 60%
Landowner Satisfaction Percent N/A N/A N/A
Harvest: 15 24 30
Hunters: 85 95 100
Hunter Success: 18% 25% 30 %
Active Licenses: 85 95 100
Active License Success: 18% 25% 30 % Recreation Days: 490 329 350
Days Per Animal: 32.7 13.7 11.7
Males per 100 Females: 0 0
Juveniles per 100 Females 0 0
Satisfaction Based Objective 60%
Management Strategy: Recreational
Percent population is above (+) or (-) objective: N/A%
Number of years population has been + or - objective in recent trend: 0
1

2

3

2016 HUNTING SEASONS TARGHEE MULE DEER HERD (MD101)
Special Archery Seasons
Season Dates Hunt Area Opens Closes
149 Sep. 1 Sep. 14
Hunt Area Type Season Dates Quota License Limitations Opens Closes 149 Sep. 15 Oct. 7 General Antlered mule deer or any
white-tailed deer 149 8 Sep. 15 Nov. 30 50 Limited
quota Doe or fawn white-tailed deer
Management Evaluation
Management Strategy: Recreational
Population Objective Type: Hunter Satisfaction
Primary Objective: Achieve a 3-year average of ≥ 60% of hunters indicating they are “satisfied” or “very satisfied” on the harvest survey.
Secondary Objective: Achieve a 3-year average of ≥ 15% harvest success.
The Wyoming Game and Fish Department (WGFD) proposed changing the objective for the Targhee Mule Deer Herd from a postseason population objective to a hunter satisfaction objective in 2014. The objective change was needed because the herd is rarely surveyed due to budget priorities elsewhere and spreadsheet models do not appear to adequately simulate observed population trends. In addition, the interstate nature of the herd poses additional challenges to population surveys and management. A hunter satisfaction objective was adopted in 2014 after public review, and included a primary and secondary objective (listed above). The region did not adopt a landowner satisfaction objective because the majority of the herd unit is located on public lands.
In 2015, 44% of hunters indicated they were “satisfied” or “very satisfied” with hunting in the Targhee Mule Deer Herd (n=27 respondents). The average satisfaction for the past 3 years is
4

42% (Fig. 1). Therefore, the herd is currently below its primary objective of ≥ 60% hunter satisfaction.
In 2015, 25% of hunters were successful in the Targhee Mule Deer Herd (Fig. 2). The 3-year average of hunter success is 21%. Therefore, the herd is meeting the secondary objective of an average of ≥ 15% harvest success over 3 years.
0.0
10.0
20.0
30.0
40.0
50.0
60.0
70.0
2010-2012 2013-2015
Perc
ent
Percent Hunter Satisfaction
Fig. 1. Percent of hunters indicating they are “satisfied” or “very satisfied” with hunting in the Targhee Mule Deer Herd on WGFD’s annual harvest survey, 2010-2015. Dashed line indicates the objective of ≥ 60%.
Fig. 2. Harvest success rates in the Targhee Mule Deer Herd for 2010-2015. Dashed line indicates the objective of ≥ 15% harvest success.
32.7% 42.0%
5

Herd Unit Issues
Post-season classification surveys are not flown in this herd due to budget constraints. However, mule deer were opportunistically recorded during an aerial survey of the Targhee bighorn sheep herd in March 2015. Fifteen mule deer were observed. Many of the historical winter ranges for the Targhee Herd have been converted to agriculture and residential development in Idaho. Winter ranges that remain are primarily low elevation mountain shrub and aspen communities in Wyoming and riparian areas in Idaho along the Teton River. Many of the mountain shrub and aspen communities along the state line are old and decadent and are being encroached by conifers. More restrictive hunting seasons have been implemented to allow this population to increase and increase hunter success. Beginning in 2015, a Type 8 doe/fawn white-tailed deer license was added to the hunt area due to several private landowners expressing interest in controlling white-tailed deer numbers.
Weather
Spring and summer 2015 produced consistent moisture, leading to good forage production. Fall was relatively mild with no significant snowfall until mid-December. By early February, low elevation slopes were beginning to melt out. At the time of the mid-winter survey, winter precipitation was reported at 91% of normal in the Snake River Basin. Please refer to the following web sites for specific weather station data. http://www.wrds.uwyo.edu/wrds/nrcs/snowprec/snowprec.html and http://www.ncdc.noaa.gov/oa/climate/research/prelim/drought/pdiimage.html
Habitat
There are several historical vegetation transects in mule deer winter ranges, but they have not been monitored in the past 5 years. Several habitat improvement projects are being planned in this herd unit, including the Hill Creek Prescribed Burn, which is scheduled for completion in 2016. In addition, a habitat treatment in Teton Canyon is currently in the planning stages to improve mountain shrub and aspen communities for mule deer. The WGFD is assisting Caribou-Targhee National Forest (CTNF) with vegetation monitoring in aspen stands pre and post-treatment. Please refer to the 2015 Annual Report Strategic Habitat Plan Accomplishments for Jackson Region habitat improvement project summaries (https://wgfd.wyo.gov/Habitat/Habitat-Plans/Strategic-Habitat-Plan-Annual-Reports).
Field Data
No field data were collected in the Targhee Herd Unit during the 2015 biological year.
6

Harvest Data
Based on harvest statistics, the density of mule deer in the Targhee Herd continues to be a concern. Although the secondary objective of an average of ≥ 15% harvest success over 3 years is being met, most hunters are not satisfied with their hunting experience. The average days to harvest was 13.7 in 2015. This is the lowest in the past 6 years. Ninety-five hunters participated in the mule deer hunt and 24 deer were harvested. The number of hunters peaked in 1983 when 575 hunters participated in this hunt.
A new Type 8 white-tailed deer doe/fawn license was offered beginning in 2015 with 50 licenses. Twenty-five hunters utilized this license in 2015 to harvest 14 deer (56% success). Since the majority of white-tailed deer occur on private land, access is likely a limiting factor for white-tailed deer harvest. This license will be offered again in 2016.
Population
This population likely declined following liberal hunting seasons in Idaho. Data are limited for this population and spreadsheet models do not simulate observed trends. Mule deer winter and transitional ranges in Wyoming are dominated by older age class shrubs and conifer-encroached aspen stands. Many mountain shrub communities are decadent, with plants reaching over 10 feet in height, well above a mule deer’s browse zone.
Management Summary
Due to the “interstate” nature of this mule deer population, managing this herd is difficult. Observations of deer along the state line indicate this population remains at a low density even though hunting seasons are conservative. There are no changes planned for the 2016 mule deer hunting season. Antlered deer seasons will close on October 7 to coincide with hunt season closures in adjacent hunt areas east of Jackson. Hunting seasons in Area 149 have minimal impact on this herd and it is likely that more harvest occurs in Idaho than Wyoming. The WGFD continues to work closely with CTNF to develop habitat improvement projects for mule deer and other big game species. In addition, WGFD plans to work more closely with IDFG beginning in 2016 on management issues related to mule deer.
Several private landowners have expressed interest in expanded white-tailed deer hunting opportunities in Hunt Area 149. Therefore, a new Type 8 license was offered beginning in 2015 for doe or fawn white-tailed deer with 50 licenses. Twenty-five hunters utilized this license in 2015 to harvest 14 deer (56% success). Since the majority of white-tailed deer occur on private land, access is likely a limiting factor for white-tailed deer harvest. White-tailed deer licenses will help maintain low densities to prevent competition with mule deer, reduce damage to private lands, and create additional deer hunting options in this area.
7

8

50000 (40000 - 60000)
Total: 7% 8%Proposed change in post-season population: 1% 1%
Males ≥ 1 year old: 31% 31%Juveniles (< 1 year old): 0% 0%
Proposed harvest rates (percent of pre-season estimate for each sex/age group):JCR Year Proposed
Females ≥ 1 year old: 7% 6%
Percent population is above (+) or below (-) objective: -24%Number of years population has been + or - objective in recent trend: 23Model Date: 2/23/2016
Juveniles per 100 Females 68 61
Population Objective (± 20%) :Management Strategy: Special
Days Per Animal: 13.2 11.3 13.4Males per 100 Females 38 39
Active License Success: 42% 48% 41 %Recreation Days: 30,261 36,134 34,879
Hunter Success: 42% 48% 41 %Active Licenses: 5,513 6,588 6,315
Harvest: 2,296 3,189 2,600Hunters: 5,513 6,588 6,315
2010 - 2014 Average 2015 2016 ProposedPopulation: 33,740 38,000 38,000
2015 - JCR Evaluation FormSPECIES: Mule Deer PERIOD: 6/1/2015 - 5/31/2016HERD: MD131 - WYOMING RANGE
HUNT AREAS: 134-135, 143-145 PREPARED BY: GARY FRALICK
9

10

11

2010 - 2015 Postseason Classification Summary
for Mule Deer Herd MD131 - WYOMING RANGE
MALES FEMALES JUVENILES Males to 100 Females Young to
Year Post Pop Ylg2+
Cls 12+
Cls 22+
Cls 32+
UnCls Total % Total % Total %TotCls
ClsObj Ylng Adult Total
Conf Int
100 Fem
Conf Int
100 Adult
2010 34,000 494 0 0 0 688 1,182 19% 3,124 50% 1960 31% 6266 1265 16 22 38 ± 1 63 ± 2 462011 31,000 340 0 0 0 998 1,338 19% 3,563 50% 2173 31% 7074 1224 10 28 38 ± 1 61 ± 2 442012 33,000 251 0 0 0 439 690 15% 2,256 50% 1556 35% 4502 1325 11 19 31 ± 2 69 ± 3 532013 36,500 544 0 0 0 704 1,248 20% 2,946 47% 2065 33% 6259 1376 18 24 42 ± 2 70 ± 2 492014 34,200 582 627 428 274 0 1,313 19% 3,239 46% 2478 35% 7030 1232 18 23 41 ± 2 77 ± 2 542015 38,000 672 408 308 158 0 1,546 20% 3,830 50% 2,381 30% 7,857 1300 17 22 39 ± 1 61 ± 2 43
2016 HUNTING SEASONS WYOMING RANGE MULE DEER HERD (MD131)
Hunt Area
Type Season Dates Quota License LimitationsOpens Closes
134 Oct. 1 Oct. 14 General Antlered mule deer three (3) points or more on either antler or any white-tailed deer
135 Oct. 1 Oct. 14 General Antlered mule deer or any white-tailed deer
143 Sep. 15 Oct. 7 General Antlered mule deer or any white-tailed deer
144 Sep. 15 Oct. 7 General Antlered mule deer or any white-tailed deer
145 Sep.15 Oct. 7 General Antlered mule deer or any white-tailed deer
145 3 Nov. 1 Nov. 30 60 Limited quota Any white-tailed deer 145 3 Dec. 1 Jan. 31 Unused Area 145 Type 3 licenses
valid for doe or fawn white-tailed deer 134, 135
Sep. 1 Sep. 30 Archery only – REFER TO SECTION 3
143, 144, 145
Sep. 1 Sep. 14 Archery only - REFER TO SECTION 3
REGION G NONRESIDENT QUOTA – 600 LICENSES
12

SUMMARY OF PROPOSED CHANGES BY LICENSE NUMBER
Area License Type
Change from 2015
Herd Unit Total No Net Change
Management Evaluation Current Postseason Population Management Objective: 50,000 Management Strategy: Special 2015 Postseason Population Estimate: ~38,000 2016 Proposed Postseason Population Estimate: ~38,000
The population objective for Wyoming Range mule deer herd is 50,000 deer. The management strategy is special and the objective and management strategy were last revised in 1994. The current population estimate is approximately 38,000 deer. The population objective will be reviewed in 2016 (APPENDIX A).
Herd Unit Issues
The population objective for Wyoming Range mule deer herd is 50,000 deer. The management strategy is special management. The objective and management strategy were last revised in 1994. The current population estimate is approximately 38,000 deer.
Management strategies since 1993 emphasized hunting antlered deer in an effort to promote population growth. Antlered deer hunts occur in mid-September and early October throughout the herd unit. Hunt seasons close in the northern hunt areas prior to the onset of the annual fall migration in order to minimize vulnerability of bucks that migrate from subalpine summer ranges to sagebrush winter ranges in the Upper Green River Basin. Sustained population growth has been difficult to achieve because of high overwinter mortality approximately every 3 years on crucial winter ranges, low vigor and productivity of important winter range browse, and reduced fawn survival and recruitment.
The Wyoming Range Mule Deer Project was launched in March 2013. The overall goal of this research project is to address important research and management needs indentified by the Wyoming Mule Deer Initiative and Wyoming Range Mule Deer Initiative. An important aspect of this research is to investigate the nutritional relationships between mule deer population dynamics, energy development and disturbance, habitat conditions, and climate to provide a mechanistic approach to monitoring and management of mule deer (Appendix B). A planned approach is to integrate data on nutritional condition, forage production and utilization, and
13

population performance to understand factors regulating Wyoming Range mule deer and the ability of the current habitat to support mule deer. In addition, there is an opportunity to address secondary objectives including nutritional contributions of winter and summer ranges, factors affecting reproduction, identification of habitats of nutritional and reproductive importance to mule deer, timing and delineation of important migration routes, and direct assessment of the effects of energy development on nutrition and survival of mule deer (Monteith et al. 2012).
In March 2015, Phase II of the Wyoming Range Mule Deer Project was initiated. The Phase II segment of the project focused on measuring survival and cause-specific mortality of mule deer fawns to quantify the relative roles of habitat, nutrition, and predation on recruitment of young (Monteith 2015, Appendix B). Specific objectives of this project quantified the effects of predation and other mortality factors on survival of young mule deer, and provided a relative assessment of the effect of juvenile mortality on the annual population dynamic.
Weather
Precipitation
Overall precipitation from October 2014 through September 2015 was near average when averaged across the entire herd unit. The general characteristics included a relatively dry winter followed by above average summer precipitation. Fortunately, growing season (April through June) precipitation was above average which resulted in good vegetation production across all ranges.
Winter Severity
The 2015-2016 winter was very mild with above average temperatures and below average snow accumulation on winter ranges. This will be the third winter in a row of good over-winter survival for fawns and adults which influences the overall population trend. High elevation mountain ranges have received snow levels that are closer to average. The Upper Green River
0
5
10
15
20
25
30
2010 2011 2012 2013 2014 2015
Inches of Precipitation
2010‐2015 Wyoming Range MD 131 Precipitation Oct‐Sep Precipitation
Apr‐Jun Precipitation
SSF Range Precipitation (May‐Jul)
30 Year Oct‐Sep Precipitation Average
30 Year Apr‐Jun Precipitation Average
30 Year May‐Jul Precipitation Average
14

Basin is 92% of median, Lower Green River Basin is 97% of median, and Upper Bear River Basin is 92% of median as of March 15, 2016.
Habitat
Sagebrush and other shrubs produced excellent leader growth in 2015 which provided a good quantify of forage on winter ranges. High temperatures and a lighter snowpack have allowed migrating wildlife to move off of crucial winter ranges earlier than normal in spring of 2016 and will likely result in grass and forb green-up earlier than most years.
Habitat Significant Events
Habitat treatments were conducted as part of the Wyoming Range Mule Deer Habitat Project on BLM land in 2015 including: 2519 acres Lawson aerator sagebrush thinning, 770 acres of sagebrush mowing, 357 acres of aspen mechanical preparation for future burning, 2,500 acres of cheatgrass herbicide spraying, and 1 water reservoir renovated to assist with livestock rest. More information can be obtained by reading the Pinedale Region report in the 2015 Strategic Habitat Plan Annual Report. There were no significant wildfires in 2015 in this herd unit.
Habitat Monitoring
Winter Range Shrub transects (Figures 1 and 2) were only monitored on four true mountain mahogany transects in 2015 by Department personnel.
Figure 1. A summary of mountain mahogany production, Wyoming Range mule deer herd, 1997-2015.
0
1
2
3
4
5
6
97 98 99 00 01 02 03 04 05 06 07 08 09 10 11 12 13 14 15
Inch
es
Year
Mountain Mahogany Production Compared to Seasonal Precipitation (April-June)
Precipitation (inches) Leader Production (inches)
15

Additionally, 100 sagebrush transects were monitored in the herd by University of Wyoming graduate student Samantha Dwinnell as part of her research with Dr. Kevin Monteith (Figure 2). These data were collected on North Winter Range (LaBarge/Calpet, n=50), South winter range (Cokeville-Kemmerer, n=50) and Pinedale Anticline Project Area (PAPA, Mesa, n=50).
Figure 2. A summary of sagebrush production on Wyoming Range mule deer winter ranges, 2013-2015.
For additional site specific habitat information, please refer to the 2015 Annual Report Strategic Habitat Plan Accomplishments, for the Pinedale Region habitat improvement project summaries (http://wgfd.wyo.gov/web2011/wildlife-1000708.aspx).
Field Data
The Wyoming Range deer herd has been unable to sustain population growth for more than 3 consecutive years since the early 1990s. Normal to high over-winter mortality has suppressed this population’s ability to sustain growth because of poor survival and recruitment of fawns.
Since the initiation of the Wyoming Range Mule Deer Project, radio-collared adult does have provided an index of two important metrics: adult survival and fetal rates. Phase II – the fawn survival component of the project, was implemented in 2015 to provide an over assessment of annual fawn survival. During 2015 an important, but previously unknown, mortality factor was
16

discovered in this deer herd. The disease, Adenovirus Hemorrhagic Disease (AHD) was determined to be a cause of mortality for radio-collared newborn fawns and un-collared fawns as old as 5 months old throughout the herd unit. Although the impact to the annual population dynamic is unknown at this time, it is suspected that AHD, in addition to predation and malnutrition, played an important role in the mortality of a substantial percentage of fawns born in 2015.
Adult survival has exceeded 70% over the last three years; during the same period fetal rates have averaged 1.6 fetuses/doe. An on-going effort to monitor population dynamics with posthunt herd composition surveys provides an assessment of buck recruitment and fawn production and survival.
The primary issue affecting the population dynamic of the northern segment of the herd, is the general decline in productivity and survival of fawns prior to their arrival on, and subsequent departure from, the LaBarge/Big Piney winter ranges (Area 143). During the 5-year period from 1996-2000, an average of 82 fawns:100 does were observed on this winter range. During a subsequent 5-years period (2011-2015), the average fawn:100 does ratio was 62:100. Body condition of pregnant does that arrive on winter ranges and depart in the spring is one of the primary determinants of fawn production and survival.
Buck:doe ratios have met or exceeded the special management objective of 30-45 bucks:100 does in the posthunt population over the last 7 years. Moderate to high overwinter survival has ensured recruitment of 1.5+ year old bucks. Despite lower fawn survival and recruitment, buck ratios have met management goals of 30-45 bucks in the posthunt population. Since 2009 buck:does ratios have exceeded 40:100 in two of the last seven years. On the LaBarge winter ranges buck:doe ratios averaged 42 bucks:100 since 2010. The highest buck ratio achieved in at least 20 years was in 2013 when 46 bucks:100 does were observed on the LaBarge winter ranges.
On herd unit winter as well as summer ranges, low fawn recruitment is of concern, and is believed to be related to habitat conditions, nutritional condition of doe deer, effects of winter severity, predation, and because of the recent findings of the Phase II fawn survival component, the prevalence of disease. Poor browse production related to persistent drought, and an increase in decadent and over-mature forage plants on crucial winter ranges are factors that dictate over-winter deer survival during mild and open winters. Additional factors are the declining vigor, and an increase in dead and decadent aspen communities in parturition and summer ranges. The condition of aspen communities is believed to contribute to the declining neonatal fawn survival and recruitment.
Harvest
Hunting seasons since 1993 have been designed to allow 7-14 days of hunting in the southern areas (Areas 134,135) and 16-23 days of hunting in the northern areas (Areas 143-145). Antlered only hunting, and the near absence of antlerless harvest has failed to produce the sustained population increase since the late 1990s. Nonresident licenses were reduced to 600 licenses for Region G beginning in 2012. Observed buck:doe ratios totaled 42 bucks :100 does in
17

2013, which is the highest observed buck:doe ratio since 1991. A conservative management approach of closing hunting seasons prior to the annual fall migration in the northern hunt areas has ensured that trophy class bucks continue to be recruited into the posthunt population. Hunter success was estimated at 48% in 2015. A total of 3189 deer were estimated to have been harvested. In 2014 success was 47%, while 2760 deer harvested. Hunter success and total deer harvested have been the highest levels reported since the late 1990s and early 2000s. A total of 101 does and 109 does were harvested in 2014 and 2015 respectively. Nonresidents accounted 14% of the total estimated harvest in the herd unit. Population The population trend has increased over the last 5 years, although only minimally. The “Time Sensitive Juvenile – Constant Adult Mortality Rate” (TSJ,CA) spreadsheet model was used to derive the post season population estimate. The TSJ,CA model showed the best overall fit compared to the suite of available models (Fit=1, Relative AICc=116). This model tracks observed buck:100 doe ratios extremely well. Management Summary The population remains below the objective. The 2016 hunting season is designed to promote population growth and retain bucks in the posthunt population by closing hunt seasons prior to the onset of the fall migration. Nonresident Region G licenses will remain at 600 licenses. The 2016 season in Hunt Areas 134 and 135 will allow 14 days of general season antlered deer hunting, with the added restriction that antlered deer with three points or more on either antler may be taken in Areas 134. Both areas will allow the take of any white-tailed deer. Hunt Areas 143-145 will close on October 7 in 2016, and offer hunters the opportunity to harvest antlered mule deer or any white-tailed deer. The 2016 closing date is similar to the 2014 and 2015 closing date. The October portion of the hunting season in the northern areas will close prior to the onset of the fall migration which typically begins in late September; it is during the fall migration that bucks are most vulnerable when snow accumulations at higher elevations force deer to into areas more accessible to hunters. Season closure prior to this migration will ensure that overharvest of bucks does not occur. In Area 145, a limited quota any white-tailed deer hunt will allow hunters to take any white-tailed deer during the November portion of the hunting season, and doe or fawn white-tailed deer in an area where chronic damages to stored crops on private property have been occurring. The 2016 hunting seasons are projected to harvest approximately 2600 deer. The population should be maintained at approximately 38,000 deer following the 2016 hunting seasons.
18

WYOMING RANGE MULE DEER HERD
AND POPULATION OBJECTIVE REVIEW
Prepared by: Gary L. Fralick, Thayne & Big Piney Wildlife Biologist
POPULATION OBJECTIVE REVIEW
There have been several significant management changes since the delineation of the Wyoming Range herd unit (Figure 1). These changes have been primarily associated with development and implementation of population objectives. Population estimates, and the associated objectives, were derived from POP2 computer program modeling efforts (Bartholow 1999) and spreadsheet models for ungulate population data (White and Lubow 2002).
The initial population objective for the Wyoming Range herd was established at 30,000 deer in approximately 1974. This objective was provided by field managers based on winter habitat capability and on-the-ground estimates at the time. This objective remained in effect until 1985.
In 1985, the population objective was increased from 30,000 deer to 38,000 mule deer. The reason for this population objective correction was the re-alignment of herd unit boundaries for the West Green River (HA 135, 136, 137), Carter Lease (HA134), Lincoln (HA 144,145), and Sublette deer herds (HA 142,143) in 1981 that resulted in revisions to the population model parameters (Lockman 1981). The population objective of 38,000 deer guided management efforts until 1993.
A public attitude survey was conducted during the winter 1993-1994 in western Wyoming communities to assess public support for the current objective of 38,000 (Fralick 1993). The results of this attitude survey, based largely on widespread public dissatisfaction with the deer management program, compelled the Department to implement an interim population objective revision from 38,000 to 50,000 deer in 1994 (Fralick 1993a).
Since1994 the population objective has been 50,000 deer. The implementation of the Wyoming Range Mule Deer Initiative in 2010 and 2011 drew considerable public comment that pertained to a comprehensive review of management of the deer herd. An important segment of the herd review pertained to the public discussion regarding the population objective and the need to re-evaluate the objective to reflect current biological and environmental conditions. In 2015, the Department responded to the public’s request to re-evaluate the population Wyoming Range objective and the formal review process was initiated in January 2016.
Figure 1. The Wyoming Range Mule Deer Herd, Hunt Areas 134, 135, 143-145.
19
administrator
Typewritten Text
APPENDIX A

Population
The population objective for Wyoming Range mule deer herd is 50,000 deer. The management strategy is special management. The objective and was last revised in 1994. The current population estimate is approximately 38,000 deer (Figure 2).
The Wyoming Range deer herd has been unable to sustain population growth for more than 3 consecutive years since 2006 (Figure 2). Normal to high over-winter mortality has suppressed this population’s ability to sustain growth because of poor survival and recruitment of fawns, yearlings, and substantial losses to the 2+-year old age classes. Normal to severe winter mortality was observed during the winters of 2005-06, 2007-08, and 2010-2011.
Figure 2. A depiction of posthunt population estimates and the associated population objective (N=50,000), Wyoming Range mule deer herd, 2006 – 2015.
Current Management Strategy
Management strategies since 2006 emphasized hunting antlered deer in an effort to promote population growth. Antlered deer hunts occur in mid-September and early October throughout the herd unit (Fralick 2007). Hunt seasons close in the northern hunt areas prior to the onset of the annual fall migration in order to minimize vulnerability of bucks that migrate from subalpine summer ranges to sagebrush winter ranges in the Upper Green River Basin. Hunt seasons in the southern hunt areas typically close prior to the elk hunt opener on October 15 in order to reduce vulnerability of bucks to hunter harvest concurrent with the elk hunt. Sustained population growth has been difficult because of the frequency of high overwinter mortality every 3 years.
Hunter numbers, primarily resident hunters, have increased herd unit wide since 2006 (Figure 3). The Department initiated a decrease in the number of nonresident licenses in Region G in 2011. Nonresident Region G licenses were reduced from 800 to 600 licenses and have remained at that level since 2011. In response to generally higher overwinter survival of the antlered 2+-year old cohort and exceptional antler production, resident hunters have comprised a higher percentage of the total hunter population in the Wyoming Range.
In 2006, a total of 4747 hunters indicated they hunted in the Wyoming Range. Resident hunters accounted for 77% of the total hunter numbers in that year, while nonresidents accounted for 23% of the herd unit’s hunters. In comparison, hunter numbers have, in general, steadily increased since 2006. In 2015 an estimated 6588 total hunters indicated they hunted the Wyoming Range. During the current year resident hunters accounted for 89% (n=5859) of the herd unit’s hunters, while nonresident hunters comprised 11% (n=729). The substantial decrease in nonresidents from 2006 to 2015 is due to two years when the Department initiated decreases in the number of licenses issued to nonresidents. In 2007 and 2011 the Department decreased the number of licenses issued in those years from 1000 to 800 licenses and 800 to 600 licenses in Region G, respectively.
0 10,000 20,000 30,000 40,000 50,000 60,000
2006
2007
2008
2009
2010
2011
2012
2013
2014
2015
POSTHUNT POPULATION
WYOMING RANGE MULE DEER HERD 2006 - 2015
20
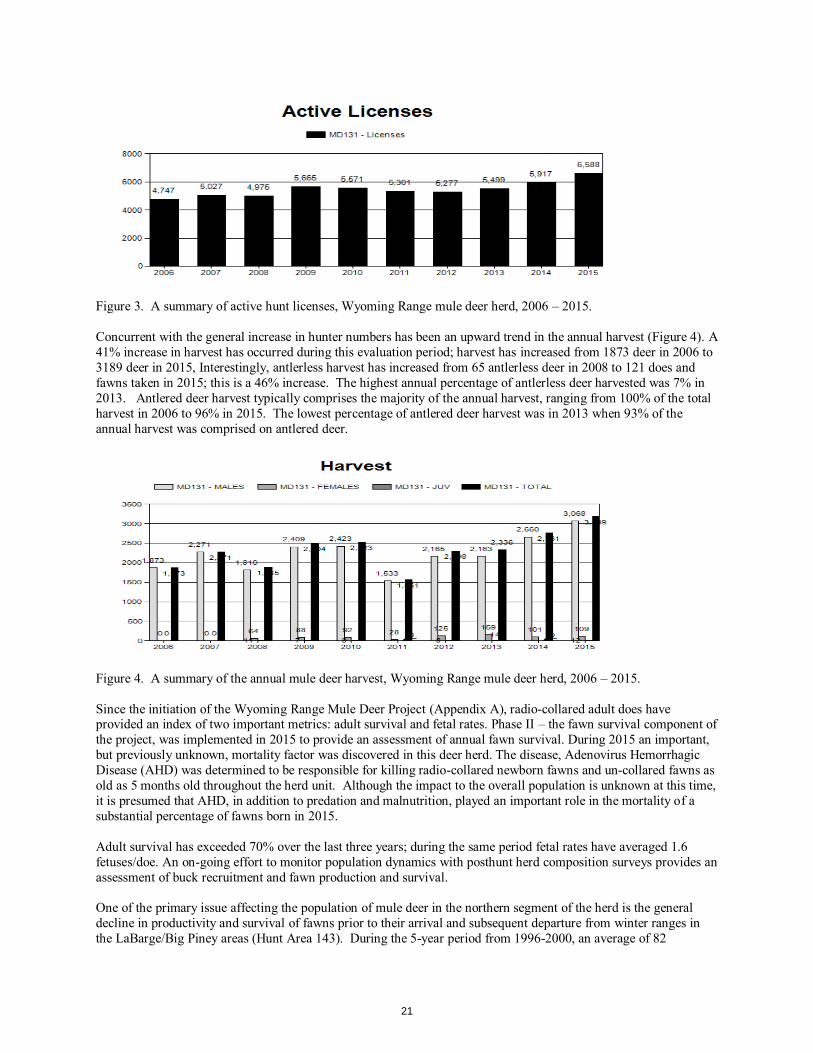
Figure 3. A summary of active hunt licenses, Wyoming Range mule deer herd, 2006 – 2015.
Concurrent with the general increase in hunter numbers has been an upward trend in the annual harvest (Figure 4). A 41% increase in harvest has occurred during this evaluation period; harvest has increased from 1873 deer in 2006 to 3189 deer in 2015, Interestingly, antlerless harvest has increased from 65 antlerless deer in 2008 to 121 does and fawns taken in 2015; this is a 46% increase. The highest annual percentage of antlerless deer harvested was 7% in 2013. Antlered deer harvest typically comprises the majority of the annual harvest, ranging from 100% of the total harvest in 2006 to 96% in 2015. The lowest percentage of antlered deer harvest was in 2013 when 93% of the annual harvest was comprised on antlered deer.
Figure 4. A summary of the annual mule deer harvest, Wyoming Range mule deer herd, 2006 – 2015.
Since the initiation of the Wyoming Range Mule Deer Project (Appendix A), radio-collared adult does have provided an index of two important metrics: adult survival and fetal rates. Phase II – the fawn survival component of the project, was implemented in 2015 to provide an assessment of annual fawn survival. During 2015 an important, but previously unknown, mortality factor was discovered in this deer herd. The disease, Adenovirus Hemorrhagic Disease (AHD) was determined to be responsible for killing radio-collared newborn fawns and un-collared fawns as old as 5 months old throughout the herd unit. Although the impact to the overall population is unknown at this time, it is presumed that AHD, in addition to predation and malnutrition, played an important role in the mortality of a substantial percentage of fawns born in 2015.
Adult survival has exceeded 70% over the last three years; during the same period fetal rates have averaged 1.6 fetuses/doe. An on-going effort to monitor population dynamics with posthunt herd composition surveys provides an assessment of buck recruitment and fawn production and survival.
One of the primary issue affecting the population of mule deer in the northern segment of the herd is the general decline in productivity and survival of fawns prior to their arrival and subsequent departure from winter ranges in the LaBarge/Big Piney areas (Hunt Area 143). During the 5-year period from 1996-2000, an average of 82
21

fawns:100 does were observed on this winter range. During a subsequent 5-years period (2011-2015), the average fawn:100 does ratio was 62:100. Buck:doe ratios have met or exceeded the special management objective of 30-45 bucks:100 does in the posthunt population over the last 7 years. Normal to high overwinter survival has ensured recruitment of 1.5+ year old bucks. Despite low fawn survival and recruitment, buck ratios have met management goals of 30-45 bucks in the posthunt population. Since 2009 buck:does ratios have exceeded 40:100 in two of the last seven years. On the LaBarge winter ranges buck:doe ratios averaged 42 bucks:100 since 2010. The highest buck ratio achieved in at least 20 years was in 2013 when 46 bucks:100 does were observed on the LaBarge winter ranges. Habitat Conditions
The Wyoming Range mule deer herd includes a wide variety of vegetation communities and habitat conditions across two mountain ranges and the sage-brush basins to the south and east that is used as winter range. Winter ranges are dominated by Wyoming big sagebrush, saltbush, greasewood, and include pockets of mountain shrubs such as true mountain mahogany and serviceberry. In general the condition of shrubs on winter range is poor and is dominated by severely hedged old age plants with little annual production. For this reason, mule deer are typically on a negative nutritional plane and loosing body fat throughout the winter season. Winter range conditions have not changed greatly in the last 10-15 years, with the exception of additional oil and gas infrastructure in the LaBarge area, a few relatively small-scale habitat treatments and expansion of cheatgrass into many southern aspects and places that have experienced recent disturbance. Drought has also played a role on winter ranges in the last 15 years. Old age shrubs are not able to generate annual leader production as well as young plants when resources are scarce. Summer and transitional ranges are located in the Salt and Wyoming Ranges. These areas are certainly more productive than winter ranges, but could provide higher quality habitat for mule deer. The primary management concerns involve late succession conditions in aspen, mountain shrubs and conifer communities as well as degraded condition of tall forb rangelands that are used heavily by mule deer for high quality forage in summer months. Recent large-scale wildfires such as the Fontenelle Wildfire (2012) and changes in land management have potential to benefit mule deer in future years. Additionally, a significant effort has been placed on treating shrub and aspen stands on the east slope of the Wyoming Range in order to set back succession and improve habitat quality for many generations to come. On herd unit winter as well as summer ranges, low fawn recruitment is of concern, and is believed to be related to habitat conditions, nutritional condition of doe deer, effects of winter severity, predation, and because of the recent findings of the Phase II fawn survival component, the prevalence of disease. Poor browse production related to persistent drought, and an increase in decadent and over-mature forage plants on crucial winter ranges are some of the factors that dictate over-winter deer survival during mild and open winters. Additional factors are the declining vigor, and an increase in dead and decadent aspen communities in parturition and summer ranges. The condition of aspen communities is believed to contribute to declining neonatal fawn survival and recruitment. Hunter Satisfaction
Hunter satisfaction and approval of mule deer management is an essential element in determining the level of support for the current review of the population objective (Figures 4 and 5). In order to assess hunter satisfaction throughout the herd unit, two hunt areas that represent differing management strategies were selected to evaluate hunter experience. Hunt Area 135 was selected because in most years over 50% of the herd unit’s hunter and annual harvest occurs in this area (Figure 4). The season dates in Area 135 typically open on October 1 and close on/before October 14. In contrast, Hunt Area 144 (Figure 5) typically opens on September 15 and closes on/before October 7 prior to the onset of the fall migration. In most years, Area 144 accounts for approximately 23% - 27% of the herd unit’s annual harvest and hunter numbers. Hunters were queried during the annual posthunt review to rate their approval of the Department’s management of this deer herd from 2011 - 2015. Hunters were asked to chose one of five categories (Very Satisfied, Satisfied,
22

Neutral, Dissatisfied, Very Dissatisfied) to describe their deer hunting experience. The hunter satisfaction ratings recorded in Hunt Area 135 (Figure 3) and Hunt Area 144 (Figure 4) reflect a positive sentiment of a management strategy that has garnered widespread public approval throughout the herd unit.
The relative increase in annual hunter satisfaction reflects a positive experience following the high winter mortality and population decline during and after the 2011 winter. Since that time, deer hunters in the Green River Region’s Hunt Area 135 have rated their annual hunting experience in an increasingly positive manner (Figure 3). The lowest approval rating of 33% is very likely a result of the effects of the severe mortality observed during 2011 winter, while a 63% approval reported in 2015 ranks among the highest ratings in this hunt area in the last 15 years.
Figure 4. Percent of hunters who rated their hunting experience as Very Satisfied and Satisfied, Hunt Area 135 Wyoming Range mule deer herd, 2011 – 2015, (N=3,632 hunters).
The Greys River area, Hunt Area 144, is highly touted for its trophy class buck hunting opportunity (Figure 5). Since 2011 those hunters that pursued bucks expressed a sentiment that is consistent throughout the herd unit. The immediate effects of extreme overwinter mortality following the 2011 winter are reflected in a lower hunter approval rating. However, during the subsequent four years, hunter satisfaction increased annually as a result of higher overwinter survival of all age classes. Consequently, hunter approval and support of the Department’s deer management strategy is depicted at some of the highest levels in over 20 years.
Figure 5. Percent of hunters who rated their hunting experience as Very Satisfied and Satisfied, Hunt Area 144, Wyoming Range mule deer herd, 2011 – 2015 (N=1,551 hunters).
2011 2012 2013 2014 2015
Hunter Satisfaction 33 51 53 61 63
33
51 53 61 63
0
20
40
60
80
P
E
R
C
E
N
T
WYOMING RANGE MULE DEER HERD HUNT AREA 135
2011 2012 2013 2014 2015
Hunter Satisfaction 49 60 65 68 70
49
60 65 68 70
0
20
40
60
80
P
E
R
E
N
T
WYOMING RANGE MULE DEER HERD HUNT AREA 144
23

PROPOSED PRIMARY AND SECONDARY OBJECTIVES FOR THE WYOMING RANGE MULE DEER
HERD AND SPECIAL MANGEMENT STRATEGY
Managers propose decreasing the population objective for the Wyoming Range mule deer herd from 50,000 to 40,000 deer. The proposed decrease in the population objective is an effort to manage the population at a level that reflects the current biological capacity of the deer herd and the environmental conditions that the population is dependent upon.
The proposed objective of 40,000 deer is based on the preliminary findings of the Wyoming Range Mule Deer Project – Phase I and Phase II, the ability of the current habitat conditions to support a lower number of mule deer, the widespread public support of the current mule deer management strategy, and the need for the population objective to reflect current and projected environmental conditions that may exist for the next five (5) years.
Primary Objective
The proposed primary objective for the Wyoming Range mule deer herd is to manage for a postseason population objective of 40,000 deer. The objective will encompass the range of + 20% (32,000 – 48,000) of the current year’s posthunt population estimate in order to provide managers the guidance to design hunting seasons for the upcoming year.
Secondary Objective
The management criterion for the Wyoming Range mule deer herd is Special Management. Parameters for the Special Management designation are proposed as secondary objectives and include:
Maintain a posthunt buck:doe ratio of 30-45 bucks:100 does;
Maintain the percent males in annual harvest ≥70%;
Maintain the percent females in the annual harvest ≤ 30%; and,
Maintain the percent harvest of yearling males in the annual harvest at ≤ 35%.
LANDOWNER, AGENCY AND PUBLIC INVOLVEMENT
The Wyoming Range mule deer herd objective review was discussed during public meetings in the Jackson and Pinedale regions during the 2016 Mule Deer Initiative Public meetings in Pinedale, Marbleton, and Thayne January 5-7, 2016. Similar meetings were held in Kemmerer and Green River on January 11 and 12, 2016. These meetings were held in Pinedale (formal meeting format, 15 people in attendance); Marbleton (formal meeting format, 13 people in attendance); Thayne (formal meeting format, 35 people in attendance). Public attendance in Kemmerer and Green River was recorded as 16 and 18 people, respectively.
On March 2, 2016, the Department presented a preliminary assessment of proposed 2016 Big Game Hunting Seasons to the Jackson Hole Outfitters and Guides Association. Included in this presentation was a brief discussion of the Wyoming Range mule deer herd management, proposed 2016 hunting seasons, and the upcoming review of the Wyoming Range population objective in March – May, 2016. Approximately 30 outfitters and guides were in attendance.
Regional personnel discussed the mule deer objective review on March 3, 2016 in LaBarge, and it was at that time the proposed revised objective was agreed to 40,000 deer.
The Wyoming Range population objective was presented to the Bridger-Teton National Forest personnel during the annual WGFD/USFS coordination in Jackson on March 17, 2016.
During 2016 big game hunting season public meetings and open houses in Marbleton (March 14; 2 people), Thayne (March 15, 17 people), Pinedale (March 16; 14 people), and Jackson (March 17; 35 people) the Wyoming Range mule deer population objective review was presented for public review.
24

Additional big game population review public meetings were held in Jackson and Pinedale on April 25, 2016, Kemmerer on April 27, and Green River on April 28, 2016.
25

LITERATURE CITED
Bartholow, J. 1999. POP-II System Documentation. Fossil Creek Software. Fort Collins, Colorado, USA.
Fralick, G. L. 1993. A summary of public responses to the proposed interim objective change for the Wyoming Range Mule Deer Herd. Wyoming Game and Fish Department, Jackson, Wyoming.
Fralick, G. L. 1993a. Wyoming Range Mule Deer Herd. Population Objective Update. Wyoming Game and Fish Department, Jackson, Wyoming.
Fralick, G. L. 2007. The Wyoming Range Mule Deer Herd: A summary of management alternatives, 2007 – 2008 Unpublished White Paper. Wyoming Game and Fish Department, Jackson, Wyoming.
Lockman, D. 1981. Statement of justification for the re-definition of all or portions of the West Green River, Lincoln, Sublette and Carter Lease deer herd units in western Wyoming. Wyoming Game and Fish Department, Green River, Wyoming.
White, G.C. and B.C. Lubow. 2002. Fitting population models to multiple sources of observed data. Journal of Wildlife Management, 66, 300-309.
26

The Wyoming Range Mule Deer Project:
Interim Report
27
administrator
Typewritten Text
APPENDIX B

Concerns over population performance of mule deer
(Odocoileus hemionus) have heightened in recent
decades in response to near ubiquitous declines in
abundance followed by stagnation in population
growth throughout much of the West. Although a
wealth of research has been conducted to identify what
is preventing populations from growing, controversy
remains, in part because population dynamics are
complex and studies rarely are able to address the
multitude of factors that can affect populations.
At the foundational level, individuals and populations
ultimately require the resources necessary to fuel growth and reproduction. Consequently, the food and
habitat requirements for individuals must be satisfied before other potentially limiting factors will matter—
nutrition is the fundamental building block of populations. In essence, without necessary habitat and
nutrition to support the metabolic demands of survival and reproduction necessary to sustain population
growth, targeted management actions focused on other factors are futile. Understanding the habitat
potential to support population growth is the first step towards identifying what factors are ultimately
responsible for regulating population dynamics.
The physiological adaptations that deer use to survival in a variable environment, such a storing excess
energy as excess fat, can be used as a lens to examine the relationship between habitat conditions and
population size. Deer undergo seasonal changes in nutritional condition (i.e., body fat) that reflect the
corresponding changes in food quality and availability, and metabolic demand. By relying on body stores,
specifically body fat, deer can survive nutritional bottlenecks associated with winter conditions and increase
their ability to provision offspring during summer. Nutritional condition itself is a direct measure of energy
acquisition and debt experienced by an individual. Consequently, an animal’s nutritional condition is a direct
product of it’s environment, and offers us a unique lens to measure the quality and adequacy of an
individual’s or a population’s habitat.
Nutritional condition represents the mechanistic link
between forage quality and availability relative to
the density of the population (i.e., resource
limitation), thereby creating a framework to
understand factors regulating population growth.
Advances in the application of ultrasonograph
technology to study big game allows researchers to
measure the nutritional condition (% body fat) of
live animals, making the linkage between habitat,
nutrition and population growth possible.
Nutritional Ecology of Mule Deer
28

Project
Overview
In response to concerns about mule deer populations in Wyoming, the Wyoming Game and Fish Commission
adopted the Wyoming Mule Deer Initiative (MDI) with the intent to develop individual management plans or
strategies for key herd units based on overarching goals and objectives. Separately, the Mule Deer Working
Group (2007) recognized that the “Success and implementation of these plans will depend upon our ability to
identify limiting factors to mule deer populations and their habitats”. Of particular concern is the Wyoming
Range mule deer herd in western-central Wyoming — one of the largest mule deer herds in the state and a
premier destination for mule deer hunting in the country.
The Wyoming Range mule deer population (MD131) has undergone dynamic changes in recent decades
from a population high of >50,000 in the late 1980s, to a sustained population of ~30,000 during the last
decade (Fig. 1). Despite conservative harvest
focused on the antlered portion of the population
with limited to no harvest of females, the
population has failed to recover to the herd unit
objective of 50,000 animals. Therefore, the
question remains as to whether current habitat
conditions can viably support growth in this herd,
and if the great abundance of deer experienced in
the late 1980s is a realistic expectation.
Nevertheless, identifying the current capacity of
the habitat to support mule deer in the Wyoming
Range or other places has been a persistent
management challenge.
The overall goal of the Wyoming Range Mule
Deer Project is to address important research and management needs identified by the Mule Deer Working
Group in the MDI and Wyoming Range Mule Deer Initiative. Overall, we seek to investigate the nutritional
relationships between mule deer population dynamics, energy development and disturbance, habitat
conditions, and climate to provide a mechanistic approach to monitoring and management of mule deer.
Our overall approach is to mesh data on nutritional condition, forage production and utilization, and
population performance to understand factors regulating Wyoming Range mule deer and the ability of the
current habitat to support mule deer. In addition, funding for this primary objective provides the
opportunity to address multiple secondary objectives including nutritional contributions of seasonal ranges,
factors affecting reproduction, identification of habitats of nutritional and reproductive importance to mule
deer, timing and delineation of important migration routes, and direct assessment of the effects of energy
development on nutrition and survival of mule deer.
Figure 1. Population trend of Wyoming Range mule deer over 35
years.
29

Fat reserves
Mule Deer Capture
We initiated our research in March 2013 with an
initial capture of 70, female mule deer that were
fitted with GPS radiocollars. Since the project’s
initiation, we have recaptured the same cohort of
deer each December and March via helicopter net-
gunning — the safest and most efficacious way to
capture and recapture radiocollared deer. At each
capture event, new deer are also fitted with GPS radio-collars to replace mortalities. By recapturing our study
animals as they enter winter ranges in December and leave winter ranges in March, we are able to use field
ultrasonography to track seasonal changes in nutritional condition (i.e., fat reserves) and reproductive status.
Fat measured in December yields insight into the contributions of summer range, the costs of reproduction,
and the fat reserves an animal has to aid in winter survival. Measurements of fat in March reveal the
nutritional contributions of winter range, and the fat reserves an animal has to aid in provisioning offspring.
In addition, we use ultrasonography to assess pregnancy status and
fetal rates each March.
GPS radiocollars have yielded detailed data about the habitats
that deer use throughout the year, and has allowed delineation of
migration routes that connect the critical winter and summer
ranges that heretofore were little known (Fig. 2). Migration
routes have ranged from very short distance migrations or range
shifts of <5 miles, to long distances of >115 miles. GPS data will be
used to delineate key migration routes, evaluate habitat condi-
tions on seasonal ranges, and understand movements and habitat
selection across the landscape throughout the year. 30

Figure 2. Map displaying the GPS collar data from 2013 used to delineate winter and summer home ranges and migration move-
ments.
31

Habitat Condition
Conditions on winter range, summer range, or during migration
comprise the annual resources that deer experience. If the quality
on one of these critical habitats is limiting, it can effect survival and
reproduction at other times of the year. We are measuring
components of habitat condition across all of these seasonal ranges
to better understand key habitat requirements for mule deer in this
range and what factors are limiting. Our on-the-ground assessment
of habitat conditions allow us to link the conditions of the
landscape with the behavior, nutritional condition, reproduction,
and survival of Wyoming Range mule deer.
Winter Range—To quantify potential indirect habitat loss due to
human disturbance associated with energy development, we
measured sagebrush production (i.e., annual leader growth) at 150
locations throughout winter ranges before deer arrive on winter
ranges. After deer leave winter ranges, these sites were revisited to
measure winter utilization (i.e., % browsed). We monitored changes
in production and utilization of sagebrush over three years in order
to capture inter-annual variability in availability of sagebrush. We also used remotely sensed data on location
and density of infrastructure associated with energy development to evaluate the potential effects human
disturbance may have on habitat condition.
Summer Range and Migration Routes— Using fecal samples, plant clipping and vegetation surveys, we will
reconstruct diet composition of deer, availability of forage, and quality of forage that deer use on summer
ranges and during migration. This information is aimed at understanding how and why animals time their
migratory movements, and evaluating how forage quality influences an individual's ability to support
reproduction.
1. Vegetationmeasurements – used to assess composition and
availability of forage plants through time.
2. Fecal samples –used toassess the diet
composition of mule deer.
3. Plant clippings – used toevaluate temporal changes in digestibility, available protein,
and toxins. 32

Migration Deer are a lot like goldilocks, they prefer to eat plants at a very specific life stage (not too old and not too young). This way, they can access the most digestible and nutrient rich food, which should ultimately result in enhanced nutritional condition.
Too Young—
Not enough biomass
Just Right—Easy to digest
High in nutrients
Too Old—Build up of defense
compoundsHard to digest
Spring green up, when plants are young and highly digestible, provides high-quality forage for deer. By migrating along an elevational gradient from low elevation winter range to high elevation summer range, deer can follow the “green-up” stage of plants that are most nutritious. Our research indicates that deer follow the green up of plants, which we call “surfing the green wave”. This research indicates that surfing the green wave is a fundamental behavior that influences migration and the forging benefit of migration, thereby emphasizing the importance of migration routes to deer not only as a means to move between seasonal ranges but also as a way to enhance resource gain in spring—a critical time for reproduction.
33

Drought and Migration We linked GPS data which measures deer movements in the spring with data on spring green-up, measured via satellite imagery. Essentially, from orbiting satellites we evaluate the photosynthetic activity (plant growth) across the landscape. With these data, we are studying how deer move in response to green-up during migration and how the forage they experience during migration affects survival and reproduction. We are also interested in understanding how drought effects green-up and the subsequent habitat quality of migratory corridors.
Drought = Shorter duration of green-up & Non-consecutive green up
Figure 3. (a) Duration of green-up is shorter in drought years when compared with wet years. (b) Green-up along migration routes is more consecutive (sequentially order along the migration route) in wet years than in dry years.
Our research shows that drought changes the way plants green up across the landscape (Fig. 3). As a result, the amount of time that deer are exposed to high-quality forage (as indexed by a track-ing score) is shorter in drought years, than in non-drought years (Fig. 4). The consequences of drought years modifying the pre-sumed benefits of migration have yet to be documented, however, the hindered track-ing of spring as it moves up the mountain surely holds some nutritional costs. Future research will be focused on identifying migratory routes or habitat types that may be buffered from drought. If such a buffer exist, they could be excellent targets for con-
servation.
Green-up Tracking
Score (1=perfect)
Green-up Tracking
Score (1=perfect)
Figure 4. Comparison of green-up tracking scores for individual deer between a wet and a dry year. A score of 1 indicates a deer that has perfectly tracked the timing of green-up and presumably accessed the best quality forage.
a b
34

Winter Habitat Conditions, Behavior, and Nutritional Condition
Energy development is widespread throughout west-
ern Wyoming and much has occurred on winter ranges
for migratory mule deer. Although encroachment of
human disturbance resulting from energy development
can directly reduce available forage through habitat
loss, human disturbance can invoke avoidance behav-
ior and alter habitat selection and foraging behavior.
Such behavioral responses may exacerbate the nutri-
tional bottleneck inherent to winter ranges by further
restricting access to and use of otherwise available for-
age. The effects of the resulting indirect habitat loss
may far exceed that of direct habitat loss by magnifying the loss of available forage and further reducing the
nutritional carrying capacity of winter ranges exposed to human disturbance.
To evaluate the effects of energy development on the nutritional carrying capacity of winter ranges for mule
deer, we aim to 1) identify behavioral responses to human disturbance, 2) link behavior and habitat condi-
tions – including exposure to human disturbance
– to nutritional condition (i.e., fat reserves over
the winter), and 3) quantify indirect habitat loss
by measuring forage availability and use on the
landscape. Our approach entails coupling data
collected from GPS collars and longitudinal chang-
es in nutritional condition of individual mule deer
with on-the-ground measurements of foraging
conditions, human disturbance, and use of forag-
ing patches. For this component of our research,
we’ve targeted our efforts across three primary
winter ranges with varying degrees of energy de-
velopment (Fig. 5). Our study area includes winter
ranges for Wyoming Range mule deer near Ev-
anston and Cokeville (SouthWR) and west of Big
Piney and LaBarge (NorthWR). We also included
winter ranges on Pinedale Anticline Project Area
(PAPA) into our study. Inclusion of winter ranges
on PAPA and the mule deer population that oc-
curs there allows us to compare effects among
winter ranges with varying intensities of human
disturbance resulting from energy development.
Figure 5. The study area including three winter ranges that vary in
intensity of human disturbance. 35

Winter Habitat Conditions
Habitat conditions across the 3 winter ranges vary in both levels of human disturbance and forage produc-
tion. Although the percent of the total infrastructure resulting from energy development covers less than
10% of the total habitat across all winter ranges ( 2.17% of 1,025,980km2 on PAPA, 7.41% of 620,563km2 on
NorthWR, and 1.23% of 1,925,317km2 on SouthWR), human activity as measured by traffic volumes is sub-
stantially higher on PAPA winter ranges when compared with NorthWR and SouthWR (Fig. 6). Furthermore,
the average known age of development is far younger on PAPA than on NorthWR and SouthWR winter rang-
es (9 years, 31 years, and 22 years, respectively). Therefore time of exposure and intensity of human disturb-
ance varies widely among winter ranges.
Figure 6. Traffic volumes across the three winter ranges.
p-values=1.939e-13;
R2=0.1812
Cumulative Precipitation of Growing Season
Avg
. An
nu
al G
row
th o
f Sa
geb
rush
Figure 7. Annual averages of leader growth for each
winter ranges among years.
Figure 8. Positive relationship between annual growth of
sagebrush and cumulative precipitation May—Sept.
Typical development on PAPA winter ranges.
Forage production varied among years and was closely correlated to precipitation throughout the growing
season (Figs. 7 and 8). However, NorthWR winter ranges were consistently more productive in annual lead-
er growth of sagebrush suggesting greater, relative availability of forage on NorthWR in comparison to
SouthWR and PAPA.
36

Behavior
In assessing use of available sagebrush on winter ranges, our preliminary findings revealed that use of sage-
brush increases with distance to energy development and is dependent on the amount of annual leader
growth (Fig. 9). These findings suggest that although mule deer appear to be avoiding otherwise available
forage near human disturbance, they are willing to forage in patches near human disturbance as long as the
forage benefit is high. These findings offer evidence that avoidance of human disturbance is resulting in less
use of otherwise available forage; however, the effects of this indirect habitat loss are potentially lessened in
patches where production of leader growth in sagebrush is high.
Nutritional Condition
Although December body fat is often a strong predictor of fat loss over the winter months, our preliminary
results show that mule deer populations on more productive winter ranges (i.e., winter ranges with higher
annual leader growth of sagebrush), come out of winter in better nutritional condition (i.e., have more body
fat in March; Fig. 10). This evidence suggests that forage availability on winter ranges may have effects on
adult survival and reproduction that may carry-over into the summer months.
Figure 9. There is a positive relationship between use of foraging patches, (a) distance to development and (b) production (i.e.,
leader growth), but an interaction between distance to development and production reveals that the effect of distance to develop-
ment is less when production is high.
December % Fat Sage Production
Mar
ch %
Fat
Mar
ch %
Fat
Figure 10. The best model for predicting fat at the end of winter resulted in a positive relationships between % fat in March, (a)
sagebrush production on winter ranges, and (b) % fat in December, .
a. b.
a. b.
37

Adult Survival Survival of adult female ungulates is notoriously high,
with little variation from year to year. Nevertheless,
adult survival if suppressed, can have dramatic
influences on population growth. We measured
survival of adult females from our radiocollared
sample during winter (Nov–Apr) and summer (May–
Oct), beginning in May 2013.
Adult survival was relatively high (Fig. 11), but was
lower when the study began in 2013 than during
2015. Also, survival during summer was slightly
lower than that measured during winter—which
conflicts with some current opinions. Average
annual survival for the current duration of the study
was 0.915.
Seasonal survival was influence primarily by 2
factors, age and nutritional condition. During winter,
age affected survival negatively, with older age
classes having a lower probability of survival (Fig.
12). In contrast, during summer, nutritional
condition of females as measured in March had a
positive influence on summer survival, with females
exiting winter in poor nutritional condition having a
lower probability of surviving the summer than
females in good nutritional condition in March (Fig.
13).
Figure 11: Survival of adult female mule deer in the Wyoming Range deer herd during winter (Nov–Apr) and summer (May–Oct) during 2013–2015.
Figure 12: Probability of winter survival (Nov–Apr) as a function of age for adult female mule deer in the Wyoming Range herd during 2013 and 2015.
Figure 13: Probability of summer survival (May–Oct) as a func-tion of March nutritional condition (% body fat) for adult female mule deer in the Wyoming Range herd during 2013 and 2015.
%
38

Reproduction Pregnancy and fetal rates (number of young in utero) is typically
high. That is, adult mule deer are rarely not pregnant, and most
often, are carrying twins. The deer in the Wyoming Range fit
this pattern. During our 3 years of monitoring thus far,
pregnancy rates have consistently exceeded 95%, and fetal
rates are about 1.7 fawns per female (Fig. 14). Therefore,
reproductive rates are sufficiently high, and the key factor then,
underpinning population dynamics that our work continues to
explore is what determines survival and recruitment of young.
Producing and rearing young is energetically expensive, and comes at a cost to nutrition condition for female
deer. The cost however, is
mediated by environmental
conditions and forage
availability, as was evident in
the apparent differences in
nutritional condition of
females in December for
those that succeeded to rear
2 young in 2013 and 2014;
costs of successful
reproduction were much
greater during the drought of
2013 as compared to the wet
year of 2014 (Fig. 15). Figure 15: (a) Number of recruited young in December relative to number of fetuses in March, and (b) December % Fat relative to number of fawns recruited for adult female mule deer in the Wyoming Range herd during 2013 and 2014.
Figure 14: (a) Fetal rates (number of young in utero) and (b) recruitment rates (number of young at heel in December) for the north and south Wyoming Range deer herd and deer on the Pinedale Anticline Project Area during 2013–2015.
Dec
emb
er %
Fat
Fall
Rec
ruit
men
t
Fetal Rate Fawns Recruited
a. b.
a. b.
39

Fawn Survival In March 2015, we initiated Phase II of the
Wyoming Range Mule Deer Project aimed at
identifying the relative role of factors that affect
fawn survival by evaluating cause-specific mortality
of young mule deer. This component of the project
allowed us to exploit a unique research opportunity
by enabling us to couple comprehensive research
on adult demography, behavior, and habitat
conditions with survival of young.
Data collection for Phase II entails fitting each radiocollared, adult deer that is pregnant in March with a
vaginal implant transmitter (VIT). VITs provide us with information on the timing and location of birth; thus,
enabling us to locate fawns that are collared and subsequently allowing us to monitor their daily survival and
cause-specific mortality. We successfully collared and monitored 52 fawns throughout summer 2015. By
November 2015, 42% of our collared fawns died due to predation, disease, trauma, malnutrition, or other
unknown causes (Fig. 16).
Our first summer of data collection revealed some surprising results. Although predation is often the leading
cause of mortality among mule deer fawns, we found that disease was the leading cause of mortality for
fawns of the Wyoming Range in summer 2015. The most prevalent disease causing agent was adenovirus
(accounting for 63% of disease-caused deaths). Adenovirus is a viral disease that can cause internal
hemorrhaging and pulmonary edema. Although adenovirus has been detected in mule deer populations
before, it was not known to be prevalent in Wyoming until our research detected it. Further work is
necessary to understand what this disease means for Wyoming Range deer and will be a focus of our efforts
in the upcoming year.
This is the typical condition of a fawn that died of ade-
novirus. Most were found fully intact and without any
sign of predation or an obvious cause of death. Adeno-
virus was confirmed in these mortalities at the Wyo-
ming State Veterinary Lab. Figure 16. Causes of death for the 22 fawn mortalities detected throughout summer 2015.
40

Partners and Funders
Knobloch Family
Foundation
41

42

2015 - JCR Evaluation Form
SPECIES: Elk PERIOD: 6/1/2015 - 5/31/2016
HERD: EL101 - TARGHEE
HUNT AREAS: 73 PREPARED BY: ALYSON COURTEMANCH
2010 - 2014 Average 2015 2016 Proposed
Hunter Satisfaction Percent 55% 59% 65%
Harvest: 38 28 40
Hunters: 129 116 125
Hunter Success: 29% 24% 32%
Active Licenses: 130 116 125
Active License Success: 29% 24% 32% Recreation Days: 738 585 600
Days Per Animal: 19.4 20.9 15
Males per 100 Females: Juveniles per 100 Females
Satisfaction Based Objective 60%
Management Strategy: Recreational
Percent population is above (+) or (-) objective: N/A%
Number of years population has been + or - objective in recent trend: 0
43

44

45

2016 HUNTING SEASONS
TARGHEE ELK HERD (EL101)
Hunt Area Type Season Dates Quota License Limitations Opens Closes
73 Sep. 20 Oct. 25 General Antlered elk, spikes excluded
Special Archery Seasons
Season Dates Limitations Hunt Area Type Opens Closes
73 All Sep. 1 Sep. 19 Valid in the entire area Management Evaluation Management Strategy: Recreational Population Objective Type: Hunter Satisfaction Primary Objective: Achieve a 3-year average of ≥ 60% of hunters indicating they are “satisfied” or “very satisfied” on the harvest survey. Secondary Objective: Achieve a 3-year average of ≥ 25% harvest success. The Wyoming Game and Fish Department (WGFD) proposed changing the objective for the Targhee Elk Herd from a postseason population objective to a hunter satisfaction objective in 2014. The objective change was needed because the herd is rarely surveyed due to budget priorities elsewhere and spreadsheet models do not appear to adequately simulate observed population trends. In addition, the interstate nature of the herd poses additional challenges to population surveys and management. A hunter satisfaction objective was adopted in 2014 after public review, and included primary and secondary objectives (listed above). The region did not adopt a landowner satisfaction objective because the majority of the herd unit is located on public lands. In 2015, 59% of hunters indicated they were “satisfied” or “very satisfied” with hunting in the Targhee Elk Herd (n=34 respondents). The average satisfaction for the past 3 years is 59.0% (Fig. 1). Therefore, the herd is not meeting the primary objective of an average of ≥ 60% hunter satisfaction over 3 years. In 2015, 24% of hunters were successful in the Targhee Elk Herd (Fig.
46

2). The 3-year average of hunter success is 27%. Therefore, the herd is meeting the secondary objective of an average of ≥ 25% harvest success over 3 years.
0.0
10.0
20.0
30.0
40.0
50.0
60.0
70.0
2010-2012 2013-2015
Perc
ent
Percent Hunter Satisfaction
Fig. 1. Three-year averages of percent of hunters indicating they were “satisfied” or “very satisfied” on WGFD’s harvest survey from 2010-2015. The dashed line indicates the objective of ≥ 60%.
Fig. 2. Harvest success rates in the Targhee Elk Herd for 2010-2015. The dashed line indicates the 3-year average objective of at least 25% harvest success.
55.3% 59.0%
47

Herd Unit Issues Post-season classification surveys are not flown in this herd due to budget constraints. However, elk were opportunistically recorded during an aerial survey of the Targhee bighorn sheep herd in March 2015. Only 4 adult bull elk were observed. Many of the historical winter ranges for the Targhee Herd have been converted to agriculture and residential development in Idaho. Winter ranges that remain are primarily low elevation mountain shrub and aspen communities in Wyoming and riparian areas in Idaho along the Teton River. Many of the mountain shrub and aspen communities along the state line are old and decadent and are being encroached by conifers. Weather Spring and summer 2015 produced consistent moisture, leading to good forage production. Fall was relatively mild with no significant snowfall until mid-December. By early February, low elevation slopes were beginning to melt out. At the time of the mid-winter survey, winter precipitation was reported at 91% of normal in the Snake River Basin. Please refer to the following web sites for specific weather station data. http://www.wrds.uwyo.edu/wrds/nrcs/snowprec/snowprec.html and http://www.ncdc.noaa.gov/oa/climate/research/prelim/drought/pdiimage.html Habitat There are several historical vegetation transects in elk winter and transitional ranges, but these have not been monitored in the past 5 years. Several habitat improvement projects are being planned in this herd unit, including the Hill Creek Prescribed Burn, which is scheduled for completion in 2016. In addition, a habitat treatment in Teton Canyon is currently in the planning stages to improve mountain shrub and aspen communities. The WGFD is assisting Caribou-Targhee National Forest (CTNF) with vegetation monitoring in aspen stands pre and post-treatment. Please refer to the 2015 Annual Report Strategic Habitat Plan Accomplishments for Jackson Region habitat improvement project summaries (https://wgfd.wyo.gov/Habitat/Habitat-Plans/Strategic-Habitat-Plan-Annual-Reports). Field Data No field data were collected in the Targhee Herd Unit during the 2015 biological year. Harvest Data Based on harvest statistics, the density of elk in the Targhee Herd continues to be a concern. The overall number of elk harvested remained low in 2015 (n=28) as did the number of hunters (n=116). Antlerless elk seasons were eliminated in 2010 and the season was shortened 6 days in
48

2012. Hunter satisfaction appears to be improving slightly over the last 3 years. In 2015, hunter satisfaction was 59% and harvest success was 24%.
Population
This population likely declined following the elimination of the supplemental feeding program in Idaho and liberal hunting seasons to address damage to private lands and comingling with livestock. Data are limited in this population and spreadsheet models developed for this population do not simulate observed trends. Elk winter and transitional ranges in Wyoming are dominated by conifer-encroached aspen stands.
Management Summary
Due to the “interstate” nature of this population, managing this herd is difficult. This population spends the summer and early fall in Wyoming and winters along drainages in the foothills of the Teton Range. The WGFD continues to work closely with CTNF to develop habitat improvement projects to benefit elk in Wyoming. Observations of elk along the state line indicate this population remains at a low density even though hunting seasons are conservative. In an effort to improve male recruitment in this population a spikes-excluded season was implemented in 2013. However, Idaho currently runs a spikes-only hunting season across the state line. Therefore, spikes that avoid harvest in Wyoming face hunting pressure once they migrate into Idaho.
49

50

2015 - JCR Evaluation FormSPECIES: Elk PERIOD: 6/1/2015 - 5/31/2016 HERD: EL102 - JACKSON
HUNT AREAS: 70-72, 75, 77-83 PREPARED BY: ALYSON COURTEMANCH
2010 - 2014 Average 2015 2016 Proposed Population: 11,552 11,200 11,000 Harvest: 1,359 1,169 1,400 Hunters: 3,003 3,211 3,000 Hunter Success: 45% 37% 47% Active Licenses: 3,097 3,330 3,000 Active License Success: 44% 36% 47% Recreation Days: 20,553 22,569 18,000 Days Per Animal: 15.1 19.1 12.9 Males per 100 Females 31 31 Juveniles per 100 Females 21 19
Population Objective (± 20%): 11000 (8800 - 13200)
Management Strategy: Recreational Percent population is above (+) or below (-) objective: 2% Number of years population has been + or - objective in recent trend: 0 Model Date: None Proposed harvest rates (percent of pre-season estimate for each sex/age group):
JCR Year Proposed
Females ≥ 1 year old: na% 0% Males ≥ 1 year old: na% 0%
Juveniles (< 1 year old): na% 0% Total: na% 0%
Proposed change in post-season population: na% 0%
51

52

53

2010 - 2015 Postseason Classification Summary
for Elk Herd EL102 - JACKSON
MALES FEMALES JUVENILES
Males to 100 Females Young to
Year Post Pop Ylg Adult Total % Total % Total % Tot Cls
Cls Obj Ylng Adult Total
Conf Int
100 Fem
Conf Int
100 Adult
2010 11,978 659 1,589 2,248 20% 7,669 67% 1,586 14% 11,503 372 9 21 29 ± 0 21 ± 0 16 2011 11,982 467 1,519 1,986 17% 8,116 70% 1,417 12% 11,519 269 6 19 24 ± 0 17 ± 0 14 2012 11,200 601 1,693 2,294 21% 7,027 64% 1,730 16% 11,051 440 9 24 33 ± 0 25 ± 0 19 2013 11,600 659 1,619 2,278 20% 7,560 66% 1,585 14% 11,423 374 9 21 30 ± 0 21 ± 0 16 2014 11,000 679 2,028 2,707 25% 6,570 62% 1,356 13% 10,633 584 10 31 41 ± 0 21 ± 0 15 2015 11,200 497 1,703 2,200 21% 7,117 67% 1,351 13% 10,668 387 7 24 31 ± 0 19 ± 0 15
2016 HUNTING SEASONS
JACKSON ELK HERD (EL102)
Hunt Area Type Season Dates Quota License Limitations Opens Closes
70 Sep. 20 Oct. 31 General Antlered elk, spikes excluded 71 Sep. 20 Oct. 31 General Antlered elk, spikes excluded 72 CLOSED 75 4 Oct. 22
Nov. 30 125 Limited
quota Antlerless elk; the Snake River Bottom portion of Area 75 shall be closed, also valid in that portion of Area 81 west of the Shadow Mountain Loop Road (U.S.F.S. Road 30340)
75 4 Oct. 22 Oct. 31 Antlerless elk valid in Area 79 75 4 Dec. 1 Dec. 11
Antlerless elk; the Snake River Bottom
and Antelope Flats portion of Area 75 shall be closed
75 6 Oct. 22
Nov. 30 500
Limited quota
Cow or calf; the Snake River Bottom portion of Area 75 shall be closed
75 6 Dec. 1 Dec. 11
Cow or calf; the Snake River Bottom and Antelope Flats portion of Area 75 shall be closed
77 Oct. 15
Oct. 16
General license and unused limited quota licenses; excluding limited quota cow or calf licenses and limited quota archery only licenses, valid for any elk; 70 National Elk Refuge permits may be issued only for youths 12 through 17 years of age
77 Oct. 17
Oct. 24 General license and unused limited quota licenses; excluding limited quota cow or calf licenses and limited quota archery only licenses, any elk
54

77 Oct. 25 Dec. 16
General license and unused limited quota licenses; excluding limited quota archery only licenses, antlerless elk only
78 1 Aug. 15 Sep. 25 75 Limited quota
Any elk valid off national forest
78 1 Sep. 26 Jan. 31 Any elk valid in the entire area 78 6 Aug. 15 Sep. 25
175
Limited quota
Cow or calf valid off national forest
78 6 Sep. 26
Jan. 31 Cow or calf valid in the entire area
78 7 Aug. 15 Jan. 31 50
Limited quota
Cow or calf archery, muzzle-loading firearm or shotgun only
79 Oct. 22 Oct. 31 Antlerless elk, Area 75 Type 4 licenses valid in Area 79
80 Sep. 26 Oct. 31 General Any elk 80 Nov. 1 Nov. 13 General Antlerless elk 80 Nov. 14 Nov. 30 General Antlerless elk valid south of the Curtis
Canyon and Sheep Creek Roads (U.S.F.S. Roads 30440 and 30445)
80 6 Oct. 15
Nov.13
100 Limited quota
Cow or calf
81 Sep. 26 Oct. 25 General Antlered elk, spikes excluded 82 Sep. 26 Oct. 25 General Antlered elk, spikes excluded 82 4 Sep. 10 Oct. 25 25 Limited
quota Antlerless elk
83 Oct. 1 Oct. 25 General Antlered elk, spikes excluded
Special Archery Seasons
Type
Season Dates Limitations Hunt Area Opens Closes
83 All Sep. 1 Sep. 30 Valid in the entire area(s) 70, 71 All Sep. 1 Sep. 19 Valid in the entire area(s) 78, 80-82 All Sep. 1 Sep. 25 Valid in the entire area(s)
Summary of 2016 License Changes
Area
Type Quota change
from 2015
Other changes from 2015
70 General -1 day 71 General -1 day
55

75 4 -25 Opens 2 days earlier, closes 2 days earlier. -1 day that licenses are valid in Area 79.
6 Opens 2 days earlier, closes 2 days earlier. 77 Opens 2 days earlier, closes 2 days earlier. 78 1 Opens 42 days earlier off national forest. 79 +1 day. Opens 2 days earlier, closes 1 day earlier. 80 General Closure north of Curtis Canyon/Sheep Creek Roads goes
into effect 2 days earlier. 6 Opens 2 days earlier, closes 2 days earlier.
Management Evaluation Current Postseason Population Management Objective: 11,000 Management Strategy: Recreational 2015 Postseason Population Estimate: 11,200 2016 Proposed Mid-Winter Trend Count: 11,000 The population objective for the Jackson Elk Herd is 11,000 elk. The management strategy is recreational and the objective and management strategy were last revised in 2007. The current population estimate is approximately 11,200 elk. Low calf productivity from the northern herd segments and liberal antlerless elk hunting seasons on the southern migratory segment have reduced the population to the desired population objective. Spreadsheet models do not adequately simulate this population. Therefore, the population objective and management strategy were reviewed in spring 2016. A proposal to change from a postseason population management objective (derived from a spreadsheet model) to a mid-winter trend count of 11,000 elk was presented to the public. The proposal will be reviewed by the WGF Commission in July 2016. Herd Unit Issues Management of this herd is complicated because occupied habitat includes two National Parks and the National Elk Refuge (NER). Complex seasons are typically used to address management concerns for various population segments in this herd. Recent pre-season classification surveys indicate that elk in the southern portion of the herd unit in southern GTNP and private lands near the Snake River reproduce at twice the rate of long-distance migratory elk from the northern herd segments. These differential recruitment rates are likely driven by lower predator densities and supplemental forage from agricultural areas and suburban landscapes in the southern herd segments. Herd management is currently structured around the following elk winter distribution targets: 1) a maximum of 5,000 elk on supplemental feed on the NER (Bison and Elk Management Plan, 2007), 2) 3,500 elk in the Gros Ventre drainage, and 3) 2,500 elk on other native winter ranges. Achieving these goals has been challenging due to high calf recruitment in southern herd segments, low harvest on private lands, comingling issues with livestock, elk movement patterns, weather, and predator influences. The number of elk on native winter ranges has decreased dramatically over the past decade. For example, average number of elk on native winter ranges
56

in the Gros Ventre drainage has decreased by over 50% in the last decade. From 2000-2004, an average of 1,160 elk utilized native winter ranges, whereas an average of 538 were found from 2010-2014. From 2000-2004, an average of 864 elk wintered in the Buffalo Valley and Spread Creek, whereas an average of 167 wintered from 2010-2014, an 80% reduction. During that time, the overall population has only decreased by 7%. Weather Spring and summer 2015 produced consistent moisture, leading to good forage production. Fall was relatively mild with no significant snowfall until mid-December. By early February, low elevation slopes were beginning to melt out. At the time of the mid-winter survey, winter precipitation was reported at 91% of normal in the Snake River Basin. Please refer to the following web sites for specific weather station data. http://www.wrds.uwyo.edu/wrds/nrcs/snowprec/snowprec.html and http://www.ncdc.noaa.gov/oa/climate/research/prelim/drought/pdiimage.html Habitat There are several established aspen transects on elk winter and transitional ranges in the Gros Ventre drainage, Buffalo Valley, and Blackrock areas. These transects have been monitored since the late 1970s. Data was collected on these transects in summers 2012 and 2013. The Red Rock Fire Ungulate Nutrition Project was initiated in 2012 in the Gros Ventre drainage. This is designed to be a long-term project to collect and analyze nutritional and mineral content of vegetation post-wildfire and evaluate the influence of fire severity on plant nutrition for ungulates. This project is scheduled to continue through at least 2016. There were no significant wildfires or prescribed burns in the herd unit in 2015. Please refer to the 2015 Annual Report Strategic Habitat Plan Accomplishments for Jackson Region habitat improvement project summaries (https://wgfd.wyo.gov/Habitat/Habitat-Plans/Strategic-Habitat-Plan-Annual-Reports). Field Data Postseason classification surveys were conducted February 5–10, 2016. A total of 10,668 elk were counted including 7,117 cows, 1,351 calves, 497 yearling bulls, and 1,703 adult bulls. The majority of elk were located on feedgrounds (81.5%; n=8,694), with only 18.5% on native winter ranges (n=1,974). Elk sightability from aircraft can range from 70-90% under good visibility and searching conditions (Coughenour & Singer 1996). To account for elk missed during the survey, we assumed a sightability rate of 80% of elk on native winter ranges. Therefore, we adjusted our native winter range count by an additional 533 elk. This number was added to the trend count to produce a population estimate of 11,200 elk. Herd unit ratios were 19 calves:100 cows, 31 adult males:100 cows, and 7 yearling males:100 cows. Approximately 68% of the herd (7,290) was counted on supplemental feed on the National Elk Refuge (NER), while 13% was split between the Fish Creek and Alkali feedgrounds in the Gros Ventre drainage (1,404). The 18.5% of the herd that was observed on native winter range was mostly in Hunt Area 80 to the east of the NER, native ranges on the NER, upper Gros Ventre drainage, Buffalo Valley, and Spread Creek areas. More elk were found on native winter
57

ranges and the Gros Ventre feedgrounds than in 2014. This is likely driven by an overall milder winter in 2015 with the first significant snowfall occurring in mid to late December compared to late November in 2014. There were 1,100 fewer elk on supplemental feed on the NER in 2015 compared to 2014 however numbers remain well above the 5,000 objective. Ratios on NER supplemental feed were 16 calves:100 cows, 25 mature bulls:100 cows, and 7 yearling bulls:100 cows. Staff at the NER estimated that refuge-wide herbaceous forage production was 17,750 tons in 2015, which is 22% above the 1998-2015 average. Relatively high forage production on NER was attributed to average total precipitation during the May through August growing season, plus irrigation system improvements. The WGFD and NER staff monitored forage and snow conditions on the NER from late December through January, and decided to initiate elk supplemental feeding on January 30, 2016. The average date of feeding initiation on the NER is January 28. Feeding occurred later than average this year due to high summer forage production on the NER, late elk and bison migrations and therefore minimal forage consumption in the fall, and snow conditions in January. Staff from NER and WGFD darted and GPS-collared 30 cow elk from the NER in March 2016. Collars will provide current movement and summer distribution data for these elk. Total elk wintering in the Gros Ventre drainage have been generally declining since 2004 (Fig. 1). The goal of wintering 3,500 elk in the Gros Ventre has not been met for the past 10 years. This is likely driven by early winter snowfall patterns and predation pressure. Supplemental feeding was initiated at Alkali Feedground in late November in an attempt to prevent elk from leaving the Gros Ventre drainage. However, a remote camera at the Red Hills documented at least 400 elk moving down-drainage in mid and late December (T. Zaffarano, Wyoming Cooperative Research Unit, pers. comm.). It is unknown where these elk ultimately wintered, but they will likely migrate back into the Gros Ventre for the summer and fall. Postseason calf:cow ratios were relatively high in the Gros Ventre in 2012 (25 calves:100 cows) and 2013 (22 calves:100 cows), but declined substantially in 2014 (12 calves:100 cows). This decline was likely in part due to a large number of elk leaving the Gros Ventre in 2014 and wintering on the NER. The calf:cow ratio improved in 2015 to 22 calves:100 cows. WGFD staff darted and GPS-collared 7 cow elk on the Fish Creek Feedground in February 2016. In addition, the Fish Creek Feedground elk trap was opened and utilized for the first time in 40 years. Fifty-eight elk were processed through the trap (see Appendix). A total of 8 GPS collars and VITs were deployed on elk in the Gros Ventre this winter. The WGFD hired a contractor to conduct a forward-looking infrared (FLIR) flight to count and classify resident elk in Hunt Area 78 and southern GTNP in October, 2015. Hunt Area 78 is predominantly private lands and had not been surveyed for over 5 years. The survey was flown using a fixed-wing aircraft at 2,500 feet above the ground along set transects. A total of 852 elk were counted in the survey area. The number of mature bulls counted was 122. Cow and calf classifications were unreliable due to the camera resolution quality and the relatively large body size of calves in October. This resident herd segment is growing at a rapid rate with high calf production and survival due to very low predation, high quality forage (irrigated agricultural lands), and relatively low harvest due to diverse private land ownership. Grand Teton National Park personnel flew preseason elk surveys in GTNP in August 2015. In GTNP, a total of 672 elk were classified in the Central Valley, Elk Ranch/Uhl Hill, and Willow Flats areas. Ratios were 33 calves:100 cows and 37 mature bulls:100 cows. Based on
58

pre-season surveys in GTNP and Hunt Area 78, hunting seasons in GTNP are warranted in 2016 to continue to curb the growth rate of the southern herd segment.
0500
100015002000250030003500400045005000
1990
1992
1994
1996
1998
2000
2002
2004
2006
2008
2010
2012
2014
Coun
t
Total Elk Wintering in Gros Ventre
Fig. 1. Total elk numbers in the Gros Ventre drainage (feedgrounds and native winter ranges) from 1990-2015. Dashed line indicates the goal of 3,500 elk wintering in the Gros Ventre. The continued high number of elk utilizing supplemental feed on the NER suggests that current management direction to maintain liberal seasons on antlerless elk from the southern herd segment is needed. At the same time, maintaining a conservative season structure for elk that migrate longer distances from the northern segments of the herd is important. Increasing harvest pressure on elk in southern GTNP, Hunt Area 80, and Hunt Area 78 will help achieve management goals for the herd. Harvest Data The 2015 harvest continued to focus hunting pressure on elk from southern herd segments with the majority of cow and calf harvest occurring in Hunt Area 77 (236 cows/calves), followed by Hunt Area 75 (154 cows/calves), and Hunt Area 78 (107 cows/calves). The majority of mature bull harvest occurred in Hunt Area 70 (202 bulls), followed by Hunt Area 81 (150 bulls). Total harvest was 1,169 elk, including 413 cows, 599 mature bulls, 6 yearling bulls, and 151 calves. Hunter numbers in 2015 decreased slightly from last year to 3,211, the second highest since 2009. Hunter success in the Jackson Herd was lower than in recent years at 37%. This is due to relatively high numbers of general license hunters using this area and mild weather during the hunting season, resulting in a late elk migration. Cow harvest in 2014 was the highest it has been since 2003. Cow harvest returned to more average levels in 2015. Recently, seasons have been structured to increase antlerless harvest in southern herd segments that have high calf production rates and contribute to high elk numbers on supplemental feed on the NER. The disparate cow harvest numbers between 2014 and 2015 highlight how weather and migration timing can greatly influence harvest success. While bull
59

harvest remained similar between the two years, cow and calf harvest was nearly double in 2014 (1,090 elk) compared to 2015 (564 elk). Of 10 radio-collared cow elk from the northern herd segment (southern Yellowstone and Teton Wilderness), none were harvested in 2015. This suggests that the current season structure is succeeding in targeting harvest on elk from the productive southern herd segments, while protecting elk from the declining northern herd segment. Total bull harvest has been declining in the Jackson herd since 2001. However, bull harvest the past three years has shown a promising upward trend. This year, 599 mature bulls were harvested, compared to 642 last year. Bull harvest remained relatively high this year despite a warm fall with late snowfall that allowed elk to remain at high elevations longer. The WGFD has made changes over the past decade to season length and established antlered only spikes excluded seasons in the Gros Ventre hunt areas beginning in 2007 (Areas 81, 82, 83) and the Teton Wilderness hunt areas in 2011 (Areas 70, 71) in an effort to improve yearling bull recruitment. Beginning in 2012, there has been no antlered elk harvest in GTNP. This year, the WGFD evaluated whether the spikes-excluded seasons that have been in effect for 9 years in the Gros Ventre and 5 years in the Teton Wilderness are resulting in increased spike to cow ratios. The analysis examined trends in spike ratios on a herd-wide basis and for the Gros Ventre separately. Elk from the Teton Wilderness hunt areas mix with elk on the NER in the winter, making it impossible to analyze that herd segment separately. Results show that spikes-excluded restrictions have not improved spike ratios either herd-wide or in the Gros Ventre (Figs. 2 & 3). Ratios herd-wide remained the same before and after implementation of spikes-excluded restrictions in the Gros Ventre and Teton Wilderness (Fig. 2). Gros Ventre spike ratios declined after implementation of spikes-excluded restrictions (Fig. 3). Therefore, according to postseason data, spikes-excluded restrictions are not resulting in desired improvements to spike recruitment. Spikes-excluded restrictions are supported by many members of the public. Therefore, managers are not proposing any changes to spikes-excluded restrictions for 2016, but will continue to monitor these trends over time.
2.0
3.0
4.0
5.0
6.0
7.0
8.0
9.0
10.0
Spike
s to
100
cow
s
Average Spike Ratios Pre and Post Spikes-Excluded Restrictions
PRE POST-GV POST-GV and TW1990-2006 2007-2010 2011-2015
Fig. 2. Average postseason spike to cow ratios in the Jackson Elk Herd before spikes-excluded restrictions (1990-2006), after restrictions in the Gros Ventre hunt areas went into effect (2007-2010), and after both the Gros Ventre and Teton Wilderness hunt areas went into effect (2011-2015). Error bars are ± 1 standard error.
60

2.0
3.0
4.0
5.0
6.0
7.0
8.0
9.0
10.0
Spike
s to
100
cow
s
Average Spike Ratios in the Gros Ventre Pre and Post Spikes-Excluded
PRE POST
1998-2006 2007-2015
Fig. 3. Average postseason spike to cow ratios in Gros Ventre herd segment before spikes-excluded restrictions (1998-2006) and after (2007-2015). Error bars are ± 1 standard error. Population The 2015 mid-winter trend count indicates that this population remained relatively stable near the population objective of 11,000. The majority of elk were located on feedgrounds (81.5%; n=8,694), with only 18.5% on native winter ranges (n=1,974). Elk sightability from aircraft can range from 70-90% under good visibility and searching conditions (Coughenour & Singer 1996). Therefore, it is expected that approximately 533 elk were likely not observed during the aerial surveys (80% sightability). The population estimate is rounded up to 11,200 elk to account for this. The calf ratio in 2015 was 19 calves:100 cows, which is the lowest since 2011 when it was 17.5 calves:100 cows. This ratio is similar to the 5-year average of 20.9 calves:100 cows. Managers will continue to structure hunting seasons to support calf survival in the long-distance migratory herd segments in the Teton Wilderness and Gros Ventre areas, while focusing harvest pressure on the increasing resident herd segments. Management Summary Hunting seasons in 2016 will again focus hunting pressure on southern resident elk that spend the summer along the Snake River corridor. Trend data indicate the Jackson Elk Herd has declined in recent years, but may now be stable and within 10% of the population objective. To prevent further declines in the Yellowstone and Teton Wilderness long-distance migratory segments, elk hunting seasons in Hunt Areas 70, 71, and 79 will remain relatively the same as 2015, closing October 31. This closure date is intended to remain the same in the future. This will encourage elk to stage in the Moran area and ensure that hunting pressure will not displace elk off transitional ranges. The northern portion of Area 80 will close November 13 to protect northern migrants while allowing hunters to access those areas where southern, resident elk are likely available to harvest. The rest of Area 80 will close November 30 to coincide with winter range closures on Bridger-Teton National Forest. Hunt Area 75 will remain open until December 11 and Hunt Area 77 until December 16 to allow for harvest of southern, resident elk as they move through the area. The Antelope Flats portion of Area 75 will remain open through
61

November 30 again this year. Area 78 will close on January 31. These later closing dates are designed to maintain hunting pressure on elk from southern GTNP and private lands along the Snake River that reproduce at a high rate. Type 4 licenses will be decreased in Area 75 by 25 licenses to maintain steady harvest. The Snake River Bottom portion of Area 75 will be closed to hunters again this year. Type 1 licenses in Area 78 will have an earlier opening date of August 15 match the opening date of Type 6 licenses and address elk damage on private lands. Bibliography Allred, W.J. 1950. Re-establishment of seasonal elk migration through transplanting. Transactions of the North American Wildlife Conference 15:597-611. Anderson, C.C. 1958. The elk of Jackson Hole. Bull. 10. Wyoming Game and Fish Commission. 184 pp. Bailey, J. R. 1999. A working model to assist in determining initiation of supplemental feeding of elk and a carrying capacity model for the National Elk Refuge, Jackson, Wyoming. M.S. Thesis. University of Wyoming. Laramie, Wyoming. 83pp. Barber-Meyer, S.M., L.D. Mech, and P.J. White. 2008. Elk calf survival and mortality following wolf restoration to Yellowstone National Park. Wildlife Monographs 169:1-30. Barbknecht, A.E., W.S. Fairbanks, E.J. Maichak, J.D. Rogerson, and B. Scurlock. 2008. Elk parturition site selection at local and landscape scale in western Wyoming. M. S. Thesis, Iowa State University, Ames, IA. 97pp Boyce, M.S. 1989. The Jackson herd: intensive wildlife management in North America. Cambridge University Press, Cambridge, United Kingdom. Casebeer, R.L. 1960. A preliminary chronology and bibliography on the Jackson Hole elk herd and closely related materials. Special Report by USFS, Jackson WY.16pp. Cole, G.F. 1969. The elk of Grand Teton and southern Yellowstone National Parks. National Park Service Res. Rpt. GRTE – N – 1. Washington, D. C. 80pp. Cole, E.K., A.M. Foley, J.M. Warren, B.L. Smith, S.R. Dewey, D.G. Brimeyer, W.S. Fairbanks, H. Sawyer, and P.C. Cross. 2015. Changing migratory patterns in the Jackson Elk Herd. Journal of Wildlife Management 79:877-886. Coughenour, M.B. and F.J. Singer. 1996. Elk population processes in Yellowstone National Park under the policy of natural regulation. Ecological Applications 6: 573-593. Craighead, J .J. 1952. A biological and economic appraisal of the Jackson Hole elk herd. New York Zoological Society, New York, NY. Cromley, C.M. 2000. Historical Elk Migrations Around Jackson Hole, Wyoming. In “Developing Sustainable Management Policy for the National Elk Refuge, Wyoming. Yale School of Forestry and Environmental Studies. Bull. No. 104. pp. 53-65.
62

Cross, P. C., W. H. Edwards, B. M. Scurlock, E. J. Maichak, and J. D. Rogerson. 2007. Effects of management and climate on elk brucellosis in the Greater Yellowstone Ecosystem. Ecological Applications 17: 957-964. Foley, A.M., P.C. Cross, D.A. Christianson, B.M. Scurlock, and S. Creel. 2015. Influences of supplemental feeding on winter elk calf:cow ratios in the southern Greater Yellowstone Ecosystem. Journal of Wildlife Management 79:887-897. Hobbs, N. T., G. Wockner, and F. J. Singer. 2003. Assessing management Alternatives for ungulates in the Greater Teton Ecosystem using simulation modeling. Natural Resources Ecology Laboratory, Fort Collins, CO., 63pp.
Houston, D.B. 1982. The Northern Yellowstone elk. Macmillan Publishing, New York, New York, USA.
Kamath, P.L., Foster, J.T., Drees, K.P., Luikart, G., Quance, C., Anderson, N.J., Clarke, P.R., Cole, E.K., Drew, M.L., Edwards, W.H., Rhyan, J.C., Treanor, J.J., Wallen, R.L., White, P.J., Robbe-Austerman, S., and P.C. Cross. 2016. Genomics reveals historic and contemporary transmission dynamics of a bacterial disease among wildlife and livestock. Nature Communications.
Middleton, A.D., Morrison, T.A., Fortin, J.K., Robbins, C.T., Proffitt, K.M., White, P.J., McWhirter, D.E., Koel, T.M., Brimeyer, D.G., Fairbanks, W.S., and M.J. Kauffman. 2013. Grizzly bear predation links the loss of native trout to the demography of migratory elk in Yellowstone. Proc R Soc B 280: 20130870. http://dx.doi.org/10.1098/rspb.2013.0870 Monello, R.J., J.G. Powers, N.T. Hobbs, T.R. Spraker, K.I. O’Rourke, and M.A. Wild. 2013. Efficacy of antemortem rectal biopsies to diagnose and estimate prevalence of chronic wasting disease in free-ranging cow elk (Cervus elaphus nelsoni). Journal of Wildlife Diseases 49(2):270-278. Monello, R.J., J.G. Powers, N.T. Hobbs, T.R. Spraker, M.K. Watry, and M.A. Wild. 2014 Survival and population growth of a free-ranging elk population with a long history of exposure to chronic wasting disease. Journal of Wildlife Management 78(2):214-223. Murie, O.J. 1945. Our big game in winter. Transactions of the North America Wildlife Conference 9:173-176. Murie, O.J. 1951. The Elk of North America. Stackpole Books, Harrisburg, PA. National Elk Refuge and Grand Teton National Park. 2007. Final Bison and Elk Management Plan and Environmental Impact Statement for the National Elk Refuge/Grand Teton National Park/John D. Rockefeller, Jr., Memorial Parkway. U.S. Fish and Wildlife Service, Region 6, Denver, CO. 605 pp. http://www.fws.gov/bisonandelkplan North, D. 1990. The Buffalo Valley elk enhancement project, 1990 annual report. Wyoming Game and Fish Department. Cheyenne, Wyoming, USA.
63

Preble, E.A. 1911. Report on Conditions of elk in Jackson Hole, Wyoming, in 1911. U.S.D.A. Biol. Bull. 40, 23 pp. Scurlock, B.M. and H.E. Edwards. 2010. Status of Brucellosis in Free-Ranging Elk and Bison in Wyoming. Journal of Wildlife Diseases. 46 (2): 442-449. Sheldon, C. 1927. The conservation of the elk of Jackson Hole, Wyoming. A report to Honorable Dwight F. Davis, Secretary of War, Chairman of the President’s Committee on Outdoor Recreation, and Honorable Frank C. Emerson, Governor of Wyoming. Washington, D.C. 36 pp. Singer, F.J. and L.C. Zeigenfuss. 2003. A survey of willow communities, willow stature and production, and correlations to ungulate consumption and density in the Jackson valley and the National Elk Refuge. USDI, Geological Survey, Biological Resources Division, Fort Collins, CO. Unpublished report.
Smith, B.L. and R.L. Robbins. 1994. Migrations and management of the Jackson elk herd. National Biological Survey Resource Publication 199, Washington, D.C., USA.
Smith, B.L. and S.H. Anderson. 1996. Patterns of neonatal mortality of elk in northwestern Wyoming. Canadian Journal of Zoology. 74:1229–1237.
Smith, B.L., R.L. Robbins, and S.H. Anderson. 1997. Early development of supplementally fed, free-ranging elk. Journal of Wildlife Management. 61:26–38.
Smith, B.L. 2001. Winter feeding of elk in western North America. Journal of Wildlife Management 65: 173-190.
Smith B.L., and T.L. McDonald. 2002. Criteria for improving field classification of antlerless elk. Wildlife Society Bulletin. 30:200–207.
Smith, B., E. Cole, and D. Dobkin. 2004. Imperfect pasture: a century of change at the National Elk Refuge in Jackson Hole, Wyoming. Grand Teton Natural History Association, Moose, WY. 156 pp. Thorne E. T., J. K. Morton, and W. C. Ray. 1979. Brucellosis, its effect and impact on elk in western Wyoming. Pages 212-220 in M. S. Boyce and L. O. Hayden-Wing editors. North American elk: ecology, behavior, and management. University of Wyoming, Laramie, WY, USA. Thorne, E. T., T. J. Walthall, and H. A. Dawson. 1981. Vaccination of elk with strain 19. Proceedings of the United States Animal Health Association 82:359-374. Wachob, D. and C. Smith 2003. Elk migration through a human dominated landscape in Jackson Hole, Wyoming. Final report. Williams, A.L., T.J. Kreeger, and B.A. Schumaker. 2014. Chronic wasting disease model of genetic selection favoring prolonged survival in Rocky Mountain elk (Cervus elaphus). Ecosphere 5(5):1-10.
64

Wyoming Game and Fish Department. 2006. Evaluation of a proposal from the Wyoming Outdoor Council, Greater Yellowstone Coalition, and Jackson Hole Conservation Alliance for a phase out of elk feeding in the Gros Ventre. Unpublished report. 37 pp. Wyoming Game and Fish Department. 2007. Jackson Elk Herd Unit Brucellosis Management Action Plan. https://wgfd.wyo.gov/Wildlife-in-Wyoming/More-Wildlife/Wildlife-Disease/Brucellosis/Brucellosis-Reports. 118 pp.
65

Appendix I
FEEDGROUND BRUCELLOSIS SURVEILLANCE/RESEARCH
Gros Ventre Feedgrounds On January 16, 2016, 58 elk were captured in the corral trap, and on February 13th, an additional 7 adult female elk were chemically immobilized at Fish Creek feedground (Table 1). A total of 31 yearling and older cows were bled for brucellosis diagnosis, pregnancy status, and to establish the base-rate of polymorphisms in the prion protein gene associated with susceptibility and progression of chronic wasting disease infection. The corral trap capture marked the first time that the Fish Creek trap had been operated in exactly 40 years! Totals of 8 GPS collars and VITs were deployed on elk captured at Fish Creek this winter.
Table 1. Eartag information for elk captured at Fish Creek feedground during winter 2016.
Ear Tag UID Capture
Date Sex Age
Class Age Est
Visibility Collar Color
VIS Collar
GV0611 13689 1/16/2016 Female Adult 2-5 Red H3
GV0609 13685 1/16/2016 Female Adult 2-5 Red H7
GV0485 13692 1/16/2016 Female Adult 2-5 Red I0
GV0637 13691 1/16/2016 Female Juvenile 0 Red NONE
GV0636 13691 1/16/2016 Female Juvenile 0 Red NONE
GV0664 13690 1/16/2016 Female Adult 2-5 Red H2
GV0613 13693 1/16/2016 Female Adult >=10 Red H4
GV0612 13689 1/16/2016 Female Adult 2-5 Red H3
GV0614 13693 1/16/2016 Female Adult >=10 Red H4
GV0486 13688 1/16/2016 Female Adult 6-9 Red NONE
GV0634 13687 1/16/2016 Female Adult 6-9 Red C1
GV0635 13687 1/16/2016 Female Adult 6-9 Red C1
GV0663 13686 1/16/2016 Female Adult >=10 Red H5
66

GV0662 13686 1/16/2016 Female Adult >=10 Red H5
GV0601 13669 1/16/2016 Female Adult 2-5 Red H8
GV0665 13690 1/16/2016 Female Adult 2-5 Red H2
GV0617 13697 1/16/2016 Female Juvenile 0 Red NONE
GV0692 13699 1/16/2016 Male Juvenile 0 Red NONE
GV0690 13699 1/16/2016 Male Juvenile 0 Red NONE
GV0640 13698 1/16/2016 Male Juvenile 0 Red NONE
GV0641 13698 1/16/2016 Male Juvenile 0 Red NONE
G8428 13150 1/16/2016 Female Adult 2-5 Red H0
GV0487 13692 1/16/2016 Female Adult 2-5 Red I0
GV0618 13697 1/16/2016 Female Juvenile 0 Red NONE
GV0682 13684 1/16/2016 Male Juvenile 0 Red NONE
GV0689 13696 1/16/2016 Female Adult 2-5 Red B7
GV0688 13696 1/16/2016 Female Adult 2-5 Red B7
GV0639 13695 1/16/2016 Female Juvenile 0 Red NONE
GV0638 13695 1/16/2016 Female Juvenile 0 Red NONE
GV0667 13694 1/16/2016 Male Juvenile 0 Red NONE
GV0666 13694 1/16/2016 Male Juvenile 0 Red NONE
G8429 13150 1/16/2016 Female Adult 2-5 Red H0
GV0677 13672 1/16/2016 Female Yearling 1 Red I2
GV0610 13685 1/16/2016 Female Adult 2-5 Red H7
GV0629 13675 1/16/2016 Female Adult >=10 Red I5
67

GV0628 13675 1/16/2016 Female Adult >=10 Red I5
GV0656 13674 1/16/2016 Female Adult 2-5 Red I3
GV0657 13674 1/16/2016 Female Adult 2-5 Red I3
GV0678 13676 1/16/2016 Female Adult >=10 Red I1
GV0603 13673 1/16/2016 Female Adult 6-9 Red H9
GV0605 13677 1/16/2016 Male Yearling 1 Red NONE
GV0676 13672 1/16/2016 Female Yearling 1 Red I2
GV0626 13671 1/16/2016 Female Yearling 1 Red I6
GV0627 13671 1/16/2016 Female Yearling 1 Red I6
GV0654 13670 1/16/2016 Female Adult 2-5 Red I4
GV0653 13670 1/16/2016 Female Adult 2-5 Red I4
GV0602 13669 1/16/2016 Female Adult 2-5 Red H8
GV0604 13673 1/16/2016 Female Adult 6-9 Red H9
GV0631 13680 1/16/2016 Male Juvenile 0 Red NONE
GV0683 13684 1/16/2016 Male Juvenile 0 Red NONE
GV0633 13683 1/16/2016 Female Juvenile 0 Red NONE
GV0632 13683 1/16/2016 Female Juvenile 0 Red NONE
GV0661 13682 1/16/2016 Male Juvenile 0 Red NONE
GV0660 13682 1/16/2016 Male Juvenile 0 Red NONE
GV0679 13676 1/16/2016 Female Adult >=10 Red I1
GV0607 13681 1/16/2016 Female Adult >=10 Red H6
GV0620 13701 1/16/2016 Female Adult >=10 Red D7
68

GV0630 13680 1/16/2016 Male Juvenile 0 Red NONE
GV0680 13679 1/16/2016 Male Yearling 1 Red NONE
GV0681 13679 1/16/2016 Male Yearling 1 Red NONE
GV0659 13678 1/16/2016 Male Yearling 1 Red NONE
GV0658 13678 1/16/2016 Male Yearling 1 Red NONE
GV0606 13677 1/16/2016 Male Yearling 1 Red NONE
GV0608 13681 1/16/2016 Female Adult >=10 Red H6
GV0670 13719 1/16/2016 Male Yearling 1 Red NONE
GV0615 13700 1/16/2016 Female Adult >=10 Red C0
GV0128 13722 1/16/2016 Male Juvenile 0 Red NONE
GV0127 13722 1/16/2016 Male Juvenile 0 Red NONE
GV0104 13721 1/16/2016 Male Juvenile 0 Red NONE
GV0103 13721 1/16/2016 Male Juvenile 0 Red NONE
GV0077 13723 1/16/2016 Female Juvenile 0 Red NONE
GV0151 13720 1/16/2016 Female Yearling 1 Red D6
GV0078 13724 1/16/2016 Male Juvenile 0 Red NONE
GV0699 13719 1/16/2016 Male Yearling 1 Red NONE
GV0126 13718 1/16/2016 Female Juvenile 0 Red NONE
GV0650 13718 1/16/2016 Female Juvenile 0 Red NONE
GV0102 13717 1/16/2016 Male Juvenile 0 Red NONE
GV0101 13717 1/16/2016 Male Juvenile 0 Red NONE
GV0156 13716 1/16/2016 Female Juvenile 0 Red NONE
69

GV0152 13720 1/16/2016 Female Yearling 1 Red D6
GV0076 13723 1/16/2016 Female Juvenile 0 Red NONE
GV0697 13715 1/16/2016 Female Juvenile 0 Red NONE
GV0079 13724 1/16/2016 Male Juvenile 0 Red NONE
GV0030 13294 1/16/2016 Female Adult 2-5 Red D9
GV0645 13706 1/16/2016 Male Juvenile 0 Red NONE
GV0644 13706 1/16/2016 Male Juvenile 0 Red NONE
GV0671 13705 1/16/2016 Female Adult 2-5 Red D8
GV0670 13705 1/16/2016 Female Adult 2-5 Red D8
GV0623 13704 1/16/2016 Female Juvenile 0 Red NONE
GV0155 13716 1/16/2016 Female Juvenile 0 Red NONE
GV0029 13294 1/16/2016 Female Adult 2-5 Red D9
GV0625 13708 1/16/2016 Female Adult >=10 Red D5
GV0642 13703 1/16/2016 Female Adult 2-5 Red H1
GV0643 13703 1/16/2016 Female Adult 2-5 Red H1
GV0669 13702 1/16/2016 Female Adult 2-5 Red B0
GV0668 13702 1/16/2016 Female Adult 2-5 Red B0
GV0621 13701 1/16/2016 Female Adult >=10 Red D7
GV0622 13704 1/16/2016 Female Juvenile 0 Red NONE
GV0695 13711 1/16/2016 Female Juvenile 0 Red NONE
GV0619 13700 1/16/2016 Female Adult >=10 Red C0
GV0649 13714 1/16/2016 Female Adult 6-9 Red D1
70

GV0648 13714 1/16/2016 Female Adult 6-9 Red D1
GV0675 13713 1/16/2016 Male Juvenile 0 Red NONE
GV0674 13713 1/16/2016 Male Juvenile 0 Red NONE
GV0154 13712 1/16/2016 Female Juvenile 0 Red NONE
GV0693 13707 1/16/2016 Male Juvenile 0 Red NONE
GV0696 13711 1/16/2016 Female Juvenile 0 Red NONE
GV0694 13707 1/16/2016 Male Juvenile 0 Red NONE
GV0647 13710 1/16/2016 Male Juvenile 0 Red NONE
GV0646 13710 1/16/2016 Male Juvenile 0 Red NONE
GV0673 13709 1/16/2016 Female Adult 2-5 Red D2
GV0672 13709 1/16/2016 Female Adult 2-5 Red D2
GV0624 13708 1/16/2016 Female Adult >=10 Red D5
GV0698 13715 1/16/2016 Female Juvenile 0 Red NONE
GV0153 13712 1/16/2016 Female Juvenile 0 Red NONE
GV0083 14012 2/13/2016 Female Adult >=10 Red D4
GV0080 14016 2/13/2016 Female Adult 6-9 Red D3
GV0087 14015 2/13/2016 Female Adult >=10 Red G0
GV0086 14015 2/13/2016 Female Adult >=10 Red G0
GV0099 14014 2/13/2016 Female Adult 2-5 Red F1
GV0098 14014 2/13/2016 Female Adult 2-5 Red F1
GV0501 14013 2/13/2016 Female Adult >=10 Red G1
GV0082 14012 2/13/2016 Female Adult >=10 Red D4
71

GV0669 13702 2/13/2016 Female Adult 6-9 Red B0
GV0668 13702 2/13/2016 Female Adult 6-9 Red B0
GV0100 14011 2/13/2016 Female Adult 6-9 Red F5
GV0503 14011 2/13/2016 Female Adult 6-9 Red F5
GV0502 14013 2/13/2016 Female Adult >=10 Red G1
GV0081 14016 2/13/2016 Female Adult 6-9 Red D3 VIT and GPS collar data have been collected in the Gros Ventre since 2010 as part of an effort to analyze relationships between serostatus and elk movements, define brucellosis transmission risk areas, determine parturition locations and investigate elk use of habitat treatments. Collar data from Gros Ventre elk will be compared to elk on other feedgrounds for determining effects of feedground practices and feeding season length. The Safari Club International funded a portion of the collar costs in 2010-2013, and North Wind Inc. provided the seven collars deployed in 2014 (mortality collars from a separate project in southwestern Sublette Co., WY with a year of battery life remaining). TARGET FEEDGROUND MANAGEMENT Brucella abortus strain 19 ballistic elk vaccination was discontinued this year due to a lack of efficacy observed over the course of the 30-year effort, and the inability to procure the necessary vaccination supplies due to the sole provider closing its manufacturing facility. Thus, the primary brucellosis management tools now employed are low-density (LD) feeding and early end-date of feeding on select, target feedgrounds where a high opportunity exists to conduct these measures (i.e., large feeding areas and long distance away from cattle operations). LD feeding methods are used on the feedgrounds in the Gros Ventre as conditions allow; there is not enough space to allow this method of feeding to occur at the Patrol Cabin feedground when all the elk are present there. None of the feedgrounds in this elk herd are managed for early end dates, due to the close proximity of susceptible cattle and private lands and the perception that elk may leave the feedgrounds in the Gros Ventre and move to the NER if feeding ends early. CHRONIC WASTING DISEASE SURVEILLANCE The National Elk Refuge (NER) provided funds to the Wyoming Game and Fish Department (WGFD) to support Chronic Wasting Disease (CWD) surveillance in the Jackson elk herd and adjacent elk, deer, and moose herds during the 2015 hunting seasons. The funding was used to hire two temporary CWD technicians, one employed with the WGFD, and one employed by the National Elk Refuge from mid-September through December 2015. The WGFD technician logged 800 hours and 10,000 miles, mostly while conducting field contacts with hunters and pulling samples (medial retropharyngeal lymph nodes) from carcasses. The highest yielding
72

method of collecting elk samples for subsequent CWD testing in the Jackson region comes from hunter contacts in the field, especially those within Grand Teton National Park (GTNP) and the NER. Hunter contacts are made throughout the fall in an effort to increase sample size and participation, and to educate hunters on CWD. NER parking areas and highly used locations in GTNP, such as the Kelly Hayfields and Blacktail Butte, are reliable places to make hunter contacts and collect samples. Frequent communication among NER law enforcement, elk retrieval operators and other WGFD personnel is essential for locating successful hunters soon after they’ve harvested their elk. Successful hunters whose animals are not sampled in the field are requested to deposit heads with attached harvest information in bear-proof containers placed at Moose and Moran Junctions within GTNP in the same locations as the tooth and permit drops. Another container is stationed at Kelly Warm Springs, mostly for use by hunters returning from the Gros Ventre drainage, and more head-drop containers are placed at three of the hunter parking areas on the NER. An additional collection barrel was located at the WGFD office in Jackson. Many samples were obtained though the cooperation of the local game meat processor (Matts Meats – Jackson and Hog Island Meats in both Jackson and Pinedale). Processor employees save heads along with harvest date, location, and hunter contact information, which are retrieved by CWD technicians daily. CWD samples are also collected from road-killed and “targeted” (euthanized due to illness) animals throughout the year. In addition, GTNP personnel make a concerted effort to sample from road-killed animals within the Park. The WGFD collected and tested a total of 376 lymph nodes from 320 elk, 48 deer, and 8 moose for CWD within the Department’s Jackson region during the 2015 hunting seasons. No positive samples were detected. Table 1. CWD samples collected from elk within the Jackson elk herd by year, with corresponding population and harvest estimates. Year Sample
Size Population Estimate
% of Est. Pop Sampled
# Harvested
% of Harvest Sampled
1997 243 16463 1.48% 3290 7.39% 1998 317 17641 1.80% 3159 10.03% 2000 197 16385 1.20% 2350 8.38% 2002 234 13457 1.74% 2253 10.39% 2004 187 12610 1.48% 1818 10.29% 2005 189 12855 1.47% 1776 10.64% 2006 184 12904 1.43% 1678 10.97% 2007 116 12795 0.91% 1689 6.87% 2008 301 12935 2.33% 1316 22.87% 2009 434 13349 3.25% 1486 29.21% 2010 414 11976 3.46% 1414 29.28% 2011 275 11962 2.30% 1146 24.00% 2012 241 11051 2.18% 1037 23.24% 2013 300 11423 2.63% 1437 20.88% 2014 247 11000 2.25% 1768 13.97% 2015 301 11200 2.69% 1183 25.44%
73

1
JACKSON ELK HERD UNIT POPULATION OBJECTIVE REVIEW
2016 Prepared by: Alyson Courtemanch, North Jackson Wildlife Biologist Management Evaluation Current Post-Season Population Objective: 11,000 Proposed Mid-Winter Trend Count Objective: 11,000 Management Strategy: Recreational The Jackson Elk Herd covers 2,100 square miles north of the Town of Jackson, and resides on Bridger-Teton National Forest (BTNF), Grand Teton National Park (GTNP), the National Elk Refuge (NER), and private lands (Fig. 1). Approximately 200 square miles of the area is considered winter range. This herd unit includes Hunt Areas 70 – 72, 75, and 77-83. The herd unit is comprised of approximately 97% public land, including the Gros Ventre Wilderness and Teton Wilderness. The herd includes long-distance migratory segments that travel up to 60 miles between their winter and summer ranges and more resident segments that travel 5-10 miles between seasonal ranges. Management of this herd is complicated and involves a high degree of interagency coordination.
Fig. 1. Map of the Jackson Elk Herd Unit (orange shading) with hunt areas.
74

2
Population Objective Review Background For over 100 years, elk management and the number of elk in Jackson Hole have been controversial topics and attracted a high level of public interest. The first settlers arrived in Jackson Hole in the 1880s. At that time, it was estimated there were 15,000-25,000 elk in the Jackson Herd, which included the Hoback River drainage that is part of the Fall Creek Herd today (Cole 1969). Preble (1911) estimated that 20,000 elk summered north of Jackson, including 8,000 between the Gros Ventre and Buffalo Fork River and another 12,000 north of the Buffalo Fork and into southern Yellowstone National Park. Others speculated that the majority of the elk migrated out of Jackson Hole and wintered in the Green River Basin, Little Colorado Desert, and Red Desert (Murie 1945, Craighead 1952, Casebeer 1960, Cromley 2000). While it is likely that a segment of the herd spent the winter in Jackson Hole, wintering numbers were undocumented (Murie 1951). By 1895, market and “tusk” hunting (for elk upper canine “ivory” teeth), barbed wire fences, and retaliation for livestock conflicts had decimated elk migrations out of Jackson Hole (Smith et al. 2004). It was thought that by 1917, the majority of long-distance elk migrations out of Jackson Hole had disappeared (Allred 1950). Permanent settlement in Jackson Hole was relatively rapid; the human population grew from 638 in 1900 to 1,500 by 1909 (Smith et al. 2004). With increasing settlement came livestock, buildings, extensive barbed wire fences, and the conversion of elk winter ranges to livestock pasture and hayfields. Homesteaders replaced native grasses and shrubs with smooth brome, timothy, and alfalfa grasses for hay and cultivated barley and oats for grain (Smith et al. 2004). Much of the limited elk winter range was converted to non-native grasses and either consumed by livestock in the summer or cut and stored as hay. At the same time, large scale reduction of large carnivores and improved law enforcement and hunting regulations bolstered the elk population. The Teton Game Preserve (covering most of today’s Teton Wilderness) was established by the State of Wyoming in 1905 and closed to hunting to increase elk numbers (Smith et al. 2004). These changes, coupled with diminished winter ranges, loss of migration routes out of Jackson Hole, and periodic, severe winters caused high winter elk mortality in the late 1800s and early 1990s (Craighead 1952). The recognition of this emerging problem led the early residents of Jackson Hole to petition Congress for a solution. In 1912, Congress appropriated $50,000 for purchase of private lands to start the “Winter Elk Refuge” (Smith et al. 2004). Private lands were slowly purchased and incorporated into the Elk Refuge and by 1949, it totaled 23,000 acres. Winter feeding on the NER stabilized elk population numbers by reducing winter mortality (Smith & Robbins 1994). Population goals for the Jackson Elk Herd were as high as 20,000 from 1927-1944 (Smith et al. 2004). However, by the 1940s and 1950s, multiple people expressed concern that too many elk were causing habitat degradation (Murie 1945, Craighead 1952). In 1942, approximately 11,000 elk were wintering on or adjacent to the NER. At that time, the Wyoming Game and Fish Department (WGFD) and U.S. Fish and Wildlife Service (USFWS) agreed to reduce winter elk numbers on the NER to 6,000-7,000 through legal hunting (Smith et al. 2004). In 1950, a U.S. Forest Service survey found that 75% of winter ranges in Jackson Hole and 67% in the Gros Ventre drainage were in poor or depleted condition (Craighead 1952, Casebeer 1960). Craighead
75

3
(1952) found that the current population of 17,000 elk was twice as large as what winter habitat could support and recommended the herd be reduced to 8,000-9,000 elk. In 1929, GTNP was established but only included lands west of the Snake River. At this time, NER staff were cutting and baling hay on the Kelly Hayfields and Elk Ranch to feed elk in the winter, along with hay produced on the NER. In 1950, GTNP was expanded to include most of the sagebrush-grassland areas and livestock pasture/hayfields east of the Snake River, which was known as the Central Valley. This appears to have resulted in a surge in the elk population as grasslands that were formerly fenced and hayed now provided spring, summer, and fall forage for elk and other wildlife (Cole 1969, Boyce 1989). The expansion of GTNP was surrounded by much public debate and opposition from the WGFD, which centered on the management of the Jackson Elk Herd (Boyce 1989). The WGFD was concerned that without hunting in that area, management of the Jackson Elk Herd would become untenable. As a compromise, Public Law 81-787 was created by Congress, which allows controlled elk hunting in a portion of GTNP by hunters licensed by the State of Wyoming and deputized by the Secretary of the Interior. A great deal of disagreement arose between the WGFD, National Park Service (NPS), and USFWS by the early 1970s with regard to the management of the elk herd. As a result, a Cooperative Agreement between the WGFD and USFWS was developed in 1974 which described and delineated various responsibilities regarding management of elk on the NER. This agreement set a maximum of 7,500 elk wintering on the NER (68% of herd). By the next winter, numbers rose to 8,373 elk on and adjacent to the NER and again the agencies disagreed on the number in the Cooperative Agreement. Agency personnel then proposed the number be changed from a maximum to a five-year average. This was never officially adopted but was mutually understood that we were using an average of 7,500 elk (Wilbrecht 1984). Up until 1978, elk numbers were managed around feedground quotas in the herd unit including 7,500 on the NER, 2,400 on the Gros Ventre feedgrounds, and 2,000 on native winter ranges for a total of 11,900 elk. From 1978-1980 the population objective was decreased to 11,250 because elk numbers were low on the NER. Prior to 1987, elk were counted from the ground on the feedgrounds and from fixed-wing aircraft on native winter ranges. After 1987, helicopter surveys were implemented on native winter ranges. From 1981-1982, the population objective for the herd was 12,000 elk (WGFD 1981, WGFD 1982). In 1983, a new objective was set at 11,250. At the time only 5,000 elk wintered on the NER and the population was estimated at 8,000 elk based on a fixed wing aircraft survey that counted 7,665 elk. A formal Herd Unit objective was set in 1986 at 11,029 elk. The new objective included quotas of 800 elk on the Alkali Feedground, 1,000 elk on the Fish Creek Feedground, 620 elk on the Patrol Cabin Feedground, 7,500 elk on the NER, and 10% or 1,109 on native winter ranges. In 1986, personnel counted 11,276 elk and estimated the population at 11,800 elk. The public still perceived elk numbers to be too low and wanted conservative hunting seasons. As a result, conservative seasons were in place through 1988. By 1988, 14,919 elk were counted on feedgrounds and with a helicopter and the population was estimated at 15,500 elk.
76

4
Herd segments and seasonal migrations
Management of the Jackson Elk Herd is complicated and challenging because various herd segments utilize GTNP, BTNF, the NER, and private lands over the course of a year. The Jackson Elk Herd is comprised of three major summer segments: 1) Yellowstone/Teton Wilderness, 2) Gros Ventre, and 3) Grand Teton National Park/Snake River Bottom. The majority of elk that summer in Yellowstone/Teton Wilderness migrate long distances (up to 60 miles) to the NER to spend the winter (Fig. 2), but a small percentage also remains on native winter ranges in the Buffalo Valley/Spread Creek area. Elk that summer in the high elevations of the Gros Ventre drainage generally migrate to Gros Ventre feedgrounds and native winter ranges (Fig. 2), although it has become increasingly common for some Gros Ventre elk to spend the winter on the NER. Elk that summer in GTNP and on private lands in the Snake River Bottom close to the Town of Jackson migrate shorter distances to the NER to winter.
Smith & Robbins (1994) found that of 85 adult elk captured and radio-collared on the NER from 1978-1982, 40% summered in Yellowstone/Teton Wilderness, 12% in the Gros Ventre drainage, and 48% in GTNP (with 10% migrating to southern GTNP). Fidelity to summer ranges was extremely high at 98%. More recent work by Cole et al. (2015) found that now only 10% of radio-collared elk migrate to Yellowstone/Teton Wilderness, while 40% migrate to southern GTNP/Snake River Bottom. These findings indicate that the proportion of short-distance migrants in the herd has increased while long-distance migrants have declined. Differences in calf recruitment is the driving factor behind these recent changes, likely caused by varying elk calf predator densities and habitat conditions (Barber-Meyer et al. 2008, Middleton et al. 2013, Cole et al. 2015). In addition, elk from Yellowstone/Teton Wilderness that winter in the Buffalo Valley and northern GTNP experience winter wolf predation (Stephenson et al. 2012). Stephenson et al. (2012) found that over three winters (2010-2012), wolves preyed primarily on elk (66%) and moose (32%) in this area. In winter 2012, adult bulls comprised 45% of elk kills along with 23% cows, 14% yearlings, and 18% calves (Stephenson et al. 2012). Hunting seasons in recent years have been structured to reduce harvest pressure on cows and calves in the Yellowstone/Teton Wilderness and Gros Ventre herd segments while maintaining pressure on the growing herd segment of short-distance migrants in southern GTNP/Snake River Bottom.
Habitat
As evidenced by relatively high winter elk mortality during some years prior to the establishment of feedgrounds, Jackson Hole is a difficult place for elk to spend the winter. While some winters can be mild with little snowfall, other winters can produce deep, crusted snow that persists for much of the season. Snow crust or hardness affect forage availability to elk based on a function of snow depth (Bailey 1999). With no crust and low density, snow depth begins to affect elk foraging efficiency at 10 cm, but elk have been observed using areas with snow depths of 60-115 cm (Bailey 1999). Several studies have attempted to evaluate winter carrying capacities under different habitat and weather conditions for all or portions of the Jackson Elk Herd (Bailey 1999, Hobbs et al. 2003, WGFD 2006). Bailey (1999) estimated that the winter carrying capacity on the NER ranged from 4,500-8,300 elk based on average winters and least and most productive forage years. Hobbs et al. (2003) estimated the equilibrium point between forage supply and
77

5
demand for the entire Jackson Elk Herd, instead of carrying capacity. During normal winters following average growing seasons, approximately 16,000 elk could be sustained, with 5,000 on the NER. However, during severe winters following average growing seasons, only approximately 1,000 elk could be sustained. These numbers are not starvation thresholds, but instead an indication of how many elk could be supported without a high potential for conflict such as elk raiding livestock feedlines, hay stacks, and/or private landscaping. The WGFD has partnered with BTNF, GTNP, and multiple funding partners such as the Rocky Mountain Elk Foundation and Wyoming Wildlife and Natural Resources Trust to implement elk habitat improvement projects. Since the 1970s, thousands of acres of elk winter, transitional, and summer ranges have been improved through prescribed burning. Managers have spent considerable effort and funds treating aspen stands in the Gros Ventre drainage and in the Buffalo Valley area to improve elk winter range. In addition, the WGFD supports BTNF in managing natural wildfires in Wilderness areas to improve forest structural and age class diversity on the landscape.
Fig. 2. Crucial winter ranges (purple polygons) in the Jackson Elk Herd. Feedgrounds (orange stars) are located in the Gros Ventre drainage and NER.
78

6
Feedgrounds Winter elk feeding was initiated on the NER in 1912. Winter feeding in the Gros Ventre drainage was done on an emergency basis by local ranchers or the WGFD until the 1950s when the state-operated Alkali, Patrol Cabin, and Fish Creek feedgrounds were established (Anderson 1958) (Fig. 2). Few details are known about the actual feeding of elk in the Gros Ventre prior to 1949. It appears that efforts to prevent starvation were mostly “token” and were not always successful. Anderson (1958) stated that feeding in the Gros Ventre was done on an emergency basis and the number fed remained small until 1956. Elk have also been fed in various temporary locations over the years to address comingling with livestock and damage concerns, including many years in the Buffalo Valley. Historically, the Blackrock feedground, located in the Buffalo Valley, was used on an annual basis beginning in the early 1930s. It was moved several times and was finally terminated in 1971 (North 1990, WGFD 1991). Feeding was discontinued in an effort to compel the elk into using the larger feedgrounds of the Gros Ventre and NER instead. However, chronic elk and livestock comingling issues persist in the Buffalo Valley and have resulted in emergency elk feeding taking place during many years. The State of Wyoming passed a crop damage law in 1937 that allowed landowners to submit claims for reimbursement from big game damage on their property. In addition, WGFD is committed to preventing elk/livestock comingling, particularly during winter and early spring when the majority of brucellosis-induced abortion events occur and the risk of interspecific transmission is highest. Feedgrounds act as a tool to keep elk spatially segregated from livestock, hay, and private property during the winter. In addition, feedgrounds lower winter elk mortality rates. However, feedgrounds create high densities of elk in relatively small areas, which can result in increased transmission of disease and habitat degradation both on and adjacent to feedgrounds. Annually, WGFD personnel employ a variety of damage control techniques to maintain spatial and temporal separation of elk and livestock. The WGFD has a long-standing practice of providing game-proof stackyard fencing to private producers to prevent elk from depredating privately owned stored hay crops and to discourage elk from frequenting cattle feeding areas. Other techniques include hazing animals away with pickup trucks, snowmobiles, helicopters, WGFD personnel on snowshoes, and/or noise-making devices, and in some areas setting extended hunting seasons on private lands in areas of chronic damage. By preventing elk from establishing feeding patterns in livestock wintering areas, the potential for interspecific brucellosis transmission can be reduced. Bison and Elk Management Plan The NPS and USFWS initiated the Bison and Elk Management Plan and Environmental Impact Statement in 2000, with the WGFD and U.S. Forest Service as cooperating agencies. The final plan, completed in 2007, guides the portions of Jackson Elk Herd management that GTNP and the NER are responsible for (National Elk Refuge and Grand Teton National Park 2007). The 15 year plan calls for interagency coordination between the federal agencies and the WGFD to achieve population objectives (including herd ratios and herd segment sizes). Following the
79

7
initial implementation of a phased approach, approximately 5,000 elk are expected to winter on the NER. Bison and elk hunting on the NER, and when necessary, the elk reduction program in GTNP, are used to assist the state in managing herd sizes, sex and age ratios, and summer distributions. The plan also calls for improvements to winter and yearlong habitat on the NER, GTNP, and BTNF to reduce elk reliance on supplemental feeding. Current Herd Unit Objective and Management Strategies Population trend The Jackson Elk Herd increased in the late 1980s and early 1990s due to public demand for conservative hunting seasons (Fig. 3). At its peak in 1996, managers counted over 15,000 elk during the mid-winter trend count. Since then, hunting seasons have been structured to reduce the herd toward its 11,000 objective. The 2015 classification totaled 10,668 elk, with 81% on feedgrounds and 19% on native winter ranges. Calf:cow ratios have decreased since the late 1980s when they averaged 30 calves:100 cows (Fig. 4). The average for the past 3 years (2013-2015) is 20 calves:100 cows. This reduction in calf recruitment is likely due to a combination of increasing grizzly bear densities (Barber-Meyer et al. 2008, Foley et al. 2015), increasing wolf densities, and long-term drought impacts to habitat conditions and pregnancy rates (Middleton et al. 2013). Wolves expanded from Yellowstone National Park and began re-colonizing the Jackson Hole area beginning in about 1998. Grizzly bear populations also rebounded and expanded into much of the Jackson Elk Herd by 2000 (Pyare et al. 2004). Despite this decrease in calf:cow ratios compared to 30 years ago, the current population trend appears stable (Fig. 3), following a more conservative hunt season structure.
Fig. 3. Three-year running average of Jackson Elk Herd mid-winter trend counts, 1987-2015. Prior to 1987, elk were classified on native winter ranges using fixed-wing aircraft instead of helicopters.
2000
4000
6000
8000
10000
12000
14000
16000
1987
1989
1991
1993
1995
1997
1999
2001
2003
2005
2007
2009
2011
2013
2015
Tren
d Count
Year
3‐Year Averages of Mid‐Winter Trend Count
Trend Count
Objective
80

8
Fig. 4. Three-year running average of Jackson Elk Herd calf:cow ratios, 1987-2015. Hunting seasons The Jackson Elk Herd attracts hunters due to 1) having several general elk license hunt areas, 2) a diversity of hunting experiences ranging from multi-day backcountry hunts to private lands hunts close to town, and 3) a well-known reputation for bull quality. The local economy and culture in Jackson have developed around elk hunting and elk viewing for over 100 years, and many local businesses are centered on elk hunting. Elk harvest in the Jackson Herd has been as high as 4,200 animals in the past (Fig. 5). Harvest levels peaked in the late 1970s/early 1980s and in the early 1990s. Harvest levels have been steadily decreasing since 1995 and in recent years, harvest is in the range of 1,000 – 1,700 animals (Fig. 5). The number of hunters follows a similar trend with numbers peaking in the late 1970s/early 1980s and to a lesser extent in the early 1990s (Fig. 6). At its peak in 1978, there were over 14,000 active hunters in the Jackson Elk Herd. In 2015, there were 3,211 hunters which included 2,281 residents and 930 nonresidents (Fig. 6). Although the total harvest and number of hunters have decreased since the mid-1990s, harvest success has increased (Fig. 7). Harvest success over the past 3 years has averaged 46%, which is higher than the average 26% success rate during peak hunting from 1975-1982 (Fig. 7). In recent years, hunting seasons have been structured to address relatively low calf:cow ratios in backcountry areas by restricting general seasons to antlered elk only in most areas (Hunt Areas 70, 71, 81, 82, and 83). Meanwhile, more liberal seasons with either general or limited quota licenses valid for both bulls and cow/calf elk take place in the southern portion of the herd unit to address high calf:cow ratios of elk that summer in southern GTNP and private lands close to Jackson. The goal of this hunting season structure is to minimize harvest pressure on the reproductive portions of the herd (cows) in the backcountry segments while maintaining harvest levels on the southern herd segments to keep the population near the 11,000 objective.
0
5
10
15
20
25
30
35
1987
1989
1991
1993
1995
1997
1999
2001
2003
2005
2007
2009
2011
2013
2015
Calf to cow ra
tio
Year
3‐Year Averages of Calf:Cow Ratios
81

9
Fig. 5. Total annual elk harvest in the Jackson Elk Herd, 1975-2015.
Fig. 6. Total annual elk hunters in the Jackson Elk Herd, 1975-2015.
0
500
1000
1500
2000
2500
3000
3500
4000
4500
1975
1977
1979
1981
1983
1985
1987
1989
1991
1993
1995
1997
1999
2001
2003
2005
2007
2009
2011
2013
2015
Harvest
Year
Total Jackson Elk Harvest
0
2000
4000
6000
8000
10000
12000
14000
1975
1977
1979
1981
1983
1985
1987
1989
1991
1993
1995
1997
1999
2001
2003
2005
2007
2009
2011
2013
2015
Hunters
Year
Total Elk Hunters in the Jackson Herd
Total HuntersResident
Nonresident
82

10
Fig. 7. Percent annual harvest success in the Jackson Elk Herd, 1975-2015. Trend line (black line) shows general increase in harvest success.
Current research
Since 1998, over 150 elk have been GPS-collared in the Jackson Herd by the Jackson Cooperative Elk Studies Group, which is comprised of the WGFD, GTNP, NER, and BTNF (Fig. 8). This collaborative research is aimed at monitoring elk movements, seasonal range use, survival, pregnancy, and vulnerability to harvest over time. Currently, the group is tracking approximately 80 collared elk in various herd segments. In winter 2016, seven elk were darted at the Fish Creek feedground and outfitted with GPS collars and 30 elk were darted on the NER and outfitted with Iridium satellite collars. Plans are in place to capture and collar an additional 12 elk during summer 2016 in southern Yellowstone National Park and northern GTNP. This ongoing research is crucial to understanding the timing of elk migration and formulating hunting seasons that afford more protection for elk this segment of the population.
Brucellosis
Brucellosis, caused by infection with the bacterium Brucella abortus, has sparked controversy because of its persistence in elk and bison of the Greater Yellowstone Ecosystem in Wyoming, Montana, and Idaho and the threat of disease spillover to domestic livestock (Thorne et al. 1978). Presumably, B. abortus was transmitted from domestic livestock to free-ranging bison and elk just prior to 1917 after repetitive comingling and subsequent contact with aborted fetuses contaminated with brucellosis (Meagher & Meyer 1994). Brucella transmission usually occurs via the oral route, with ingestion of bacteria that are shed by infected females in high numbers in aborted fetuses, fetal membranes and fluids, or uterine discharges (Thorne et al. 1982, Cheville et al. 1998). The WGFD has monitored brucellosis seroprevalence in elk in western Wyoming for many years. Seroprevalence levels in elk average 29.6% on state-operated feedgrounds in the
0.0
10.0
20.0
30.0
40.0
50.0
60.0
1975
1977
1979
1981
1983
1985
1987
1989
1991
1993
1995
1997
1999
2001
2003
2005
2007
2009
2011
2013
2015
Percent Success
Year
Harvest SuccessHarvest Success
Linear (Harvest Success)
83

11
Gros Ventre (1990-2015) and 29.4% on the NER (1985-2015) (Scurlock and Edwards 2010, WGFD 2014). WGFD is committed to preventing elk/livestock comingling, particularly during winter and early spring when the majority of brucellosis-induced abortion events occur. The WGFD produced the Jackson Elk Herd Brucellosis Management Action Plan (BMAP) in 2007, and is updating the plan in 2016. This plan lays out brucellosis management options and best management practices. The WGFD currently employs several methods to minimize interspecific transmission of brucellosis from elk to livestock and intraspecific transmission of brucellosis from elk to elk on feedgrounds (WGFD 2007). Elk feeders are encouraged to feed hay on clean snow when
Fig. 8. A subset of GPS-collared elk movements between winter and summer ranges in the Jackson Elk Herd. Individual elk are represented by different colored dots. The Jackson Elk Herd Unit area is shown as orange shading.
84

12
possible and recover aborted fetuses to reduce inadvertent ingestion of contaminated feed and exudates. Attempts have been made to increase the dispersal of hay and reduce the duration of the feeding season on each feedground on a case-by-case basis. However, damage and elk/livestock comingling concerns typically determine the duration of supplemental feeding on most feedgrounds. Damage and elk/livestock comingling contribute to increased risk of intraspecific disease transmission among elk. In most circumstances, elk are not tolerated consuming private crops and comingling with cattle. Strategies to hold elk on artificial feed longer and hazing elk to feedgrounds are often employed to minimize these conflicts. These practices increase the chance that an aborted fetus contaminated with Brucella will be contacted by elk wintering on feedgrounds, thus increasing exposure rates among elk. Chronic wasting disease Chronic wasting disease (CWD) is a member of a group of diseases termed transmissible spongiform encephalopathies (TSEs) and is a fatal disease of cervids (deer, elk, and moose). The WGFD conducts extensive surveillance for CWD in the Jackson Elk Herd annually, with funding support from the NER. The highest yielding method of collecting elk samples (lymph nodes) for subsequent CWD testing in the Jackson region comes from hunter contacts in the field, especially those within GTNP and the NER. Successful hunters whose animals are not sampled in the field are requested to deposit heads with attached harvest information in bear-proof containers placed at various locations. Also, many samples are obtained though the cooperation of local game meat processors. CWD samples are also collected from road-killed and “targeted” animals (euthanized due to illness) throughout the year. Test results are reported to hunters typically within three weeks of sample submission. Hunters can obtain results by accessing the Department’s website, and hunters that submit a positive sample are notified via phone and letter. The WGFD also notifies other state wildlife agencies if a hunter from their state harvests a CWD test-positive animal in Wyoming. During calendar year 2015, 301 samples were collected from the Jackson Elk Herd, which all tested as negative. At this time, no animal has tested positive for CWD from the Jackson Elk Herd Unit area, including elk, deer, or moose. Early mathematical models predicted CWD would drive affected cervid populations to extinction (Gross & Miller 2001). More recent modeling suggests CWD may have a population level impact in Rocky Mountain National Park elk (Monello et al. 2013, Monello et al. 2014), while other research suggests certain populations may be able to survive through disease-driven genetic selection (Robinson et al. 2012, Williams et al. 2014). The WGF Commission adopted a Chronic Wasting Disease Management Plan in 2016 that outlines an adaptive management strategy allowing flexibility to alter disease management activities depending on future research findings, CWD distribution, prevalence, funding, and level of concern (from publics, WGFD and other governmental agencies).
85

13
Recommended Herd Unit Objective Jackson Region wildlife personnel recommend changing the objective for the Jackson Elk Herd from a Post-Season Population Objective to a Mid-Winter Trend Count Objective. New spreadsheet models initiated in 2012 do not adequately simulate population trends for the Jackson Herd. The approach of using a mid-winter trend count will allow regional personnel to monitor population trends, while recognizing that no working spreadsheet model exists for the population. The objective is scheduled to be reviewed again in 2021. We propose the following objective for the Jackson Elk Herd: Manage for a mid-winter trend count of 11,000 elk, which will be estimated using ground classifications on feedgrounds and aerial surveys on native winter ranges. Mid-winter trend counts will be analyzed using a 3-year running average. The population will be managed for ± 20% of the objective (range of 8,800 to 13,200). This population is Recreational Management, meaning management for a post-season ratio of 15 - 29 bulls: 100 cows. In addition, the WGFD will continue working with the NER and GTNP to achieve the goals outlined in the BEMP (2007). Justification Since 1978, the population objective has been set between 11,000 and 11,250 elk. Trend counts for the Jackson Elk Herd have been within 11,000 ± 20% since 1998. The most recent trend count in February 2016 was 10,668 elk. Currently, most of the Jackson Elk Herd spends the winter on either state-operated feedgrounds or the NER, which makes mid-winter classifications relatively accurate for the majority of the herd. Therefore, it is reasonable to expect that mid-winter trend counts using ground and aerial classifications will accurately represent herd changes over time. In addition, the recreational management goal of 15 - 29 bulls:100 cows has been achieved or surpassed since at least 1970 in the Jackson Herd. The last 5-year average was 31.9 bulls:100 cows. Reducing the Jackson Elk Herd objective is not proposed and it is anticipated that the general public would not support a population goal with fewer elk. Reducing the herd objective would likely require extending hunting seasons and would increase the vulnerability of the Yellowstone/Teton Wilderness and Gros Ventre herd segments to harvest. The relatively low calf:cow ratios in these herd segments make them sensitive to over-harvest and potential loss of traditional migrations over time. The population objective could be reevaluated within five years if major management changes occurred in the Jackson Elk Herd within the next 5 years.
Public/Agency Involvement The Bridger-Teton National Forest Supervisor and District Rangers were notified of the objective changes in the Jackson Region during the annual BTNF/WGFD Coordination meeting
86

14
on March 17, 2016 in Jackson. Additionally, the proposal will be discussed at the Interagency Elk Studies Group Meeting on May 3, 2016. This proposal was forwarded to Grand Teton National Park, National Elk Refuge, and Bridger-Teton National Forest staff for review on April 21, 2016. Management data and the schedule to review the herd objective were discussed during the public season setting meeting in Jackson March 17, 2016 and at a Jackson Hole Outfitters and Guides Association meeting on March 2, 2016. The proposal will be presented at a public meeting in Jackson on April 25, 2016. A news release was distributed on April 19, 2016 to the Jackson Hole News and Guide and over 7,000 personal subscribers to the Department’s Jackson Region email list. An article featuring the proposed Jackson Elk Herd Objective changes appeared on the front page of the April, 25, 2016 edition of the Jackson Hole News and Guide. References Allred, W.J. 1950. Re-establishment of seasonal elk migration through transplanting. Transactions of the North American Wildlife Conference 15:597-611. Anderson, C.C. 1958. The elk of Jackson Hole. Bull. 10. Wyoming Game and Fish Commission. 184 pp. Bailey, J. R. 1999. A working model to assist in determining initiation of supplemental feeding of elk and a carrying capacity model for the National Elk Refuge, Jackson, Wyoming. M.S. Thesis. University of Wyoming. Laramie, Wyoming. 83pp. Barber-Meyer, S.M., L.D. Mech, and P.J. White. 2008. Elk calf survival and mortality following wolf restoration to Yellowstone National Park. Wildlife Monographs 169:1-30. Barbknecht, A.E., W.S. Fairbanks, E.J. Maichak, J.D. Rogerson, and B. Scurlock. 2008. Elk parturition site selection at local and landscape scale in western Wyoming. M. S. Thesis, Iowa State University, Ames, IA. 97pp Boyce, M.S. 1989. The Jackson herd: intensive wildlife management in North America. Cambridge University Press, Cambridge, United Kingdom. Casebeer, R.L. 1960. A preliminary chronology and bibliography on the Jackson Hole elk herd and closely related materials. Special Report by USFS, Jackson WY.16pp. Cheville, N.F., D.R. McCullough, and L.R. Paulson. 1998. Brucellosis in the Greater Yellowstone area. National Research Council, Washington, D.C., USA. Cole, G.F. 1969. The elk of Grand Teton and southern Yellowstone National Parks. National Park Service Res. Rpt. GRTE – N – 1. Washington, D. C. 80pp.
87

15
Cole, E.K., A.M. Foley, J.M. Warren, B.L. Smith, S.R. Dewey, D.G. Brimeyer, W.S. Fairbanks, H. Sawyer, and P.C. Cross. 2015. Changing migratory patterns in the Jackson Elk Herd. Journal of Wildlife Management 79:877-886. Coughenour, M.B. and F.J. Singer. 1996. Elk population processes in Yellowstone National Park under the policy of natural regulation. Ecological Applications 6: 573-593. Craighead, J .J. 1952. A biological and economic appraisal of the Jackson Hole elk herd. New York Zoological Society, New York, NY. Cromley, C.M. 2000. Historical Elk Migrations Around Jackson Hole, Wyoming. In “Developing Sustainable Management Policy for the National Elk Refuge, Wyoming. Yale School of Forestry and Environmental Studies. Bull. No. 104. pp. 53-65. Cross, P. C., W. H. Edwards, B. M. Scurlock, E. J. Maichak, and J. D. Rogerson. 2007. Effects of management and climate on elk brucellosis in the Greater Yellowstone Ecosystem. Ecological Applications 17: 957-964. Foley, A.M., P.C. Cross, D.A. Christianson, B.M. Scurlock, and S. Creel. 2015. Influences of supplemental feeding on winter elk calf:cow ratios in the southern Greater Yellowstone Ecosystem. Journal of Wildlife Management 79:887-897. Gross, J.E. and M.W. Miller. 2001. Chronic wasting disease in mule deer: disease dynamics and control. Journal of Wildlife Diseases 65:205-215. Hobbs, N. T., G. Wockner, and F. J. Singer. 2003. Assessing management Alternatives for ungulates in the Greater Teton Ecosystem using simulation modeling. Natural Resources Ecology Laboratory, Fort Collins, CO., 63pp.
Houston, D.B. 1982. The Northern Yellowstone elk. Macmillan Publishing, New York, New York, USA.
Meagher, M. and M.E. Meyer. 1994. On the origin of brucellosis in bison of Yellowstone National Park: a review. Conservation Biology 8:645-653.
Middleton, A.D., Morrison, T.A., Fortin, J.K., Robbins, C.T., Proffitt, K.M., White, P.J., McWhirter, D.E., Koel, T.M., Brimeyer, D.G., Fairbanks, W.S., and M.J. Kauffman. 2013. Grizzly bear predation links the loss of native trout to the demography of migratory elk in Yellowstone. Proc R Soc B 280: 20130870. http://dx.doi.org/10.1098/rspb.2013.0870 Monello, R.J., J.G. Powers, N.T. Hobbs, T.R. Spraker, K.I. O’Rourke, and M.A. Wild. 2013. Efficacy of antemortem rectal biopsies to diagnose and estimate prevalence of chronic wasting disease in free-ranging cow elk (Cervus elaphus nelsoni). Journal of Wildlife Diseases 49(2):270-278.
88

16
Monello, R.J., J.G. Powers, N.T. Hobbs, T.R. Spraker, M.K. Watry, and M.A. Wild. 2014 Survival and population growth of a free-ranging elk population with a long history of exposure to chronic wasting disease. Journal of Wildlife Management 78(2):214-223. Murie, O.J. 1945. Our big game in winter. Transactions of the North America Wildlife Conference 9:173-176. Murie, O.J. 1951. The Elk of North America. Stackpole Books, Harrisburg, PA. National Elk Refuge and Grand Teton National Park. 2007. Final Bison and Elk Management Plan and Environmental Impact Statement for the National Elk Refuge/Grand Teton National Park/John D. Rockefeller, Jr., Memorial Parkway. U.S. Fish and Wildlife Service, Region 6, Denver, CO. 605 pp. http://www.fws.gov/bisonandelkplan North, D. 1990. The Buffalo Valley elk enhancement project, 1990 annual report. Wyoming Game and Fish Department. Cheyenne, Wyoming, USA. Preble, E.A. 1911. Report on Conditions of elk in Jackson Hole, Wyoming, in 1911. U.S.D.A. Biol. Bull. 40, 23 pp. Pyare, S., S. Cain, D. Moody, C. Schwartz, and J. Berger. 2004. Carnivore re-colonisation: reality, possibility and a non-equilibrium century for grizzly bears in the Southern Yellowstone Ecosystem. Animal Conservation 7:1-7. Scurlock, B.M. and H.E. Edwards. 2010. Status of Brucellosis in Free-Ranging Elk and Bison in Wyoming. Journal of Wildlife Diseases. 46 (2): 442-449. Sheldon, C. 1927. The conservation of the elk of Jackson Hole, Wyoming. A report to Honorable Dwight F. Davis, Secretary of War, Chairman of the President’s Committee on Outdoor Recreation, and Honorable Frank C. Emerson, Governor of Wyoming. Washington, D.C. 36 pp. Singer, F.J. and L.C. Zeigenfuss. 2003. A survey of willow communities, willow stature and production, and correlations to ungulate consumption and density in the Jackson valley and the National Elk Refuge. USDI, Geological Survey, Biological Resources Division, Fort Collins, CO. Unpublished report.
Smith, B.L. and R.L. Robbins. 1994. Migrations and management of the Jackson elk herd. National Biological Survey Resource Publication 199, Washington, D.C., USA.
Smith, B.L. and S.H. Anderson. 1996. Patterns of neonatal mortality of elk in northwestern Wyoming. Canadian Journal of Zoology. 74:1229–1237.
Smith, B.L., R.L. Robbins, and S.H. Anderson. 1997. Early development of supplementally fed, free-ranging elk. Journal of Wildlife Management. 61:26–38.
89

17
Smith, B.L. 2001. Winter feeding of elk in western North America. Journal of Wildlife Management 65: 173-190. Smith, B., E. Cole, and D. Dobkin. 2004. Imperfect pasture: a century of change at the National Elk Refuge in Jackson Hole, Wyoming. Grand Teton Natural History Association, Moose, WY. 156 pp. Stephenson, J., M. Jimenez, S. Dewey, and S. Cain. 2012. Wildlife research: wolf predation. In Wildlife Conservation, Management, and Research 2012. Ed. Steve Cain, Division of Science and Resource Management, Grand Teton National Park, pp. 56-57. Robinson, S.J., M.D. Samuel, C.J. Johnson, M. Adams, and D.I. McKenzie. 2012. Emerging prion disease drives host selection in a wildlife population. Ecological Applications 22(3):1050-1059. Thorne, E.T., J.K. Morton, F.M. Blunt, and H.A. Dawson. 1978. Brucellosis in elk. II. Clinical effects and means of transmission as determined through artificial infections. Journal of Wildlife Diseases 14:280-291. Thorne, E.T. 1982. Brucellosis. Pages 54-63 in E.T. Thorne, N. Kingston, W.R. Jolley, and R.C. Bergstrom, editors. Diseases of wildlife in Wyoming. Second edition. Wyoming Game and Fish Department, Cheyenne, Wyoming, USA. Wachob, D. and C. Smith 2003. Elk migration through a human dominated landscape in Jackson Hole, Wyoming. Final report. Wilbrecht, J. 1984. How the objective of an average of 7,500 winter elk on the National Elk Refuge was arrived at. Unpublished report. April 20, 1984. Williams, A.L., T.J. Kreeger, and B.A. Schumaker. 2014. Chronic wasting disease model of genetic selection favoring prolonged survival in Rocky Mountain elk (Cervus elaphus). Ecosphere 5(5):1-10. Wyoming Game and Fish Department. 2006. Evaluation of a proposal from the Wyoming Outdoor Council, Greater Yellowstone Coalition, and Jackson Hole Conservation Alliance for a phase out of elk feeding in the Gros Ventre. Unpublished report. 37 pp. Wyoming Game and Fish Department. 2007. Jackson Elk Herd Unit Brucellosis Management Action Plan. https://wgfd.wyo.gov/Wildlife-in-Wyoming/More-Wildlife/Wildlife-Disease/Brucellosis/Brucellosis-Reports. 118 pp. Wyoming Game and Fish Department. 1981. Jackson Elk Herd. Big Game Job Completion Reports. Cheyenne, Wyoming, USA. Wyoming Game and Fish Department. 1982. Jackson Elk Herd. Big Game Job Completion Reports. Cheyenne, Wyoming, USA.
90

18
Wyoming Game and Fish Department. 1991. Jackson Elk Herd. Big Game Job Completion Reports. Cheyenne, Wyoming, USA. Wyoming Game and Fish Department. 2014. Jackson Elk Herd. Job Completion Report. Cheyenne, Wyoming, USA. https://wgfd.wyo.gov/Hunting/Job-Completion-Reports.
91

92

93

94

4400 (3520 - 5280)
Total: 15% 14%Proposed change in post-season population: 10% 4%
Males ≥ 1 year old: 27% 30%Juveniles (< 1 year old): 9% 8%
Proposed harvest rates (percent of pre-season estimate for each sex/age group):JCR Year Proposed
Females ≥ 1 year old: 10% 8%
Percent population is above (+) or below (-) objective: 2%Number of years population has been + or - objective in recent trend: 12Model Date: 02/23/2016
Juveniles per 100 Females 28 31
Population Objective (± 20%) :Management Strategy: Recreational
Days Per Animal: 20.2 24.2 21.8Males per 100 Females 24 20
Active License Success: 36% 25% 33%Recreation Days: 17,837 10,154 11,121
Hunter Success: 38% 25% 33%Active Licenses: 2,455 1,714 1,553
Harvest: 885 420 510Hunters: 2,343 1,686 1,553
2010 - 2014 Average 2015 2016 ProposedPopulation: 4,700 4,500 4,300
2015 - JCR Evaluation FormSPECIES: Elk PERIOD: 6/1/2015 - 5/31/2016HERD: EL103 - FALL CREEK
HUNT AREAS: 84-85 PREPARED BY: GARY FRALICK
95

96

2010 - 2015 Postseason Classification Summary
97

for Elk Herd EL103 - FALL CREEK
MALES FEMALES JUVENILES Males to 100 Females Young to
Year Post Pop Ylg Adult Total % Total % Total %TotCls
ClsObj Ylng Adult Total
Conf Int
100 Fem
Conf Int
100 Adult
2010 5,000 290 484 774 17% 3,116 66% 796 17% 4,685 271 9 16 25 ± 0 26 ± 0 202011 4,500 198 487 685 16% 2,841 66% 766 18% 4,292 317 7 17 24 ± 0 27 ± 0 222012 4,500 215 379 594 15% 2,663 66% 804 20% 4,061 310 8 14 22 ± 0 30 ± 0 252013 4,800 318 309 627 16% 2,498 63% 842 21% 3,967 328 13 12 25 ± 1 34 ± 1 272014 4,700 261 441 702 17% 2,692 66% 682 17% 4,076 303 10 16 26 ± 1 25 ± 1 202015 4,500 130 369 499 13% 2,446 66% 768 21% 3,713 289 5 15 20 ± 1 31 ± 1 26
2016 HUNTING SEASONS FALL CREEK ELK HERD (EL103)
Hunt Area
Type Season Opens
Dates Closes
Quota License Limitations
84 Sep. 26 Oct. 9 General Any elk, spikes excluded 84 Oct. 10 Oct. 31 General Antlerless elk, spikes excluded 84 1 Nov. 1 Jan. 31 20 Limited quota Any elk valid on private land
west of U.S. Highway 191 and north and east of the Snake River starting at the South Park Bridge
84 6 Sept 26 Nov. 20 25 Limited quota Cow or calf; that portion of Area 84 east and south of Granite Creek to the Hoback River shall be closed after October 31
84 6 Nov. 1 Jan. 31 Cow or calf valid in Area 85 on private land north of Butler Creek
84 6 Nov. 21 Jan. 31 Cow or calf valid on private land west of U.S. Highway 191 and north and east of the Snake River starting at the South Park Bridge
84 7 Aug. 15 Jan.31 75 Limited quota Cow or calf valid on private land west of U.S. Highway 191 and north and east of the Snake River starting at the South Park Bridge
84 7 Nov. 1 Jan. 31 Cow or calf valid on private land in that portion of Area 85 north of Butler Creek
85 Sep. 26 Oct. 9 General Any elk, spikes excluded 85 Oct. 10 Oct. 31 General Antlerless elk, spikes excluded 85 6 Sep. 26 Oct. 31 25 Limited quota Cow or calf 85 6 Nov. 1 Jan. 31 Cow or calf valid on private land
north of Butler Creek 85 6 Nov. 21 Jan. 31 Cow or calf valid on private land
west of U.S. Highway 191 and north and east of the Snake River starting at the South Park Bridge
98

SUMMARY OF PROPOSED CHANGES BY LICENSE NUMBER
Area License Type
Change from 2015
84,85 General Change dates Sep. 26 – Oct. 18 general license any elk spikes excluded to Sep. 26 – Oct. 9 general license any elk, spikes excluded
84,85 General Change dates Oct. 19 – Oct. 31 general license antlered elk, spikes excluded to Oct. 10 – Oct. 31 general license, antlered elk, spikes excluded
85 Limited quota; Nov. 1 – Jan.31
Add Unused Hunt Area 84 Type 7
84,85 General Remove spikes excluded restriction Herd Unit Total
Management Evaluation Current Postseason Population Management Objective: 4,400 Management Strategy: Recreational 2015 Postseason Population Estimate: ~4,500 2016 Proposed Postseason Population Estimate: ~4,400
The population objective for Fall Creek elk herd is 4400 elk. The management strategy is recreational management. The objective and management strategy were last revised in 2011. The current population estimate of 4500 elk is within +/- 20% of the population objective. Low calf productivity and survival and management strategies associated with November hunting seasons that targeted the antlerless segment of the population have stabilized the population near the population objective.
Herd Unit Issues
The most substantial herd unit issues continue to be associated with elk numbers inhabiting private property along the Snake River Bottomlands and sustaining calf survival and recruitment. Late season hunts have been implemented over the last 20 years in an effort to encourage elk to move to the South Park feedground thereby minimizing potential conflict. Substantial reductions in antlerless elk hunting opportunities have resulted from lower than desired calf survival and recruitment.
99

Weather Weather conditions during 2015 were ideal for forage production beginning in early spring and continuing through fall. By late summer the moisture regime had changed frequent precipitation scenario that persisted into the fall hunting season. Drought conditions in the early portion of the summer abated by late fall as persistent snow storms began to deposit snowpack in the Snake River Mountain Range. By mid winter snow conditions on winter ranges had changed significantly. Little to no snow had accumulated on core winter ranges. These conditions persisted throughout the remainder of the winter. By late winter 2016 snowpack in western Wyoming watersheds were estimated to be near normal to slightly below normal. For additional weather and precipitation data please visit the following websites: http://www.ncdc.noaa.gov/temp-and-precip/time-series and http://www.ncdc.noaa.gov/oa/climate/research/prelim/drought/pdiimage.html. Habitat No habitat data has been collected on elk summer and winter ranges. There are no established vegetation transects in this herd unit. Please refer to the 2015 Annual Report Strategic Habitat Plan Accomplishments, for the Jackson Region habitat improvement project summaries ( http://wgfd.wyo.gov/web2011/wildlife-1000708.aspx). Field Data Since 2010, population growth has been suppressed by lower calf survival and recruitment. November antlerless elk hunts have targeted the reproductive segment of the population since 2008. This management strategy has resulted in the desired management objective of reducing the population to within 20% of the population objective. Management over the last six years has been successful at maintaining bull:cow ratios at or higher than the management goal of 20 bulls:100 cows. Bull:cow ratios in 2014 and 2015 were observed at the highest levels in 10 years, and are likely a result of very warm temperatures and absence of weather during the October portion of the hunting season. A total of 20 bulls:100 cows were noted in the current year’s trend count. Since 2011 reductions in antlerless elk hunting opportunity have been implemented in response to a declining population. Spikes excluded seasons were incorporated into the herd unit management strategy in 2013 to address public concerns that hunting pressure would increase in this area if spikes excluded seasons were not adopted. The 2016 hunt season will be the fourth consecutive year of spikes excluded general license hunting seasons. Harvest Data Hunter success was estimated at 25% in 2015 with a total harvest of 420 elk. The current year’s harvest declined from 566 elk harvested in 2014; hunt success in 2014 was estimated at 29%. The reduced opportunity and issuance of limited quota type 6 licenses has resulted in general license hunters harvesting more antlerless elk than limited quota license holders. Antlered
100

harvest has generally been decreasing as a result of spikes excluded hunting opportunity and reduced calf recruitment. A total of 307 and 291 adult males were harvested in 2013 and 2014 respectively, while the current year’s estimated harvest of 2+year-old bulls was estimated at 275. Hunter success has generally declined since 2012 (39%), to 25% success in 2015. Hunt success is a function of the declining harvest and decreased hunting opportunity associated with an elk herd that has approached the population objective. A total of 834 elk were taken in 2012, while approximately half that number, or 420 elk were harvested in 2015.
The spikes excluded hunt the last three years has resulted in antlered harvest being focused on the 2+-year old bulls. Since 2012 the number of 2+-year old bulls estimated in the annual harvest has declined as a result of reduced hunter participation, more conservative hunting seasons, and decreased calf survival in 2014 and 2015.
The reduction in yearling harvest because of the spikes excluded regulation has not resulted in the desired or sustained increase in recruitment of the yearling cohort. Since 2013 the number of yearling bulls documented in the trend count has exhibited an annual, incremental decrease (Figure 1). The specific causal relationship associated with the decline in yearling bull numbers is unknown, however, the presence of necrotic stomatitis on Horse Creek and Camp Creek feedgrounds in 2014 and 2015 is believed to have influenced calf survival sufficiently to adversely affect recruitment of yearlings.
Figure 1. A depiction of the number of yearling bulls counted during the annual trend count during years of general license, any elk hunting seasons (2006-2012) versus general license, any elk spikes excluded hunting seasons (2013-2015).
The current year’s observed yearling bulls:100 cows ratio was the lowest since 2006 (Figure 2). The observed ratio of 5 yearling bulls:100 cows was the lowest yearling bull ratio observed since spikes excluded hunting was first implemented in 2013. Since that time the yearling bull ratio
101

has exhibited any annual decline from 13 yarlings:100 cows in 2013 to the current low of 5 yearling bulls:100 cows in 2015.
Figure 2. A depiction of the yearling bulls:100 cows ratio observed during the annual trend count during years of general license, any elk hunting seasons (2006-2012) versus general license, any elk spikes excluded hunting seasons (2013-2015).
Population
The population has stabilized within 20% of the objective. The “Time Sensitive Juvenile – Constant Adult Mortality Rate” (TSJ, CA) spreadsheet model was used to derive the post season population estimate. The TSJ, CA model showed the best overall fit compared to the suite of available models (Fit=188, Relative AICc=297). This model tracks bull:cow ratios and , harvest percentages of antlered elk, and population estimates. Model simulations and derived outcomes fit with observed data collected during postseason herd composition and trend surveys.
Management Summary
The 2016 hunting season is designed to maintain a stable population near the objective. The general any/antlered elk spikes excluded hunting season structure will be maintained in Areas 84 and 85 because of vocal public support to maintain this restriction. In addition, the reduction in the number of elk counted during the current year’s trend count will result in a more restrictive hunting season format by reducing the number of days of general any elk season length by nine days. The portion of the general license any elk season will end on October 9, instead of closing on October 18 as noted in 2015. Beginning on October 10 and continuing through October 31, antlered only elk may be taken with general licenses. In order to provide limited quota license hunters continued recreation days, the limited quota Type 6 licenses will be maintained at 25
102

licenses in Hunt Areas 84 and 85, and continue to be valid into November. This management strategy will reduce overall antlerless harvest and maintain the population within 20% of the population objective. In Area 84 the limited quota Type 6 licenses will be valid through November 20. The continuation of the November portion of the hunting season and maintaining the number of Type 6 licenses issued at 25 is in response to lower numbers of elk being counted on the Horse Creek and Camp Creek feedgrounds, and because of concerns expressed by the public regarding lower elk numbers on these feedgrounds. An additional limited quota Type 7 license will be maintained for the third consecutive year at 75 licenses. The opening date for the Type 7 license will be August 15. This private land hunt will address landowner concerns regarding elk numbers on private property along the Snake River Bottomlands and provide hunters with an extended hunting opportunity to harvest antlerless elk in areas that have been historically prone to chronic elk damage and comingling with livestock. In Area 85, hunting pressure will be reduced on the antlerless segment of the population by maintaining the number of Type 6 cow/calf licenses at 25 licenses and closing the season October 31. Population management objectives have been achieved in the Area 85 portion of the herd unit, and therefore the appropriate management response is to initiate season limitations that are designed to stabilize this segment of the population that spends the winter on the Dog Creek feedground. The 2016 hunting seasons are projected to harvest a total of 650 elk. The projected harvest should maintain the population at approximately 4400 elk following the 2016 hunting season.
103

BRUCELLOSIS MANAGEMENT (E103) – 2015
BRUCELLOSIS SURVEILLANCE/RESEARCH
Horse Creek/Camp Creek Feedgrounds One adult female elk was chemically immobilized at Camp Creek on February 19, 2016 (eartags CC0023 and CC0024). The elk was fitted with a GPS collar and a Vaginal Implant Transmitter (VIT) that will be expelled upon either abortion or parturition during spring 2016.
Dog Creek Feedground Four adult female elk were chemically immobilized and recaptured on this feedground on February 15, 2016. Three of the cows were targeted to remove collars that failed to drop off, and the fourth cow had a GPS collar with one year of battery life remaining, and was targeted to increase sample size of individual elk with multiple parturition sites. This cow was pregnant and received a VIT.
South Park Feedground Two adult female elk captured and GPS-collared in January of 2015 were chemically immobilized and tested for pregnancy on January 9, 2016. These cows were targeted to boost the sample size of individual elk with multiple birth site locations. Both cows were pregnant and fitted with VITs that will be expelled upon either abortion or parturition during spring 2016.
TARGET FEEDGROUND MANAGEMENT
Brucella abortus strain 19 ballistic elk vaccination was discontinued this year due to a lack of efficacy observed over the course of the 30-year effort, and the inability to procure the necessary vaccination supplies due to the sole provider closing its manufacturing facility. Thus, the primary brucellosis management tools now employed are low-density (LD) feeding and early end-date of feeding on select, target feedgrounds where a high opportunity exists to conduct these measures (i.e., large feeding areas and long distance away from cattle operations). One feeder works at both South Park and Dog Creek feedgrounds, and time limitations allow LD feeding at only South Park feedground where the feed is distributed extremely well in LD fashion. Horse and Camp Creek feedgrounds do not have adequate space for LD feeding when all elk are present at either feedground, but attempts are made to distribute hay as much as possible at both sites. None of the feedgrounds in this elk herd are managed for early end dates, due to the close proximity of susceptible cattle and private lands.
104

105

106

2,200
Proposed change in post-season population: NA% NA%
Juveniles (< 1 year old): NA% NA%Total: NA% NA%
Females ≥ 1 year old: NA% NA%Males ≥ 1 year old: NA% NA%
Number of years population has been + or - objective in recent trend: 6
Proposed harvest rates (percent of pre-season estimate for each sex/age group):JCR Year Proposed
Trend Based Objective (± 20%) (1760 - 2640)Management Strategy: RecreationalPercent population is above (+) or (-) objective: -16.5%
Males per 100 Females: 19 17Juveniles per 100 Females 36 39
Recreation Days: 16,153 16,469 16,350Days Per Animal: 21.5 19.1 21.8
Active Licenses: 2,401 2,626 2,445Active License Success 31% 33% 31%
Hunters: 2,318 2,537 2,445Hunter Success: 32% 34% 31%
Trend Count: 2,045 1,837 1,950Harvest: 752 861 750
HUNT AREAS: 88-91 PREPARED BY: GARY FRALICK
2010 - 2014 Average 2015 2016 Proposed
2015 - JCR Evaluation FormSPECIES: Elk PERIOD: 6/1/2015 - 5/31/2016HERD: EL105 - AFTON
107

108

109

2010 - 2015 Postseason Classification Summary
for Elk Herd EL105 - AFTON
MALES FEMALES JUVENILES Males to 100 Females Young to
Year Post Pop Ylg Adult Total % Total % Total %TotCls
ClsObj Ylng Adult Total
Conf Int 100
Fem Conf Int 100
Adult
2010 2,280 86 186 272 14% 1,235 64% 426 22% 1,933 287 7 15 22 ± 1 34 ± 1 282011 2,098 53 169 222 13% 1,132 68% 322 19% 1,676 267 5 15 20 ± 1 28 ± 1 242012 2,400 60 145 205 11% 1,077 60% 506 28% 1,788 299 6 13 19 ± 1 47 ± 2 392013 2,400 109 166 276 13% 1,409 66% 461 21% 2,145 274 8 12 20 ± 1 33 ± 1 272014 0 77 152 229 10% 1,564 66% 592 25% 2,385 367 5 10 15 ± 0 38 ± 0 332015 0 53 121 174 11% 1,045 646% 411 25% 1,630 419 5 12 17 ± 0 39 ± 0 34
2016 HUNTING SEASONS AFTON ELK HERD (EL105)
Hunt Area
Type
Season Dates Quota
License
Limitations Opens Closes
88 Oct.1 Oct. 31 40 Limited quota Any elk 89 Oct. 15 Oct. 17 General Any elk Oct. 18 Oct. 31 General Antlered Elk 90 Oct. 15 Oct. 31 General Any elk Nov. 1 Nov. 15 General Antlerless elk 6 Oct. 15 Nov. 15 250 Limited quota Cow or calf 91 Oct. 15 Oct. 31 General Any elk 1 Oct. 1 Oct. 31 100 Limited quota Any elk Nov. 1 Dec. 31 Unused Area 91 Type 1 licenses valid
for antlerless elk 6 Oct. 1 Dec. 31 175 Limited quota Cow or calf
Jan. 1 Jan. 31 Area 91 Type 6 licenses valid in the entire area. Archery only in that portion of Area 91 south of Cedar Creek and east of Muddy String Road (Lincoln County Road 117), north of Lost Creek Road (Lincoln County Road 120) and north of Lost Creek, off national forest
88 Sep. 1 Sep. 30 Archery only – REFER TO SECTION 4 89,90 Sep. 1 Sep. 30 Archery only – REFER TO SECTION 4
91 Sep. 1 Sep. 30 Archery only – REFER TO SECTION 4
110

SUMMARY OF CHANGES BY LICENSE NUMBER
Area License Type
Change from 2015
89 General Decrease number of days of any elk portion from Oct. 15 – 18 to Oct. 15-17
General Increase number of days of antlered only hunting Oct. 19 – 31 to Oct. 18 – 31
Herd Unit Total
Management Evaluation Current Mid-Winter Trend Count Management Objective: 2,200 Management Strategy: Recreational 2015 Mid-Winter Trend Count: 1,840 Most Recent 3-Year Running Average Trend Count: 2,200
The current mid-winter trend count management objective for Afton elk herd is 2200 elk. The management strategy is recreational management. The objective and management strategy were last revised in 2011. The current mid-winter trend count was 1840 elk.
Herd Unit Issues
Management strategies have been diverse throughout the four hunt areas over the last 10 years in an effort to address individual hunt area issues. Hunting pressure has been maintained in the upper Greys River (Area 90) where elk numbers exceed the Commission-established quota for the Forest Park elk feedground. In the lower Greys River (Area 89) hunting opportunity has been more restricted with shorter overall season length and fewer days to harvest antlerless elk than in Area 90. This strategy is designed to increase overall elk numbers on the Greys River feedground and native winter ranges in Area 89. Based on the current year’s trend count, this strategy was successful as elk numbers have decreased on Forest Park feedground and increased on the Greys River feedground. Hunt seasons in the Salt River (Area 91), have maintained elk numbers at desired levels to minimize damage to stored crops and comingling with livestock.
Weather
Weather conditions during the 2015 were ideal for forage production beginning in early spring and continuing through fall. By late summer the moisture regime had changed frequent precipitation scenario that persisted into the fall hunting season. Drought conditions in the early portion of the summer abated by late fall as persistent snow storms began to deposit snowpack in the Wyoming and Salt Mountain Ranges. By mid winter snow conditions on winter ranges had changed significantly. Little to no snow had accumulated on core winter ranges. These
111

conditions persisted throughout the remainder of the winter. By late winter 2016 snowpack in western Wyoming watersheds were estimated to be at or below normal. For additional weather and precipitation data please visit the following websites: http://www.ncdc.noaa.gov/temp-and-precip/time-series and http://www.ncdc.noaa.gov/oa/climate/research/prelim/drought/pdiimage.html. Habitat No habitat data has been collected on elk summer and winter ranges. There are no established vegetation transects in this herd unit. Please refer to the 2015 Annual Report Strategic Habitat Plan Accomplishments for the Jackson Region habitat improvement project summaries ( http://wgfd.wyo.gov/web2011/wildlife-1000708.aspx). Field Data The Afton elk herd has been managed to maintain the population within +/-20% of the objective of 2200. Population trends are relatively stable. Hunt seasons have been successful at targeting elk numbers, notably in upper Greys River segment of the population, where rapid and sustained growth has been observed. Hunting seasons have suppressed population growth in an elk herd where moderate to high calf survival and calf:cow ratios are frequently observed at 38 – 43 calves:100 cows. Since 2011 bull:cow ratios have been observed at or slightly below the management goal of at least 20 bulls:100 cows. Harvest Data There has been no substantial change in hunter success or effort to harvest in an in this herd unit the last two years. Hunters were able to harvest an elk after 25 days of hunting in 2014 as compared to 19 days in 2015. Hunter success was estimated at 32% and 34% in 2014 and 2015 respectively. A total of 861 elk were taken by hunters, which is an increase from the 757 elk taken in 2014. The hunt seasons have produced the desired population reduction over the last 5 years. Hunt seasons that provide a combination of any and antlerless elk hunting opportunities during the October portion of the hunt, and into November, will maintain population within the +/- 20% of the objective. The hunting season in 2016 will focus on harvesting predominately any elk in Area 89 during the first three days of the hunting seasons to compensate for the generally higher trend counts in that area the last two years. The percentage of antlered elk taken continues to exceed the number and percentage of cow elk in this herd unit. Since 2009 antlered elk comprised approximately 55% of the annual total harvest, while cow elk comprised approximately 35%. Population Several attempts to develop a spreadsheet model have been unsuccessful over the last 5 years. Poor alignment of the bull:cow ratios, harvest percentages of males, and population estimates have rendered the development of a spreadsheet model unsuitable. However, on-going efforts to assess population performance were based on annual trend counts conducted since 2007 As a
112

result, the trend count management objective was developed and implemented in 2015 to better utilize observed data to estimate population trend and size.. Trend counts appear to represent a more reasonable depiction of this population’s performance, which has averaged approximately 2170 elk over the last three years. Management Summary The 2016 hunting season is designed to maintain the mid-winter trend objective. The lower Greys River (HA 89) will close on October 31, which is the same season closing date as in 2015. The general any elk portion of the hunting season in Area 89 will be decreased by one day from a closing date on October 18 in 2015 to a closing date on October 17 in 2016. Antlered elk only hunting will continue on October 18 and close on October 31. The longer season in Area 89 is in response to the number of elk counted during the 2014 and 2015 winter trend count on native winter ranges in the Greys River watershed. Management will continue to emphasize antlerless elk harvest in Area 90 by enabling general and limited quota type 6 license holders to hunt into November. The Area 90 Type 6 additional cow or calf licenses will remain at 250 licenses in an effort to increase harvest. The season length for limited quota Type 6 licenses will extend into November as it has since 2006 in an effort to encourage hunters to harvest antlerless elk in an area where the Forest Park feedground quota has exceeded the Commission-established quota. In Area 91 the number of Type 6 cow or calf only licenses will be maintained at 175 licenses in response to higher elk numbers being observed in 2014 and 2015. The increase in Type 6 licenses will address elk damage concerns along the eastern portion of area 91. Season dates for this license will continue to extend through the end of January. Based on past harvest statistics, the 2016 hunting seasons will result in a harvest of 750 elk. The 2016 harvest should maintain the population within +/- 20% of the annual three-year trend count average of 2200 following the 2016 hunting season.
113

BRUCELLOSIS MANAGEMENT (E105) - 2015
BRUCELLOSIS SURVEILLANCE/RESEARCH
Greys River Feedground A total of 79 elk were captured at this feedground on January 23rd, 2016, and 62 blood samples were collected from yearling and older cows to determine brucellosis serostatus and herd genetics. From 2008-2015, 22 GPS collars and 43 VITs have been deployed on/in elk captured from the Greys River feedground. GPS collar data indicate some elk movement north into the Fall Creek elk herd and some movement west into Idaho, but most elk use occurs in HA 88 and the northwestern corner of HA 89. Among the 43 VITs, WGFD personnel identified the locations of 32 parturition sites and 4 reproductive failures. One elk died prior to expelling the VIT, one elk’s VIT was classified as unknown (could not be located), and 5 VITs were still implanted and being monitored while as of this writing. These data are allowing managers to assess feedground interchange and define areas of high risk for inter and intra-specific brucellosis transmission.
Table 1. Eartag records of elk captured on Greys River feedground on 1/23/16.
Ear Tag UID Sex Age Class Age Est
Visibility Collar Color
VIS Collar
A2650 2534 Female Adult 6‐9 Blue E3 A2651 2534 Female Adult 6‐9 Blue E3 A2791 2589 Female Adult >=10 Blue T8 A3134 10023 Female Adult 6‐9 Blue S4 A3141 7770 Female Adult >=10 Blue F1 A3320 5427 Female Adult >=10 Blue T6 A3321 5427 Female Adult >=10 Blue T6 A3393 5473 Female Adult >=10 Blue NONE A3425 7770 Female Adult >=10 Blue F1 A3789 4043 Female Adult 6‐9 Blue NONE A3790 4043 Female Adult 6‐9 Blue NONE A3911 4599 Female Adult 6‐9 Blue F4 A3912 4599 Female Adult 6‐9 Blue F4 A4444 9100 Female Adult >=10 Blue NONE A4445 9100 Female Adult >=10 Blue NONE A4561 5106 Female Adult 6‐9 Blue E1 A4562 5106 Female Adult 6‐9 Blue E1 A4646 10080 Female Adult >=10 Blue E8 A4647 10080 Female Adult >=10 Blue E8 A4721 13453 Female Adult 2‐5 Blue G9 A4826 6715 Female Adult 6‐9 Blue NONE A4827 6715 Female Adult 6‐9 Blue NONE A4922 12059 Female Adult >=10 Blue G0 A4923 12059 Female Adult >=10 Blue G0 A5348 10099 Female Adult 2‐5 Blue F6 A5349 10099 Female Adult 2‐5 Blue F6 A5614 11945 Female Adult >=10 Blue S5
114

115

116

2015 - JCR Evaluation Form
SPECIES: Moose PERIOD: 6/1/2015 - 5/31/2016
HERD: MO101 - TARGHEE
HUNT AREAS: 16, 37 PREPARED BY: ALYSON COURTEMANCH
2010 - 2014 Average 2015 2016 Proposed
Harvest: 5 4 5
Hunters: 6 5 5
Hunter Success: 83% 80% 100 %
Active Licenses: 6 5 5
Active License Success: 83% 80% 100 % Recreation Days: 42 54 60
Days Per Animal: 8.4 13.5 12
Males per 100 Females: Juveniles per 100 Females
Management Strategy: Special
Percent population is above (+) or (-) objective: 0%
Number of years population has been + or - objective in recent trend: 0
Population Objective Type: Limited Opportunity
Primary Objectives: 1. Achieve a 5-year median age of ≥ 4.5 years for harvested moose, and2. Achieve a 5-year average of ≤ 12 days/animal to harvest.
Secondary Objective: Achieve a 5-year average of 40% of harvested moose are > 5 years of age.
117

118

119

2016 HUNTING SEASONS TARGHEE MOOSE HERD (MO101)
Special Archery Seasons
Season Dates Hunt Area Opens Closes
16, 37 Sep. 1 Sep. 14 Management Evaluation Management Strategy: Special Population Objective Type: Limited Opportunity Primary Objectives: 1. Achieve a 5-year median age of ≥ 4.5 years for harvested moose, and 2. Achieve a 5-year average of ≤ 12 days/animal to harvest. Secondary Objective: Achieve a 5-year average of 40% of harvested moose are > 5 years of age. The Wyoming Game and Fish Department (WGFD) proposed changing the objective for the Targhee Moose Herd from a postseason population objective to a limited opportunity objective in 2014. The objective change was needed because the herd is rarely surveyed due to budget priorities elsewhere and spreadsheet models do not appear to adequately simulate observed population trends. In addition, the interstate nature of the herd poses additional challenges to population surveys and management. A limited opportunity objective was adopted in 2014 after public review, and included primary and secondary objectives (listed above). In 2015, the median age of harvested moose was 6.5 years (n = 4 samples, range = 3.5-10.5 years). The median age of harvested moose for the past 5 years is 4.5 years (n = 15 samples) (Fig. 1). Therefore, the first primary objective of a median age of ≥ 4.5 years for harvested moose for 5 years is currently being met. In 2015, the average number of days per animal to harvest was 13.5. This is higher than the last two years, when average days to harvest were 4. The 5-year average of number of days per animal to harvest was 9.6 (Fig. 2). Therefore, the second primary objective of a 5-year average of ≤ 12 days/animal to harvest is currently being met.
Hunt Area Type Season Dates Quota License Limitations Opens Closes 16, 37 1 Sep. 15 Nov. 15 5 Limited quota Antlered moose
120

In 2015, four hunters submitted tooth samples from harvested moose for aging. Two moose were > 5 years of age (9 and 10 years old). During the past 5 years, 15 hunters have submitted tooth samples for aging. Of those, 7 moose were aged at > 5 years (5.5, 6.5, 7.5, 7.5, 9.5, 10.5, and 10.5 years). Therefore, the secondary objective of at least 40% of harvested moose being > 5 years of age is currently met, although sample sizes are low (Fig. 3).
n=114
n=34
n=13
0
1
2
3
4
5
6
2000-2005 2006-2010 2011-2015
Age
Median Age of Harvested Moose
Fig. 1. Median age of harvested moose in the Targhee Herd in 5-year periods, from 2000-2015. The dashed line indicates the objective of ≥ 4.5 years old.
02468
101214161820
2001-2005 2006-2010 2011-2015
Days
to h
arve
st
Average Days to Harvest
10.1 10.79.6
Fig. 2. Average number of days per animal harvested in the Targhee Moose Herd, from 2001-2015. The dashed line indicates the objective of ≤ 12 days per animal harvested.
121

Fig. 3. Percent of harvested moose in the Targhee Moose Herd that are over 5 years old, from 2000-2015. The dashed line indicates the objective of > 40%. Herd Unit Issues Spreadsheet models developed for this moose herd do not appear to adequately simulate observed trends. This population is very difficult to survey and manage through harvest due to its interstate nature. Post-season classification surveys are not flown in this herd due to budget constraints. However, moose were opportunistically recorded during an aerial survey of the Targhee bighorn sheep herd in March 2015. Two cows, 2 calves, 5 bulls, and 1 unclassified adult were observed. Winter ranges are primarily low elevation mountain shrub and aspen communities and riparian willow and spruce/fir communities. On more severe winters, moose may move west along riparian corridors towards the Teton River in Idaho. Many of the mountain shrub and aspen communities along the state line are old and decadent. Serviceberry, chokecherry, and mountain mahogany are often over 10 feet tall, above the browse zone for moose. Harvest was as high as 70 moose in 1990 and 1991. License quotas were then decreased as harvest statistics and public comments indicated the population was decreasing. The license quota has been 5 antlered moose in recent years. Weather Spring and summer 2015 produced consistent moisture, leading to good forage production. Fall was relatively mild with no significant snowfall until mid-December. By early February, low elevation slopes were beginning to melt out. At the time of the mid-winter survey, winter precipitation was reported at 91% of normal in the Snake River Basin. Please refer to the following web sites for specific weather station data. http://www.wrds.uwyo.edu/wrds/nrcs/snowprec/snowprec.html and http://www.ncdc.noaa.gov/oa/climate/research/prelim/drought/pdiimage.html
122

Habitat There are no permanent vegetation transects in moose winter ranges for the Targhee Herd. Several habitat improvement projects are being planned in this herd unit, including the Hill Creek Prescribed Burn, which is scheduled for completion in 2016. In addition, a habitat treatment in Teton Canyon is currently in the planning stages to improve mountain shrub and aspen communities for moose and other big game. The WGFD is assisting Caribou-Targhee National Forest (CTNF) with vegetation monitoring in aspen stands pre and post-treatment. Please refer to the 2015 Annual Report Strategic Habitat Plan Accomplishments for Jackson Region habitat improvement project summaries (https://wgfd.wyo.gov/Habitat/Habitat-Plans/Strategic-Habitat-Plan-Annual-Reports). Field Data There were no field data collected in the Targhee Herd Unit during the 2015 biological year. Harvest Data To offset observed population declines, antlerless harvest was eliminated from the Targhee moose herd in 2006 and the two hunt areas were combined in 2011. In spite of these changes the moose population did not increase significantly. Data from the 2015 harvest survey indicate that 4 hunters harvested 5 bulls. Harvest success has been consistently high for past 5 years (>80%). The average number of days to harvest was higher in 2015 at 13.5 days compared to 2014 at 4.0 days and 2013 at 4.8 days, however sample size is low. In 2015, hunters harvested a 9.5 year-old and a 10.5 year-old moose, indicating that older age classes are present in the population. In 2015, average antler width of harvested moose was 43.3 inches (max=46 inches). Population Due to budget constraints, there have been no mid-winter surveys in the Targhee herd since 2009. Based on the 2009 survey this population is likely 150-200 moose. Similar to the Jackson moose herd this population appeared to decline during the early 2000s. Management Summary Due to the “interstate” nature of this population, managing this herd is difficult. Moose along the state line spend summer and early fall in Wyoming and winter along drainages in the foothills of the Teton Range. The population has not responded to hunting season changes and it is likely that numerous factors are influencing recruitment and survival of moose in this population, including long-term drought, warming climate, parasites, disease, and predation. Managers plan to maintain limited hunting opportunity west of the Teton Range. Hunter success
123

and effort from the last few years suggest this population may be increasing. Managers are not proposing an increase to licenses in 2016 and will continue to monitor average age and harvest statistics. Additional effort to contact hunters and increase tooth sample returns will be made. The WGFD continues to work closely with CTNF to develop habitat improvement projects for moose and other big game species.
124

125

126

2015 - JCR Evaluation Form
SPECIES: Moose PERIOD: 6/1/2015 - 5/31/2016
HERD: MO103 - JACKSON
HUNT AREAS: 7, 14-15, 17-19, 28, 32 PREPARED BY: ALYSON COURTEMANCH
2010 - 2014 Average 2015 2016 Proposed
Trend Count: 295 228 300
Harvest: 13 9 10
Hunters: 15 10 10
Hunter Success: 87% 90% 100%
Active Licenses: 15 10 10
Active License Success 87% 90% 100% Recreation Days: 101 67 70
Days Per Animal: 7.8 7.4 7
Males per 100 Females: 79 74
Juveniles per 100 Females 29 45
Trend Based Objective (± 20%) 800 (640 - 960)
Management Strategy: Special
Percent population is above (+) or (-) objective: -71.5%
Number of years population has been + or - objective in recent trend: 20
Three-year average
127

128

129

2010 - 2015 Postseason Classification Summary
for Moose Herd MO103 - JACKSON
MALES FEMALES JUVENILES Males to 100 Females Young to
Year Post Pop Ylg Adult Total % Total % Total % Tot Cls
Cls Obj Ylng Adult Total
Conf Int
100 Fem
Conf Int
100 Adult
2010 919 0 0 134 32% 224 54% 55 13% 413 459 0 0 60 ± 0 25 ± 0 15 2011 896 0 0 113 38% 149 50% 36 12% 298 389 0 0 76 ± 10 24 ± 5 14 2012 500 0 0 99 42% 103 44% 34 14% 236 389 0 0 96 ± 13 33 ± 6 17 2013 500 0 112 112 39% 126 44% 46 16% 284 416 0 89 89 ± 10 37 ± 5 19 2014 450 0 101 101 42% 105 44% 35 15% 241 389 0 96 96 ± 12 33 ± 6 17 2015 450 0 77 77 34% 104 46% 47 21% 228 395 0 74 74 ± 0 45 ± 0 26
2016 HUNTING SEASONS JACKSON MOOSE HERD (MO103)
Hunt Area Type Dates of Seasons Quota License Limitations Opens Closes 7, 14, 15, 19, 32 CLOSED
17, 28 1 Sep. 15 Oct. 31 5 Limited quota Antlered moose 18 1 Oct. 1 Oct. 31 5 Limited quota Antlered moose
Special Archery Seasons
Management Evaluation
Mid-Winter Trend Count Objective: 800 Secondary Objectives:
1. Maintain a 5-year running average of at least 40% of male harvest ≥ 5 years of age, and2. Maintain a 3-year median age of ≥ 4.5 years old for harvested moose.
Management Strategy: Special 2015 Mid-Winter Trend Count: 228 3-Year Mid-Winter Trend Average (2013-2015): 251
The mid-winter trend count objective for the Jackson Moose Herd is 800 moose. The management strategy is special and the objective and management strategy were last revised in
Dates of Seasons Hunt Area Opens Closes 17, 28 Sep. 1 Sep. 14 18 Sep. 1 Sep. 30
130

2015. The herd objective was publicly reviewed in 2015 and changed to a mid-winter trend count objective of 800 moose. The 2015 current trend count is 228 moose and the 3-year average is 251 moose. The first of the secondary objectives is currently not being met. The average percent male harvest ≥ 5 years of age from 2011-2015 was 36.8% (n=33). The average from 2006-2010 was 35.6% (n=133). The second of the secondary objectives is currently being met. The 3-year median age for harvested moose is 4.5 years (n=20) for 2013-2015. The median age from 2010-2012 was 3.5 years (n=27). In general, managers would like to see the average age of harvested moose increase in the herd unit. Herd Unit Issues This population is 80% below its postseason management objective. Native moose populations naturally expanded and colonized the Jackson area in the late 19th century. The species’ arrival was followed by a classic exponential population increase, peaking at approximately 3,000-5,000 animals (depending on modeling techniques). For many years, the Jackson Herd served as a source for moose transplants in multiple states and supported nearly 500 hunting licenses. However, the population underwent a dramatic population crash beginning in the early 1990s. Despite drastic reductions in hunting licenses, the population has failed to recover and continues to decline. Research on moose in the northern portion of the herd unit indicated that a number of factors are influencing this population (Houston 1968, Berger 2004, Becker 2008, Vartanian 2011). Similar to other moose herds throughout the western United States and New England, the Jackson Herd is impacted by a combination of factors, including long-term drought, severe wildfires, a warming climate, predation, parasites, and disease. Moose in the Jackson Herd are exposed to predation by several large carnivore species. Large scale wildfires during the late 1980s and more recently have influenced summer moose habitat. Parasites such as carotid artery worm and winter ticks, as well as re-colonization by large carnivores pose additional challenges. In spite of hunting season closures and a reduction in the number of licenses, this population has not responded to management changes. Weather Spring and summer 2015 produced consistent moisture, leading to good forage production. Fall was relatively mild with no significant snowfall until mid-December. By early February, low elevation slopes were beginning to melt out. The relatively shallow snow depths in winter 2015/2016 result in reduced energy expenditure for moose, but consistent daytime temperatures of 30 and 40 degrees in February cause heat stress for moose. At the time of the mid-winter survey, winter precipitation was reported at 91% of normal in the Snake River Basin. Please refer to the following web sites for specific weather station data. http://www.wrds.uwyo.edu/wrds/nrcs/snowprec/snowprec.html and http://www.ncdc.noaa.gov/oa/climate/research/prelim/drought/pdiimage.html
131

Habitat
Browsing pressure varies greatly between winter ranges, but on average, about 25% of willow leaders were browsed in winter 2012/2013. Winter ranges were not monitored in winter 2013/2014 or 2014/2015. Live-dead indices are generally positive, indicating that browsing pressure is not preventing willows from reaching their natural height. Monitoring indicates that moose winter ranges are slowly improving north of Jackson. Summer habitat has been modified by several large-scale wildfires in recent years, greatly reducing thermal cover for moose.
The Wyoming Game and Fish Department (WGFD) and Bridger-Teton National Forest (BTNF) initiated a project to monitor the short-term and long-term nutritional changes in moose forage species after wildfire at different severities. This project will track the nutritional content over 10 years of key forage species that burned at several fire severities during the Red Rock Fire in the Gros Ventre in 2011. Also, a current study by a doctoral student at the Wyoming Cooperative Research Unit (Brett Jesmer) is further investigating relationships between habitat condition and moose population performance statewide, including the Jackson herd. Please refer to the 2015 Strategic Habitat Plan Annual Report for Jackson Region habitat improvement project summaries (https://wgfd.wyo.gov/Habitat/Habitat-Plans/Strategic-Habitat-Plan-Annual-Reports).
Field Data
In February 2016, classification surveys were flown over low elevation winter ranges. We observed 228 moose this year. This count is down from 241 observed in 2014 and 284 in 2013. However, a significant portion of winter range in the Gros Ventre was not surveyed this year, which usually supports approximately 30 moose. The calf ratio increased this year to 45 calves:100 cows, which is higher than the 2014 ratio (33:100) and 2013 ratio (37:100). This ratio has been slowly improving since 2008 when a ratio of 15:100 was observed. Notably, calf ratios improved in the Buffalo Valley/Spread Creek area (46 calves:100 cows) where they have been low for years. The overall bull ratio also remained high this year at 74:100.
Sixteen calf/cow pairs were observed in the Gros Ventre, with a calf:cow ratio of 48:100. Sixteen calf/cow pairs were observed in the Buffalo Valley and Spread Creek. Bull ratios continue to be high in the Gros Ventre where open hunt areas are located with 110 bulls:100 cows.
Moose densities in the Willow Flat/Oxbow Bend Area have declined from an average of 4 moose per km2 in 2000 to 0.16 moose per km2 in 2010 and 2012. No moose were observed in the Willow Flats area during the February 2016 classification flight. The density of moose has also declined on winter ranges in the Buffalo Valley area. Houston (1968) documented winter moose densities as high as 50 moose per square mile. In recent years, the highest densities observed are 12-17 moose per square mile.
132

Harvest Data
During the 2015 season, 10 hunters harvested 9 bull moose in the Jackson Herd in Hunt Areas 17/28 and 18 in the Gros Ventre drainage. During 2015, hunter success remained high at 90% and hunter effort was 7.4 days per animal compared to 8.3 days in 2014 and 4.3 days in 2013. Four hunters from Area 17/28 and three hunters from Area 18 submitted tooth samples and antler widths from harvested moose. Moose harvested from Area 17/28 were 3, 4, 6, and 6 years old and moose harvested from Area 18 were all 4 years old. Average antler width from Area 17/28 was 45.2 inches (max=59 inches) and average from Area 18 was 41.8 inches (max=45.5 inches).
Secondary objectives for the Jackson Herd Unit are to, 1) maintain a 5-year running average of at least 40% of male harvest ≥ 5 years of age, and 2) maintain a 3-year median age of ≥ 4.5 years old for harvested moose. The first of the secondary objectives is currently not being met (Fig. 1). The average percent male harvest ≥ 5 years of age from 2011-2015 was 36.8% (n=33). The average from 2006-2010 was 35.6% (n=133). The second of the secondary objectives is currently being met (Fig. 2). The 3-year median age for harvested moose is 4.5 years (n=20) for 2013-2015. The median age from 2010-2012 was 3.5 years (n=27). In general, managers would like to see the average age of harvested moose increase in the herd unit.
Fig. 1. Average percent of harvested males in the Jackson Herd Unit over 5 years old, in 5-year periods from 2000-2015. The dashed line indicates the objective of ≥ 40%.
n = 348
n = 133 n = 33
133

Fig. 2. Median ages of harvested moose in the Jackson Herd Unit, in 3-year periods from 2007-2015. The dashed line indicates the objective of ≥ 4.5 years.
Population
POP II simulations likely overestimated moose numbers in the Jackson population. Spreadsheet models developed for this herd also do not appear to adequately simulate observed trends. Based on the observability of marked animals during recent research projects it is likely there are fewer than 500 animals in this population. Although the population remains low, aerial survey data from recent postseason classifications indicate a high number of bull moose and an improving calf:cow ratio. However, the low number of cows in the population suggests that any present or future recovery will be slow.
Management Summary
To offset observed population declines, antlerless moose hunting was eliminated in the Teton Wilderness in 2001 and in the Gros Ventre drainage in 2004. Antlered moose hunting seasons were closed in the Teton Wilderness in 2011 (Areas 7, 14, 15 and 32), and Areas 17 and 28 were combined into one unit beginning in the 2012 season. Despite these changes the moose population north of Jackson continued to decline through 2015. Although calf:cow ratios have improved in recent years, overall numbers of moose remain low. Even with current calf:cow ratios, any population recovery will be slow due to the low numbers of cow moose.
Conservative hunting seasons are again planned for 2016 with 10 licenses offered for the Gros Ventre drainage. The herd will continue to be closely monitored in future years to evaluate whether additional hunting opportunities can be provided. The high bull:cow ratios indicate that some harvest is sustainable at this time and complete closure to moose hunting in the Jackson Herd is not warranted for 2016.
n = 95
n = 27
n = 20
134

References
Anderson, C. R., and F. G. Lindzey. 1996. A sightability model for moose developed from helicopter surveys. Wildl. Soc. Bull. 24:247-259.
Bartholow, J. 1999. POP-II System Documentation. Fossil Creek Software. Fort Collins, Colorado, USA.
Becker, S.A. 2008. Habitat selection, condition, and survival of Shiras moose in northwest Wyoming. M.S. Thesis. University of Wyoming, Laramie, Wyoming, USA, 224 pp.
Becker, S.A., M.J. Kauffman, and S.H. Anderson. 2010. Nutritional condition of adult female Shiras moose in northwest Wyoming. Alces 46:151-166.
Berger, J., J. E. Swenson, and I.-L. Persson. 2001. Recolonizing carnivores and naïve prey: conservation lessons from Pleistocene extinctions. Science 291: 1036-1039.
Berger, J., 2004. Does predation drive moose population declines in northwest Wyoming – a ten year study. A Report to the Wyoming Wildlife Commission, 9 Sept 2004. 38 pp.
Berger, J. 2007. Fear, human shields and the redistribution of prey and predators in protected areas. Biology Letters 3: 620-623.
Blair, N. 1987. The history of wildlife management in Wyoming. Wyoming Game and Fish Department. Cheyenne, Wyoming, USA.
Brimeyer, D. G., and T. P. Thomas. 2004. History of moose management in Wyoming and recent trends in Jackson Hole. Alces 40: 133-143.
Denniston, R. H., II. 1956. Ecology, behavior and population dynamics of the Wyoming or Rocky Mountain moose, Alces alces shirasi. Zoologica 41: 105-118.
Harry, G. B. 1957. Winter food habits of moose in Jackson Hole, Wyoming. Journal of Wildlife Management 21: 53-57.
Henningsen, J.C., A.L. Williams, C.M. Tate, S.A. Kilpatrick, and W.D. Walter. 2012. Distribution and prevalence of Elaeophora schneideri in moose in Wyoming. Alces 48:35-44.
Hnilicka, P., and M. Zornes 1994. Status and management of moose in Wyoming. Alces 30:101-107.
Houston, D. B. 1968. The Shiras moose in Jackson Hole, Wyoming. Technical Bulletin No. 1. Grand Teton Natural History Association.
135

Jesmer, B. 2014. Statewide moose habitat project: linking habitat and nutrition with population performance in Shiras moose. Annual Report to Wyoming Game and Fish Department, 11 pp.
Jimenez, M. D., E. E. Bangs, S. P. Woodruff, J. A. Stephenson, S. Dewey, and D. Brimeyer. In prep. Prey Selection by wolves and wolf-elk interactions on state-managed winter feed grounds and traditional winter range in western Wyoming. Journal of Wildlife Management.
Kreeger, T. J., W. H. Edwards, E. J. Wald, S. A. Becker, D. Brimeyer, G. Fralick, and J. Berger. 2005. Health assessment of Shiras moose immobilized with thiafentanil. Alces 41: 121-128.
McMillan, J. F. 1953. Some feeding habits of moose in Yellowstone Park. Ecology 34: 102-110
Monteith, K.L., R.W. Klaver, M.J. Kauffman. In press. Effects of climate and plant phenology on recruitment of moose at the southern extent of their range. Oecologia
Pearson, S. M., M. G. Turner, L. L. Wallace, and W. H. Romme. 1995. Winter habitat use by large ungulates following fire in northern Yellowstone National Park. Ecological Applications 5: 744-755.
Rudersdorf, W. J. 1952. The coactions of beaver and moose on a joint food supply in the Buffalo River Meadows and surrounding area in Jackson Hole, Wyoming. Thesis, Utah State Agricultural College, Logan, Utah, USA
Ritchie, B. W. 1978. Ecology of moose in Fremont County, Idaho. Wildlife Bulletin No. 7. Idaho Department of Fish and Game, Boise, Idaho, USA.
Stephenson, J., M. Jimenez, S. Dewey, and S. Cain. 2012. Wildlife research: wolf predation. In Wildlife Conservation, Management, and Research 2012. Ed. Steve Cain, Division of Science and Resource Management, Grand Teton National Park, pp. 56-57.
Stephenson, J., M. Jimenez, S. Dewey, and S. Cain. 2011. Wildlife Research: Wolf Predation. In Wildlife Conservation, Management, and Research 2011. Ed. Steve Cain, Division of Science and Resource Management, Grand Teton National Park, pp. 1-2.
Straley, J.H. 1962. Management of moose in Wyoming. In Big Game Survey, 1961. District I. Wyoming Game and Fish Commission, 8 pp.
Tyers, D. B. 2003. Winter ecology of moose on the northern Yellowstone winter range. Dissertation, Montana State University, Bozeman, Montana, USA.
Tyers, D.B. 2006. Moose population history on the northern Yellowstone winter range. Alces 42:133-149
136

Vartanian, J.M. 2011. Habitat condition and the nutritional quality of seasonal forage and diets: demographic implications for a declining moose population in northwest Wyoming. M.S. Thesis. University of Wyoming, Laramie, Wyoming, USA 89 pp.
Wigglesworth, R. R., and D. G. Wachob. 2004. Historical and present habitat conditions on the Jackson Hole, Wyoming moose winter range. Teton Science Schools Conservation Research Center, Jackson, Wyoming, USA.
137

138

2015 - JCR Evaluation Form
SPECIES: Bighorn Sheep PERIOD: 6/1/2015 - 5/31/2016
HERD: BS106 - TARGHEE
HUNT AREAS: 6 PREPARED BY: ALYSON COURTEMANCH
2010 - 2014 Average 2015 2016 Proposed
Harvest: 1 1 2
Hunters: 2 3 2
Hunter Success: 50% 33% 100 %
Active Licenses: 2 3 2
Active License Success: 50% 33% 100 % Recreation Days: 13 65 40
Days Per Animal: 13 65 20
Males per 100 Females: 155 100
Juveniles per 100 Females 30 30
Management Strategy: Special
Percent population is above (+) or (-) objective: 0%
Number of years population has been + or - objective in recent trend: 0
Population Objective Type: Alternative, Bighorn Sheep
Objectives: 1. Achieve a 5-year average harvest age of 6-8 years,2. Achieve a 5-year average hunter success of ≥ 50%, and3. Document occurrence of adult rams in the population, especially on National Forest lands.
139

140

141

2010 - 2015 Postseason Classification Summary
for Bighorn Sheep Herd BS106 - TARGHEE
MALES FEMALES JUVENILES
Males to 100 Females Young to
Year Post Pop Ylg Adult Total % Total % Total % Tot Cls
Cls Obj Ylng Adult Total
Conf Int
100 Fem
Conf Int
100 Adult
2010 0 0 0 0 0% 0 0% 0 0% 0 0 0 0 0 ± 0 0 ± 0 0 2011 0 0 0 0 0% 0 0% 0 0% 0 0 0 0 0 ± 0 0 ± 0 0 2012 125 0 0 0 0% 0 0% 0 0% 0 0 0 0 0 ± 0 0 ± 0 0 2013 125 0 0 0 0% 0 0% 0 0% 0 0 0 0 0 ± 0 0 ± 0 0 2014 125 3 28 31 54% 20 35% 6 11% 57 123 15 140 155 ± 42 30 ± 13 12 2015 125 1 19 20 43% 20 43% 6 13% 46 120 5 95 100 ± 0 30 ± 0 15
2016 HUNTING SEASONS TARGHEE BIGHORN SHEEP HERD (BS106)
Hunt Area Type Dates of Seasons Quota License Limitations Opens Closes
6 1 Aug. 15 Oct. 31 2 Limited quota Any ram (1 resident, 1 nonresident)
Special Archery Seasons
Season Dates Hunt Area Opens Closes
6 Aug. 1 Aug. 14
Summary of 2016 License Changes
Hunt Area Type Change from 2015
6 1 - 1 resident, + 1 nonresident Management Evaluation Management Strategy: Special Population Objective Type: Alternative, Bighorn Sheep Objectives: 1. Achieve a 5-year average harvest age of 6-8 years, 2. Achieve a 5-year average hunter success of ≥ 50%, and 3. Document occurrence of adult rams in the population, especially on National Forest lands.
142

The Wyoming Game and Fish Department (WGFD) proposed changing the objective for the Targhee Bighorn Sheep Herd from a postseason population objective to an alternative population objective in 2014. The objective change was needed because the herd is rarely surveyed due to budget constraints, challenging weather conditions, and spreadsheet models do not appear to adequately simulate observed population trends. Alternative population objectives were adopted in 2014 after public review (listed above). Three hunters hunted in the Targhee Herd in 2015 (2 residents, and 1 nonresident with a medical carryover from 2014). One resident hunter harvested an 8.5 year-old ram in 2015. The 5-year average age of harvested rams is 6.35 years (Fig. 1). Therefore, the first objective of a 5-year average harvest age of 6-8 years is currently met. In 2015, hunter success was 33%. The 5-year average hunter success is 43.2%, which is below the objective of ≥ 50% (Fig. 2). Therefore, the second objective was not met. Success is highly variable year to year due to extremely challenging terrain and movement of sheep between Caribou-Targhee National Forest (CTNF) and Grand Teton National Park (GTNP). Hunter success has improved over the past 10 years in this herd unit, from an average of only 16.6% from 2001-2005. WGFD staff conducted 3 days of bighorn sheep ground surveys in Hunt Area 6 during July and August 2015. Weather conditions were challenging with poor visibility due to smoke. Three rams (1/2 curl) were observed above Camp Lake in the South Fork of Bitch Creek on CTNF in July 2015. In addition, winter aerial surveys of the Targhee Bighorn Sheep Herd were conducted in March 2015 and February 2016. A summary report of these surveys is included in Appendix I. A total of 46 sheep were observed during the 2016 survey (20 ewes, 6 lambs, 1 yearling ram, and 19 mature rams (11 of these had >3/4 curl horns)). A total of 57 sheep were observed during the 2015 survey (20 ewes, 6 lambs, 3 yearling rams, 18 rams with < ¾ curl horns, and 10 rams with > ¾ curl horns). Sightability of sheep was difficult both years due to the unusually warm weather, which caused sheep to move off their high elevation winter ranges early and onto open, south-facing slopes at mid-elevations during the survey. As a result, sheep were widely distributed and difficult to track and observe from the air, which led to lower counts than expected. The third objective is met because rams were documented using areas on National Forest lands in summer and in winter.
143

0
1
2
3
4
5
6
7
8
9
2001-2005 2006-2010 2011-2015
Age
Average Age of Harvested Sheep
Fig 1. Five-year averages of age of harvested bighorn sheep in the Targhee Herd, 2001-2015. Dashed lines represent objective of 6-8 years old.
0
10
20
30
40
50
60
70
2001-2005 2006-2010 2011-2015
Perc
ent
Percent Hunter Success
Fig. 2. Five-year averages of percent hunter success in the Targhee Herd, 2001-2015. Dashed line represents objective of ≥ 50% success. Herd Unit Issues Current bighorn sheep occupied habitat is located at high elevations year-round in the Teton Range, mostly in GTNP. Bighorn sheep winter on high elevation, windswept ridgelines in upper Jensen Canyon, Mt. Hunt, Prospectors Mountain, Static Peak, Mt. Wister, Ranger Peak, Doane Peak, and Elk Mountain. Winter habitat is most likely the limiting factor for this population. Transitional and summer ranges also include Darby, Fox, Moose and Teton Creeks on CTNF. Historically, this population was migratory and wintered at low elevations around Jackson Hole and Teton Valley, Idaho. In the past, hunters have had a difficult time locating sheep outside of GTNP. However, bighorn sheep have recently increased their use of habitats on CTNF due to willing-seller buy-outs of domestic sheep allotments brokered by the Wyoming Wild Sheep
16.6%
41.6% 43.2%
144

Foundation. In 1997 the revised CTNF Plan called for the retirement of the domestic sheep allotments on the west side of the Tetons. In 2004, the fifth and final domestic sheep allotment was bought with bighorn sheep conservation funds and closed by CTNF. Recently, data from radio-collared bighorn sheep have showed the importance of these areas, especially during the spring. Mountain goat sightings have been increasing north of Wyoming Highway 22 indicating that their distribution is expanding north from the Snake Range into the Teton Range. In 2008, the first confirmed sighting of a nanny with kids was reported, suggesting an establishing population. It is estimated that approximately 60 mountain goats currently occupy the Teton Range. GTNP deployed radio-collars on 5 mountain goats in December 2014. Disease sampling of those individuals found that they carry the respiratory bacteria Bibersteinia trehalosi. In the future, field managers may need to consider potential impacts of an expanding mountain goat population on this small, native bighorn sheep herd. Expanding winter backcountry recreation also impacts available winter habitat for bighorn sheep. Recent research from the Wyoming Cooperative Research Unit indicates that Targhee bighorn sheep avoid backcountry ski routes, even if they are in otherwise high quality habitat. This further constricts available winter habitat for bighorn sheep (Courtemanch, 2014). Additional research on this herd is planned beginning in 2016. Objectives of the research are to capture and collar at least 10 ewes, obtain respiratory disease samples and blood samples to test pregnancy, and monitor movements and habitat use in relation to collared mountain goats. GTNP is currently developing a mountain goat management plan that is expected to be released for public comment in 2016. Weather Spring and summer 2015 produced consistent moisture, leading to good forage production. Fall was relatively mild with no significant snowfall until mid-December. By early February, low elevation slopes were beginning to melt out. At the time of the mid-winter survey, winter precipitation was reported at 91% of normal in the Snake River Basin. Please refer to the following web sites for specific weather station data. http://www.wrds.uwyo.edu/wrds/nrcs/snowprec/snowprec.html and http://www.ncdc.noaa.gov/oa/climate/research/prelim/drought/pdiimage.html Habitat A habitat treatment in Teton Canyon is currently in the planning stages to improve historical bighorn sheep winter and summer habitat. The WGFD is assisting Caribou-Targhee National Forest (CTNF) with vegetation monitoring pre and post-treatment. Please refer to the 2015 Annual Report Strategic Habitat Plan Accomplishments for Jackson Region habitat improvement project summaries (https://wgfd.wyo.gov/Habitat/Habitat-Plans/Strategic-Habitat-Plan-Annual-Reports).
145

Field Data WGFD personnel conducted 3 days of bighorn sheep ground surveys in Hunt Area 6 during July and August 2015. Areas in Darby Canyon and the North and South Forks of Bitch Creek were surveyed. Weather conditions were challenging with poor visibility due to smoke. Three rams (1/2 curl) were observed above Camp Lake in the South Fork of Bitch Creek on CTNF in July 2015. In addition, winter aerial surveys of the Targhee Bighorn Sheep Herd were conducted in February 2016 and March 2015. A summary report of these surveys is included in Appendix I. A total of 46 sheep were observed during the 2016 survey (20 ewes, 6 lambs, 1 yearling ram, and 19 mature rams (11 of these had > ¾ curl horns)). Of these, 6 mature rams, 7 ewes, and 1 lamb were observed in Hunt Area 6 (see Appendix I). The lamb:ewe ratio was 30:100 and the ram:ewe ratio was 100:100. A total of 57 sheep were observed during the 2015 winter survey (20 ewes, 6 lambs, 3 yearling rams, 18 rams with < ¾ curl horns, and 10 rams with > ¾ curl horns). The lamb:ewe ratio was 30:100 and the ram:ewe ratio was 155:100. Sightability of sheep was difficult both years due to the unusually warm weather this year, which caused sheep to move off their high elevation winter ranges early and onto open, south-facing slopes at mid-elevations during the survey. As a result, sheep were widely distributed and difficult to track and observe from the air, which led to lower counts than expected. Harvest Data In 2015, there were 3 active licenses in the Targhee Herd (2 residents and 1 nonresident with a medical carryover). One resident hunter harvested an 8-year old ram. The hunter spent 65 days in the field. Population This population is estimated to be stable at approximately 100-125 animals. Management Summary Two licenses will be available for this herd in 2016 (1 resident and 1 nonresident). No changes are proposed to the 2016 hunt season. This bighorn sheep population is distributed both within GTNP and along its boundary in remote steep terrain making it difficult for hunters to locate and stalk sheep. As a result, harvest levels have remained low and on some years no sheep are harvested. Given the limited number of ram-only licenses available and periodic harvest, hunting is likely not having an impact on this population. Two licenses for any ram will be offered for future hunts until more sheep are observed occupying areas outside GTNP on CTNF lands.
146

Bibliography Courtemanch, A.B. 2014. Seasonal habitat selection and impact of winter backcountry recreation on a formerly migratory bighorn sheep population in northwest Wyoming. M.S. Thesis. University of Wyoming, Laramie, WY, USA. Fitzsimmons, N., S.W. Buskirk, and M.H. Smith. 1995. Population history, genetic variability and horn growth in bighorn sheep. Conservation Biology 9:314-323. Kardos, M.D., S. Dewey, S.J. Amish, J. Stephenson, and G. Luikart. In prep. Strong fine-scale population structure of Grand Teton National Park bighorn sheep suggests important role of philopatry in bighorn population subdivision. Whitfield, M.B. 1983. Bighorn sheep history, distributions and habitat relationships in the Teton Mountain Range, Wyoming. M.S. Thesis. Idaho State University, Pocatello, Idaho, USA.
147

148

2015 - JCR Evaluation Form
SPECIES: Bighorn Sheep PERIOD: 6/1/2015 - 5/31/2016
HERD: BS107 - JACKSON
HUNT AREAS: 7 PREPARED BY: ALYSON COURTEMANCH
2010 - 2014 Average 2015 2016 Proposed
Trend Count: 258 307 350
Harvest: 8 9 12
Hunters: 11 11 12
Hunter Success: 73% 82% 100%
Active Licenses: 11 11 12
Active License Success 73% 82% 100% Recreation Days: 82 158 168
Days Per Animal: 10.2 17.6 14
Males per 100 Females: 62 46
Juveniles per 100 Females 31 41
Trend Based Objective (± 20%) 400 (320 - 480)
Management Strategy: Special
Percent population is above (+) or (-) objective: -23.2%
Number of years population has been + or - objective in recent trend: 13
149

150

151

2010 - 2015 Postseason Classification Summary
for Bighorn Sheep Herd BS107 - JACKSON
MALES FEMALES JUVENILES Males to 100 Females Young to
Year Post Pop Ylg Adult Total % Total % Total % Tot Cls
Cls Obj Ylng Adult Total
Conf Int
100 Fem
Conf Int
100 Adult
2010 423 17 71 88 29% 152 51% 59 20% 299 298 11 47 58 ± 6 39 ± 4 25 2011 454 18 121 139 33% 217 52% 61 15% 417 349 8 56 64 ± 3 28 ± 1 17 2012 350 17 65 82 34% 133 55% 28 12% 243 256 13 49 62 ± 6 21 ± 3 13 2013 350 14 84 98 37% 130 49% 40 15% 268 292 11 65 75 ± 6 31 ± 3 18 2014 400 10 84 94 28% 173 52% 63 19% 330 285 6 49 54 ± 4 36 ± 3 24 2015 425 12 75 87 25% 188 53% 77 22% 375 280 6 40 46 ± 0 41 ± 0 28
2016 HUNTING SEASONS JACKSON BIGHORN SHEEP HERD (BS107)
Hunt Area Type Season Dates Quota License Limitations Opens Closes
7 1 Sep. 1 Oct. 31 12 Limited quota
Any bighorn sheep
Special Archery Seasons
Season Dates Hunt Area Opens Closes
7 Aug. 15 Aug. 31
Summary of 2016 License Changes
Area Type Quota change
from 2015 Other changes from 2015
7 1 +1 +1 license will be nonresident
152

Management Evaluation
Mid-Winter Trend Count Objective: 400 on key winter ranges Secondary Objective: Maintain a 3-year running average age of harvest rams 6-8 years old Management Strategy: Special
2015 Mid-Winter Trend Count: 307 on key winter ranges 2016 Proposed Mid-Winter Trend Count: 350 3-Year Mid-Winter Trend Average (2013-2015): 291
The mid-winter trend count objective for the Jackson Bighorn Sheep Herd is 400 sheep on key winter ranges. The management strategy is special and the objective and management strategy were last revised in 2015. The herd objective was publicly reviewed in 2015 and changed to a mid-winter trend count objective of 400 sheep because spreadsheet models do not adequately simulate population trends. The current trend count is 307 sheep on key winter ranges.
The secondary objective for the herd is to maintain a 3-year running average age of harvested rams between 6-8 years old. Currently, this objective is being met. The average age of harvested rams in 2015 was 7.3 years (max = 9.3 years). The average age from 2013-2015 is 7.3 years.
Herd Unit Issues
This population is approximately 23% below the postseason objective of 400 sheep on key winter ranges. This population experienced a pneumonia-related die-off in 2002 and again in 2012. An estimated 30% of the population died during the latest pneumonia event. However, lamb survival rebounded within a couple of years after both outbreaks, leading to relatively quick herd recoveries. If the current trajectory continues, the population should reach objective again within 2-3 years. From 2011–2015, over 40 bighorn sheep were radio-collared to monitor disease, herd demographics, body condition, and migration patterns.
Weather
Spring and summer 2015 produced consistent moisture, leading to good forage production. Fall was relatively mild with no significant snowfall until mid-December. By early February, low elevation slopes were beginning to melt out. At the time of the mid-winter survey, winter precipitation was reported at 91% of normal in the Snake River Basin. Please refer to the following web sites for specific weather station data. http://www.wrds.uwyo.edu/wrds/nrcs/snowprec/snowprec.html and http://www.ncdc.noaa.gov/oa/climate/research/prelim/drought/pdiimage.html
153

Habitat
The Wyoming Game and Fish Department (WGFD) and Bridger-Teton National Forest (BTNF) initiated a project in 2012 to evaluate the short-term and long-term nutritional changes in bighorn sheep forage after wildfire. This project will track the nutritional content over 10 years of key forage species that burned at different fire severities during the Red Rock Fire in the Gros Ventre. Other than this project, there are no established vegetation transects in this herd unit.
The Bryan Flats Habitat Enhancement and Fuels Reduction Project is scheduled for implementation in fall 2016. This prescribed burn project is led by BTNF and will improve bighorn sheep habitat in the Hoback Canyon area. Please refer to the 2015 Annual Report Strategic Habitat Plan Accomplishments for Jackson Region habitat improvement project summaries (https://wgfd.wyo.gov/Habitat/Habitat-Plans/Strategic-Habitat-Plan-Annual-Reports).
Field Data
In the Gros Ventre drainage, approximately 30% of radio-collared bighorn ewes died during a pneumonia outbreak in 2012 and lamb ratios declined from a high of 50 lambs:100 ewes in late June 2012 to 15:100 by February 2013. Carcasses retrieved during the summer indicated that sheep likely died from pneumonia. Additional sampling of live sheep during and after the outbreak indicates that Jackson sheep carry Mycoplasma ovipneumoniae, leukotoxin-positive Mannheimia spp., and leukotoxin-positive Bibersteinia spp.. Helicopter captures in March 2016, as part of a study with the Wyoming Cooperative Fish and Wildlife Research Unit, found several ewes with contagious ecthyma symptoms. Additional ground observations of sheep on Miller Butte recorded approximately 60% of sheep in some groups with symptoms. Additional research is planned for 2015-2017 to track respiratory pathogens, contagious ecthyma, seasonal body condition, pregnancy, and lamb recruitment of individual ewes over time in collaboration with WGFD Vet Services and Wyoming Cooperative Fish and Wildlife Research Unit (see Appendix I and II).
In February 2016, classification surveys were flown over both low and high elevation winter ranges. Bighorn sheep on Miller Butte and Camp Creek were classified from the ground. A total of 375 sheep were observed including 188 females, 77 lambs, 75 adult males, 12 yearling males, and 23 unclassified sheep. Three hundred and two sheep were observed on key winter ranges (areas on Miller Butte, Curtis Canyon, Flat Creek, Hoback area, Lower Slide Lake, Red Hills, and Grey Hills) compared to 299 sheep last year. Herd unit ratios in 2015 were 41 lambs:100 ewes, 40 adult rams:100 ewes and 6 yearling rams:100 ewes. The lamb ratio is higher than last year’s ratio of 36:100, and a ratio of 31:100 in 2013, which suggests that the population is rebounding from the pneumonia outbreak.
Harvest Data
Data from the 2015 harvest survey indicate that 11 hunters harvested 9 rams (82% success). The median age of harvested rams in 2015 was 7.3 years (max = 9.3 years), similar to 2014 at 7.3 years and 2013 at 8.3 years. The number of licenses was increased for the 2015 season from 8 to
154

11 in response to the growing population and strong ram to ewe ratio. Based on classification surveys and the number of mature rams observed in February 2016 (n=75; 45 rams > ¾ curl horns), ram harvest has not affected the ability of the population to recover from the pneumonia outbreak. Given the recent trend of population recovery, managers are increasing licenses to 12 for 2016. Licenses will be distributed to 9 residents and 3 non-residents.
Population
This population is estimated to be approximately 425 sheep, with 307 observed on key winter ranges during 2015 postseason classifications. Past trends seem to indicate that pneumonia outbreaks occur when the population reaches 500-600 animals. Currently, the population is increasing due to relatively high lamb:ewe ratios and may approach the 500 objective within 2-3 years. Therefore, the public and managers should monitor the herd closely and anticipate another pneumonia outbreak in the near future.
Management Summary
Trend data indicate that the Jackson Bighorn Sheep Herd is recovering relatively quickly from a pneumonia outbreak in 2012. Overall numbers have increased in the past 3 years and lamb:ewe ratios continue to improve. Based on past history, pneumonia outbreaks seem to occur when the population reaches 500-600 animals. Therefore, another outbreak should be expected within 2-5 years. Due to the increasing population and availability of rams, managers are increasing licenses from 11 to 12 for 2016. Although this level of ram harvest is not expected to affect population increase, it will provide hunters with harvest opportunities before another pneumonia outbreak occurs. The WGFD plans to continue to monitor the population using radio-collars, disease sampling, and body condition measurements in 2015-2017 to learn more about the interaction of respiratory pathogens, body condition, and population density in causing pneumonia outbreaks.
References
Honess, R.F. and N.M. Frost. 1942. A Wyoming bighorn sheep study. Wyoming Game and Fish Department Bulletin No. 1, 127 pp.
155

Appendix I
2015 Jackson Sheep Monitoring Annual Report Permit #798
Contact: Alyson Courtemanch North Jackson Wildlife Biologist Wyoming Game and Fish Department PO Box 67 Jackson, Wyoming 83001 307-733-2321 [email protected]
Project Background
The Jackson bighorn sheep herd experienced a die-off during 2001-2002 in which approximately 50% of the population died. However, bighorn sheep numbers rebounded to within 10% of the population objective (500 animals) by 2010. During 2010, two male lambs were removed from Russold Hill in early March after it was observed that some of the animals wintering on Russold Hill were exhibiting signs of pneumonia (e.g. coughing, runny nose etc.). Both lambs had minor cases of pneumonia (~15% of the lungs affected), but otherwise were in good health with moderate fat stores. Over the next couple of years, an effort was made to capture and radio-collar bighorn sheep on winter ranges north of Jackson and in the Camp Creek area to track survival and movements. In 2011 and 2012, approximately 30% of radio-collared sheep died, with several confirmed pneumonia cases. Population classifications also showed an overall 30% decline in the herd, likely due to another pneumonia outbreak. Efforts have continued to maintain a sample of collared sheep to track survival and movements. Sheep have also been tested for bacterial pathogens during the past two years as part of the Statewide Bighorn Sheep Disease Surveillance Program. No new sheep were collared in 2015 under this permit however, the Wyoming Cooperative Research Unit at the University of Wyoming initiated a project in collaboration with the Wyoming Game and Fish Department to capture, collar, and sample sheep in the Jackson, Whiskey, and Absaroka Herds.
Results
During 2014, 8 ewes were captured and fitted with GPS collars using both helicopter netgunning and ground darting. Six ewes were captured in the Curtis Canyon and Flat Creek winter ranges using a helicopter and two were darted near Camp Creek. Animals were fitted with a GPS collar, which is programmed to drop off after 2 years (spring 2016), and VHF micro collars. This approach will enable two tiers of data collection; GPS collars will provide fine-scale movement data while VHF collars allow us to track survival over the longer term. These captures were part of the Statewide Disease Surveillance Program under Chapter 33 Permit #854. Additional details regarding capture locations and disease testing results can be found in that permit’s 2014 report.
Data from radio collars recovered during 2012-2015 were shared with the Greater Yellowstone Area Mountain Ungulate Project at Montana State University. This research is a collaborative initiative to study the ecology and population dynamics of bighorn sheep and mountain goats throughout the Yellowstone ecosystem (http://gyamountainungulateproject.com/contact.html). Data were also shared with the Wyoming Migration Initiative at the University of Wyoming.
Twenty-one collared bighorn sheep were monitored in 2015 (Table 1). One GPS-collared bighorn sheep died during 2015 (Figure 1). This ewe appeared to have died in a fall on a cliff in Sheep Creek. There were no pneumonia outbreaks detected in the Jackson Herd in 2015.
There were two telemetry flights conducted in 2015 to monitor collared bighorn sheep, one in July and one in December (Figure 2).
156

Table 1. Bighorn sheep collar frequencies in the Jackson herd, 2015. These do not include bighorn sheep collared as part of the Wyoming Cooperative Research Unit study.
Sheep ID
GPS collar frequ
Micro VHF collar frequ Visibility tags
Capture Date Notes
211 150.263 Alive Dec. 2015 – incorporated into Dr. Monteith’s study
653 150.352 Alive Dec. 2015 684 150.482 Alive Dec. 2015 743 150.493 Yellow #26 4/11/2013 Alive Dec. 2015 –
incorporated into Dr. Monteith’s study
893 150.540 12/10/2012 Unknown – not heard in 2015 390 150.390 blue7B Alive Dec. 2015 500 150.500 150.500 green2B Alive Dec. 2015 630 150.630 white/yellow6B Alive Dec. 2015 410 150.160 150.160 purple 1B 3/5/2013 Alive Dec. 2015 219 219.010 Unknown – not heard in 2015 218 218.160 5/8/2012 Unknown – not heard in 2015
218_2 150.464 Yellow #27 4/17/2013 Alive Dec. 2015 110 149.110 Yellow #28 5/1/2013 Alive Dec. 2015 – no VHF
signal 755 150.754 Yellow #5 (L),
#6 R 1/26/2014 Alive Dec. 2015 -
incorporated into Dr. Monteith’s study
530 150.530 150.530 Yellow #2 (L), #1 R
1/26/2014 Mortality in Nov. 2014 near Turquoise Lake - predation
562 150.560 150.560 Yellow #5 (8), #67 R
1/26/2014 Mortality in Flat Creek Nov. 2014 – snow slide
411 150.410 150.410 Yellow #4 (L), #3 R
1/26/2014 Alive Dec. 2015
662 150.662 Yellow #10 (L), #9 R
1/26/2014 Alive Dec. 2015 – incorporated into Dr. Monteith’s study
212 150.211 150.211 Yellow #12 (L), #11 R
1/26/2014 Mortality in Curtis Canyon in winter 2015
763 150.763 150.763 Yellow #15 R 1/26/2014 Alive Dec. 2015 783 150.783 150.783 Yellow #14 R 1/26/2014 Alive Dec. 2015
157

Figure 1. GPS-collar locations from sheep 212, which died from a fall in Curtis Canyon on February 2015. This ewe wintered in the Curtis Canyon area and migrated to summer range in the Pinnacle Peak area.
158

Figure 2. Collared bighorn sheep locations from telemetry flights, 2015.
159

Nutritional Dynamics and Interactions with Disease in Bighorn Sheep
Winter 2016 Project Update
The entrance of epizootic pneumonia to bighorn sheep populations muddles the already complicated process-es underlying population dynamics, and is often the culprit for massive population crashes of sheep popula-tions. Although pneumonia caused by bacterial respiratory pathogens is known to be the underlying driver of the massive mortality events, the frequency and intensity of the dieoffs are inconsistent and infections are not always manifested in disease. Therefore, dieoffs may be dependent upon certain ecological or environmental conditions—the understanding of which could yield management alternatives to help reduce the frequency of outbreaks. Our goal with the Bighorn Sheep Nutrition/Disease Project is to begin to unravel the interactions among animal density, nutrition, and disease in an effort to identify potential management options for and improve our understanding of pneumonia in bighorn sheep, and identify the range limits (i.e., Nutritional Carrying Capacity) for our bighorn sheep populations in northwest Wyoming. In Wyoming, the Statewide Bighorn Sheep Dis-ease Surveillance Program, led by the Wyoming Game and Fish Department, has documented many bacterial pathogens in herds across the state. While some herds continue to do well, others have undergone repeated pneumonia out-breaks and recoveries, and others have never re-covered from dieoffs. We are adding another component to the ongoing Disease Surveillance Program by investigating bacterial pathogens, nutritional condition, survival, pregnancy, and lamb recruitment in female bighorn sheep from three herds over time.
160

During March and December 2015, the Wyoming Cooperative Fish and Wildlife Research Unit and the Wyoming Game and Fish Depart-ment, in collaboration with the US Fish and Wildlife Service, the Shoshone and Arapaho Tribes of the Wind River Indian Reservation, and the National Elk Refuge set out to capture adult female bighorn sheep in the Jackson, Cody, and Whiskey herds of northwest Wyo-ming. In December, the objective was to recapture those same adult females to monitor how conditions changed over the summer relative to their recruitment status, age, disease, and nutritional condition.
161

Numerous disease-related samples were collected from each animal including nasal and tonsil swabs, feces, and blood by the Wyoming Game and Fish Department Wildlife Disease Laboratory and follow-ing protocols established through the Statewide Bighorn Sheep Dis-ease Surveillance Program. Samples are currently being analyzed by the Wildlife Disease laboratory to identify respiratory pathogens and macro-, and micro-nutrient levels. Future work will seek to assess whether previous experiences of individual animals affect their prob-ability of becoming infected, becoming symptomatic, and their subse-quent effects on vital rates.
162

Fig. 1. Average body mass (kg±SE) of adult female bighorn sheep in March and December 2015 in the Cody, Whiskey, and Jackson herds of northwest Wyoming.
Body mass of sheep was measured using an elec-tronic platform scale. Body mass represents a com-bination of the overall size and composition of an animal.
Age was estimated using a combination of toothwear and replacement patterns, and by counting horn annu-li. Age data are critical to understanding behavior, nu-tritional condition, reproductive performance, and dis-ease exposure of individuals.
Fig. 2. Average estimated age (yr±SE) of adult female bighorn sheep at initial capture in March, 2015 in the Cody (N=10), Whis-key (N=20), and Jackson (N=12) herds of northwest Wyoming.
163

We assessed pregnancy status and size of fetus us-ing ultrasonography and transabdominal scanning. Pregnancy rates among the animals we measured were 100% in Cody, 90% in Whiskey, and 92% in Jackson herds. Of those animals that were preg-nant however, size of those fetuses as indicated by fetal eye diameter was variable.
Fig. 3. Eye diameter (mm±SE) of fetuses for pregnant adult female bighorn sheep in March, 2015 in the Cody (N=10), Dubois (N=13), and Jackson (N=9) herds of northwest Wyoming. Triangles represent range in observed eye diameters.
Image of bighorn sheep fetus recorded during captures.
164

Fig. 4. Ingesta-free body fat (%±SE) of adult female bighorn sheep in March and December, 2015 in the Cody, Dubois, and Jackson herds of northwest Wyoming.
We measured nutritional condition using a combination of ultrasonog-raphy and body condition scoring based on standardized methods developed for bighorn sheep. Nu-tritional condition of an animal is a product of its environment and therefore, represents the energetic gains and deficits experienced by an animal, as well as the nutrition-al reserves it carries into the up-coming season.
Fig. 4. Ingesta-free body fat (%±SE) of adult female bighorn sheep relative to lactation status in December, 2015 in the Cody, Dubois, and Jackson herds of northwest Wyoming. Lactation rates were 50% in Cody, 43% in Dubois, and 45% in Jackson. 165

All animals were fit with either a store-on-board GPS radiocollar (Cody sheep), or a live satellite collar designed to col-lect 2 GPS fixes per day and transmit those data every 3 days (Jackson and Whiskey sheep). Having GPS data will allow us to learn more about migration patterns and occupancy of seasonal ranges that will prove valuable in land management and understanding how contributions of seasonal ranges influence nutrition, demography, and potentially disease interac-tions.
All current locations recorded in the Jackson and Whiskey herds for sheep wearing satellite collars with data uplink ca-pability. Red locations are those recorded during May–October, and those in red were recorded during November–April, 2015. 166

Looking ahead…...
This past year capture marks the beginning of what we hope to be a long-term research project to ex-plore the disease-nutrition interface in bighorn sheep, and to develop an understanding of the range lim-its (i.e., nutritional carrying capacity) of our sheep populations in northwest Wyoming. Future work will include annual assessment of recruitment status for marked females, continued monitoring of survival, and subsequent recaptures of radiomarked females during mid-December and mid-March to assess their nutritional status and presence of respiratory pathogens following summer and winter each year. With time, we will begin to piece together each female’s history to describe how she interacts with her envi-ronment, understand her success to survive and reproduce or lack thereof, and how she fits within the population in which she resides. By piecing together the histories of each female we monitor, we hope to add an important piece to the puzzle of the complex interactions of environment, disease, and dynam-ics of our cherished bighorn sheep populations. Although there is still much work to do, and much more support needed to accomplish these goals, we are grateful for the funding and logistical support to date that has made the initiation of this project possible.
167

Acknowledgments
This project would not be possible without the financial and logistical support of our research partners. Funding has been provided by the Wyoming Wildlife/Livestock Disease Research Partnership and the Wyoming Governor’s Big Game License Coalition. We thank the Shoshone and Arapaho tribes for ac-cess to lands on the Wind River Indian Reservation, and to the US Fish and Wildlife Service for access to the National Elk Refuge for capture and research. We also thank the numerous folks who took time out of their busy schedules to assist with captures. Thanks to T. McDowell, M. Gocke, and P. Hnilicka for photographs contained herein.
Wyoming Wildlife/Livestock Disease Research Partnership
168

For more information:
Kevin Monteith Research Professor WY Coop Unit Laramie [email protected]
Doug McWhirter Wildlife Biologist WY Game & Fish Cody [email protected]
Aly Courtemanch Wildlife Biologist WY Game & Fish Jackson [email protected]
Greg Anderson Wildlife Biologist WY Game & Fish Lander/Dubois [email protected]
Hank Edwards Wildlife Disease Sup WY Game & Fish Laramie [email protected]
169

170

120
Proposed change in post-season population: NA% NA%
Juveniles (< 1 year old): NA% NA%Total: NA% NA%
Females ≥ 1 year old: NA% NA%Males ≥ 1 year old: NA% NA%
Number of years population has been + or - objective in recent trend: 1
Proposed harvest rates (percent of pre-season estimate for each sex/age group):JCR Year Proposed
Trend Based Objective (± 20%) (96 - 144)Management Strategy: SpecialPercent population is above (+) or (-) objective: N/A%
Males per 100 Females: 0 0Juveniles per 100 Females 23 0
Recreation Days: 40 69 54Days Per Animal: 5.7 5.8 4.5
Active Licenses: 8 12 12Active License Success 88% 100% 100%
Hunters: 8 12 12Hunter Success: 88% 100% 100%
Trend Count: 80 0 145Harvest: 7 12 12
HUNT AREAS: 2 PREPARED BY: GARY FRALICK
2010 - 2014 Average 2015 2016 Proposed
2015 - JCR Evaluation Form
SPECIES: Mountain Goat PERIOD: 6/1/2015 - 5/31/2016HERD: MG101 - PALISADES
171

172

173

2010 - 2015 Preseason Classification Summary
for Mountain Goat Herd MG101 - PALISADES
MALES FEMALES JUVENILES Males to 100 Females Young to
Year Pre Pop Ylg Adult Total % Total % Total % TotCls
ClsObj Ylng Adult Total
Conf Int
100 Fem
Conf Int
100 Adult
2010 140 0 0 0 0% 97 76% 30 24% 127 0 0 0 0 ± 0 31 ± 0 31 2011 130 0 0 0 0% 0 0% 0 0% 0 0 0 0 0 ± 0 0 ± 0 0 2012 130 0 0 0 0% 83 77% 25 23% 108 0 0 0 0 ± 0 30 ± 0 30 2013 130 0 0 0 0% 0 0% 0 0% 0 0 0 0 0 ± 0 0 ± 0 0 2014 130 0 0 0 0% 144 87% 21 13% 165 0 0 0 0 ± 0 15 ± 0 15 2015 0 0 0 0 0% 0 0% 0 0% 0 0 0 0 0 ± 0 0 ± 0 0
2016 HUNTING SEASONS PALISADES MOUNTAIN GOAT HERD (MG101)
Hunt Area
Type
Season Dates Quota
License
Limitations Opens Closes
2 1 Sep. 1 Oct. 31 12 Limited quota Any mountain goat Aug. 15 Aug. 31 Archery only – SEE
SECTION 8
Summary of Proposed Change by License Type
Management Evaluation Current Mid-Winter Trend Count Management Objective: 120 Management Strategy: Special 2014 Mid-Summer Trend Count: 165 Most Recent 3-year Running Average Trend Count: 91 The Palisades mountain goat population objective is 120 goats (± 20% of the population objective). The original population objective was established in 1999 at 50 goats. The 2014 mid-summer trend count was 165 goats. The three-year average mid-summer trend count is 91 goats. The next mid-summer trend count will be conducted in 2016. The population objective was reviewed by the Wyoming Game and Fish Commission in 2015, and the Special Management strategy was approved.
Area License Type Changed from 2015 2 1 No Changes
Herd Unit Total
174

Herd Unit Issues To ensure the long-term welfare of this population, Idaho and Wyoming have committed to a cooperative management effort that entails sharing population data, coordinating habitat management projects, and surveying the entire goat population concurrently every two years. Management goals of the Wyoming subpopulation have focused on maintaining a conservative hunting approach since 1999. This approach has resulted in a high degree of hunter satisfaction, exceptionally high hunters’ success, low days/animal harvest, and trophy class males being taken in most years since the hunt was initiated in 1999. A consequent concern associated with population growth has been the one year reduction in juvenile production observed in 2014. The observed kid:adult ratio was the lowest (15 kids:100 adults) since is this population has been monitored. Five of the six females captured in 2014 were not pregnant, and the sixth female pregnancy status was undetermined. Mountain goats have dispersed north into Grand Teton National Park. In an effort to provide additional hunting opportunity the Department has expanded the area to include the west slope of the Tetons, on National Forest System Lands. This management strategy will continue in 2016. A general license hunting season structure north of Highway 22 is currently being discussed for this herd unit as a means of controlling mountain goat dispersal. In 2013 research was started in the Palisades mountain goat herd. The Greater Yellowstone Area Mountain Ungulate Project is a collaborative research initiative to study the ecology and population dynamics of bighorn sheep and mountain goats throughout the Yellowstone ecosystem http://gyamountainungulateproject.com/contact.html. Concurrent with the relatively conservative management is a lack of knowledge associated with interstate movements, distribution, reproductive success, and fecundity. Moreover, since goats in Wyoming have never been exposed to herd specific research and monitoring efforts, the opportunity to initiate a baseline herd health monitoring effort is warranted. This initial effort to assess herd health will focus on determining the presence and persistence of disease and parasites in a substantial segment of the Palisades goat herd that inhabits Wyoming. Mountain goats have dispersed into Grand Teton National Park, and adjacent Wyoming bighorn sheep hunt areas 6, 7, 8, and 24. Mountain goat dispersal into these areas may present other management challenges in the future. Greater Yellowstone Area Mountain Ungulate Project: Project Objectives Project objectives include: collecting migration information on segments of the Palisades mountain goat herd, documenting any interstate movements of collared goats, determining the presence of Mannheimia sp., Mycoplasma sp. and other pathogens that may potentially be transmitted to bighorn sheep; monitor herd health during the winter (Appendix A).
175

Scientific Merit/Management Relevance Disease monitoring in mountain goat is critical, especially in those herds where little or no monitoring information has been collected. The Palisades herd is believed to be the source herd of dispersing mountain goats in western Wyoming. This population and occupies active domestic sheep allotments there is the potential that mountain goats harbor infectious diseases that are potentially lethal to bighorn sheep. Weather Weather conditions during the 2015 were ideal for forage production beginning in early spring and continuing through fall. By late summer the moisture regime had changed frequent precipitation scenario that persisted into the fall hunting season. Drought conditions in the early portion of the summer abated by late fall as persistent snow storms began to deposit snowpack in the Snake River Mountain Range. By mid winter snow conditions on winter ranges had changed significantly. Minimal snow had accumulated on core winter ranges. These conditions persisted throughout the remainder of the winter. By late winter 2016 snowpack in western Wyoming watersheds were estimated to be at or below normal. For additional weather and precipitation data please visit the following websites: http://www.ncdc.noaa.gov/temp-and-precip/time-series and http://www.ncdc.noaa.gov/oa/climate/research/prelim/drought/pdiimage.html. Habitat No habitat data has been collected on goat summer and winter ranges. There are no established vegetation transects in this herd unit. Please refer to the 2015 Annual Report Strategic Habitat Plan Accomplishments, pages 61-77 for Jackson Region habitat improvement project summaries ( http://wgfd.wyo.gov/web2011/wildlife-1000708.aspx). Harvest The 2015 hunting season was the 17th year that goats were hunted in Area 2. A total of twelve (12) licenses were issued; twelve goats were harvested. All goats harvested were males. Since 1999, a total of 110 mountain goats (96 billies, 14 nannies) have been harvested in Hunt Area 2. Population The population trend is increasing, and remains above the desire population objective of 120 goats. The population objective was reviewed in 2015. The Wyoming Game and Fish Commission approved a population objective of 120 mountain goats. A population model has not been developed because of the small size of this population. The current season structure is warranted as a means to diminish dispersal away from the herd unit, and control account for lower than average reproductive output in 2014. Summer aerial surveys were conducted from a helicopter. These surveys are coordinated with Idaho Department of Fish and Game to ensure this interstate population is surveyed concurrently.
176

Surveys are initiated every biennial. Helicopter surveys were first initiated in August 1997 (Appendix B). The highest number of goats counted in Wyoming occurred in 2014. A total of 165 goats were counted. Comprehensive winter surveys were not conducted in February 2007 - 2014. Mountain goats have dispersed into areas beyond the hunt area boundary. It is believed the predominate individual dispersers are billies, as no reported or observed evidence of mountain goat reproduction has been observed in the Salt Range, Wyoming Range, Wind River Range, or Gros Ventre Range. However, mountain goats are successfully reproducing within the boundaries of Grand Teton National Park. In areas outside of Grand Teton National Park, dispersing individuals are currently being monitored and when sufficient numbers of goats are regularly documented to sustain a multi-year hunting season, general hunt seasons may be considered in designated mountain goat expansion areas. Management Summary A total of twelve (12) licenses, valid for any goat, will be issued in 2016. The season will run September 1 – October 31. The number of licenses issued will be maintained at 2015 levels in response to the high number (N=165) goats observed during the 2014 trend count, and the relatively low percentage (14%) of reproductive age nannies harvested since the hunt was initiated in 1999. The size of the hunt area was expanded in 2014 in an effort to harvest goats that have dispersed from the Palisades herd into the Teton Range. The hunt area expansion area encompasses a portion of the national forest north of U.S. Highway 22. The increased hunt area size will provide additional hunter recreation. A total of twelve (12) goats are projected in the 2016 harvest. The anticipated harvest will likely consist of 9 billies, and three (3) nannies. Based on the projected harvest, the posthunt population estimate is projected at 145 goats.
177

APPENDIX A
Population characteristics, movements, and disease
surveillance in the Palisades mountain goat herd, Wyoming
2015
Prepared by:
Gary L. Fralick Wildlife Biologist Thayne/Big Piney
Wyoming Game and Fish Dept. P.O. Box 1022
Thayne, WY. 83127
178

Population characteristics, movements, and disease surveillance in the Palisades mountain goat herd,
Wyoming
INTRODUCTION Historical mountain goat distribution (Oreamnos americanus) has been recorded from Alaska and the Yukon southward to the Sawtooth Range of Idaho. Research by Irby and Chezgrall (1994) have reported, based on historical accounts from the 1800s, that mountain goat distribution occurred in areas south of 40 degrees N Latitude in the Colorado Rocky Mountains. In areas where goats have been extirpated or non-existent, transplants have been used successfully to reintroduce goats into former historic or unoccupied range and augment native populations. Prior to 1987, the state of Idaho released a total of 55 mountain goats at three locations in Idaho identified as Lake Pend Oreille in northern Idaho (releases made 1960, 1968), in the Seven Devils Range of western Idaho (1962, 1974), and the Snake River Range in southeastern Idaho (1969-1971) (Hayden, 1990). During the period between July 1969 and 1971, the Idaho Department of Fish and Game transplanted 5 female and 7 male goats into the Snake River Range (Hayden 1989). This population increased during the next 10 years to a level that wildlife managers believed could sustain a limited harvest in 1981. Mountain goats have since dispersed into Wyoming since the initial transplant occurred in Idaho. Department personnel, hunters, and outfitters have documented goats in the Snake River Range and in other areas outside of the core area. As a result of these observations, Hunt Area 2 was created with a population objective of 50 goats in 1994 in order to address an expanding goat
179

population and to provide hunting opportunity in Wyoming. Summer trend counts conducted from helicopters have been the most efficient and successful method to assess population distribution and growth. The initial aerial survey was conducted in August, 1996; 24 goats were observed. The most current surveys, completed in 2010 and 2012 documented 127 and 108 goats in Wyoming, respectively. To ensure the long-term welfare of the population Idaho and Wyoming have committed to a cooperative management effort that entails sharing population data, coordinating habitat management projects, and surveying the entire goat population concurrently every two years. Management goals of the Wyoming subpopulation have been focused on maintaining a conservative hunting approach through the annual issuance of 4 - 12 licenses valid for any goat since 1999. Concurrent with this relatively conservative management approach is a comprehensive absence of knowledge associated with interstate movements, distribution, and reproductive success and fecundity. Moreover, since goats in Wyoming have never been exposed to herd specific research and monitoring efforts, the opportunity to initiate a baseline herd health monitoring effort is warranted. This initial effort to assess herd health will focus on determining the presence and persistence of disease and parasite loadings in a substantial segment of the Palisades goat herd that inhabits Wyoming. Mountain goats have dispersed into Grand Teton National Park, and adjacent Wyoming bighorn sheep hunt areas 6, 7, 8, and 24. Mountain goat dispersal into these areas may present the potential to transmit diseases to bighorn sheep. This heightened potential for mountain goat to bighorn sheep disease transmission is a result of the Palisades goat population occupying areas where domestic sheep are grazed. In order for managers to assess disease transmission risk from goats to bighorn sheep initial surveillance efforts were initiated in spring 2013. Project Objectives Project objectives include: collecting migration information on segments of the Palisades mountain goat herd, documenting any interstate movements of collared goats, assessing juvenile production and recruitment, determining the presence of Mannheimia spp. and Mycoplasma spp. and other pathogens that may potentially be transmitted to bighorn sheep, and monitor herd health during the winter. Project Goals and Analysis Goals of the project include capturing up to 20 mountain goats (2+ years of age) on winter ranges in the Palisades mountain goat herd. Biological samples will be collected to determine the presence of Mannheimia haemolytica and Mycoplasma ovipneumoniae. Radio-collars and colored, alpha-numerically labeled neck bands will be placed on female goats. Migration data will be collected on collared animals and WGFD Veterinary Services personnel will collect culture samples to determine the presence of pneumonia and evaluate herd health.
180

Scientific Merit/Management Relevance Disease monitoring in mountain goat is critical, especially in those herds where little or no monitoring information has been collected. The Palisades herd in Idaho and Wyoming are believed to be the source herd of dispersing mountain goats in western Wyoming. This population occupies active domestic sheep allotments. There is the potential that mountain goats harbor infectious diseases that are lethal to bighorn sheep. Migration, interstate movements, and summer distribution data will be important for managers to document and evaluate. MOUNTAIN GOAT DISTRIBUTIUON AND CAPTURE OPERATIONS
During late winter and early spring mountain goats occupy south exposures in search of emergent herbaceous vegetation in the Snake River Canyon, east of Alpine, Wyoming. These aggregations may exceed 60 mountain goats; and, often goats present themselves in relative close proximity to U.S. Highway 26/89. Capture operations were initiated when goats were observed immediately adjacent to U.S. Highway 26/89, and when environmental conditions assured a capture event could be safely executed.
Mountain goats were typically darted at a distance of 18.3 meters (20 yards) or less under free ranging conditions, or from a vehicle if goats were present adjacent to the highway right-of-way. Mountain goats were immobilized with a dosage of 0.65 ml of thiafentanil or 0.55 ml of
181

Carfentanil deployed from a CO2 Pneu-dart projector. In December two goats were captured with immobilizing darts deployed from a helicopter.
Immobilized goats were blindfolded and positioned in sternal recumbency; hollow, rubber horn sheaths were placed over the horns to protect handlers from injury during the collection of
biological samples. Body temperature and breathing were monitored during anesthesia. Biological samples of blood, feces, and nasal/tonsil/ear-mite swabs were collected. Ear-tags and VHF and GPS radio-collars were affixed to female goats; males were ear-tagged. The age of each goat was determined through replacement and eruption of lower incisors and by counting horn annuli. Mountain goats were retained for approximately 20-25 minutes to collect biological samples. The antagonist, Naltrexone, was administered at a dosage of 6 ml. Goats were ambulatory within 2:15 minutes after administration of the antagonist. RESULTS
Survival
A total of six mountain goats were captured in March and December 2015 (Tables 1 and 2).
Three (n=3) females and two (n=2) males were outfitted with Telonics VHF and GPS radio-collars; the yearling male goat captured in March was ear-tagged and released. The estimated ages of the female goats were 2 and 5 years old (Table 1). The ages of the male goats captured and radio-collared were 3 and 5 years old, respectively. Table 1. A summary of mountain goat capture location, age, and pregnancy status in the Palisades mountain goat herd, 2015.
Capture Location Freq Ear
Tag Capture
Date Easting Northing Sex Age Pregnancy
Status
152.600 138 25-Mar 501,622 4,780,736 Female 5 NA 152.690 NA 17-Dec 499,499 4,793,192 Female 2 NA 152.720 NA 17-Dec 502,214 4,788,284 Male 3 152.710 149 18-Dec 501,448 4,780,596 Male 5 152.700 147 19-Dec 500,416 4,780,512 Female 5 NA
NA 29 25-Mar 501,355 4,780,797 Male 1.5
182

Disease Surveillance
The biological samples collected during the 2015 captures resulted in a preliminary diagnostic assessment of disease prevalence and persistence of parasite loads for a segment of the Palisades goat population that inhabit the winter ranges in the Snake River Canyon (Table 2). The primary disease concern is the presence of Mannheimia haemolytica, Mycoplasma
ovipneumoniae and Bibersteinia spp. in this goat population. Diagnostic results for PCR leukotixin positive results for Mannheimia
haemolytica were not available at the time of this report. Diagnostic assays were completed in an effort to isolate PCR leukotoxin positive Mycoplasma ovipneumonia in the current sample of mountain goats. Results of this assay indicate M. ovipneumonia were present in two goats captured in the Snake River Canyon in December (Table 2). Bibersteinia spp is an important pathogen of sheep and is associated with serious infection that results in pneumonia. PCR leucotoxin positive results for Bibersteinia spp. were not available at the time of this report.
Table 2. A summary of disease and parasite prevalence in mountain goats in the Palisades mountain goat herd, Wyoming, 2015.
Presence/Absence of Disease or Parasite
Frequency Ear Tag
Capture Date
Sex Age Mannheimia haemolytica
Mycoplasma ovipneumonia
Bibersteinia spp.
Psorptic spp.
Culture PCR Culture PCR Culture PCR
152.600 138 25-Mar Female 5 NA NA NSI - NA NA -
152.690 146 17-Dec Female 2 NA NA NSI - NA NA - 152.720 150 17-Dec Male 3 NA NA NSI - NA NA -
152.710 149 18-Dec Male 5 NA NA NSI + NA NA -
152.700 147 19-Dec Female 5 NA NA NSI + NA NA -
NA 29 25-Mar Male 1.5 NA NA NSI NA NA NA -
DISTRIBUTION AND MOVEMENTS
Distribution and movements of radio-collared mountain goats is provided in Appendix A. This summary reflects the movements of female mountain goat that were captured in 2013 and those that died since the initial year of the project. Female mountain goats that were captured and radio-collared moved from low elevation winter ranges in the Snake River Canyon to summer ranges associated with Ferry Peak and the South Fork of Indian Creek. One female traveled east to Wolf Creek.
183

FUTURE WORK
Mountain goats will be captured in spring 2016 as part of an on-going disease surveillance and population monitoring effort. A total of five mountain goats 2+-years of age will be captured and efforts will continue to collect biological samples in support of the disease surveillance. Our work is in cooperation with Dr. Robert Garrott, Montana State University, and the Greater Yellowstone Mountain Ungulate Project (GYAMUP). The primary goal of the project is to gain a better understanding and knowledge of bighorn sheep and mountain goat ecology and the interactions between the two species. This corroborative effort between various state and federal agencies, and private entities will result in one of the most comprehensive databases of knowledge and understanding of bighorn sheep and mountain goats in the GYA.
184

M149 5 - YEARS OLD
FREQUENCY: 152.710 SNAKE RIVER CANYON
CAPTURED: 18 DECEMBER 2015
185

Literature Cited
Irby, M.L. and A.F. Chappell. 1994. Review of the historical literature regarding the distribution of the Rocky Mountain goat (Oreamnos americanus). Pp. 75-80 in M. Pylus and B. Wishart, eds. Proc. Ninth Biennial Symp. Northern Wild Sheep and Goat Council. May 2-6, 1994. Cranbrook, British Columbia. Hayden, J. A. 1989. Status and population dynamics of mountain goats in the Snake River Range, Idaho. Master’s Thesis. Univ. Montana, Missoula. 146pp. Hayden, J.A. 1990. ed. Mountain goat management plan. 1991-1995. Idaho Dept. Fish and Game. Boise. 25pp.
186

APPENDIX A A summary of mountain goat distribution and movements in Wyoming, Palisades mountain goat herd, 2015.
187

Appendix B. SNAKE RIVER MOUNTAIN RANGE MOUNTAIN GOAT POPULATION SURVEYS IDAHO/WYOMING Idaho Summary of Mountain Goat Surveys in Unit 67 South of Palisades Creek, 1982-Present (Mt. Baird area).
Year Hunt Area
Inclusive Location Adults Kids Unknown Total
Ratio Kid:100 Adult
1982a 67-1 South of Palisades Creek to ID./WY. Stateline
33 13 0 46 39 1985a 35 16 0 51 46 1986b 0 0 104 104 -- 1986a 37 15 0 52 41 1988b 71 21 0 92 30 1990b 45 18 0 63 40 1993b 104 33 16 153 34 1994a 73 42 0 115 58 1996a 151 66 0 217 44 1998a 118 45 0 163 38 2000a 61 29 0 90 48 2002a 35 7 0 42 20 2004a 83 24 0 107 29 2006a 103 19 0 122 18 2008 a
2010 a
2012 a
2014 a
96 96 87
27 33 23
0 0 0
123 129 113
28 34 26
Wyoming Summary of Mountain Goat Surveys, Hunt Area 2, Palisades Goat Herd, 1996-Present
Year Hunt Area
Inclusive Location Adults Kids Unknown Total
Ratio Kid:100 Adult
1996a 2 Wyoming – Palisades Goat Herd
16 8 0 24 50 1997a 34 20 0 54 59 1998a 47 15 0 62 32 2000a 58 18 0 76 31 2002a 37 17 0 54 46 2004a 90 31 0 121 34 2006a 98 32 0 130 33 2008 a 52 13 0 65 33 2010 a 97 2012 a 83 2014 a
144
30 0 127 31 25 0 108 30 21 0 165 15
a Helicopter survey (August). b Ground count.
188

189
Gfrali
Text Box
HERD UNIT SEASONAL RANGE MAP

190

2015 - JCR Evaluation Form
SPECIES: Bison PERIOD: 6/1/2015 - 5/31/2016
HERD: BI101 - JACKSON
HUNT AREAS: 2 PREPARED BY: ALYSON COURTEMANCH
2010 - 2014 Average 2015 2016 Proposed
Trend Count: 821 666 540
Harvest: 221 206 260
Hunters: 267 288 295
Hunter Success: 83% 72% 88%
Active Licenses: 267 288 295
Active License Success 83% 72% 88% Recreation Days: 1,567 2,111 1,500
Days Per Animal: 7.1 10.2 5.8
Males per 100 Females: 60 93
Juveniles per 100 Females 47 51
Trend Based Objective (± 20%) 500 (400 - 600)
Management Strategy: Recreational
Percent population is above (+) or (-) objective: 33%
Number of years population has been + or - objective in recent trend: 14
191

192

193

2010 - 2015 Postseason Classification Summary
for Bison Herd BI101 - JACKSON
MALES FEMALES JUVENILES
Males to 100 Females Young to
Year Post Pop Ylg Adult Total % Total % Total % Tot Cls
Cls Obj Ylng Adult Total
Conf Int
100 Fem
Conf Int
100 Adult
2010 927 76 218 294 32% 423 46% 193 21% 910 0 18 52 70 ± 0 46 ± 0 27 2011 887 102 156 258 31% 386 46% 196 23% 840 0 26 40 67 ± 2 51 ± 1 30 2012 875 73 174 247 29% 429 50% 179 21% 855 0 17 41 58 ± 1 42 ± 1 26 2013 825 74 131 205 26% 398 50% 191 24% 794 0 19 33 52 ± 1 48 ± 1 32 2014 691 68 117 185 27% 336 49% 170 25% 691 0 20 35 55 ± 0 51 ± 0 33 2015 666 42 212 254 38% 273 41% 139 21% 666 0 15 78 93 ± 0 51 ± 0 26
2016 HUNTING SEASONS JACKSON BISON HERD (BI101)
Hunt Area Type Season Dates Quota License Limitations Opens Closes
2 1 Aug. 15 Jan. 10 50
Limited quota
Any wild bison; also valid in Area 1 within the Clark’s Fork River and Soda Butte Creek drainages. Valid in other portions of Area 1 upon notification and authorization by the Department.
2 1 Jan. 11 Jan. 31 Any wild bison. Limited alternate permits for the National Elk Refuge may be available through the Department’s Jackson Regional Office on a first-come first-served basis until the season closes or forage/weather conditions dictate that supplemental feeding is necessary.
2 4 Aug. 15 Jan. 10 245
Limited quota
Any female or calf wild bison; also valid in Area 1 within the Clark’s Fork River and Soda Butte Creek drainages. Valid in other portions of Area 1 upon notification and authorization by the Department.
2 4 Jan. 11 Jan. 31 Any female or calf wild bison. Limited alternate permits for the National Elk Refuge may be available through the Department’s Jackson Regional Office on a first-come first-served basis until the season closes or forage/weather conditions dictate that supplemental feeding is necessary.
3 CLOSED
194

Summary of 2016 License Changes
Hunt Area Type Quota change from 2015 Other changes from 2015
2 1 +10 -5 days to the regular season. Added 2 weeks to the season on a provisional basis, running through Jan. 31
4 -20 -5 days to the regular season. Added 2 weeks to the season on a provisional basis, running through Jan. 31
Management Evaluation Mid-Winter Trend Count Objective: 500 Management Strategy: Recreational 2015 Mid-Winter Trend Count: 666 3-Year Mid-Winter Trend Average (2013-2015): 723 2016 Proposed Mid-Winter Trend Count: 540 The mid-winter trend count objective for the Jackson Bison Herd is 500 bison. The management strategy is recreational and the objective and management strategy were last revised in 2014. The herd objective was publicly reviewed in 2014 and changed to a mid-winter trend count objective of 500 bison. The current trend count is 666 bison. Annual harvest rates have recently reduced the population toward the 500 bison objective. Managers anticipate that with average or above-average harvest success in 2016, the population will be at objective. Herd Unit Issues Management of this herd is complicated because occupied habitat includes Grand Teton National Park (GTNP), the National Elk Refuge (NER) and the Bridger-Teton National Forest (BTNF). Bison remain distributed in GTNP during much of the summer and fall and are not available for hunting until they migrate to either BTNF or the NER. Over the past several years, bison have become sensitized to the presence of hunters on the NER and will vacate the open hunt area. Bison hunter numbers are limited on the NER due to concurrent elk hunting seasons and issues with hunter crowding. Permits for the NER are structured in an attempt to provide hunters with a quality hunting experience while moving the bison population toward the mid-winter objective of 500. Weather Spring and summer 2015 produced consistent moisture, leading to good forage production. Fall was relatively mild with no significant snowfall until mid-December. These conditions resulted in the majority of bison remaining in GTNP until early January. Bison harvest on the NER was slow until the last 2 weeks of the hunting season. By early February, low elevation slopes were
195

beginning to melt out. At the time of the mid-winter survey, winter precipitation was reported at 91% of normal in the Snake River Basin. Small groups of bison were observed on native winter range in the Spread Creek area and Snake River Bottom during February helicopter surveys. Please refer to the following web sites for specific weather station data. http://www.wrds.uwyo.edu/wrds/nrcs/snowprec/snowprec.html and http://www.ncdc.noaa.gov/oa/climate/research/prelim/drought/pdiimage.html Habitat No habitat data have been collected on bison summer and winter ranges. There are no established vegetation transects in this herd unit. Please refer to the 2015 Annual Report Strategic Habitat Plan Accomplishments for Jackson Region habitat improvement project summaries (https://wgfd.wyo.gov/Habitat/Habitat-Plans/Strategic-Habitat-Plan-Annual-Reports). Field Data During the mid-winter trend count in February 2016, a total of 618 bison were classified on supplemental feed in the McBride area on the NER and an additional 48 bison were observed on native ranges in the Spread Creek area and Snake River Bottom for a total of 666 bison. Personnel from GTNP and the WGFD classified 212 adult males, 42 yearling males, 273 cows, and 139 calves. Herd unit ratios were 93 bulls:100 cows and 51 calves:100 cows. Trend data indicate that the bison population has stabilized and started to decline with current harvest levels (Fig. 1). The bull ratio steadily declined from 82:100 in 2008 to 55:100 in 2014, likely due to bull harvest. The population is managed to maintain a high bull to cow ratio, therefore managers adjusted licenses in 2015 to harvest fewer bulls and more cows. This resulted in a rapid increase in the bull ratio to 93 bulls:100 cows (Fig. 2).
1027925 922 962
880 855 811691 666
-100
100
300
500
700
900
1100
1300
1500
2007 2008 2009 2010 2011 2012 2013 2014 2015
Tren
d Co
unt
Jackson Bison Herd Trend Count
Fig. 1. Mid-winter trend counts of the Jackson Bison Herd, 2007-2015. The mid-winter trend count objective is 500 bison.
196

0102030405060708090
1995
1997
1999
2001
2004
2006
2008
2010
2012
2014
Ratio
Mature Bull:Cow Ratio
Fig. 2. Annual mature bulls to 100 cows ratios for the Jackson Bison Herd, 1995-2015. Changes to the number of Type 1 licenses in fall 2015 caused a rapid increase in the ratio. Harvest Data The sale of bison licenses has improved by requiring hunters to submit payment with their license applications beginning in 2014. During the 2015 hunting season, 288 hunters harvested 47 bulls, 123 cows, and 36 calves, totaling 206 bison. Harvest in 2014 was the highest at 299 bison. Harvest in 2013 was 234 bison and 200 bison were harvested in 2012. In 2015, hunters reported a 74% success rate. In 2015, 8 bulls were accidentally harvested using Type 4 cow/calf licenses. Most of these incidents were due to misidentification by the hunter. In 2015, there were 5 Governor’s Licenses, 1 Super Tag, and 1 Super Tag Trifecta license available for bison that hunted in Area 2. When the population was high, the annual bison harvest had to exceed 200 animals to move the population toward its mid-winter objective of 500 bison. This is due to the consistently high reproductive rate of the herd; approximately 50 calves:100 cows during postseason classifications. As the population has been reduced toward objective, the reproductive rate remains high but the number of adult females has decreased. This year, approximately 137 calves are expected to be recruited into the population, therefore, harvest needs to exceed 137 animals to further reduce the population in 2016. Population The 2015 mid-winter trend count indicates that the population decreased by approximately 25 animals (4% of the population) in 2015. The population peaked at 1,100 animals in 2007, was stabilized by harvest from 2008-2010, and has started to trend downward in recent years. Consistently high calf:cow ratios around 50:100 have made it difficult to reduce the population.
197

When the population was high, harvest levels needed to exceed 200 bison in order to move the population toward the mid-winter objective of 500 animals. More recently the number of adult cows has been reduced through harvest and approximately 137 calves are expected to be recruited this year. Therefore, harvest levels must exceed 137 animals to reduce the population. Managers reduced bull licenses in 2015 in an effort to increase the bull ratio. The bull ratio responded rapidly and increased to 93 bulls:100 cows in one year. Bull licenses will remain conservative in the short-term to allow younger bulls to mature. Management Summary Harvest success was moderate in 2015 (74% success), which resulted in a reduction in the bison population. The population remains 166 animals above objective, or 33%. Hunting seasons will be structured to continue to reduce the population toward objective. The license quota for Type 1 (any wild bison) will be increased slightly to 50 in 2016. The license quota for Type 4 (cow or calf wild bison) will be decreased slightly to 245 in 2016, a reduction of 20 licenses. In addition, 5 Governor’s Licenses and 1 Super Tag for bison are expected to hunt in Area 2. The one winner of the Super Tag Trifecta drawing may also choose a bison license, depending on their species preference. Hunter access to the NER will be allowed along the Gros Ventre River from U.S. Highway 191 and at designated parking areas along the Kelly Road in GTNP. Since the number of adult cows has been reduced through harvest, approximately 137 calves are expected to be recruited by fall 2016. Therefore, harvest must exceed 137 animals in 2016 to reduce the population. The season will remain open until January 10. The season will continue to run on a provisional basis from January 11-31 with alternate permits available for the National Elk Refuge until either forage/weather conditions dictate that elk supplemental feeding is necessary or January 31 is reached. This extension of the season by 2 weeks will likely result in increased harvest success and a further reduction in the population. Depending on harvest success, the population is expected to be between 540 and 610 bison at the end of the 2016 season. The bull ratio is expected to be between 110 and 150 bulls:100 cows, although bulls will be skewed to younger age classes. Bibliography Berger, J. and S.L. Cain. 1999. Reproductive synchrony in brucellosis-exposed bison in the southern Greater Yellowstone Ecosystem and in noninfected populations. Conservation Biology 13:357-366. National Elk Refuge and Grand Teton National Park. 2007. Final Bison and Elk Management Plan and Environmental Impact Statement for the National Elk Refuge/Grand Teton National Park/John D. Rockefeller, Jr., Memorial Parkway. U.S. Fish and Wildlife Service, Region 6, Denver, CO. 605 pp. http://www.fws.gov/bisonandelkplan Williams, E.S., Thorne, E.T., Anderson, S.L., and J.D. Herriges, Jr. 1993. Brucellosis in free-ranging wild bison (Bison bison) from Teton County, Wyoming. Journal of Wildlife Diseases 29:118-122.
198