TABLE OF CONTENTS - in.gov · 6 49-3R Shoulder Wedges 49-4A Barrier Deflections 49-4B Barrier...
224
1 TABLE OF CONTENTS LIST OF FIGURES ........................................................................................................................ 5 49-1.0 GENERAL.......................................................................................................................... 9 49-1.01 Clear-Zone Concept...................................................................................................... 9 49-1.02 Situation Requiring Greater Clear-Zone Width ........................................................... 9 49-1.03 Applicability ................................................................................................................. 9 49-1.04 Right of Way .............................................................................................................. 10 49-1.05 Cost-Effectiveness of Safety Improvements .............................................................. 10 49-1.06 Adherence to Design Criteria ..................................................................................... 10 49-2.0 ROADSIDE CLEAR ZONE ............................................................................................ 11 49-2.01 Clear-Zone Width ....................................................................................................... 11 49-2.02 Clear-Zone-Width Adjustments ................................................................................. 12 49-2.02(01) Horizontal-Curve Correction ........................................................................... 12 49-2.02(02) Slope Averaging............................................................................................... 13 49-2.03 Clear-Zone Applications ............................................................................................ 14 49-2.03(01) Roadway with Shoulders or Sloping Curbs and V ≥ 40 mph .......................... 14 49-2.03(02) Roadway with Shoulders or Sloping Curbs and V ≤ 35 mph .......................... 19 49-2.03(03) Roadway with Vertical Curbs .......................................................................... 19 49-2.03(04) Appurtenance-Free Area .................................................................................. 19 49-2.03(05) On-Street Parking............................................................................................. 20 49-3.0 TREATMENT OF OBSTRUCTIONS............................................................................. 20 49-3.01 Roadside Hazards ....................................................................................................... 20 49-3.01(01) Range of Treatments ........................................................................................ 20 49-3.01(02) Example Hazards ............................................................................................. 20 49-3.02 Embankment ............................................................................................................... 22 49-3.03 Roadside Ditch ........................................................................................................... 23 49-3.03(01) General Guidelines........................................................................................... 23 49-3.02(02) Application ....................................................................................................... 24 49-3.04 Drainage Structure ...................................................................................................... 25 49-3.04(01) Drainage Structure Perpendicular or Skewed to Roadway Centerline ............ 25 49-3.04(02) Drainage Structure Parallel to Roadway Centerline ........................................ 26 49-3.04(03) Drainage Inlet ................................................................................................... 27 49-3.05 Curbs........................................................................................................................... 28 49-3.05(01) General ............................................................................................................. 28 49-3.05(02) Curbs on a Ramp .............................................................................................. 28 49-3.06 Bridge Pier and Spillslope .......................................................................................... 28 49-3.06(01) New-Construction Project ................................................................................ 28 49-3.06(02) Reconstruction Project ..................................................................................... 30 2012
Transcript of TABLE OF CONTENTS - in.gov · 6 49-3R Shoulder Wedges 49-4A Barrier Deflections 49-4B Barrier...
1
TABLE OF CONTENTS
LIST OF FIGURES ........................................................................................................................ 5
49-1.0 GENERAL.......................................................................................................................... 9 49-1.01 Clear-Zone Concept ...................................................................................................... 9 49-1.02 Situation Requiring Greater Clear-Zone Width ........................................................... 9 49-1.03 Applicability ................................................................................................................. 9 49-1.04 Right of Way .............................................................................................................. 10 49-1.05 Cost-Effectiveness of Safety Improvements .............................................................. 10 49-1.06 Adherence to Design Criteria ..................................................................................... 10
49-2.0 ROADSIDE CLEAR ZONE ............................................................................................ 11 49-2.01 Clear-Zone Width ....................................................................................................... 11 49-2.02 Clear-Zone-Width Adjustments ................................................................................. 12
49-2.02(01) Horizontal-Curve Correction ........................................................................... 12 49-2.02(02) Slope Averaging ............................................................................................... 13
49-2.03 Clear-Zone Applications ............................................................................................ 14 49-2.03(01) Roadway with Shoulders or Sloping Curbs and V ≥ 40 mph .......................... 14 49-2.03(02) Roadway with Shoulders or Sloping Curbs and V ≤ 35 mph .......................... 19 49-2.03(03) Roadway with Vertical Curbs .......................................................................... 19 49-2.03(04) Appurtenance-Free Area .................................................................................. 19 49-2.03(05) On-Street Parking ............................................................................................. 20
49-3.0 TREATMENT OF OBSTRUCTIONS ............................................................................. 20 49-3.01 Roadside Hazards ....................................................................................................... 20
49-3.01(01) Range of Treatments ........................................................................................ 20 49-3.01(02) Example Hazards ............................................................................................. 20
49-3.02 Embankment ............................................................................................................... 22 49-3.03 Roadside Ditch ........................................................................................................... 23
49-3.03(01) General Guidelines ........................................................................................... 23 49-3.02(02) Application ....................................................................................................... 24
49-3.04 Drainage Structure ...................................................................................................... 25 49-3.04(01) Drainage Structure Perpendicular or Skewed to Roadway Centerline ............ 25 49-3.04(02) Drainage Structure Parallel to Roadway Centerline ........................................ 26 49-3.04(03) Drainage Inlet ................................................................................................... 27
49-3.05 Curbs ........................................................................................................................... 28 49-3.05(01) General ............................................................................................................. 28 49-3.05(02) Curbs on a Ramp .............................................................................................. 28
49-3.06 Bridge Pier and Spillslope .......................................................................................... 28 49-3.06(01) New-Construction Project ................................................................................ 28 49-3.06(02) Reconstruction Project ..................................................................................... 30
2012
2
49-3.06(03) Longitudinal Side-Slope Transition ................................................................. 30 49-3.07 Signing, Lighting, or Signalization ............................................................................ 31 49-3.08 Miscellaneous Grading ............................................................................................... 34
49-4.0 ROADSIDE-BARRIER LATERAL OFFSET AND LONGITUDINAL EXTENT ....... 35 49-4.01 Lateral Placement ....................................................................................................... 35
49-4.01(01) Barrier Offset ................................................................................................... 35 49-4.01(02) Shoulder Section .............................................................................................. 36 49-4.01(03) Barrier Deflection ............................................................................................ 36 49-4.01(04) Shoulder- or Embankment-Slope Shielding Limits ......................................... 37 49-4.01(05) Barrier at Curb ................................................................................................. 37 49-4.01(06) Lateral Placement for Large Drainage Structure on New Alignment, Excluding
3R Project .................................................................................................................... 37 49-4.01(07) Lateral Placement for Large Drainage Structure on Existing Alignment, or 3R
Project on New Alignment .......................................................................................... 38 49-4.02 Barrier Length of Need ............................................................................................... 38
49-4.02(01) Length of Need in Advance of Hazard for Adjacent Traffic [Rev. Sept. 2011] ..................................................................................................................................... 38
49-4.02(02) Length of Need for Opposing Traffic .............................................................. 40 49-4.02(03) Length of Need Beyond Hazard for Divided Highway ................................... 41 49-4.02(04) Length of Need at Outside-Shoulder Bridge Support [Rev. Sept. 2011] ......... 42
49-4.03 Example Length-of-Need Calculations ...................................................................... 43
49-5.0 ROADSIDE-BARRIER APPLICATIONS ...................................................................... 46 49-5.01 Roadside-Barrier Types .............................................................................................. 47
49-5.01(01) TL-3 Barriers ................................................................................................... 47 49-5.01(02) TL-4 Barriers ................................................................................................... 48 49-5.01(03) TL-5 Barrier ..................................................................................................... 50 49-5.01(04) High-Tension Cable-Barrier System (CBS) Design Criteria ........................... 51
49-5.02 Existing Non-NCHRP 350 Guardrail to Remain in Place .......................................... 54 49-5.03 Roadside Barrier Requirement at Rock Cut ............................................................... 55 49-5.04 Roadside-Barrier Requirements at Bridge Pier .......................................................... 55 49-5.05 W-Beam Guardrail Over Large Drainage Structure Under Low Fill ......................... 56
49-5.05(01) Longitudinal Guardrail Placement ................................................................... 57 49-5.05(02) Cable-Terminal Anchor System ...................................................................... 57 49-5.05(03) Grading Requirements ..................................................................................... 58
49-5.06 Guardrail at Curb ........................................................................................................ 58
49-6.0 MEDIAN BARRIER ........................................................................................................ 58 49-6.01 Median-Barrier Warrants ............................................................................................ 58 49-6.02 Median-Barrier Types ................................................................................................ 59
49-6.02(01) TL-3 Barrier ..................................................................................................... 59
2012
3
49-6.02(02) TL-4 Barriers ................................................................................................... 59 49-6.02(03) TL-5 Barrier ..................................................................................................... 60
49-6.03 Example for Determining Median-Barrier Test Level on an Expressway ................. 61 49-6.04 Median-Barrier Design ............................................................................................... 62
49-6.04(01) Median Slopes .................................................................................................. 62 49-6.04(02) Superelevated Section ...................................................................................... 62 49-6.04(03) Barrier-Mounted Obstacle ............................................................................... 63 49-6.04(04) Terminal Treatment ......................................................................................... 63 49-6.04(05) Concrete-Barrier Height Transition ................................................................. 63 49-6.04(06) Horizontal Sight Distance ................................................................................ 63 49-6.04(07) Intersection Sight Distance .............................................................................. 63 49-6.04(08) Interchange Entrance Ramp ............................................................................. 64 49-6.04(09) Median Barrier with Collector-Distributor Road ............................................. 64 49-6.04(10) Temporary Opening in Barrier ......................................................................... 64
49-6.05 Glare Screen ............................................................................................................... 64
49-7.0 PIER OR FRAME-BENT COLLISION WALL .............................................................. 65 49-7.01 Application ................................................................................................................. 65 49-7.02 Design ......................................................................................................................... 66
49-8.0 GUARDRAIL END TREATMENTS, TRANSITIONS, AND IMPACT ATTENUATORS ..................................................................................................................... 67 49-8.01 Guardrail End Treatments (GRETs) and Usage ......................................................... 67
49-8.01(01) TL-3 Treatments .............................................................................................. 67 49-8.01(02) Non-NCHRP 350 Treatment ............................................................................ 68 49-8.01(03) Design Considerations ..................................................................................... 69 49-8.01(04) Design Procedure [Rev. Sept. 2011] ............................................................... 70
49-8.02 Guardrail Transitions and Usage ................................................................................ 72 49-8.02(01) TL-3 Transitions .............................................................................................. 72 49-8.02(02) TL-4 Transitions .............................................................................................. 72 49-8.02(03) Non-NCHRP 350 Transition ............................................................................ 73
49-8.03 Bridge-Railing Transitions ......................................................................................... 73 49-8.03(01) TL-2 Transitions .............................................................................................. 73 49-8.03(02) TL-4 Transitions .............................................................................................. 73 49-8.03(03) TL-5 Transition ................................................................................................ 74
49-8.04 Impact Attenuators ..................................................................................................... 74 49-8.04(01) Types ................................................................................................................ 74 49-8.04(02) Design .............................................................................................................. 76 49-8.04(03) Requirements at a Median Pier ........................................................................ 77
49-9.0 BRIDGE-RAILING END ................................................................................................ 78 49-9.01 Curved W-Beam Guardrail System ............................................................................ 78
2012
4
49-9.02 Bridge-Railing-End Shielding [Rev. Sept. 2011] ....................................................... 78 49-9.03 Public Road Approach or Drive ................................................................................. 79
49-9.03(01) Public-Road Approach ..................................................................................... 79 49-9.03(02) Drive ................................................................................................................ 80
49-9.04 Unfavorable Site Conditions ...................................................................................... 81 49-9.05 Median-Shoulder Bridge-Approach Guardrail Length .............................................. 81
49-10.0 GUIDE TO THE ROADSIDE COMPUTER PROGRAM ............................................ 81 49-10.01 Introduction .............................................................................................................. 82
49-10.01(01) Using ROADSIDE ......................................................................................... 82 49-10.01(02) Function Keys ................................................................................................ 83
49-10.02 Basic Input Data ....................................................................................................... 84 49-10.03 Variable Input Data .................................................................................................. 84
49-10.03(01) Title ................................................................................................................ 85 49-10.03(02) Traffic Volume and Growth ........................................................................... 85 49-10.03(03) Roadway Type ............................................................................................... 86 49-10.03(04) Geometric Adjustment Factors ...................................................................... 86 49-10.03(05) Encroachment Rate ........................................................................................ 87 49-10.03(06) Design Speed ................................................................................................. 88 49-10.03(07) Hazard Definition ........................................................................................... 88 49-10.03(08) Collision Frequency ....................................................................................... 89 49-10.03(09) Severity Index ................................................................................................ 89 49-10.03(10) Project Life and Discount Rate ...................................................................... 91 49-10.03(11) Highway Agency Costs .................................................................................. 92
49-10.04 Analysis Methods ..................................................................................................... 93 49-10.05 Sensitivity Analysis .................................................................................................. 94 49-10.06 Examples .................................................................................................................. 94 49-10.07 Application of ROADSIDE to Non-Level Roadsides (Slope Correction for Cost-
Effectiveness Calculations) ............................................................................................. 103
49-11.0 ASSUMPTIONS FOR EMBANKMENT WARRANT FIGURES ............................. 104
FIGURES .................................................................................................................................... 107
2012
5
LIST OF FIGURES Figure Title 49-2A Clear-Zone Width for New Construction or Reconstruction 49-2B Clear-Zone Adjustment Factor, Kcz, for Horizontal Curve 49-2C Clear-Zone Transition for Curve Adjustment, Radius ≤ 3000 ft 49-2D Clear-Zone Transition for Tangent Section or Curve with Radius > 3000 ft 49-2E Slope-Averaging Example 49-2F Clear-Zone Application for Non-Recoverable Fill Slope 49-2G Clear-Zone Application for Side Slope on New Facility 49-2H Clear-Zone Application for Cut Slope (2:1 Backslope) 49-2 I Clear-Zone Application for Auxiliary Lane or Ramp 49-2J Clear Zone / Slope Average, Example 49-2.2 49-2K Clear Zone / Slope Average, Example 49-2.3 49-2L Appurtenance-Free Zone 49-3A Transverse Slopes 49-3B(35, 40) Barrier Warrant for Embankment, 2-Lane, 2-Way Roadway, 35 or 40 mph 49-3B(45) Barrier Warrant for Embankment, 2-Lane, 2-Way Roadway, 45 mph 49-3B(50) Barrier Warrant for Embankment, 2-Lane, 2-Way Roadway, 50 mph 49-3B(55) Barrier Warrant for Embankment, 2-Lane, 2-Way Roadway, 55 mph 49-3B(60) Barrier Warrant for Embankment, 2-Lane, 2-Way Roadway, 60 mph 49-3B(70) Barrier Warrant for Embankment, 2-Lane, 2-Way Roadway, 70 mph 49-3C Barrier Warrant for Embankment for Roadway of 4 or More Lanes, Divided or Undivided 49-3D Preferred Narrow-Width Ditch Cross Section 49-3D(1) Clear Zone / Guardrail at Culvert 49-3E Preferred Medium-Width Ditch Cross Section 49-3F Preferred Wide-Width Ditch Cross Section 49-3G Large-Culvert End within Clear Zone 49-3H Culvert End Treatment, Median Section 49-3 I Clear Zone / Barrier at Culvert 49-3J Culvert End Treatment, Longitudinal Structure 49-3K Bridge Pier or Spillslope Clearance, New Construction 49-3L Treatment at Existing Bridge Cone, Slopewall ≥ 30 ft from Travel Lane 49-3M Treatment at Existing Bridge Cone, 10 ft ≤ Slopewall < 30 ft from Travel Lane 49-3N Treatment at Existing Bridge Cone with Shoulder Pier 49-3 O Gore-Area Treatment 49-3P Breakaway Support Stub Clearance Diagram
49-3Q Light-Standard Treatment, Fill Slope 4:1 or Steeper
2012
6
49-3R Shoulder Wedges 49-4A Barrier Deflections 49-4B Barrier Placement at Curb 49-4C Barrier Length of Need 49-4D Barrier Length of Need in Advance of Hazard 49-4E Design Elements for Barrier Length of Need 49-4E(1) Minimum Guardrail Length Required in Advance of Hazard 49-4E(2) Guardrail configuration for Outside-Shoulder Approach to Bridge 49-4E(3) Guardrail Configuration and Length of Need for Median-Shoulder Approach to Bridge 49-4E(4) Guardrail Configuration for Bridge Support Inside Clear Zone, Two-Way Roadway, Single Overhead Structure 49-4E(5) Guardrail Configuration for Bridge Support Inside Clear Zone, Two-Way Roadway, Twin Overhead Structures 49-4E(6) Guardrail Configuration for Bridge Support Inside Clear Zone, One-Way Roadway, Single Overhead Structure, Outside Shoulder 49-4E(7) Guardrail Configuration for Bridge Support Inside Clear Zone, One-Way Roadway, Twin Overhead Structures, Outside Shoulder 49-4E(8) Guardrail Configuration for Bridge Support Inside Clear Zone, One-Way Roadway, Single Overhead Structure, Median Shoulder 49-4E(9) Guardrail Configuration for Bridge Support Inside Clear Zone, One-Way Roadway, Twin Overhead Structures, Median Shoulder 49-4E(10) Guardrail Pay Length for Approach to Bridge Support Inside Clear Zone 49-4F Barrier Flare Rates 49-4G Barrier Layout, Bridge Approach 49-4H Barrier Layout, Fixed Object on Horizontal Curve 49-4 I Barrier Length Beyond Hazard, 2-Lane Roadway 49-4J Barrier Length Beyond Hazard, Divided Highway 49-4K Length-of-Need Requirement for Pier Protection 49-4L Barrier Length of Need, Structure-Approach Example 49-4.1 49-4M Barrier Length of Need, Fill-Slope Example 49-4.2 49-4N Barrier Length of Need, Box-Culvert Example 49-4.3 49-5A NCHRP 350 Test Level Crash-Test Criteria 49-6A Median-Barrier Warrants 49-6B Grade Traffic-Adjustment Factor, Kg, and Curvature Traffic-Adjustment Factor, Kc 49-6C Traffic-Adjustment Factor, Ks, Deck Height and Under-Structure Shoulder Height Conditions 49-6D(30) Median-Barrier or Bridge-Railing Test-Level Selection, Design Speed 30 mph 49-6D(40) Median-Barrier or Bridge-Railing Test-Level Selection, Design Speed 40 mph 49-6D(45) Median-Barrier or Bridge-Railing Test-Level Selection, Design Speed 45 mph
2012
7
49-6D(50) Median-Barrier or Bridge-Railing Test-Level Selection, Design Speed 50 mph 49-6D(55) Median-Barrier or Bridge-Railing Test-Level Selection, Design Speed 55 mph 49-6D(60) Median-Barrier or Bridge-Railing Test-Level Selection, Design Speed 60 mph 49-6D(65, 70) Median-Barrier or Bridge-Railing Test-Level Selection, Design Speed 65 mph 49-6E Truck-Height Concrete Median-Barrier Example 49-6.1 49-6F Cutoff Angle for Glare Screen 49-7A Collision-Wall Detail 49-8A Guardrail End Treatment Type OS or MS for Curved Guardrail Run 49-8B Clear Recovery Area Behind Guardrail 49-8C Impact-Attenuator Offsets 49-8D Impact-Attenuator Type Determination 49-8E Impact-Attenuator Footprint Requirements 49-8F Pier Protection Requirements 49-9A Bridge-Railing-End Protection Requirements 49-9B Public-Road Approach Application At or Beyond the Control Line 49-9C Public-Road Approach Application within the Control Line 49-9D Drive Application At or Beyond the Control Line 49-9E Drive Application within the Control Line 49-9F Median Bridge-Approach Criteria 49-10A Basic Data Input Screen 49-10B Variable Data Input Screen 49-10C Yaw Angle 49-10D Input Data Index 49-10E Suggested Lane Distribution 49-10F 4-Lane Divided Highway 49-10G 6-Lane Divided Highway 49-10H Severity Indices (Rigid Barrier and Guardrail Parallel to Roadway) 49-10 I Severity Indices (Guardrail End Treatments) 49-10J Severity Indices (Impact Attenuators) 49-10K Severity Indices (Parallel Slopes) 49-10L Severity Indices (Transverse Slopes) 49-10M Severity Indices (Ditches) 49-10N Severity Indices (Culverts and Miscellaneous Drainage Items) 49-10 O Severity Indices (Utility, Sign, and Luminaire Support Fixed Objects) 49-10P Severity Indices (Miscellaneous Fixed Objects) 49-10Q Repair Costs 49-10R Summary of Input Variable Relative Significance 49-11A Backup Data for Figure 49-3B(40) 49-11B Backup Data for Figure 49-3B(45) 49-11C Backup Data for Figure 49-3B(50)
2012
8
49-11D Backup Data for Figure 49-3B(55) 49-11E Backup Data for Figure 49-3B(60) 49-11F Backup Data for Figure 49-3B(65) 49-11G Severity Indices
2012
9
CHAPTER 49
ROADSIDE SAFETY
49-1.0 GENERAL
49-1.01 Clear-Zone Concept
The ideal roadway should be free from obstructions or hazardous conditions within the entire right
of way. This is not practical due to economic, environmental, or drainage needs. The clear-zone
concept was developed as a guide to determine how much obstruction-free recovery area should be
provided for a run-off-the-road vehicle. The clear-zone width estimates provided herein, as derived
from the AASHTO Roadside Design Guide, provide adequate space for approximately 80% of the
motorists who run off the road to gain control of their vehicles. The clear-zone widths are only
approximate values. It is the designer’s responsibility to use engineering judgment, based on
accident data when available, to determine if hazardous roadside features, including those outside
the clear zone, warrant some type of treatment.
49-1.02 Situation Requiring Greater Clear-Zone Width
The basic clear-zone value assumes a tangent roadway section and level or near-level roadside
slopes. A steeper downslope requires a greater clear-zone width because a vehicle requires more
distance to stop or turn on a downslope. Therefore, the horizontal width of the clear zone on a
downslope must be extended to be equivalent to a level clear zone. Likewise, a sharp horizontal
curve, the location of a non-traversable drainage ditch, or a similar situation affects the area
alongside the roadway defined as a recovery area for an errant vehicle. It is equally apparent that a
slower-speed vehicle encroaching upon the roadside would not travel as far from the edge of the
travel lane as one operating at a higher speed.
49-1.03 Applicability
The clear-zone requirements provided herein apply only to a project on a new location, a
reconstruction project, or a 3R or partial 4R project on a freeway. The roadside-safety requirements
for a 3R non-freeway project are provided in Section 55-5.0.
2012
10
Where reference is made to speed, it is intended that the design speed be used. Design speed for a
new construction or reconstruction project is provided in Chapter 53. Design speed for a 3R or
partial 4R project on a freeway is provided in Chapter 54.
Where reference is made to AADT, it is intended to be the design-year traffic volume, which is
assumed to be 20 years into the future. See Section 40-2.02.
49-1.04 Right of Way
Right of way is established to clear the construction limits. The construction limits are determined
using a cross section that is traversable out to the right-of-way line or to the end of the clear zone,
whichever is closer to the edge of the travel lane. Reducing right-of-way width by designing a steep
embankment slope that will require the installation of guardrail should be avoided unless necessary
due to restricted conditions (e.g., environmental, dense development).
49-1.05 Cost-Effectiveness of Safety Improvements
Warrants for countermeasures should be in accordance with the appropriate sections in this Chapter.
The cost-effectiveness of the countermeasures for hazardous roadside conditions should desirably
be considered. Therefore, the designer is encouraged to use the ROADSIDE computer program
described in Section 49-10.0 as a tool in selecting an alternative safety treatment which offers the
greatest anticipated return of safety benefits for the funds expended. ROADSIDE can be used to
evaluate many of the safety treatments outlined in this Chapter to determine if they are cost effective
at a specific location. ROADSIDE should not be used to determine whether or not countermeasures
are warranted at a particular location. Engineering judgment must be used in applying the results
from ROADSIDE.
49-1.06 Adherence to Design Criteria
An effort should be made to satisfy the design criteria provided in this Chapter (e.g., clear zone,
barrier length of need). However, if this is not practical, a Level Two design exception is required.
If the design criteria have not been satisfied, a brief rationale for not satisfying the criteria should be
documented in the project file. It will not be necessary to prepare in-depth documentation to justify
the decision. ROADSIDE can be used as part of the required documentation justification. Section
40-8.0 further describes the design-exception procedures.
2012
11
Each new installation of a barrier device, barrier end treatment, transition device, or other safety
hardware should satisfy the placement and installation criteria described in this Chapter and the
INDOT Standard Drawings.
Environmental mitigation measures should not supersede roadside safety criteria. However,
environmental mitigation features may be considered and incorporated into the project consistent
with the criteria provided in this Chapter.
49-2.0 ROADSIDE CLEAR ZONE
49-2.01 Clear-Zone Width
Figure 49-2A, Clear-Zone Width for New Construction or Reconstruction, provides the clear-zone
width for design. This is an estimate of the traversable area required adjacent to the edge of the
travel lane and is based on a set of curves from the AASHTO Roadside Design Guide. These
curves are for a tangent section and various side slopes. They were developed assuming an infinite
length of side slope and 12-ft shoulders. Intervening ditches or multiple slopes require further
consideration.
By referring to Figure 49-2A for a given side slope and design year AADT, the appropriate clear-
zone width for a given design speed can be determined. For example, for a highway with a design
speed of 60 mph, an AADT of 5000 vehicles and a 4:1 fill slope, the suggested clear-zone width is
40 ft. For a 4:1 cut slope, the required clear-zone width is 20 ft.
A basic understanding of the clear-zone concept is critical to its proper application. The value
obtained from Figure 49-2A implies a degree of accuracy that does not exist. The values are based
on limited empirical data which was then extrapolated to provide data for a wide range of
conditions. Thus, the values obtained are neither absolute nor precise. They do, however, provide a
frame of reference for making decisions on providing a safe roadside area.
In applying the clear-zone-width value, the designer should consider the following.
1. Context. The clear-zone width shown in Figure 49-2A is not absolute. It is desirable to
eliminate all hazards within the right of way. However, this may not be practical because of
economic or environmental constraints. It can be reasonable to leave a fixed object within
the clear zone. An object beyond the clear-zone width may otherwise warrant removal or
shielding. The use of an appropriate clear-zone width is a compromise between maximum
safety and minimum construction costs. The designer should use engineering judgment in
2012
12
determining if a roadside hazard should be removed or shielded if it is outside the clear zone
but within the right of way.
2. Adjustments. The clear-zone-width value shown in Figure 49-2A can be used for a roadway
with shoulders of less than 12.0 ft in width without applying adjustment factors. The clear
zone is measured from the edge of the travel lane, and slope averaging starts at the edge of
shoulder.
3. Right of Way. If the clear-zone width extends beyond the right-of-way width, use the
distance from the edge of the travel lane to the right-of-way line as the clear-zone width.
4. Guardrail. Where guardrail is required, the clear-zone width is used to determine the length
of guardrail need.
5. Boundary. The clear-zone width should not be used as a boundary for introducing a
roadside hazard such as a bridge pier, non-breakaway sign support, utility pole, or landscape
feature. These should be placed as far from the roadway as practical.
6. Design Year AADT. The Design Year AADT will be the total AADT on a two-way
roadway or the directional AADT on a one-way roadway. Examples of a one-way roadway
include a ramp, or each directional roadway of a divided highway.
49-2.02 Clear-Zone-Width Adjustments
The clear-zone width should not vary with small variations in highway features. It should be
constant on a length of road with a fairly consistent roadside. For a highway on new location, the
clear-zone width should be constant for as much of the length of project as practical.
49-2.02(01) Horizontal-Curve Correction
A horizontal curve increases the angle of exit from the roadway and thus increases the width of
clear zone required. Figure 49-2B, Clear-Zone-Width Adjustment Factor, Kcz, for Horizontal
Curve, provides horizontal-curve correction factors that should be applied to the tangent clear-zone
width to adjust it for roadway curvature. Figure 49-2C, Clear-Zone Transition for Curve
Adjustment, Radius ≤ 3000 ft, illustrates the application of the adjusted clear-zone width on a curve.
A curve with a radius of greater than 3000 ft as measured along the roadway centerline will not
require a curvature adjustment. The horizontal-curve correction is required for a new construction
2012
13
or reconstruction project, or a 3R or partial 4R freeway project. If the correction cannot be
practically applied, a Level Two design exception will be required.
The transition between different-width clear zones along a tangent and a curve with radius greater
than 3000 ft should be applied as shown in Figure 49-2D, Clear-Zone Transition for Tangent
Section or Curve with Radius > 3000 ft. The transition lengths between the beginning and the end
of the narrower and wider clear zones may vary.
* * * * * * * * * *
Example 49-2.1
Given: Rural Collector
Design Speed = 55 mph
Design-Year AADT = 2,000
Horizontal curve with a radius of 2000 ft
3:1 cut slope
Problem: Find the adjusted clear-zone width.
Solution: From Figure 49-2A, the clear-zone width on the tangent, CZt = 15 ft
From Figure 49-2B, the curve correction factor, Kcz = 1.2
Clear-zone width for the curve, CZc = 15 ft x 1.2 = 18 ft
The transition length, L =3.1 x 55 = 171 ft
* * * * * * * * * *
49-2.02(02) Slope Averaging
Variable-fill slopes can be used along a roadway to provide a relatively flat recovery area
immediately adjacent to the roadway followed by a steeper side slope. Clear-zone widths for an
embankment with variable side slopes ranging from essentially flat to 4:1 may be averaged, using a
weighted average within the clear zone, to produce a composite clear-zone width. The slope
averaging should begin at the outside edge of the adjacent travel lane for opposing traffic. See
Figure 49-2E, Slope-Averaging Example.
For a slope flatter than or equal to 10:1, a slope of 10:1 is used for slope averaging.
2012
14
Slope averaging applies only to slopes in the same direction. Slopes which change from a
downslope to an upslope, as for a ditch section, cannot be averaged and should be treated as
discussed in Section 49-2.03(01).
49-2.03 Clear-Zone Applications
49-2.03(01) Roadway with Shoulders or Sloping Curbs and V ≥ 40 mph
This Section applies to each project on a freeway, including 3R or partial 4R work, or to each new
construction or 4R project on a rural or urban arterial, or a rural or urban collector with a design
speed of 40 mph or higher. Section 49-2.03(02) provides the clear-zone application for a rural or
urban collector with a design speed of 35 mph or lower, a rural local road, or an urban local street.
Section 49-2.03(03) provides the clear-zone application for an urban facility with vertical curbs.
The designer should consider the following clear-zone applications.
1. Criteria. The clear-zone width provided in Figure 49-2A with the appropriate adjustments
from Section 49-2.02 should be used.
2. Fill Slope for Reconstruction Project. To calculate the recommended clear-zone width, the
following should be considered.
a. Figures 49-2A and 49-2B, with the applicable design speed, AADT, and foreslope,
are used to determine the appropriate clear-zone width. If the clear zone extends
outside the right of way, use the right-of-way line as outside edge of the clear zone.
b. For a variable fill slope of 4:1 or flatter, use a weighted average as discussed in
Section 49-2.02(02) to determine the slope, then proceed as discussed in Item 2.a.
above.
c. A fill slope steeper than 4:1 is considered non-recoverable and should not be
included in slope averaging. If a vehicle encroaches onto a non-recoverable slope, it
can be assumed that the vehicle will continue to travel to the bottom of the slope.
Therefore, if the clear-zone width extends onto the non-recoverable slope, a clear
runout area should be provided at the bottom of the slope. This clear runout area
should be equal in width to the portion of the clear-zone width which extends onto
the non-recoverable slope or 12 ft, whichever is greater. See Figure 49-2F, Clear-
Zone Application for Non-Recoverable Fill Slope, for an illustration of this
procedure.
2012
15
3. Fill Slope for New Facility. A 6:1 fill slope as shown in Figure 49-2G, Clear-Zone
Application for Side Slope on New Facility, should be used adjacent to the roadway. At a
minimum, the criteria described for a reconstruction project in Item 2 above may be used.
4. Cut Slope for Reconstruction Project. To calculate the recommended clear-zone width, the
following should be considered.
a. If a ditch is traversable, use Figure 49-2A with the applicable design speed and ADT
to check the clear-zone width required for the foreslope and the backslope. The
foreslope clear-zone width will control. However, if the toe of the backslope is
within 10 ft of the shoulder edge, the clear-zone width for the backslope should be
used. See Section 49-3.03 to determine if the ditch is traversable.
b. If the ditch is not traversable, the ditch should be reconstructed to a section which is
traversable. The clear-zone width is then calculated as in Item 4.a above.
c. A cut slope of 2:1 is not desirable. However, if it will be retained or be constructed
within the clear zone, the ditch in front of it should be made traversable. Figure 49-
2H, Clear-Zone Application for Cut Slope (2:1 Backslope), illustrates the desirable
cross section if a 2:1 backslope will be retained. If it is not practical to construct a
traversable ditch, the designer should consider the accident experience at the site and
use engineering judgment to determine if guardrail is warranted.
5. Cut Slope for New Facility. A ditch section as shown in Figure 49-2G should be used. At a
minimum, the criteria described in Item 4 above for a reconstruction project may be used.
However, 2:1 backslopes should not be used on a new facility.
6. Auxiliary Lane. Existing slopes adjacent to an acceleration or deceleration lane should be
measured by averaging the slopes from the edge of the theoretical 12 ft shoulder. The clear-
zone width is measured from the edge of the through travel lane, and is based on the
mainline AADT and design speed. The clear-zone width should also be checked for the
auxiliary lane using the auxiliary-lane AADT and mainline design speed. For the latter
situation, the clear-zone width is measured from the outside edge of the auxiliary lane.
Example 49-2.2 illustrates an example calculation of the clear-zone width from the edge of
the through lane using slope averaging. Figure 49-2 I, Clear-Zone Application for Auxiliary
Lane or Ramp, illustrates the clear-zone application for an auxiliary lane next to the
mainline.
2012
16
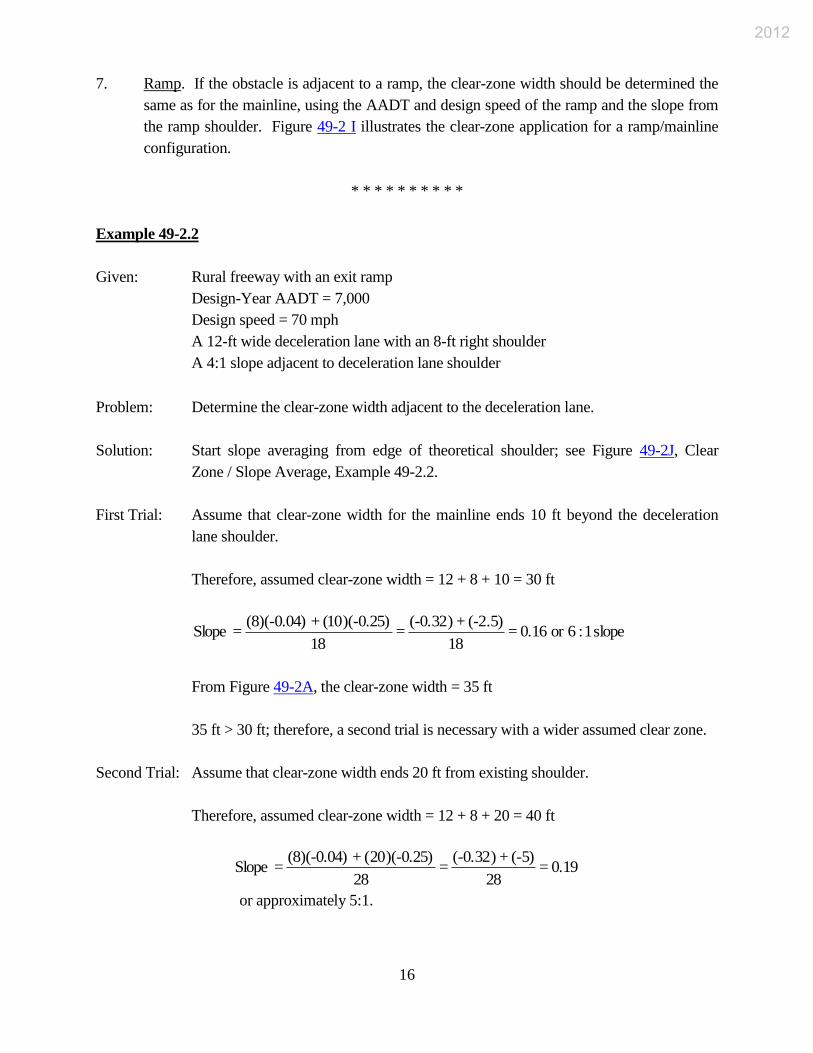
7. Ramp. If the obstacle is adjacent to a ramp, the clear-zone width should be determined the
same as for the mainline, using the AADT and design speed of the ramp and the slope from
the ramp shoulder. Figure 49-2 I illustrates the clear-zone application for a ramp/mainline
configuration.
* * * * * * * * * *
Example 49-2.2
Given: Rural freeway with an exit ramp
Design-Year AADT = 7,000
Design speed = 70 mph
A 12-ft wide deceleration lane with an 8-ft right shoulder
A 4:1 slope adjacent to deceleration lane shoulder
Problem: Determine the clear-zone width adjacent to the deceleration lane.
Solution: Start slope averaging from edge of theoretical shoulder; see Figure 49-2J, Clear
Zone / Slope Average, Example 49-2.2.
First Trial: Assume that clear-zone width for the mainline ends 10 ft beyond the deceleration
lane shoulder.
Therefore, assumed clear-zone width = 12 + 8 + 10 = 30 ft
From Figure 49-2A, the clear-zone width = 35 ft
35 ft > 30 ft; therefore, a second trial is necessary with a wider assumed clear zone.
Second Trial: Assume that clear-zone width ends 20 ft from existing shoulder.
Therefore, assumed clear-zone width = 12 + 8 + 20 = 40 ft
or approximately 5:1.
slope 1:6or 0.16 = 18
.5)2(- + )32(-0. =
18
)(-0.25)10( + )(-0.04)8( = Slope
0.19 = 28
(-5) + )32(-0. =
28
)(-0.25)20( + )(-0.04)8( = Slope
2012
17
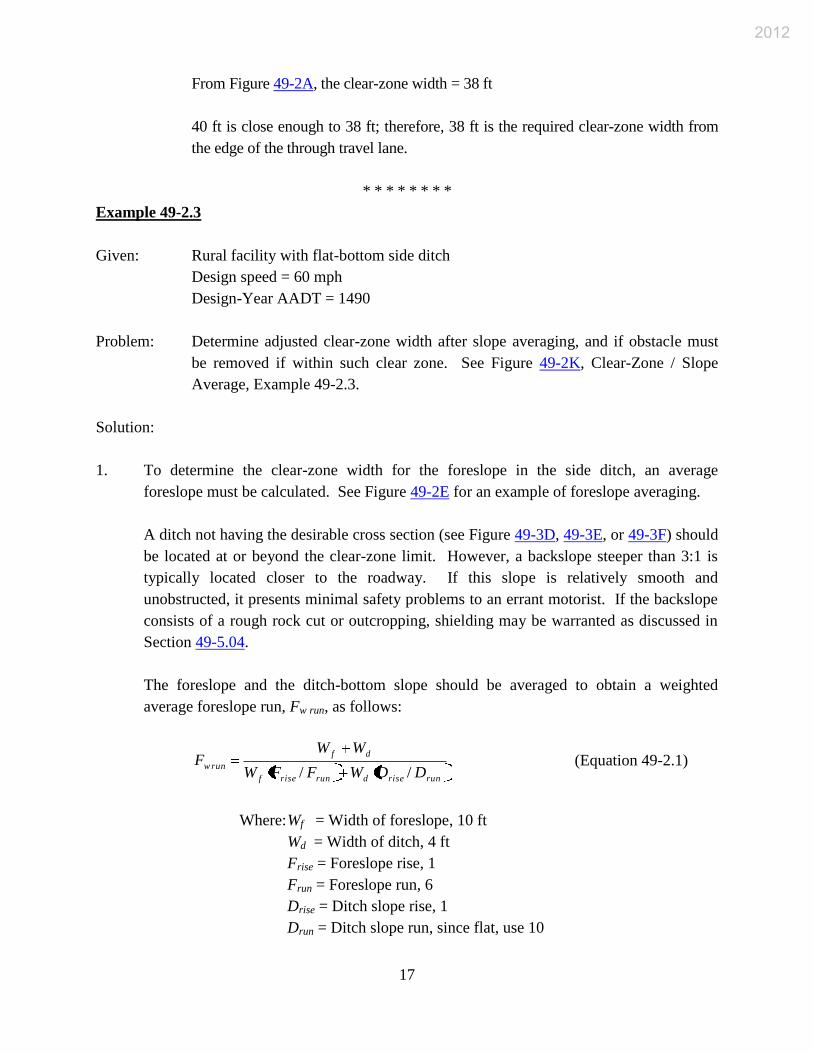
From Figure 49-2A, the clear-zone width = 38 ft
40 ft is close enough to 38 ft; therefore, 38 ft is the required clear-zone width from
the edge of the through travel lane.
* * * * * * * *
Example 49-2.3
Given: Rural facility with flat-bottom side ditch
Design speed = 60 mph
Design-Year AADT = 1490
Problem: Determine adjusted clear-zone width after slope averaging, and if obstacle must
be removed if within such clear zone. See Figure 49-2K, Clear-Zone / Slope
Average, Example 49-2.3.
Solution:
1. To determine the clear-zone width for the foreslope in the side ditch, an average
foreslope must be calculated. See Figure 49-2E for an example of foreslope averaging.
A ditch not having the desirable cross section (see Figure 49-3D, 49-3E, or 49-3F) should
be located at or beyond the clear-zone limit. However, a backslope steeper than 3:1 is
typically located closer to the roadway. If this slope is relatively smooth and
unobstructed, it presents minimal safety problems to an errant motorist. If the backslope
consists of a rough rock cut or outcropping, shielding may be warranted as discussed in
Section 49-5.04.
The foreslope and the ditch-bottom slope should be averaged to obtain a weighted
average foreslope run, Fw run, as follows:
runrisedrunrisef
df
runwDDWFFW
WWF
// (Equation 49-2.1)
Where: Wf = Width of foreslope, 10 ft
Wd = Width of ditch, 4 ft
Frise = Foreslope rise, 1
Frun = Foreslope run, 6
Drise = Ditch slope rise, 1
Drun = Ditch slope run, since flat, use 10
2012
18
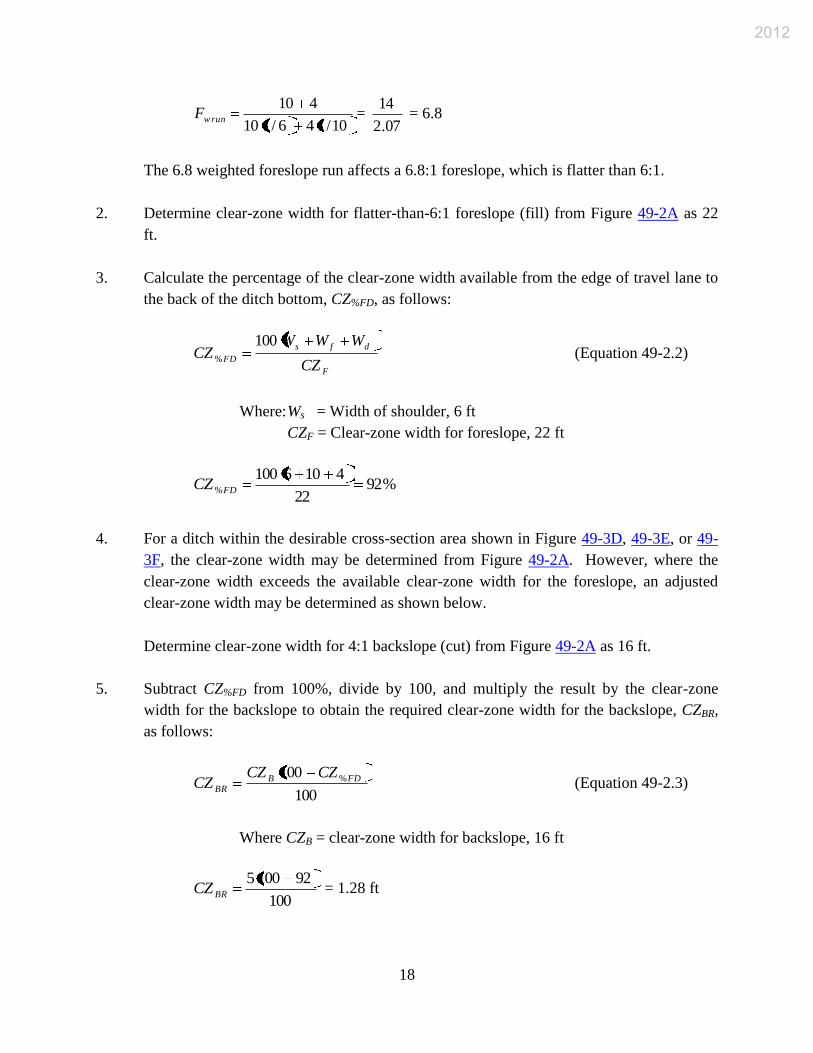
10/146/110
410runwF =
07.2
14 = 6.8
The 6.8 weighted foreslope run affects a 6.8:1 foreslope, which is flatter than 6:1.
2. Determine clear-zone width for flatter-than-6:1 foreslope (fill) from Figure 49-2A as 22
ft.
3. Calculate the percentage of the clear-zone width available from the edge of travel lane to
the back of the ditch bottom, CZ%FD, as follows:
F
dfs
FDCZ
WWWCZ
100% (Equation 49-2.2)
Where: Ws = Width of shoulder, 6 ft
CZF = Clear-zone width for foreslope, 22 ft
%9222
4106100%FDCZ
4. For a ditch within the desirable cross-section area shown in Figure 49-3D, 49-3E, or 49-
3F, the clear-zone width may be determined from Figure 49-2A. However, where the
clear-zone width exceeds the available clear-zone width for the foreslope, an adjusted
clear-zone width may be determined as shown below.
Determine clear-zone width for 4:1 backslope (cut) from Figure 49-2A as 16 ft.
5. Subtract CZ%FD from 100%, divide by 100, and multiply the result by the clear-zone
width for the backslope to obtain the required clear-zone width for the backslope, CZBR,
as follows:
100
100 %FDB
BR
CZCZCZ (Equation 49-2.3)
Where CZB = clear-zone width for backslope, 16 ft
100
921005BRCZ = 1.28 ft
2012
19
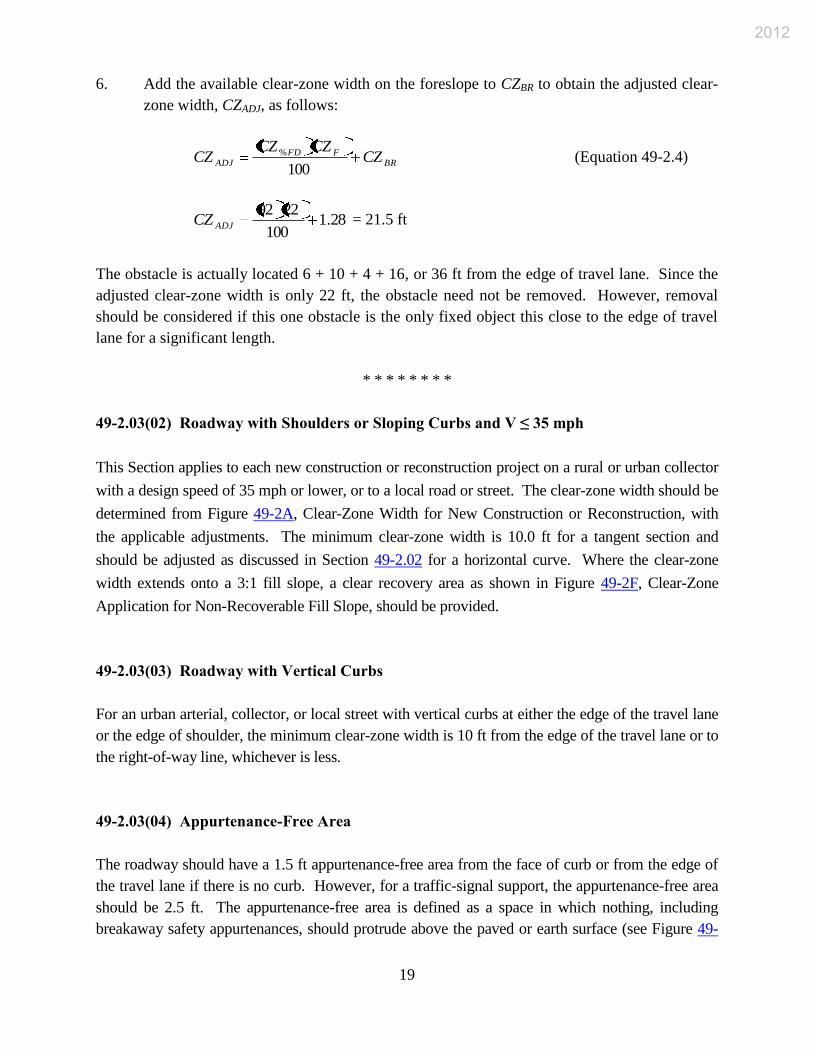
6. Add the available clear-zone width on the foreslope to CZBR to obtain the adjusted clear-
zone width, CZADJ, as follows:
BR
FFD
ADJ CZCZCZ
CZ100
% (Equation 49-2.4)
28.1100
2292ADJCZ = 21.5 ft
The obstacle is actually located 6 + 10 + 4 + 16, or 36 ft from the edge of travel lane. Since the
adjusted clear-zone width is only 22 ft, the obstacle need not be removed. However, removal
should be considered if this one obstacle is the only fixed object this close to the edge of travel
lane for a significant length.
* * * * * * * *
49-2.03(02) Roadway with Shoulders or Sloping Curbs and V ≤ 35 mph
This Section applies to each new construction or reconstruction project on a rural or urban collector
with a design speed of 35 mph or lower, or to a local road or street. The clear-zone width should be
determined from Figure 49-2A, Clear-Zone Width for New Construction or Reconstruction, with
the applicable adjustments. The minimum clear-zone width is 10.0 ft for a tangent section and
should be adjusted as discussed in Section 49-2.02 for a horizontal curve. Where the clear-zone
width extends onto a 3:1 fill slope, a clear recovery area as shown in Figure 49-2F, Clear-Zone
Application for Non-Recoverable Fill Slope, should be provided.
49-2.03(03) Roadway with Vertical Curbs
For an urban arterial, collector, or local street with vertical curbs at either the edge of the travel lane
or the edge of shoulder, the minimum clear-zone width is 10 ft from the edge of the travel lane or to
the right-of-way line, whichever is less.
49-2.03(04) Appurtenance-Free Area
The roadway should have a 1.5 ft appurtenance-free area from the face of curb or from the edge of
the travel lane if there is no curb. However, for a traffic-signal support, the appurtenance-free area
should be 2.5 ft. The appurtenance-free area is defined as a space in which nothing, including
breakaway safety appurtenances, should protrude above the paved or earth surface (see Figure 49-
2012
20
2L, Appurtenance-Free Zone). The objective is to provide a clear area adjacent to the roadway in
which nothing will interfere with extended side-mirrors on trucks, with the opening of vehicular
doors, etc.
49-2.03(05) On-Street Parking
The following clear-zone requirements will apply.
1. Continuous 24-Hours Parking. No clear zone is required where there is continuous 24-h
parking, except that the appurtenance-free area of 1.5 ft should be provided from the face of
the curb, or the edge of the parking lane if there is no curb.
2. Parking Lane Used as a Travel Lane. The clear-zone width should be determined assuming
the edge of the parking lane as the right edge of the rightmost travel lane.
49-3.0 TREATMENT OF OBSTRUCTIONS
49-3.01 Roadside Hazards
49-3.01(01) Range of Treatments
If an obstruction or non-traversable hazard is determined to be within the clear zone, it should be
treated, in order of preference, as follows:
1. removed or redesigned so that it can be safely traversed;
2. relocated outside of the clear zone to a point where it is less likely to be hit;
3. made breakaway to reduce impact severity;
4. shielded with a traffic barrier or impact attenuator; or
5. delineated if the above treatments are not practical.
49-3.01(02) Example Hazards
The method for treating an obstruction should be based on an analysis of factors such as initial cost,
maintenance cost, and the greatest safety return. The following is a list of some of the obstructions
and hazards which should be considered for treatment.
2012
21
1. non-breakaway sign support or luminaire support. A sign or luminaire in the clear zone
should not be placed on a breakaway support if there is a sidewalk and there is a potential
for the support falling on a pedestrian or bicyclist;
2. bridge pier;
3. bridge-railing end. A bridge-railing end must have appropriate approach shielding whether
or not the end is outside the clear zone;
4. the end of each culvert which is transverse to the mainline road and does not have
acceptable end treatments in accordance with Section 49-8.01;
5. concrete headwall for a culvert;
6. tree;
7. retaining-wall end;
8. mailbox support. A mailbox support should be placed in accordance with the INDOT
Standard Drawings, INDOT Standard Specifications, and Section 51-11.0;
9. wood pole or post with a cross sectional area greater than 0.15 ft2;
10. utility pole. A utility pole should be installed as close as practical to the right-of-way line;
11. steel pipe with an inside diameter greater than 2 in;
12. large boulder;
13. rough rock cut;
14. bridge-cone slope that is 2:1 or steeper and can be hit head-on;
15. severely rutted or eroded slope;
16. transverse embankment slope for a drive, public road approach, ditch check, or median
crossover that is steeper than shown in Figure 49-3A, Transverse Slopes, for the selected
design speed and AADT level;
17. ditch cross-section that is not in accordance with the criteria described in Section 49-3.02;
2012
22
18. stream or body of water where the permanent water depth is 2 ft or greater; or
19. slope steeper than 1:1 at the edge of shoulder and a height greater than 2 ft.
49-3.02 Embankment
The factors in determining the need for a roadside barrier at an embankment are the lateral
clearances from the barrier to the hazard and from the barrier to the top of the embankment slope.
They are based on distances from the face of the barrier, considering the rail-blockout-post
thickness and the barrier deflection properties.
The Figures 49-3B series describes the barrier warrant at an embankment for a 2-lane 2-way
roadway for a design speed of 35, 40, 45, 50, 55, 60, or 70 mph, respectively. Figure 49-3C
describes the barrier warrant at an embankment for a divided or undivided roadway of 4 or more
lanes. Though these figures were developed using 12-ft lanes and 10- to 12-ft shoulders, they can
be used for another lane or shoulder width. A barrier at an embankment is not warranted on a
facility with a design speed of 30 mph or lower. Slope-height combinations which appear on or
below the curve do not warrant shielding. To adjust for horizontal curvature and grade, use the
factors shown in Figure 49-6B, Grade Traffic-Adjustment Factor, Kg, and Curvature Traffic-
Adjustment Factor, Kc. The following example illustrates how to use the embankment-barrier
warrant figures.
* * * * * * * * *
Example 49-3.1
Given: 2-lane, 2-way highway
Design Speed = 55 mph
Design Year AADT = 3000
Tangent Section
Grade = 2%
Foreslope = 2.0:1
Fill Height = 10 ft
Problem: Determine if guardrail is warranted at the embankment.
2012
23
Solution: Using Figure 49-3B(55), it can be determined that a barrier is not warranted based
on the embankment height. However, the need for a barrier should be considered
based on other factors (e.g., nearby hazards, accident history).
* * * * * * * *
Example 49-3.2
Given: Same highway section as discussed in Example 49-3.1, but with a horizontal radius
of 820 ft, the embankment of concern on the outside of the curve, and a fill height of
10 ft.
Problem: Determine if a barrier is warranted at the embankment.
Solution:
1. The Design Year AADT first must be adjusted by the horizontal curvature factor Kc = 4.0
from Figure 49-6B, Grade Traffic-Adjustment Factor, Kg, and Curvature Traffic-Adjustment
Factor, Kc.
Corrected Design Year AADT = 3,000 x 4.0 = 12,000
2. Using Figure 49-3B(55), it can be determined that a barrier is now warranted based on the
embankment height.
* * * * * * * * * *
49-3.03 Roadside Ditch
49-3.03(01) General Guidelines
Traversable-ditch cross sections are defined in Figure 49-3D, Preferred Ditch Cross Section, Width
< 4 ft; Figure 49-3E, Preferred Ditch Cross Section, 4 ft ≤ Width ≤ 8 ft; and Figure 49-3F, Preferred
Ditch Cross Section, Width > 8 ft. Two curves are shown on each figure. The area below the lower
curve represents a ditch cross section which can be traversed by a vehicle containing unrestrained
occupants and, thus, is considered to be desirable. A ditch cross section which is between the upper
curve and the lower curve is considered to be acceptable. However, vehicle occupants must be
restrained in order to safely traverse the ditch. Minor encroachment into the area above the upper
2012
24
curve may be necessary due to right-of-way restrictions or to avoid nominal changes the existing
ditch. In addition, the following should be considered.
1. A slope of 3:1 should be used only where site conditions do not permit the use of a flatter
slope.
2. To permit traversability of a 3:1 slope, embankment surfaces should be uniform. Vehicular
rollover can be expected if the embankment is soft or rutted.
3. A foreslope steeper than 4:1 is not desirable because its use severely limits the range of
backslopes producing a safe ditch configuration.
49-3.02(02) Application
If a ditch is outside the clear zone, it need not be checked for traversability. For a ditch within the
clear zone, the following describes the appropriate application of Figure 49-3D, 49-3E, or 49-3F.
1. In Fill, Reconstruction Project. Existing ditch-slope combinations which are within the
desirable or acceptable range may be retained. An area with ditch slope combinations which
are not within the undesirable range should be evaluated for cost and accident history before
deciding to make an improvement. If an improvement is warranted, the slope combination
should preferably be within the desirable range and at least within the acceptable range.
2. In Fill, New Facility. A foreslope, backslope, and ditch width should be selected that will be
within the desirable range shown in Figure 49-3D, 49-3E, or 49-3F.
3. In Cut, Reconstruction Project. If the ditch is such that to flatten the slopes or move the
ditch out farther means acquiring more right-of-way, this should be done only if considered
to be cost effective. Other means of making the ditch traversable can be evaluated as
follows:
a. use of a pipe in the ditch;
b. raise the grade of the ditch; or
c. place uniform riprap in the ditch.
2012
25
4. In Cut, New Facility. The desirable ditch section is shown in Figure 49-2G, Clear-Zone Application for Side Slope. For a minimum ditch section, a section should be provided which is within the desirable range shown in Figure 49-3D, 49-3E, or 49-3F.
49-3.04 Drainage Structure 49-3.04(01) Drainage Structure Perpendicular or Skewed to Roadway Centerline The following provides the criteria for a drainage structure which is perpendicular or skewed to the roadway centerline. The point at which the top of the structure protrudes from the slope is within the clear zone. 1. 12-in. Diameter Culvert. This type of structure or equivalent pipe-arch culvert should
include a metal culvert end section as shown on the INDOT Standard Drawings. 2. 12-in. to 60-in. Diameter Culvert, 10-deg Skew or Less. This type of structure or equivalent
pipe-arch culvert should be installed with a safety metal culvert end section, or an optional grated box end section (GBES), as shown on the INDOT Standard Drawings. For a site with side slopes of 3:1 or steeper, a culvert of 12 in. to 30 in. diameter may include a safety metal culvert end section. For a site with a side slope of 3:1 or steeper, a culvert of 36 in. to 60 in. diameter may include a safety culvert metal end section or a GBES. A GBES type I should be used at a high-accident location where it is anticipated that a vehicle will most likely traverse it based on previous accident experience. This does not apply to where the culvert end is shielded with adequate length to shield the end from an errant vehicle.
3. 12-in. to 60-in. Diameter Culvert, Greater Than 10-deg Skew. This type of structure or
equivalent pipe-arch culvert should have a GBES installed perpendicular to the roadway centerline as shown on the INDOT Standard Drawings. This applies except where the culvert end is shielded with adequate length to shield the end from an errant vehicle. A large skew may require the use of a GBES that is intended for a larger pipe in order to provide an adequate opening in the GBES for the skewed pipe.
It may be necessary to maintain the direction of flow in a straight line at the inlet and the
outlet in order to perpetuate the channel flow. The GBES must be installed parallel to the pipe centerline, and the roadway embankment must be warped around the GBES to present a smooth slope profile.
4. 66-in. or Larger-Diameter Culvert. If the point at which the top of this type of culvert, pipe
structure, or equivalent pipe-arch protrudes from the slope is within the clear zone, shielding
2012
26
should be provided. See Figure 49-3G, Large-Culvert End within Clear Zone. If the culvert end is outside the clear zone, shielding should be placed to protect an errant motorist from the culvert end. If there is inadequate cover over the culvert to drive guardrail posts, it will be necessary to use the detail for shielding over a low-fill culvert as shown in Section 49-5.05 and the INDOT Standard Drawings.
5. Pipe in the Median. The adjoining ends of two transverse culverts in the median between
divided travelways or between a main road and a frontage road should be connected if the ends are within the clear zone. At a minimum, a pipe in the median should be treated the same as described above. However, a pipe structure of 12 in. through 60 in. diameter should have a GBES type I. A culvert with appropriate sloped grates should be installed in the parallel ditch as shown in Figure 49-3H, Culvert End Treatment, Median Section.
6. Box Culvert or Three-Sided Structure. See Figure 49-3 I, Clear Zone / Barrier at Culvert,
for acceptable options. The most cost-effective treatment should be considered.
Removing sections of a box culvert and attaching metal circular or pipe arch adapters, a short section of metal culvert, and then a GBES is also an option if the span is less than or equal to 5 ft.
49-3.04(02) Drainage Structure Parallel to Roadway Centerline The following provides the criteria for a drainage structure which is parallel to the roadway centerline and is within the clear zone. 1. 12-in. to 60-in. Diameter Culvert in the Median. This type of pipe structure under a median
crossover should be end-fitted with GBES type II with a slope satisfying the criteria shown in Figure 49-3A, Transverse Slope.
2. 12-in. Diameter Culvert. This type of pipe structure or equivalent pipe-arch culvert should
include the metal culvert end section as shown on the INDOT Standard Drawings. 3. 12-in. to 60-in. Diameter Culvert in Side Ditch. This includes both ends of a culvert
adjacent to a two-way roadway where both ends are within the clear zone for both the adjacent and opposing traffic. This also includes the end-facing oncoming traffic on the outside of a divided highway. It does not apply to the traffic downstream end of a culvert if it is outside the clear zone for opposing traffic. See Figure 49-3J, Culvert End Treatment, Longitudinal Structure.
2012
27
This type of pipe structure should be installed with a safety metal culvert end section. If a 10:1 slope is required parallel to the roadway, the 10:1 slope may be warped to match the 6:1 slope of the safety metal culvert end section. GBES type II, with a slope as shown in Figure 49-3A, should be used at each high-accident location where it is anticipated that a vehicle will most likely traverse it based on previous accident experience. This does not apply where the culvert end is shielded with adequate length to shield the end from an errant vehicle.
49-3.04(03) Drainage Inlet The following provides the criteria for the placement of a drainage inlet within the clear zone. 1. General. A type 7 inlet with vertical projections of 4 in. or greater should not be used in a
new installation. An existing type 7 inlet should not be replaced unless its location is considered to be a safety hazard.
2. Reconstruction Project. A type E-7 inlet in a median should not be replaced unless its
location is considered to be a safety hazard. The type E-7 inlet should be replaced with an acceptable inlet type if the slopes adjacent to it must be re-graded to eliminate a hazardous depression. If an existing type E-7 casting is broken, it should be replaced.
3. New Facility or Reconstruction Project. Only a type N-12 or P-12A inlet will be permitted,
as follows: a. in a median in advance of the 20:1 slope grading for an attenuation device at a
median pier or overhead sign structure support; or b. in a side ditch in advance of the 20:1 slope grading for a guardrail run that is buried
in a backslope. 4. Interstate Route. A type N-12 or P-12A inlet that does not have a 10:1 slope and is parallel
to the centerline should be replaced with a new 10:1 slope type N-12 or P-12A inlet as shown on the INDOT Standard Drawings.
2012
28
49-3.05 Curbs 49-3.05(01) General The use of curbs should be avoided. However, they can be necessary to control drainage or to protect erodible soils. Section 45-1.05 and the INDOT Standard Drawings provide detailed information on the warrants and types of curbs used. If considering curbing relative to roadside safety, the following should be considered. 1. Design Speed. A facility with a design speed of 50 mph or higher should be designed
without curbs. However, if necessary, a 4-in. sloping curb may be used. A facility with a design speed of 45 mph or lower may use either a sloping or vertical curb.
2. Roadside Barrier. The use of a curb with a roadside barrier is discouraged and, specifically,
a curb higher than 4 in. should not be used with a barrier. Terrain conditions between the traveled way and a barrier can have significant effects on barrier performance. Curbs and a sloped median (including superelevated section) are two prominent features which deserve attention.
3. Redirection. Curbs offer no safety benefits to vehicular behavior following impact on a
high-speed roadway. Therefore, a curb should not be used for the purpose of redirecting an errant vehicle.
49-3.05(02) Curbs on a Ramp Existing curbs on a ramp should be removed and new stabilized shoulders should be constructed. Using 16 ft as the pavement width for the ramp, the shoulders should be constructed such that a 4-ft desirable, 2.5-ft minimum width stabilized shoulder is on the left side and an 8-ft desirable, 7.5-ft minimum width stabilized shoulder is on the right side. If the existing pavement is more than 16 ft in width, that portion of the existing pavement over 16 ft should be considered as part of the shoulders. For a new facility, see Section 48-5.0 and the INDOT Standard Drawings. 49-3.06 Bridge Pier and Spillslope 49-3.06(01) New-Construction Project The following provides the criteria for bridge-pier or spillslope clearance for a new-construction project:
2012
29
1. Divided Highway. The spillslope clearance should be equal to the clear-zone width of the
approach roadway. 2. Vertical Clearance. After establishing the clear-zone width beneath an overhead structure,
the critical vertical clearance must be determined. A critical vertical clearance of 14 ft should be provided at the edge of the clear zone. The slope between the edge of shoulder and the edge of clear zone should not be steeper than 6:1. If the slope is steeper than 6:1, it should be flattened to 6:1 to provide a greater vertical clearance. See the following examples.
a. Example 1. A county road crosses over a tangent freeway having a design speed of
70 mph and a design-year projected AADT of 7500. From Figure 49-2A, Clear-Zone Width for New Construction or Reconstruction, the minimum clear-zone width to the face of pier or toe of the 2:1 spillslope, assuming a 6:1 approach fill slope, is 35 ft. See Figure 49-3K, Bridge Pier or Spillslope Clearance, New Construction, illustration (A). To maintain a minimum 14-ft vertical clearance at the outer edge of the clear zone, the maximum permissible upward slope beyond the shoulder is 8:1 (cut section).
b. Example 2. A county road crosses over a superelevated roadway having a design
speed of 60 mph, a design-year projected AADT of 1200, and a horizontal curve with a 1500-ft radius. To hold the 14-ft minimum vertical clearance at the outer edge of the clear zone, the maximum permissible slope beyond the shoulder line is 6:1 (upward) and 10:1 (upward) on the high side. See Figure 49-3K, illustration (B).
Basic clear-zone width of approach roadway: low side, 6:1 fill = 25 ft (Figure 49-2A) Basic clear-zone width of approach roadway: high side, 6:1 fill = 25 ft (Figure 49-2A) Horizontal-curve correction factor = 1.4 (Figure 49-2B) Horizontal clearance to pier or toe of 2:1 spillslope (low side) = 25 ft Horizontal clearance to pier or toe of 2:1 spillslope (high side) = 25 ft x 1.4 = 35 ft
The curve correction factor is applied only to the outside (high side) of a horizontal curve.
2. Shoulder-Pier Clearance. The use of a shoulder pier should be avoided if possible.
However, if it is considered necessary, it should be placed as far from the edge of the
2012
30
traveled way as practical and shielded as described in Section 49-5.04, if located within the clear zone.
3. Median Pier. A median pier should be shielded in accordance with the INDOT
Standard Drawings. 49-3.06(02) Reconstruction Project If a pier or a bridge-cone spillslope is within the clear zone, the following procedures apply. 1. Slopewall Set Back 30 ft from Edge of Travel Lane. Establish the elevation of the bottom
of the slopewall. Below this elevation, the upstream bridge cone should be graded at a downward slope equal to the slope below the concrete slopewall to the intersection with the natural ground. This slope should be constructed between the edge of the asphalt paved apron and as close as practical to the right-of-way line. The built-up slope should be transitioned to the existing ground near the right-of-way line at a 4:1 or flatter slope. See Section 49-3.04 for drainage-structure end-treatment requirements.
The area between the end of the slopewall, and bounded by the edge of the paved shoulder
and the base of slopewall, should be paved. At the downstream end of the paved apron, the new embankment should be graded at a 6:1 downward slope to approach the existing ground. Typical details are provided in Figure 49-3L, Treatment at Existing Bridge Cone, Slopewall ≥ 30 ft from Travel Lane.
2. Slopewall Set Back Less Than 30 ft from Edge of Travel Lane. A spillslope located less
than 30 ft from the travel lane should be graded in accordance with Figure 49-3M, Treatment at Existing Bridge Cone, 10 ft ≤ Slopewall < 30 ft from Travel Lane. The upstream bridge cone should be graded at a downward slope to intersect the natural ground. This slope should be constructed between the edge of slopewall and as close as practical to the right-of-way line; see Figure 49-3M. The built-up slope should be transitioned to the existing ground at a 4:1 or flatter slope. See Section 49-3.04 for culvert end-treatment requirements. At the downstream end, the embankment should be graded at a 6:1 downward slope to meet the existing ground.
49-3.06(03) Longitudinal Side-Slope Transition
If it is necessary to transition a side slope, the transition should be made such that the maximum
longitudinal slope (with regard to the grade line) along the roadside does not does not taper at less
2012
31
than 30:1. The 30:1 taper should be based on the sideslope elevation differences at the edge of each
respective clear zone. For example, a transition may be needed from a 6:1 fill slope to a 6:1 cut slope at a bridge overpass. This should be accomplished over a distance calculated as follows: 1. Given: Design Speed = 70 mph, Design-Year AADT = 7500. 2. Distance to shoulder slope break = 11 ft from edge of traveled way 3. Elevation differential from slope break for 6:1 fill slope at 35 ft is as follows:
341135
ft = 6
-
4. Elevation differential from slope break for 6:1 cut slope at 35 ft is as follows:
441135
ft = 6
-
5. Change in elevation along roadside at clear zone limits = 4 ft + 4 ft = 8 ft. 6. Transition distance at 30:1 longitudinal slope = 8 x 30 = 240 ft. Therefore, the transition from the 6:1 fill slope to the 6:1 cut slope should occur over approximately a 240-ft distance along the roadway. 49-3.07 Signing, Lighting, or Signalization The following provides the roadside-safety criteria for a sign support, or lighting or signal pole within the clear zone. 1. Exit Sign in Gore Area. An exit gore sign should be placed in each gore area, though
outside the paved portion of the gore, on an expressway or freeway as shown on Figure 49-3 O, Gore-Area Treatment.
2. Breakaway Supports. The stub of a breakaway sign or lighting support, or substantial
remains of a barrier end-treatment post, which are intended to remain after the unit has been struck, should have a maximum projection of 4 in. See Figure 49-3P, Breakaway Support
2012
32
Stub Clearance Diagram, or Figure 49-3Q, Light-Standard Treatment, Fill Slope 4:1 or Steeper.
3. Ground-Mounted Sign. Supports for a ground-mounted sign should be breakaway or
yielding, except those behind an adequate length of barrier to protect an errant motorist from the sign support, or those within a sidewalk. New sign supports behind a barrier should have adequate clearance from the back of the barrier post to provide for the barrier’s dynamic deflection; see Section 49-4.01(03).
4. Lighting. A conventional light standard should be breakaway except that within a sidewalk.
A breakaway light standard (except that shielded by a barrier) should not be placed where the opportunity exists for it to be struck more than 9 in. above the normal point of vehicular bumper impact. Normal bumper height is 1.5 ft. To avoid a light standard being struck at an improper height, it should be placed, and the area around it graded, as follows:
a. Fill Slope Flatter than 6:1. There are no restrictions on location, nor is special
grading required. A light standard should be placed 20 ft from the edge of the travel lane or 10 ft from the edge of shoulder.
b. Fill Slope of 5:1 or 6:1. Follow the grading plans shown in the INDOT Standard
Drawings. A light standard should be placed 20 ft from the edge of the travel lane or 10 ft from the edge of shoulder.
c. Fill Slope of 4:1 or Steeper. A light standard should be offset 3 ft from the edge of
shoulder or 12 ft from the edge of the travel lane, whichever is greater. Grading should be provided as shown in Figure 49-3Q.
d. Cut Slope. Follow the grading plans shown in the INDOT Standard Drawings.
An existing breakaway light standard should be evaluated to determine if it is necessary to relocate it, re-grade around its base, or upgrade the breakaway mechanism to current AASHTO standards. The determination of the extent of work necessary for treatment of an existing breakaway light standard involves a review of a number of variables. Therefore, this determination must be made by the Highway Management Design Division’s Office of Traffic Review. If Federal-aid funds will be used for construction and the project is on the National Highway System and is not exempt from FHWA oversight, the FHWA should also be consulted.
2012
33
5. High-Mast Lighting. High-mast lighting should be placed to provide a desirable clear-zone width of 80 ft. The minimum clear-zone width will be the roadway clear-zone width through the area where the high-mast lighting is located.
6. Traffic Signal. A traffic-signal support for a new-construction or reconstruction project
should be placed to provide the roadway clear zone through the area where the traffic-signal support is located. However, the following exceptions will apply:
a. Channelizing Island. Installation of a signal support in a channelizing island should
be avoided. However, if a signal support must be located in a channelizing island, a minimum clearance of 30 ft should be provided from all travel lanes (including turn lanes) in a rural area. Such minimum clearance should be provided in an urban area where the posted speed limit is 50 mph or higher. In an urban area where the island is bordered by barrier curb and the posted speed limit is 45 mph or lower, a minimum clearance of 10 ft should be provided from all travel lanes including turn lanes.
b. Non-Curbed Facility, Posted Speed Limit ≥ 50 mph or AADT > 1500. Where
conflicts exist such that the placement of a signal support outside of the clear zone is impractical (e.g., conflicts with buried or utility cables), the signal support should be located at least 10 ft beyond the outside edge of the shoulder.
c. Non-Curbed Facility, Posted Speed Limit ≤ 45 mph or AADT ≤ 1500. Where
conflicts exist such that the placement of a signal support outside of the clear zone is impractical (e.g., conflicts with buried or utility cables), the signal support should be located at least 6.5 ft beyond the outside edge of the shoulder.
7. Large Sign. A large sign of over 50 ft2 in area on slipbase breakaway supports should not be
placed where the opportunity exists for it to be struck more than 9 in above the normal point of vehicular bumper impact. Normal bumper height is 1.5 ft. To avoid such a sign being struck at an improper height, it should be placed as follows:
a. Fill Slope 5:1 or Flatter. The sign should be located a minimum of 30 ft from the
edge of the travel lane to the nearest edge of the sign. b. Fill Slope of 4:1 or Steeper. The nearest sign edge should be located 6 ft from the
edge of shoulder or 12 ft from the edge of the travel lane, whichever is greater. 8. Roadside Appurtenances. Roadside appurtenances such as a large breakaway sign or
lighting support should not be located in or near the flow line of a ditch. If these supports
2012
34
are placed on a backslope, they should be offset at least 10 ft up the slope from the bottom of the ditch.
Roadway signing and lighting plans for a project are often prepared separately by different INDOT designers or consultants. Therefore it is possible that guardrail, guardrail end treatments, impact attenuators, light standards, or breakaway overhead sign supports within the clear zone may have been located too close to one another and are therefore clustered at one location. An errant vehicle may have multiple impacts due to this clustering of such devices. The multiple impacts may cause higher G forces than those recommended in National Cooperative Highway Research Program Report 350 (NCHRP 350), thus creating a hazardous condition for the occupants of the impacting vehicle. Where the devices are clustered, they should be separated and relocated as far from one another as conditions permit to avoid the possibility of multiple impacts to them while ensuring that each system performs properly. For example, guardrail and end treatments may be relocated by extending each guardrail run beyond its length of need and then attaching the end treatment to the guardrail. The project manager should coordinate the review of all separately-developed sets of plans with the designer of the mother project and the reviewer before the final design stage. 49-3.08 Miscellaneous Grading Considerations to be made regarding grading are as follows: 1. Gore Area. A gore area should be graded with a slope of not steeper than 10:1 parallel to
the roadway. 2. Median Cross Slope. For a reconstruction project, the median cross slope should be 4:1 at
steepest, but desirably 6:1 or flatter. For a median cross slope on a new facility, see the INDOT Standard Drawings.
3. Shoulder Wedge. On a reconstruction project, a wedge on the outside and inside shoulders
should be constructed as shown on Figure 49-3R, Shoulder Wedges. 4. Rock Cut. As indicated in Section 49-3.01(02), a rough rock cut located within the clear
zone may be considered a roadside hazard. The following will apply to its treatment.
a. Hazard Identification. There is no precise method to determine whether or not a
2012
35
rock cut is sufficiently ragged to be considered a roadside hazard. This will be a judgment decision based on each evaluation.
b. Debris. A roadside hazard may be identified based on known or potential
occurrences of rock debris encroaching onto the roadway. c. Barrier Warrant. If the rock cut or rock debris is within the clear zone, a barrier may
be warranted. 49-4.0 ROADSIDE-BARRIER LATERAL OFFSET AND LONGITUDINAL EXTENT A roadside barrier should be placed to protect an errant vehicle from an obstacle which is within the clear zone and cannot be removed, or where described in Section 49-3.0. 49-4.01 Lateral Placement 49-4.01(01) Barrier Offset Some of the factors to consider in the lateral placement of a roadside barrier include the following: 1. clearance between barrier and hazard being shielded to allow for deflection of the barrier; 2. effects of terrain between the edge of the traveled way and the barrier on an errant vehicle’s
trajectory; 3. probability of impact with barrier as a function of its distance off the traveled way; 4. flare rate and length of need of transitions and approach barriers; and 5. the need to offset a barrier from the edge of shoulder so that the full shoulder width can be
used. For new construction, the desirable offset is 2 ft from the effective usable-shoulder width. The minimum offset is 1 ft from the effective usable-shoulder width. For a reconstruction project, the desirable offset is 2 ft from the effective usable-shoulder width. The minimum offset is 0 ft from the effective usable-shoulder width. However, if the design-year AADT exceeds 100,000, the offset should be 2 ft from the effective usable-shoulder width.
2012
36
A roadside barrier should be placed as far from the traveled way as conditions permit, thereby minimizing the probability of impact with the barrier. The barrier should be placed beyond the shy line offset; see Section 49-4.02(01). The practicality of offsetting the barrier more than 2 ft beyond the edge of the required shoulder width should be evaluated. This assessment must include a comparison of the additional costs of all work such as benching, borrow, or grading needed to construct the flat slopes required to install barrier on the embankment, against the reduced cost of installation and maintenance of the lesser amount of barrier which will be required by locating it farther from the roadway. This assessment should also consider the location’s accident history and the area’s maintenance records regarding the repair of nuisance impacts. 49-4.01(02) Shoulder Section On an INDOT route, the outside shoulder should be paved to the face of the barrier if such face is located 14 ft or less from the edge of the travel lane. On a local-public-agency route, the shoulder section at the barrier location may be designed as follows. 1. Where the face of the barrier is less than 2 ft from the outside edge of the paved shoulder,
the shoulder should be paved to the face of the barrier. 2. Where the face of the barrier is 2 ft or more from the outside edge of the paved shoulder, the
width of the paved shoulder may remain the same as in the sections without a barrier. 49-4.01(03) Barrier Deflection If the width between the front face of a barrier in its correct location and the front face of an isolated hazard is less than the dynamic deflection width shown in Figure 49-4A, Barrier Deflections, the barrier’s post spacing should be reduced to obtain a dynamic deflection width that is less than the width between the front face of the barrier in its correct location and the front face of the isolated hazard. If this is not practical, either the hazard or the barrier should be moved to provide adequate deflection width. A concrete barrier does not deflect. The deflection widths for nonstandard guardrail type B are provided so that an existing installation can be analyzed to determine whether or not the existing deflection width is sufficient.
2012
37
49-4.01(04) Shoulder- or Embankment-Slope Shielding Limits The adjacent shoulder slope or embankment slope in front of a semi-rigid roadside barrier should desirably be 10:1 or flatter. Where site conditions dictate, a steeper such slope, though not steeper than 6:1, may be provided. 49-4.01(05) Barrier at Curb A curb in front of a barrier may cause an errant vehicle to vault over, break through, or impact the barrier. However, there has been little research on which to recommend curb geometry or placement in the vicinity of a barrier. For this reason, the best practice is to avoid using a curb in the vicinity of a barrier. If a curb is essential for drainage, its effect can be minimized by using a maximum curb height of 4 in. and placing it so that the face of the curb is at or behind the face of the barrier. In an urban situation, the barrier-curb combination should be offset at least the shy-line distance from the edge of the travel lane. This offset may either be continuous (curb with or without barrier) or variable as shown in Figure 49-4B, Barrier Placement at Curb. A continuous offset should be used if there are numerous separate runs of barrier along a curb to provide a uniform curb-line offset. Where a barrier is to be installed in the vicinity of an existing curb, the curb should be removed unless the barrier can be placed as discussed above. 49-4.01(06) Lateral Placement for Large Drainage Structure on New Alignment, Excluding 3R Project A large drainage structure is defined as that with a clear span of at least 66 in., as measured parallel to the roadway centerline, or a three-sided structure. It is desirable to perpetuate as much of the clear zone as practical through a structure location. Where sufficient right-of-way will be acquired to provide the required clear-zone width, a barrier system described in Section 49-5.05 may be installed near the clear-zone limits. This is to shield the structure ends which are located within the clear zone, thus maintaining most of the clear zone required over the structure. However, where such barrier system is utilized near the edge of the clear zone, it should not be connected to another existing or proposed barrier that is located nearer to the pavement.
2012
38
49-4.01(07) Lateral Placement for Large Drainage Structure on Existing Alignment, or 3R Project on New Alignment Right-of-way may not be sufficient to perpetuate the clear-zone width through the structure location. The barrier should be installed at an offset of up to 2 ft from the edge of shoulder. 49-4.02 Barrier Length of Need Figure 49-4C, Barrier Length of Need, illustrates the total length of need of a barrier, which is based on the equation as follows: LTOT = LADV + LHAZ + LOPP [Equation 49-4.1]
Where: LADV = The length of need in advance of the hazard LHAZ = The length of the hazard itself LOPP = The length of the trailing end or length needed to protect traffic in opposing
lanes. 49-4.02(01) Length of Need in Advance of Hazard for Adjacent Traffic [Rev. Sept. 2011] Figure 49-4D, Barrier Length of Need in Advance of Hazard, illustrates the variables in the layout of an approach barrier to shield an area of concern for adjacent traffic. A roadside barrier should be installed parallel to the roadway. However, a flared installation may be appropriate where the barrier’s end is buried in the backslope. Figure 49-4E, Design Elements for Barrier Length of Need, shows the runout length, LR, and shy line offset, LS, as a function of design year AADT and design speed. Figure 49-4F, Barrier Flare Rates, provides the flare rate, a:b, relative to the shy line. The shy line offset is defined as the distance beyond which a roadside obstacle will not be perceived as a threat by a driver. The barrier should be placed beyond the shy line offset. For a 3R project, it should be placed as described in Section 55-5.04(02). The following procedures are used to determine the barrier length of need. 1. Graphical Solution, Tangent or Inside Horizontal Curve. One method of determining the
length of need is to scale the barrier layout directly on the plan sheets as shown on Figure 49-4G, Barrier Layout, Bridge Approach. First, the runout length, LR, is selected from
2012
39
Figure 49-4E. Then, the lateral distance to be protected is determined by calculating the clear-zone width, LC, and comparing it to the lateral distance from the edge of travel lane to the outside edge of the hazard, LH. The lesser of LC or LH is used to calculate the length of need, though a wider area may be chosen to be protected. Next, the runout length, LR, and the lateral distance to be protected are scaled on the drawing along the edge of the travel lane, and a line is drawn between the lateral point farthest from the edge of the travel lane and the end of the runout length farthest from the hazard. This line simulates the vehicular runout path. To shield the hazard, the barrier installation must intersect this line. The barrier may be either flared or parallel to the roadway as dictated by site conditions.
2. Graphical Solution, Outside Horizontal Curve. For a length-of-need determination for the
outside of a horizontal curve, the graphical solution should be used. The barrier length of need is determined by scaling its intercept with the tangential runout path of an encroaching vehicle rather than using the approach runout length, LR. This is illustrated in Figure 49-4H, Barrier Layout, Fixed Object on Horizontal Curve. However, if the runout length measured along the edge of the driving lane is shorter than the distance to the tangential runout path intercept, the shorter distance should be used.
3. Mathematical Solution, Tangent Section Only. The required length of need may be
calculated using the formulas as follows: 1 For a flared barrier installation:
R
H
21H
L
L +
a
b
L - )L(a
b + L
= X [Equation 49-4.2]
(X) )L(
)L( - L = Y
R
HH [Equation 49-4.3]
For a parallel barrier installation:
)L(
)L - L( L = XH
2HR [Equation 49-4.4]
2012
40
Where: X = length of need in advance of the hazard Y = lateral offset to beginning of length of need on a flared barrier
installation Other variables are defined in Figure 49-4D, Barrier Length of Need in Advance of Hazard.
4. Minimum Length of Barrier. The minimum guardrail length required in advance of a
hazard should be as shown in Figure 49-4E(1). 5. Guardrail Configuration at Approach to Bridge or Support. See the following figures to
determine the guardrail configuration and minimum pay length for each situation listed below.
49-4E(2) Guardrail Configuration for Outside-Shoulder Approach to Bridge 49-4E(3) Guardrail Configuration for Median-Shoulder Approach to Bridge 49-4E(4) Guardrail Configuration for Bridge Support Inside Clear Zone, Two-Way Roadway, Single Overhead Structure 49-4E(5) Guardrail Configuration for Bridge Support Inside Clear Zone, Two-Way Roadway, Twin Overhead Structures 49-4E(6) Guardrail Configuration for Bridge Support Inside Clear Zone, One-Way Roadway, Single Overhead Structure, Outside Shoulder 49-4E(7) Guardrail Configuration for Bridge Support Inside Clear Zone, One-Way Roadway, Twin Overhead Structure, Outside Shoulder 49-4E(8) Guardrail Configuration for Bridge Support Inside Clear Zone, One-Way Roadway, Single Overhead Structures, Median Shoulder 49-4E(9) Guardrail Configuration for Bridge Support Inside Clear Zone, One-Way Roadway, Twin Overhead Structures, Median Shoulder 49-4E(10) Guardrail Pay Length for Approach to Bridge Support The LET portion of a guardrail end treatment type OS or MS, shown on Figures 49-4E(2) through 49-4E(9), should be considered as part of the guardrail length of need as described in Section 49-8.01(04) item 2. 49-4.02(02) Length of Need for Opposing Traffic Figure 49-4 I, Barrier Length Beyond Hazard, 2-Lane Roadway, illustrates the layout variables of an approach barrier for opposing traffic. The length of need and the end of the barrier are determined in the same manner as for adjacent traffic, but all lateral dimensions are measured from
2012
41
the edge of the travel lane of the opposing traffic (e.g., from the centerline for a 2-lane roadway). For a 2-way divided roadway, the edge of the travel lane for the opposing traffic should be the edge of the driving lane on the median side. If a barrier is necessary to protect traffic in the opposing lanes, the minimum length of need is determined as follows: 1. If the design speed is 50 mph or higher, the required length in advance of the hazard for
opposing traffic will be the greater of the calculated length or 100 ft. 2. If the design speed is 45 mph or lower, the required length of guardrail in advance of the
hazard for opposing traffic will be the greater of the calculated length or 50 ft. There are three ranges of clear-zone width, LC, to be considered for an approach barrier for opposing traffic. In analyzing these situations, the type of treatment should be determined for a barrier or hazard where the barrier or hazard is just outside the clear zone. These ranges are as follows: 1. If the barrier is beyond the appropriate clear zone, no additional barrier is required.
However, a crashworthy end treatment should be considered based upon AADT, distance outside the clear zone, and roadway geometrics.
2. If the barrier is within the appropriate clear zone but the hazard is beyond it, no additional
barrier is required, but a crashworthy end treatment should be used. 3. If the hazard extends well beyond the appropriate clear zone (e.g., a river), the designer may
choose to shield only that portion which lies within the clear zone, by setting LH equal to LC. 49-4.02(03) Length of Need Beyond Hazard for Divided Highway
Figure 49-4J, Barrier Length Beyond Hazard, Divided Highway, illustrates the procedure for
determining the length of need beyond the hazard on a divided highway. A gap of less than approximately 200 ft between barrier installations should be avoided, particularly if the cost of the additional barrier is about the same as the cost to install two separate end treatments, and access behind the barrier for maintenance or other purposes is not required. See the AASHTO Roadside Design Guide.
2012
42
** PRACTICE POINTER **
Barrier limits should be shown on the
Plan and Profile sheets and in the Guardrail Table.
49-4.02(04) Length of Need at Outside-Shoulder Bridge Support [Rev. Sept. 2011] Pier-protection barrier length for the right shoulder of a divided highway, or for both shoulders of a 2-lane, 2-way highway are based on the clear zone and the lateral location of the pier end relative to the clear zone. Depending on the lateral locations of the pier and the barrier, the barrier should either be fastened to the end of the pier or placed in front of the pier. The location and attachment is discussed below. The additional barrier length required to protect another hazard in the area of the structure, such as a slopewall, bridge cone, or drainage structure under the slopewall, is computed separately. If the conditions described below require calculations to determine the pier-protection barrier length, the calculation should consider all hazards adjacent to the pier end. These requirements apply to a pier for a single overhead structure, or twin (side-by-side) overhead structures spanning a 2-lane, 2-way roadway or divided highway, or tandem (end-to-end) overhead structures spanning a divided highway. The required length of pier-protection barrier is determined in accordance with the following: 1. Support Located ≤ 16 ft from Edge of Travel Lane. The support-shielding barrier is to be
attached to the upstream traffic end of the support. The minimum required barrier length is shown in Figure 49-4E(1), Minimum Guardrail Length Required in Advance of Hazard.
The length of need should be calculated using the equations shown in Section 49-4.02 and
the clear-zone values from Figure 49-2A, Clear-Zone Width for New Construction or Reconstruction. The calculated length should be rounded up to the nearer whole multiple of 6.25 ft.
If the support end is located inside the clear zone and the design speed ≥ 50 mph, the
amount of barrier required should be the greater of the calculated rounded length or 100 ft.
2012
43
If the support end is located inside the clear zone and the design speed ≤ 45 mph, the amount of barrier required should be the greater of the calculated rounded length or 50 ft.
2. Support Located > 16 ft from the Edge of Travel Lane. The barrier length required in
advance of the support is determined in the same manner as that required for each extended hazard along the roadway. The support-protection barrier should be located between the support and the edge of travel lane and as far away from the edge of travel lane as feasible.
The lateral extent of the support foundation will dictate how close the barrier’s posts can be
driven to the support face. The barrier should be located such that the clearances from its face to the support face ≥ 4.25 ft and the clearance from its face to the pavement side edge of the support foundation ≥ 1.75 ft. These clearances are needed to permit the barrier to deflect upon impact without impacting either the support face or the foundation and to permit the driving of the post. If the clearance from the barrier face to the support face < 4.25 ft, the post spacing must be reduced in accordance with Figure 49-4A, Barrier Deflections. If the clearance from the barrier face to the support face < 2.75 ft, or the clearance from the barrier face to the pavement-side edge of the support foundation < 1.75 ft, the barrier should be installed in accordance with Item 1.
The required barrier length is shown in Figure 49-4K, Length-of-Need Requirement for Support Protection, and is described in Item 1 above. The barrier length along the face of the outside shoulder support or frame bent on a divided roadway should be sufficient to continuously cover the full length of the support plus 25 ft. For twin (in-line) supports, this length should also include the gap between the supports. 49-4.03 Example Length-of-Need Calculations
* * * * * * * * * * Example 49-4.1 Given: Divided-highway structure over stream Design speed = 65 mph AADT = 7000 Foreslope = 4:1 Problem: Determine the length of the barrier needed on the shoulder side for the approaching
end of the structure.
2012
44
Solution: See Figure 49-4L, Barrier Length of Need, Structure-Approach Example 49-4.1 1. From Figure 49-3A, Transverse Slopes, determine clear-zone width, CZ = 46 ft. 2. From Figure 49-4E, Design Elements for Barrier Length of Need, determine runout length,
LR = 460 ft. 3. To find the point of CZ, first determine the hazard. In this situation, it is the stream. An
errant vehicle must be protected from it. 4. To establish the point of CZ, first determine if the clear zone extends outside the right of
way. If it does, the right-of-way line becomes the point of CZ, and where it crosses the top of the bank of the stream it becomes the point of CZ.
5. From the point of CZ, draw a line perpendicular to the edge of the travel lane and call this
point EP. 6. From point EP, scale off distance LR along the travel lane edge and call this point ER. 7. From point ER, to the point of CZ, draw a line. 8. Draw a line along the face of barrier parallel to the centerline from the bridge railing to
where it crosses the line between ER and the point of CZ. This is the barrier length of need for this particular bridge approach.
* * * * * * * *
Example 49-4.2 Given: 2-lane highway with high fill Design speed = 60 mph AADT = 7000 Right shoulder width = 10 ft Slope in high fill area = 2.5:1 Slope at toe of fill = flat Tangent Level Conditions Problem: Determine the length of barrier needed to protect the fill slope.
2012
45
Solution: See Figure 49-4M, Barrier Length of Need, Fill-Slope Example 49-4.2
1. Determine clear-zone width, CZ, from Figure 49-2A. CZ = 30 ft based on flat slope at toe of
fill. Therefore, adjusted CZ = 30 - 10 shoulder; or 20 ft at toe of slope.
2. Determine runout length from Figure 49-4E; LR = 425 ft.
3. From Figure 49-3B(60), Barrier Warrant for Embankment, 2-lane, 2-Way Roadway, 60
mph, determine the location where the barrier should start. Interpolating between the 6000
AADT and the 12,000 AADT lines, the fill height = 8.9 ft.
4. At the point where the fill is 8.9 ft high, scale the LR distance to point ER.
5. From point ER to point of CZ, draw a line.
6. Draw a line along the face of barrier parallel to centerline from the point where the fill
height is 8.9 ft to where it crosses the line, between ER and the point of CZ. This is the
length of need required to shield the driver from the fill height.
8. The trailing end of a barrier run is determined in a similar manner, however, CZ is measured
from the near edge of the opposing travel lane; see Section 49-4.02(02).
* * * * * * * *
Example 49-4.3
Given: Divided highway with large box culvert within clear zone that cannot be extended
(under fill).
Design speed = 65 mph
AADT = 7000
Foreslope = 5:1
Problem: Determine the length of barrier needed to protect the driver from the culvert end.
Solution: See Figure 49-4N, Barrier Length of Need, Box-Culvert Example 49-4.3
1. Determine clear-zone width from Figure 49-2A; CZ = 38 ft.
2. Determine runout length from Figure 49-4E; LR = 475 ft.
2012
46
3. Using the end of the wing on the approaching-traffic side of the box culvert, draw a line
perpendicular to the edge of the travel lane from the point of CZ through the end of the wing
to the edge of the travel lane and call this point EP.
4. From point EP, scale along the travel lane the distance LR and call this point ER.
5. From point ER to point of CZ, draw a line.
6. Draw a line along the face of barrier parallel to centerline from point EP to where it crosses
the line, between ER and the point of CZ. This is the length of need on the approaching-
traffic side.
7. The trailing end of a barrier run for the protection of the box culvert should be extended far
enough to protect an errant vehicle from any hazard (for this example, a paved side ditch
type F) when leaving the roadway at a 25-deg angle and missing the end of the barrier.
Once this point has been established, add an additional 50 ft to establish the strength of the
guardrail run.
* * * * * * * * * *
49-5.0 ROADSIDE-BARRIER APPLICATIONS
The basic parameter for roadside-barrier selection is the National Cooperative Highway Research
Program Report 350 (NCHRP 350) Test Level (TL) required at the site. This is a function of the
following:
1. highway design speed;
2. adjusted construction-year traffic volume;
3. barrier offset;
4. highway geometry (grades, horizontal curvature);
5. height of bridge deck where applicable; and
6. type of land use below bridge deck, where applicable.
This Section provides the detailed methodology for determining the Test Level selection for each
roadside barrier type. The methodology has been adapted from the AASHTO publication Guide
Specifications for Bridge Railings. The Guide Specifications methodology is based on a benefit-
cost analysis which considers occupant safety, vehicular types, highway conditions, and costs. The
overall objective is to match each barrier’s Test Level (and therefore costs) to site needs. Because
2012
47
of the similarities between the potential safety hazards from penetrating a roadside barrier, INDOT
also applies this methodology to the Test Level selection for a median or shoulder barrier.
The NCHRP 350 Test Levels for roadside barriers used by the Department are described by the
crash-test criteria shown in Figure 49-5A, NCHRP 350 Test-Level Crash-Test Criteria. Passage of
a given crash test consists of a 75-ft length of a given device’s ability to contain and redirect the test
vehicle such that, after impact and stopping, the vehicle has remained upright and is pointing in its
original direction in its original traffic lane.
A roadside barrier used on an INDOT-maintained route should be at minimum TL-3. A TL-4 or
TL-5 barrier should be used where warranted as described below.
49-5.01 Roadside-Barrier Types
The specific types of roadside barriers for each Test Level are described below. Figure 49-4A,
Barrier Deflections, provides the deflection distances for these barriers based on post spacing. The
desired distance from the face of a roadside barrier to the shoulder breakpoint is 3 ft (1’-5‖ of barrier
width plus 1’-7‖ behind it). In a restricted condition, this may be reduced to 1.5 ft.
49-5.01(01) TL-3 Barriers
1. W-Beam Guardrail with Posts Spaced at 6’-3‖. This barrier is used where the clearance
between the guardrail face and the fixed object being shielded is 4.25 ft or greater.
2. W-Beam Guardrail with Posts Spaced at 3’-1½‖. This barrier is used where the clearance
between the guardrail face and the fixed object being shielded is at least 3.25 ft but less than
4.25 ft.
3. W-Beam Guardrail with Posts Spaced at 1’-6¾‖. This barrier is used where the clearance
between the guardrail face and the fixed object being shielded is at least 2.75 ft but less than
3.25 ft.
4. Nested W-Beam Guardrail. This configuration is used at a large drainage structure as
described in Section 49-5.06. Nested guardrail at the post spacing listed above is also a TL-
3 barrier.
2012
48
5. Double-Faced W-Beam Guardrail with Posts Spaced at 6’-3‖. This barrier is used on a
divided roadway as a median-side bridge-approach guardrail to one of the bridge structures
in a set of twins.
6. High-Tension Cable-Barrier System (CBS). A CBS is a flexible median barrier with a
larger lateral deflection during a vehicle impact than a semi-flexible barrier such as a
double-faced W-beam or thrie-beam guardrail. A TL-3 CBS, if warranted, should be
specified for a non-Interstate route. Design criteria are provided in Section 49-5.01(04).
49-5.01(02) TL-4 Barriers
1. Concrete Barrier, Shape F, Common Height. This barrier should be considered on the
roadside to shield a rigid object where no deflection distance is available.
This barrier is used on an urban freeway where a barrier is required. If a rigid object is not
continuous (e.g., bridge support), a half-section barrier may be used. To provide the
necessary lateral support, backfill should be provided behind the half-section barrier, or the
barrier should be tied to a concrete surface with reinforcing steel at its base. If this is not
practical, a full-section barrier should be used.
2. Thrie-Beam Guardrail with Posts Spaced at 6’-3‖. If a deflection distance of at least 3 ft is
available, this barrier should be considered in one of the following situations.
a. New Facility, Location within the Limits of a Horizontal Curve with a Radius of
1435 ft or Less. The conditions which must be satisfied are as follows:
(1) a barrier is warranted;
(2) design speed is 50 mph or higher; and
(3) design-year AADT is equal to or greater than 10,000.
b. New Facility, Location on Horizontal Curve with Radius of Greater Than 1435 ft
or on Tangent Roadway. The conditions which must be satisfied are as follows:
(1) a barrier is warranted; and
(2) design-year AADT is equal to or greater than 100,000.
c. 3R or 4R Project, Location within the Limits of a Horizontal Curve with a Radius
of 1435 ft or Less. The conditions which must be satisfied are as follows:
2012
49
(1) guardrail is in place and must be moved transversely to accommodate
lanes or shoulders widened to 3R or 4R standards or horizontal curve
improved to 3R or 4R standards, and such guardrail is still warranted;
(2) design speed is 50 mph or higher; and
(3) design-year AADT is equal to or greater than 10,000.
d. 3R or 4R Project, Location on Horizontal Curve with Radius of Greater Than
1435 ft or on Tangent Roadway. The conditions which must be satisfied are as
follows:
(1) guardrail is in place and must be moved transversely to accommodate
lanes or shoulders widened to 3R or 4R standards or horizontal curve
improved to 3R or 4R standards, and such guardrail is still warranted; and
(2) design-year AADT is equal to or greater than 100,000.
e. Partial 3R Project. The conditions which must be satisfied are as follows:
(1) guardrail is currently in place;
(2) guardrail is still warranted; and
(3) a run of guardrail has been damaged, or gets impacted, on average, two or
more times per year.
Guardrail impacts should be determined from the reported accident data (for the
most recent available 3-year period) provided by the Planning Division’s Office
of Roadway Safety and Mobility. This information may be unavailable or may
not indicate an average of at least two impacts per year. If so, the appropriate
operations or maintenance personnel should be contacted for information which
may reveal a history of an average of two or more impacts per year.
Each existing guardrail run of 300 ft or shorter which has been damaged, or gets
impacted, on average, twice per year should be replaced with thrie-beam
guardrail. An undamaged portion of at least 500 ft or longer of an existing W-
beam run should be left in place. An undamaged portion of an existing W-beam
run of less than 500 ft between high-impact areas should be replaced with thrie-
beam guardrail.
f. Large Cross-Drainage Structure. Nested thrie-beam guardrail should be used at a
large cross-drainage structure where nested guardrail is required, but a TL-4
device is warranted. Details for such thrie-beam configuration have not yet been
developed as INDOT Standard Drawings.
2012
50
Thrie-beam guardrail should be used instead of W-beam guardrail where a curb and
sidewalk approach a bridge railing.
Thrie-beam guardrail should not be used for approaching a curved guardrail end
treatment at a drive radius.
3. High-Tension Cable-Barrier System (CBS). This is the same type of system as described
in Section 49-5.01(01) item 6. A TL-4 CBS, if warranted, should be specified for an
Interstate route. Design criteria are provided in Section 49-5.01(04).
49-5.01(03) TL-5 Barrier
The only TL-5 barrier used by the Department is the concrete barrier, shape F, truck height. This
barrier may be used on the approach to a bridge, where warranted, to contain a large truck which
can depart from the roadway, resulting in a high risk of loss of life or severe injury to a
pedestrian or a person in a vehicle on a crossroad or a parallel road.
The TL-5 barrier should be used on the approach to a bridge where all of the following conditions
exist.
1. The warrants for a TL-5 concrete bridge railing have been satisfied. See Section 61-6.01.
2. The mainline or ramp has a radius of 1435 ft or less.
3. The design-year AADT of the crossroad or parallel roadway below, which is within 120 ft
of the edge of the overhead travel lane, is equal or greater than 7,500.
4. The physical characteristics of the roadside are such that an errant truck crashing through a
TL-3 or TL-4 barrier can be expected to reach the crossroad, parallel roadway, or other
high-occupancy land use area below.
For an existing facility, accident data should be obtained and analyzed. If an adverse truck-accident
history is found, consideration should be given to installing the TL-5 barrier if the listed warrants
are not satisfied.
Consideration should also be given to installing a TL-5 concrete barrier on each bridge approach of
a new facility where motorist expectations are violated such as where a steep downgrade or long
tangent section in advance of a curve over a crossroad will be constructed.
2012
51
The length of need for a TL-5 barrier or TL-3 guardrail before and beyond the bridge is determined
from the length-of-need equations for roadside barrier (see Section 49-4.02). The length of the TL-
5 barrier should be based on the barrier length of need or the tangent runout path, whichever is less.
Where a roadside barrier is warranted beyond the TL-5 concrete barrier, the additional barrier
should be TL-3. Where the TL-5 approach barrier is used, it must be tapered down to the common
height. Additional TL-3 guardrail beyond the concrete barrier must include a proper guardrail
transition.
49-5.01(04) High-Tension Cable-Barrier System (CBS) Design Criteria
This positive-protection device should be considered in the median of a high-speed roadway
where fatal median-crossover crashes have been reported or are anticipated.
1. Warrants. The lateral deflection of a CBS is 6.6 ft to 9.2 ft. A CBS may be used in a
median of at least 36 ft width if the barrier is located close to the center of the median. It
should not be located in a ditch bottom or flow line, so as to avoid potential drainage
problems.
See the INDOT Standard Drawings for information on locating a CBS in a median which
includes a bridge support, existing concrete barrier or guardrail, impact attenuator, or
other safety hardware.
2. Advantages.
a. A CBS can be installed in an existing median with a minimum of site work as one
of the most cost-effective choices of median barrier.
The cost of a CBS is almost the same as that of double-faced W-beam guardrail.
Compared to double-faced W-beam guardrail, the repairs to a CBS are relatively
simple, faster, and should not require driving posts or replacing rails.
b. Vehicle containment and redirection are effective over a wide range of vehicle
sizes and installation conditions. Deceleration forces upon vehicle occupants are
low.
c. A vehicle impact results in less damage to the vehicle and barrier, and results in
less injury to vehicle occupants. The cable often remains at the proper height
2012
52
after an impact that damages several posts. A CBS can sustain multiple impacts
and still remain effective.
d. The posts are installed in sleeves in the ground to facilitate removal and
replacement.
e. Its open design does not generate drifting of sand or snow on or alongside the
roadway.
f. Once maintenance crews have developed the skills to rapidly repair a CBS,
maintenance costs can be reduced.
3. Disadvantages.
a. A comparatively long length of CBS is non-functional, and is therefore in need of
repair following a vehicle impact.
b. A large clear area is needed behind the barrier to accommodate the design lateral
deflection distance.
c. A CBS has reduced effectiveness on the inside of a horizontal curve.
d. There is little installation tolerance in obtaining the specified barrier height.
e. Maintenance is often required.
4. Design Considerations.
a. Deflection. A CBS redirects an impacting vehicle after sufficient tension is
developed in the cable, with the posts in the impact area offering only slight
resistance. A deflection distance of 10 ft should be provided. The clearance
between the cable and the opposing traffic’s median edge of travel lane should be
at least 10 ft.
The use of a CBS where it is likely to be impacted frequently, such as on the
outside of a sharp horizontal curve, is not recommended.
b. Slope Requirement. A CBS should not be constructed on a slope steeper than 6:1.
The approach should be relatively flat, without a curb or a ditch.
2012
53
c. Transverse Location in Median. The post offset from the centerline of a median
V ditch should desirably be at least 8 ft, or minimally within 1 ft of the centerline.
The post offset from the edge of a median flat-ditch bottom should desirably be at
least 8 ft or minimally within 1 ft of the ditch line. The post offset from the edge
of paved shoulder should desirably be at least 12 ft to avoid nuisance impacts.
The desirable conditions described above require a minimum median width of 48
to 52 ft for proper placement of a CBS assuming that the paved shoulder and flat-
bottom ditch widths are each 4 ft.
d. Line Post and Anchor Foundations. Each end of a CBS run must be anchored.
The designer should initially prepare a layout plan and request a geotechnical
investigation of soil conditions for approximate locations of the safety terminals
and representative locations of the intermediate line-post foundations. The
geotechnical-investigation findings should be incorporated into the contract
documents. End-anchor and line-post-foundation sizes are determined by soil
classification, condition, temperature extremes, etc.
e. Line-Post-Foundation Size. The foundation for an intermediate line post should
have a minimum depth of 3.5 ft and a minimum diameter of 14 in., with the
foundation top flush with the ground level.
f. CBS Run Length. The recommended minimum run length is 1000 ft. The
recommended maximum run length is 10,000 ft between anchors.
The number of median crossovers for emergency vehicles should correspond to
that required with a concrete or thrie-beam median barrier.
g. Clearance to Rigid Obstacle. The lateral clearance to a rigid obstacle such as a
bridge support, sign support, utility pole, tree, etc., should be 10 ft.
h. Placing CBS in the Vicinity of Another Barrier. If the side slopes are not steeper
than 6:1 and another barrier is parallel to the roadway, the CBS can be tapered on
a 50:1 or flatter taper. The end terminal should be placed behind the other barrier.
A minimum lateral clearance of 10 ft from the end treatment of the parallel barrier
is recommended. If the other barrier is flared, the CBS may be connected to W-
beam or thrie-beam guardrail using an attachment to the guardrail end terminal
that is available from the manufacturer.
i. Placing CBS in Vicinity of Inlet or Dike. If a drainage inlet, dike, etc., is
encountered and cannot be adjusted to the proper grade, the CBS alignment
2012
54
should be gradually transitioned around it to ensure that the correct cable height
above the ground line will be maintained. The horizontal transition should be on
a taper of 50:1 or flatter.
j. CBS at Crossover. For a CBS termination at a median crossover, the CBS end
terminal (end anchor) should be located beyond the tangent points of the
crossover, preferably 3 to 5 ft from the tangent point.
k. Changing Offset of CBS in a Median from Being Closer to One Roadway to
Being Closer to the Opposing-Traffic Roadway. If a CBS requires a change of
lateral offset, the end anchors of the CBS should be overlapped for the minimum
distance between the anchors in each direction as described below. The minimum
distance for the anchor located at the incoming end should be at least the runout
length, LR, used for calculating the guardrail length of need. An overlap distance
of 500 ft should be used for a median width up to 60 ft, a design speed of 70 mph,
and AADT > 6000. For the anchor located at the outgoing end, the minimum
overlap distance should be two times the anchor length. Changing the lateral
offset of a CBS at the anchor located at the outgoing end is the preferable method.
l. Locating the End Anchor of CBS in the Vicinity of Impact Attenuator. If a CBS
is terminated in the vicinity of an impact attenuator, the entire end-anchor length
should be located at the distance shown on the INDOT Standard Drawings behind
and clear of the concrete attenuator pad.
49-5.02 Existing Non-NCHRP 350 Guardrail to Remain in Place
Existing non-NCHRP 350 guardrail may be retained, subject to the following conditions.
1. A W-beam back-up plate is required at each W-beam-to-blockout connection where the W-
beam element units are not lapped.
2. The height of guardrail should be a minimum of 2.25 ft with a maximum height of 2.5 ft as
measured from the top of the W-beam to the ground surface at the face of rail.
3. A rubrail must also be used, including that for a guardrail run with a radius of 50 ft or less.
4. The flat-plate washers should be eliminated from under the head of the bolt holding the W-
beam to the blockout except where washers are needed to transmit the forces in the W-beam
to the anchor posts to obtain end anchorage. For example, if both ends of a guardrail run
2012
55
have positive anchorage at a bridge support or through a guardrail end treatment, all of the
flat-plate washers should be eliminated except those in the transition. However, if the
guardrail run ends without a positive connection, anchorage will have to be achieved
through the last 5 posts and the washers must be left on these posts.
5. It is considered safer for an errant vehicle to traverse an embankment slope as steep as 3:1 at
any height, than it is for the vehicle to impact a traffic barrier which can shield that slope
(see Section 49-3.02). Therefore, on a reconstruction project, it may be necessary to remove
portions of existing guardrail to be in accordance with to the concept that guardrail should
be provided only where clearly warranted. However, on a slope steeper than 4:1, the clear
runout area shown in Figure 49-2F, Clear-Zone Application for Non-Recoverable Fill
Slope, must be provided at the toe of slope.
49-5.03 Roadside Barrier Requirement at Rock Cut
Where a barrier is required to shield a rock cut, a concrete shape F median barrier as described in
Section 49-6.02(02) should be placed.
49-5.04 Roadside-Barrier Requirements at Bridge Pier
A pier located within the clear zone should be protected with guardrail. A pier located within 16 ft
of the edge of the travel lane should be protected with a guardrail transition attached to the pier and
the required length of guardrail. A pier located beyond 16 ft but within the clear zone should be
shielded with either a guardrail transition attached to the pier and the required length of guardrail, or
a run of guardrail placed in front of the pier, as determined on the field check (see Section 49-3.06).
See Section 49-8.02 for guardrail-transition information. Where the run of guardrail is placed in
front of the pier, the offset between the face of rail and the edge of the travel lane should be made as
large as practical. The clearance between the back of the guardrail posts and the pier should be
checked to satisfy the guardrail-deflection criteria. Figure 49-3N, Treatment at Existing Bridge
Cone with Shoulder Pier, provides typical details for shoulder-pier protection.
Where the offset distance between the face of pier and the edge of the travel lane is less than the
minimum required usable-shoulder width, a design exception will be required for the shoulder
width, though the pier is protected with guardrail. A design exception will not be required if the
face of pier is located beyond the minimum required usable shoulder width, and the guardrail
transition projects into the shoulder area.
2012
56
The methods of treatment at an existing pier or bridge cone described above and the details shown
on Figures 49-3L and 49-3M provide satisfactory methods of treatment. Because actual field
conditions are variable, each location should be investigated at the field check to determine if
alternative solutions may be more acceptable.
49-5.05 W-Beam Guardrail Over Large Drainage Structure Under Low Fill
A large drainage structure is defined as that with a clear span of at least 66 in., as measured parallel
to the roadway centerline, or a three-sided structure. For such structure ends within the clear zone
which are costly to extend and whose end sections cannot be made traversable, shielding with
guardrail should be provided to protect an errant motorist from colliding with a structure end. If the
structure end is outside the clear zone, guardrail should be placed to protect the errant motorist from
the structure end.
If there is inadequate cover over the structure to support the guardrail posts, it will be necessary to
use the details for guardrail installation over a low-fill structure as shown in the INDOT Standard
Drawings. For this situation, full embedment of the guardrail posts is often impractical. The
locations of the types of standard or modified posts are to be used should be shown on the plans.
Steel or concrete bridge railing in accordance with NCHRP 350 criteria also may be required over a
low-fill structure where modified guardrail posts cannot be utilized. An appropriate guardrail-to-
bridge-railing transition should be used.
The nested-guardrail configuration shown in the INDOT Standard Drawings should be used where
there is inadequate cover for driving full-length guardrail posts. The configuration may be used
within a longer run of W-beam guardrail, or may be used alone, depending on the length of
guardrail need. This configuration has been crash tested in accordance with NCHRP 350
requirements, and approved for use by the FHWA on the National Highway System.
The configuration may only be used as one complete 100-ft unit. The number of modified posts
should be determined, if they are required, to determine the pay quantity. The end-treatment
requirements should also be determined.
The length of need for guardrail in advance of the structure or area of concern should be
determined as described in Section 49-4.02. If nested W-beam guardrail is used over the
structure and is not sufficient for the calculated length of need, additional non-nested W-beam
guardrail should be provided to satisfy the length-of-need requirement preceding the nested W-
beam guardrail installation as shown on the INDOT Standard Drawings. If there is a need for
non-nested W-beam guardrail beyond the nested W-beam guardrail installation, the non-nested
2012
57
W-beam guardrail (minimum length 25 ft) should be connected to the outgoing end of the nested
W-beam guardrail installation in lieu of the cable-terminal anchor system.
At an installation of guardrail for a large drainage structure on a 4R project constructed on new
alignment, the shoulder should not be paved to the face of the guardrail. The standard width of
stabilized shoulder should be specified.
Where W-beam guardrail is used to shield a structure, the following procedure should be used
for each combination of overall structure width, W (ft), and depth of cover, C (ft), over the
structure. The overall structure width of a large drainage structure is defined as the width out-to-
out of structure parallel to the roadway centerline for a skewed or perpendicular structure.
49-5.05(01) Longitudinal Guardrail Placement
1. W 24 and C < 4. Use nested guardrail including a 25-ft span over the structure as
shown on the INDOT Standard Drawings.
2. 24 < W 60 and 1.5 C < 4. Use nested guardrail including a 25-ft span over the
structure, and modified posts for the nested guardrail adjacent to the 25-ft span as shown
on the INDOT Standard Drawings. The modified posts should be inserted into steel
tubes, which are embedded into concrete bases. The concrete post bases should not be
attached to the structure. The modified posts with concrete bases should only be used
over the structure.
3. W Not Limited and 4 C < 5. Use TL-3 W-beam guardrail with 6-ft length posts at 6.25-
ft spacing over the structure, and 7-ft length posts at 6.25-ft spacing preceding and
beyond the structure.
4. W Not Limited and C 5. Use TL-3 W-beam guardrail with 7-ft length posts at 6.25-ft
spacing.
49-5.05(02) Cable-Terminal Anchor System
The cable-terminal anchor system may be used at the outgoing end of a W-beam guardrail run
that is not exposed to oncoming traffic. It may be used as the equivalent of the W-beam
anchorage guardrail ordinarily required 25 ft beyond the length of need, where space limitations
do not permit placement of such a guardrail run.
2012
58
49-5.05(03) Grading Requirements
Grading requirements for a structure carrying a rural divided highway on new alignment with a
design speed of 70 mph are shown on the INDOT Standard Drawings. For a different design
speed, a similar grading configuration should be designed using appropriate design criteria and
dimensions.
Grading requirements for a structure carrying a highway on existing alignment without regard to
design speed are also shown on the INDOT Standard Drawings for grading requirements at
guardrail end treatment.
Guardrail length of need should be based on the clear-zone width.
49-5.06 Guardrail at Curb
If 2 ft of embankment (back of guardrail post to shoulder break point) cannot be provided behind a
guardrail at a curb, nested guardrail should be used. Therefore, the guardrail post must be driven
immediately behind the back of curb.
49-6.0 MEDIAN BARRIER
49-6.01 Median-Barrier Warrants
A median barrier should be used on a freeway or expressway where the design speed is 50 mph
or higher, and median crossings are at least 1 mi apart. If breaks in the median barrier will, on
average, be less than 1 mile apart, a median barrier should not be installed because of the larger
number of barrier end treatments required. The hazards created by the end treatments are greater
than the benefits derived from using a median barrier.
Figure 49-6A, Median-Barrier Warrants, provides the warranting criteria for median barrier on a
freeway or other divided highway which has a relatively flat, unobstructed median. As indicated in
Figure 49-6A, a median barrier is warranted for combinations of 20-year projected AADT and
median width that appear within the crosshatched area. At a low 20-year projected AADT, the
probability of a vehicle crossing the median is relatively low. For a relatively wide median, the
probability of a vehicle crossing the median is relatively low. These conditions are indicated by the
shaded area under the curve. For a 20-year projected AADT less than 20,000 and a median width
2012
59
below the warranting curve, and for a median width 30 ft and below the warranting curve, median-
barrier use is optional.
49-6.02 Median-Barrier Types
49-6.02(01) TL-3 Barrier
A double-faced W-beam guardrail system should be considered where median-barrier use is
identified as optional as described in Section 49-6.01.
49-6.02(02) TL-4 Barriers
1. Concrete Barrier, Shape F, Common Height of 33 in. This barrier is used in a paved median
of 36-ft width or narrower on a non-freeway. This barrier should be used where the impact
frequencies are less than those described in Item 2.b. below, as this is a rigid system which
will negligibly deflect upon impact.
A modified concrete barrier may be necessary where the median barrier must accommodate
a fixed object in the median (e.g., bridge pier, sign support). For details, see the INDOT
Standard Drawings.
2. Double-Faced Thrie-Beam Guardrail with Posts Spaced at 6’-3‖. A median barrier must
have been determined to be warranted as described in Section 49-6.01. Double-faced
thrie-beam guardrail should be considered for an unpaved median where the minimum
distance from the front face of the guardrail to edge of the paved shoulder is 12 ft. The
designer should ascertain that the placement of guardrail posts does not interfere with
sewer pipes, drainage structures, underdrains, etc.
This barrier should be considered where a median barrier has been determined to still be
warranted, and the following criteria are satisfied.
a. New Facility. A median barrier is warranted as indicated by Figure 49-6A.
b. Impact Frequency Where No Barrier Currently Exists. Impact data should be
researched and applied as follows:
(1) there is an average of 0.50 cross-median crashes per mile per year; or
2012
60
(2) there is an average of 0.11 fatal crashes per mile per year.
c. Impact Frequency Where W-Beam Guardrail Currently Exists. Researched
impact data indicate that a particular run of guardrail has been impacted two or
more times per year.
49-6.02(03) TL-5 Barrier
The only TL-5 barrier is the concrete barrier, shape F, truck height of 45 in. It should be used on a
freeway as indicated in Figure 49-6A, Median-Barrier Warrants.
The following procedure should be used to determine if a truck-height median barrier is warranted
on an expressway.
1. Determine adjustment factors Kg and Kc from Figure 49-6B, Grade Traffic Adjustment
Factor, Kg, and Curvature Traffic Adjustment Factor, Kc. Use Ks = 0.7.
2. Calculate the adjusted construction-year AADT by multiplying the construction-year AADT
shown on the plans (total for both directions) by the three adjustment factors and dividing by
1000 as shown below.
Adjusted construction-year AADT = (construction-year AADT shown on plans)(Kg)(Kc)(Ks).
1000
3. Enter the Figures 49-6D series, Median-Barrier or Bridge-Railing Test-Level Selection for
the appropriate design speed, for the type of roadway on which the work is located.
4. Locate the line in the figure that corresponds to the site conditions (% Trk and Edge of
Travel Lane to Front Face Barrier, L2).
5. Locate the adjusted construction-year AADT range, T, on the table.
6. If the calculated adjusted AADT value from Step 2 exceeds the T range from the figure from
Step 5, a TL-5 railing or barrier is warranted. If the adjusted AADT is less, a lower Test
Level railing or barrier is warranted.
7. If a TL-5 median barrier is warranted, it should be used between logical termini, such as two
bridge piers.
2012
61
The minimum length of need for a TL-5 concrete barrier in a median can be determined as
discussed in Section 49-4.02(03). Other logical points of termination that should be considered
include bridge pier or parapet, median crossover, or the beginning or end of project location.
This barrier may be warranted where there is a high volume of truck traffic, above deep water,
on a high-occupancy land use area, on a high fill, across a deep ravine, or for a combination of
these.
* * * * * * * *
49-6.03 Example for Determining Median-Barrier Test Level on an Expressway
Example 49-6.1 See Figure 49-6E, Truck-Height Concrete-Median-Barrier Example 49-6.1.
Given: 6-lane divided highway
Design speed = 70 mph
Construction-year AADT = 8,000 vpd
Percent trucks = 10%
Median width = 24 ft
Median-barrier offset = 11 ft
Horizontal curvature = tangent
Grade = 3% eastbound, -3% westbound
Problem: Determine whether a TL-4 or TL-5 concrete median barrier is appropriate.
Solution: Eastbound traffic, L2 = 11 ft:
From Figure 49-6B, Grade Traffic-Adjustment Factor, Kg, and Curvature Traffic-
Adjustment Factor, Kc, Kg = 1.0 and Kc = 1.0.
From Figure 49-6C, Traffic-Adjustment Factor, Ks, Deck Height and Under-
Structure Shoulder Height Conditions, Ks = 0.7.
Adjusted construction-year AADT = 6.51000
7.00.10.1000,8
From Figure 49-6D(65, 70), Median-Barrier or Bridge-Railing Test-Level Selection,
Design Speed 70 mph, for % Trk 10 ≤ % < 15, 7 < L2 ≤ 12, and highway type as
Divided, the appropriate T range is 2.6 < T ≤ 27.0.
2012
62
The value of 21.0 is within this range; therefore, a TL-4 median barrier may be used,
and a TL-5 barrier is not required.
Westbound traffic, L2 = 11 ft:
From Figure 49-4J, Kg = 1.25 and Kc = 1.0.
From Figure 49-4K, Ks = 0.7.
Adjusted construction-year AADT = 0.71000
7/00.125.1000,8
From Figure 49-6D(65, 70), for % Trk 10 ≤ % < 15, 7 < L2 ≤ 12, and highway type
as divided, the appropriate T range is 2.6 < T ≤ 27.0.
The value of 26.25 is within this range; therefore, a TL-4 median barrier may be
used, and a TL-5 barrier is not required.
* * * * * * * *
49-6.04 Median-Barrier Design
49-6.04(01) Median Slopes
The slope in front of a median barrier should be 20:1 or flatter. Where a median barrier is
warranted, it should be placed such that its effectiveness is not diminished by the severity of the
median slopes. This may result in the placement of a median barrier along either or both inside
shoulders instead of a single barrier along the center of the median.
49-6.04(02) Superelevated Section
Where a median barrier is located on the high side of a superelevated section, its vertical axis of
symmetry should be at 90 deg to the pavement surface. On the low side of a curve, the axis of
symmetry can be either vertical, or at 90 deg to the pavement surface. See Section 43-3.08 for more
information on superelevation development with a median barrier.
2012
63
49-6.04(03) Barrier-Mounted Obstacle
If a truck or bus impacts a median barrier, their high center of gravity may result in a vehicular roll
angle which may result in the truck or bus impacting an obstacle on top of the barrier (e.g., a
luminaire support). If practical, such an obstacle should be moved to the outside, or additional
distance should be provided between the barrier and obstacle (e.g., a bridge pier).
49-6.04(04) Terminal Treatment
As with a roadside-barrier terminal, a median-barrier terminal also poses a potential roadside hazard
for a run-off-the-road vehicle. Therefore, consideration must be given to the selection and
placement of the terminal end. See Section 49-8.04 for information on impact attenuators.
49-6.04(05) Concrete-Barrier Height Transition
The truck-height concrete barrier should be tapered down to the common height where barriers of
the two heights are connected as shown in the INDOT Standard Drawings. The transition should
be sloped at 30:1 or flatter. This taper should be accomplished outside the area where the truck-
height barrier is warranted. If the truck-height barrier does not connect to the common-height
concrete barrier, the ends must be tapered down to the common height and terminated with an
appropriate impact attenuator.
49-6.04(06) Horizontal Sight Distance
The use of a TL-4 or TL-5 barrier may limit stopping sight distance, SSD, on the inside of a
horizontal curve. Therefore, the SSD should be checked on a horizontal curve to determine if the
required SSD is available (see Section 43-4.0). If SSD requirements are not satisfied, the impacts of
the reduced SSD on safety should be evaluated, and, if appropriate, a Level One design exception
should be considered (see Section 40-8.0). If, for example, safety is significantly reduced, the TL-5
barrier may not be appropriate.
49-6.04(07) Intersection Sight Distance
The use of a truck-height median barrier may limit intersection sight distance, ISD. Therefore,
the ISD should be checked as described in Section 46-10.03. If ISD requirements cannot be
satisfied, the barrier height must be tapered to the common height as described in Section 49-
2012
64
6.04(05) as it approaches the portion of the barrier to be placed within the sight triangle. A
common-height barrier and impact attenuator type SD may be extended into the sight triangle
outside the limits of a public-road crossover or shoulder, and not beyond the stop line into the
intersection. Consideration should be given to the ISD required for a vehicle turning right on a
red signal indication after stopping.
49-6.04(08) Interchange Entrance Ramp
A motorist entering a freeway needs sufficient sight distance to locate gaps in the traffic stream in
which to merge. The presence of a truck-height barrier can interfere with the sighting of an entering
motorist. Therefore, the entrance ramp should be checked to ensure that adequate sight distance is
available for the merge maneuver.
49-6.04(09) Median Barrier with Collector-Distributor Road
A concrete barrier may be warranted between a highway mainline and a collector-distributor road.
In this situation, a TL-4 concrete barrier should be used because of the importance of sight distance.
49-6.04(10) Temporary Opening in Barrier
A temporary opening may be affected by using a gate device. Such opening may be used to
route traffic around an emergency scene. An emergency opening may be required to route traffic
around an emergency scene such that the roadway must be temporarily closed. For this situation,
a proprietary device may be used to provide a temporary opening. It may be used in conjunction
with a concrete median barrier to provide a temporary opening in the barrier for emergency
vehicles or to temporarily reroute traffic. The device is opened and closed by means of an
electronic control mechanism that can be manually overridden during a power failure.
49-6.05 Glare Screen
Headlight glare from opposing traffic can be bothersome and distracting. A glare screen can be
used in combination with a median barrier to eliminate the problem. Specific warrants have not yet
been adopted for the use of a glare screen. The typical application, however, is on an urban freeway
with a narrow median and high traffic volume. Another application is between on/off ramps at an
interchange where the two ramps adjoin each other. Here, the sharp radius or curvature and the
narrow separation may make headlight glare bothersome. The use of a glare screen should be
2012
65
considered at either of these sites. A key element warranting its use is the number of public
complaints received regarding glare for a particular highway section.
The following design criteria should be evaluated for a glare screen.
1. Cutoff Angle. A glare screen should be designed for a cutoff angle of 20 deg. This is the
angle between the median centerline and the line of sight between two vehicles traveling in
opposite directions. See Figure 49-6F, Cutoff Angle for Glare Screen. The glare screen
should be designed to block the headlights of oncoming vehicles up to the 20-deg cutoff
angle. On a horizontal curve, the design cutoff angle should be increased to allow for the
effect of curvature on headlight direction. The criterion is as follows:
Where R = horizontal radius (ft).
2. Horizontal Sight Distance. A glare screen may reduce the available horizontal sight
distance. For a curve to the left, the middle ordinate must be checked to determine if
adequate stopping sight distance will be available. See Section 43-4.0.
3. Sag Vertical Curve. In determining the necessary glare-screen height, the effect of sag
vertical curvature need not be considered.
4. Height of Eye. The driver’s eye height is 3.5 ft.
5. Glare-Screen Height. To determine the appropriate height of the glare screen, NCHRP
Synthesis 66, Glare Screen Guidelines should be reviewed.
49-7.0 PIER OR FRAME-BENT COLLISION WALL
49-7.01 Application
A collision wall should be provided in new-construction or reconstruction work where the traffic
face of an overhead-structure pier is not completely protected by guardrail or where there is a gap
between adjacent piers that is not protected by guardrail.
R
5731 + 20 = (deg) Angle Cutoff
2012
66
For an overhead-structure frame bent (i.e., pier composed of columns), a collision wall should be
constructed between the columns. For twin overhead structures, a collision wall should be
constructed between the twin frame bents.
Such a wall is required for a shoulder-side or median-side pier or frame bent.
49-7.02 Design
The following provides the design criteria for a collision wall.
1. Wall Height and Thickness. The minimum height above the shoulder or ground surface
should be 33 in. The minimum thickness should be equal to the thickness of the adjacent
piers or bents. The height should be increased to match the height of the adjacent concrete
median barrier.
2. Traffic-Face Geometry. The traffic-side face of the collision wall should be a vertical shape.
3. Footing Design. The footing should be 4 ft wide by 1 ft thick with the bottom 3 ft below the
ground line. A longitudinal keyway is required at the top of the footing. The width of the
keyway should be equal to one third the thickness of the wall, a minimum of 6 in., and with
a depth of 3 in.
4. Reinforcing Steel. The longitudinal reinforcing steel should be #4 bars at 1’-0‖ spacing, the
vertical reinforcing steel should be #5 bars at 1’-0‖ spacing, and the horizontal reinforcing
steel at the top of the wall should be #4 bars at 1’-0‖ spacing.
5. Impact Attenuators for Median Pier or Frame Bent. An impact attenuator is required at each
end of a median pier or frame bent for a single overhead structure. For twin overhead
structures, an impact attenuator is required at the incoming end of the first structure and the
outgoing end of the second structure on a divided highway.
6. Existing Collision Wall. An existing collision wall which is less than 33 in. in height above
the shoulder or ground should be extended to 33 in. by grouting vertical #5 reinforcing bars
at 1’-0‖ spacing into the top of the existing wall along both faces and pouring concrete to the
necessary height.
7. Typical Collision-Wall Detail. Figure 49-7A illustrates typical details of a new collision
wall.
2012
67
49-8.0 GUARDRAIL END TREATMENTS, TRANSITIONS, AND IMPACT
ATTENUATORS
49-8.01 Guardrail End Treatments (GRETs) and Usage
49-8.01(01) TL-3 Treatments
1. Type OS – Outside Shoulder. This type of GRET dissipates energy if hit head-on and
has the ability to redirect an errant vehicle on one side only, where a backside impact is
not anticipated. It is used with single-faced guardrail.
2. Type MS – Median Shoulder. This type of GRET dissipates energy if hit head-on and
has the ability to redirect an errant vehicle on two sides, where a backside impact is
anticipated. It is used with double-faced guardrail.
3. Type II. This type of GRET is used where a cut slope or backslope above the roadway
grade is encountered along the roadside. The details for GRET type II are shown in the
INDOT Standard Drawings. GRET type II is used to terminate single-faced guardrail in
a backslope. This type redirects an errant vehicle on one side only. It is acceptable if the
foreslope on the approach is 4:1 or flatter. It may be necessary to modify the details on
the INDOT Standard Drawings to adapt to unique conditions. A deviation from the
Standard Drawings should be shown on the plans. The design characteristics relative to
guardrail design and embankment slopes shown in the INDOT Standard Drawings
should be considered in the design.
Where practical, it is desirable to bury the end of a guardrail run into the backslope. The
factors to consider in burying guardrail in a backslope are proper guardrail flare,
maintaining the proper height of the guardrail, providing proper shoulder, embankment,
and approach slopes in front of the guardrail, and maintaining drainage.
The design considerations to be evaluated in the selection of a GRET type II are as
follows:
a. A minimum 75-ft straight run of W-beam guardrail which may include a guardrail
transition, is required preceding the area of concern (hazard).
b. If this 75-ft guardrail run is not adequate, the guardrail run should be extended to
shield the hazard.
2012
68
c. The cut slope or backslope should be located laterally approximately 6.5 ft
minimum and 17 ft maximum from the face of guardrail, at the end of the 75-ft
guardrail run. The backslope should be ascertained to extend parallel to the
roadway for a sufficient distance to bury the end of the GRET type II, otherwise,
a different type of GRET will be required.
d. The total pay length of GRET type II includes both the WR-beam guardrail run
and the guardrail-height taper to end anchorage. This buried-in-backslope
guardrail end treatment is made up of the components as follows:
(1) The first component is 25 ft of WR-beam guardrail at the specified ratio a:b,
depending upon the design speed at the specific location.
(2) The length of the second component, which is also WR-beam guardrail,
varies from 0 to 100 ft to fit field conditions at the specified ratio a:b,
depending upon the design speed at the specific location.
(3) The third component is 37.5 ft of W-beam guardrail plus the steel-post
anchor system at the specified ratio of 8:1.
e. For the buried-in-backslope guardrail system to be cost effective, the total length of
the system should not extend approximately 150 ft beyond the guardrail length of
need as determined in Section 49-4.02.
49-8.01(02) Non-NCHRP 350 Treatment
GRET type I is a treatment that may be used only on a local-public-agency route or on a local
approach to an INDOT route, where the design-year AADT < 1000 regardless of the design
speed. Double-faced GRET type I may be used in conjunction with a double-faced guardrail
installation. GRET type I details are shown in the INDOT Standard Drawings. This guardrail
end treatment type shall neither be used on the National Highway System nor an INDOT-
maintained route.
This GRET should be flared. The embankment in the flared area should be sloped at a 20:1 rate. If
the guardrail is on a taper, it is acceptable to continue the buried end on the same taper line without
offsetting it further, provided the minimum 2-ft offset is obtained.
2012
69
49-8.01(03) Design Considerations
The considerations which should be evaluated in the design of a GRET or guardrail transition are
described below.
1. Slopes. All slopes in the area of a GRET should be graded in accordance with the INDOT
Standard Drawings.
2. Breakaway-Cable Terminal. A breakaway-cable terminal end section should be removed
and replaced with the NCHRP 350 GRET which is suitable for the location.
3. Transition. A guardrail transition to a bridge pier, bridge railing, etc., should be as shown on
the INDOT Standard Drawings.
4. Opening Near a Bridge. A drive or a county road may intersect the highway a short distance
from the end of a bridge. Providing an opening in the guardrail for such an approach should
be accomplished by using the curved W-beam guardrail terminal or connector system as
shown on the INDOT Standard Drawings.
5. GRET Type OS or MS. This GRET should be installed in alignment with the guardrail if
the guardrail run is on a tangent. For a curved guardrail run, the GRET should be
constructed along a chord of the curve with the beginning and end of the GRET having the
same offset from the edge of the travel lane (see Figure 49-8A, Guardrail End Treatment
Type OS or MS for Curved Guardrail Run).
6. W-Beam Guardrail Buried in Backslope. Where practical, consideration should be given to
burying the end of a guardrail run into the backslope. Further considerations include proper
guardrail flare, maintaining full design height of guardrail, and providing proper drainage
and approach-terrain details. In addition, the following should be considered.
a. Flare Rate. The guardrail system should be flared away from the roadway at a rate
not greater than 15:1 until the guardrail passes the clear zone or the center of the
ditch, whichever is the greater distance. At that point, it can then be flared back at
8:1. The foreslope in front of the guardrail should be 20:1. A steeper slope, up to a
maximum of 10:1, may be used if necessary to allow for ditch grading.
b. Guardrail Height. The design height should be maintained across the slope to the
point where the guardrail passes over the foreslope-backslope intercept. Where this
is not practical and if the gap between the ground and the bottom of the W-beam rail
is 1.75 ft or more, it will be necessary to add a W-beam rubrail. The rubrail should
2012
70
be added for 50 ft downstream and 25 ft upstream of the area where the gap exceeds the 1.25-ft normal height. The W-beam rubrail should be terminated behind the last post, similar to that shown for a guardrail transition type VH on the INDOT Standard Drawings.
c. Anchors. The end of the guardrail buried in the backslope will be anchored with a
W-beam steel post anchor system as shown on the INDOT Standard Drawings.
d. Transitions. A foreslope transition zone will be needed to transition from the standard ditch cross-section in the cut section to the 10:1 desirable, 6:1 maximum, foreslope in front of the guardrail. The approach slope to the 20:1 cross slope in front of the guardrail should be a 30:1 maximum longitudinal slope relative to the roadway grade. The ground can then be warped from the standard ditch cross-section to the desired 10:1 foreslope in front of the guardrail. These conditions, if satisfied, should minimize the potential for a vehicle to vault over the guardrail or for wheels to snag on the guardrail.
e. Drainage. Where a ditch section providing the recommended guardrail approach
terrain cannot be constructed without blocking flow in the ditch or where the resulting ditch grade is too slight, an acceptable inlet type and an outlet pipe will be required to carry the drainage under the guardrail. Where an inlet is not needed in the vicinity of the guardrail because of approach-terrain requirements, there may be a need for a drainage structure behind the guardrail in the fill section to prevent erosion.
7. Drive-Behind. If an errant vehicle penetrates the guardrail end treatment section, the
motorist should be able to guide his or her vehicle down the slope without difficulty. Therefore, a minimum recovery area behind the barrier end treatment must be provided. This recovery area is shown in Figure 49-8B, Clear Recovery Area Behind Guardrail.
49-8.01(04) Design Procedure [Rev. Sept. 2011] After the design of a roadside barrier is completed, including the determination of the barrier length of need and the appropriate railing transitions in accordance with Section 49-8.03, it is necessary to select the proper GRET.
In order to determine the appropriate GRET type, the following should be considered.
2012
71
1. Relationship of GRET to Traffic. It must be determined if there will be traffic on one or both sides of the guardrail end treatment. The GRET may be located beyond the outside shoulder with traffic passing on one side only, or it may be in a median, gore, or other location where traffic passes on two sides. If all traffic will pass a GRET only on one side, the GRET will not require redirective capability on more than one side. If traffic will pass the GRET on two sides, it may be necessary for the GRET to be capable of redirecting errant vehicles from two sides.
a. GRET for Single-Faced Guardrail. For this situation, the GRET must provide
redirective capability only on the traffic side. GRET type OS or type II should be selected for this situation.
b. GRET for Double-Faced Guardrail. For this situation, the GRET must provide
redirective capabilities on both sides. GRET type MS should be selected for this situation.
2. Relationship Between GRET and Guardrail Length of Need. Some GRETs can function
as typical guardrail as described below. a. GRET Type OS. A 37.5-ft portion of the downstream end of a GRET type OS
can function as typical guardrail. It therefore should be considered as part of the length of need in advance of the obstruction. Where GRET type OS is warranted, the pay length for the guardrail run is equal to the required length of need for the guardrail minus 37.5 ft.
b. GRET Type MS. A 12.5-ft portion of the downstream end of a GRET type MS
can function as typical guardrail. It therefore should be considered as part of the length of need in advance of the obstruction. Where GRET type MS is warranted, the pay length for the guardrail run is equal to the required length of need for the guardrail minus 12.5 ft.
GRET type I or II cannot function as typical guardrail, so no portion of it should be
considered as part of the guardrail length of need. The reduced pay length should be reflected in the guardrail length shown on the plans.
2012
72
49-8.02 Guardrail Transitions and Usage 49-8.02(01) TL-3 Transitions 1. Type WGB – W-beam, Guardrail to, Bridge railing transition. This transition type is used
where the proximity of an intersecting road or drive prevents the proper installation of the guardrail transition type TGB described in Section 49-8.02(02). Where at least one transition type WGB is required at a bridge, all bridge-railing ends should use the transition type WGB.
2. Type GP – Guardrail to Pier. This transition is used to connect guardrail to a bridge pier or
a frame bent. 49-8.02(02) TL-4 Transitions 1. Type TGB – Thrie-beam, Guardrail to, Bridge railing transition. – This is the preferred
transition. It should not be used only where an intersecting road or drive prevents the placement of a properly designed system. To use the transition type TGB, there must be space to place at least 25 ft of roadside barrier between a curved W-beam guardrail connector terminal system or a curved W-beam guardrail system and the beginning of the transition.
2. Type WGT – W-beam, Guardrail to, Thrie-beam guardrail transition.
a. Outside Shoulder. A thrie-beam section must be transitioned to a W-beam section, and a guardrail end treatment type OS should be attached to the end of the W-beam section. This transition connector is guardrail transition type WGT. The details are shown on the INDOT Standard Drawings. The WGT guardrail transition must be used to bring the thrie-beam guardrail to the W-beam guardrail height for proper attachment of a guardrail end treatment.
b. Median-Side Shoulder. Where thrie-beam guardrail is terminated in a median, two
WGT transitions with staggered posts as shown on the INDOT Standard Drawings must be provided unless a median pier or barrier wall, etc., is immediately adjacent. The two WGT guardrail transitions must be used to bring the double-faced thrie-beam guardrail to the double-faced W-beam guardrail height and width for proper attachment of a guardrail end treatment type MS.
2012
73
49-8.02(03) Non-NCHRP 350 Transition Type VH – Vertical Height adjustment – may be used to extend existing non-NCHRP 350 guardrail classes Bs, Ds, Es, or Hs if adding new TL-3 guardrail. This transition involves the vertical adjustment of the first 25 ft of existing guardrail adjacent to the new guardrail. The adjustment requires the posts in this 25-ft section to be driven deeper to compensate for the height difference between the two guardrail systems, and it also requires the proper termination of the rubrail. This transition is also used where a GRET type MS or OS is being connected to an old railing system. To properly specify the required version of this transition, the post spacing of the existing guardrail adjacent to the proposed extension must be known. 49-8.03 Bridge-Railing Transitions See Section 61-6.0 for more information on the location and design of a bridge-railing transition and its complementary bridge railing. 49-8.03(01) TL-2 Transitions A TL-2 transition should only be used on a non-INDOT-maintained route not on the National Highway System. 1. Type TGS-1 – Transition, Guardrail, Side-mounted, 1 tube. This transition is used with
bridge railing type TS-1. 2. Type TPF-2 – Transition, Pedestrian-height, Flush with deck, 2 tubes. This transition is
used with bridge railing type PF-2. 3. Type TPS-2 – Transition, Pedestrian-height on, Sidewalk, 2 tubes. This transition is used
with bridge railing type PS-2. 4. Type TTX – Transition, TeXas 411 ornamental. This transition is used with bridge railing
type TX. 49-8.03(02) TL-4 Transitions A TL-4 transition should be used on an INDOT-maintained route or the NHS where a TL-5 railing and transition is not warranted.
2012
74
1. Type TBC – Thrie-beam, Bridge approach, Common height. This transition is used with the
common-height, shape F concrete bridge railing. 2. Type TPF-1 – Transition, Pedestrian-height, Flush with deck, 1 tube. This transition is used
with bridge railing type PF-1. 3. Type TPS-1 – Transition, Pedestrian-height on, Sidewalk, 1 tube. This transition is used
with bridge railing type PS-1. 4. Type TGT – Thrie-beam, Guardrail, Truck height. This transition is used with bridge railing
type CF-1 5. Type TTT, Thrie-beam guardrail, Transition to, Thrie-beam bridge-railing transition.
This transition connects a bridge-railing transition to the thrie-beam guardrail by providing a height-adjustment transition. The TTT transition details are shown on the INDOT Standard Drawings.
49-8.03(03) TL-5 Transition Type TBT – Thrie-beam, Bridge approach, Truck height is used with concrete bridge railing, shape F, truck height, and with bridge railing type TR. 49-8.04 Impact Attenuators 49-8.04(01) Types Impact-attenuator selection design is based on the appropriate Test Level for the design speed of the roadway under consideration. The types of TL-2 or TL-3 impact attenuators are described as follows: 1. Type ED – Energy Dissipation. This is an energy dissipation device. 2. Type R1 – Redirective 1 side. This is an energy dissipation device that has redirective
capability on one side.
2012
75
3. Type R2 – Redirective 2 sides. This is an energy dissipation device that has redirective capability on two sides.
4. Type CR – Clearance Restriction. This is an energy dissipation device that has
redirective capability on two sides. This type is used where there are lateral clearance restrictions that make installation and maintenance of the attenuator difficult.
The expected or experienced crash frequency should be considered in attenuator type CR selection.
Type CR1 should be specified unless conditions exist as described below.
Type CR2 should only be specified for a location that has been documented for an existing alignment, or anticipated for a new alignment, by the appropriate district maintenance engineer, to have an impact frequency of 3 or more per year. A type CR2 unit is largely self-restoring after a typical impact, and has the ability to partially absorb additional impacts that can occur before the unit can be serviced.
The designer should solicit input from the appropriate district maintenance engineer on which type of CR attenuator to specify. Use of a type CR2 attenuator must be authorized in writing by the maintenance engineer.
5. Type SD – vertical Sight Distance limitation. This is an energy dissipation device that
has redirective capability on two sides. This type is used at an intersection where there can be sight distance limitations if a taller attenuator is used.
If the design speed is 45 mph or lower, the attenuator design should be in accordance with TL-2 criteria. A project with a design speed of 50 mph or higher will require an attenuator design which should be in accordance with TL-3 criteria. An attenuator shielding an obstruction located between roadway facilities with different design speeds (e.g., gore area) should be in accordance with the Test Level requirement for the higher design speed. An impact attenuator type LS – Low Speed – is a low-speed energy dissipation device that has redirective capability on two sides. This type should be in accordance with TL-1 criteria only. Attenuator type LS should be selected for a design speed of 30 mph or lower. The type SD attenuator may also be used in this situation.
2012
76
49-8.04(02) Design After the design of a roadside barrier is performed in accordance with Section 49-5.0, it is necessary to determine whether there is an obstruction located within the clear zone that is not protected. An obstruction that can be protected by extending a proposed barrier a short distance should be protected in this manner. However, an impact attenuator should be utilized to protect an isolated obstruction. Unless transitioned to a roadside barrier, the end of a truck-height bridge railing should be shielded with an appropriate impact attenuator. This applies whether the end is inside or outside the clear zone. If an impact attenuator is required for a median barrier near an at-grade intersection, intersection sight distance should be checked as described in Sections 46-10.03 and 49-6.04(07). If sight distance is inadequate, an impact attenuator type SD should be placed to protect the median-barrier end. Figure 49-8C, Impact-Attenuator Offsets, illustrates common impact-attenuator installations. The D1 dimension shown on the figure determines whether an attenuator is warranted and, if so, whether the attenuator requires redirective capability on the side adjacent to the traffic under consideration. The D2 dimension shown on the figure is used to determine whether the attenuator requires redirective capability on its backside. For an obstruction in a gore or other similar area, the offset dimension from the edge of the obstruction face to the mainline outside travel lane edge must be compared to the similar measurement between the obstruction and the ramp inside travel lane edge. The smaller of the two offsets is defined to be D1 and the larger offset is considered to be D2. The required attenuator-width designation is based on the width of the obstruction. The standard available widths are as follows. 1. W1. This attenuator width is required for an obstruction that is not more than 3 ft wide. 2. W2. This attenuator width is required for an obstruction that is more than 3 ft wide but
less than or equal to 6 ft wide. 3. W3. This attenuator width is required for an obstruction that is more than 6 ft wide but
less than or equal to 8 ft wide. Impact attenuator type ED is limited to the W1 width only. A width requirement greater than that
2012
77
provided by width W1 will necessitate the selection of an impact attenuator type R1 or R2. Impact attenuator type LS is limited to the W1 width only. A width requirement greater than that provided by width W1 will necessitate the selection of an impact attenuator type R2 or CR. For the terminal end of a concrete median barrier, an impact attenuator type R1 or R2 is used. For another impact-attenuator type, if the obstruction width is greater than 8 ft, the obstruction should be shielded with an attenuator specifically designed for that width, altered so the width is less than or equal to 8 ft, or moved to a location where shielding is not required. Figure 49-8D, Impact-Attenuator Type Determination, illustrates the space requirements for each approved impact attenuator. For a roadway with a shoulder section, the attenuator footprint shown on the figure should not encroach onto the usable shoulder, as defined in Chapter 53, 54, or 55, as appropriate. For a roadway with curbs, the attenuator footprint should not encroach onto the 1.5-ft appurtenance-free zone, as discussed in Section 49-2.03(04). If the roadway section includes a sidewalk, the attenuator footprint should not encroach upon the sidewalk to reduce the remaining sidewalk width to less than 4 ft. An impact attenuator should not be installed behind a curb. Where necessary for drainage, a sloping curb not higher than 4 in. may be used for at least a distance of LR in advance of and alongside the attenuator. If the attenuator footprint violates the encroachment limits described above, the obstruction should be shielded with a roadside barrier, altered so the footprint encroachment is satisfactory, or moved to a location where shielding is not required. See Figure 49-8E, Impact-Attenuator Footprint Requirements.
49-8.04(03) Requirements at a Median Pier The type of protection required for a pier or frame bent located in a median is determined by the configuration of the overhead structure. The possible overhead-structure configurations are single, twin (side-by-side), or tandem (in-line). The required pier protection is determined as follows and is summarized in Figure 49-8F, Pier-Protection Requirements. 1. Single Overhead-Structure Pier or Frame Bent. The protection required is based on the
clearance from the face of the pier or frame bent to the median edge of the travel lane. 2. Twin (End-to-End) Overhead-Structure Piers or Frame Bents. The protection required is
based on the clearance from the faces of the piers or frame bents to the median edge of the travel lane at the outermost ends of the piers or frame bents.
2012
78
3. Tandem (In-Line) Overhead-Structure Pier or Frame Bent. Due to the bridge-cone location
behind the median-side pier or frame bent for this type of overhead structure, the pier protection should be the same as that required for outside-shoulder location described in Section 49-3.06.
49-9.0 BRIDGE-RAILING END 49-9.01 Curved W-Beam Guardrail System The curved W-beam guardrail system is composed of two subsystems. The first is the curved W-beam guardrail terminal system, which is used to terminate a guardrail run where the run is interrupted by a drive. The second subsystem is the curved W-beam guardrail connector system, which is used to connect guardrail located along a main roadway to guardrail or a guardrail end treatment located along an intersecting public-road approach. Each subsystem includes different types which can be specified based upon site conditions. The area behind the curved W-beam guardrail system should be cleared of all fixed objects which constitute hazards as shown on the INDOT Standard Drawings. 49-9.02 Bridge-Railing-End Shielding [Rev. Sept. 2011] The AASHTO LRFD Bridge Design Specifications requires that each bridge-railing end be shielded from direct collision by traffic. The type and extent of protection required should be determined based on the location of the bridge-railing end relative to the clear zone. The minimum extent of protection should be as shown in Figure 49-4E(1), Minimum Guardrail Length Required in Advance of Hazard. Conditions in an urban area can preclude the protection as shown in Figure 49-4E(1). See LRFD Bridge Design Specifications Article 13.7.1.2 and its Commentary for other options. The required length of bridge-approach guardrail, including the guardrail transition, for both shoulders of a 2-lane, 2-way highway, or the outside shoulders of a divided highway, is based on the clear-zone requirement for the roadway and the design speed. The calculated length should be rounded up to the nearer whole multiple of 6.25 ft. The length shown in Figure 49-4E(1) is that required to shield the end of the bridge railing only and should be considered the minimum requirement. All hazards adjacent to the bridge-railing end should be considered where bridge-approach-guardrail length is to be determined.
2012
79
49-9.03 Public Road Approach or Drive Each public road approach or drive that prohibits the installation of the required bridge-approach guardrail and guardrail end treatment should be relocated or closed. Because this will not always be practical, each situation must be addressed individually, with emphasis placed on providing the maximum protection practical consistent with the restrictions. The appropriate guardrail layout at, and in advance of, the public-road approach or drive is dictated by the control line, which is established by the clear zone and the guardrail runout length, LR. 49-9.03(01) Public-Road Approach Where a public road approach cannot be relocated, the appropriate curved W-beam guardrail system should be specified, in accordance with the INDOT Standard Drawings and the guidelines included herein. A minimum of 25 ft of W-beam guardrail should be provided between the guardrail transition type TGB and the curved W-beam guardrail system. Where this is not practical, a bridge railing transition type TBC and a guardrail transition type WGB should be specified instead of the type TGB, to connect the concrete bridge railing to the curved W-beam guardrail system. A curved W-beam guardrail connector type 1 or type 2 should be used depending on the system radius required to come in contact with the approach radius. The following should be considered. 1. Curved W-Beam Guardrail Connector System, End Located At or Beyond the Control Line.
Where the end of the curved W-beam guardrail connector system is at or beyond the control line, as shown in Figure 49-9B, Public-Road-Approach Application At or Beyond the Control Line, no additional guardrail is required along the public road approach. An appropriate guardrail end treatment should be used to attach to the end of the curved W-beam guardrail connector system. The area in advance of the guardrail, bounded by the edge of travel lane and the control line, must be traversable. The additional grading should be shown on the plans.
2. Curved W-Beam Guardrail Connector System, End Located Within the Control Line.
Where the end of the curved W-beam guardrail connector system is within the control line, as shown in Figure 49-9C, Public-Road-Approach Application Within the Control Line, additional guardrail will be required from the end of the curved W-beam guardrail connector system to the control line, terminated with an appropriate guardrail end treatment.
2012
80
3. Guardrail Requirements for Public-Road Approach. If additional guardrail is needed to satisfy the clear-zone requirements along a public-road approach, this guardrail should extend from the end of the curved W-beam guardrail connector system to the point of need along the public-road approach and be terminated with an appropriate guardrail end treatment.
49-9.03(02) Drive Except as described below, a curved W-beam guardrail terminal system type 1 or type 4 should be used depending on the system radius required to come in contact with the drive radius. The following should be considered. 1. Type 5 Anchor Located At or Beyond the Control Line. Where the type 5 anchor of the
curved W-beam guardrail terminal system, as shown in Figure 49-9D, Drive Application At or Beyond the Control Line, is at or is entirely beyond the control line, the bridge-approach guardrail should be terminated at that point. However, the area in advance of the guardrail, bounded by the edge of travel lane and the control line, must be traversable. The additional grading should also be shown on the plans.
2. Type 5 Anchor Located Partially or Entirely Within the Control Line. Where the type 5
anchor of the curved W-beam guardrail terminal system, as shown in Figure 49-9E, Drive Application Within the Control Line, is partially or entirely within the control line, the guardrail run should be continued on the other side of the drive to the point of need. This will require another curved W-beam guardrail terminal system along the other side of the drive, additional W-beam guardrail along the roadway shoulder in advance of the drive, and an appropriate guardrail end treatment. This advance guardrail should be extended from the end of the curved W-beam guardrail terminal to the point of need and then connected to the guardrail end treatment. However, if this guardrail length required in advance of the drive is less than 100 ft, the guardrail run and curved W-beam guardrail terminal system in advance of the drive will not be required. However, the area in advance of the guardrail, bounded by the edge of the travel lane and the control line, must be traversable. This additional grading should be shown on the plans.
3. Restricted Right of Way. Where the obtainable right of way is insufficient for use of the
normal configuration, a modified version of the curved W-beam guardrail terminal system should be used. A modified version has shorter legs along the side of the drive and is designated as type 2, 3, 5, or 6, as shown in the INDOT Standard Drawings. Types 2 and 5 are 6.25 ft (one panel) shorter than the standard version. Types 3 and 6 are 12.5 ft (two panels) shorter than the standard version. The appropriate type should be chosen based on
2012
81
the system radius required to come in contact with the drive radius and the amount of
shortening required by the restricted right of way. The restrictions concerning the location
of the type 5 anchor and the need for additional guardrail in advance of the drive are still
applicable to this situation.
Examples of restricted right of way include avoidance of a wetland or other
environmentally-sensitive area or a lawn. An example of an area where additional right of
way should be purchased to avoid removing guardrail panels is agricultural land. For a 3R
project, the criteria shown in Section 55-5.04(02) Item 5 should be considered. The
guardrail run may be shortened or the guardrail terminal system may be eliminated.
49-9.04 Unfavorable Site Conditions
Site conditions will frequently be encountered which prohibit or restrict the use of these treatments.
The necessary drive or approach relocation, additional right of way, and clearance for each fixed
obstacle should be obtained to provide the suitable protection. If these efforts are not practical, a
project-specific design may be necessary. The Production Management Division’s Roadway
Standards Team should be contacted for assistance.
49-9.05 Median-Shoulder Bridge-Approach Guardrail Length
The length of median-shoulder bridge-approach guardrail is based on the clear-zone requirements
for the roadway. The entire length of the median-shoulder bridge-approach guardrail, exclusive of
the bridge railing transition type TGB, is double faced. The required minimum length is shown in
Figure 49-9F, Median Bridge-Approach Criteria. The flare and offset shown is the desired layout of
the guardrail. The length of bridge-approach guardrail should be recomputed for site conditions
other than those assumed and listed in Figure 49-9F.
49-10.0 GUIDE TO THE ROADSIDE COMPUTER PROGRAM
This Section supplements the information in AASHTO Roadside Design Guide, Appendix A, and
in the README file of the ROADSIDE computer program. It provides more detailed information
and guidance on the use of ROADSIDE and an expanded listing of recommended severity indices
and an example of a sensitivity analysis.
2012
82
49-10.01 Introduction
The program ROADSIDE is a useful tool for highway engineers making decisions for the design of
roadsides and the placement of highway hardware. It aids the designer in selecting an alternative
treatment which offers the greatest anticipated return for safety benefits for funds expended.
ROADSIDE is the microcomputer version in the AASHTO Roadside Design Guide, Cost-
Effectiveness Selection Procedure. The program is written in Quick Basic 4 and is not copyrighted.
Thus, modifications to the program can be made if the user has an understanding of basic
programming and the assembled language of the program.
49-10.01(01) Using ROADSIDE
With the computer turned on, insert the ROADSIDE disk into the CD drive. At the DOS prompt,
change to the appropriate drive, type ROADSIDE and press Enter.
The program then reads the data files containing the lateral extent of encroachment probabilities and
displays a note on the screen to that effect.
The Basic Input Data Screen (Figure 49-10A) and global values are then shown, with an inquiry to
the user regarding the value to be used. If no changes to the basic input data are desired, type N (no)
and press Enter. The severity index versus cost relationship is displayed next for the user's
information. Press Enter to continue.
The Variable Input Data Screen (Figure 49-10B) is the last screen displayed. All data entry occurs
on this screen. To enter data, type the appropriate line number from the left-hand margin and press
Enter. A new screen will then be displayed showing the current value and asking the user to enter
the new value for the field in question. All calculations are automatically made as the user inputs
values for each variable. Whenever an input variable is changed, all calculations using that variable
are automatically made and the new results are displayed.
The Command Menu at the bottom of the Variable Input Data screen identifies the function keys
listed below that are used in ROADSIDE.
2012
83
49-10.01(02) Function Keys
The following function keys are used in the program:
1. Function Key 1. This key will print a copy of the Variable Input Data screen and the
resultant computations. The printout contains some information that does not appear on the
computer screen. The computer screen was modified so all data entry can be made on a
single screen.
2. Function Key 2. This key will store the problem variables and basic input data.
3. Function Key 3. This key will retrieve a previously stored problem. The user will be given
two or three options. If the problem was stored with the original default values, the user
may have the problem recalled to the screen using the default data or using the basic input
data values from the last problem shown on the screen (called the ―current‖ values). If the
problem was stored using altered values, then it may be recalled using those values
(―dataset‖ values), using the ―default‖ values, or using the basic input values that were used
on the last problem shown on the screen (―current‖ values).
4. Function Key 4. This key will let the user access the HELP menu which contains detailed
information on every aspect of ROADSIDE.
5. Function Key 5. This key will display, and allow the user to change, the basic input (global)
values.
6. Function Key 6. This key will display the relationship between severity index and cost as
derived from the accident costs included in the basic input values.
7. Function Key 7. This key will list all file names on the ROADSIDE disk.
8. Function Key 8. This key lists the percentage of accident types included for each severity
index value.
9. Function Key 9. This key will, for computers with graphic display capability only, provide
a sketch of the highway roadside, and hazard parameters. The ―Print Screen‖ key will allow
the user to obtain a hard copy of this sketch if a dot matrix printer is used. A ―daisy wheel‖
will not print correctly.
10. Function Key 10. This key is used to exit the program. No data are stored via this function.
Data should be stored using Function Key 2.
2012
84
49-10.02 Basic Input Data
The first input screen (Figure 49-10A) shows all default values. While these numbers represent the
best judgment of the program developers, the user of this program has the option to change any
default value as deemed appropriate based on new data or on local conditions. If no changes are
made in these variables, the program then prints out accident costs for each severity index based on
the default accident costs by accident type.
The swath width is the effective width of an encroaching vehicle that is not tracking. Although this
width naturally varies depending on vehicular length, width and yaw angle, a width of 12 feet is the
default value used to represent a typical vehicle. The yaw angle, shown in Figure 49-10C, is
defined as the angle between the direction the vehicle is traveling and the direction the vehicle is
pointing. This value may be changed if desired, but it is considered both reasonable and
representative for analysis purposes.
Accident costs are assigned to each of three categories of accidents — fatal, injury and property
damage only (PDO). Injury and PDO accidents are further divided into different levels of severity.
The default values in the program may be changed, but it is recommended that the default values be
used for lack of more current information. Accident costs used in economic evaluations differ
significantly between agencies. The default values in the model were selected as median values.
Should they be changed, the values assigned to these, especially fatal accidents, will have a
significant effect on the numerical values and the calculated cost-benefit ratios, but it will usually
not change the relative ranking of the alternatives being considered. The effect of using one set of
values over another can be assessed using a sensitivity analysis. This procedure is illustrated with
the example problem where the same alternatives are analyzed using the default accident costs
included in Figure 49-10A and with the FHWA-recommended costs from FHWA Technical
Advisory T 7570.1.
49-10.03 Variable Input Data
The second input screen (Figure 49-10B) in the program includes specific roadway and roadside
characteristics that must be entered by the user. The program contains Lateral Extent of
Encroachment Probability tables for 40, 50, 60, and 70 mph, and adjustment coefficients for
horizontal curvature and grade.
The following subsections describe each of the input data and explain how they are used in this
program. Figure 49-10D is provided for quick reference.
2012
85
49-10.03(01) Title
Each alternative or iteration should be assigned a unique title if it will be saved for later retrieval and
comparison to other alternatives. When saving an alternative, a unique file name will also be
required. The title and file name need not be the same.
49-10.03(02) Traffic Volume and Growth
Line Input Data Units
2 Traffic Volume two-way ADT
Growth Rate percent
Enter the current daily 2-way traffic volume and an estimated annual growth rate. The traffic
growth rate is entered as a percentage (0 to 10%). In the absence of other guidance, a traffic-growth
rate of 2.0% is suggested.
The model assumes the characteristics of the highway facility are uninterrupted flow with no
interaction among vehicles in the traffic stream. Once the traffic volume reaches capacity, the
characteristics change to interrupted flow and the volume-encroachment relationship is no longer
valid. Therefore, a default value limits maximum traffic volume to 10,000 vehicles per lane per
day. A volume higher than 10,000 is reduced to 10,000 vehicles per lane per day in the first year
only. The program does not limit or omit a volume which may exceed 10,000 vehicles per lane per
day during the remaining project life. ROADSIDE does not assign traffic to individual lanes on
multi-lane highways. This is discussed in Section 49-10.03(03).
A divided-roadway facility will operate at uninterrupted flow except for peak hours. The 10,000
limit may be too low because the facility will operate at uninterrupted flow the majority of the time.
A higher limit of 15,000 vehicles per lane per day may be used for a divided highway.
Traffic volume is a significant factor for determining user costs; therefore, using accurate volumes
is important. The growth rate usually does not significantly affect the user and agency costs. A
general rate readily available should be used because of this.
2012
86
49-10.03(03) Roadway Type
Line Input Data Units
3 Roadway Type undivided (U), divided (D), one-way (O)
Lanes of Adjacent Traffic number of lanes
Width of Each Lane feet
Enter the type of highway being analyzed. Three options exist — divided, undivided, and one-way.
For undivided highways, encroachments on one side of the road by both adjacent and opposing
traffic are calculated. Encroachments from the opposite direction are not computed on divided and
one-way highways. The number of lanes of adjacent traffic and the width of each lane must also be
entered. Adjacent traffic is defined as all lanes traveling in the same direction on the roadway next
to the obstacle. A 2-lane undivided highway will have one adjacent lane of traffic whereas a 4-lane
divided highway will have two adjacent lanes.
The obstacle can be located in the median or to the right of the traveled way. The model does not
recognize whether the encroachments occur on the inside (median) or outside of the roadway. The
user should treat the median as if it is a roadside. An analysis in the median may also require
separate program runs so that encroachments are considered from both directions.
The total traffic volume is split equally between both directions of travel, except for one-way
roadways or ramps. The directional volume is assigned to the lane closest to the obstacle. In
actuality, there is a distribution of total traffic between the travel and passing lanes for a multi-lane
highway. Most of the traffic in the travel lane will be an additional 12 feet from a hazard located in
the median. Therefore, the number of encroachments may be overestimated for a median-side
analysis, where the lane closest to the obstacle normally carries lighter traffic volume. An analysis
more representative of the actual lane distribution could be obtained by running the program
separately for each lane. Figure 49-10E can be used to select approximate lane distributions for 4-
and 6-lane highways. With each program run, the only input variables that would change are traffic
volume and the distance to the obstacle. An alternative method is to apply the appropriate factor in
Figure 49-10F and Figure 49-10G; this provides the same answer as the sum of separate program
runs.
49-10.03(04) Geometric Adjustment Factors
Line Input Data Units
4 Roadway Curvature Adjustment degrees
Roadway Grade Adjustment percent
2012
87
There are two geometric adjustment factors for the encroachment rate. These are listed below:
1. Roadway Curvature Factor. Curves to the right (for adjacent traffic) are assigned a (+) sign
and can increase the basic encroachment rate by a factor of 2 (maximum) for curves of 6
degrees or sharper. Curves 3 degrees or flatter do not increase the basic rate.
A curve to the left (for adjacent traffic) is assigned a (-) sign and can increase the basic
encroachment rate by a factor of 4 (maximum) for curves of 6 degrees and sharper. A curve
of 3 deg or flatter do not change the basic rate. ROADSIDE selects the appropriate factor
when the degree of curvature is entered.
2. Roadway Grade Factor. Negative grade (downgrade) in the direction of adjacent traffic
increases the basic encroachment rate by a factor of 2 for a 6% or steeper grade. A
downgrade of 2% or less does not affect the basic rate. The appropriate factor is selected
once the grade is entered by the program user.
For example, a tangent highway section 1/3 mile in length with 6,000 AADT will have a
calculated value of 1 encroachment for two years (1/3 mile x 3,000 AADT per direction x
0.0005 encroachment rate x 2 years = 1). This is neglecting opposite direction
encroachments. If that highway section was on a 6-degree curve with a 6% grade, there
would be 8 encroachments on the outside downhill curve [4 (curve factor) x 2 (grade factor)
x 1 encroachment = 8] and 2 encroachments on the inside uphill curve [1 (curve factor) x 2
(grade factor) x 1 encroachment = 2].
49-10.03(05) Encroachment Rate
Using the data up to this point (lines 2, 3 and 4), the program automatically computes the total
number of encroachments. An encroachment begins when a vehicle leaves the roadway (i.e.,
crosses the edge of the travel lane and/or moves onto the shoulder). The number of encroachments
is shown for the total adjacent and opposing traffic (see Figure 49-10B). Adjustments are made for
roadway characteristics (horizontal and vertical alignment) which will increase the number of
encroachments.
The user adjustment factor allows the user to modify the basic rate if there are site specific
conditions or an accident history that warrant a change. The user factor can be used to adjust the
predicted number of encroachments with actual conditions or historical data.
As mentioned earlier, the user factor could be used to adjust for encroachments on multi-lane
highways. This saves a step in running the program once versus several times for each lane.
2012
88
Figures 49-10F and 49-10G provide factors to use for analyzing either the median or outside of
either a 4- or 6-lane highway.
49-10.03(06) Design Speed
Line Input Data Units
6 Design Speed miles per hour
The design speed of the roadway is used to select a lateral-extent-of-encroachment probability
curve. Curves for speeds of 40, 50, 60, and 70 mph are used in the program. For any input speed
less than 40 mph, the 40-mph curve is used; the 50-mph curve is used for speeds between 40 and
50; the 60-mph curve is used for speeds between 50 and 60, and the 70-mph curve is used for
speeds above 60 mph. These curves assume flat side slopes and underestimate the lateral extent of
encroachment when slopes steeper than 10:1 exist. They may also overestimate the lateral distance
a vehicle is likely to travel on a backslope. A design speed lower than the posted speed limit should
not be used. At site specific locations, generally use speeds that closely approximate the actual or
anticipated operating speed of the facility. At certain sites, such as some suburban highway sections
with large peak hour volumes, the average operating speed may not accurately represent the design
speed. In these cases, use the low-volume operating or running speed which represents the most
likely condition for a single vehicle off roadway accident.
49-10.03(07) Hazard Definition
Line Input Data Units
7 Hazard Offset from Driving Lane A, feet
Hazard Length (parallel to road) L, feet
Hazard Width (perpendicular to road) W, feet
ROADSIDE defines a roadside hazard as a rectangle that is laterally offset from the edge of the
driving lane a distance of A feet, is L feet long in the direction of travel, and W feet wide. The
hazard can be a bridge pier, a large box culvert inlet and channel, an embankment, or a traffic
barrier designed to shield a roadside obstacle or non-traversable terrain feature.
Defining the area of concern for multiple obstacles can be difficult. The program should not be run
several times for each obstacle and composite costs added. Such an analysis implies a degree of
accuracy the model lacks. In some cases the hazard may be behind another hazard (i.e., trees behind
traversable ditch, 3:1 slope with trees at bottom, etc). In some cases there may be multiple hazards
(trees on slope, culvert outlet on slope, etc). In defining these hazards, a single program run is
2012
89
accurate enough. This will require the user to select a rectangle that includes all significant hazards,
a procedure similar to defining an area of concern for barrier layout (page 5-32, 1988 AASHTO
Roadside Design Guide). For varying or multiple offset distances, an average offset distance should
be used. The severity index may also need to be adjusted to account for various combinations of
hazards; see Section 49-10.03(09).
User costs are sensitive to the offset distance and length of obstacle. The closer to the roadway and
the longer the obstacle, the bigger the chance for collision. Agency costs are also sensitive to
obstacle length. The width of the obstacle does not significantly influence costs.
49-10.03(08) Collision Frequency
Using the data supplied up to this point (lines 2 through 7), the program calculates the collision
frequency. Once you have defined an object and determined how far it is from the ETL, the number
of vehicles which hit the object is automatically calculated. The expected number of collisions with
the hazard each year is the summation of collisions into the side, corner and longitudinal face of the
hazard by adjacent and (where applicable) opposite-direction traffic. The input screen shows the
initial collision frequency (impacts per year) for the whole object and for each location on the
hazard impacted (face, side and corner). The collision frequency over the life of the project is only
shown on the output screen.
Collision frequency is basically an accident rate for the object’s exposure, because the number of
impacts is determined over the length of the object. For example, a 1,000-ft length of guardrail, 8 ft
from the ETL on a 6,000 ADT 2-lane roadway, will have an estimated number of 0.22926 impacts
for the first year. Over five years, this equates into 1 accident (0.22926 x 5 years) for that 1000-ft
section of guardrail.
49-10.03(09) Severity Index
Line Input Data
9 Severity Index for:
upstream side of hazard (SU)
downstream side of hazard (SD)
upstream corner of hazard (CU)
downstream corner of hazard (CD)
longitudinal face of hazard (FACE)
2012
90
To convert accidents to costs, a severity index (SI) must be assigned to impacts with the hazard.
Essentially, assigning a SI to an object is determining the relative cost per accident. The
relationship between severity index and the percent accident type is shown on page A-12 of the
RDG. For example, assigning a SI of 5.0 for a tree is predicting that resulting impacts will be 8%
fatalities, 77% injuries, 15% PDO. Taking each percentage by accident costs (e.g., 8% x $500,000,
etc.), the predicted cost per accident is $56,535.
ROADSIDE has no capability to select an appropriate SI and is dependent upon the user for this
information. The more severe an object (higher SI), the higher the associated accident costs are.
Once a SI is assigned to an object, the program automatically computes the resultant accident costs.
Impacts into a given object may have different outcomes based on where the vehicle hits.
Therefore, adjustments can be made for impacts into the side of the hazard, the upstream and
downstream (for 2-way traffic) corners of the hazard, and the face of the hazard. These will be
equal for point objects such as trees and utility poles. For barriers, the severity of the accident will
be less for a face impact than for a side or corner hit.
Figures 49-10H through 49-10P have been developed to provide more information to the user.
Accident data was not used to develop the table. To determine SI’s from accident records would
require detailed accident data for each roadside object or obstacle. Unfortunately, accident reports
seldom contain all the information needed to identify the object or obstacle struck in detail. The SI
is a relative value, rather than an absolute or discrete number. It does not represent an impact into a
specific object at the selected design speed, but rather an average estimated impact speed, given the
selected design speed. This means that for most features there will be many low-severity accidents
included. A low-severity accident is one in which a vehicle is nearly stopped before reaching a
feature, or strikes it such that its occupants are not seriously injured. That is why the numbers are
generally lower than the values in the 1977 Barrier Guide, which represented the severity of crashes
at 60 mph. The tables were developed by ranking each common object by speed (e.g., different
types of guardrail, etc).
The severity indices shown on Figures 49-10H through 49-10P incorporate ranges for each
obstacle. The range covers other performance factors beyond those considered in the model. The
user should read the information when selecting a value within the range. The ranking was based
on the anticipated performance and intuitive judgment from engineers with backgrounds in safety,
design and research. Based on historical data of relative relationships (guardrail and slopes,
guardrail and ditches, etc.), the common objects were then compared to one another and
adjustments were made as deemed appropriate. Severity for the sides and corners are assumed to be
the same values shown for the side. Both mean that the severity for the face, corner, and side
impacts are the same. These objects have also been listed in the RDG Appendix A in order of
ascending severity for each speed (40, 50, 60, and 70 mph).
2012
91
There are many cases where different obstacles will appear within the clear area. Each will have its
own relative severity index (e.g., a tree on a 3:1 slope, headwall and culvert opening, curb and
guardrail, culvert opening and 4:1 slope). The severity table could not possibly provide a severity
index for each situation. The combination of hazards adds more uncertainty as to the collision
outcome. Adjustment to the severity index within the given range or even outside the range may be
required.
The severity index is a very significant factor in determining user cost. Designers will need to use
their best judgment in selecting a value. The sensitivity of different values should be analyzed for
their impact on resulting costs. A sensitivity analysis over a range of values would be appropriate
because of the variable’s significance. In any case, the analyst should always apply the test of
reasonableness to the output of ROADSIDE and be wary of using the results to compromise
established safety practices or to justify costly or controversial new safety design practices or
policies.
Actual accident history can be used to determine a cost per accident. One method for determining
an average cost per accident is described in FHWA Technical Advisory T 7570.1, dated June 30,
1988. By using the SI - accident costs relationship, accident costs could be used to find a SI. As
mentioned above in using actual data several gross assumptions need to be made, one of which is
the model’s prediction of collisions versus reported accidents. Not all collisions will result in an
accident. Vehicles may drive away from an impact to a slope or guardrail. An adjustment based on
a ratio of actual accidents to predicted collisions needs to be made on the SI. Additional
information in this area is included in Appendix F in TRB Special Report 214.
49-10.03(10) Project Life and Discount Rate
Line Input Data Units
10 Project Life years
Discount Rate percent
The project life of a roadside design is the useful life of the design and is an input value selected by
the user. The discount rate is also a basic input to the economic analysis. Once these variables are
selected, the program calculates the economic factors needed to complete the analysis. In the
absence of other guidance, a discount rate of 4.0% is suggested.
The project life is the time period from construction to replacement of each alternative. This is also
called the alternative’s useful life and may have a significant effect on the analysis. There are many
situations at a given location where alternatives will have different useful lives. For consistency it
2012
92
would be desirable to establish a common or national figure for useful lives for each alternative.
Such values could not be applied at each situation because of the many uncertainties involved. It is
recommended that the useful life be established for the analysis by using the best information
available to an agency. Typically, 20 years is used; beyond 20 years the accuracy of the predictions
is difficult to estimate. A sensitivity analysis can be used to compare different periods of time for a
given location.
The discount rate usually is not a significant factor in the analysis. High rates favor future
investments and low rates favor current investments. The discount rate is used to reduce various
costs or benefits to their present worth or uniform annual costs so that the economics of different
alternatives can be compared. If the discount rate is set equal to the real interest rate (interest minus
inflation), reasonable values are in the order of 3 to 5 percent.
49-10.03(11) Highway Agency Costs
Line Input Data Units
11 Installation Cost dollars
12 Repair Cost (per accident) dollars
13 Routine Maintenance Cost (per year) dollars
14 Salvage Value dollars
The installation (construction), repair, maintenance and salvage value costs are the final basic inputs
to the program. Once this information is provided, total present worth and annualized costs and
highway agency present worth and annualized costs are computed. This is the output of the
program, which enables the design engineer to make direct comparisons between several proposed
alternative safety treatments.
Direct costs include construction, maintenance, repair and salvage. The most important of these
costs is construction cost. Because this is a significant factor, the construction cost used in the
analysis should be current and can be obtained from the latest INDOT Catalog of Unit Price
Averages for Roads - Bridges - Traffic. A sensitivity analysis comparing variations in cost may be
desirable.
Routine repair costs for a number of different types of barriers, end treatments and crash cushions
are shown in Figure 49-10Q. These should be used to estimate the repair costs for these items
unless better information is available.
Due to subjectivity and difficulty of determining routine maintenance costs and salvage values, the
user can typically assume these to be $0 (or zero).
2012
93
49-10.04 Analysis Methods
The three common methods used to compare alternative proposals in an economic analysis are as
follows:
1. comparison of present worth of costs;
2. comparison of equivalent uniform annual cost; and
3. benefit/cost ratio.
When properly applied and when the results are properly interpreted, each method will lead to the
selection of the same project as being the most economically advantageous. Each alternative must
be compared with the others to determine the best selection when more than two alternatives are
being compared.
In the present worth method (PW), the objective is to compare the present worth of all cash flows
for a selected time period. The alternative having the minimum present worth is normally the best
selection. The present worth represents the sum which would be required in the base year to finance
all future expenditures (agency and user’s) during the project life. ROADSIDE automatically
computes the total present worth for each alternative. The analysis period for which the present
worth costs are calculated must be equal for all alternatives.
In the equivalent uniform annual cost method (EUAC), all alternatives are compared on the basis of
their equivalent uniform annual cost. The alternative having the minimum total EUAC is most
often the selection of choice. ROADSIDE automatically computes the EUAC for each alternative.
Comparison of alternatives with different analysis periods can be made. This is assuming
construction replacement costs are the same in the future.
The benefit/cost ratio method measures the ratio of expected benefits to cost. These costs are
usually expressed as a EUAC. The B/C ratio method is an incremental solution; i.e., it compares the
differences of a pair of alternatives. Usually alternatives which include a safety improvement are
compared with existing conditions (i.e., do nothing). Benefits are the reduction in accident costs
(accident costs for do nothing minus accident costs for the improvement). Costs for the B/C ratio
would be agency costs for that improvement.
2012
94
49-10.05 Sensitivity Analysis
There are many factors which influence traffic safety policies and the development of safety
programs. Rational decision-making processes combined with a cost-effective analysis are of
crucial importance in the choice between competing social and economic goals. The cost-effective
selection procedures provide a basic tool to compare alternative roadside improvements at site-
specific locations. It was intended for evaluating improvements to either reduce the chances of a
crash (remove or relocate) or reduce the severity (retrofit or shield). The decision between doing
nothing and safety improvements is another question. Existing policies and standards are the
overriding force in this area. ROADSIDE provides a basic tool for comparing alternative
improvement options at specific locations. However, it is a probability model and the ranking of
options should be viewed as a relative ranking only. Furthermore, the program is extremely
sensitive to the selection of a severity index and to the costs assigned to each general type of
accident.
Sensitivity is the relative effect that a variable may have on the decision. The sensitivity of each
input variable on the user and agency costs are summarized in Figure 49-10R. Use of the computer
program makes it relatively easy to vary an input variable. It may be desirable to test the effects of
variations of the significant input variables on the selection of an alternative.
49-10.06 Examples
These examples are from the Federal Highway Administration’s August 1991 SUPPLEMENTAL
INFORMATION FOR USE WITH THE ROADSIDE COMPUTER PROGRAM. The options
considered in these examples may not always correspond to those required by INDOT policy.
* * * * * * * * * *
Example 49-10.1 Culvert and protruding headwall.
Use the example problem (provided in the AASHTO RDG, Appendix A) and check the effects of
changing accident costs and severity.
Design options: Option 1 - do nothing
Option 2 - shield the culvert
Option 3 - extend the culvert
Option 4 - modify culvert inlet/outlet
2012
95
Sensitivity Analysis:
1. See how a change in accident costs affects the outcome (RDG default values vs. FHWA T
7570.1 values)
FHWA T 7570.1: Fatal accident = $ 1,500,000
Injury = $39,000 - $12,000 - $6,000
PDO = $2,000
2. See how changes in severity indices affect the outcome (RDG SI values vs. suggested SI
values in this Section).
Summary:
1. Accident Cost. Annualized cost using RDG accident cost default values.
Alternatives Accident Cost Agency Cost Total Cost B/C Ratio
Option 1 $2,060 $0 $2,060 n/a
Option 2 $858 $392 $1,250 3.1
Option 3 $225 $625 $850 2.9
Option 4 $591 $441 $1,032 3.3
Annualized Cost for FHWA T 7570.1 accident cost values.
Alternatives Accident Cost Agency Cost Total Cost B/C Ratio
Option 1 $4,966 $0 $4,966 n/a
Option 2 $1,661 $392 $2,053 8.4
Option 3 $542 $625 $1,167 7.1
Option 4 $1,240 $441 $1,681 8.4
Discussion:
The sensitivity analysis shows that increasing the accident cost would increase the benefit-
cost (B/C) ratio 2 to 3 times. The benefit (reduced accidents from existing condition -
Option 1) increases for each option because of the higher relative accident cost. In most
cases, using a higher accident cost will not change the order of which option has the highest
2012
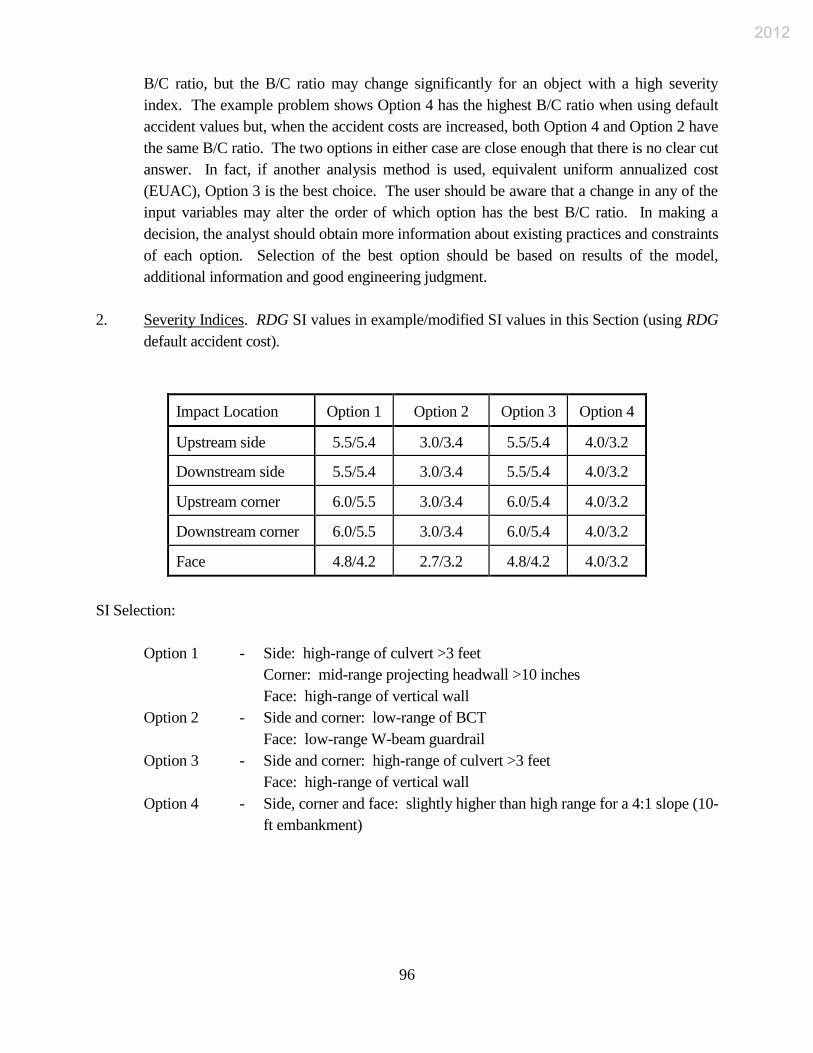
96
B/C ratio, but the B/C ratio may change significantly for an object with a high severity
index. The example problem shows Option 4 has the highest B/C ratio when using default
accident values but, when the accident costs are increased, both Option 4 and Option 2 have
the same B/C ratio. The two options in either case are close enough that there is no clear cut
answer. In fact, if another analysis method is used, equivalent uniform annualized cost
(EUAC), Option 3 is the best choice. The user should be aware that a change in any of the
input variables may alter the order of which option has the best B/C ratio. In making a
decision, the analyst should obtain more information about existing practices and constraints
of each option. Selection of the best option should be based on results of the model,
additional information and good engineering judgment.
2. Severity Indices. RDG SI values in example/modified SI values in this Section (using RDG
default accident cost).
Impact Location Option 1 Option 2 Option 3 Option 4
Upstream side 5.5/5.4 3.0/3.4 5.5/5.4 4.0/3.2
Downstream side 5.5/5.4 3.0/3.4 5.5/5.4 4.0/3.2
Upstream corner 6.0/5.5 3.0/3.4 6.0/5.4 4.0/3.2
Downstream corner 6.0/5.5 3.0/3.4 6.0/5.4 4.0/3.2
Face 4.8/4.2 2.7/3.2 4.8/4.2 4.0/3.2
SI Selection:
Option 1 - Side: high-range of culvert >3 feet
Corner: mid-range projecting headwall >10 inches
Face: high-range of vertical wall
Option 2 - Side and corner: low-range of BCT
Face: low-range W-beam guardrail
Option 3 - Side and corner: high-range of culvert >3 feet
Face: high-range of vertical wall
Option 4 - Side, corner and face: slightly higher than high range for a 4:1 slope (10-
ft embankment)
2012
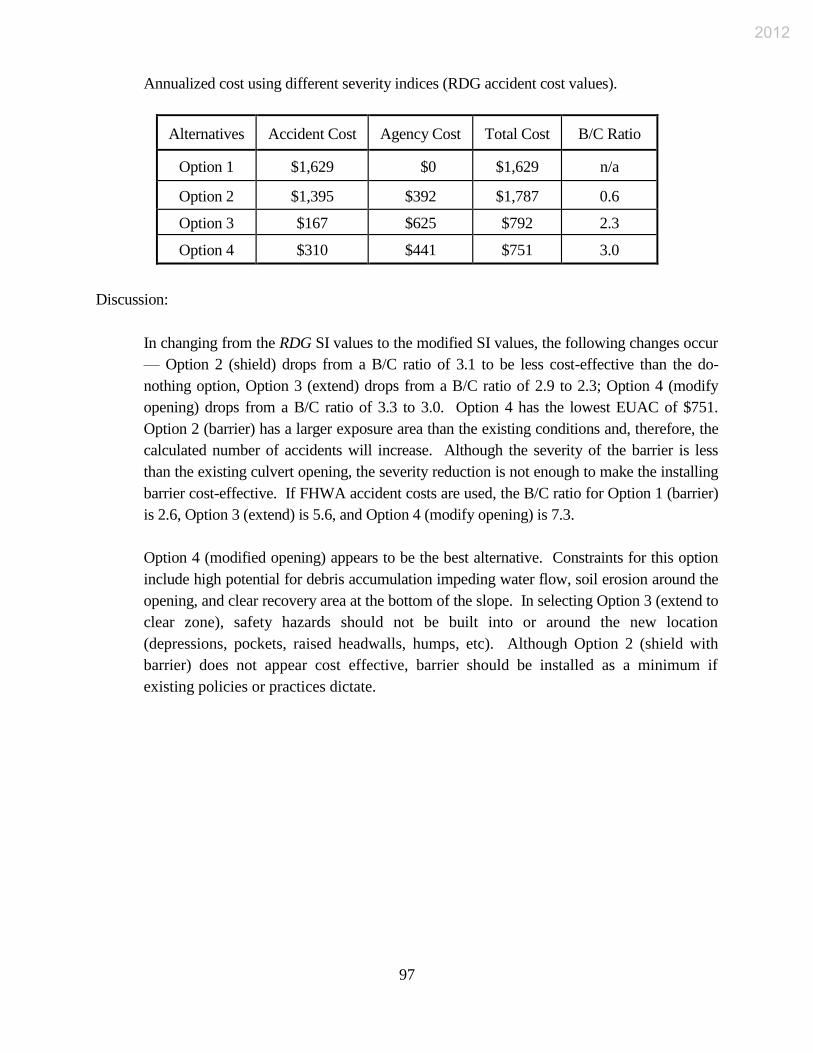
97
Annualized cost using different severity indices (RDG accident cost values).
Alternatives Accident Cost Agency Cost Total Cost B/C Ratio
Option 1 $1,629 $0 $1,629 n/a
Option 2 $1,395 $392 $1,787 0.6
Option 3 $167 $625 $792 2.3
Option 4 $310 $441 $751 3.0
Discussion:
In changing from the RDG SI values to the modified SI values, the following changes occur
— Option 2 (shield) drops from a B/C ratio of 3.1 to be less cost-effective than the do-
nothing option, Option 3 (extend) drops from a B/C ratio of 2.9 to 2.3; Option 4 (modify
opening) drops from a B/C ratio of 3.3 to 3.0. Option 4 has the lowest EUAC of $751.
Option 2 (barrier) has a larger exposure area than the existing conditions and, therefore, the
calculated number of accidents will increase. Although the severity of the barrier is less
than the existing culvert opening, the severity reduction is not enough to make the installing
barrier cost-effective. If FHWA accident costs are used, the B/C ratio for Option 1 (barrier)
is 2.6, Option 3 (extend) is 5.6, and Option 4 (modify opening) is 7.3.
Option 4 (modified opening) appears to be the best alternative. Constraints for this option
include high potential for debris accumulation impeding water flow, soil erosion around the
opening, and clear recovery area at the bottom of the slope. In selecting Option 3 (extend to
clear zone), safety hazards should not be built into or around the new location
(depressions, pockets, raised headwalls, humps, etc). Although Option 2 (shield with
barrier) does not appear cost effective, barrier should be installed as a minimum if
existing policies or practices dictate.
2012
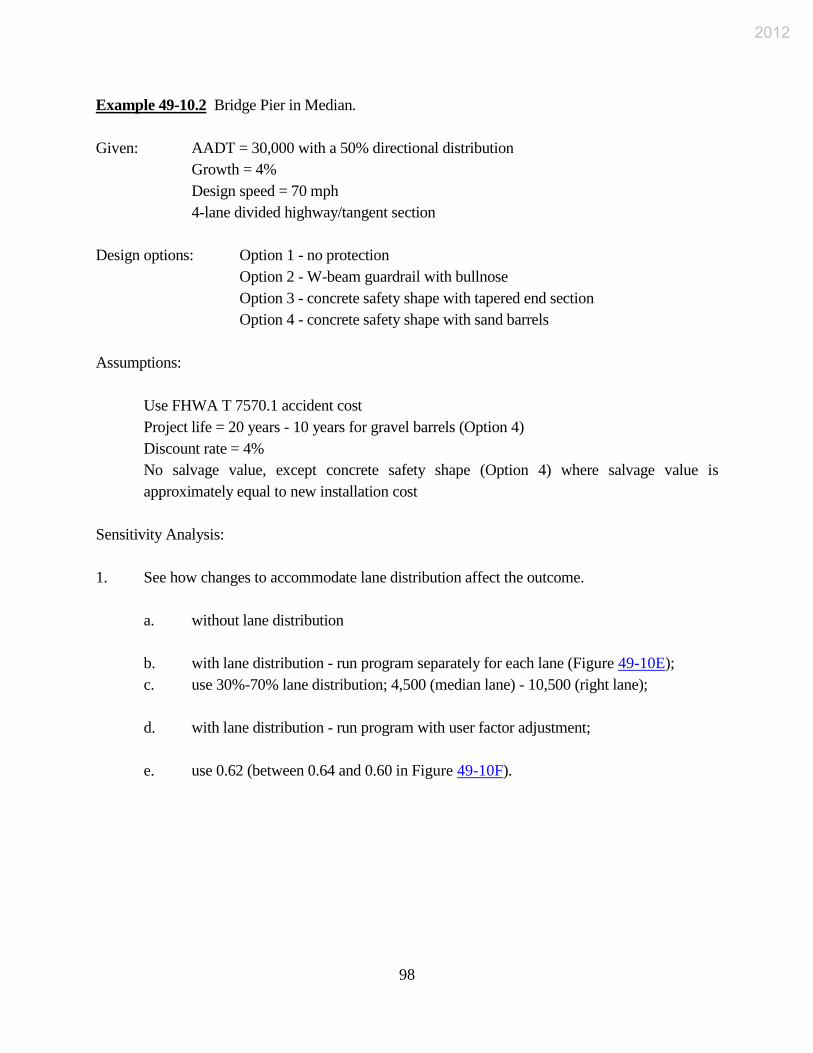
98
Example 49-10.2 Bridge Pier in Median.
Given: AADT = 30,000 with a 50% directional distribution
Growth = 4%
Design speed = 70 mph
4-lane divided highway/tangent section
Design options: Option 1 - no protection
Option 2 - W-beam guardrail with bullnose
Option 3 - concrete safety shape with tapered end section
Option 4 - concrete safety shape with sand barrels
Assumptions:
Use FHWA T 7570.1 accident cost
Project life = 20 years - 10 years for gravel barrels (Option 4)
Discount rate = 4%
No salvage value, except concrete safety shape (Option 4) where salvage value is
approximately equal to new installation cost
Sensitivity Analysis:
1. See how changes to accommodate lane distribution affect the outcome.
a. without lane distribution
b. with lane distribution - run program separately for each lane (Figure 49-10E);
c. use 30%-70% lane distribution; 4,500 (median lane) - 10,500 (right lane);
d. with lane distribution - run program with user factor adjustment;
e. use 0.62 (between 0.64 and 0.60 in Figure 49-10F).
2012
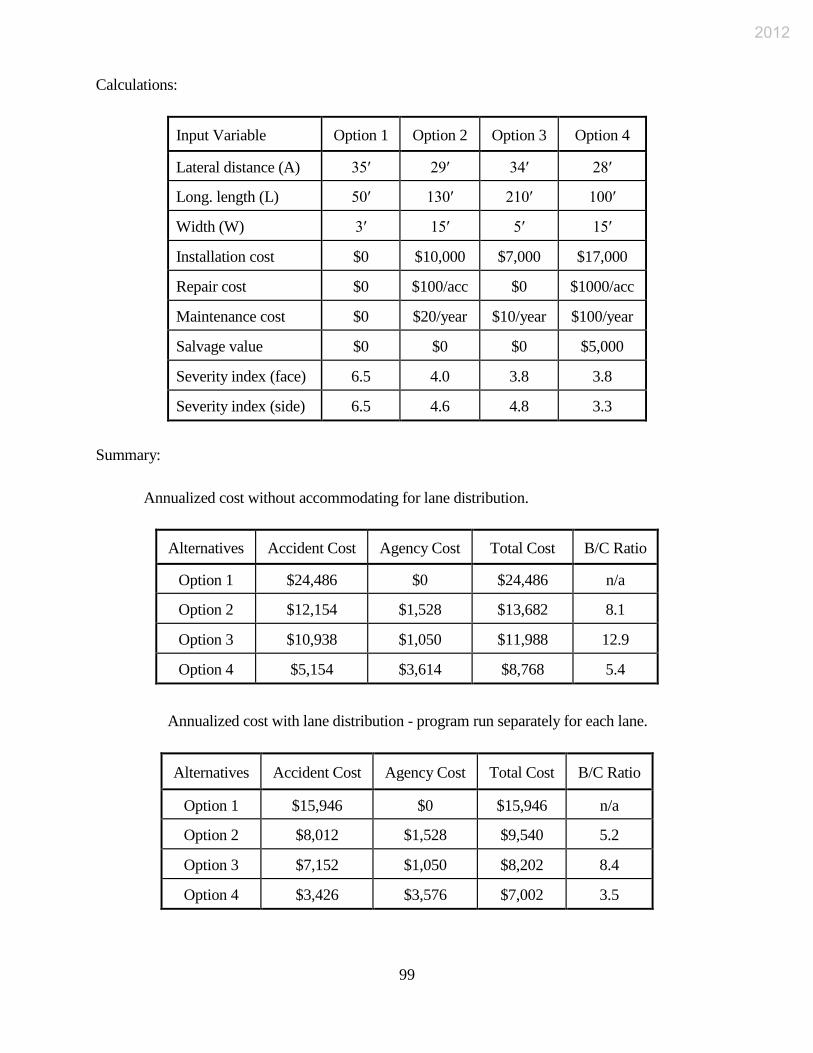
99
Calculations:
Input Variable Option 1 Option 2 Option 3 Option 4
Lateral distance (A) 35′ 29′ 34′ 28′
Long. length (L) 50′ 130′ 210′ 100′
Width (W) 3′ 15′ 5′ 15′
Installation cost $0 $10,000 $7,000 $17,000
Repair cost $0 $100/acc $0 $1000/acc
Maintenance cost $0 $20/year $10/year $100/year
Salvage value $0 $0 $0 $5,000
Severity index (face) 6.5 4.0 3.8 3.8
Severity index (side) 6.5 4.6 4.8 3.3
Summary:
Annualized cost without accommodating for lane distribution.
Alternatives Accident Cost Agency Cost Total Cost B/C Ratio
Option 1 $24,486 $0 $24,486 n/a
Option 2 $12,154 $1,528 $13,682 8.1
Option 3 $10,938 $1,050 $11,988 12.9
Option 4 $5,154 $3,614 $8,768 5.4
Annualized cost with lane distribution - program run separately for each lane.
Alternatives Accident Cost Agency Cost Total Cost B/C Ratio
Option 1 $15,946 $0 $15,946 n/a
Option 2 $8,012 $1,528 $9,540 5.2
Option 3 $7,152 $1,050 $8,202 8.4
Option 4 $3,426 $3,576 $7,002 3.5
2012
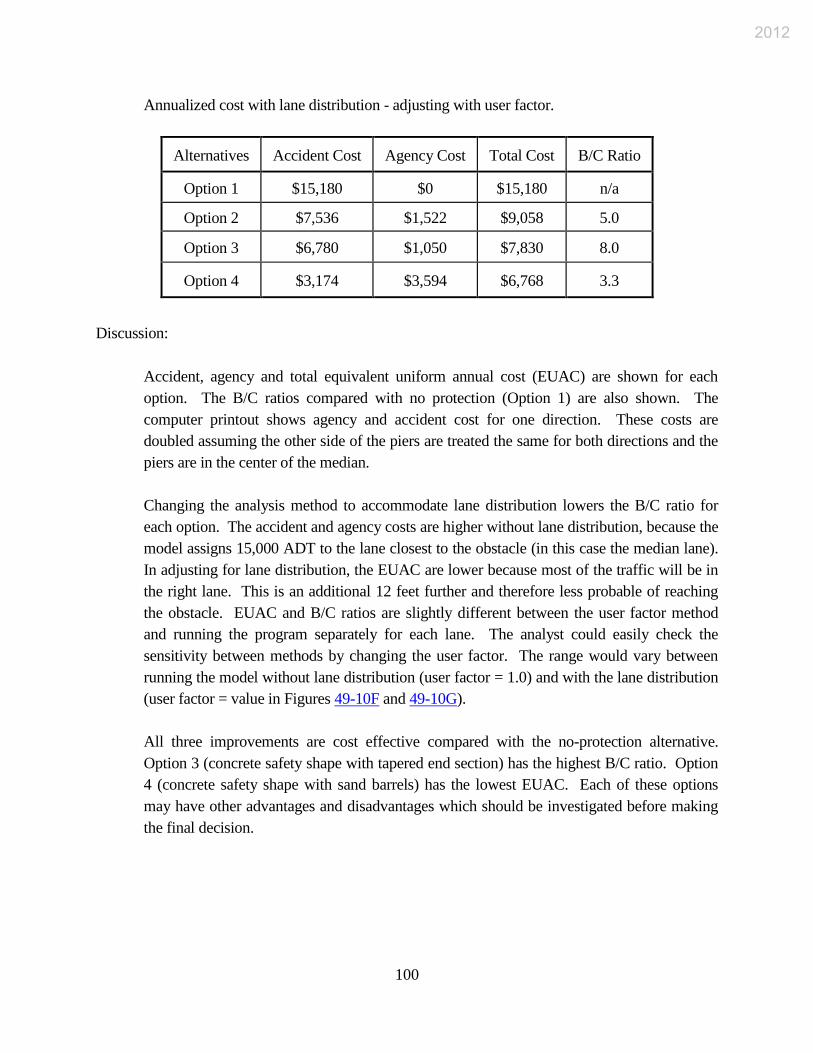
100
Annualized cost with lane distribution - adjusting with user factor.
Alternatives Accident Cost Agency Cost Total Cost B/C Ratio
Option 1 $15,180 $0 $15,180 n/a
Option 2 $7,536 $1,522 $9,058 5.0
Option 3 $6,780 $1,050 $7,830 8.0
Option 4 $3,174 $3,594 $6,768 3.3
Discussion:
Accident, agency and total equivalent uniform annual cost (EUAC) are shown for each
option. The B/C ratios compared with no protection (Option 1) are also shown. The
computer printout shows agency and accident cost for one direction. These costs are
doubled assuming the other side of the piers are treated the same for both directions and the
piers are in the center of the median.
Changing the analysis method to accommodate lane distribution lowers the B/C ratio for
each option. The accident and agency costs are higher without lane distribution, because the
model assigns 15,000 ADT to the lane closest to the obstacle (in this case the median lane).
In adjusting for lane distribution, the EUAC are lower because most of the traffic will be in
the right lane. This is an additional 12 feet further and therefore less probable of reaching
the obstacle. EUAC and B/C ratios are slightly different between the user factor method
and running the program separately for each lane. The analyst could easily check the
sensitivity between methods by changing the user factor. The range would vary between
running the model without lane distribution (user factor = 1.0) and with the lane distribution
(user factor = value in Figures 49-10F and 49-10G).
All three improvements are cost effective compared with the no-protection alternative.
Option 3 (concrete safety shape with tapered end section) has the highest B/C ratio. Option
4 (concrete safety shape with sand barrels) has the lowest EUAC. Each of these options
may have other advantages and disadvantages which should be investigated before making
the final decision.
2012
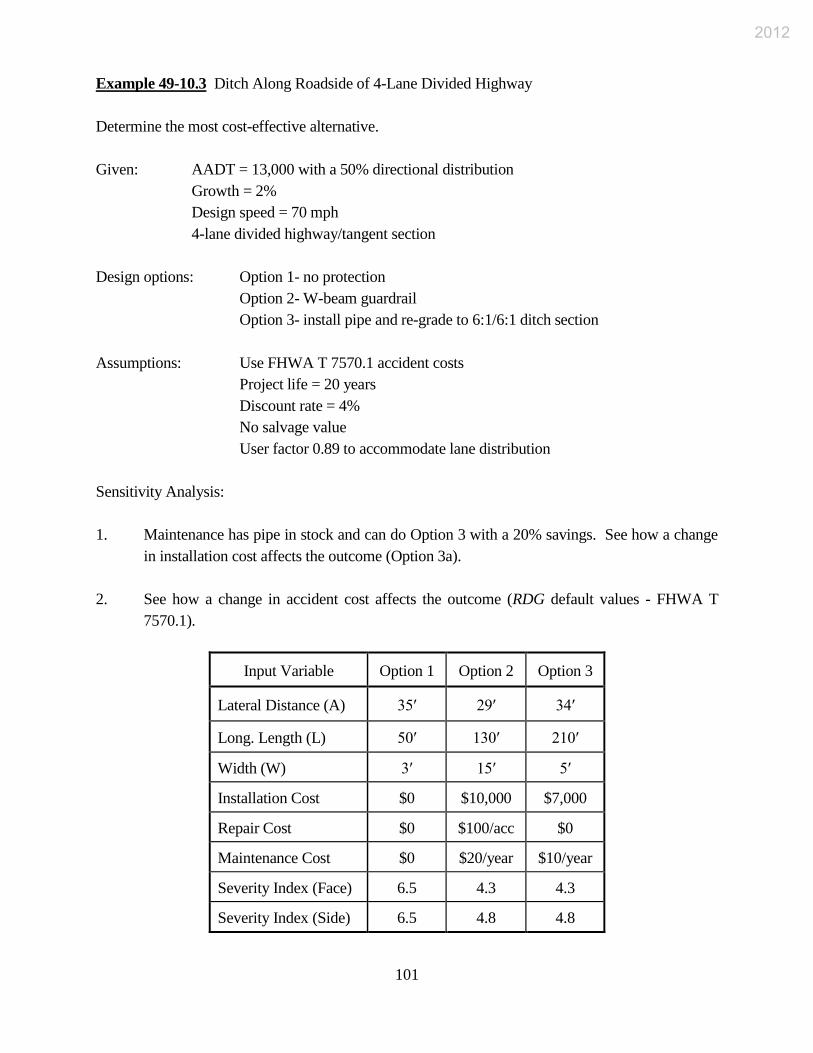
101
Example 49-10.3 Ditch Along Roadside of 4-Lane Divided Highway
Determine the most cost-effective alternative.
Given: AADT = 13,000 with a 50% directional distribution
Growth = 2%
Design speed = 70 mph
4-lane divided highway/tangent section
Design options: Option 1- no protection
Option 2- W-beam guardrail
Option 3- install pipe and re-grade to 6:1/6:1 ditch section
Assumptions: Use FHWA T 7570.1 accident costs
Project life = 20 years
Discount rate = 4%
No salvage value
User factor 0.89 to accommodate lane distribution
Sensitivity Analysis:
1. Maintenance has pipe in stock and can do Option 3 with a 20% savings. See how a change
in installation cost affects the outcome (Option 3a).
2. See how a change in accident cost affects the outcome (RDG default values - FHWA T
7570.1).
Input Variable Option 1 Option 2 Option 3
Lateral Distance (A) 35′ 29′ 34′
Long. Length (L) 50′ 130′ 210′
Width (W) 3′ 15′ 5′
Installation Cost $0 $10,000 $7,000
Repair Cost $0 $100/acc $0
Maintenance Cost $0 $20/year $10/year
Severity Index (Face) 6.5 4.3 4.3
Severity Index (Side) 6.5 4.8 4.8
2012
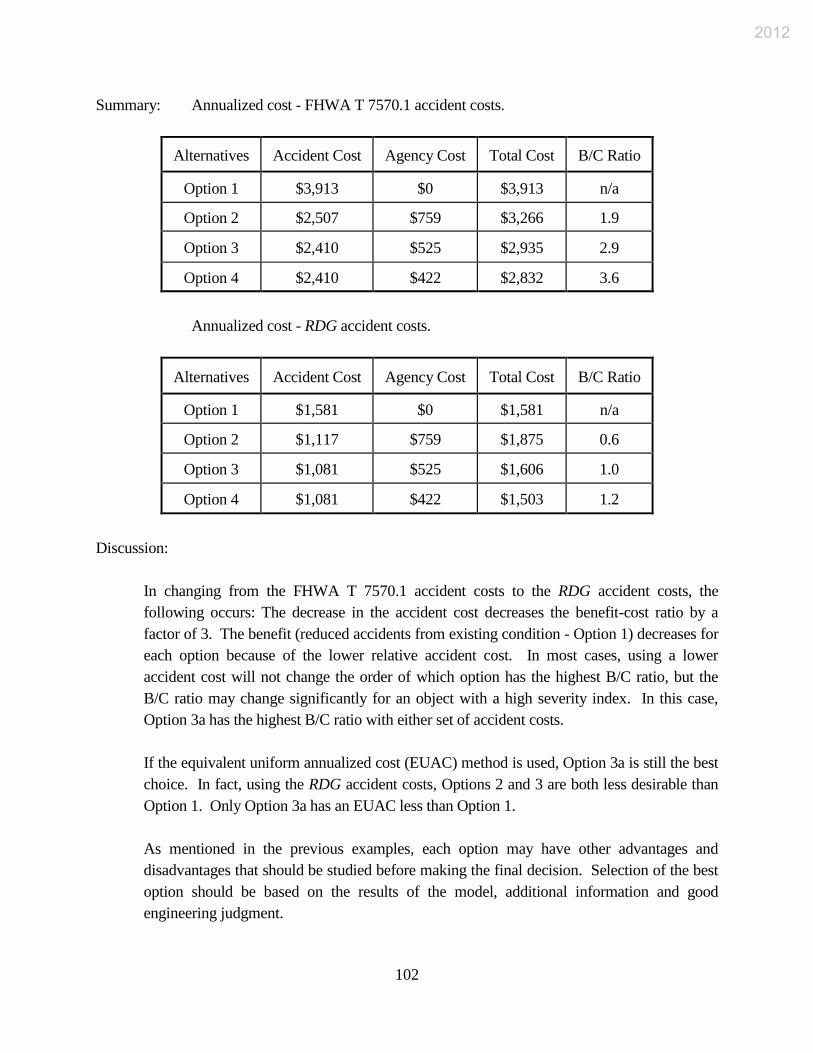
102
Summary: Annualized cost - FHWA T 7570.1 accident costs.
Alternatives Accident Cost Agency Cost Total Cost B/C Ratio
Option 1 $3,913 $0 $3,913 n/a
Option 2 $2,507 $759 $3,266 1.9
Option 3 $2,410 $525 $2,935 2.9
Option 4 $2,410 $422 $2,832 3.6
Annualized cost - RDG accident costs.
Alternatives Accident Cost Agency Cost Total Cost B/C Ratio
Option 1 $1,581 $0 $1,581 n/a
Option 2 $1,117 $759 $1,875 0.6
Option 3 $1,081 $525 $1,606 1.0
Option 4 $1,081 $422 $1,503 1.2
Discussion:
In changing from the FHWA T 7570.1 accident costs to the RDG accident costs, the
following occurs: The decrease in the accident cost decreases the benefit-cost ratio by a
factor of 3. The benefit (reduced accidents from existing condition - Option 1) decreases for
each option because of the lower relative accident cost. In most cases, using a lower
accident cost will not change the order of which option has the highest B/C ratio, but the
B/C ratio may change significantly for an object with a high severity index. In this case,
Option 3a has the highest B/C ratio with either set of accident costs.
If the equivalent uniform annualized cost (EUAC) method is used, Option 3a is still the best
choice. In fact, using the RDG accident costs, Options 2 and 3 are both less desirable than
Option 1. Only Option 3a has an EUAC less than Option 1.
As mentioned in the previous examples, each option may have other advantages and
disadvantages that should be studied before making the final decision. Selection of the best
option should be based on the results of the model, additional information and good
engineering judgment.
2012
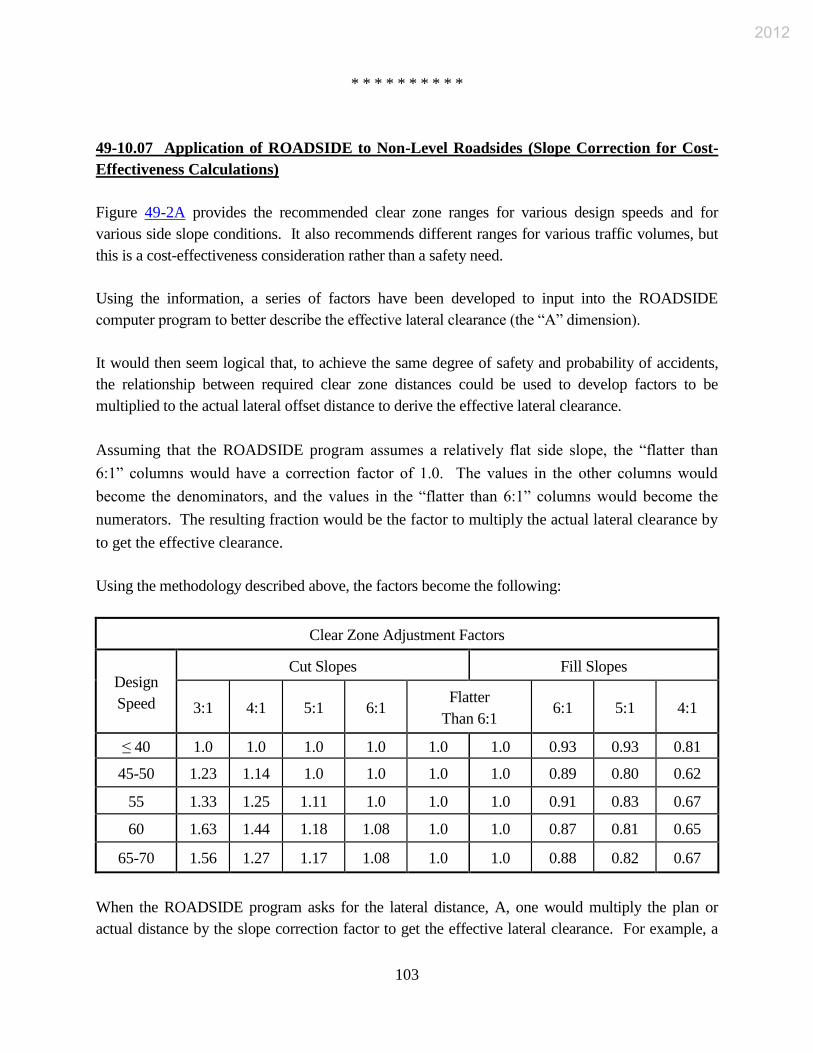
103
* * * * * * * * * *
49-10.07 Application of ROADSIDE to Non-Level Roadsides (Slope Correction for Cost-
Effectiveness Calculations)
Figure 49-2A provides the recommended clear zone ranges for various design speeds and for
various side slope conditions. It also recommends different ranges for various traffic volumes, but
this is a cost-effectiveness consideration rather than a safety need.
Using the information, a series of factors have been developed to input into the ROADSIDE
computer program to better describe the effective lateral clearance (the ―A‖ dimension).
It would then seem logical that, to achieve the same degree of safety and probability of accidents,
the relationship between required clear zone distances could be used to develop factors to be
multiplied to the actual lateral offset distance to derive the effective lateral clearance.
Assuming that the ROADSIDE program assumes a relatively flat side slope, the ―flatter than
6:1‖ columns would have a correction factor of 1.0. The values in the other columns would
become the denominators, and the values in the ―flatter than 6:1‖ columns would become the
numerators. The resulting fraction would be the factor to multiply the actual lateral clearance by
to get the effective clearance.
Using the methodology described above, the factors become the following:
Clear Zone Adjustment Factors
Design
Speed
Cut Slopes Fill Slopes
3:1 4:1 5:1 6:1 Flatter
Than 6:1 6:1 5:1 4:1
≤ 40 1.0 1.0 1.0 1.0 1.0 1.0 0.93 0.93 0.81
45-50 1.23 1.14 1.0 1.0 1.0 1.0 0.89 0.80 0.62
55 1.33 1.25 1.11 1.0 1.0 1.0 0.91 0.83 0.67
60 1.63 1.44 1.18 1.08 1.0 1.0 0.87 0.81 0.65
65-70 1.56 1.27 1.17 1.08 1.0 1.0 0.88 0.82 0.67
When the ROADSIDE program asks for the lateral distance, A, one would multiply the plan or
actual distance by the slope correction factor to get the effective lateral clearance. For example, a
2012
104
fixed object located 16 feet off the traveled way on a 5:1 fill slope on a highway with a design speed
of 45 mph would be effectively 16 ft x 0.80 or 12.8 ft away. The 12.8 ft should be the value used
for cost-effectiveness calculations.
49-11.0 ASSUMPTIONS FOR EMBANKMENT WARRANT FIGURES
The Figures 49-3B series provides warrants for guardrail on an embankment based on embankment
height, slope, and design-year AADT. These figures were developed using the computer program
ROADSIDE, as described in Section 49-10.0. This Section discusses the variables and assumptions
that were used to develop the Figures 49-3B series. The line numbers listed below refer to the line
numbers for imputing data into ROADSIDE; see Figure 49-10B. The following steps were used in
the calculations.
1. Guardrail Calculations. ROADSIDE was first used to determine the present worth of
providing guardrail along a 100-ft embankment. In addition to the following, Figures 49-
11A through Figure 49-11F provide the assumptions used to develop these figures.
a. Line 2. Figures 49-11A through 49-11F provide the design-year traffic volumes
selected by the Department. The current traffic volumes were used in the program.
A 2% traffic growth factor per year was assumed.
b. Line 3. The calculations were run assuming a 2-lane, undivided facility with 12-ft
width travel lanes.
c. Line 4. The roadway was assumed to be on a tangent and in level terrain.
d. Line 6. The English-units design speed was used.
e. Line 7. The lateral location of the guardrail from the edge of the travel lane was
assumed to be 10 ft for AADT between 700 and 1500, and 42 ft for AADT greater
than 1500. The longitudinal length of the guardrail was calculated to be 1000 ft +
2*LR, where LR is from Figure 49-4E. The width of guardrail was assumed to be 2
ft.
f. Line 9. The severity indices from Figures 49-10H and 49-10 I for the guardrail face
and the terminal ends were interpolated. The interpolations are shown in Figure 49-
11G, Severity Indices. For an AADT less than 6000 and a design speed of 45 mph
or lower, a buried-end terminal was used. For an AADT of 6000 or greater and a
2012
105
design speed of 50 mph or higher, a FHWA approved proprietary guardrail end
treatment (CAT) was assumed. No corner impacts were assumed.
g. Line 10. The project life for the guardrail installation was assumed to be 10 years
with a 4% discount rate.
h. Line 11. The installation cost varies according to the design speed and AADT; see
Figures 49-11A through 49-11F. Installation costs were taken from the INDOT
Catalog of Unit Price Averages for Roads - Bridges - Traffic.
i. Line 12. The repairs costs in Figure 49-10Q were used.
j. Line 13. No maintenance costs were assumed.
k. Line 14. No salvage value was assumed.
2. Embankment Calculations. ROADSIDE was also used to determine an equivalent
embankment severity index for an embankment without guardrail. The severity index for
the embankment was selected to match the present worth of the guardrail using the
assumptions in Figures 49-11A through 49-11F and the following:
a. Line 2. Figures 49-11A through 49-11F provide the design-year traffic volumes
selected by the Department. The current traffic volumes were used in the program.
A 2% traffic growth factor per year was assumed.
b. Line 3. The calculations were run assuming a 2-lane, undivided facility with 12-ft
width travel lanes.
c. Line 4. The roadway was assumed to be on a tangent and in level terrain.
d. Line 6. The English-units design speed was used.
e. Line 7. The lateral location of the embankment from the edge of the travel lane was
assumed to be10 ft for AADT between 700 and 1500, and 12 ft for AADT greater
than 1500. The embankment was assumed to be 1000 ft long. For calculation
purposes, the width of the embankment was assumed to be 25 ft.
f. Line 9. For an embankment, the severity index was selected to match the present
worth for the guardrail installation.
2012
106
g. Line 10. The project life for the embankment was assumed to be 20 years with a 4%
discount rate.
h. Line 11. No installation costs were assumed because the embankment would also be
in place for guardrail installations.
i. Line 12. No repairs costs were assumed.
j. Line 13. No maintenance costs were assumed.
k. Line 14. No salvage value was assumed.
3. Slope Equivalents. Using Figure 49-10K and interpolating for the metric-units design
speed, the slope indices were developed and are provided in Figure 49-11G, Severity
Indices. The higher-range indices were assumed to be for an embankment height of at least
5.0 m. The midrange indices were assumed to be for a height of 6.5 ft. The lower-range
indices were assumed to be for an embankment height of 1.5 ft. Using Figure 49-11G and
the equivalent embankment severity index shown in Figures 49-11A through 49-11F, the
equivalent slope can be determined for each embankment height and AADT.
3. Data Plotting. The data points determined in Step 3 were used to develop the Figures 49-3B
series. AASHTO Roadside Design Guide Figure 5.1 was also imposed on the charts as a
lower boundary for where guardrail is required. The AADT of 18,000 was assumed to be
the maximum traffic volume that can be reasonably obtained on a 2-lane facility and,
therefore, is considered to be a lower boundary.
2012
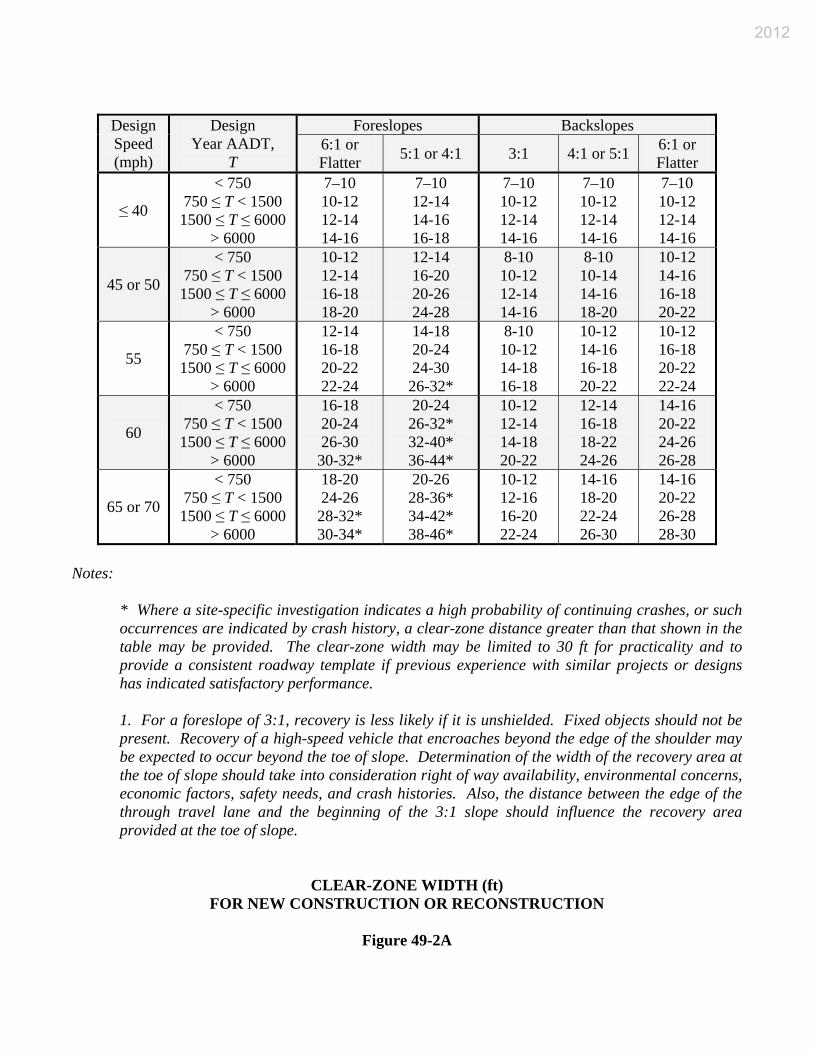
Foreslopes Backslopes Design
Speed (mph)
Design Year AADT,
T 6:1 or Flatter 5:1 or 4:1 3:1 4:1 or 5:1 6:1 or
Flatter
≤ 40
< 750 750 ≤ T < 1500 1500 ≤ T ≤ 6000
> 6000
7–10 10-12 12-14 14-16
7–10 12-14 14-16 16-18
7–10 10-12 12-14 14-16
7–10 10-12 12-14 14-16
7–10 10-12 12-14 14-16
45 or 50
< 750 750 ≤ T < 1500 1500 ≤ T ≤ 6000
> 6000
10-12 12-14 16-18 18-20
12-14 16-20 20-26 24-28
8-10 10-12 12-14 14-16
8-10 10-14 14-16 18-20
10-12 14-16 16-18 20-22
55
< 750 750 ≤ T < 1500 1500 ≤ T ≤ 6000
> 6000
12-14 16-18 20-22 22-24
14-18 20-24 24-30 26-32*
8-10 10-12 14-18 16-18
10-12 14-16 16-18 20-22
10-12 16-18 20-22 22-24
60
< 750 750 ≤ T < 1500 1500 ≤ T ≤ 6000
> 6000
16-18 20-24 26-30 30-32*
20-24 26-32* 32-40* 36-44*
10-12 12-14 14-18 20-22
12-14 16-18 18-22 24-26
14-16 20-22 24-26 26-28
65 or 70
< 750 750 ≤ T < 1500 1500 ≤ T ≤ 6000
> 6000
18-20 24-26 28-32* 30-34*
20-26 28-36* 34-42* 38-46*
10-12 12-16 16-20 22-24
14-16 18-20 22-24 26-30
14-16 20-22 26-28 28-30
Notes:
* Where a site-specific investigation indicates a high probability of continuing crashes, or such occurrences are indicated by crash history, a clear-zone distance greater than that shown in the table may be provided. The clear-zone width may be limited to 30 ft for practicality and to provide a consistent roadway template if previous experience with similar projects or designs has indicated satisfactory performance.
1. For a foreslope of 3:1, recovery is less likely if it is unshielded. Fixed objects should not be present. Recovery of a high-speed vehicle that encroaches beyond the edge of the shoulder may be expected to occur beyond the toe of slope. Determination of the width of the recovery area at the toe of slope should take into consideration right of way availability, environmental concerns, economic factors, safety needs, and crash histories. Also, the distance between the edge of the through travel lane and the beginning of the 3:1 slope should influence the recovery area provided at the toe of slope.
CLEAR-ZONE WIDTH (ft) FOR NEW CONSTRUCTION OR RECONSTRUCTION
Figure 49-2A
2012
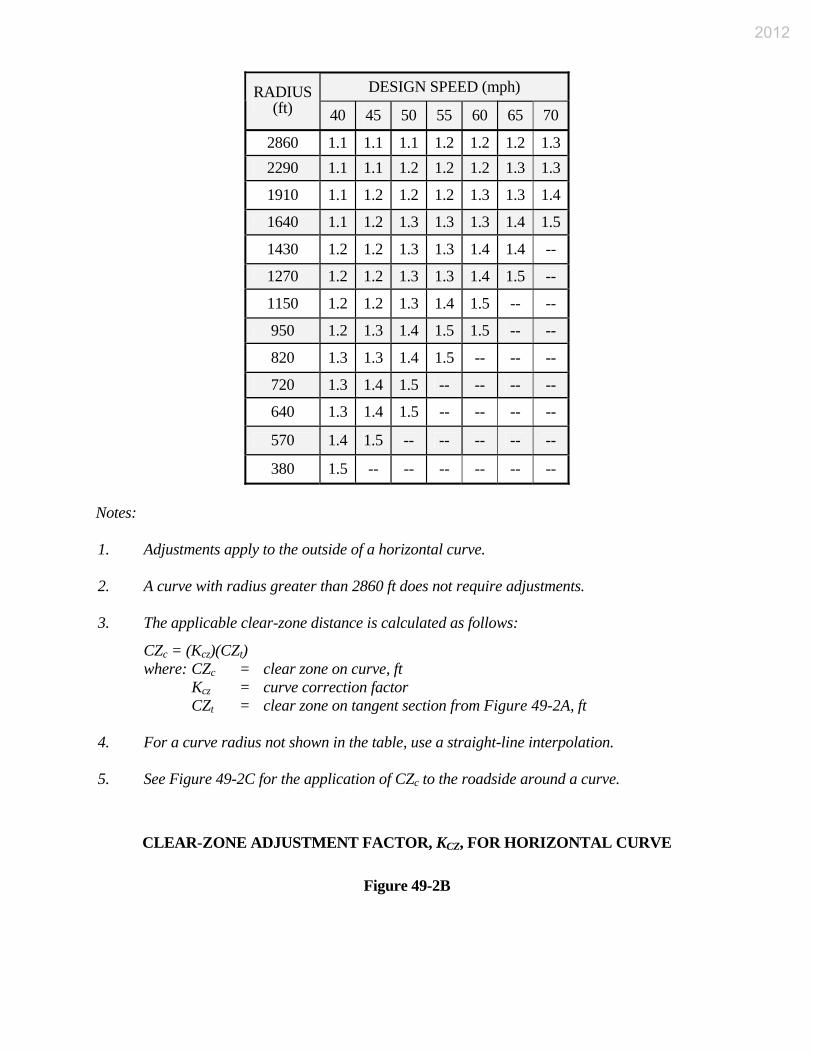
DESIGN SPEED (mph) RADIUS (ft) 40 45 50 55 60 65 70
2860 1.1 1.1 1.1 1.2 1.2 1.2 1.32290 1.1 1.1 1.2 1.2 1.2 1.3 1.3
1910 1.1 1.2 1.2 1.2 1.3 1.3 1.4
1640 1.1 1.2 1.3 1.3 1.3 1.4 1.5
1430 1.2 1.2 1.3 1.3 1.4 1.4 --
1270 1.2 1.2 1.3 1.3 1.4 1.5 --
1150 1.2 1.2 1.3 1.4 1.5 -- --
950 1.2 1.3 1.4 1.5 1.5 -- --
820 1.3 1.3 1.4 1.5 -- -- --
720 1.3 1.4 1.5 -- -- -- --
640 1.3 1.4 1.5 -- -- -- --
570 1.4 1.5 -- -- -- -- --
380 1.5 -- -- -- -- -- -- Notes: 1. Adjustments apply to the outside of a horizontal curve. 2. A curve with radius greater than 2860 ft does not require adjustments. 3. The applicable clear-zone distance is calculated as follows:
CZc = (Kcz)(CZt) where: CZc = clear zone on curve, ft Kcz = curve correction factor CZt = clear zone on tangent section from Figure 49-2A, ft 4. For a curve radius not shown in the table, use a straight-line interpolation. 5. See Figure 49-2C for the application of CZc to the roadside around a curve.
CLEAR-ZONE ADJUSTMENT FACTOR, KCZ, FOR HORIZONTAL CURVE
Figure 49-2B
2012
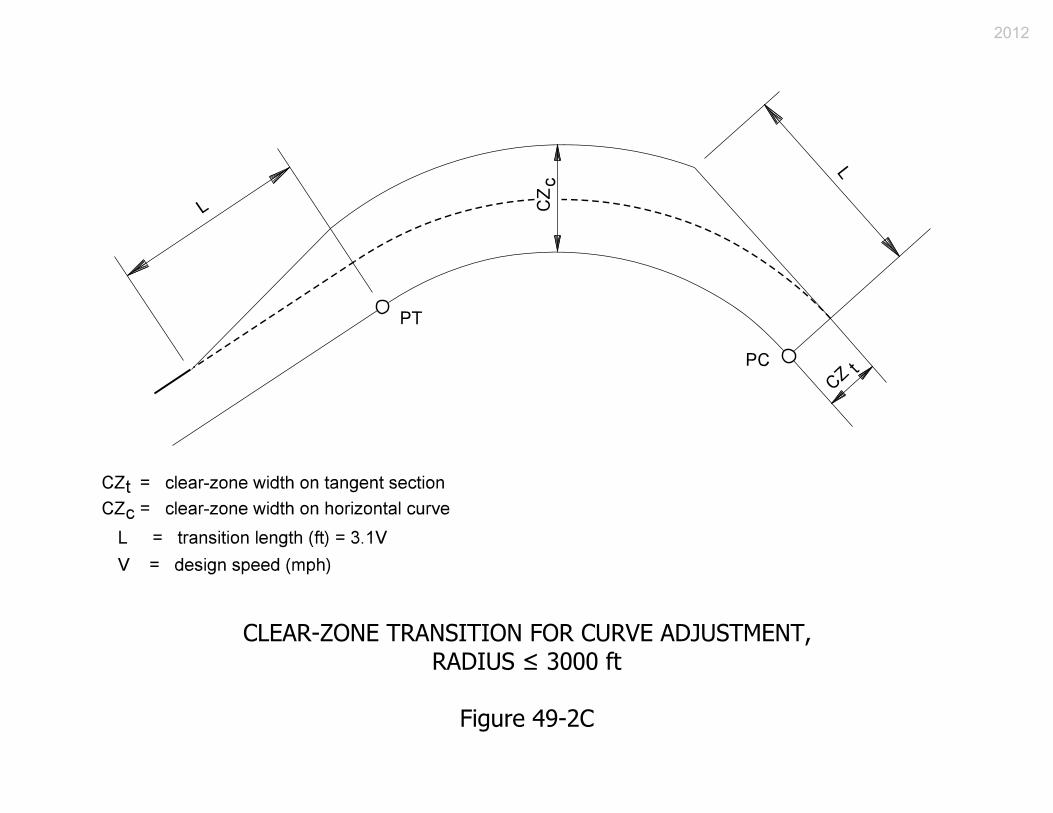
2012
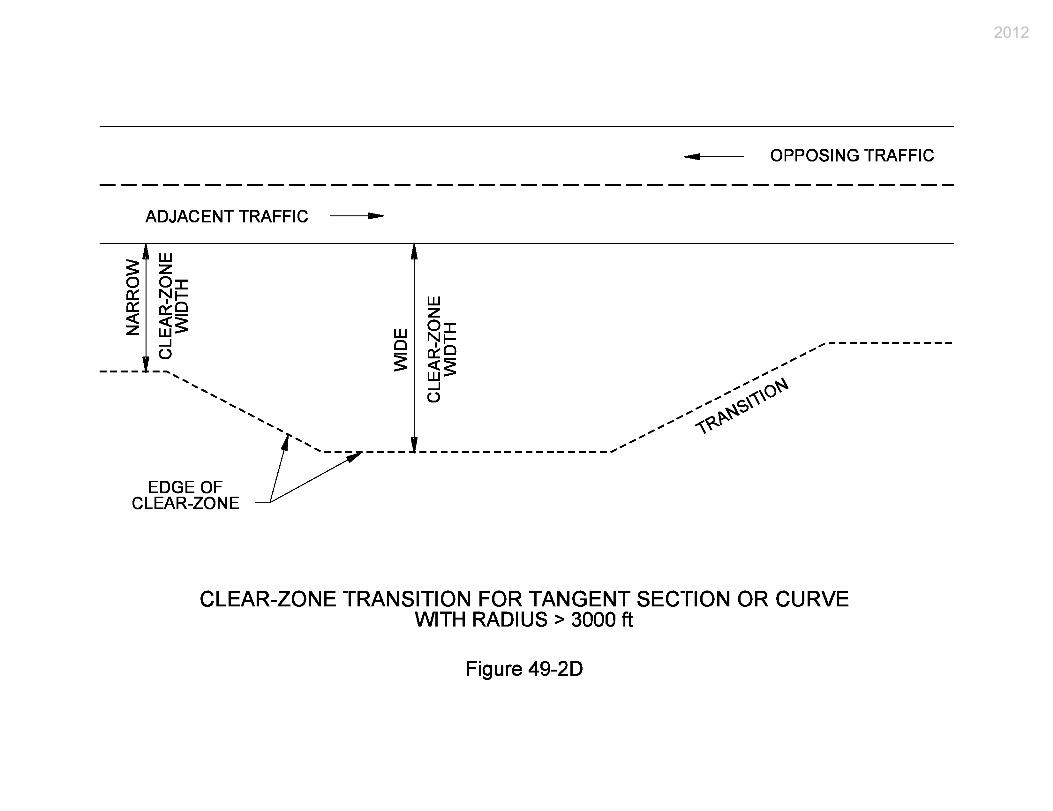
2012
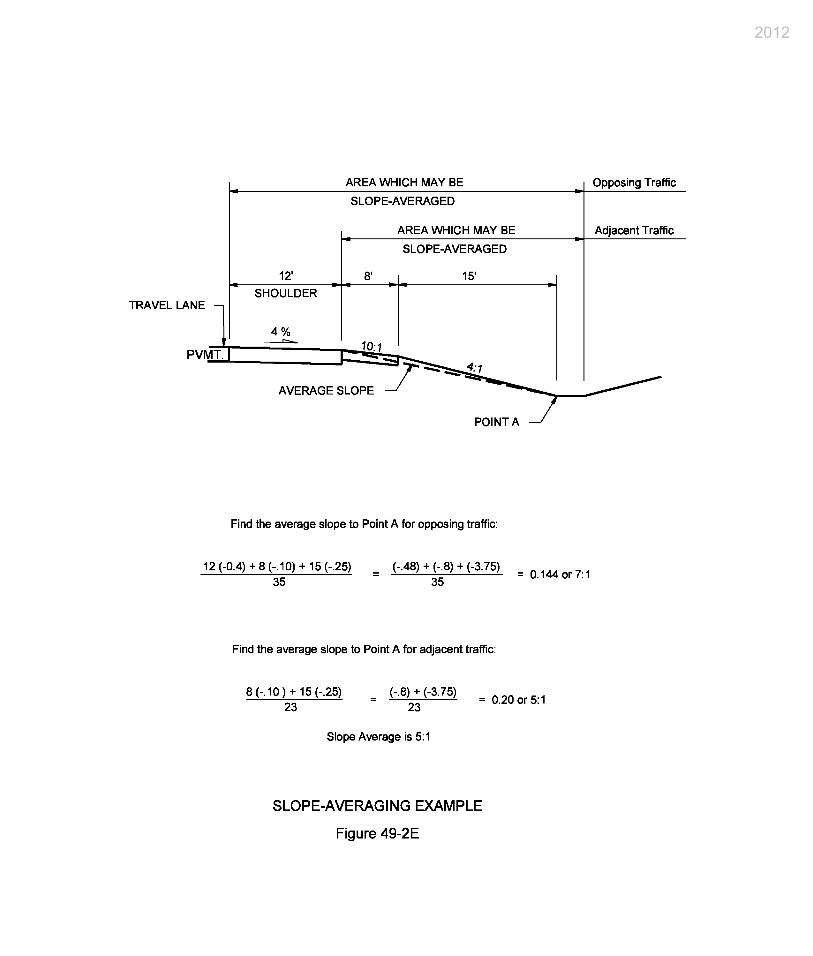
2012
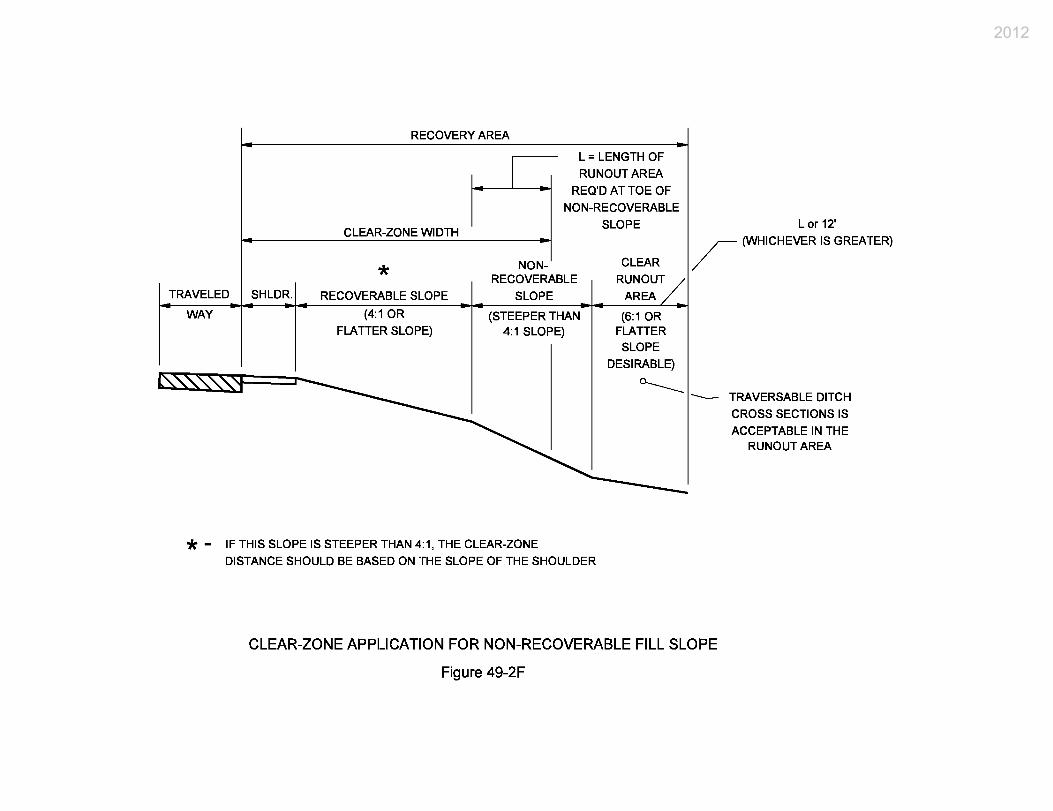
2012
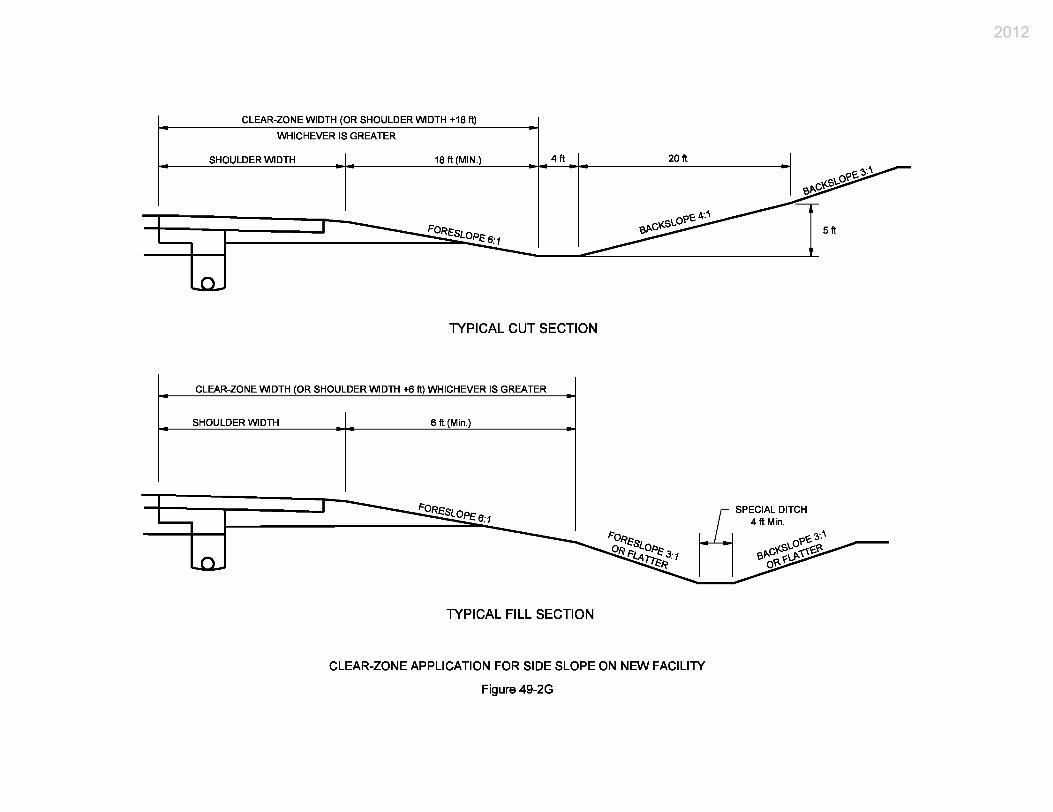
2012
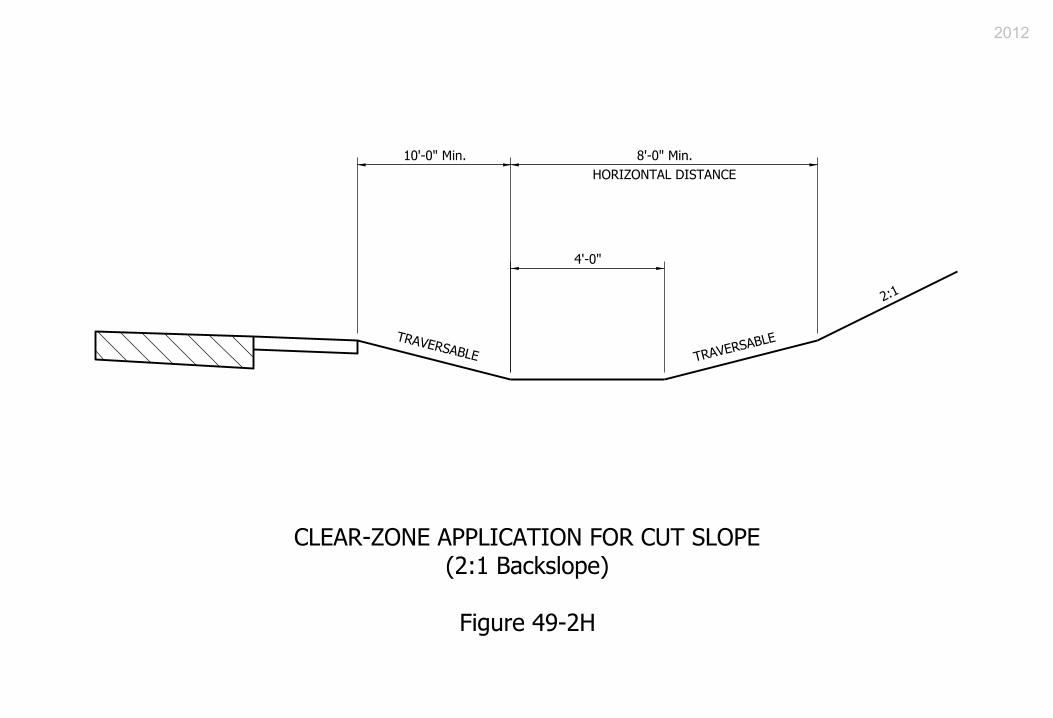
2012
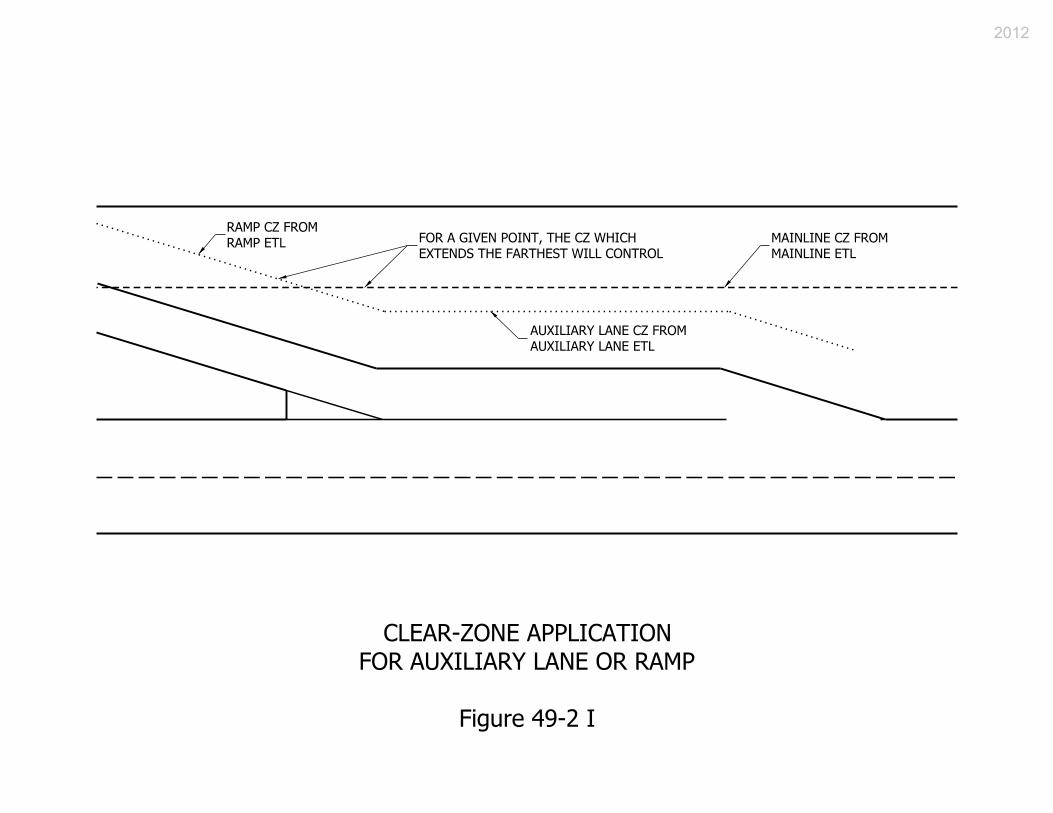
2012
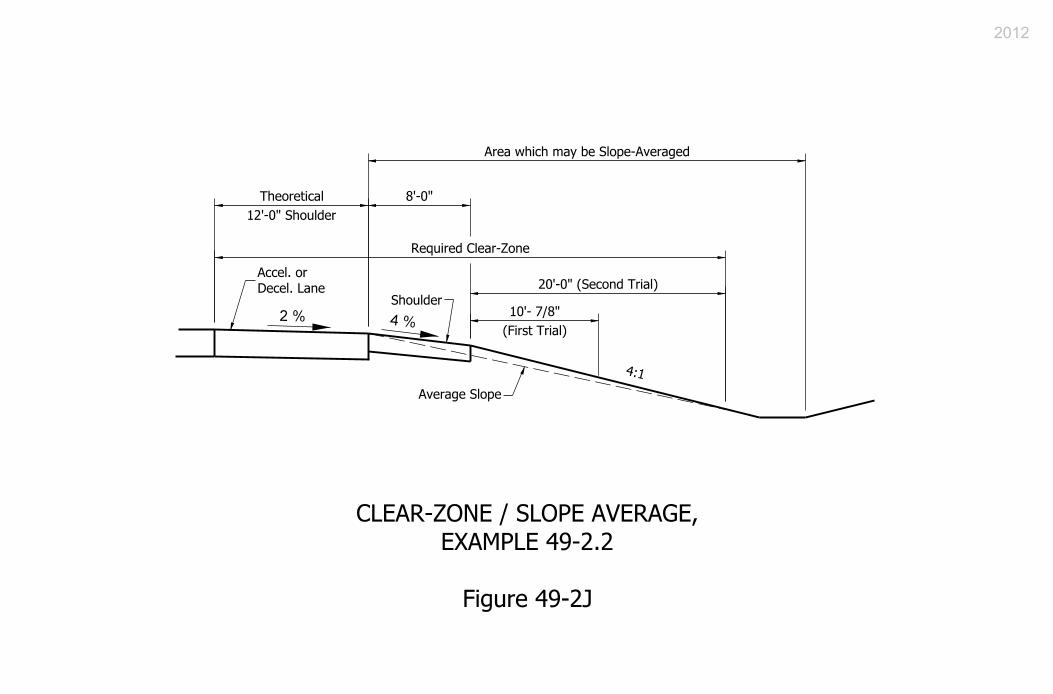
2012
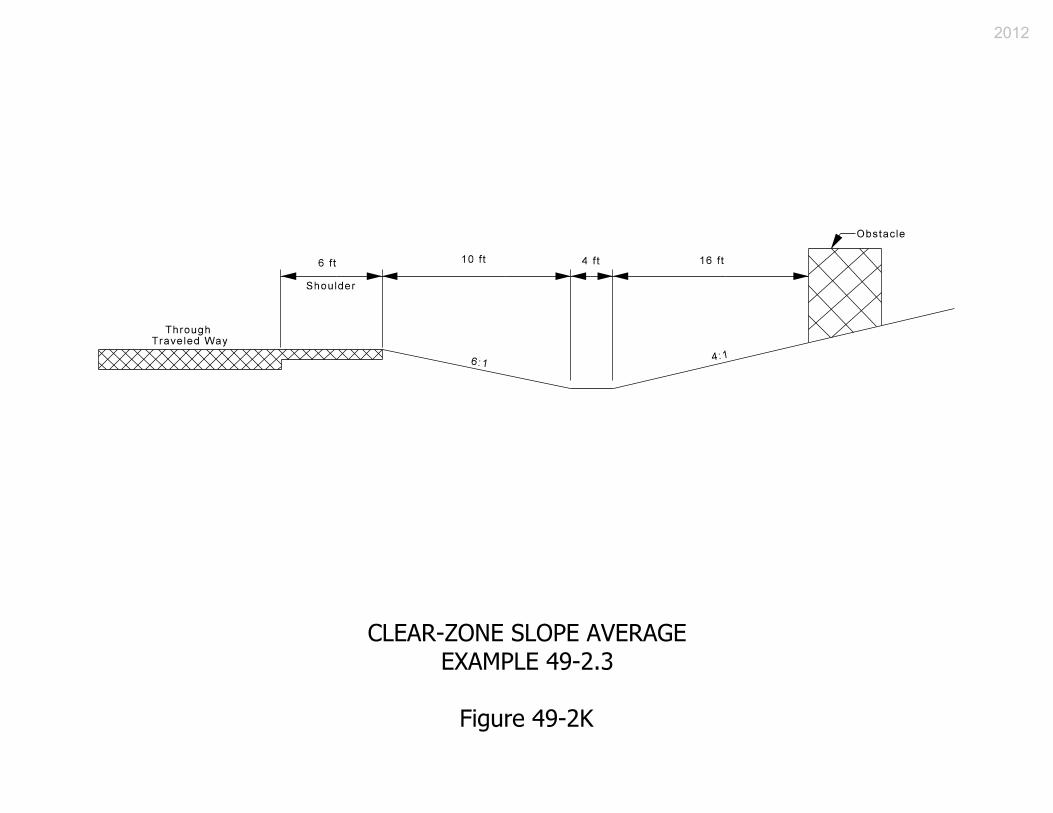
2012
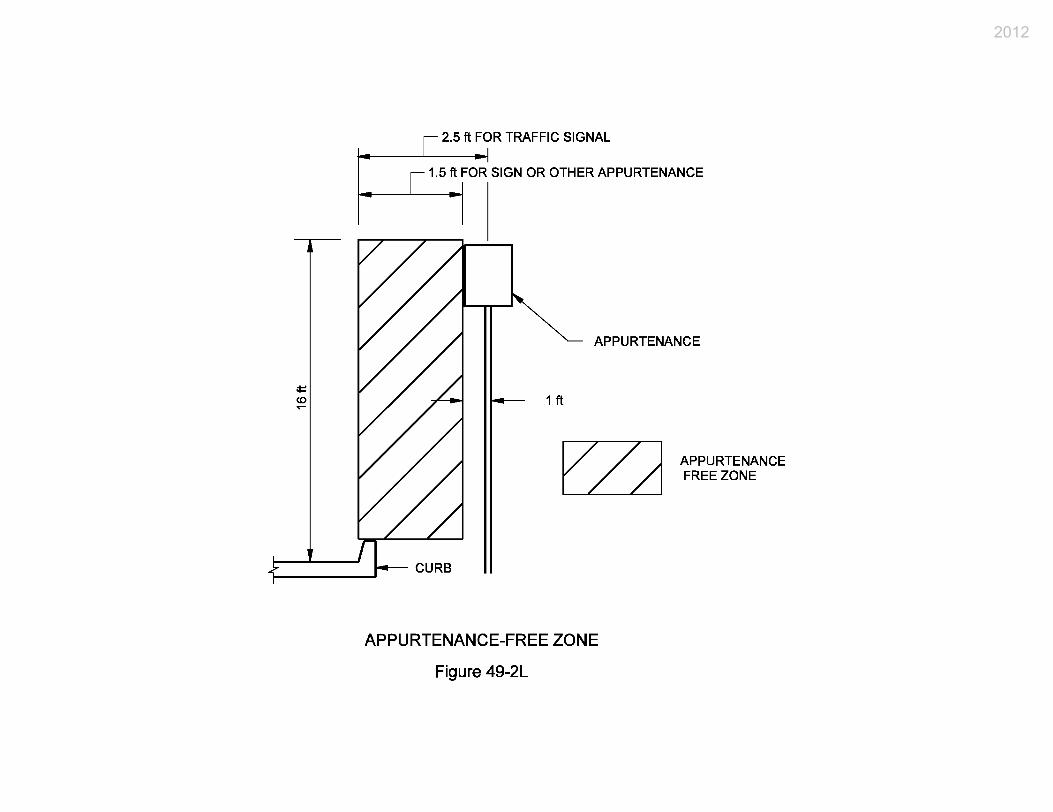
2012
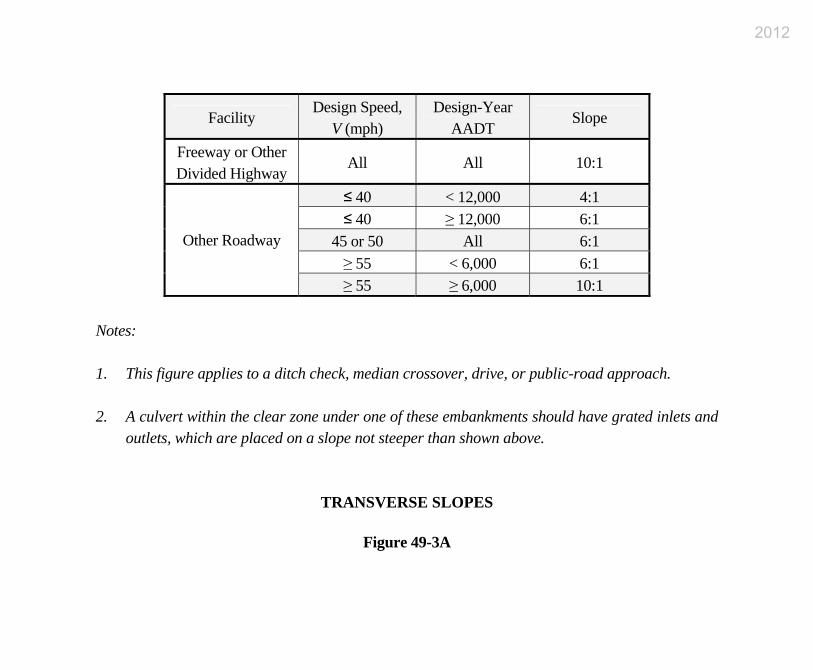
Facility Design Speed,
V (mph) Design-Year
AADT Slope
Freeway or Other Divided Highway
All All 10:1
≤ 40 < 12,000 4:1 ≤ 40 ≥ 12,000 6:1
45 or 50 All 6:1 ≥ 55 < 6,000 6:1
Other Roadway
≥ 55 ≥ 6,000 10:1 Notes: 1. This figure applies to a ditch check, median crossover, drive, or public-road approach. 2. A culvert within the clear zone under one of these embankments should have grated inlets and
outlets, which are placed on a slope not steeper than shown above.
TRANSVERSE SLOPES
Figure 49-3A
2012
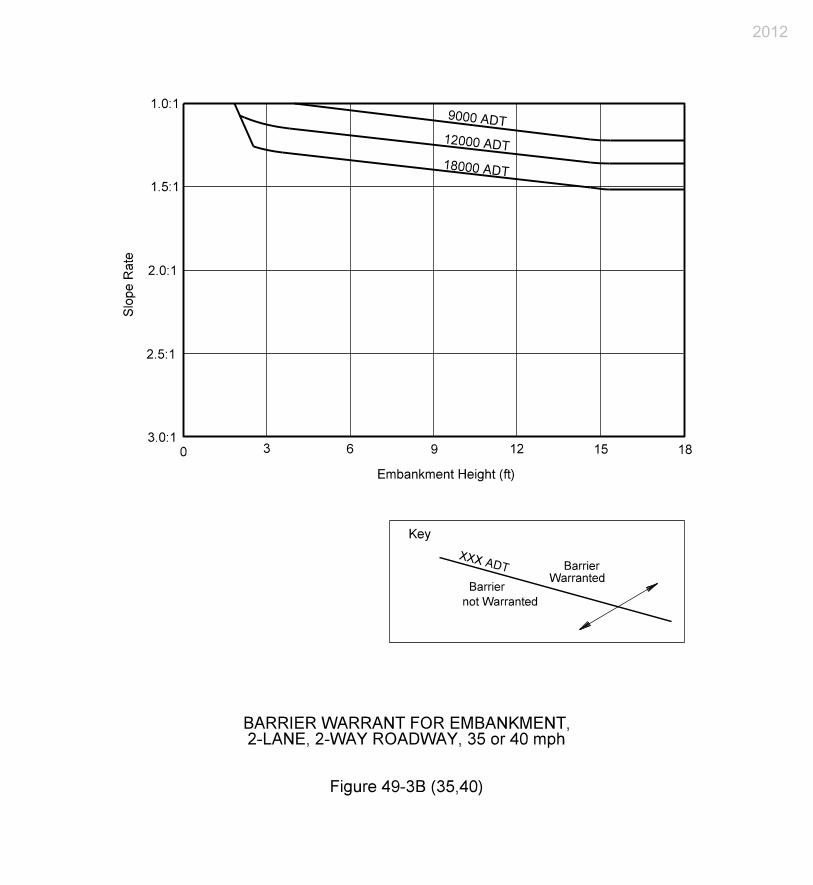
2012
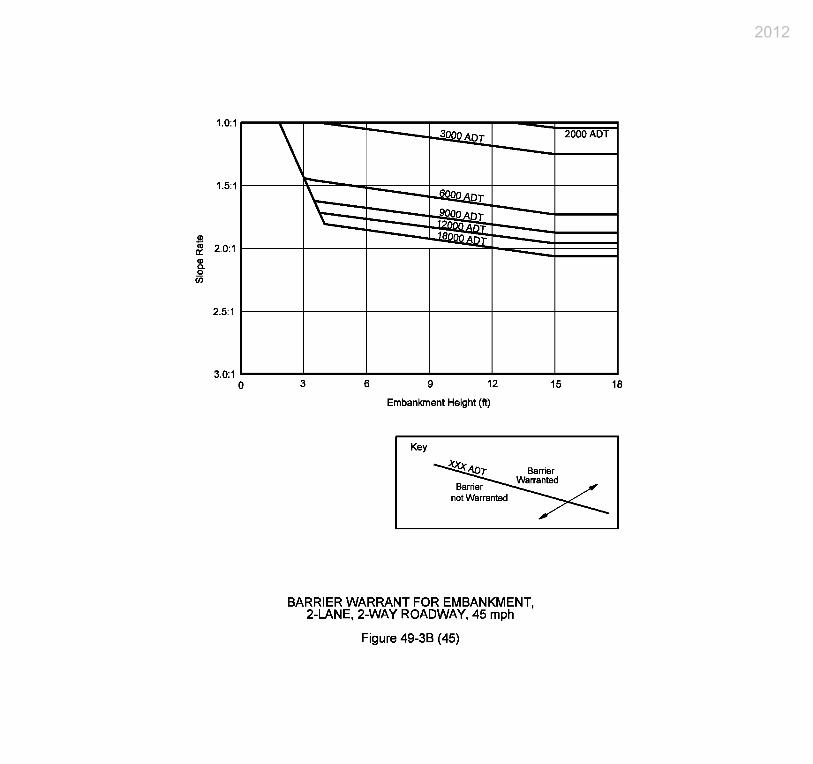
2012
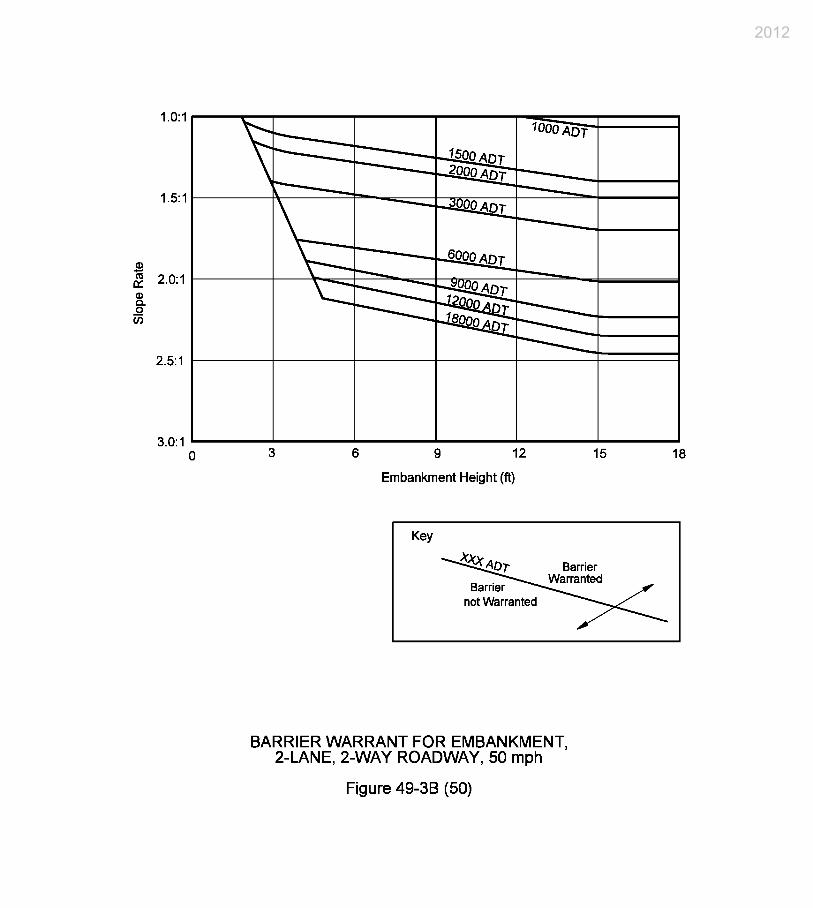
2012
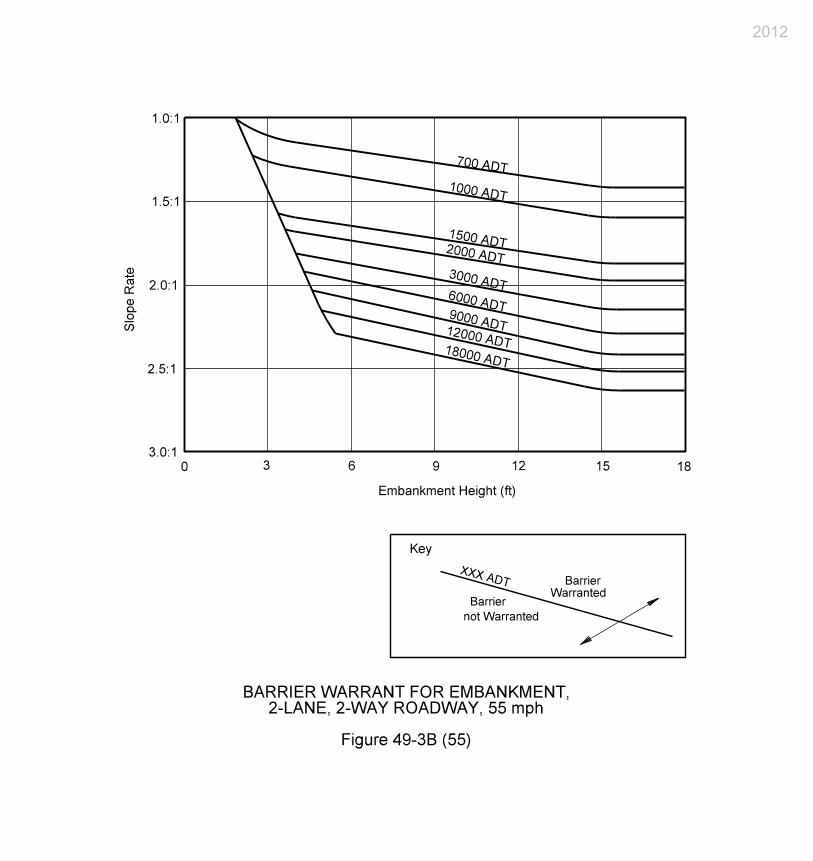
2012
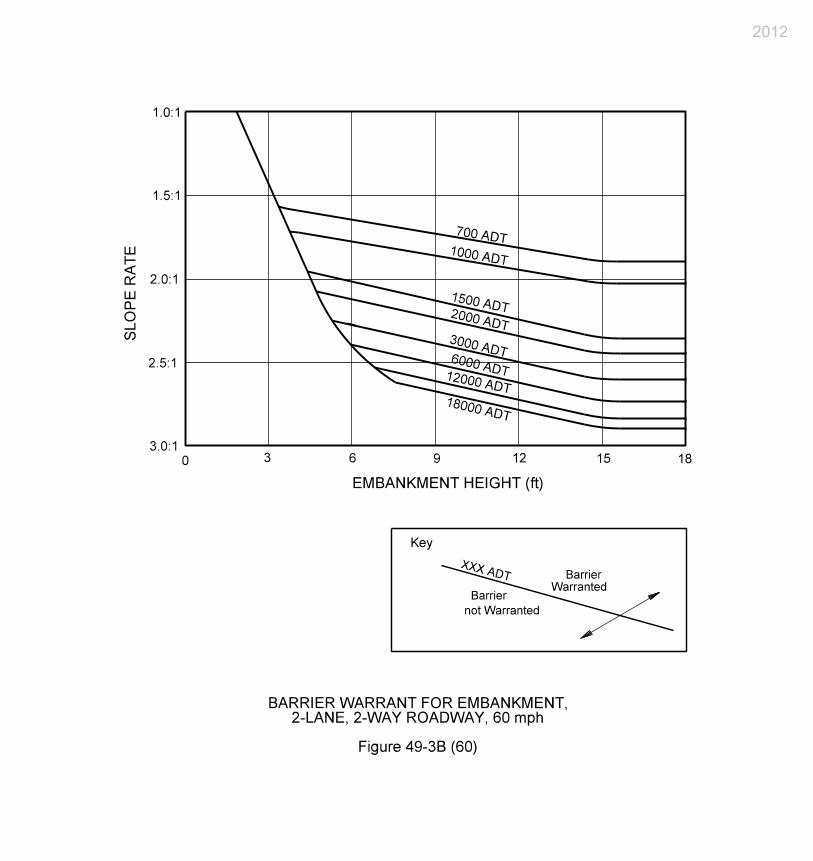
2012
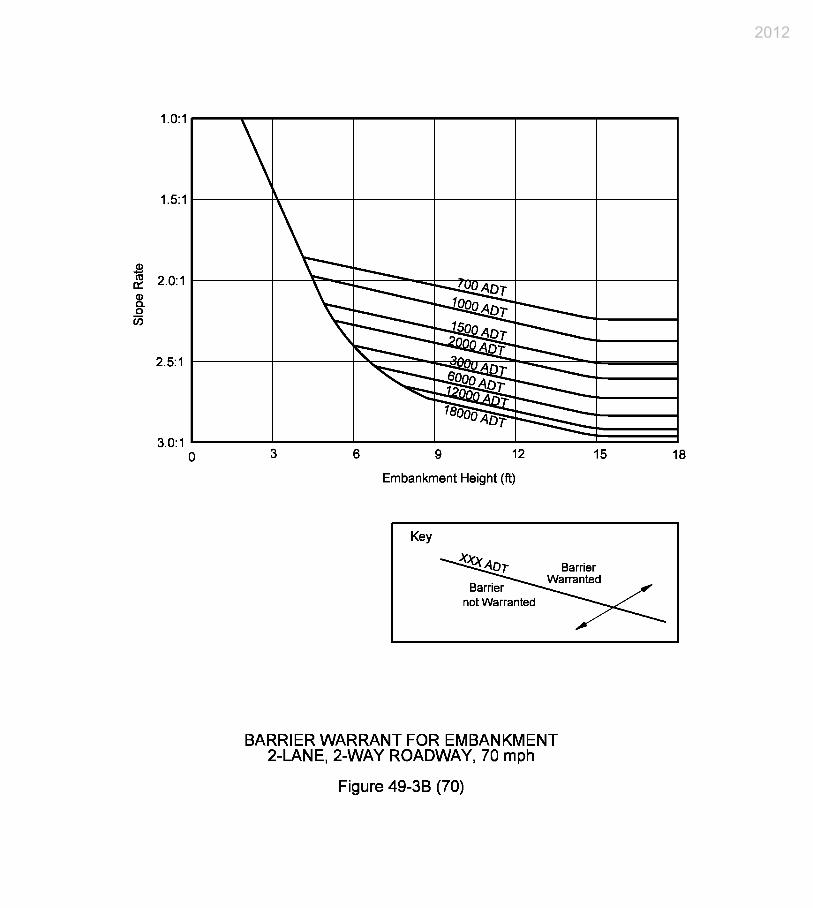
2012
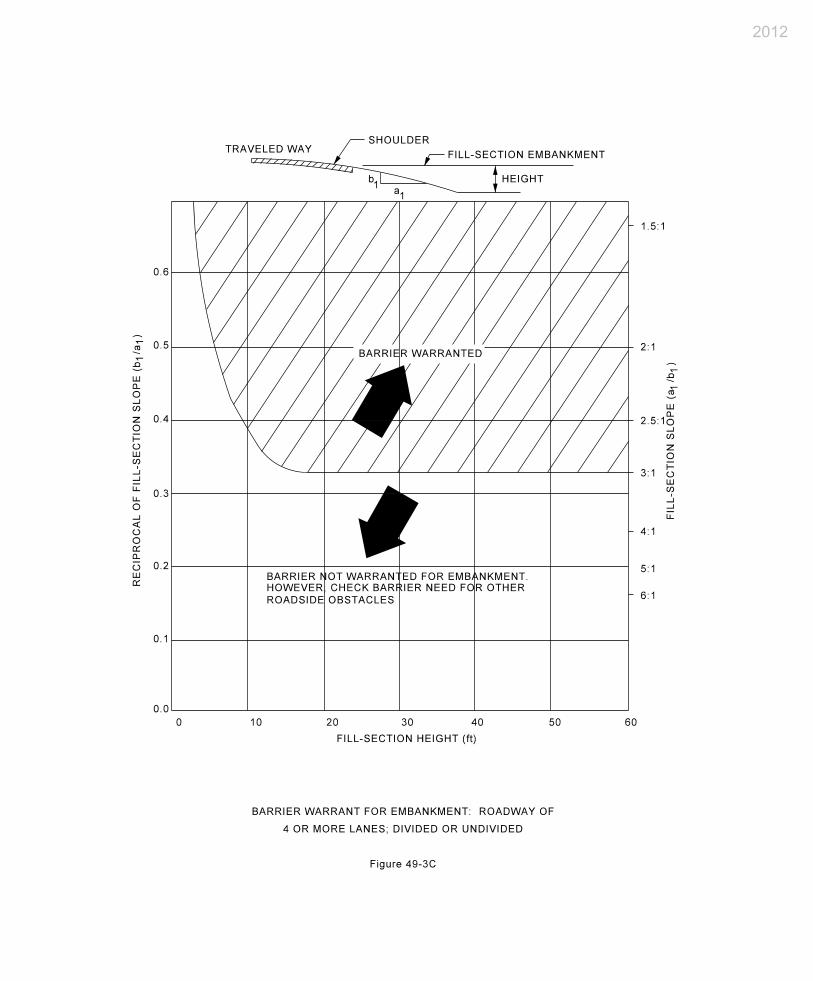
2012
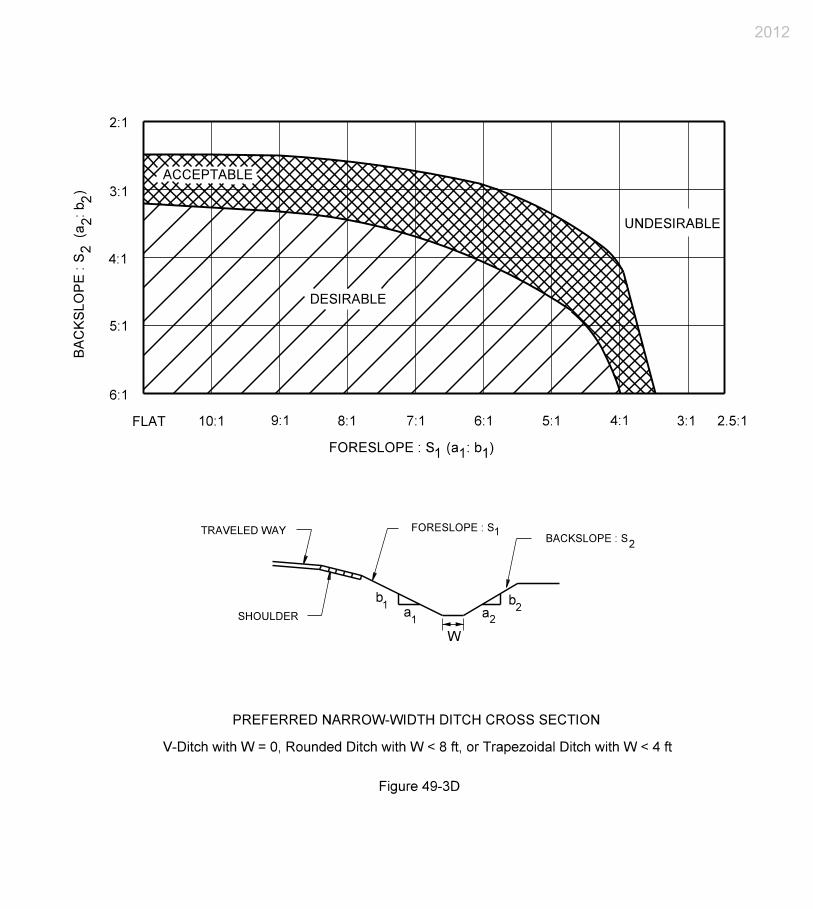
2012
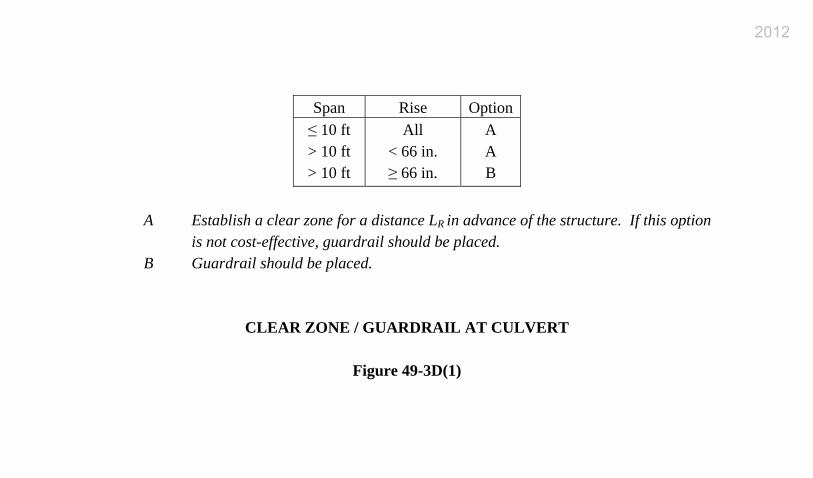
Span Rise Option≤ 10 ft > 10 ft > 10 ft
All < 66 in. ≥ 66 in.
A A B
A Establish a clear zone for a distance LR in advance of the structure. If this option
is not cost-effective, guardrail should be placed. B Guardrail should be placed.
CLEAR ZONE / GUARDRAIL AT CULVERT
Figure 49-3D(1)
2012
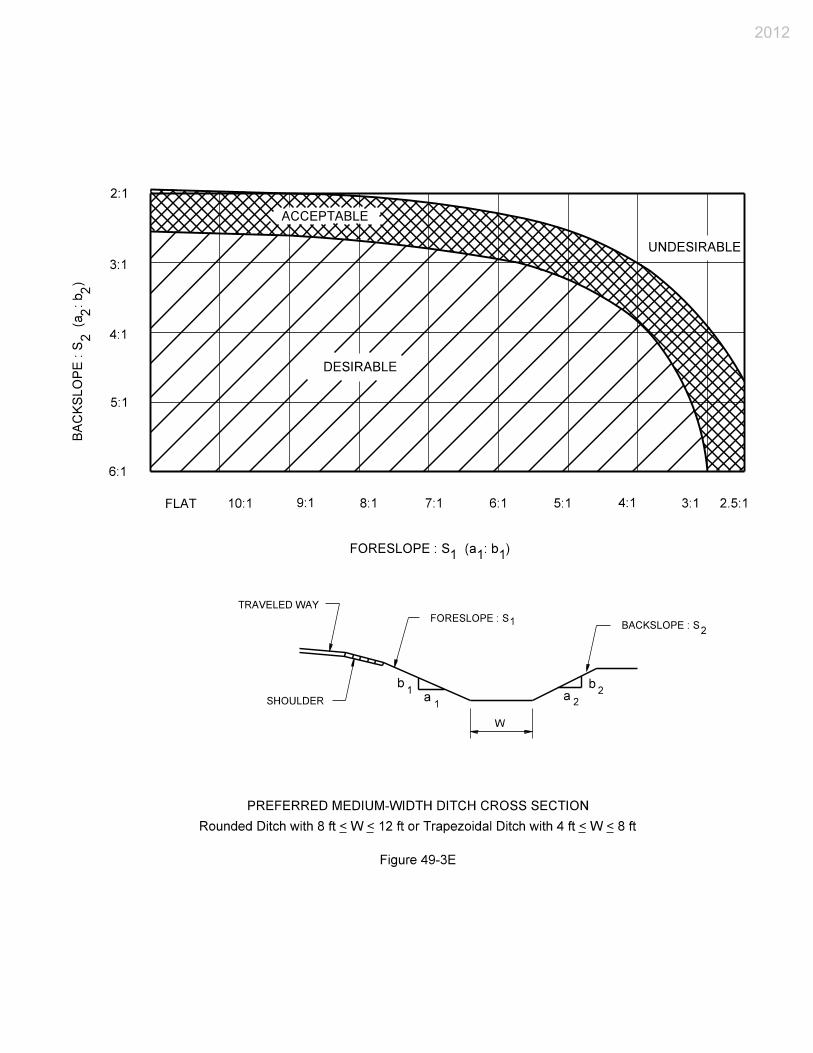
2012
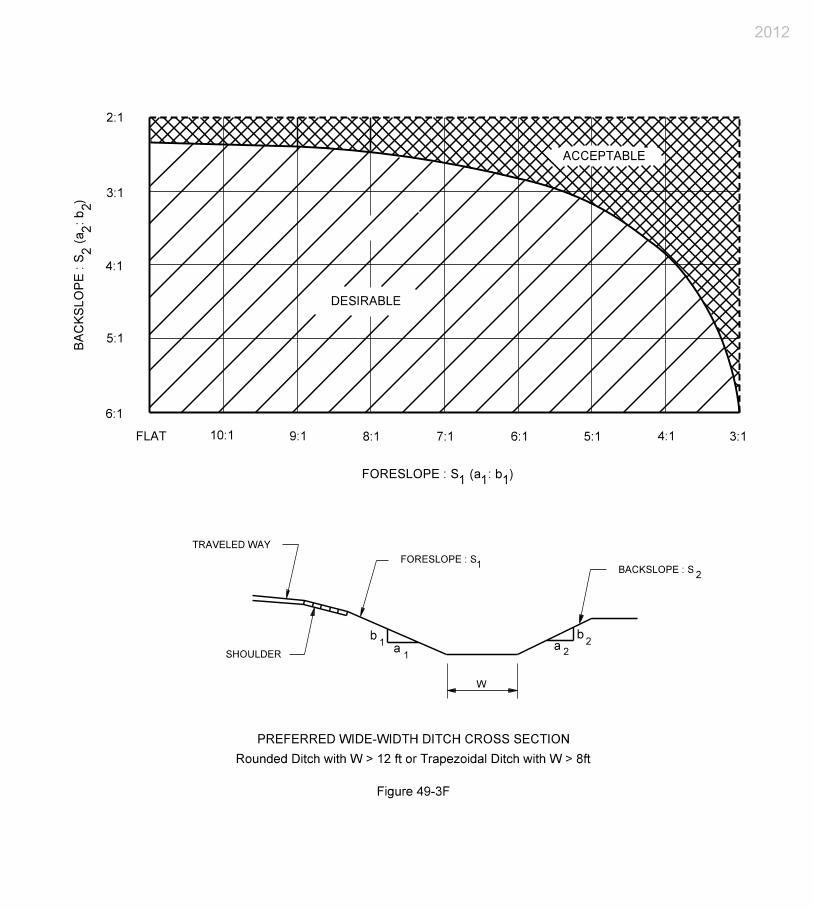
2012
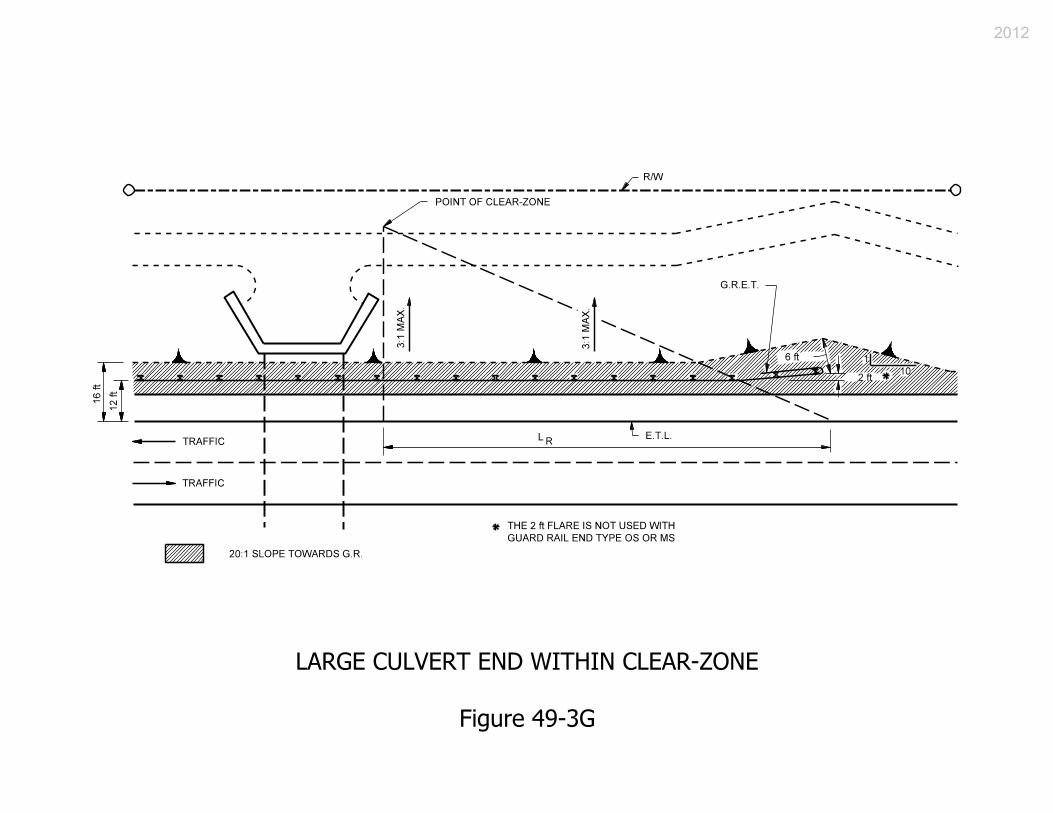
2012
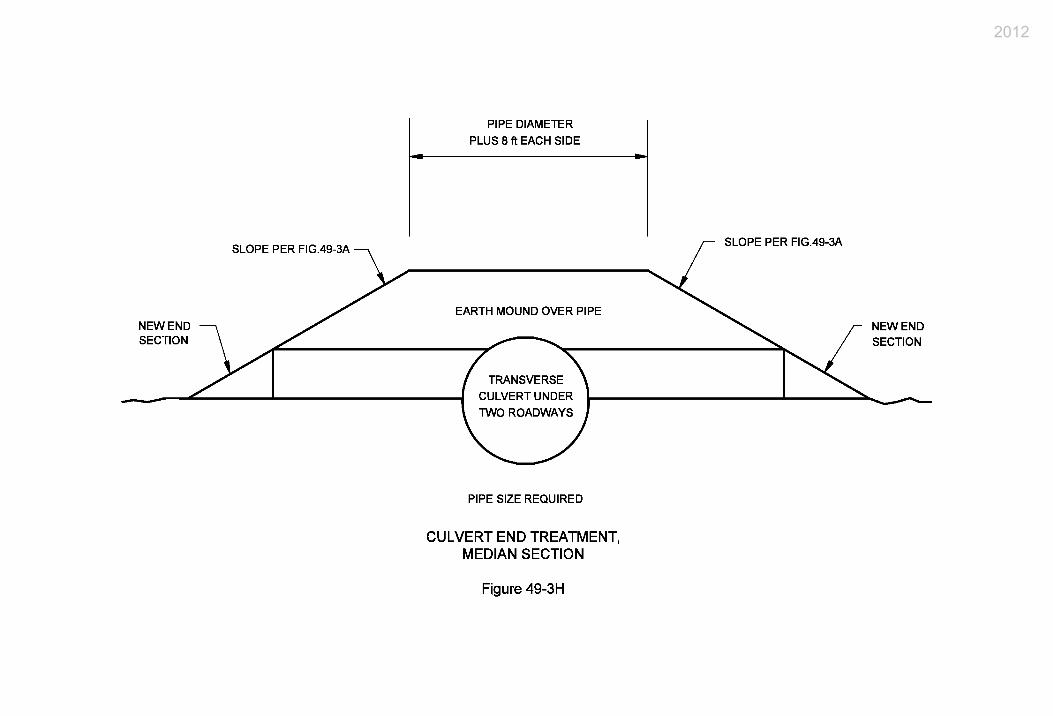
2012
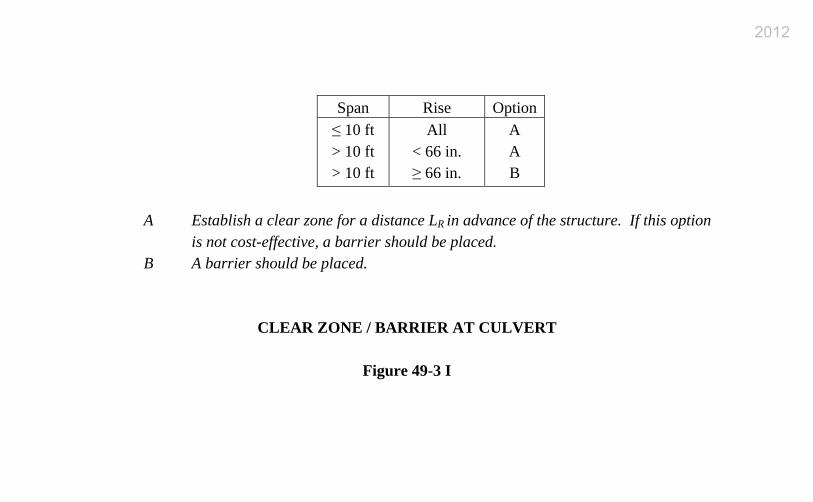
Span Rise Option≤ 10 ft > 10 ft > 10 ft
All < 66 in. ≥ 66 in.
A A B
A Establish a clear zone for a distance LR in advance of the structure. If this option
is not cost-effective, a barrier should be placed. B A barrier should be placed.
CLEAR ZONE / BARRIER AT CULVERT
Figure 49-3 I
2012
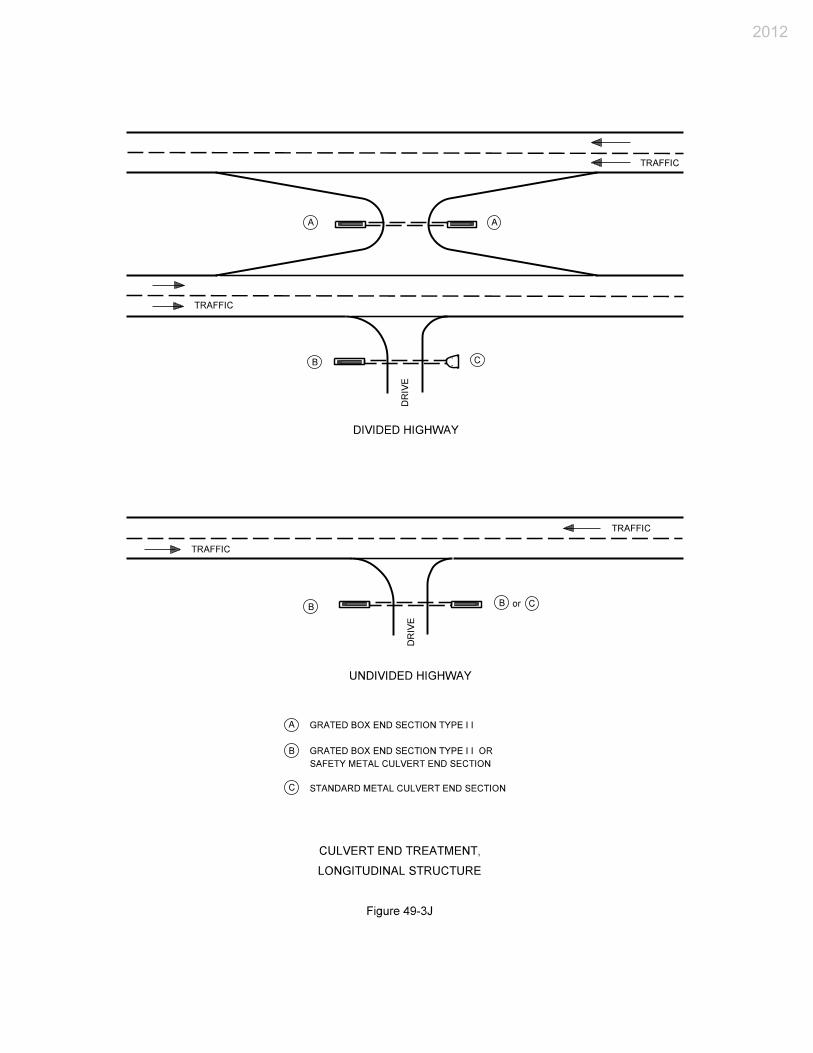
2012
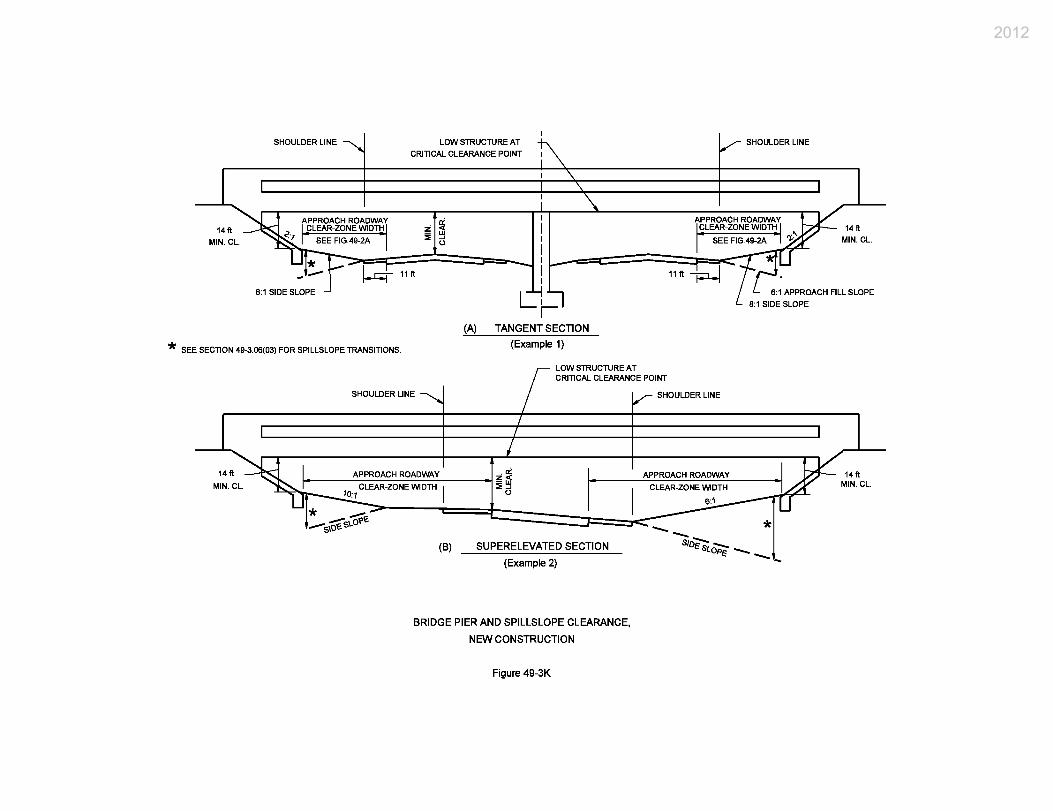
2012
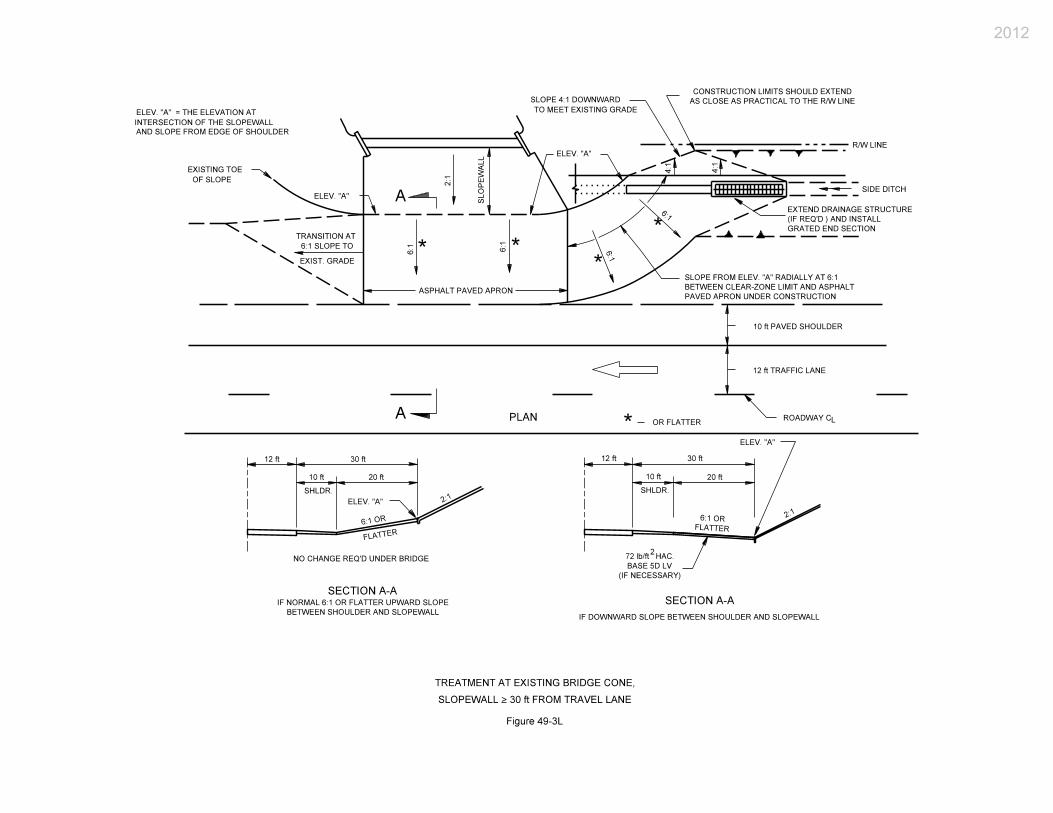
2012
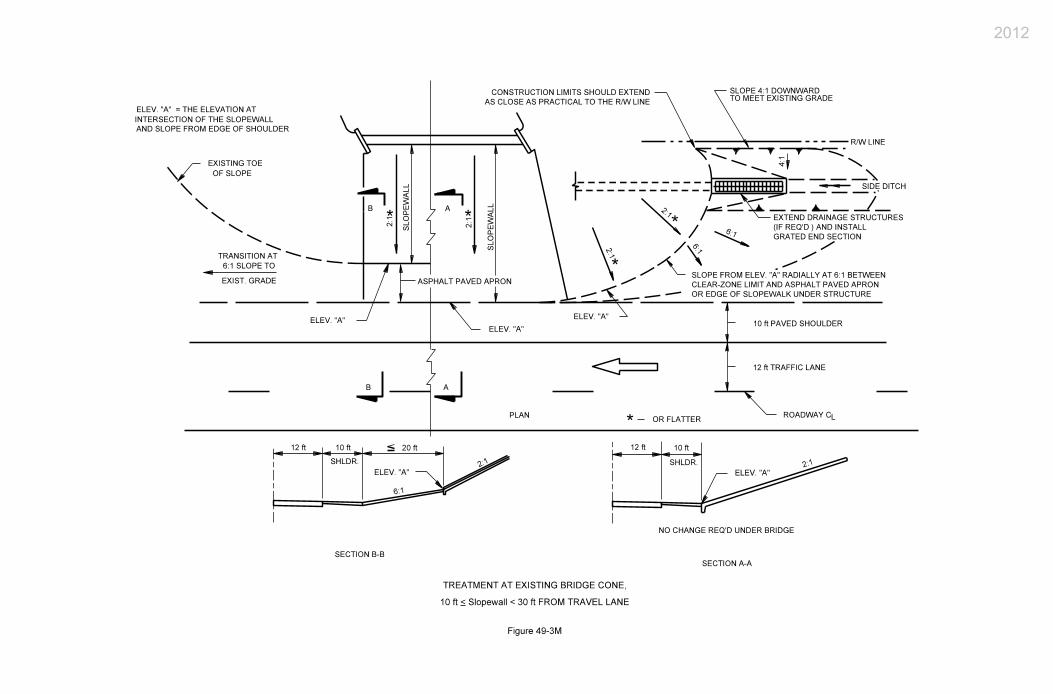
2012
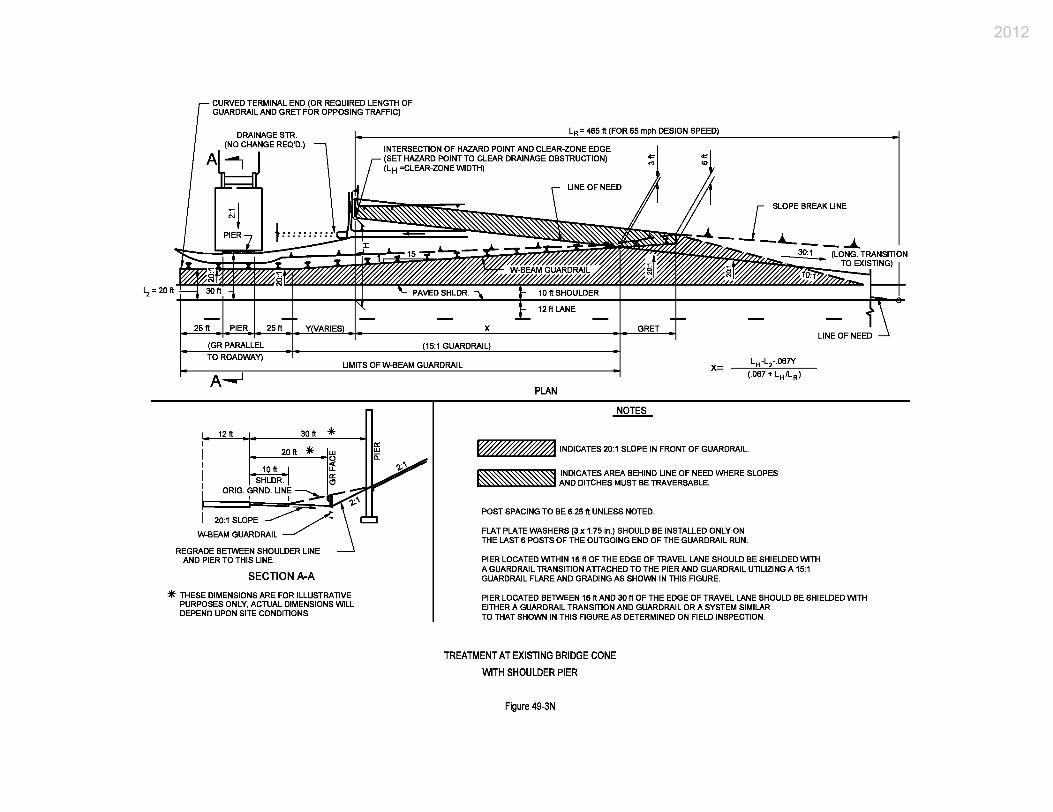
2012
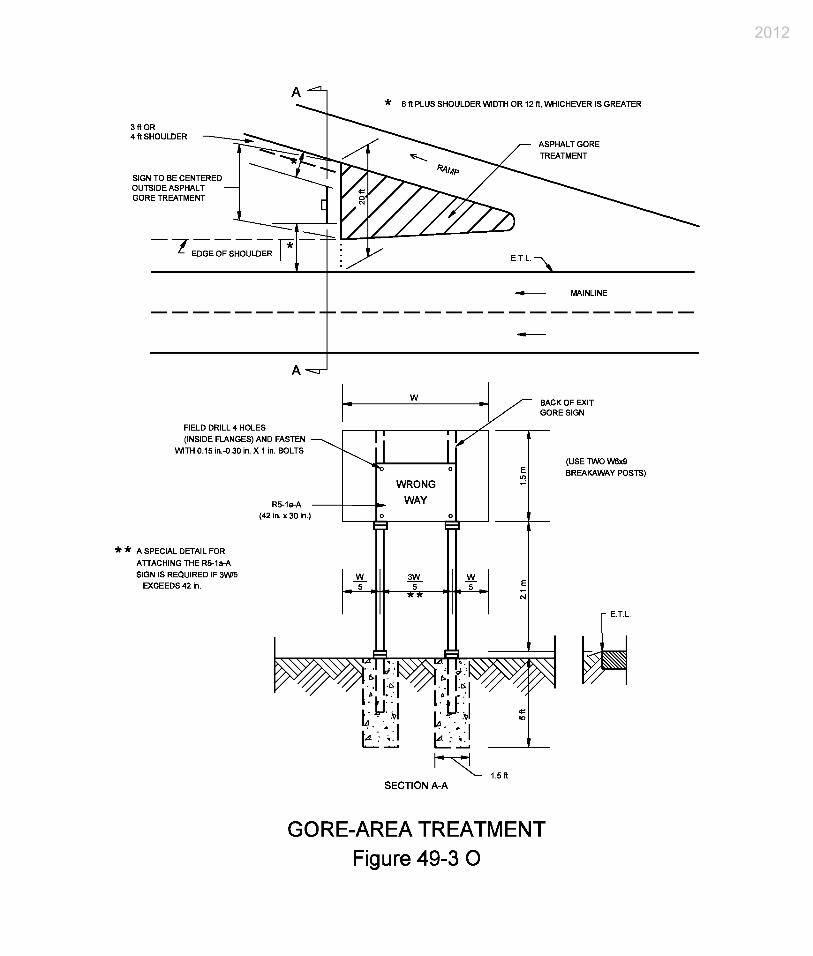
2012
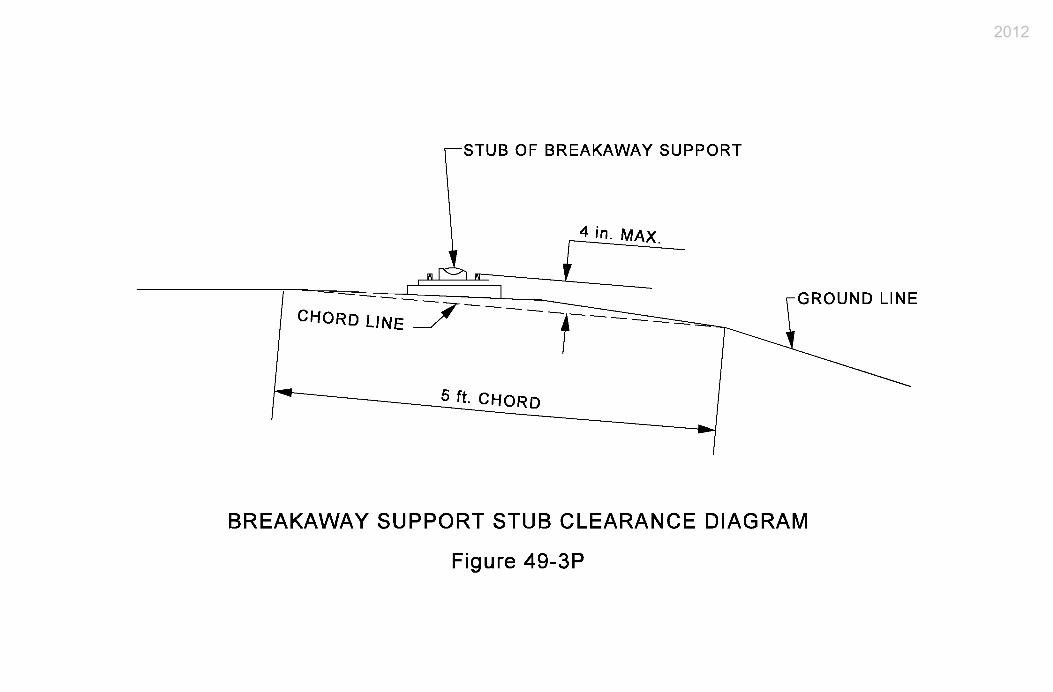
2012
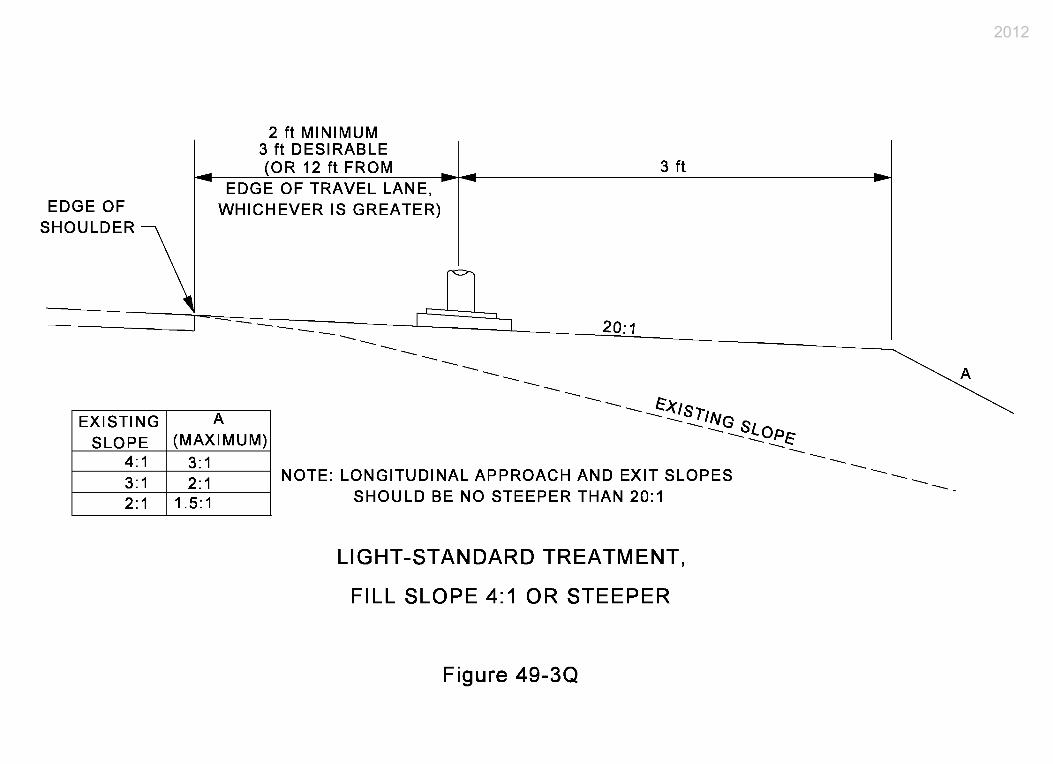
2012
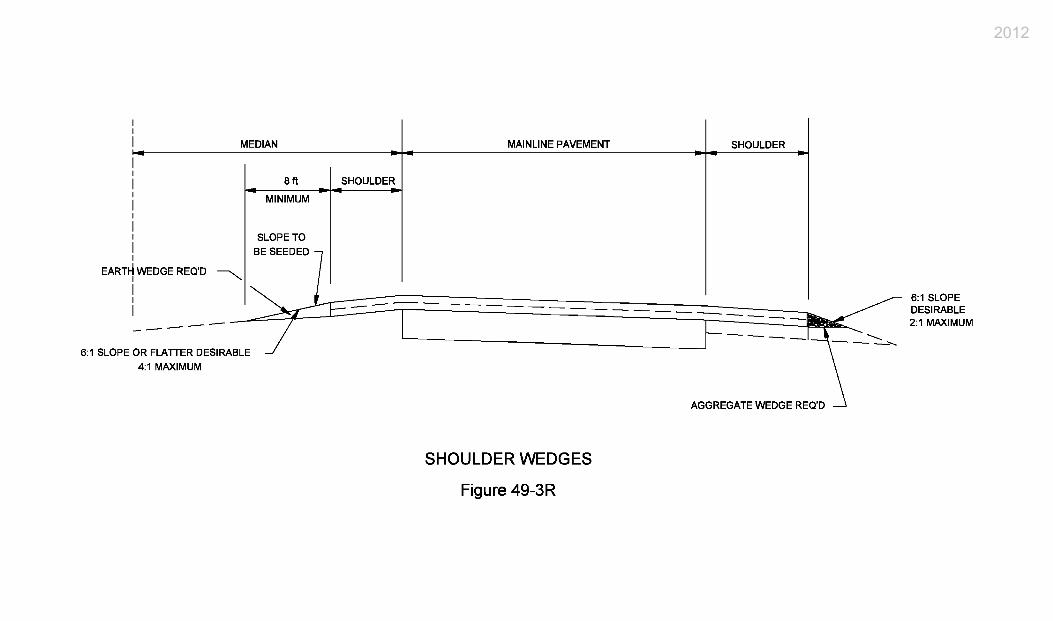
2012
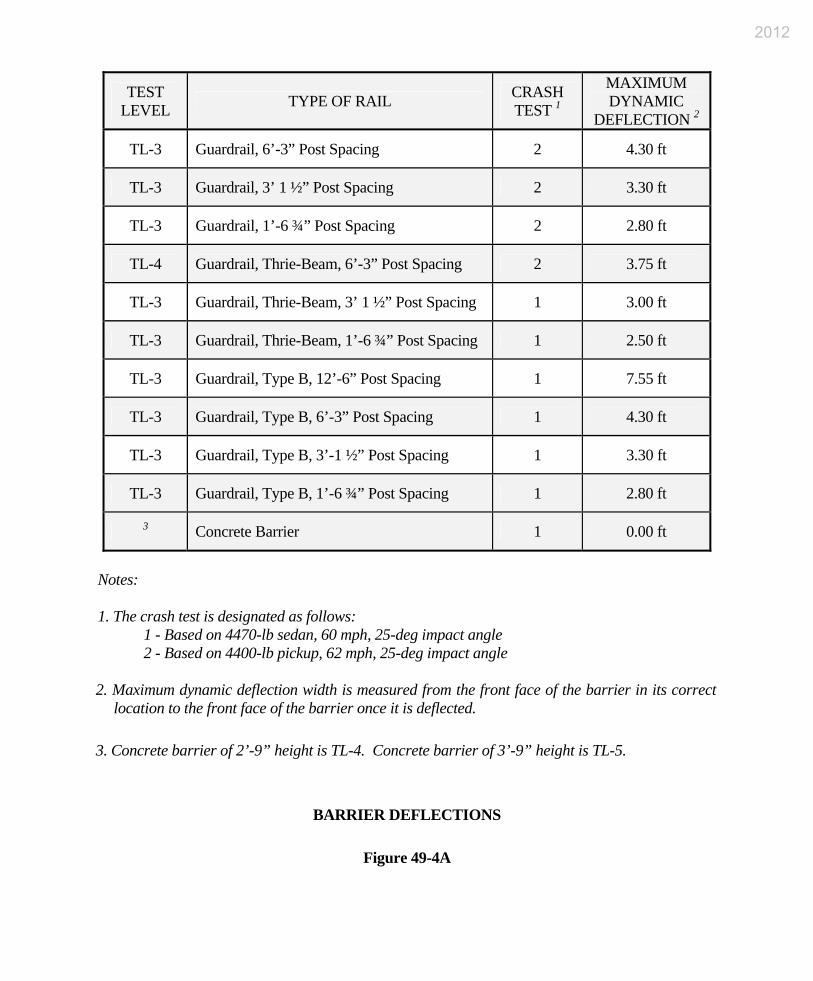
TEST LEVEL TYPE OF RAIL CRASH
TEST 1MAXIMUM DYNAMIC
DEFLECTION 2
TL-3 Guardrail, 6’-3” Post Spacing 2 4.30 ft
TL-3 Guardrail, 3’ 1 ½” Post Spacing 2 3.30 ft
TL-3 Guardrail, 1’-6 ¾” Post Spacing 2 2.80 ft
TL-4 Guardrail, Thrie-Beam, 6’-3” Post Spacing 2 3.75 ft
TL-3 Guardrail, Thrie-Beam, 3’ 1 ½” Post Spacing 1 3.00 ft
TL-3 Guardrail, Thrie-Beam, 1’-6 ¾” Post Spacing 1 2.50 ft
TL-3 Guardrail, Type B, 12’-6” Post Spacing 1 7.55 ft
TL-3 Guardrail, Type B, 6’-3” Post Spacing 1 4.30 ft
TL-3 Guardrail, Type B, 3’-1 ½” Post Spacing 1 3.30 ft
TL-3 Guardrail, Type B, 1’-6 ¾” Post Spacing 1 2.80 ft
3 Concrete Barrier 1 0.00 ft
Notes: 1. The crash test is designated as follows: 1 - Based on 4470-lb sedan, 60 mph, 25-deg impact angle 2 - Based on 4400-lb pickup, 62 mph, 25-deg impact angle 2. Maximum dynamic deflection width is measured from the front face of the barrier in its correct
location to the front face of the barrier once it is deflected. 3. Concrete barrier of 2’-9” height is TL-4. Concrete barrier of 3’-9” height is TL-5.
BARRIER DEFLECTIONS
Figure 49-4A
2012
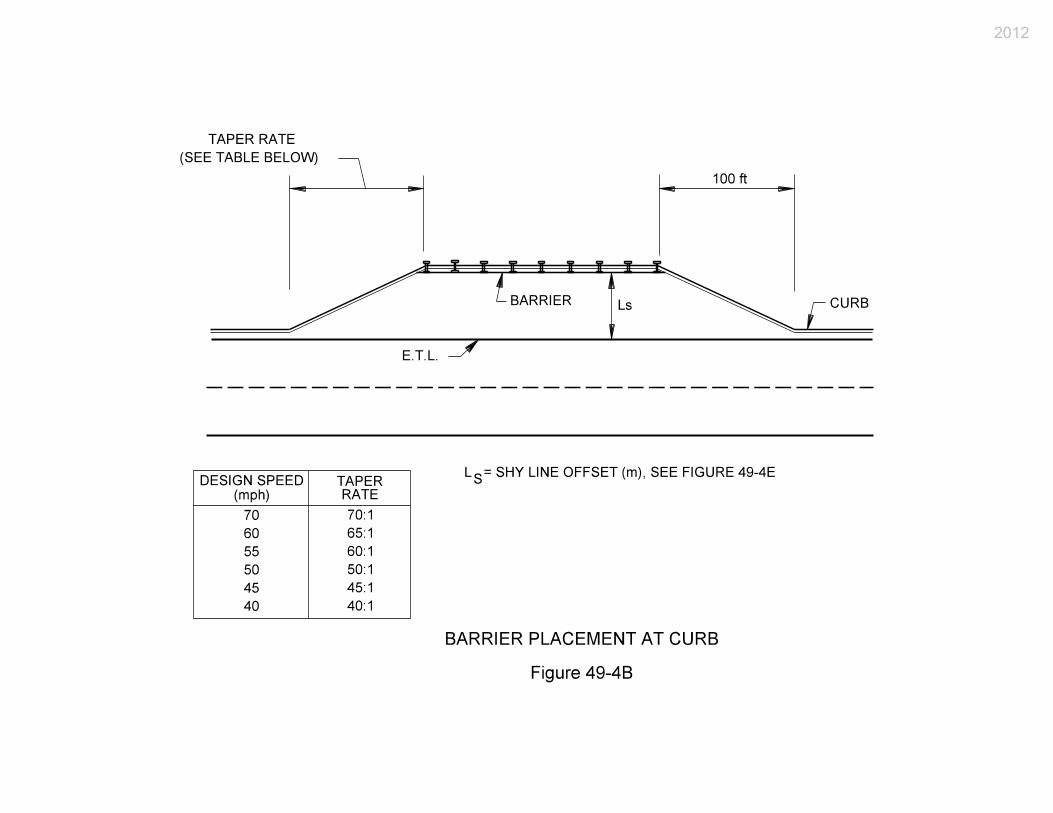
2012
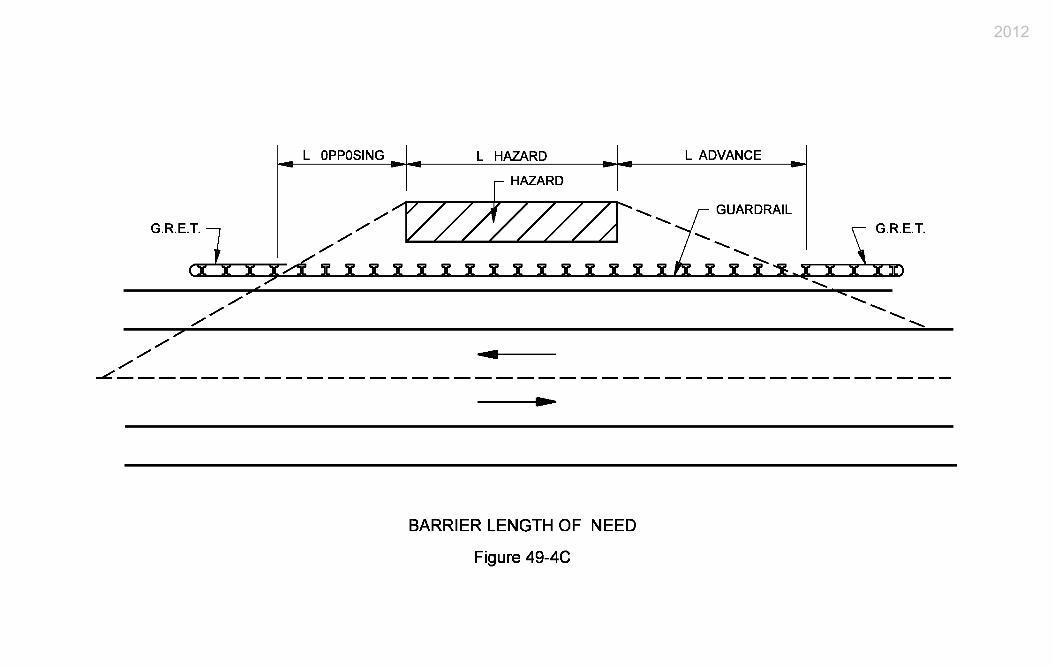
2012
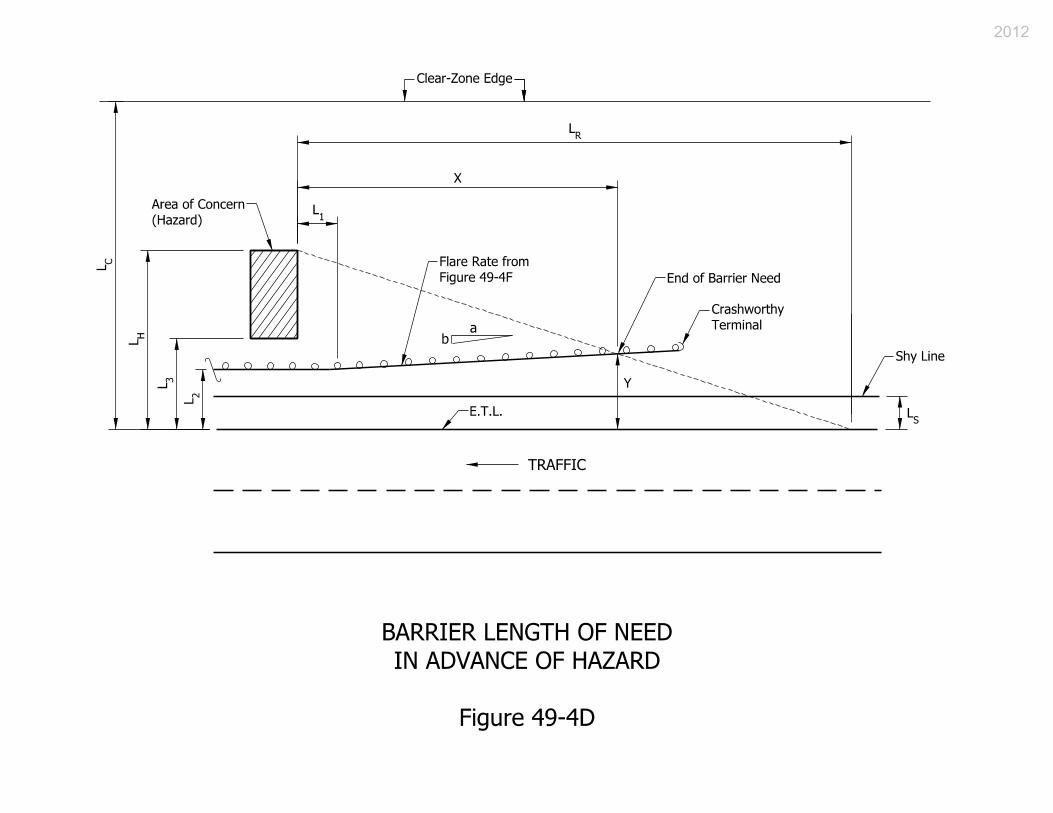
ab
TRAFFIC
(Hazard)
Area of Concern
End of Barrier Need
Terminal
Crashworthy
Shy Line
E.T.L.
Figure 49-4F
Flare Rate from
Clear-Zone Edge
SL
1L
RL
Y
CL
HL
3L
2L
X
Figure 49-4D
IN ADVANCE OF HAZARD
BARRIER LENGTH OF NEED
2012
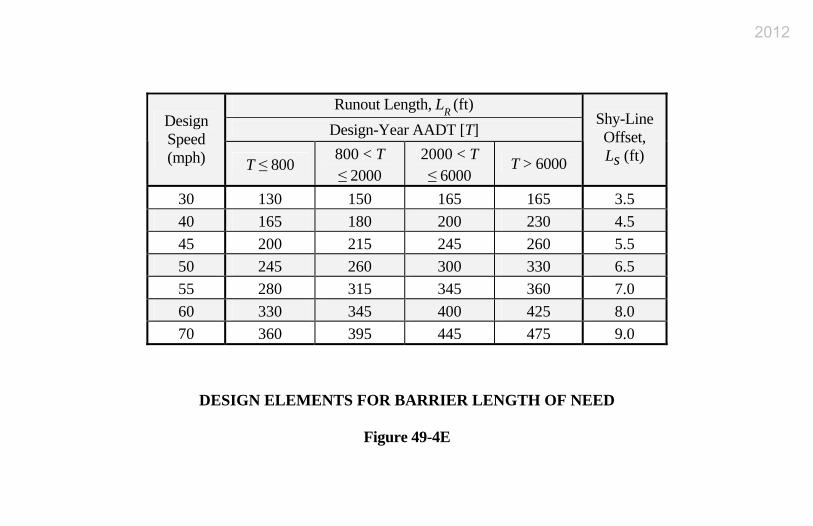
Runout Length, L
R (ft)
Design-Year AADT [T] Design Speed (mph) T ≤ 800
800 < T ≤ 2000
2000 < T ≤ 6000
T > 6000
Shy-Line Offset, Ls (ft)
30 130 150 165 165 3.5 40 165 180 200 230 4.5 45 200 215 245 260 5.5 50 245 260 300 330 6.5 55 280 315 345 360 7.0 60 330 345 400 425 8.0 70 360 395 445 475 9.0
DESIGN ELEMENTS FOR BARRIER LENGTH OF NEED
Figure 49-4E
2012
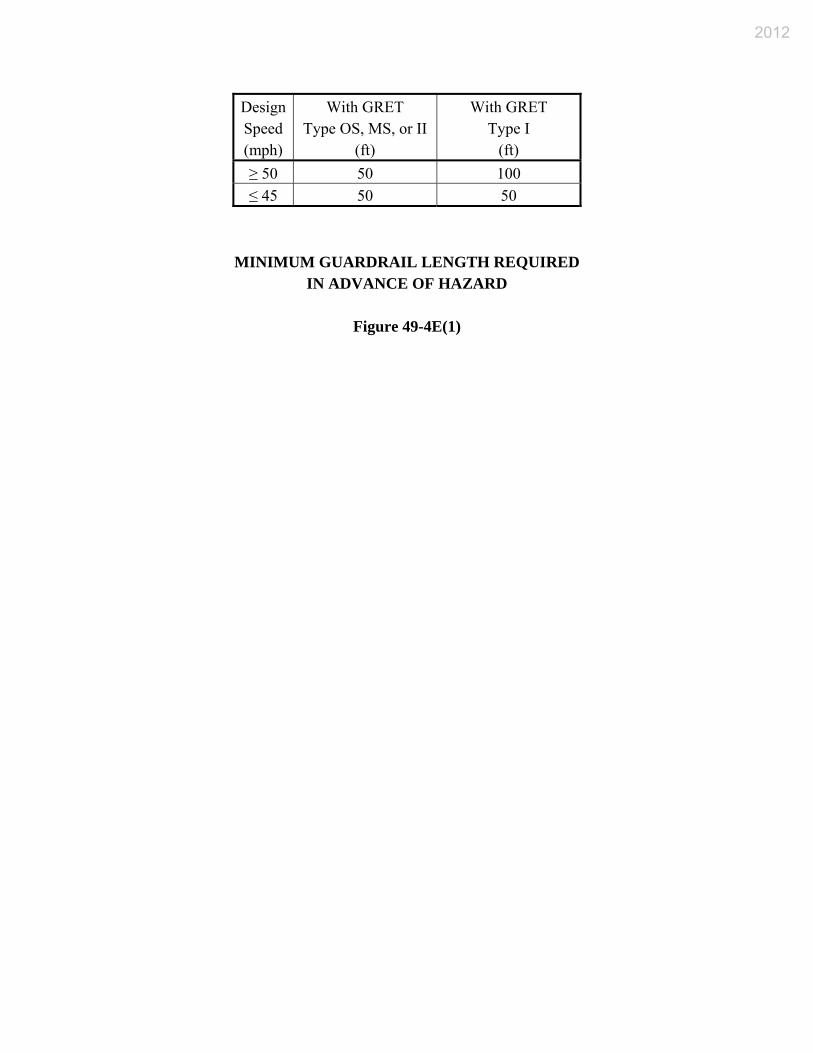
Design Speed (mph)
With GRET Type OS, MS, or II
(ft)
With GRET Type I
(ft)
≥ 50 50 100
≤ 45 50 50
MINIMUM GUARDRAIL LENGTH REQUIRED IN ADVANCE OF HAZARD
Figure 49-4E(1)
2012
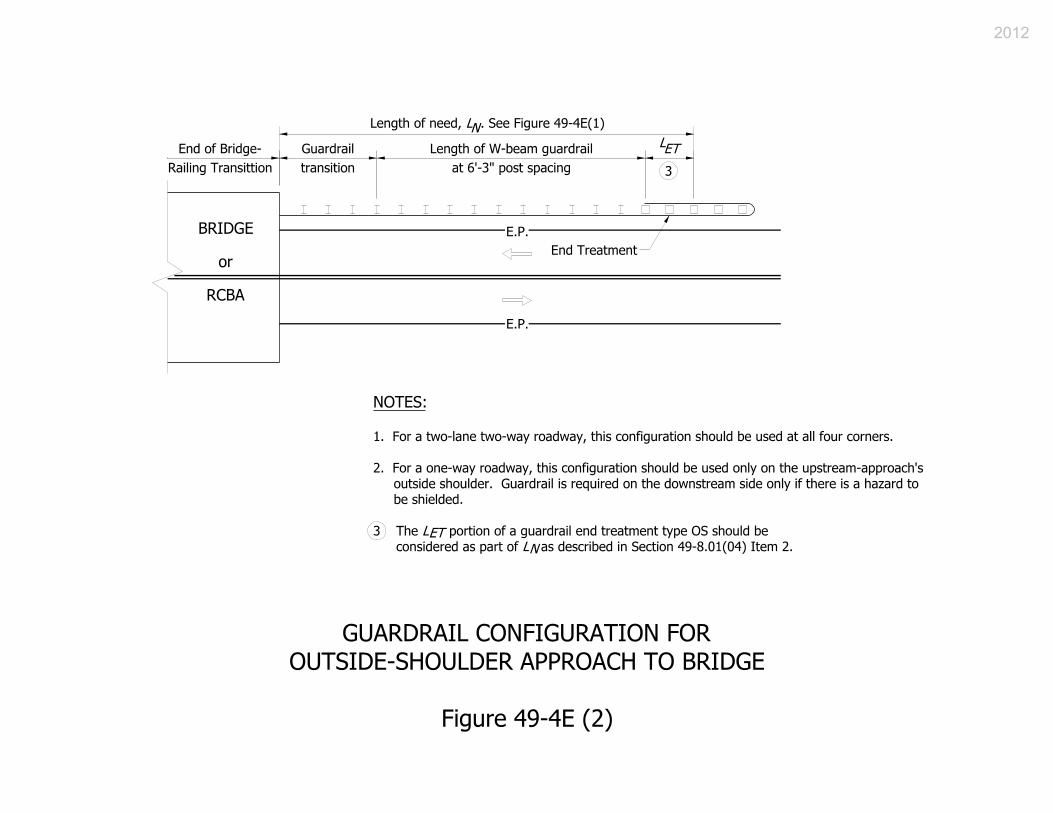
2012
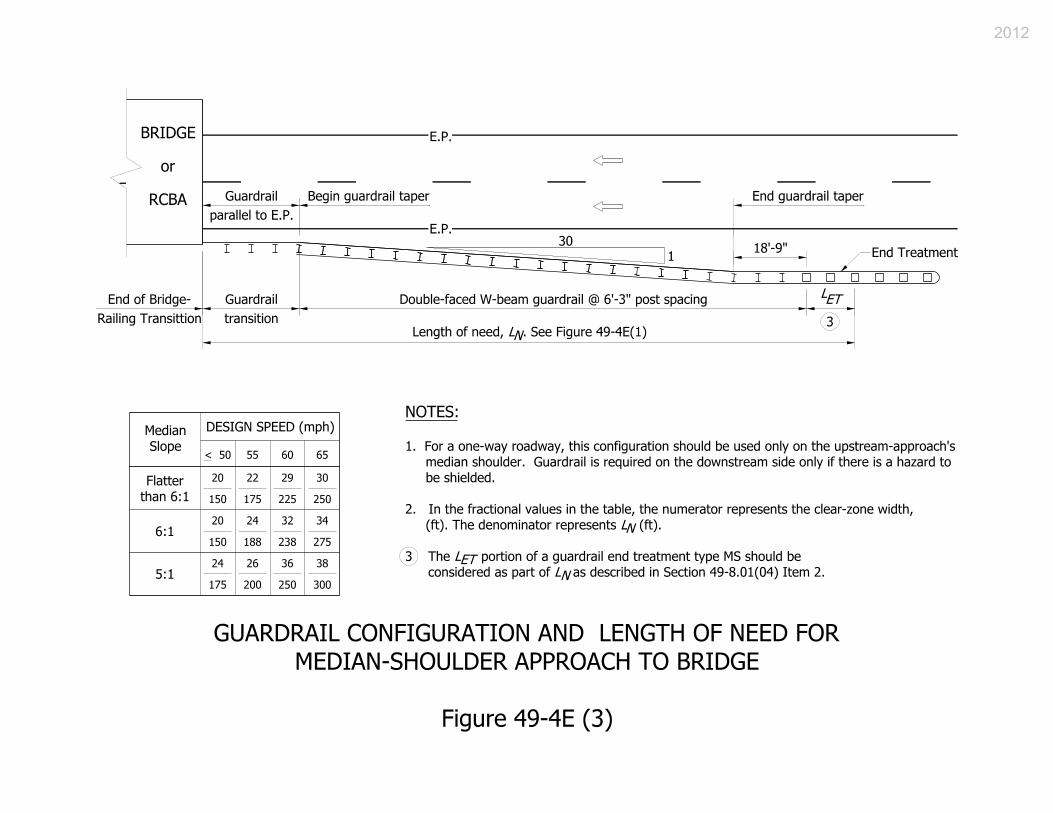
2012
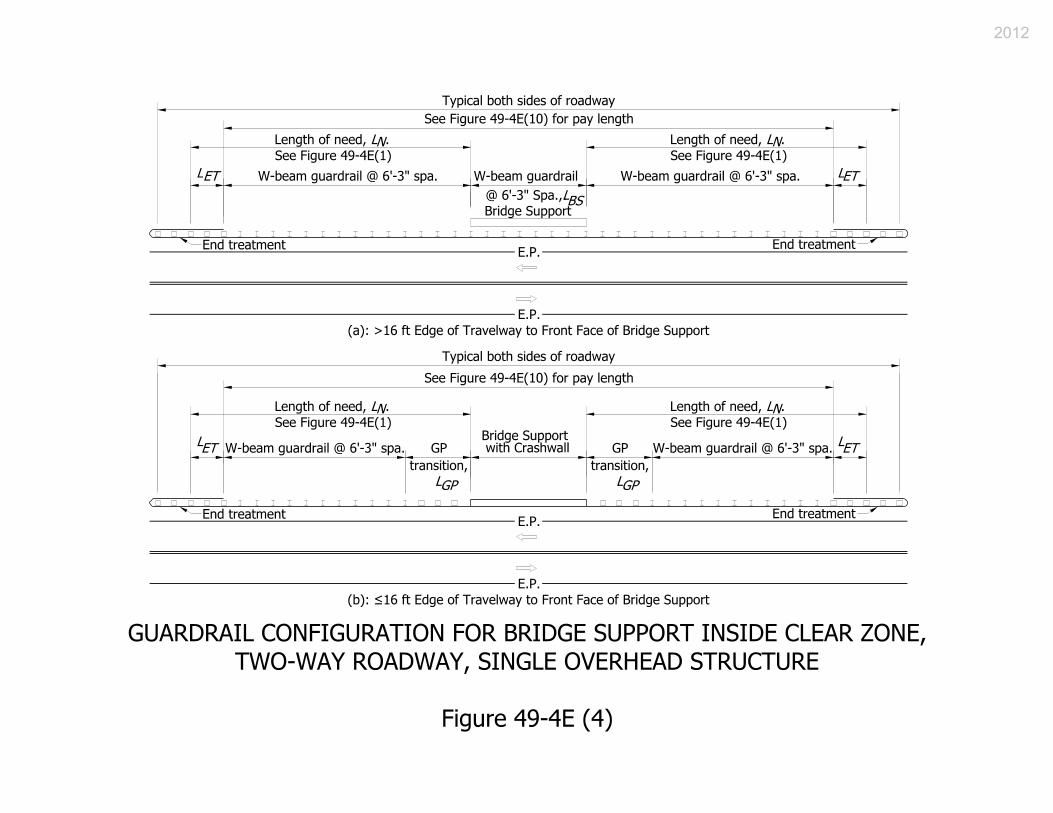
2012
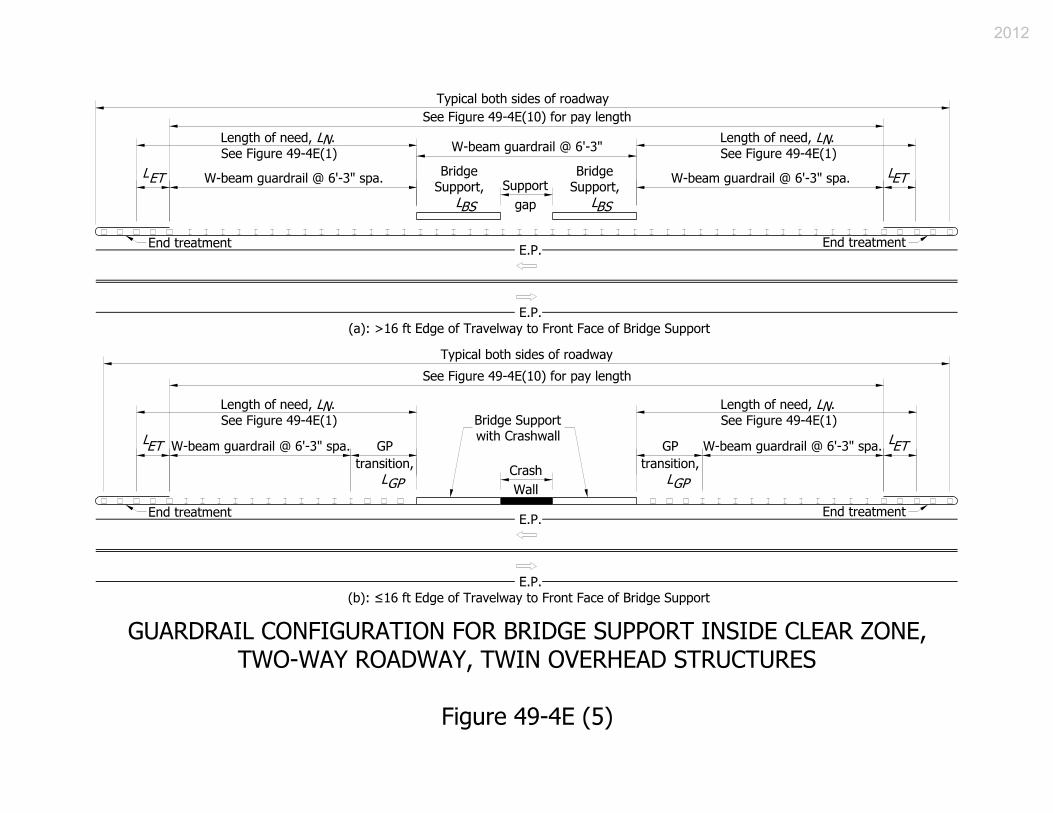
2012
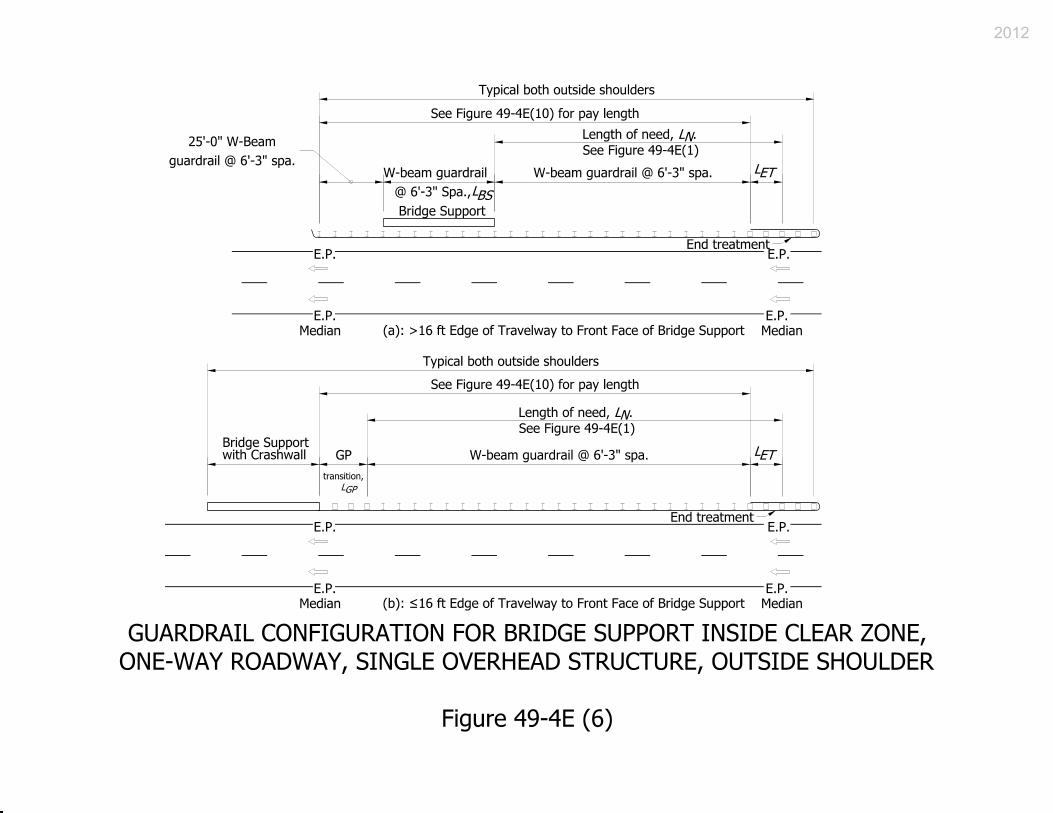
2012
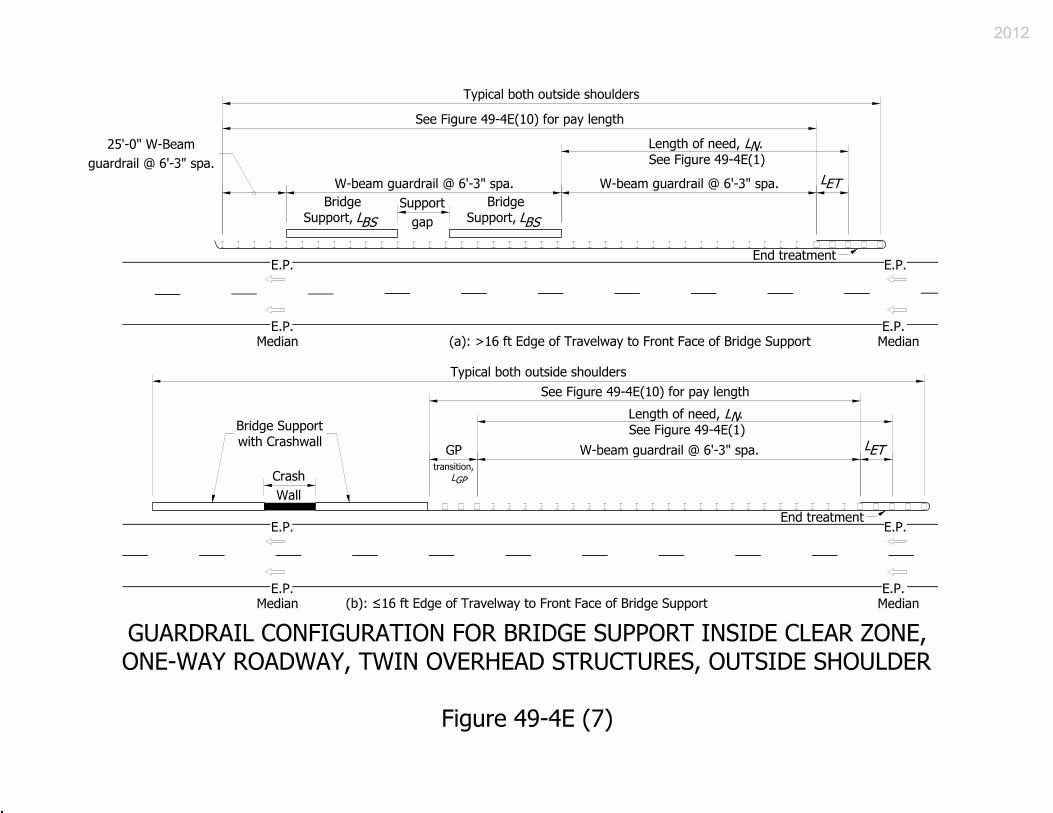
2012
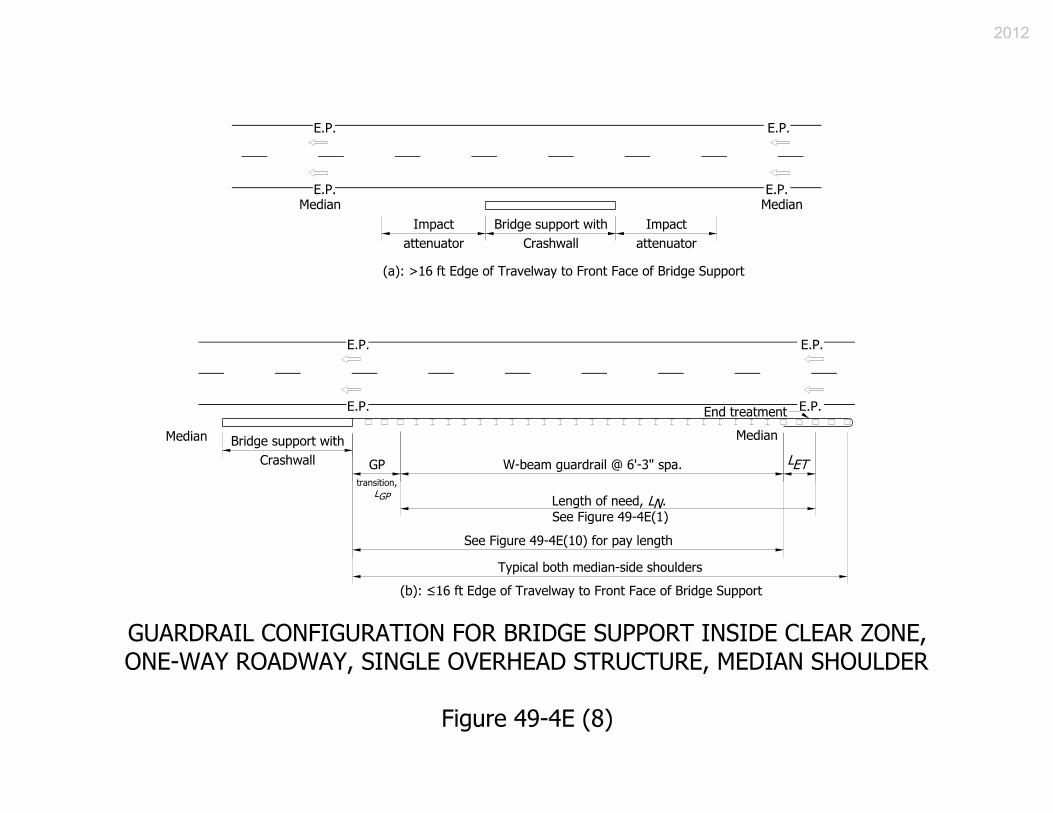
2012
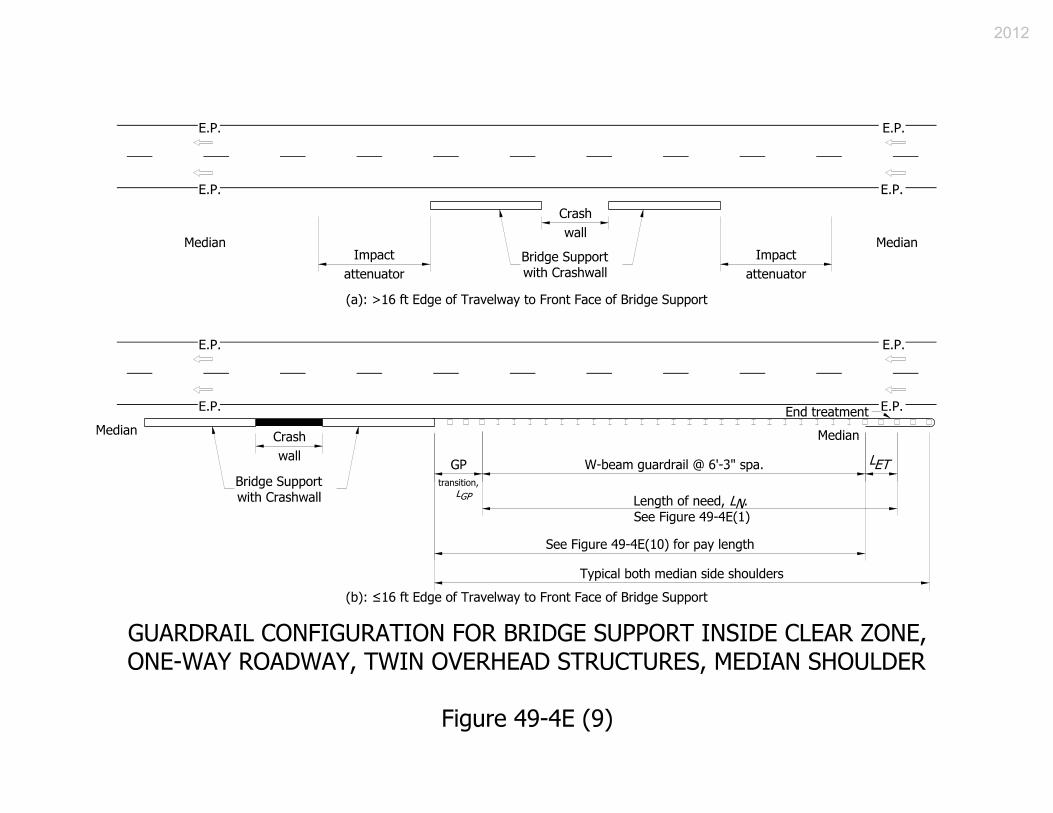
2012
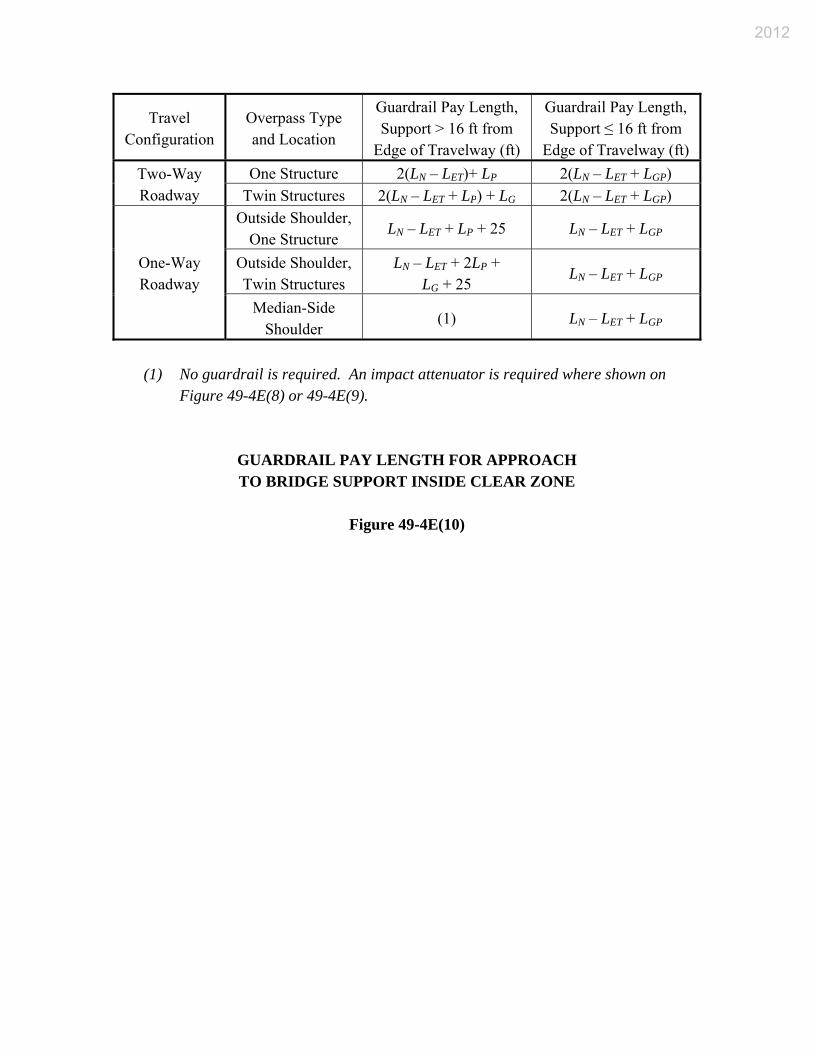
Travel Configuration
Overpass Type and Location
Guardrail Pay Length, Support > 16 ft from
Edge of Travelway (ft)
Guardrail Pay Length, Support ≤ 16 ft from
Edge of Travelway (ft)
Two-Way Roadway
One Structure 2(LN – LET)+ LP 2(LN – LET + LGP)
Twin Structures 2(LN – LET + LP) + LG 2(LN – LET + LGP)
One-Way Roadway
Outside Shoulder, One Structure
LN – LET + LP + 25 LN – LET + LGP
Outside Shoulder, Twin Structures
LN – LET + 2LP + LG + 25
LN – LET + LGP
Median-Side Shoulder
(1) LN – LET + LGP
(1) No guardrail is required. An impact attenuator is required where shown on Figure 49-4E(8) or 49-4E(9).
GUARDRAIL PAY LENGTH FOR APPROACH TO BRIDGE SUPPORT INSIDE CLEAR ZONE
Figure 49-4E(10)
2012
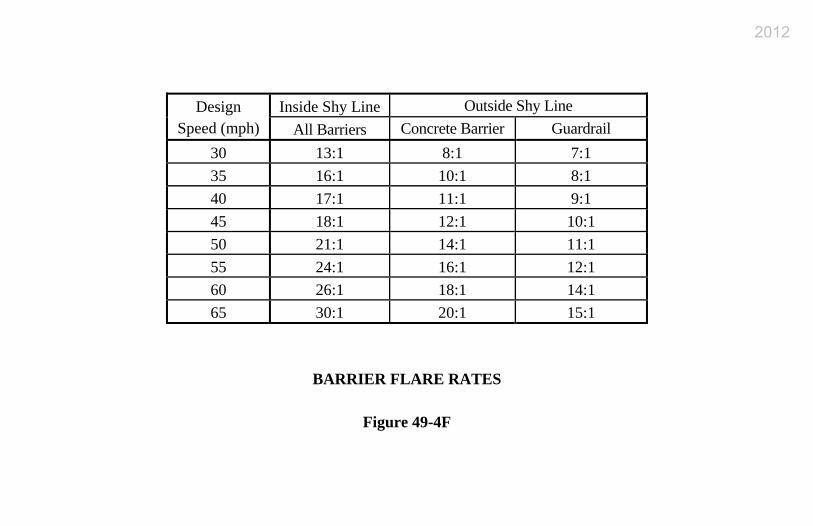
Inside Shy Line Outside Shy Line Design
Speed (mph) All Barriers Concrete Barrier Guardrail 30 13:1 8:1 7:1 35 16:1 10:1 8:1 40 17:1 11:1 9:1 45 18:1 12:1 10:1 50 21:1 14:1 11:1 55 24:1 16:1 12:1 60 26:1 18:1 14:1 65 30:1 20:1 15:1
BARRIER FLARE RATES
Figure 49-4F
2012
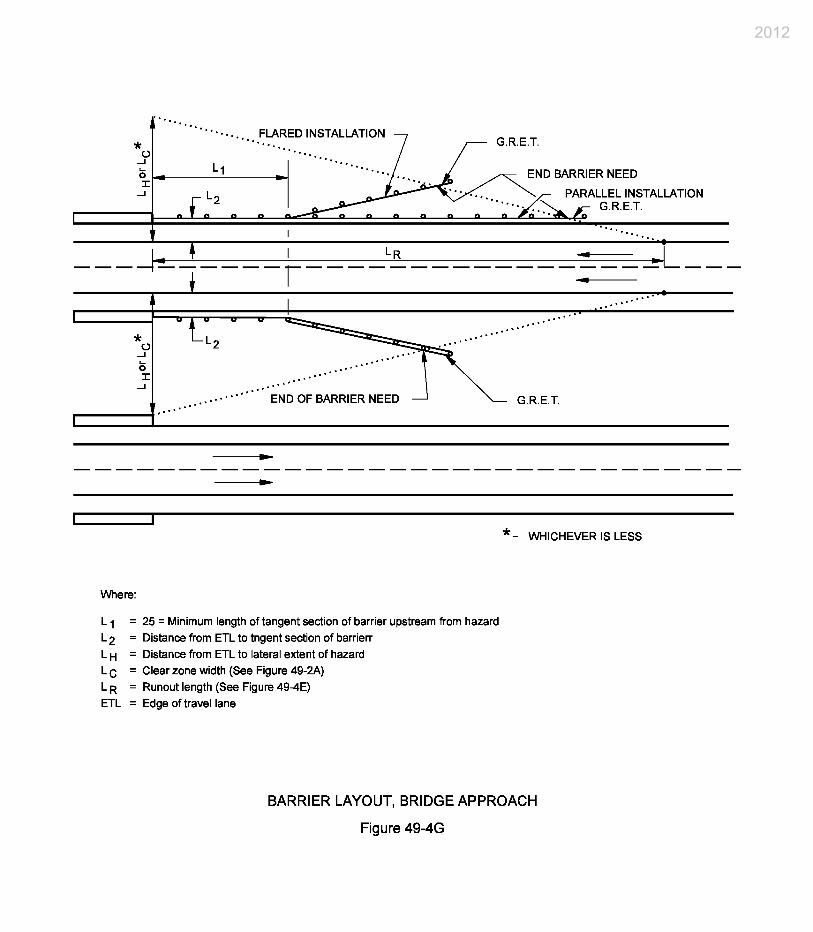
2012
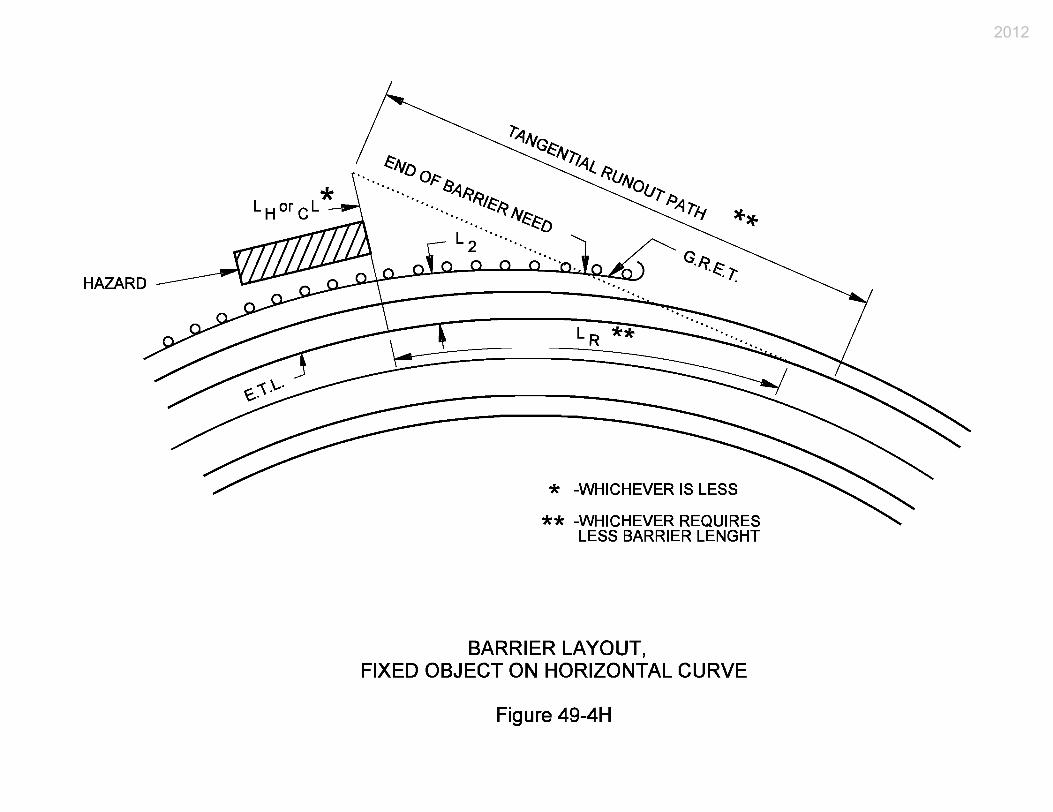
2012
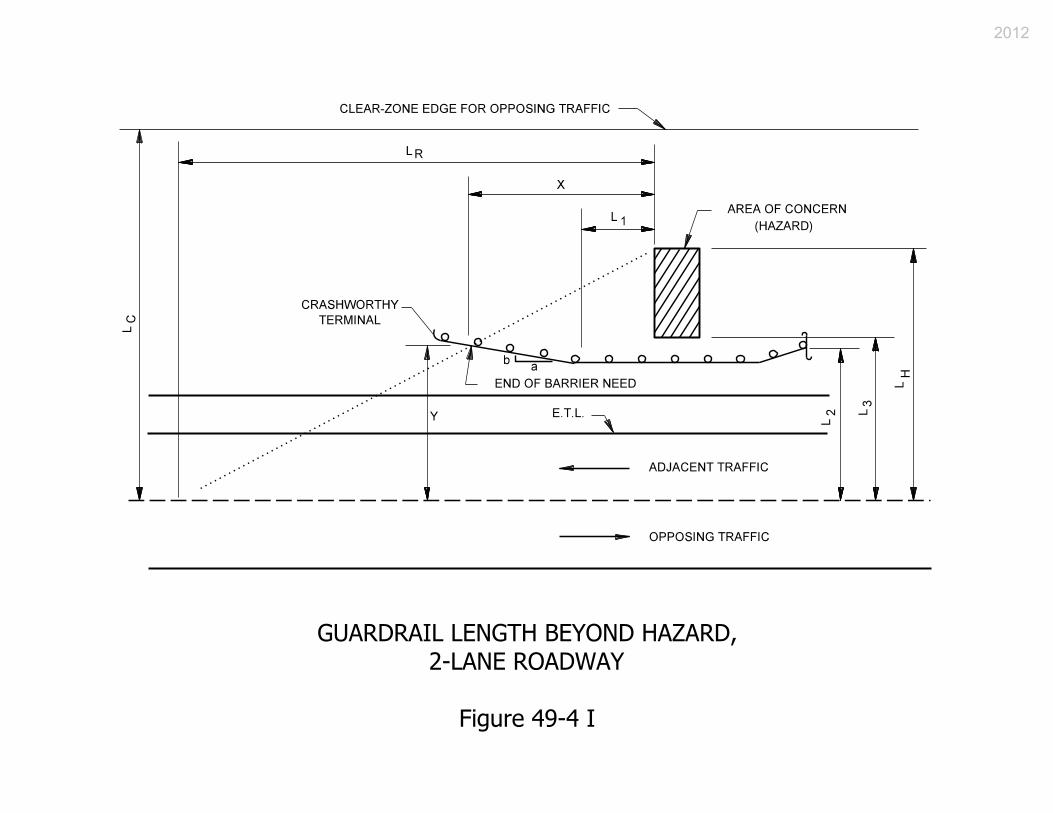
2012
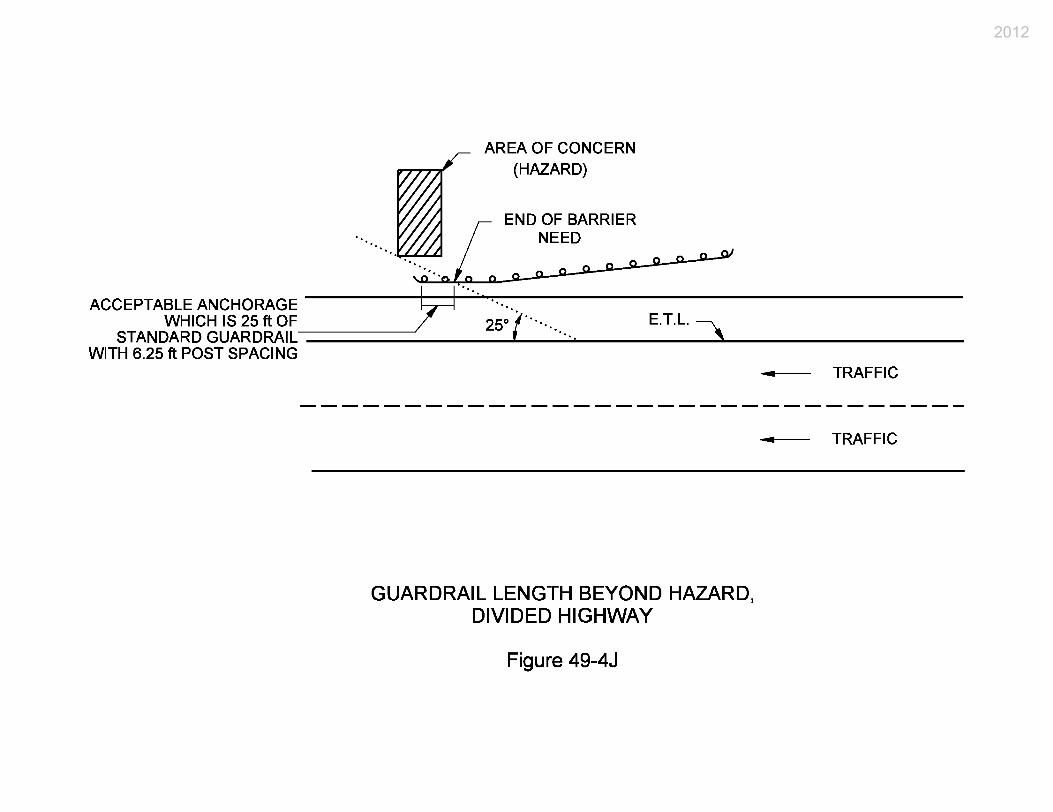
2012
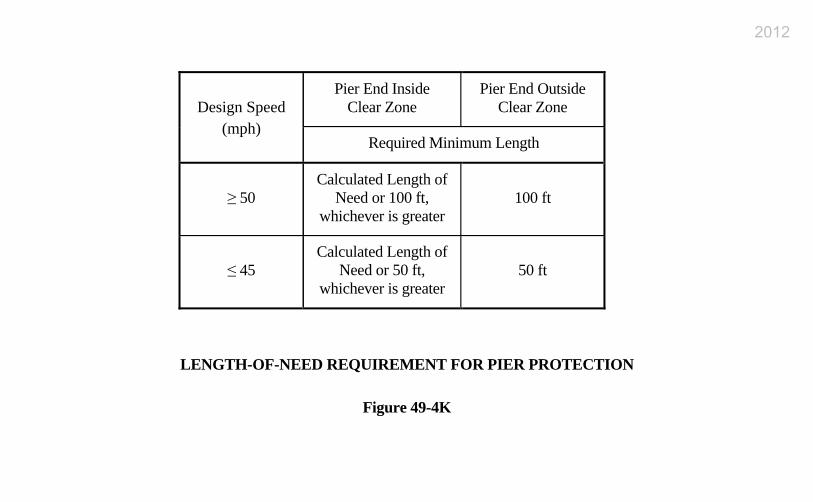
Pier End Inside Clear Zone
Pier End Outside Clear Zone Design Speed
(mph) Required Minimum Length
≥ 50 Calculated Length of
Need or 100 ft, whichever is greater
100 ft
≤ 45 Calculated Length of
Need or 50 ft, whichever is greater
50 ft
LENGTH-OF-NEED REQUIREMENT FOR PIER PROTECTION
Figure 49-4K
2012
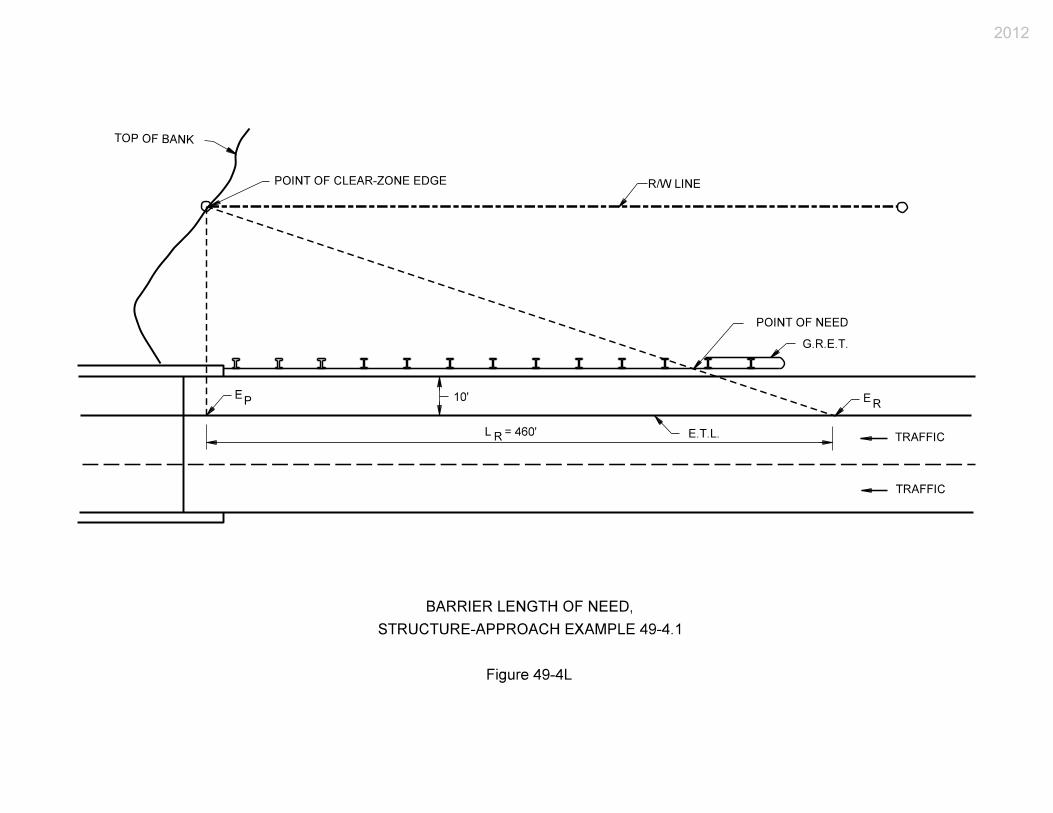
2012
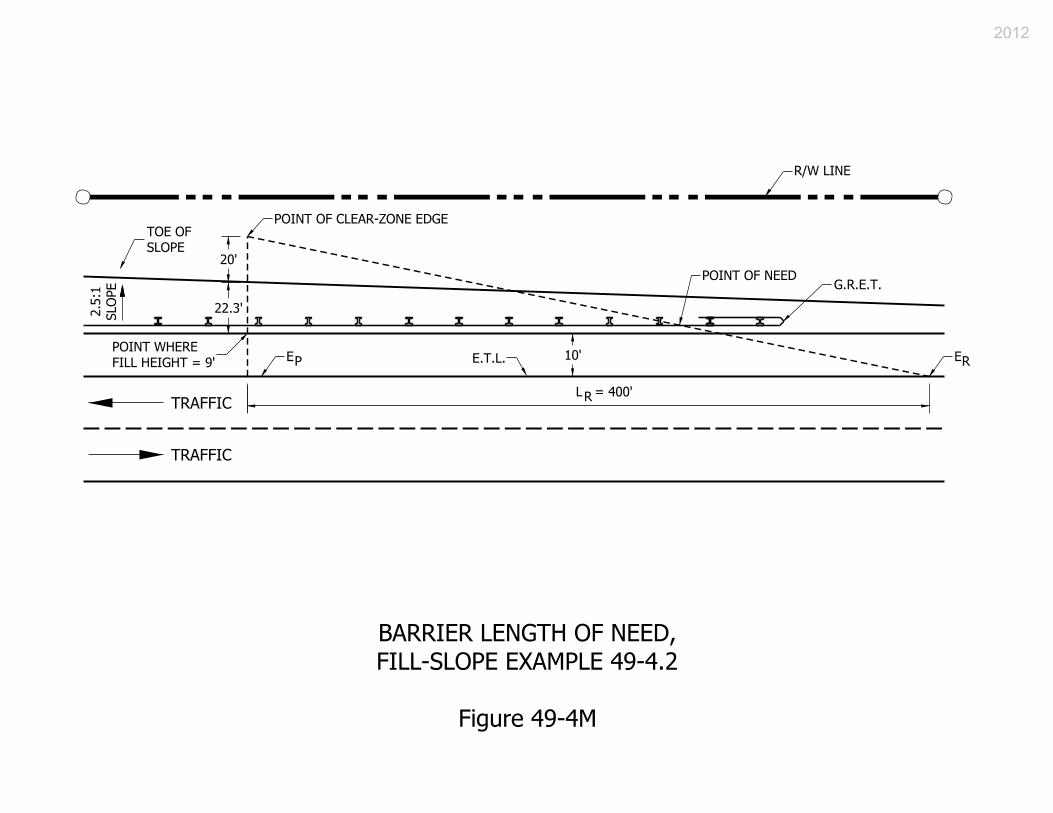
2012
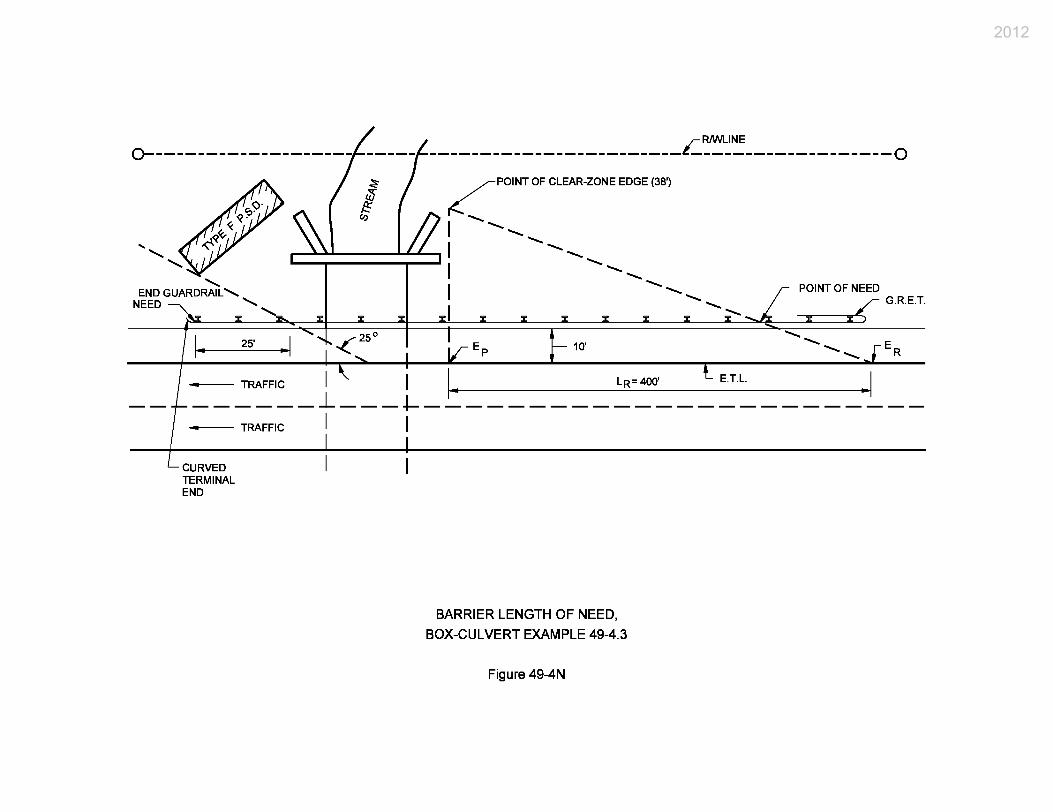
2012
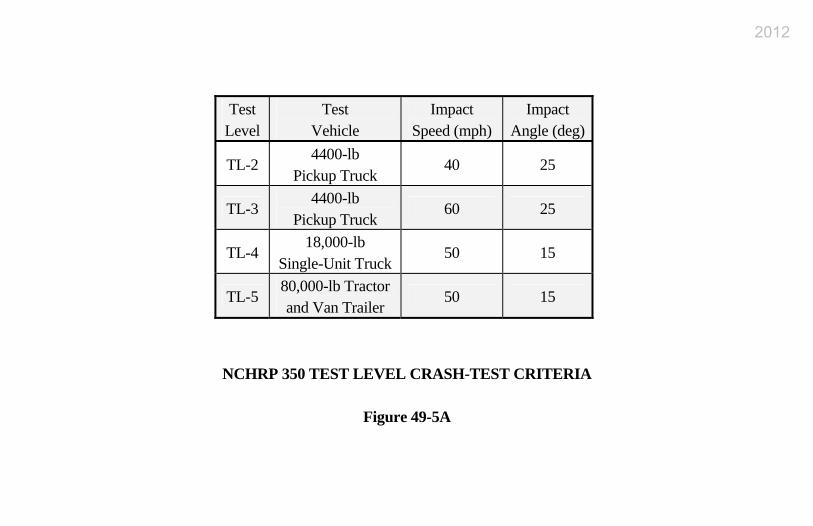
Test Level
Test Vehicle
Impact Speed (mph)
Impact Angle (deg)
TL-2 4400-lb
Pickup Truck 40 25
TL-3 4400-lb
Pickup Truck 60 25
TL-4 18,000-lb
Single-Unit Truck 50 15
TL-5 80,000-lb Tractor and Van Trailer
50 15
NCHRP 350 TEST LEVEL CRASH-TEST CRITERIA
Figure 49-5A
2012
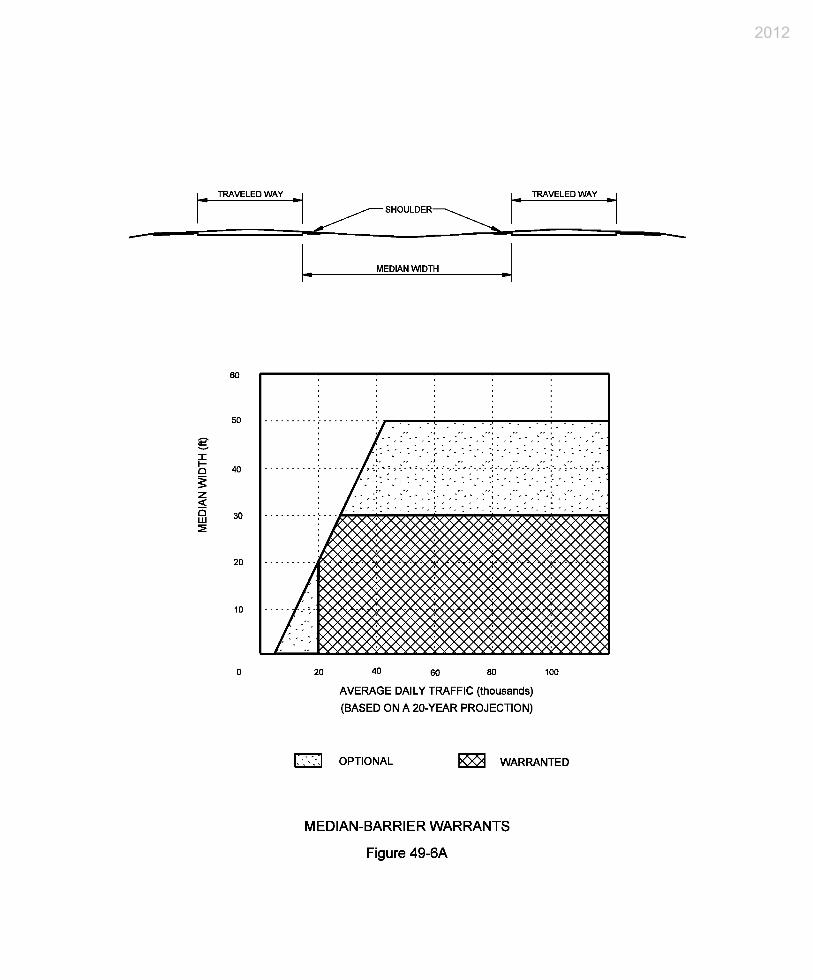
2012
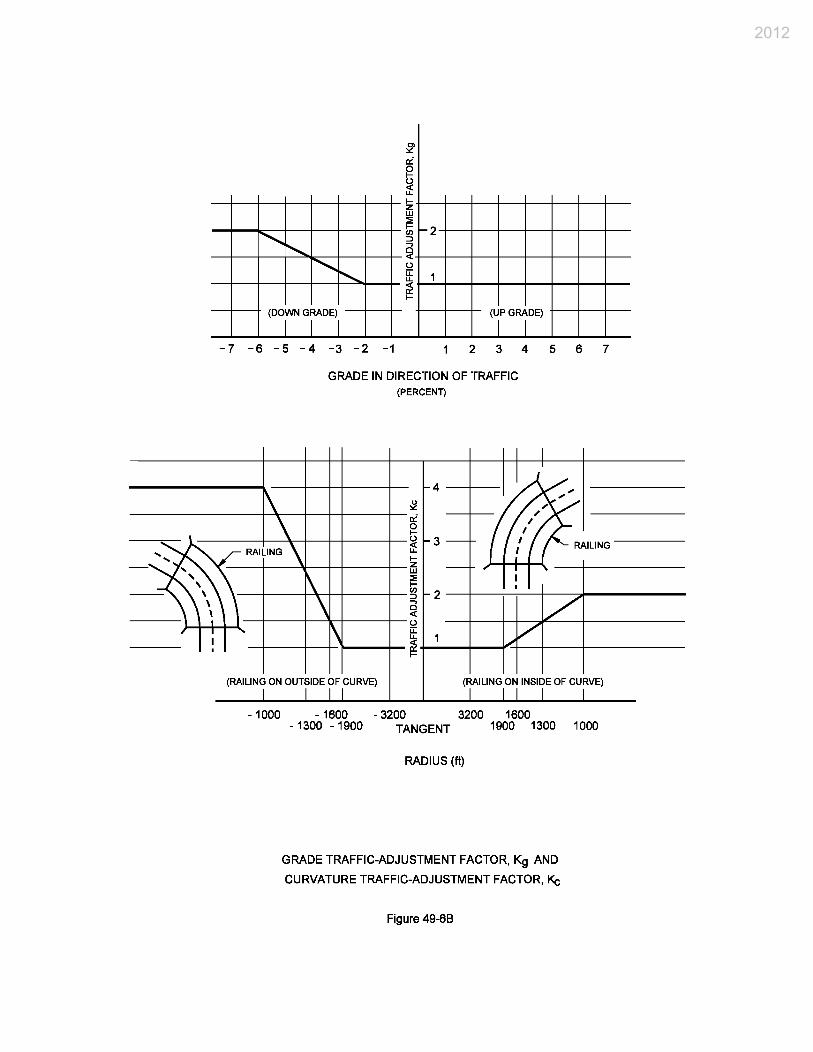
2012
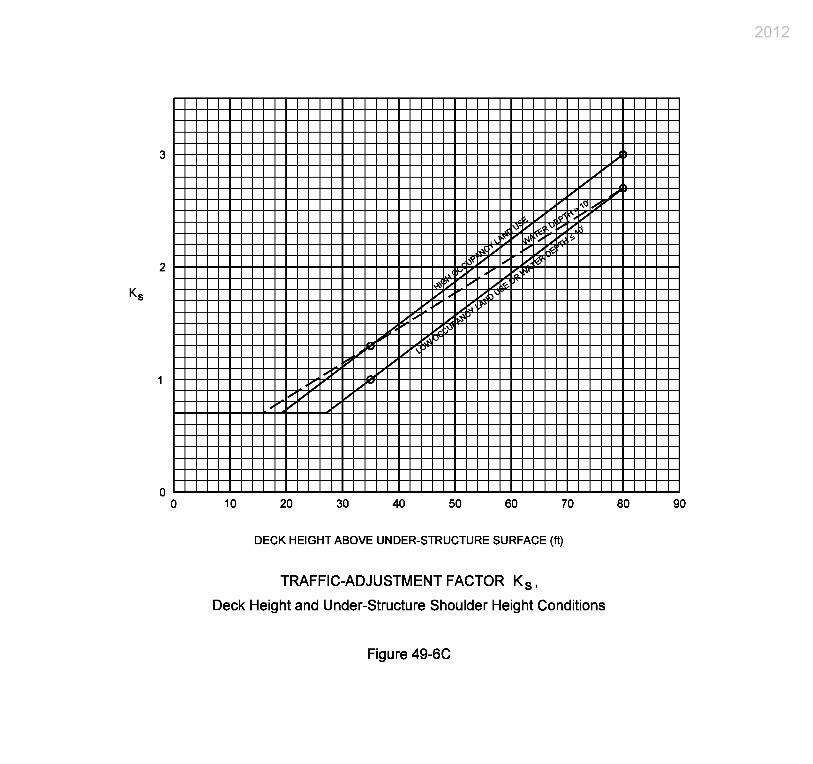
2012
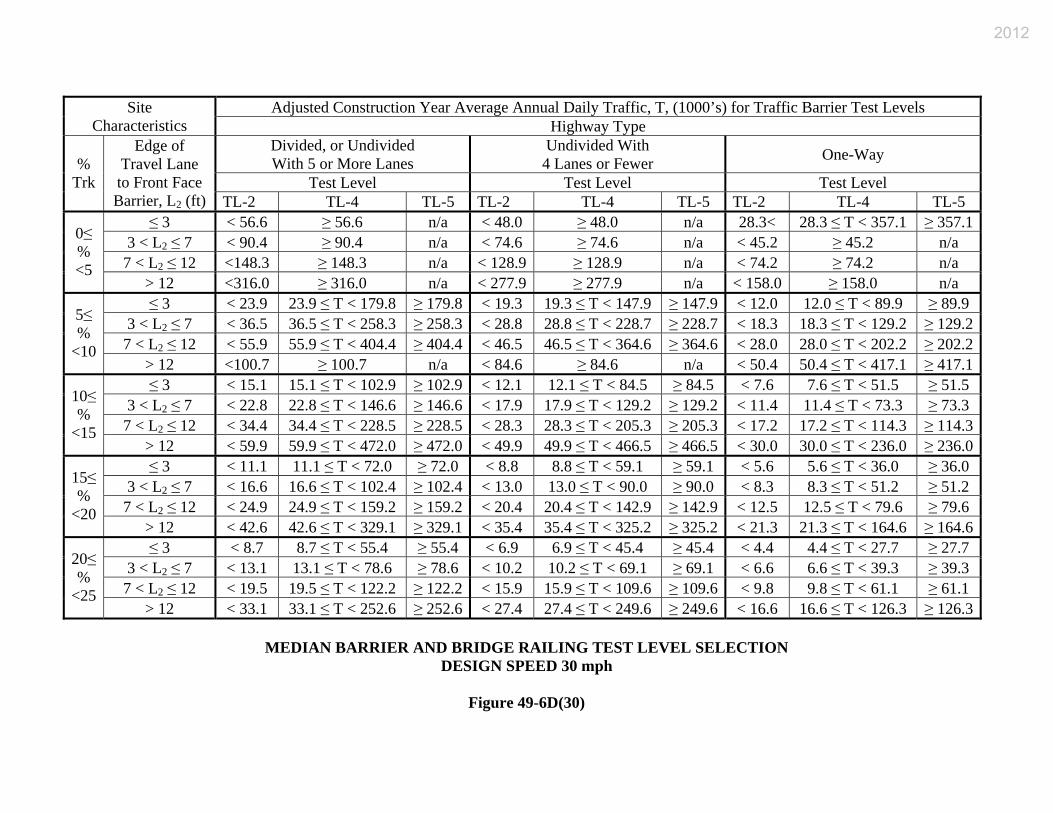
Adjusted Construction Year Average Annual Daily Traffic, T, (1000’s) for Traffic Barrier Test Levels Site Characteristics Highway Type
Divided, or Undivided With 5 or More Lanes
Undivided With 4 Lanes or Fewer One-Way
Test Level Test Level Test Level %
Trk
Edge of Travel Lane to Front Face Barrier, L2 (ft) TL-2 TL-4 TL-5 TL-2 TL-4 TL-5 TL-2 TL-4 TL-5
≤ 3 < 56.6 ≥ 56.6 n/a < 48.0 ≥ 48.0 n/a 28.3< 28.3 ≤ T < 357.1 ≥ 357.13 < L2 ≤ 7 < 90.4 ≥ 90.4 n/a < 74.6 ≥ 74.6 n/a < 45.2 ≥ 45.2 n/a 7 < L2 ≤ 12 <148.3 ≥ 148.3 n/a < 128.9 ≥ 128.9 n/a < 74.2 ≥ 74.2 n/a
0≤ % <5
> 12 <316.0 ≥ 316.0 n/a < 277.9 ≥ 277.9 n/a < 158.0 ≥ 158.0 n/a ≤ 3 < 23.9 23.9 ≤ T < 179.8 ≥ 179.8 < 19.3 19.3 ≤ T < 147.9 ≥ 147.9 < 12.0 12.0 ≤ T < 89.9 ≥ 89.9
3 < L2 ≤ 7 < 36.5 36.5 ≤ T < 258.3 ≥ 258.3 < 28.8 28.8 ≤ T < 228.7 ≥ 228.7 < 18.3 18.3 ≤ T < 129.2 ≥ 129.27 < L2 ≤ 12 < 55.9 55.9 ≤ T < 404.4 ≥ 404.4 < 46.5 46.5 ≤ T < 364.6 ≥ 364.6 < 28.0 28.0 ≤ T < 202.2 ≥ 202.2
5≤ %
<10 > 12 <100.7 ≥ 100.7 n/a < 84.6 ≥ 84.6 n/a < 50.4 50.4 ≤ T < 417.1 ≥ 417.1≤ 3 < 15.1 15.1 ≤ T < 102.9 ≥ 102.9 < 12.1 12.1 ≤ T < 84.5 ≥ 84.5 < 7.6 7.6 ≤ T < 51.5 ≥ 51.5
3 < L2 ≤ 7 < 22.8 22.8 ≤ T < 146.6 ≥ 146.6 < 17.9 17.9 ≤ T < 129.2 ≥ 129.2 < 11.4 11.4 ≤ T < 73.3 ≥ 73.3 7 < L2 ≤ 12 < 34.4 34.4 ≤ T < 228.5 ≥ 228.5 < 28.3 28.3 ≤ T < 205.3 ≥ 205.3 < 17.2 17.2 ≤ T < 114.3 ≥ 114.3
10≤ %
<15 > 12 < 59.9 59.9 ≤ T < 472.0 ≥ 472.0 < 49.9 49.9 ≤ T < 466.5 ≥ 466.5 < 30.0 30.0 ≤ T < 236.0 ≥ 236.0≤ 3 < 11.1 11.1 ≤ T < 72.0 ≥ 72.0 < 8.8 8.8 ≤ T < 59.1 ≥ 59.1 < 5.6 5.6 ≤ T < 36.0 ≥ 36.0
3 < L2 ≤ 7 < 16.6 16.6 ≤ T < 102.4 ≥ 102.4 < 13.0 13.0 ≤ T < 90.0 ≥ 90.0 < 8.3 8.3 ≤ T < 51.2 ≥ 51.2 7 < L2 ≤ 12 < 24.9 24.9 ≤ T < 159.2 ≥ 159.2 < 20.4 20.4 ≤ T < 142.9 ≥ 142.9 < 12.5 12.5 ≤ T < 79.6 ≥ 79.6
15≤ %
<20 > 12 < 42.6 42.6 ≤ T < 329.1 ≥ 329.1 < 35.4 35.4 ≤ T < 325.2 ≥ 325.2 < 21.3 21.3 ≤ T < 164.6 ≥ 164.6≤ 3 < 8.7 8.7 ≤ T < 55.4 ≥ 55.4 < 6.9 6.9 ≤ T < 45.4 ≥ 45.4 < 4.4 4.4 ≤ T < 27.7 ≥ 27.7
3 < L2 ≤ 7 < 13.1 13.1 ≤ T < 78.6 ≥ 78.6 < 10.2 10.2 ≤ T < 69.1 ≥ 69.1 < 6.6 6.6 ≤ T < 39.3 ≥ 39.3 7 < L2 ≤ 12 < 19.5 19.5 ≤ T < 122.2 ≥ 122.2 < 15.9 15.9 ≤ T < 109.6 ≥ 109.6 < 9.8 9.8 ≤ T < 61.1 ≥ 61.1
20≤ %
<25 > 12 < 33.1 33.1 ≤ T < 252.6 ≥ 252.6 < 27.4 27.4 ≤ T < 249.6 ≥ 249.6 < 16.6 16.6 ≤ T < 126.3 ≥ 126.3
MEDIAN BARRIER AND BRIDGE RAILING TEST LEVEL SELECTION
DESIGN SPEED 30 mph
Figure 49-6D(30)
2012
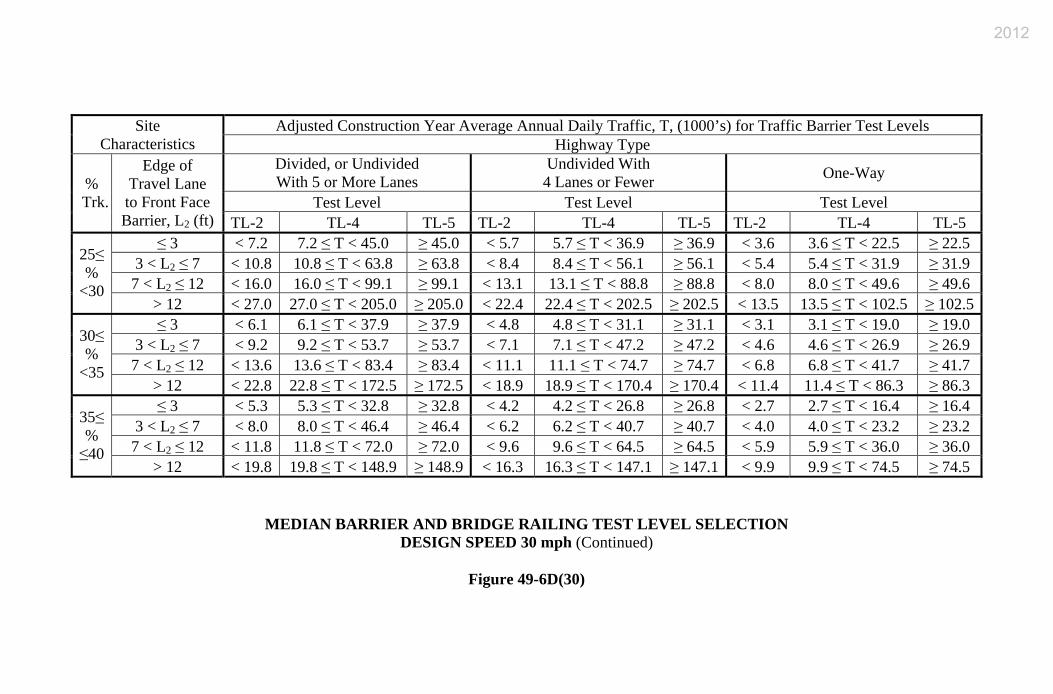
Adjusted Construction Year Average Annual Daily Traffic, T, (1000’s) for Traffic Barrier Test Levels Site
Characteristics Highway Type Divided, or Undivided With 5 or More Lanes
Undivided With 4 Lanes or Fewer One-Way
Test Level Test Level Test Level % Trk.
Edge of Travel Lane to Front Face Barrier, L2 (ft) TL-2 TL-4 TL-5 TL-2 TL-4 TL-5 TL-2 TL-4 TL-5
≤ 3 < 7.2 7.2 ≤ T < 45.0 ≥ 45.0 < 5.7 5.7 ≤ T < 36.9 ≥ 36.9 < 3.6 3.6 ≤ T < 22.5 ≥ 22.5 3 < L2 ≤ 7 < 10.8 10.8 ≤ T < 63.8 ≥ 63.8 < 8.4 8.4 ≤ T < 56.1 ≥ 56.1 < 5.4 5.4 ≤ T < 31.9 ≥ 31.9 7 < L2 ≤ 12 < 16.0 16.0 ≤ T < 99.1 ≥ 99.1 < 13.1 13.1 ≤ T < 88.8 ≥ 88.8 < 8.0 8.0 ≤ T < 49.6 ≥ 49.6
25≤ %
<30 > 12 < 27.0 27.0 ≤ T < 205.0 ≥ 205.0 < 22.4 22.4 ≤ T < 202.5 ≥ 202.5 < 13.5 13.5 ≤ T < 102.5 ≥ 102.5≤ 3 < 6.1 6.1 ≤ T < 37.9 ≥ 37.9 < 4.8 4.8 ≤ T < 31.1 ≥ 31.1 < 3.1 3.1 ≤ T < 19.0 ≥ 19.0
3 < L2 ≤ 7 < 9.2 9.2 ≤ T < 53.7 ≥ 53.7 < 7.1 7.1 ≤ T < 47.2 ≥ 47.2 < 4.6 4.6 ≤ T < 26.9 ≥ 26.9 7 < L2 ≤ 12 < 13.6 13.6 ≤ T < 83.4 ≥ 83.4 < 11.1 11.1 ≤ T < 74.7 ≥ 74.7 < 6.8 6.8 ≤ T < 41.7 ≥ 41.7
30≤ %
<35 > 12 < 22.8 22.8 ≤ T < 172.5 ≥ 172.5 < 18.9 18.9 ≤ T < 170.4 ≥ 170.4 < 11.4 11.4 ≤ T < 86.3 ≥ 86.3 ≤ 3 < 5.3 5.3 ≤ T < 32.8 ≥ 32.8 < 4.2 4.2 ≤ T < 26.8 ≥ 26.8 < 2.7 2.7 ≤ T < 16.4 ≥ 16.4
3 < L2 ≤ 7 < 8.0 8.0 ≤ T < 46.4 ≥ 46.4 < 6.2 6.2 ≤ T < 40.7 ≥ 40.7 < 4.0 4.0 ≤ T < 23.2 ≥ 23.2 7 < L2 ≤ 12 < 11.8 11.8 ≤ T < 72.0 ≥ 72.0 < 9.6 9.6 ≤ T < 64.5 ≥ 64.5 < 5.9 5.9 ≤ T < 36.0 ≥ 36.0
35≤ % ≤40
> 12 < 19.8 19.8 ≤ T < 148.9 ≥ 148.9 < 16.3 16.3 ≤ T < 147.1 ≥ 147.1 < 9.9 9.9 ≤ T < 74.5 ≥ 74.5
MEDIAN BARRIER AND BRIDGE RAILING TEST LEVEL SELECTION DESIGN SPEED 30 mph (Continued)
Figure 49-6D(30)
2012
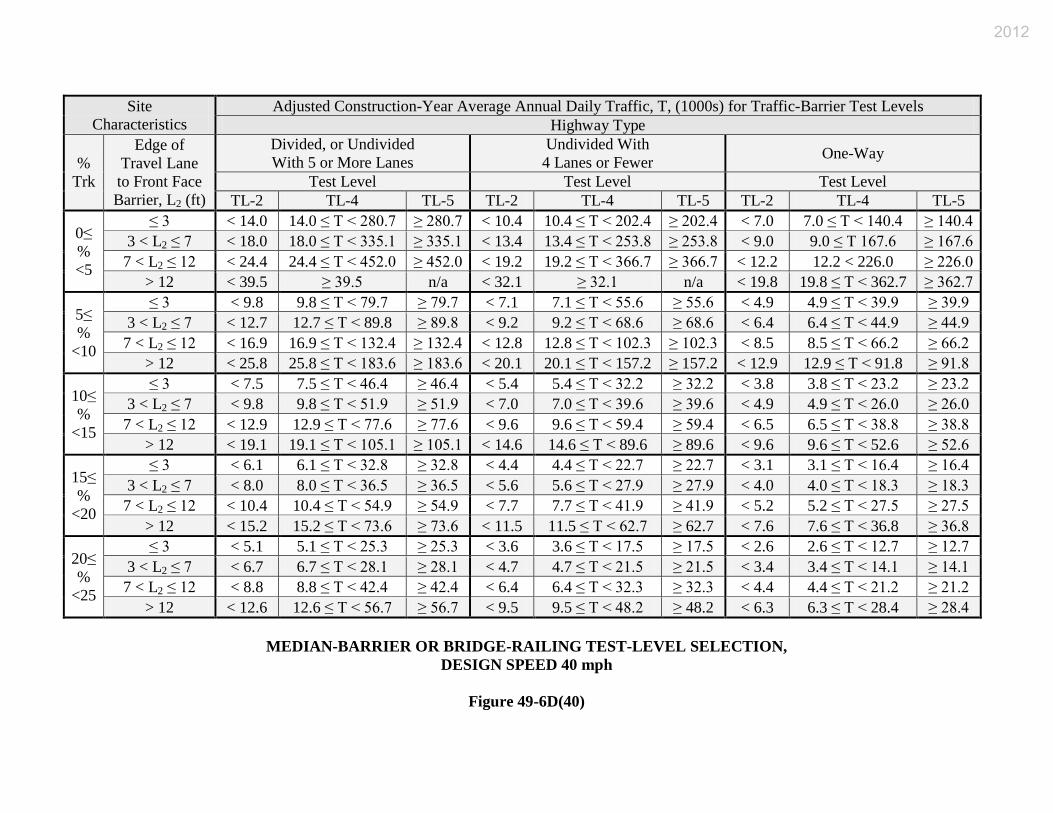
Site Characteristics
Adjusted Construction-Year Average Annual Daily Traffic, T, (1000s) for Traffic-Barrier Test Levels Highway Type
% Trk
Edge of Travel Lane to Front Face Barrier, L2 (ft)
Divided, or Undivided With 5 or More Lanes
Undivided With 4 Lanes or Fewer One-Way
Test Level Test Level Test Level TL-2 TL-4 TL-5 TL-2 TL-4 TL-5 TL-2 TL-4 TL-5
0≤ % <5
≤ 3 < 14.0 14.0 ≤ T < 280.7 ≥ 280.7 < 10.4 10.4 ≤ T < 202.4 ≥ 202.4 < 7.0 7.0 ≤ T < 140.4 ≥ 140.4 3 < L2 ≤ 7 < 18.0 18.0 ≤ T < 335.1 ≥ 335.1 < 13.4 13.4 ≤ T < 253.8 ≥ 253.8 < 9.0 9.0 ≤ T 167.6 ≥ 167.6 7 < L2 ≤ 12 < 24.4 24.4 ≤ T < 452.0 ≥ 452.0 < 19.2 19.2 ≤ T < 366.7 ≥ 366.7 < 12.2 12.2 < 226.0 ≥ 226.0
> 12 < 39.5 ≥ 39.5 n/a < 32.1 ≥ 32.1 n/a < 19.8 19.8 ≤ T < 362.7 ≥ 362.7
5≤ %
<10
≤ 3 < 9.8 9.8 ≤ T < 79.7 ≥ 79.7 < 7.1 7.1 ≤ T < 55.6 ≥ 55.6 < 4.9 4.9 ≤ T < 39.9 ≥ 39.9 3 < L2 ≤ 7 < 12.7 12.7 ≤ T < 89.8 ≥ 89.8 < 9.2 9.2 ≤ T < 68.6 ≥ 68.6 < 6.4 6.4 ≤ T < 44.9 ≥ 44.9 7 < L2 ≤ 12 < 16.9 16.9 ≤ T < 132.4 ≥ 132.4 < 12.8 12.8 ≤ T < 102.3 ≥ 102.3 < 8.5 8.5 ≤ T < 66.2 ≥ 66.2
> 12 < 25.8 25.8 ≤ T < 183.6 ≥ 183.6 < 20.1 20.1 ≤ T < 157.2 ≥ 157.2 < 12.9 12.9 ≤ T < 91.8 ≥ 91.8
10≤ %
<15
≤ 3 < 7.5 7.5 ≤ T < 46.4 ≥ 46.4 < 5.4 5.4 ≤ T < 32.2 ≥ 32.2 < 3.8 3.8 ≤ T < 23.2 ≥ 23.2 3 < L2 ≤ 7 < 9.8 9.8 ≤ T < 51.9 ≥ 51.9 < 7.0 7.0 ≤ T < 39.6 ≥ 39.6 < 4.9 4.9 ≤ T < 26.0 ≥ 26.0 7 < L2 ≤ 12 < 12.9 12.9 ≤ T < 77.6 ≥ 77.6 < 9.6 9.6 ≤ T < 59.4 ≥ 59.4 < 6.5 6.5 ≤ T < 38.8 ≥ 38.8
> 12 < 19.1 19.1 ≤ T < 105.1 ≥ 105.1 < 14.6 14.6 ≤ T < 89.6 ≥ 89.6 < 9.6 9.6 ≤ T < 52.6 ≥ 52.6
15≤ %
<20
≤ 3 < 6.1 6.1 ≤ T < 32.8 ≥ 32.8 < 4.4 4.4 ≤ T < 22.7 ≥ 22.7 < 3.1 3.1 ≤ T < 16.4 ≥ 16.4 3 < L2 ≤ 7 < 8.0 8.0 ≤ T < 36.5 ≥ 36.5 < 5.6 5.6 ≤ T < 27.9 ≥ 27.9 < 4.0 4.0 ≤ T < 18.3 ≥ 18.3 7 < L2 ≤ 12 < 10.4 10.4 ≤ T < 54.9 ≥ 54.9 < 7.7 7.7 ≤ T < 41.9 ≥ 41.9 < 5.2 5.2 ≤ T < 27.5 ≥ 27.5
> 12 < 15.2 15.2 ≤ T < 73.6 ≥ 73.6 < 11.5 11.5 ≤ T < 62.7 ≥ 62.7 < 7.6 7.6 ≤ T < 36.8 ≥ 36.8
20≤ %
<25
≤ 3 < 5.1 5.1 ≤ T < 25.3 ≥ 25.3 < 3.6 3.6 ≤ T < 17.5 ≥ 17.5 < 2.6 2.6 ≤ T < 12.7 ≥ 12.7 3 < L2 ≤ 7 < 6.7 6.7 ≤ T < 28.1 ≥ 28.1 < 4.7 4.7 ≤ T < 21.5 ≥ 21.5 < 3.4 3.4 ≤ T < 14.1 ≥ 14.1 7 < L2 ≤ 12 < 8.8 8.8 ≤ T < 42.4 ≥ 42.4 < 6.4 6.4 ≤ T < 32.3 ≥ 32.3 < 4.4 4.4 ≤ T < 21.2 ≥ 21.2
> 12 < 12.6 12.6 ≤ T < 56.7 ≥ 56.7 < 9.5 9.5 ≤ T < 48.2 ≥ 48.2 < 6.3 6.3 ≤ T < 28.4 ≥ 28.4
MEDIAN-BARRIER OR BRIDGE-RAILING TEST-LEVEL SELECTION, DESIGN SPEED 40 mph
Figure 49-6D(40)
2012
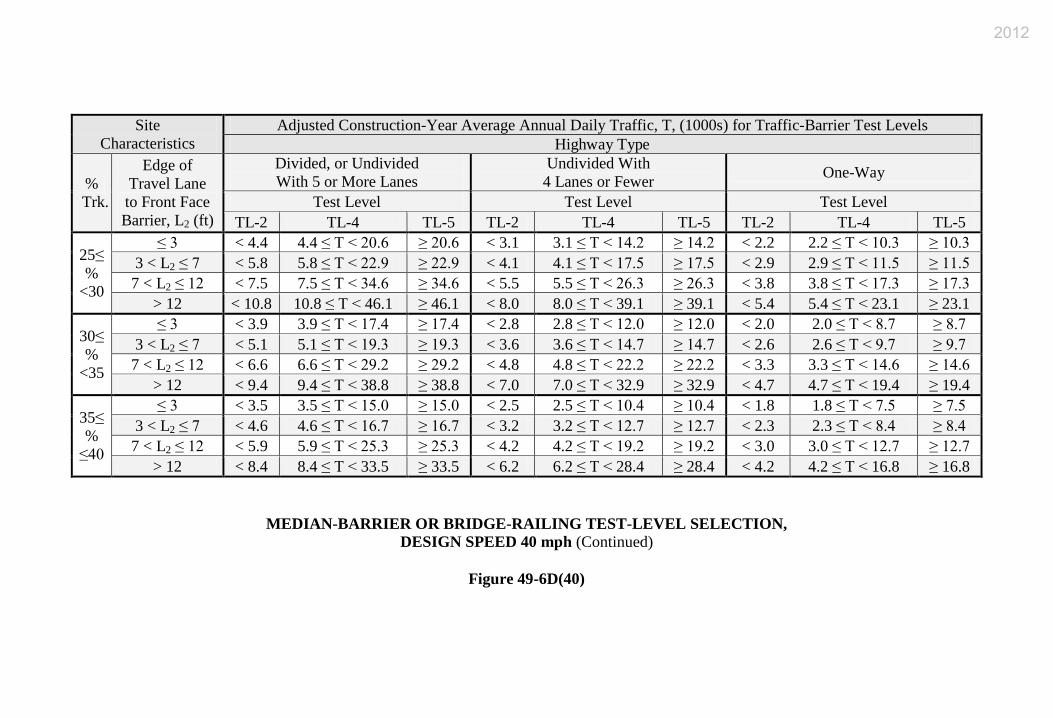
Site
Characteristics Adjusted Construction-Year Average Annual Daily Traffic, T, (1000s) for Traffic-Barrier Test Levels
Highway Type
% Trk.
Edge of Travel Lane to Front Face Barrier, L2 (ft)
Divided, or Undivided With 5 or More Lanes
Undivided With 4 Lanes or Fewer One-Way
Test Level Test Level Test Level TL-2 TL-4 TL-5 TL-2 TL-4 TL-5 TL-2 TL-4 TL-5
25≤ %
<30
≤ 3 < 4.4 4.4 ≤ T < 20.6 ≥ 20.6 < 3.1 3.1 ≤ T < 14.2 ≥ 14.2 < 2.2 2.2 ≤ T < 10.3 ≥ 10.3 3 < L2 ≤ 7 < 5.8 5.8 ≤ T < 22.9 ≥ 22.9 < 4.1 4.1 ≤ T < 17.5 ≥ 17.5 < 2.9 2.9 ≤ T < 11.5 ≥ 11.5 7 < L2 ≤ 12 < 7.5 7.5 ≤ T < 34.6 ≥ 34.6 < 5.5 5.5 ≤ T < 26.3 ≥ 26.3 < 3.8 3.8 ≤ T < 17.3 ≥ 17.3
> 12 < 10.8 10.8 ≤ T < 46.1 ≥ 46.1 < 8.0 8.0 ≤ T < 39.1 ≥ 39.1 < 5.4 5.4 ≤ T < 23.1 ≥ 23.1
30≤ %
<35
≤ 3 < 3.9 3.9 ≤ T < 17.4 ≥ 17.4 < 2.8 2.8 ≤ T < 12.0 ≥ 12.0 < 2.0 2.0 ≤ T < 8.7 ≥ 8.7 3 < L2 ≤ 7 < 5.1 5.1 ≤ T < 19.3 ≥ 19.3 < 3.6 3.6 ≤ T < 14.7 ≥ 14.7 < 2.6 2.6 ≤ T < 9.7 ≥ 9.7 7 < L2 ≤ 12 < 6.6 6.6 ≤ T < 29.2 ≥ 29.2 < 4.8 4.8 ≤ T < 22.2 ≥ 22.2 < 3.3 3.3 ≤ T < 14.6 ≥ 14.6
> 12 < 9.4 9.4 ≤ T < 38.8 ≥ 38.8 < 7.0 7.0 ≤ T < 32.9 ≥ 32.9 < 4.7 4.7 ≤ T < 19.4 ≥ 19.4
35≤ %
≤40
≤ 3 < 3.5 3.5 ≤ T < 15.0 ≥ 15.0 < 2.5 2.5 ≤ T < 10.4 ≥ 10.4 < 1.8 1.8 ≤ T < 7.5 ≥ 7.5 3 < L2 ≤ 7 < 4.6 4.6 ≤ T < 16.7 ≥ 16.7 < 3.2 3.2 ≤ T < 12.7 ≥ 12.7 < 2.3 2.3 ≤ T < 8.4 ≥ 8.4 7 < L2 ≤ 12 < 5.9 5.9 ≤ T < 25.3 ≥ 25.3 < 4.2 4.2 ≤ T < 19.2 ≥ 19.2 < 3.0 3.0 ≤ T < 12.7 ≥ 12.7
> 12 < 8.4 8.4 ≤ T < 33.5 ≥ 33.5 < 6.2 6.2 ≤ T < 28.4 ≥ 28.4 < 4.2 4.2 ≤ T < 16.8 ≥ 16.8
MEDIAN-BARRIER OR BRIDGE-RAILING TEST-LEVEL SELECTION, DESIGN SPEED 40 mph (Continued)
Figure 49-6D(40)
2012
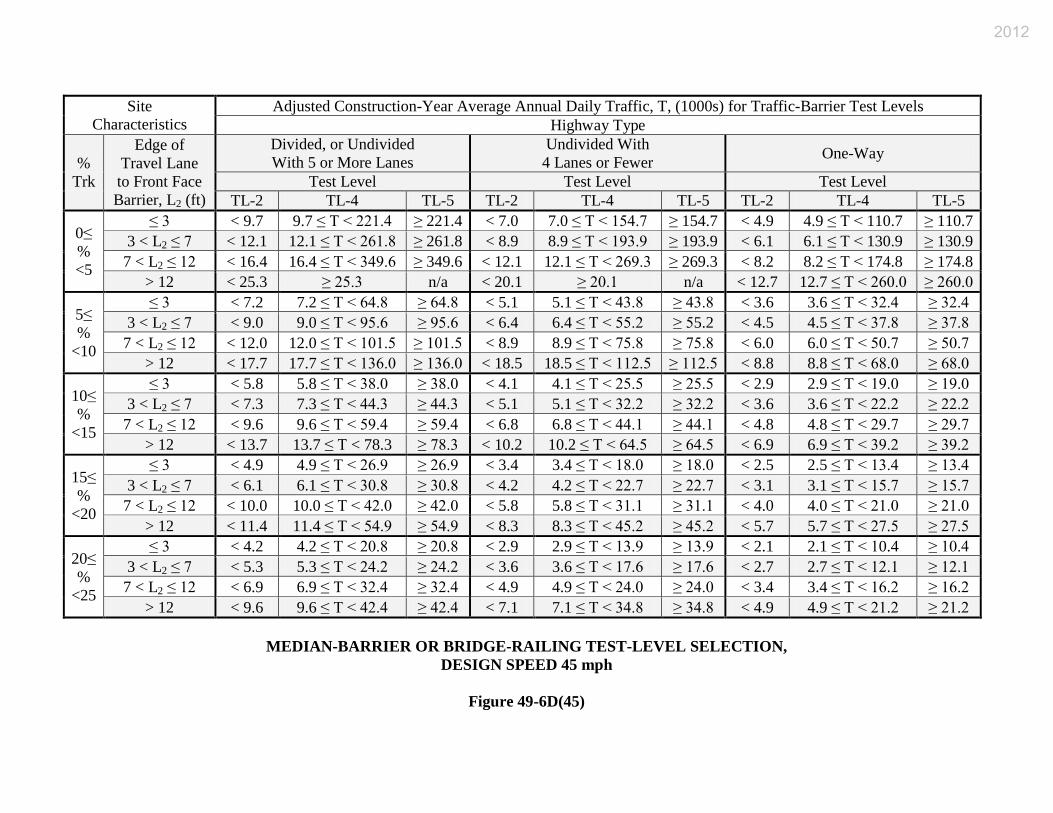
Site Characteristics
Adjusted Construction-Year Average Annual Daily Traffic, T, (1000s) for Traffic-Barrier Test Levels Highway Type
% Trk
Edge of Travel Lane to Front Face Barrier, L2 (ft)
Divided, or Undivided With 5 or More Lanes
Undivided With 4 Lanes or Fewer One-Way
Test Level Test Level Test Level TL-2 TL-4 TL-5 TL-2 TL-4 TL-5 TL-2 TL-4 TL-5
0≤ % <5
≤ 3 < 9.7 9.7 ≤ T < 221.4 ≥ 221.4 < 7.0 7.0 ≤ T < 154.7 ≥ 154.7 < 4.9 4.9 ≤ T < 110.7 ≥ 110.7 3 < L2 ≤ 7 < 12.1 12.1 ≤ T < 261.8 ≥ 261.8 < 8.9 8.9 ≤ T < 193.9 ≥ 193.9 < 6.1 6.1 ≤ T < 130.9 ≥ 130.9 7 < L2 ≤ 12 < 16.4 16.4 ≤ T < 349.6 ≥ 349.6 < 12.1 12.1 ≤ T < 269.3 ≥ 269.3 < 8.2 8.2 ≤ T < 174.8 ≥ 174.8
> 12 < 25.3 ≥ 25.3 n/a < 20.1 ≥ 20.1 n/a < 12.7 12.7 ≤ T < 260.0 ≥ 260.0
5≤ %
<10
≤ 3 < 7.2 7.2 ≤ T < 64.8 ≥ 64.8 < 5.1 5.1 ≤ T < 43.8 ≥ 43.8 < 3.6 3.6 ≤ T < 32.4 ≥ 32.4 3 < L2 ≤ 7 < 9.0 9.0 ≤ T < 95.6 ≥ 95.6 < 6.4 6.4 ≤ T < 55.2 ≥ 55.2 < 4.5 4.5 ≤ T < 37.8 ≥ 37.8 7 < L2 ≤ 12 < 12.0 12.0 ≤ T < 101.5 ≥ 101.5 < 8.9 8.9 ≤ T < 75.8 ≥ 75.8 < 6.0 6.0 ≤ T < 50.7 ≥ 50.7
> 12 < 17.7 17.7 ≤ T < 136.0 ≥ 136.0 < 18.5 18.5 ≤ T < 112.5 ≥ 112.5 < 8.8 8.8 ≤ T < 68.0 ≥ 68.0
10≤ %
<15
≤ 3 < 5.8 5.8 ≤ T < 38.0 ≥ 38.0 < 4.1 4.1 ≤ T < 25.5 ≥ 25.5 < 2.9 2.9 ≤ T < 19.0 ≥ 19.0 3 < L2 ≤ 7 < 7.3 7.3 ≤ T < 44.3 ≥ 44.3 < 5.1 5.1 ≤ T < 32.2 ≥ 32.2 < 3.6 3.6 ≤ T < 22.2 ≥ 22.2 7 < L2 ≤ 12 < 9.6 9.6 ≤ T < 59.4 ≥ 59.4 < 6.8 6.8 ≤ T < 44.1 ≥ 44.1 < 4.8 4.8 ≤ T < 29.7 ≥ 29.7
> 12 < 13.7 13.7 ≤ T < 78.3 ≥ 78.3 < 10.2 10.2 ≤ T < 64.5 ≥ 64.5 < 6.9 6.9 ≤ T < 39.2 ≥ 39.2
15≤ %
<20
≤ 3 < 4.9 4.9 ≤ T < 26.9 ≥ 26.9 < 3.4 3.4 ≤ T < 18.0 ≥ 18.0 < 2.5 2.5 ≤ T < 13.4 ≥ 13.4 3 < L2 ≤ 7 < 6.1 6.1 ≤ T < 30.8 ≥ 30.8 < 4.2 4.2 ≤ T < 22.7 ≥ 22.7 < 3.1 3.1 ≤ T < 15.7 ≥ 15.7 7 < L2 ≤ 12 < 10.0 10.0 ≤ T < 42.0 ≥ 42.0 < 5.8 5.8 ≤ T < 31.1 ≥ 31.1 < 4.0 4.0 ≤ T < 21.0 ≥ 21.0
> 12 < 11.4 11.4 ≤ T < 54.9 ≥ 54.9 < 8.3 8.3 ≤ T < 45.2 ≥ 45.2 < 5.7 5.7 ≤ T < 27.5 ≥ 27.5
20≤ %
<25
≤ 3 < 4.2 4.2 ≤ T < 20.8 ≥ 20.8 < 2.9 2.9 ≤ T < 13.9 ≥ 13.9 < 2.1 2.1 ≤ T < 10.4 ≥ 10.4 3 < L2 ≤ 7 < 5.3 5.3 ≤ T < 24.2 ≥ 24.2 < 3.6 3.6 ≤ T < 17.6 ≥ 17.6 < 2.7 2.7 ≤ T < 12.1 ≥ 12.1 7 < L2 ≤ 12 < 6.9 6.9 ≤ T < 32.4 ≥ 32.4 < 4.9 4.9 ≤ T < 24.0 ≥ 24.0 < 3.4 3.4 ≤ T < 16.2 ≥ 16.2
> 12 < 9.6 9.6 ≤ T < 42.4 ≥ 42.4 < 7.1 7.1 ≤ T < 34.8 ≥ 34.8 < 4.9 4.9 ≤ T < 21.2 ≥ 21.2
MEDIAN-BARRIER OR BRIDGE-RAILING TEST-LEVEL SELECTION, DESIGN SPEED 45 mph
Figure 49-6D(45)
2012
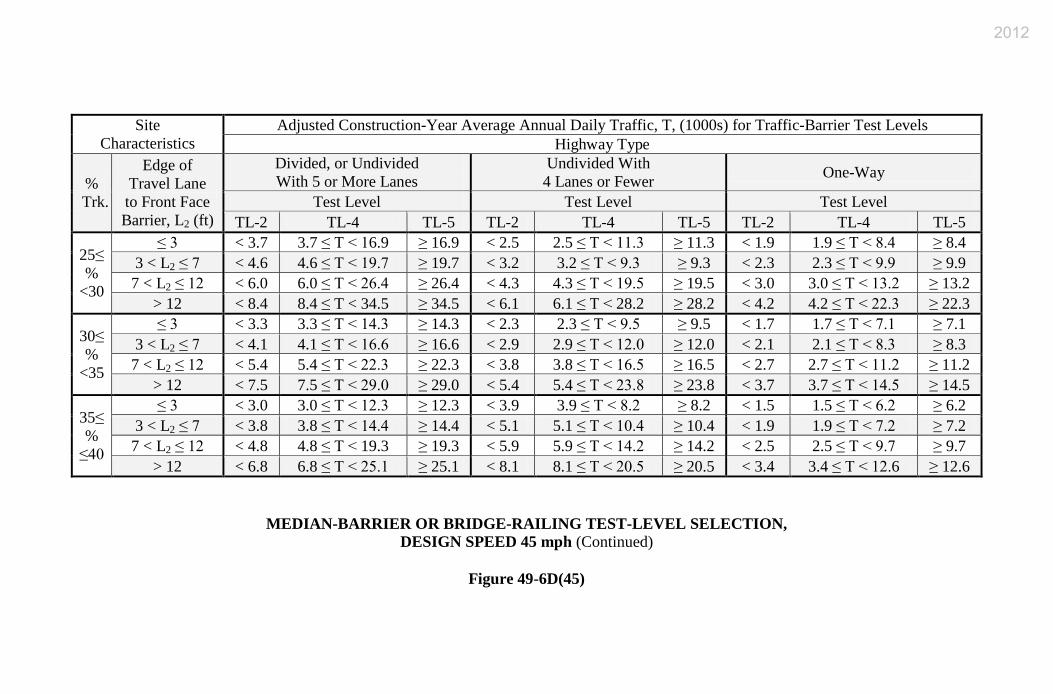
Site
Characteristics Adjusted Construction-Year Average Annual Daily Traffic, T, (1000s) for Traffic-Barrier Test Levels
Highway Type
% Trk.
Edge of Travel Lane to Front Face Barrier, L2 (ft)
Divided, or Undivided With 5 or More Lanes
Undivided With 4 Lanes or Fewer One-Way
Test Level Test Level Test Level TL-2 TL-4 TL-5 TL-2 TL-4 TL-5 TL-2 TL-4 TL-5
25≤ %
<30
≤ 3 < 3.7 3.7 ≤ T < 16.9 ≥ 16.9 < 2.5 2.5 ≤ T < 11.3 ≥ 11.3 < 1.9 1.9 ≤ T < 8.4 ≥ 8.4 3 < L2 ≤ 7 < 4.6 4.6 ≤ T < 19.7 ≥ 19.7 < 3.2 3.2 ≤ T < 9.3 ≥ 9.3 < 2.3 2.3 ≤ T < 9.9 ≥ 9.9 7 < L2 ≤ 12 < 6.0 6.0 ≤ T < 26.4 ≥ 26.4 < 4.3 4.3 ≤ T < 19.5 ≥ 19.5 < 3.0 3.0 ≤ T < 13.2 ≥ 13.2
> 12 < 8.4 8.4 ≤ T < 34.5 ≥ 34.5 < 6.1 6.1 ≤ T < 28.2 ≥ 28.2 < 4.2 4.2 ≤ T < 22.3 ≥ 22.3
30≤ %
<35
≤ 3 < 3.3 3.3 ≤ T < 14.3 ≥ 14.3 < 2.3 2.3 ≤ T < 9.5 ≥ 9.5 < 1.7 1.7 ≤ T < 7.1 ≥ 7.1 3 < L2 ≤ 7 < 4.1 4.1 ≤ T < 16.6 ≥ 16.6 < 2.9 2.9 ≤ T < 12.0 ≥ 12.0 < 2.1 2.1 ≤ T < 8.3 ≥ 8.3 7 < L2 ≤ 12 < 5.4 5.4 ≤ T < 22.3 ≥ 22.3 < 3.8 3.8 ≤ T < 16.5 ≥ 16.5 < 2.7 2.7 ≤ T < 11.2 ≥ 11.2
> 12 < 7.5 7.5 ≤ T < 29.0 ≥ 29.0 < 5.4 5.4 ≤ T < 23.8 ≥ 23.8 < 3.7 3.7 ≤ T < 14.5 ≥ 14.5
35≤ %
≤40
≤ 3 < 3.0 3.0 ≤ T < 12.3 ≥ 12.3 < 3.9 3.9 ≤ T < 8.2 ≥ 8.2 < 1.5 1.5 ≤ T < 6.2 ≥ 6.2 3 < L2 ≤ 7 < 3.8 3.8 ≤ T < 14.4 ≥ 14.4 < 5.1 5.1 ≤ T < 10.4 ≥ 10.4 < 1.9 1.9 ≤ T < 7.2 ≥ 7.2 7 < L2 ≤ 12 < 4.8 4.8 ≤ T < 19.3 ≥ 19.3 < 5.9 5.9 ≤ T < 14.2 ≥ 14.2 < 2.5 2.5 ≤ T < 9.7 ≥ 9.7
> 12 < 6.8 6.8 ≤ T < 25.1 ≥ 25.1 < 8.1 8.1 ≤ T < 20.5 ≥ 20.5 < 3.4 3.4 ≤ T < 12.6 ≥ 12.6
MEDIAN-BARRIER OR BRIDGE-RAILING TEST-LEVEL SELECTION, DESIGN SPEED 45 mph (Continued)
Figure 49-6D(45)
2012
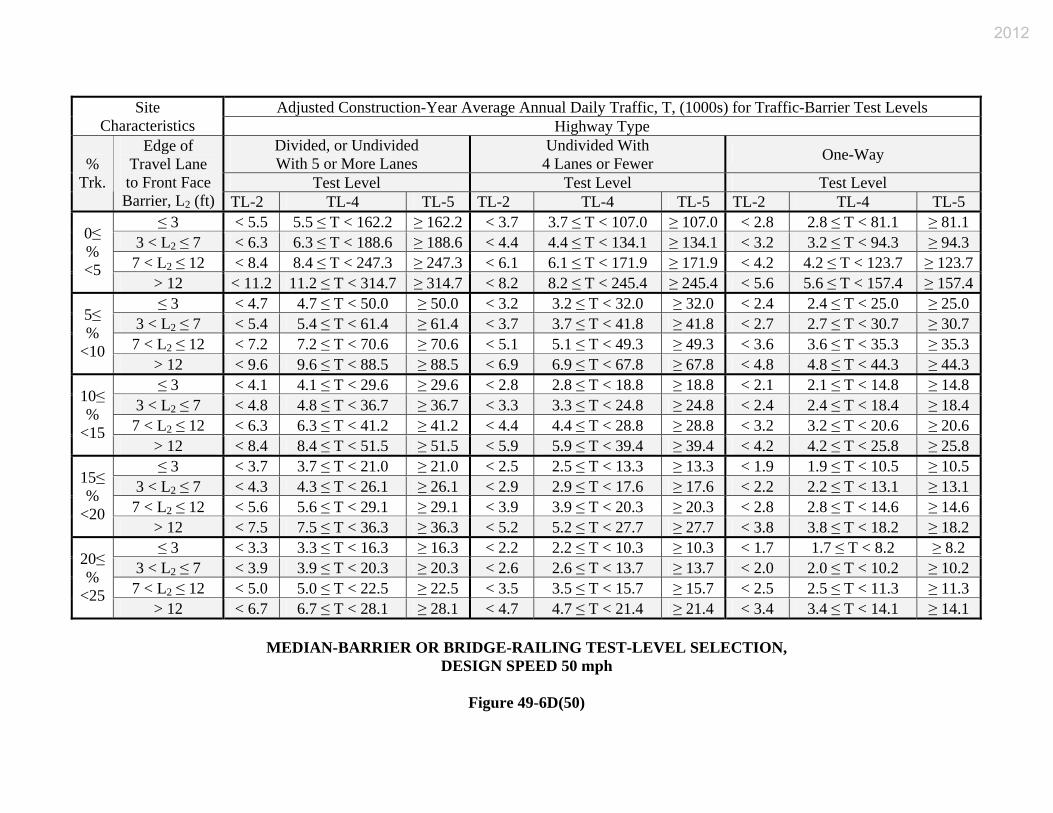
Adjusted Construction-Year Average Annual Daily Traffic, T, (1000s) for Traffic-Barrier Test Levels Site Characteristics Highway Type
Divided, or Undivided With 5 or More Lanes
Undivided With 4 Lanes or Fewer One-Way
Test Level Test Level Test Level %
Trk.
Edge of Travel Lane to Front Face Barrier, L2 (ft) TL-2 TL-4 TL-5 TL-2 TL-4 TL-5 TL-2 TL-4 TL-5
≤ 3 < 5.5 5.5 ≤ T < 162.2 ≥ 162.2 < 3.7 3.7 ≤ T < 107.0 ≥ 107.0 < 2.8 2.8 ≤ T < 81.1 ≥ 81.1 3 < L2 ≤ 7 < 6.3 6.3 ≤ T < 188.6 ≥ 188.6 < 4.4 4.4 ≤ T < 134.1 ≥ 134.1 < 3.2 3.2 ≤ T < 94.3 ≥ 94.3 7 < L2 ≤ 12 < 8.4 8.4 ≤ T < 247.3 ≥ 247.3 < 6.1 6.1 ≤ T < 171.9 ≥ 171.9 < 4.2 4.2 ≤ T < 123.7 ≥ 123.7
0≤ % <5
> 12 < 11.2 11.2 ≤ T < 314.7 ≥ 314.7 < 8.2 8.2 ≤ T < 245.4 ≥ 245.4 < 5.6 5.6 ≤ T < 157.4 ≥ 157.4≤ 3 < 4.7 4.7 ≤ T < 50.0 ≥ 50.0 < 3.2 3.2 ≤ T < 32.0 ≥ 32.0 < 2.4 2.4 ≤ T < 25.0 ≥ 25.0
3 < L2 ≤ 7 < 5.4 5.4 ≤ T < 61.4 ≥ 61.4 < 3.7 3.7 ≤ T < 41.8 ≥ 41.8 < 2.7 2.7 ≤ T < 30.7 ≥ 30.7 7 < L2 ≤ 12 < 7.2 7.2 ≤ T < 70.6 ≥ 70.6 < 5.1 5.1 ≤ T < 49.3 ≥ 49.3 < 3.6 3.6 ≤ T < 35.3 ≥ 35.3
5≤ %
<10 > 12 < 9.6 9.6 ≤ T < 88.5 ≥ 88.5 < 6.9 6.9 ≤ T < 67.8 ≥ 67.8 < 4.8 4.8 ≤ T < 44.3 ≥ 44.3 ≤ 3 < 4.1 4.1 ≤ T < 29.6 ≥ 29.6 < 2.8 2.8 ≤ T < 18.8 ≥ 18.8 < 2.1 2.1 ≤ T < 14.8 ≥ 14.8
3 < L2 ≤ 7 < 4.8 4.8 ≤ T < 36.7 ≥ 36.7 < 3.3 3.3 ≤ T < 24.8 ≥ 24.8 < 2.4 2.4 ≤ T < 18.4 ≥ 18.4 7 < L2 ≤ 12 < 6.3 6.3 ≤ T < 41.2 ≥ 41.2 < 4.4 4.4 ≤ T < 28.8 ≥ 28.8 < 3.2 3.2 ≤ T < 20.6 ≥ 20.6
10≤ %
<15 > 12 < 8.4 8.4 ≤ T < 51.5 ≥ 51.5 < 5.9 5.9 ≤ T < 39.4 ≥ 39.4 < 4.2 4.2 ≤ T < 25.8 ≥ 25.8 ≤ 3 < 3.7 3.7 ≤ T < 21.0 ≥ 21.0 < 2.5 2.5 ≤ T < 13.3 ≥ 13.3 < 1.9 1.9 ≤ T < 10.5 ≥ 10.5
3 < L2 ≤ 7 < 4.3 4.3 ≤ T < 26.1 ≥ 26.1 < 2.9 2.9 ≤ T < 17.6 ≥ 17.6 < 2.2 2.2 ≤ T < 13.1 ≥ 13.1 7 < L2 ≤ 12 < 5.6 5.6 ≤ T < 29.1 ≥ 29.1 < 3.9 3.9 ≤ T < 20.3 ≥ 20.3 < 2.8 2.8 ≤ T < 14.6 ≥ 14.6
15≤ %
<20 > 12 < 7.5 7.5 ≤ T < 36.3 ≥ 36.3 < 5.2 5.2 ≤ T < 27.7 ≥ 27.7 < 3.8 3.8 ≤ T < 18.2 ≥ 18.2 ≤ 3 < 3.3 3.3 ≤ T < 16.3 ≥ 16.3 < 2.2 2.2 ≤ T < 10.3 ≥ 10.3 < 1.7 1.7 ≤ T < 8.2 ≥ 8.2
3 < L2 ≤ 7 < 3.9 3.9 ≤ T < 20.3 ≥ 20.3 < 2.6 2.6 ≤ T < 13.7 ≥ 13.7 < 2.0 2.0 ≤ T < 10.2 ≥ 10.2 7 < L2 ≤ 12 < 5.0 5.0 ≤ T < 22.5 ≥ 22.5 < 3.5 3.5 ≤ T < 15.7 ≥ 15.7 < 2.5 2.5 ≤ T < 11.3 ≥ 11.3
20≤ %
<25 > 12 < 6.7 6.7 ≤ T < 28.1 ≥ 28.1 < 4.7 4.7 ≤ T < 21.4 ≥ 21.4 < 3.4 3.4 ≤ T < 14.1 ≥ 14.1
MEDIAN-BARRIER OR BRIDGE-RAILING TEST-LEVEL SELECTION,
DESIGN SPEED 50 mph
Figure 49-6D(50)
2012
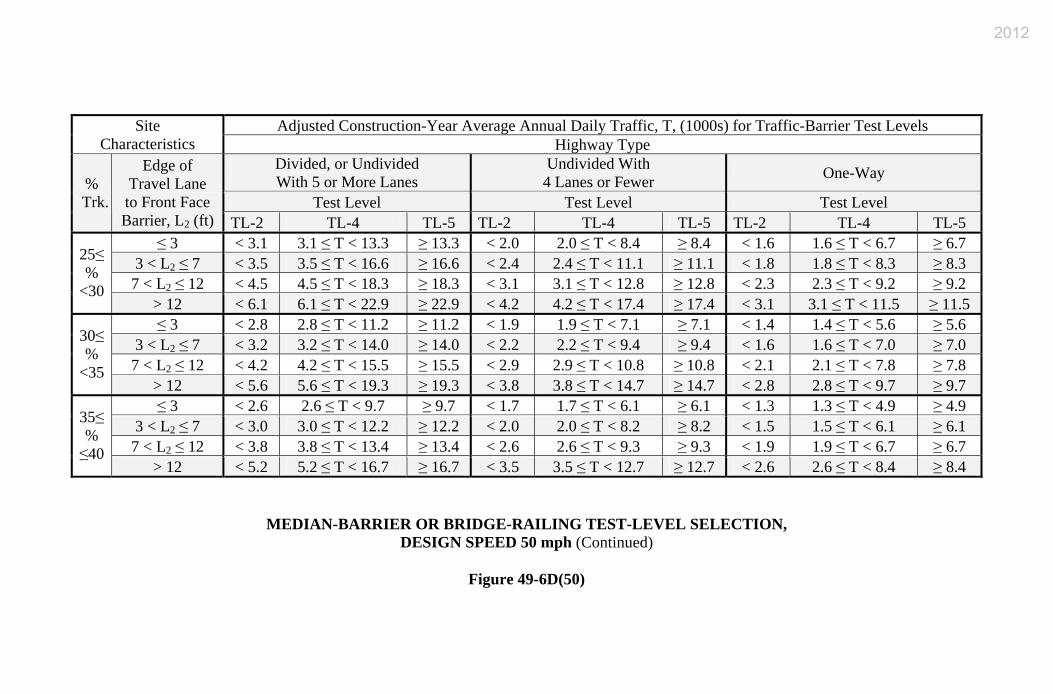
Adjusted Construction-Year Average Annual Daily Traffic, T, (1000s) for Traffic-Barrier Test Levels Site
Characteristics Highway Type Divided, or Undivided With 5 or More Lanes
Undivided With 4 Lanes or Fewer One-Way
Test Level Test Level Test Level % Trk.
Edge of Travel Lane to Front Face Barrier, L2 (ft) TL-2 TL-4 TL-5 TL-2 TL-4 TL-5 TL-2 TL-4 TL-5
≤ 3 < 3.1 3.1 ≤ T < 13.3 ≥ 13.3 < 2.0 2.0 ≤ T < 8.4 ≥ 8.4 < 1.6 1.6 ≤ T < 6.7 ≥ 6.7 3 < L2 ≤ 7 < 3.5 3.5 ≤ T < 16.6 ≥ 16.6 < 2.4 2.4 ≤ T < 11.1 ≥ 11.1 < 1.8 1.8 ≤ T < 8.3 ≥ 8.3 7 < L2 ≤ 12 < 4.5 4.5 ≤ T < 18.3 ≥ 18.3 < 3.1 3.1 ≤ T < 12.8 ≥ 12.8 < 2.3 2.3 ≤ T < 9.2 ≥ 9.2
25≤ %
<30 > 12 < 6.1 6.1 ≤ T < 22.9 ≥ 22.9 < 4.2 4.2 ≤ T < 17.4 ≥ 17.4 < 3.1 3.1 ≤ T < 11.5 ≥ 11.5 ≤ 3 < 2.8 2.8 ≤ T < 11.2 ≥ 11.2 < 1.9 1.9 ≤ T < 7.1 ≥ 7.1 < 1.4 1.4 ≤ T < 5.6 ≥ 5.6
3 < L2 ≤ 7 < 3.2 3.2 ≤ T < 14.0 ≥ 14.0 < 2.2 2.2 ≤ T < 9.4 ≥ 9.4 < 1.6 1.6 ≤ T < 7.0 ≥ 7.0 7 < L2 ≤ 12 < 4.2 4.2 ≤ T < 15.5 ≥ 15.5 < 2.9 2.9 ≤ T < 10.8 ≥ 10.8 < 2.1 2.1 ≤ T < 7.8 ≥ 7.8
30≤ %
<35 > 12 < 5.6 5.6 ≤ T < 19.3 ≥ 19.3 < 3.8 3.8 ≤ T < 14.7 ≥ 14.7 < 2.8 2.8 ≤ T < 9.7 ≥ 9.7 ≤ 3 < 2.6 2.6 ≤ T < 9.7 ≥ 9.7 < 1.7 1.7 ≤ T < 6.1 ≥ 6.1 < 1.3 1.3 ≤ T < 4.9 ≥ 4.9
3 < L2 ≤ 7 < 3.0 3.0 ≤ T < 12.2 ≥ 12.2 < 2.0 2.0 ≤ T < 8.2 ≥ 8.2 < 1.5 1.5 ≤ T < 6.1 ≥ 6.1 7 < L2 ≤ 12 < 3.8 3.8 ≤ T < 13.4 ≥ 13.4 < 2.6 2.6 ≤ T < 9.3 ≥ 9.3 < 1.9 1.9 ≤ T < 6.7 ≥ 6.7
35≤ % ≤40
> 12 < 5.2 5.2 ≤ T < 16.7 ≥ 16.7 < 3.5 3.5 ≤ T < 12.7 ≥ 12.7 < 2.6 2.6 ≤ T < 8.4 ≥ 8.4
MEDIAN-BARRIER OR BRIDGE-RAILING TEST-LEVEL SELECTION, DESIGN SPEED 50 mph (Continued)
Figure 49-6D(50)
2012
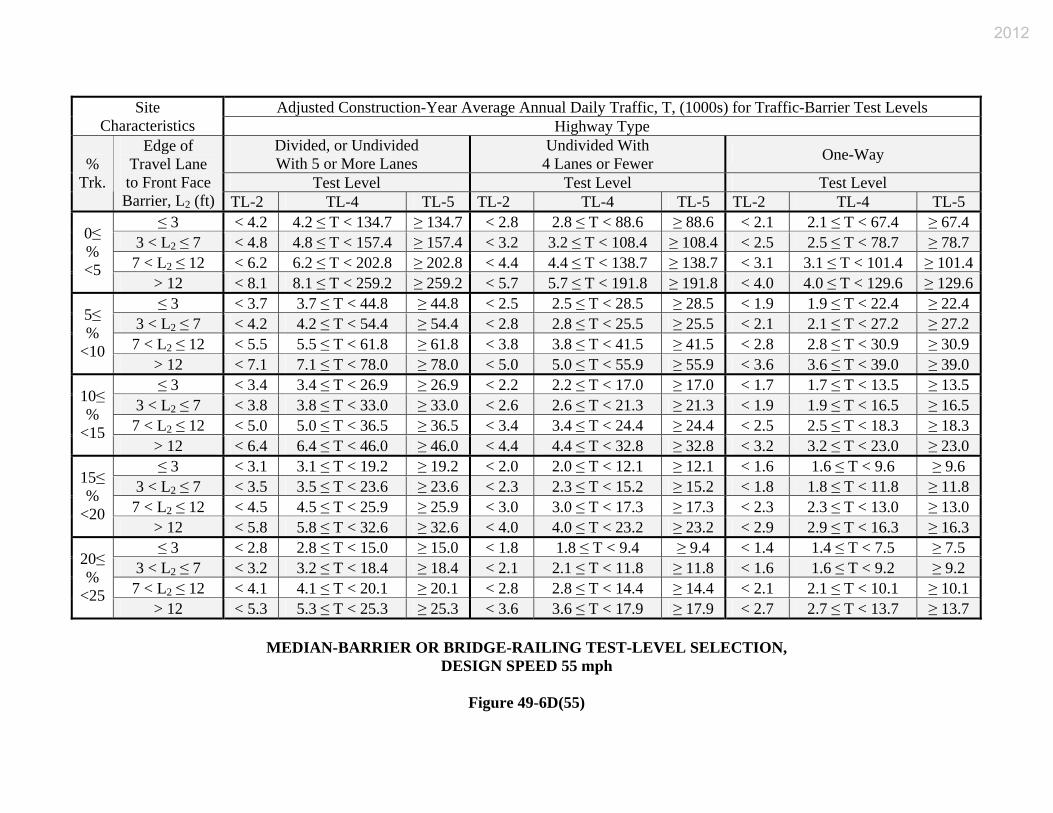
Adjusted Construction-Year Average Annual Daily Traffic, T, (1000s) for Traffic-Barrier Test Levels Site Characteristics Highway Type
Divided, or Undivided With 5 or More Lanes
Undivided With 4 Lanes or Fewer One-Way
Test Level Test Level Test Level %
Trk.
Edge of Travel Lane to Front Face Barrier, L2 (ft) TL-2 TL-4 TL-5 TL-2 TL-4 TL-5 TL-2 TL-4 TL-5
≤ 3 < 4.2 4.2 ≤ T < 134.7 ≥ 134.7 < 2.8 2.8 ≤ T < 88.6 ≥ 88.6 < 2.1 2.1 ≤ T < 67.4 ≥ 67.4 3 < L2 ≤ 7 < 4.8 4.8 ≤ T < 157.4 ≥ 157.4 < 3.2 3.2 ≤ T < 108.4 ≥ 108.4 < 2.5 2.5 ≤ T < 78.7 ≥ 78.7 7 < L2 ≤ 12 < 6.2 6.2 ≤ T < 202.8 ≥ 202.8 < 4.4 4.4 ≤ T < 138.7 ≥ 138.7 < 3.1 3.1 ≤ T < 101.4 ≥ 101.4
0≤ % <5
> 12 < 8.1 8.1 ≤ T < 259.2 ≥ 259.2 < 5.7 5.7 ≤ T < 191.8 ≥ 191.8 < 4.0 4.0 ≤ T < 129.6 ≥ 129.6≤ 3 < 3.7 3.7 ≤ T < 44.8 ≥ 44.8 < 2.5 2.5 ≤ T < 28.5 ≥ 28.5 < 1.9 1.9 ≤ T < 22.4 ≥ 22.4
3 < L2 ≤ 7 < 4.2 4.2 ≤ T < 54.4 ≥ 54.4 < 2.8 2.8 ≤ T < 25.5 ≥ 25.5 < 2.1 2.1 ≤ T < 27.2 ≥ 27.2 7 < L2 ≤ 12 < 5.5 5.5 ≤ T < 61.8 ≥ 61.8 < 3.8 3.8 ≤ T < 41.5 ≥ 41.5 < 2.8 2.8 ≤ T < 30.9 ≥ 30.9
5≤ %
<10 > 12 < 7.1 7.1 ≤ T < 78.0 ≥ 78.0 < 5.0 5.0 ≤ T < 55.9 ≥ 55.9 < 3.6 3.6 ≤ T < 39.0 ≥ 39.0 ≤ 3 < 3.4 3.4 ≤ T < 26.9 ≥ 26.9 < 2.2 2.2 ≤ T < 17.0 ≥ 17.0 < 1.7 1.7 ≤ T < 13.5 ≥ 13.5
3 < L2 ≤ 7 < 3.8 3.8 ≤ T < 33.0 ≥ 33.0 < 2.6 2.6 ≤ T < 21.3 ≥ 21.3 < 1.9 1.9 ≤ T < 16.5 ≥ 16.5 7 < L2 ≤ 12 < 5.0 5.0 ≤ T < 36.5 ≥ 36.5 < 3.4 3.4 ≤ T < 24.4 ≥ 24.4 < 2.5 2.5 ≤ T < 18.3 ≥ 18.3
10≤ %
<15 > 12 < 6.4 6.4 ≤ T < 46.0 ≥ 46.0 < 4.4 4.4 ≤ T < 32.8 ≥ 32.8 < 3.2 3.2 ≤ T < 23.0 ≥ 23.0 ≤ 3 < 3.1 3.1 ≤ T < 19.2 ≥ 19.2 < 2.0 2.0 ≤ T < 12.1 ≥ 12.1 < 1.6 1.6 ≤ T < 9.6 ≥ 9.6
3 < L2 ≤ 7 < 3.5 3.5 ≤ T < 23.6 ≥ 23.6 < 2.3 2.3 ≤ T < 15.2 ≥ 15.2 < 1.8 1.8 ≤ T < 11.8 ≥ 11.8 7 < L2 ≤ 12 < 4.5 4.5 ≤ T < 25.9 ≥ 25.9 < 3.0 3.0 ≤ T < 17.3 ≥ 17.3 < 2.3 2.3 ≤ T < 13.0 ≥ 13.0
15≤ %
<20 > 12 < 5.8 5.8 ≤ T < 32.6 ≥ 32.6 < 4.0 4.0 ≤ T < 23.2 ≥ 23.2 < 2.9 2.9 ≤ T < 16.3 ≥ 16.3 ≤ 3 < 2.8 2.8 ≤ T < 15.0 ≥ 15.0 < 1.8 1.8 ≤ T < 9.4 ≥ 9.4 < 1.4 1.4 ≤ T < 7.5 ≥ 7.5
3 < L2 ≤ 7 < 3.2 3.2 ≤ T < 18.4 ≥ 18.4 < 2.1 2.1 ≤ T < 11.8 ≥ 11.8 < 1.6 1.6 ≤ T < 9.2 ≥ 9.2 7 < L2 ≤ 12 < 4.1 4.1 ≤ T < 20.1 ≥ 20.1 < 2.8 2.8 ≤ T < 14.4 ≥ 14.4 < 2.1 2.1 ≤ T < 10.1 ≥ 10.1
20≤ %
<25 > 12 < 5.3 5.3 ≤ T < 25.3 ≥ 25.3 < 3.6 3.6 ≤ T < 17.9 ≥ 17.9 < 2.7 2.7 ≤ T < 13.7 ≥ 13.7
MEDIAN-BARRIER OR BRIDGE-RAILING TEST-LEVEL SELECTION,
DESIGN SPEED 55 mph
Figure 49-6D(55)
2012
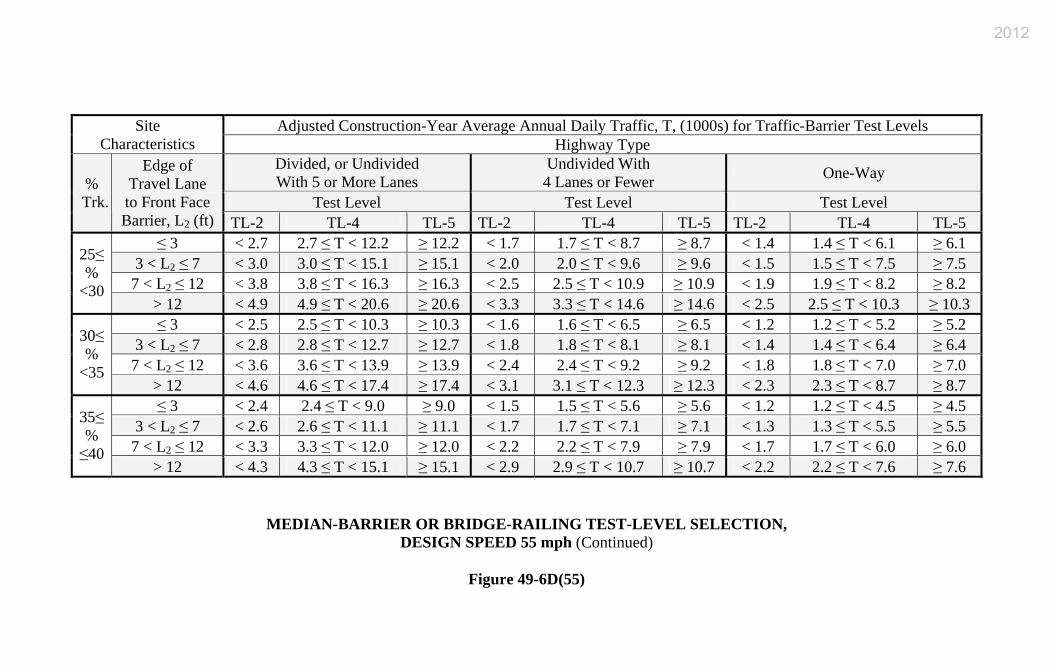
Adjusted Construction-Year Average Annual Daily Traffic, T, (1000s) for Traffic-Barrier Test Levels Site
Characteristics Highway Type Divided, or Undivided With 5 or More Lanes
Undivided With 4 Lanes or Fewer One-Way
Test Level Test Level Test Level % Trk.
Edge of Travel Lane to Front Face Barrier, L2 (ft) TL-2 TL-4 TL-5 TL-2 TL-4 TL-5 TL-2 TL-4 TL-5
≤ 3 < 2.7 2.7 ≤ T < 12.2 ≥ 12.2 < 1.7 1.7 ≤ T < 8.7 ≥ 8.7 < 1.4 1.4 ≤ T < 6.1 ≥ 6.1 3 < L2 ≤ 7 < 3.0 3.0 ≤ T < 15.1 ≥ 15.1 < 2.0 2.0 ≤ T < 9.6 ≥ 9.6 < 1.5 1.5 ≤ T < 7.5 ≥ 7.5 7 < L2 ≤ 12 < 3.8 3.8 ≤ T < 16.3 ≥ 16.3 < 2.5 2.5 ≤ T < 10.9 ≥ 10.9 < 1.9 1.9 ≤ T < 8.2 ≥ 8.2
25≤ %
<30 > 12 < 4.9 4.9 ≤ T < 20.6 ≥ 20.6 < 3.3 3.3 ≤ T < 14.6 ≥ 14.6 < 2.5 2.5 ≤ T < 10.3 ≥ 10.3 ≤ 3 < 2.5 2.5 ≤ T < 10.3 ≥ 10.3 < 1.6 1.6 ≤ T < 6.5 ≥ 6.5 < 1.2 1.2 ≤ T < 5.2 ≥ 5.2
3 < L2 ≤ 7 < 2.8 2.8 ≤ T < 12.7 ≥ 12.7 < 1.8 1.8 ≤ T < 8.1 ≥ 8.1 < 1.4 1.4 ≤ T < 6.4 ≥ 6.4 7 < L2 ≤ 12 < 3.6 3.6 ≤ T < 13.9 ≥ 13.9 < 2.4 2.4 ≤ T < 9.2 ≥ 9.2 < 1.8 1.8 ≤ T < 7.0 ≥ 7.0
30≤ %
<35 > 12 < 4.6 4.6 ≤ T < 17.4 ≥ 17.4 < 3.1 3.1 ≤ T < 12.3 ≥ 12.3 < 2.3 2.3 ≤ T < 8.7 ≥ 8.7 ≤ 3 < 2.4 2.4 ≤ T < 9.0 ≥ 9.0 < 1.5 1.5 ≤ T < 5.6 ≥ 5.6 < 1.2 1.2 ≤ T < 4.5 ≥ 4.5
3 < L2 ≤ 7 < 2.6 2.6 ≤ T < 11.1 ≥ 11.1 < 1.7 1.7 ≤ T < 7.1 ≥ 7.1 < 1.3 1.3 ≤ T < 5.5 ≥ 5.5 7 < L2 ≤ 12 < 3.3 3.3 ≤ T < 12.0 ≥ 12.0 < 2.2 2.2 ≤ T < 7.9 ≥ 7.9 < 1.7 1.7 ≤ T < 6.0 ≥ 6.0
35≤ % ≤40
> 12 < 4.3 4.3 ≤ T < 15.1 ≥ 15.1 < 2.9 2.9 ≤ T < 10.7 ≥ 10.7 < 2.2 2.2 ≤ T < 7.6 ≥ 7.6
MEDIAN-BARRIER OR BRIDGE-RAILING TEST-LEVEL SELECTION, DESIGN SPEED 55 mph (Continued)
Figure 49-6D(55)
2012
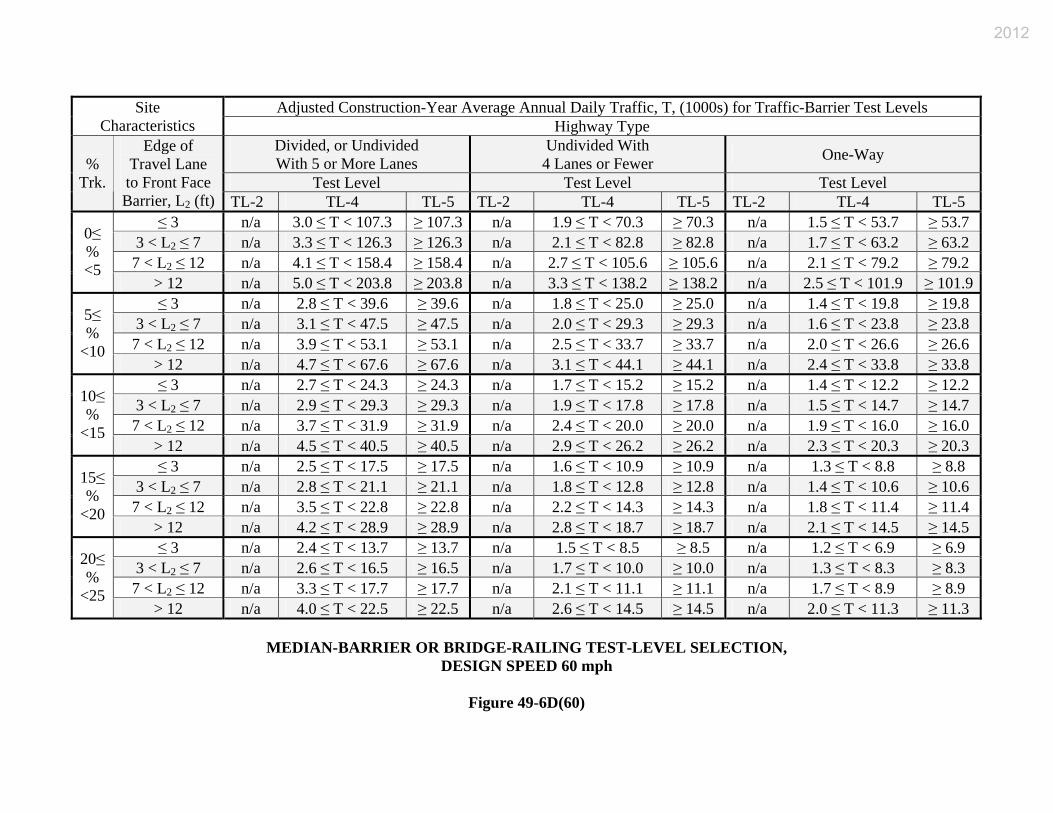
Adjusted Construction-Year Average Annual Daily Traffic, T, (1000s) for Traffic-Barrier Test Levels Site Characteristics Highway Type
Divided, or Undivided With 5 or More Lanes
Undivided With 4 Lanes or Fewer One-Way
Test Level Test Level Test Level %
Trk.
Edge of Travel Lane to Front Face Barrier, L2 (ft) TL-2 TL-4 TL-5 TL-2 TL-4 TL-5 TL-2 TL-4 TL-5
≤ 3 n/a 3.0 ≤ T < 107.3 ≥ 107.3 n/a 1.9 ≤ T < 70.3 ≥ 70.3 n/a 1.5 ≤ T < 53.7 ≥ 53.7 3 < L2 ≤ 7 n/a 3.3 ≤ T < 126.3 ≥ 126.3 n/a 2.1 ≤ T < 82.8 ≥ 82.8 n/a 1.7 ≤ T < 63.2 ≥ 63.2 7 < L2 ≤ 12 n/a 4.1 ≤ T < 158.4 ≥ 158.4 n/a 2.7 ≤ T < 105.6 ≥ 105.6 n/a 2.1 ≤ T < 79.2 ≥ 79.2
0≤ % <5
> 12 n/a 5.0 ≤ T < 203.8 ≥ 203.8 n/a 3.3 ≤ T < 138.2 ≥ 138.2 n/a 2.5 ≤ T < 101.9 ≥ 101.9≤ 3 n/a 2.8 ≤ T < 39.6 ≥ 39.6 n/a 1.8 ≤ T < 25.0 ≥ 25.0 n/a 1.4 ≤ T < 19.8 ≥ 19.8
3 < L2 ≤ 7 n/a 3.1 ≤ T < 47.5 ≥ 47.5 n/a 2.0 ≤ T < 29.3 ≥ 29.3 n/a 1.6 ≤ T < 23.8 ≥ 23.8 7 < L2 ≤ 12 n/a 3.9 ≤ T < 53.1 ≥ 53.1 n/a 2.5 ≤ T < 33.7 ≥ 33.7 n/a 2.0 ≤ T < 26.6 ≥ 26.6
5≤ %
<10 > 12 n/a 4.7 ≤ T < 67.6 ≥ 67.6 n/a 3.1 ≤ T < 44.1 ≥ 44.1 n/a 2.4 ≤ T < 33.8 ≥ 33.8 ≤ 3 n/a 2.7 ≤ T < 24.3 ≥ 24.3 n/a 1.7 ≤ T < 15.2 ≥ 15.2 n/a 1.4 ≤ T < 12.2 ≥ 12.2
3 < L2 ≤ 7 n/a 2.9 ≤ T < 29.3 ≥ 29.3 n/a 1.9 ≤ T < 17.8 ≥ 17.8 n/a 1.5 ≤ T < 14.7 ≥ 14.7 7 < L2 ≤ 12 n/a 3.7 ≤ T < 31.9 ≥ 31.9 n/a 2.4 ≤ T < 20.0 ≥ 20.0 n/a 1.9 ≤ T < 16.0 ≥ 16.0
10≤ %
<15 > 12 n/a 4.5 ≤ T < 40.5 ≥ 40.5 n/a 2.9 ≤ T < 26.2 ≥ 26.2 n/a 2.3 ≤ T < 20.3 ≥ 20.3 ≤ 3 n/a 2.5 ≤ T < 17.5 ≥ 17.5 n/a 1.6 ≤ T < 10.9 ≥ 10.9 n/a 1.3 ≤ T < 8.8 ≥ 8.8
3 < L2 ≤ 7 n/a 2.8 ≤ T < 21.1 ≥ 21.1 n/a 1.8 ≤ T < 12.8 ≥ 12.8 n/a 1.4 ≤ T < 10.6 ≥ 10.6 7 < L2 ≤ 12 n/a 3.5 ≤ T < 22.8 ≥ 22.8 n/a 2.2 ≤ T < 14.3 ≥ 14.3 n/a 1.8 ≤ T < 11.4 ≥ 11.4
15≤ %
<20 > 12 n/a 4.2 ≤ T < 28.9 ≥ 28.9 n/a 2.8 ≤ T < 18.7 ≥ 18.7 n/a 2.1 ≤ T < 14.5 ≥ 14.5 ≤ 3 n/a 2.4 ≤ T < 13.7 ≥ 13.7 n/a 1.5 ≤ T < 8.5 ≥ 8.5 n/a 1.2 ≤ T < 6.9 ≥ 6.9
3 < L2 ≤ 7 n/a 2.6 ≤ T < 16.5 ≥ 16.5 n/a 1.7 ≤ T < 10.0 ≥ 10.0 n/a 1.3 ≤ T < 8.3 ≥ 8.3 7 < L2 ≤ 12 n/a 3.3 ≤ T < 17.7 ≥ 17.7 n/a 2.1 ≤ T < 11.1 ≥ 11.1 n/a 1.7 ≤ T < 8.9 ≥ 8.9
20≤ %
<25 > 12 n/a 4.0 ≤ T < 22.5 ≥ 22.5 n/a 2.6 ≤ T < 14.5 ≥ 14.5 n/a 2.0 ≤ T < 11.3 ≥ 11.3
MEDIAN-BARRIER OR BRIDGE-RAILING TEST-LEVEL SELECTION,
DESIGN SPEED 60 mph
Figure 49-6D(60)
2012
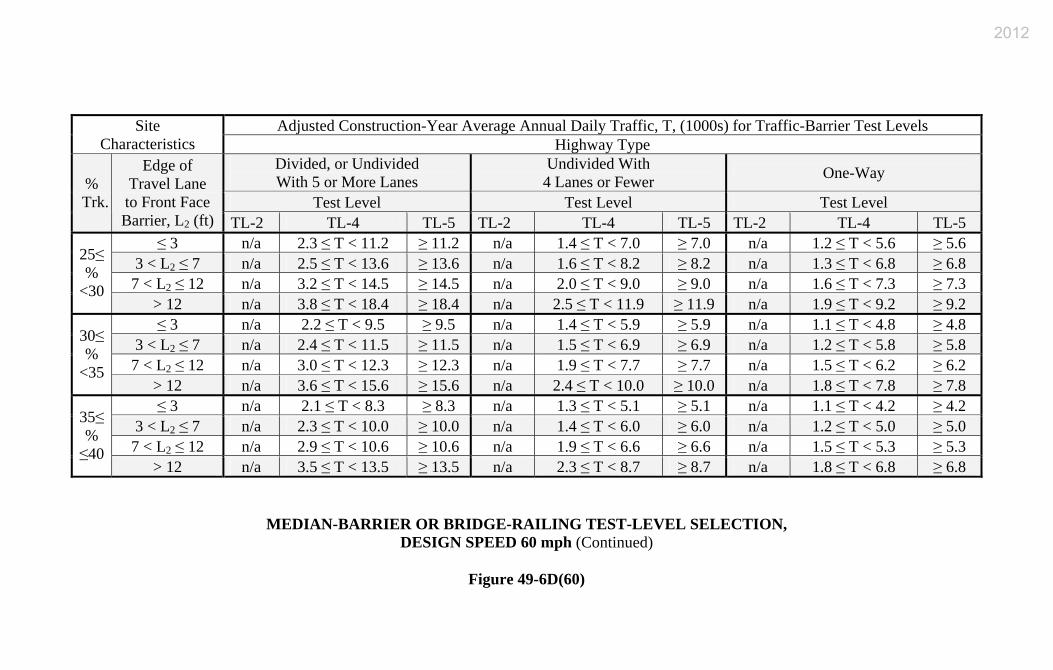
Adjusted Construction-Year Average Annual Daily Traffic, T, (1000s) for Traffic-Barrier Test Levels Site
Characteristics Highway Type Divided, or Undivided With 5 or More Lanes
Undivided With 4 Lanes or Fewer One-Way
Test Level Test Level Test Level % Trk.
Edge of Travel Lane to Front Face Barrier, L2 (ft) TL-2 TL-4 TL-5 TL-2 TL-4 TL-5 TL-2 TL-4 TL-5
≤ 3 n/a 2.3 ≤ T < 11.2 ≥ 11.2 n/a 1.4 ≤ T < 7.0 ≥ 7.0 n/a 1.2 ≤ T < 5.6 ≥ 5.6 3 < L2 ≤ 7 n/a 2.5 ≤ T < 13.6 ≥ 13.6 n/a 1.6 ≤ T < 8.2 ≥ 8.2 n/a 1.3 ≤ T < 6.8 ≥ 6.8 7 < L2 ≤ 12 n/a 3.2 ≤ T < 14.5 ≥ 14.5 n/a 2.0 ≤ T < 9.0 ≥ 9.0 n/a 1.6 ≤ T < 7.3 ≥ 7.3
25≤ %
<30 > 12 n/a 3.8 ≤ T < 18.4 ≥ 18.4 n/a 2.5 ≤ T < 11.9 ≥ 11.9 n/a 1.9 ≤ T < 9.2 ≥ 9.2 ≤ 3 n/a 2.2 ≤ T < 9.5 ≥ 9.5 n/a 1.4 ≤ T < 5.9 ≥ 5.9 n/a 1.1 ≤ T < 4.8 ≥ 4.8
3 < L2 ≤ 7 n/a 2.4 ≤ T < 11.5 ≥ 11.5 n/a 1.5 ≤ T < 6.9 ≥ 6.9 n/a 1.2 ≤ T < 5.8 ≥ 5.8 7 < L2 ≤ 12 n/a 3.0 ≤ T < 12.3 ≥ 12.3 n/a 1.9 ≤ T < 7.7 ≥ 7.7 n/a 1.5 ≤ T < 6.2 ≥ 6.2
30≤ %
<35 > 12 n/a 3.6 ≤ T < 15.6 ≥ 15.6 n/a 2.4 ≤ T < 10.0 ≥ 10.0 n/a 1.8 ≤ T < 7.8 ≥ 7.8 ≤ 3 n/a 2.1 ≤ T < 8.3 ≥ 8.3 n/a 1.3 ≤ T < 5.1 ≥ 5.1 n/a 1.1 ≤ T < 4.2 ≥ 4.2
3 < L2 ≤ 7 n/a 2.3 ≤ T < 10.0 ≥ 10.0 n/a 1.4 ≤ T < 6.0 ≥ 6.0 n/a 1.2 ≤ T < 5.0 ≥ 5.0 7 < L2 ≤ 12 n/a 2.9 ≤ T < 10.6 ≥ 10.6 n/a 1.9 ≤ T < 6.6 ≥ 6.6 n/a 1.5 ≤ T < 5.3 ≥ 5.3
35≤ % ≤40
> 12 n/a 3.5 ≤ T < 13.5 ≥ 13.5 n/a 2.3 ≤ T < 8.7 ≥ 8.7 n/a 1.8 ≤ T < 6.8 ≥ 6.8
MEDIAN-BARRIER OR BRIDGE-RAILING TEST-LEVEL SELECTION, DESIGN SPEED 60 mph (Continued)
Figure 49-6D(60)
2012

Site
Characteristics
Adjusted Construction-Year Average Annual Daily Traffic, T, (1000s) for Traffic-Barrier Test Levels
Highway Type
%
Trk.
Edge of
Travel Lane
to Front Face
Barrier, L2 (ft)
Divided, or Undivided
With 5 or More Lanes
Undivided With
4 Lanes or Fewer One-Way
Test Level Test Level Test Level
TL-2 TL-4 TL-5 TL-2 TL-4 TL-5 TL-2 TL-4 TL-5
0≤
%
<5
≤ 3 n/a 2.1 ≤ T < 63.1 ≥ 63.1 n/a 1.3 ≤ T < 42.2 ≥ 42.2 n/a 1.1 ≤ T < 31.6 ≥ 31.6
3 < L2 ≤ 7 n/a 2.3 ≤ T < 80.0 ≥ 80.0 n/a 1.4 ≤ T < 51.6 ≥ 51.6 n/a 1.2 ≤ T < 40.0 ≥ 40.0
7 < L2 ≤ 12 n/a 2.7 ≤ T < 96.4 ≥ 96.4 n/a 1.6 ≤ T < 64.0 ≥ 64.0 n/a 1.4 ≤ T < 48.2 ≥ 48.2
> 12 n/a 3.1 ≤ T < 127.6 ≥ 127.6 n/a 1.9 ≤ T < 84.0 ≥ 84.0 n/a 1.6 ≤ T < 63.8 ≥ 63.8
5≤
%
<10
≤ 3 n/a 2.0 ≤ T < 32.1 ≥ 32.1 n/a 1.2 ≤ T < 20.0 ≥ 20.0 n/a 1.0 ≤ T < 16.1 ≥ 16.1
3 < L2 ≤ 7 n/a 2.3 ≤ T < 38.5 ≥ 38.5 n/a 1.4 ≤ T < 22.9 ≥ 22.9 n/a 1.2 ≤ T < 19.3 ≥ 19.3
7 < L2 ≤ 12 n/a 2.6 ≤ T < 42.2 ≥ 42.2 n/a 1.6 ≤ T < 26.7 ≥ 26.7 n/a 1.3 ≤ T < 21.1 ≥ 21.1
> 12 n/a 3.0 ≤ T < 53.0 ≥ 53.0 n/a 1.8 ≤ T < 33.1 ≥ 33.1 n/a 1.5 ≤ T < 26.5 ≥ 26.5
10≤
%
<15
≤ 3 n/a 2.0 ≤ T < 21.5 ≥ 21.5 n/a 1.2 ≤ T < 13.1 ≥ 13.1 n/a 1.0 ≤ T < 10.8 ≥ 10.8
3 < L2 ≤ 7 n/a 2.2 ≤ T < 25.3 ≥ 25.3 n/a 1.3 ≤ T < 14.7 ≥ 14.7 n/a 1.1 ≤ T < 12.7 ≥ 12.7
7 < L2 ≤ 12 n/a 2.6 ≤ T < 27.0 ≥ 27.0 n/a 1.6 ≤ T < 16.9 ≥ 16.9 n/a 1.3 ≤ T < 13.5 ≥ 13.5
> 12 n/a 3.0 ≤ T < 33.5 ≥ 33.5 n/a 1.8 ≤ T < 20.6 ≥ 20.6 n/a 1.5 ≤ T < 16.8 ≥ 16.8
15≤
%
<20
≤ 3 n/a 1.9 ≤ T < 16.2 ≥ 16.2 n/a 1.2 ≤ T < 9.7 ≥ 9.7 n/a 1.0 ≤ T < 8.1 ≥ 8.1
3 < L2 ≤ 7 n/a 2.1 ≤ T < 18.9 ≥ 18.9 n/a 1.3 ≤ T < 10.8 ≥ 10.8 n/a 1.1 ≤ T < 9.5 ≥ 9.5
7 < L2 ≤ 12 n/a 2.5 ≤ T < 19.9 ≥ 19.9 n/a 1.5 ≤ T < 12.3 ≥ 12.3 n/a 1.3 ≤ T < 10.0 ≥ 10.0
> 12 n/a 2.9 ≤ T < 24.4 ≥ 24.4 n/a 1.8 ≤ T < 15.0 ≥ 15.0 n/a 1.5 ≤ T < 12.2 ≥ 12.2
20≤
%
<25
≤ 3 n/a 1.9 ≤ T < 13.0 ≥ 13.0 n/a 1.1 ≤ T < 7.8 ≥ 7.8 n/a 1.0 ≤ T < 6.5 ≥ 6.5
3 < L2 ≤ 7 n/a 2.0 ≤ T < 15.1 ≥ 15.1 n/a 1.3 ≤ T < 8.6 ≥ 8.6 n/a 1.0 ≤ T < 7.6 ≥ 7.6
7 < L2 ≤ 12 n/a 2.5 ≤ T < 15.7 ≥ 15.7 n/a 1.5 ≤ T < 9.7 ≥ 9.7 n/a 1.3 ≤ T < 7.9 ≥ 7.9
> 12 n/a 2.8 ≤ T < 19.2 ≥ 19.2 n/a 1.7 ≤ T < 11.8 ≥ 11.8 n/a 1.4 ≤ T < 9.6 ≥ 9.6
MEDIAN-BARRIER OR BRIDGE-RAILING TEST-LEVEL SELECTION,
DESIGN SPEED 65 mph or 70 mph
Figure 49-6D(65, 70)
2012
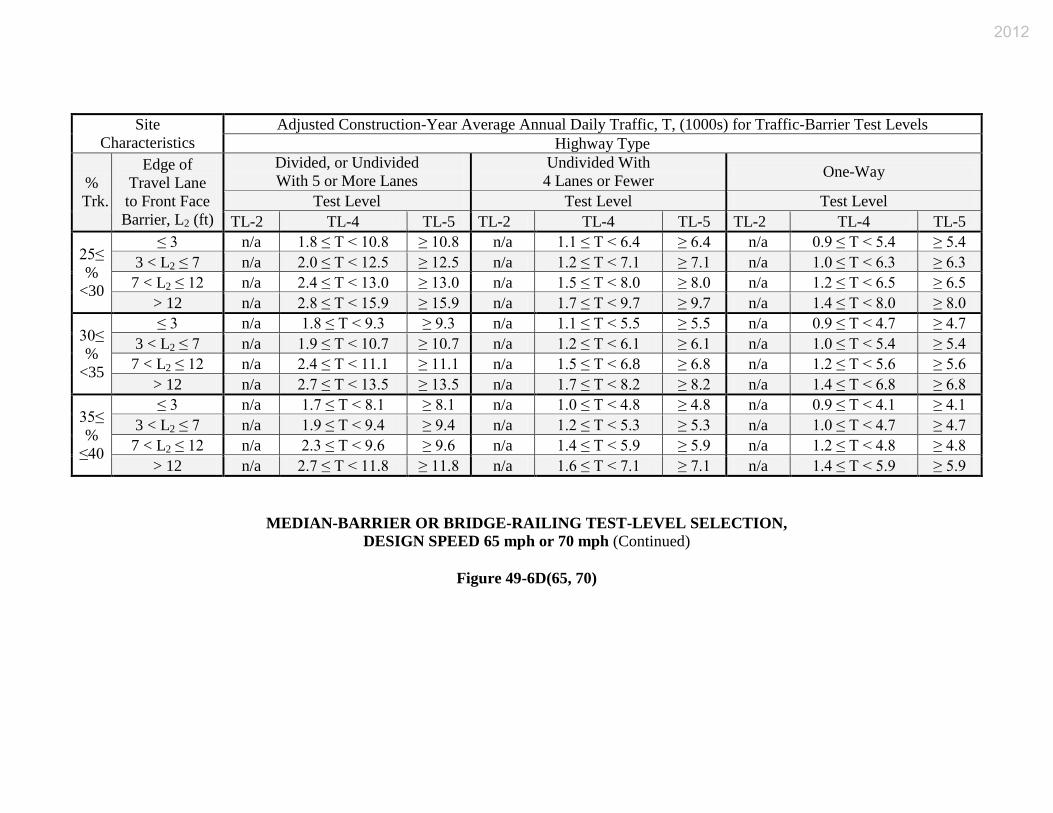
Site
Characteristics
Adjusted Construction-Year Average Annual Daily Traffic, T, (1000s) for Traffic-Barrier Test Levels
Highway Type
%
Trk.
Edge of
Travel Lane
to Front Face
Barrier, L2 (ft)
Divided, or Undivided
With 5 or More Lanes
Undivided With
4 Lanes or Fewer One-Way
Test Level Test Level Test Level
TL-2 TL-4 TL-5 TL-2 TL-4 TL-5 TL-2 TL-4 TL-5
25≤
%
<30
≤ 3 n/a 1.8 ≤ T < 10.8 ≥ 10.8 n/a 1.1 ≤ T < 6.4 ≥ 6.4 n/a 0.9 ≤ T < 5.4 ≥ 5.4
3 < L2 ≤ 7 n/a 2.0 ≤ T < 12.5 ≥ 12.5 n/a 1.2 ≤ T < 7.1 ≥ 7.1 n/a 1.0 ≤ T < 6.3 ≥ 6.3
7 < L2 ≤ 12 n/a 2.4 ≤ T < 13.0 ≥ 13.0 n/a 1.5 ≤ T < 8.0 ≥ 8.0 n/a 1.2 ≤ T < 6.5 ≥ 6.5
> 12 n/a 2.8 ≤ T < 15.9 ≥ 15.9 n/a 1.7 ≤ T < 9.7 ≥ 9.7 n/a 1.4 ≤ T < 8.0 ≥ 8.0
30≤
%
<35
≤ 3 n/a 1.8 ≤ T < 9.3 ≥ 9.3 n/a 1.1 ≤ T < 5.5 ≥ 5.5 n/a 0.9 ≤ T < 4.7 ≥ 4.7
3 < L2 ≤ 7 n/a 1.9 ≤ T < 10.7 ≥ 10.7 n/a 1.2 ≤ T < 6.1 ≥ 6.1 n/a 1.0 ≤ T < 5.4 ≥ 5.4
7 < L2 ≤ 12 n/a 2.4 ≤ T < 11.1 ≥ 11.1 n/a 1.5 ≤ T < 6.8 ≥ 6.8 n/a 1.2 ≤ T < 5.6 ≥ 5.6
> 12 n/a 2.7 ≤ T < 13.5 ≥ 13.5 n/a 1.7 ≤ T < 8.2 ≥ 8.2 n/a 1.4 ≤ T < 6.8 ≥ 6.8
35≤
%
≤40
≤ 3 n/a 1.7 ≤ T < 8.1 ≥ 8.1 n/a 1.0 ≤ T < 4.8 ≥ 4.8 n/a 0.9 ≤ T < 4.1 ≥ 4.1
3 < L2 ≤ 7 n/a 1.9 ≤ T < 9.4 ≥ 9.4 n/a 1.2 ≤ T < 5.3 ≥ 5.3 n/a 1.0 ≤ T < 4.7 ≥ 4.7
7 < L2 ≤ 12 n/a 2.3 ≤ T < 9.6 ≥ 9.6 n/a 1.4 ≤ T < 5.9 ≥ 5.9 n/a 1.2 ≤ T < 4.8 ≥ 4.8
> 12 n/a 2.7 ≤ T < 11.8 ≥ 11.8 n/a 1.6 ≤ T < 7.1 ≥ 7.1 n/a 1.4 ≤ T < 5.9 ≥ 5.9
MEDIAN-BARRIER OR BRIDGE-RAILING TEST-LEVEL SELECTION,
DESIGN SPEED 65 mph or 70 mph (Continued)
Figure 49-6D(65, 70)
2012
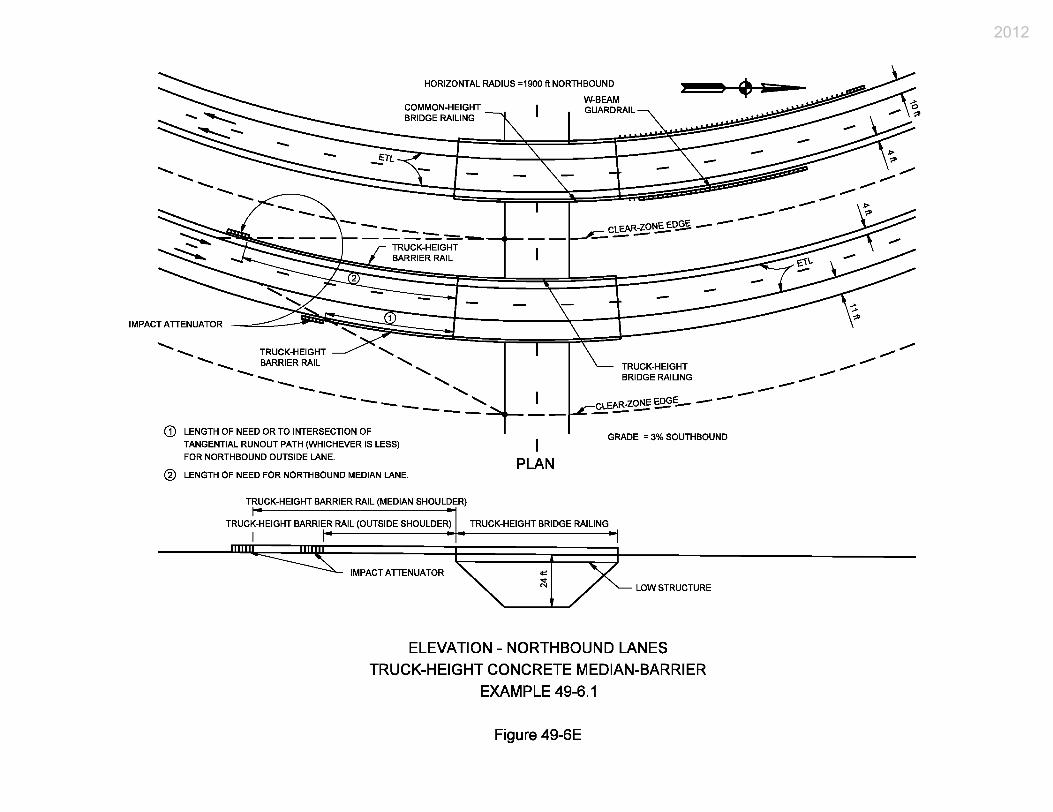
2012
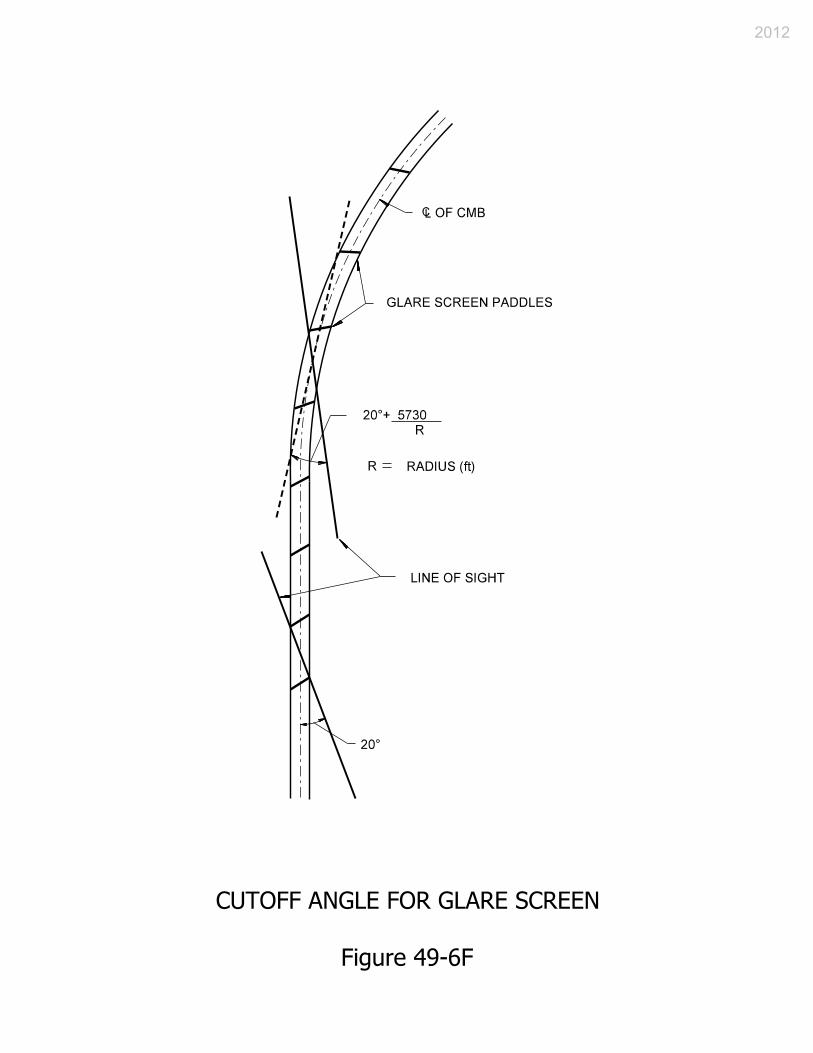
2012
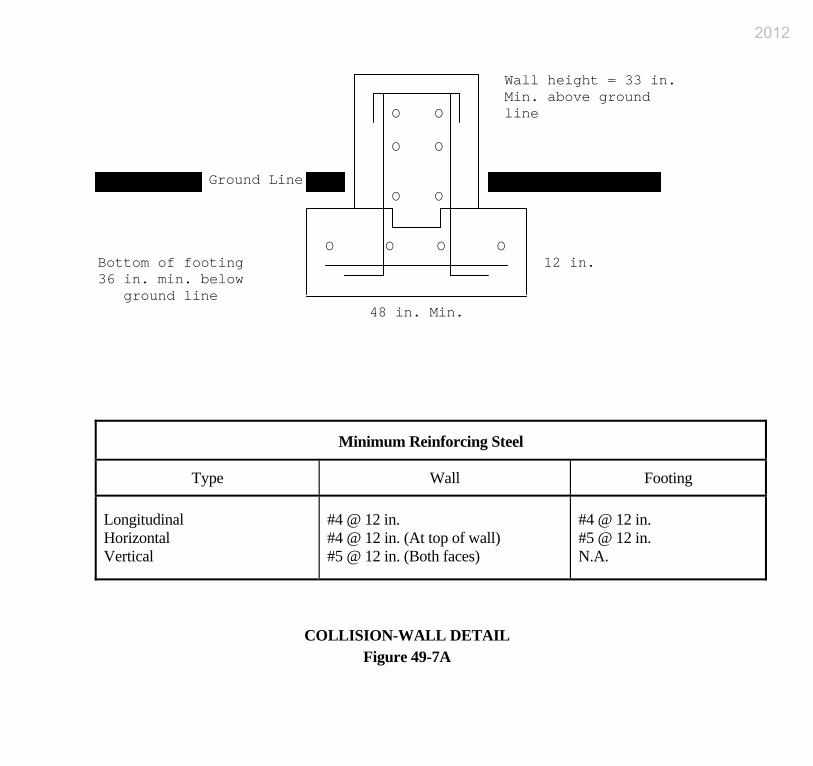
Wall height = 33 in. Min. above ground O O line O O Ground Line O O O O O O Bottom of footing 12 in. 36 in. min. below ground line 48 in. Min.
Minimum Reinforcing Steel
Type Wall Footing
Longitudinal Horizontal Vertical
#4 @ 12 in. #4 @ 12 in. (At top of wall) #5 @ 12 in. (Both faces)
#4 @ 12 in. #5 @ 12 in. N.A.
COLLISION-WALL DETAIL Figure 49-7A
2012
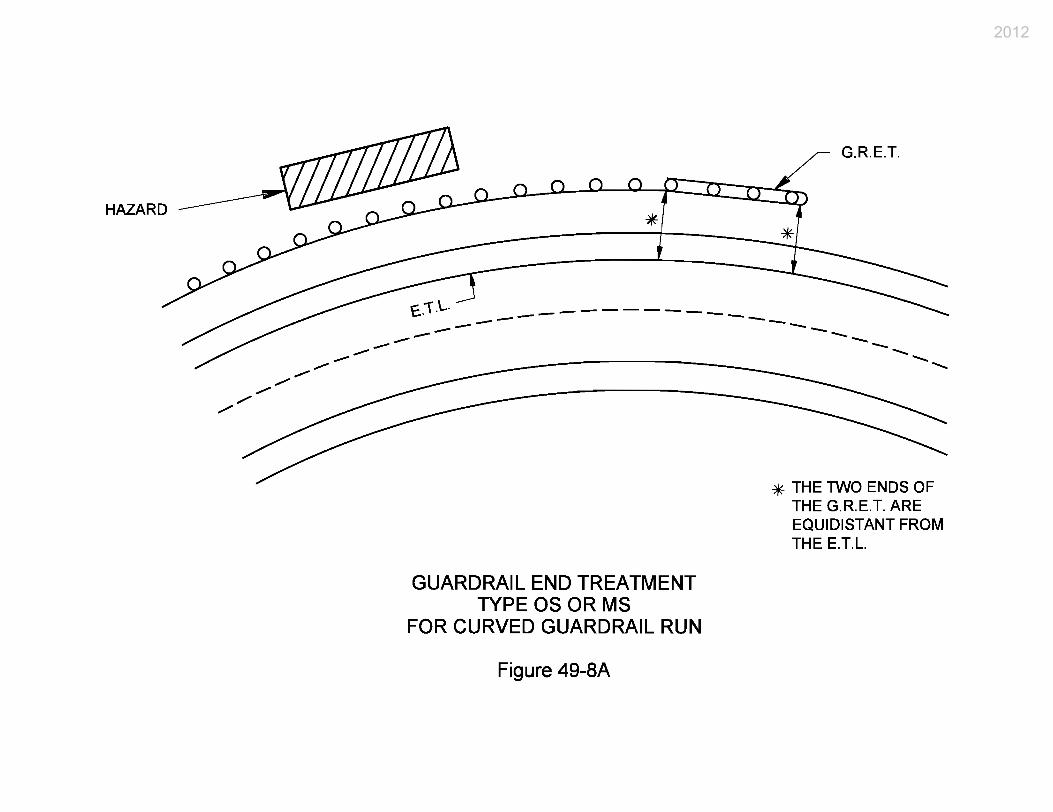
2012
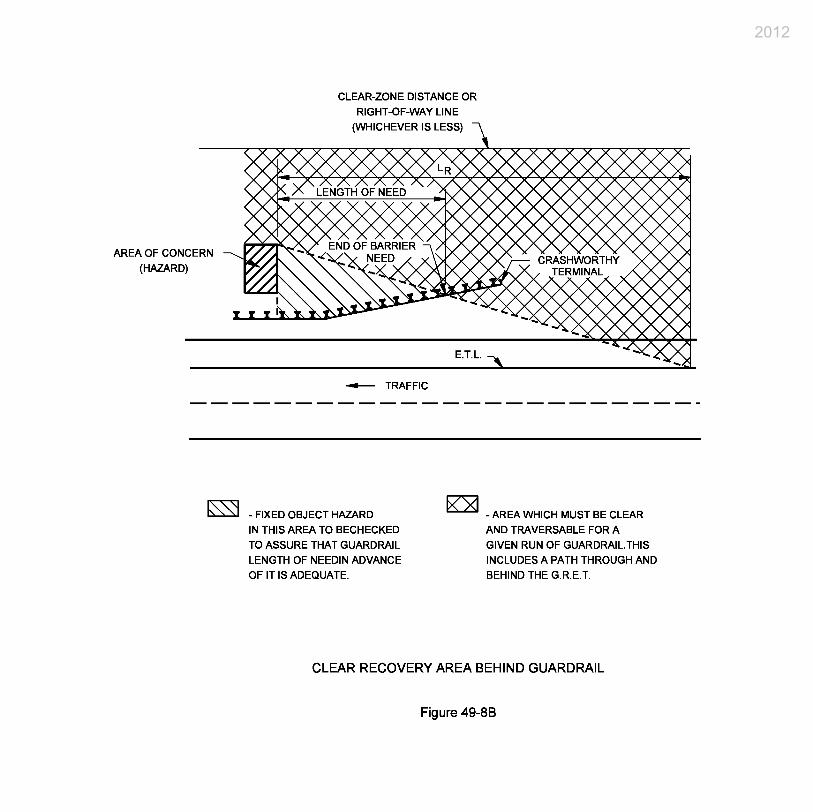
2012
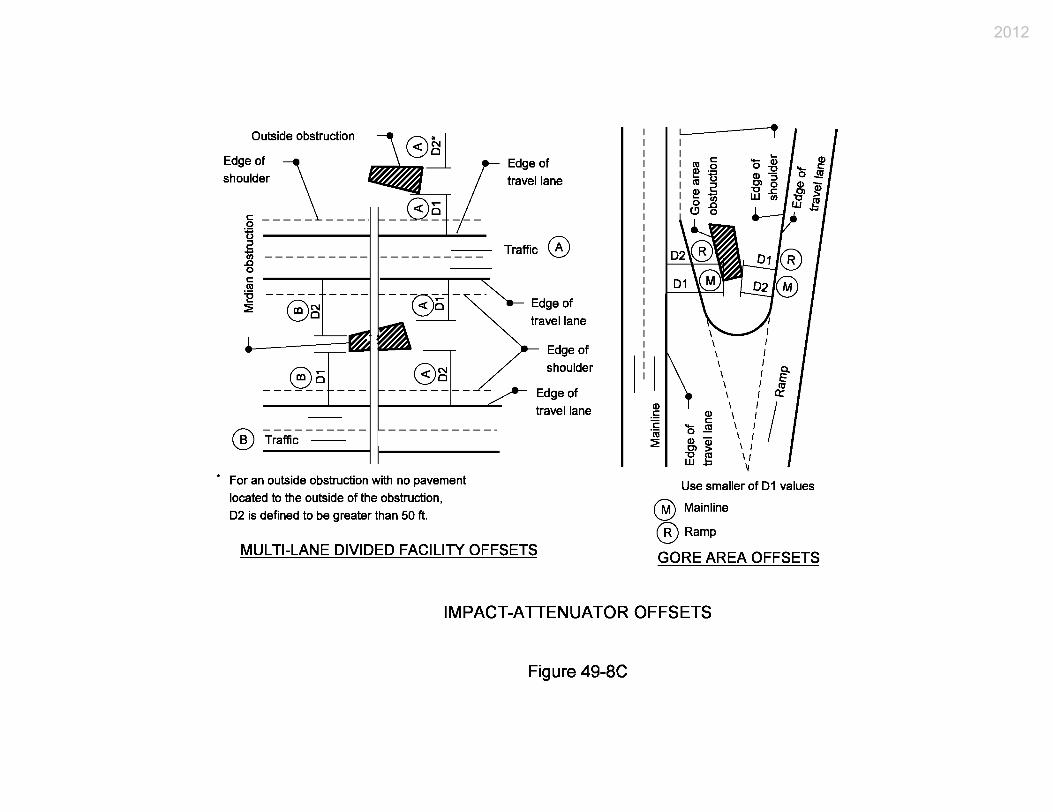
2012
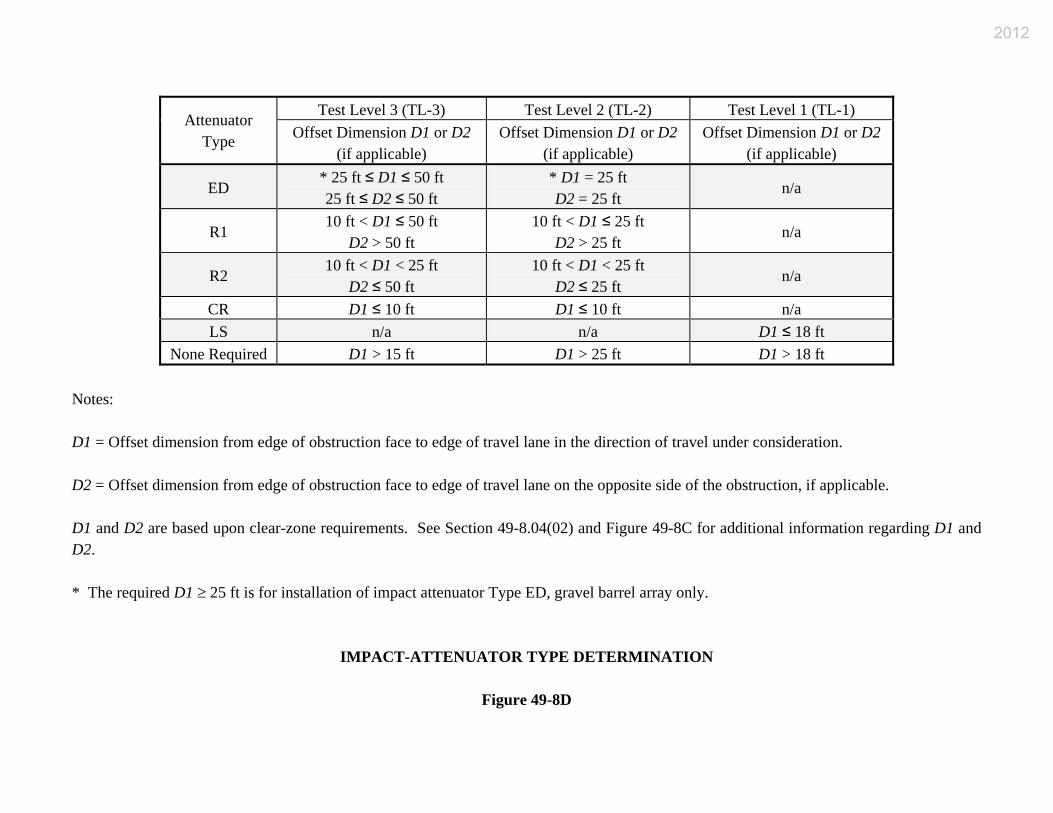
Test Level 3 (TL-3) Test Level 2 (TL-2) Test Level 1 (TL-1) Attenuator Type Offset Dimension D1 or D2
(if applicable) Offset Dimension D1 or D2
(if applicable) Offset Dimension D1 or D2
(if applicable)
ED * 25 ft ≤ D1 ≤ 50 ft 25 ft ≤ D2 ≤ 50 ft
* D1 = 25 ft D2 = 25 ft
n/a
R1 10 ft < D1 ≤ 50 ft
D2 > 50 ft 10 ft < D1 ≤ 25 ft
D2 > 25 ft n/a
R2 10 ft < D1 < 25 ft
D2 ≤ 50 ft 10 ft < D1 < 25 ft
D2 ≤ 25 ft n/a
CR D1 ≤ 10 ft D1 ≤ 10 ft n/a LS n/a n/a D1 ≤ 18 ft
None Required D1 > 15 ft D1 > 25 ft D1 > 18 ft Notes: D1 = Offset dimension from edge of obstruction face to edge of travel lane in the direction of travel under consideration. D2 = Offset dimension from edge of obstruction face to edge of travel lane on the opposite side of the obstruction, if applicable. D1 and D2 are based upon clear-zone requirements. See Section 49-8.04(02) and Figure 49-8C for additional information regarding D1 and D2. * The required D1 ≥ 25 ft is for installation of impact attenuator Type ED, gravel barrel array only.
IMPACT-ATTENUATOR TYPE DETERMINATION
Figure 49-8D
2012
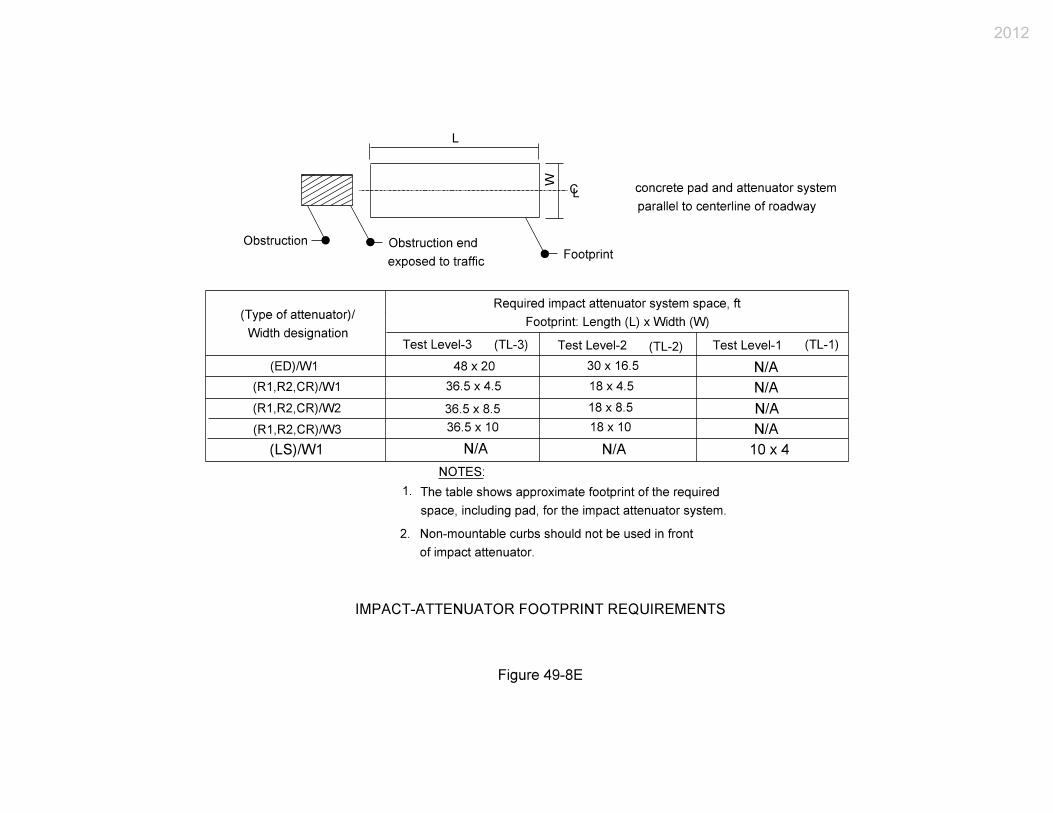
2012
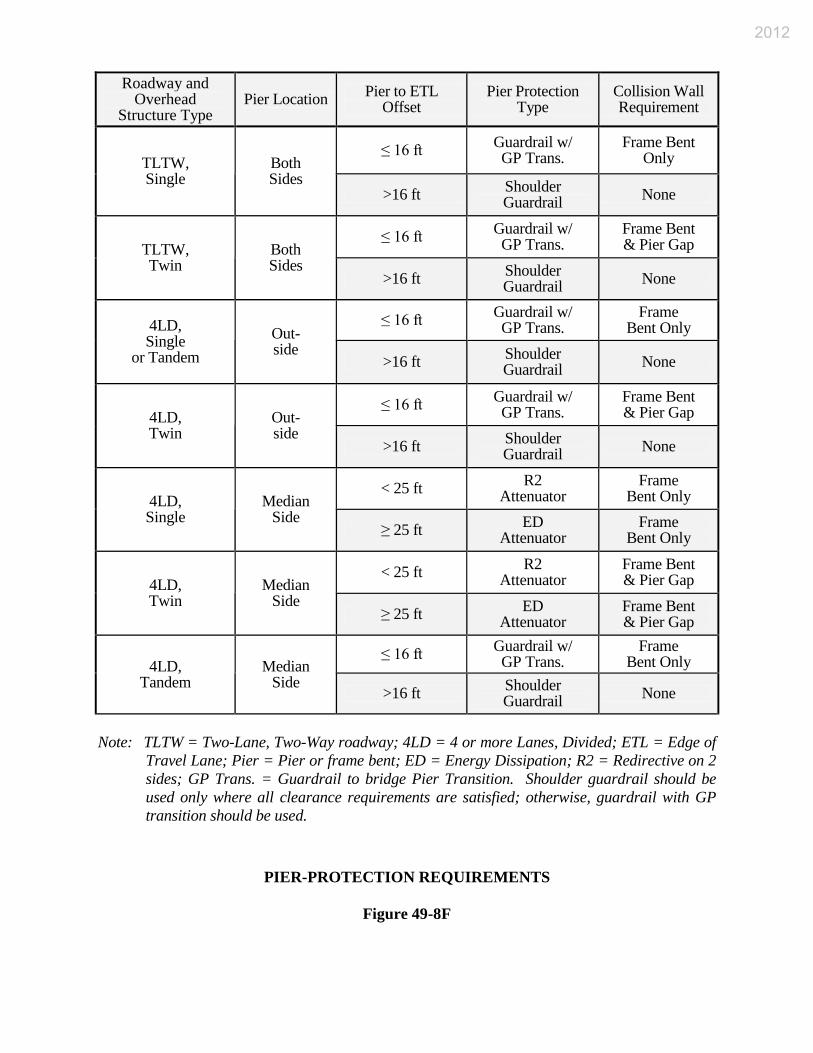
Roadway and Overhead
Structure Type Pier Location Pier to ETL
Offset Pier Protection
Type Collision Wall Requirement
TLTW, Single
Both Sides
≤ 16 ft Guardrail w/ GP Trans.
Frame Bent Only
>16 ft Shoulder Guardrail None
TLTW, Twin
Both Sides
≤ 16 ft Guardrail w/ GP Trans.
Frame Bent & Pier Gap
>16 ft Shoulder Guardrail None
4LD, Single
or Tandem Out- side
≤ 16 ft Guardrail w/ GP Trans.
Frame Bent Only
>16 ft Shoulder Guardrail None
4LD, Twin
Out- side
≤ 16 ft Guardrail w/ GP Trans.
Frame Bent & Pier Gap
>16 ft Shoulder Guardrail None
4LD, Single
Median Side
< 25 ft R2 Attenuator
Frame Bent Only
≥ 25 ft ED Attenuator
Frame Bent Only
4LD, Twin
Median Side
< 25 ft R2 Attenuator
Frame Bent & Pier Gap
≥ 25 ft ED Attenuator
Frame Bent & Pier Gap
4LD, Tandem
Median Side
≤ 16 ft Guardrail w/ GP Trans.
Frame Bent Only
>16 ft Shoulder Guardrail None
Note: TLTW = Two-Lane, Two-Way roadway; 4LD = 4 or more Lanes, Divided; ETL = Edge of
Travel Lane; Pier = Pier or frame bent; ED = Energy Dissipation; R2 = Redirective on 2 sides; GP Trans. = Guardrail to bridge Pier Transition. Shoulder guardrail should be used only where all clearance requirements are satisfied; otherwise, guardrail with GP transition should be used.
PIER-PROTECTION REQUIREMENTS
Figure 49-8F
2012
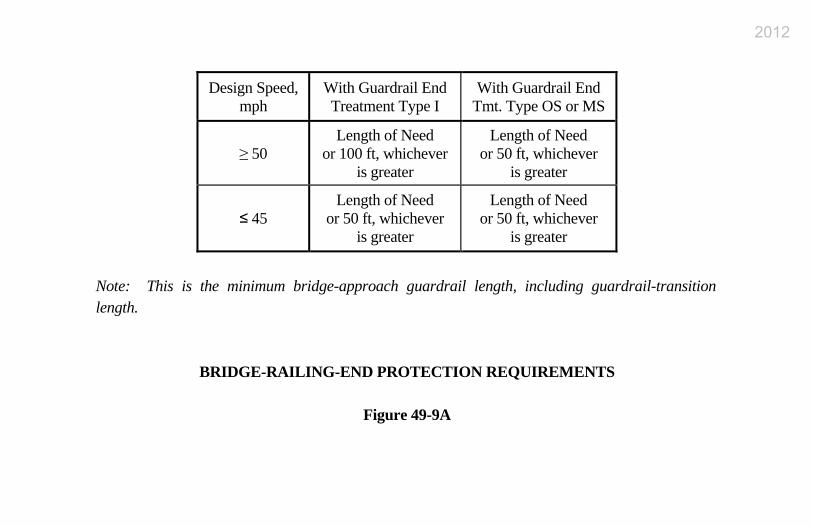
Design Speed, mph
With Guardrail End Treatment Type I
With Guardrail End Tmt. Type OS or MS
≥ 50 Length of Need
or 100 ft, whichever is greater
Length of Need or 50 ft, whichever
is greater
≤ 45 Length of Need
or 50 ft, whichever is greater
Length of Need or 50 ft, whichever
is greater
Note: This is the minimum bridge-approach guardrail length, including guardrail-transition length.
BRIDGE-RAILING-END PROTECTION REQUIREMENTS
Figure 49-9A
2012
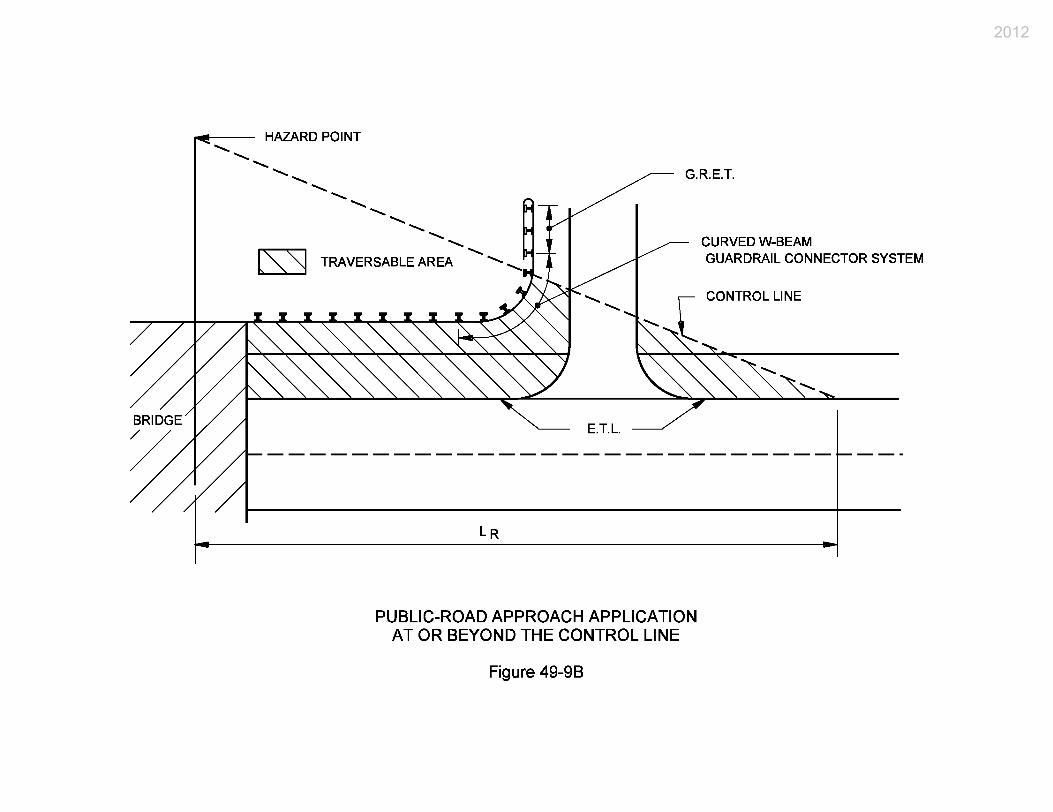
2012
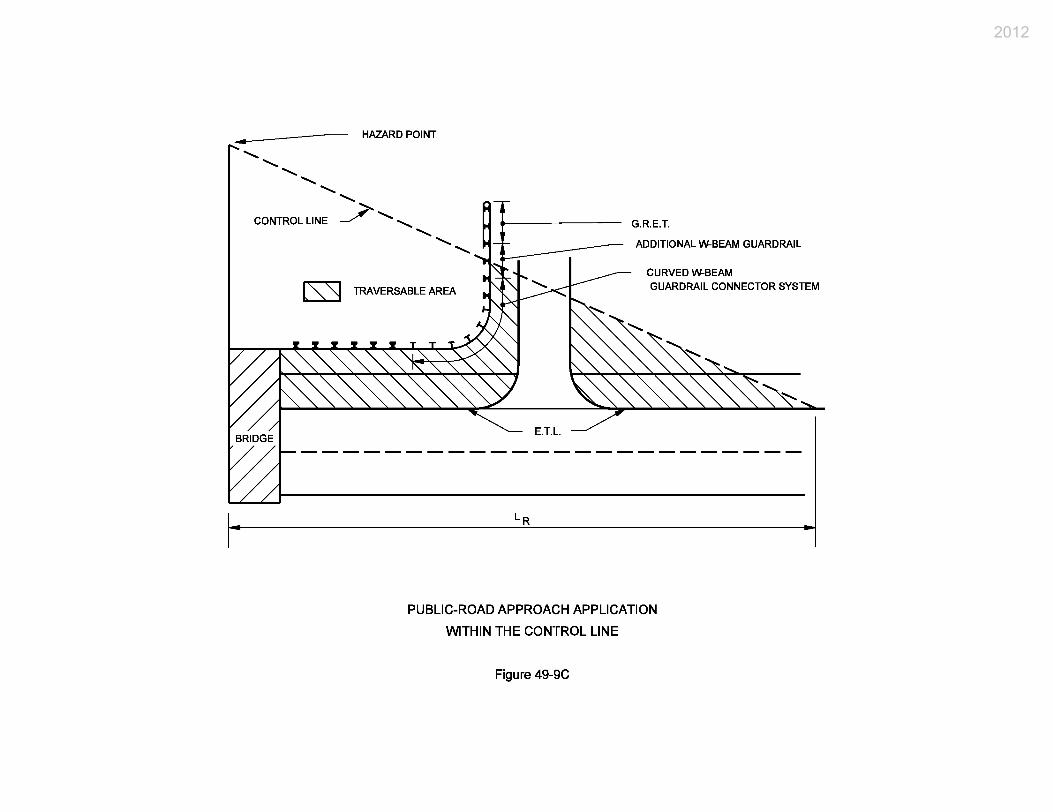
2012
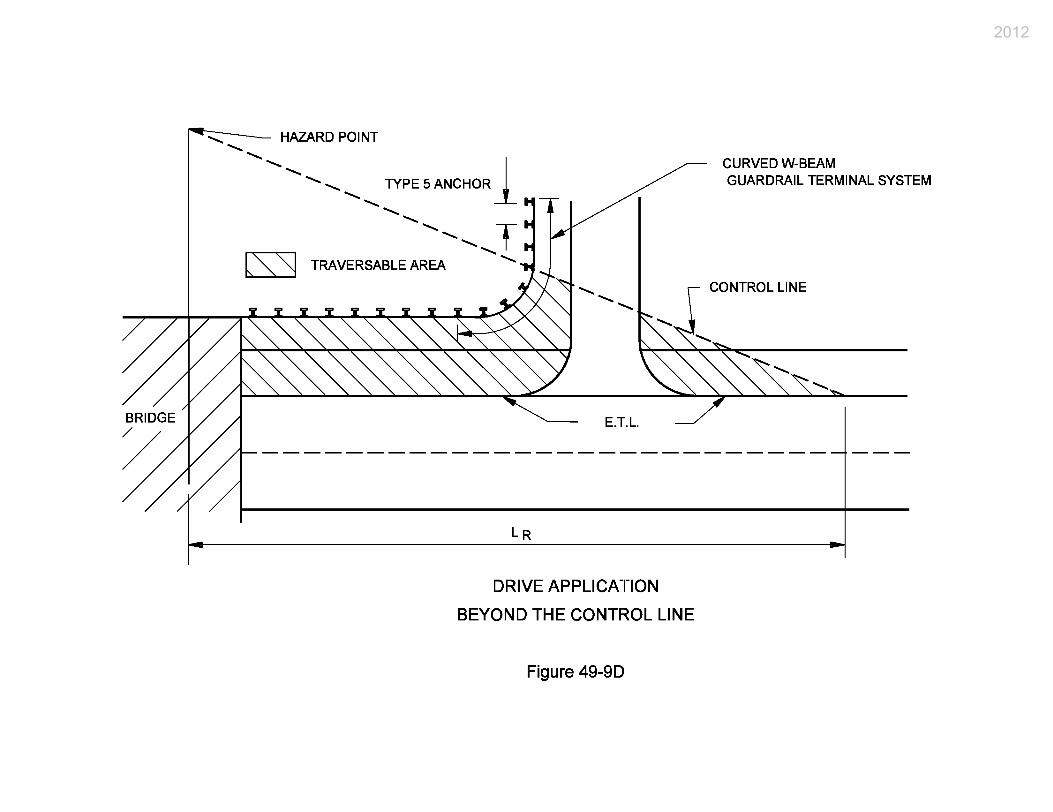
2012
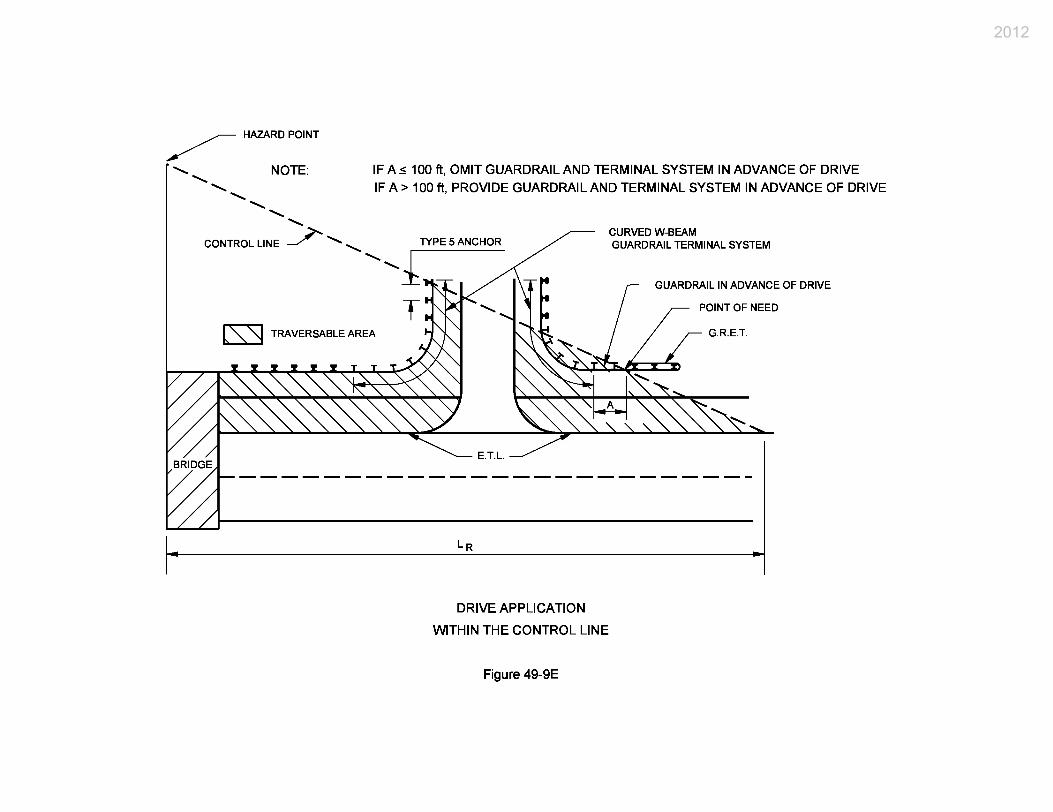
2012
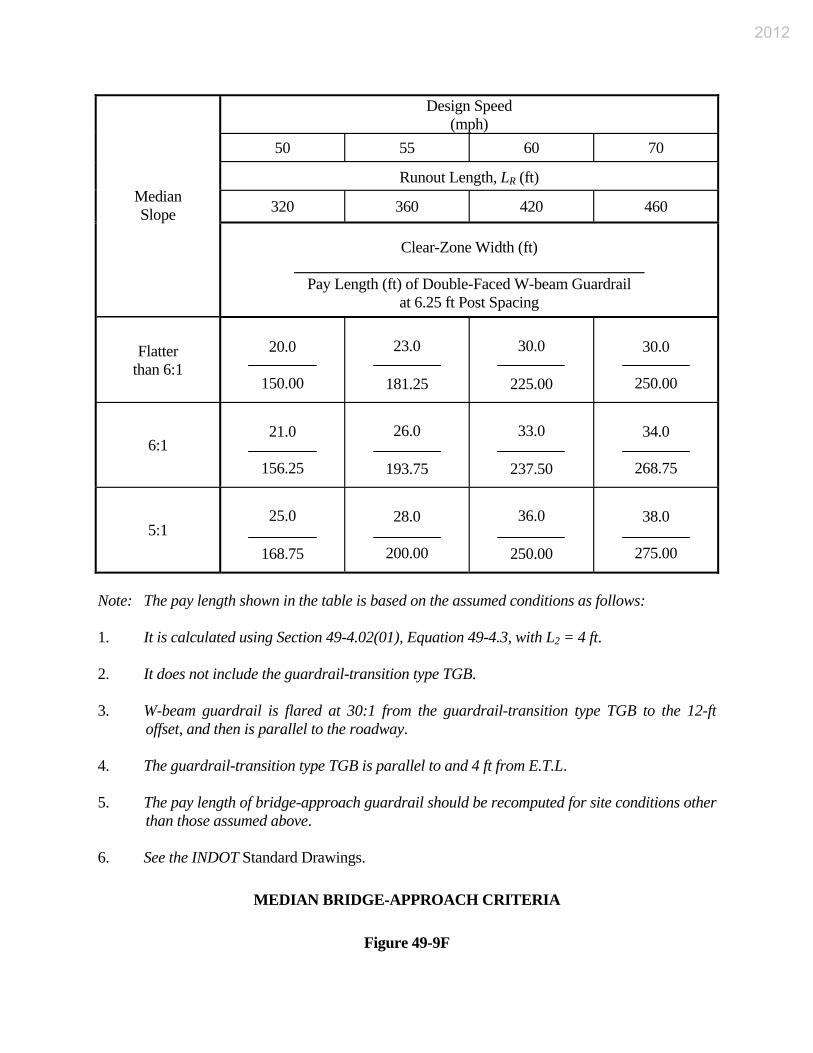
Design Speed (mph)
50 55 60 70
Runout Length, LR (ft)
320 360 420 460 Median Slope
Clear-Zone Width (ft) _____________________________________________
Pay Length (ft) of Double-Faced W-beam Guardrail at 6.25 ft Post Spacing
Flatter than 6:1
20.0
150.00
23.0
181.25
30.0
225.00
30.0
250.00
6:1 21.0
156.25
26.0
193.75
33.0
237.50
34.0
268.75
5:1 25.0
168.75
28.0
200.00
36.0
250.00
38.0
275.00
Note: The pay length shown in the table is based on the assumed conditions as follows: 1. It is calculated using Section 49-4.02(01), Equation 49-4.3, with L2 = 4 ft. 2. It does not include the guardrail-transition type TGB. 3. W-beam guardrail is flared at 30:1 from the guardrail-transition type TGB to the 12-ft
offset, and then is parallel to the roadway. 4. The guardrail-transition type TGB is parallel to and 4 ft from E.T.L. 5. The pay length of bridge-approach guardrail should be recomputed for site conditions other
than those assumed above. 6. See the INDOT Standard Drawings.
MEDIAN BRIDGE-APPROACH CRITERIA
Figure 49-9F
2012
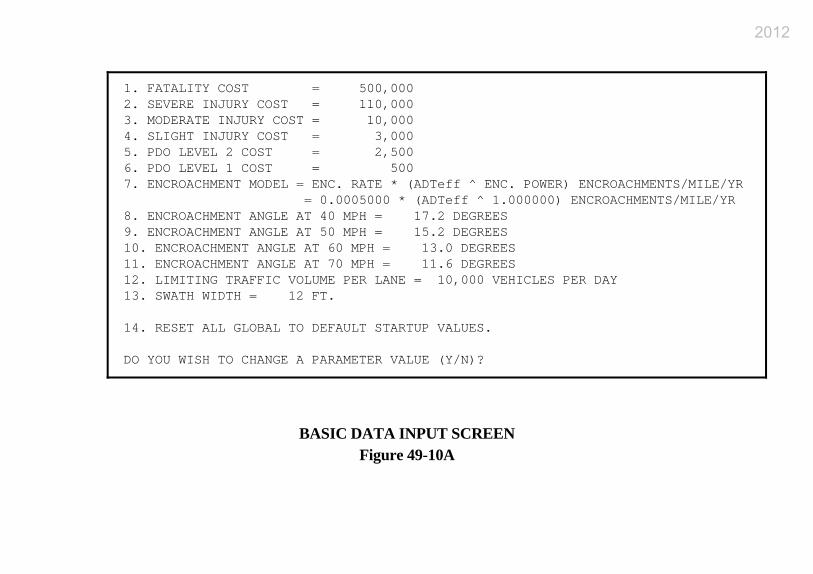
1. FATALITY COST = 500,000 2. SEVERE INJURY COST = 110,000 3. MODERATE INJURY COST = 10,000 4. SLIGHT INJURY COST = 3,000 5. PDO LEVEL 2 COST = 2,500 6. PDO LEVEL 1 COST = 500 7. ENCROACHMENT MODEL = ENC. RATE * (ADTeff ^ ENC. POWER) ENCROACHMENTS/MILE/YR = 0.0005000 * (ADTeff ^ 1.000000) ENCROACHMENTS/MILE/YR 8. ENCROACHMENT ANGLE AT 40 MPH = 17.2 DEGREES 9. ENCROACHMENT ANGLE AT 50 MPH = 15.2 DEGREES 10. ENCROACHMENT ANGLE AT 60 MPH = 13.0 DEGREES 11. ENCROACHMENT ANGLE AT 70 MPH = 11.6 DEGREES 12. LIMITING TRAFFIC VOLUME PER LANE = 10,000 VEHICLES PER DAY 13. SWATH WIDTH = 12 FT. 14. RESET ALL GLOBAL TO DEFAULT STARTUP VALUES. DO YOU WISH TO CHANGE A PARAMETER VALUE (Y/N)?
BASIC DATA INPUT SCREEN Figure 49-10A
2012
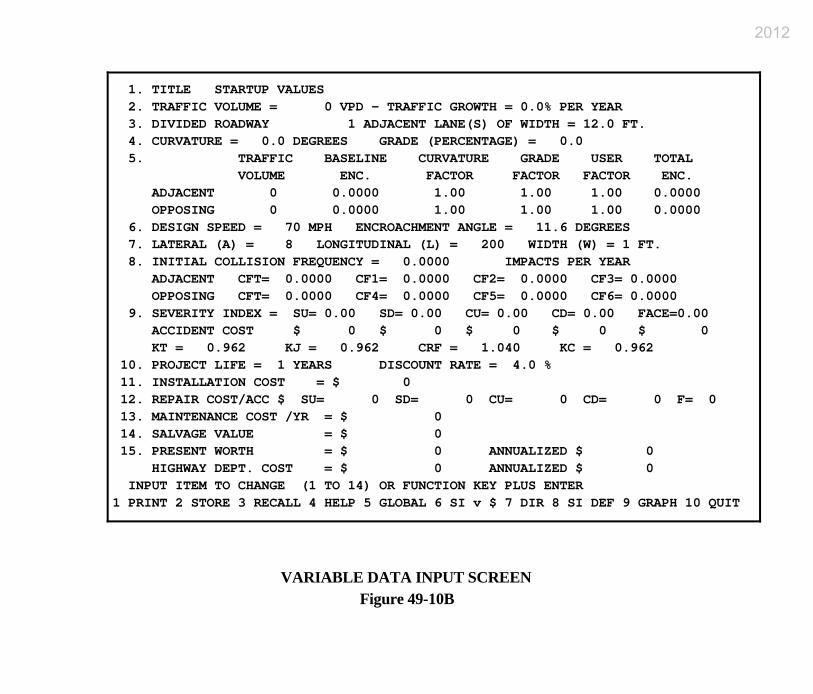
1. TITLE STARTUP VALUES 2. TRAFFIC VOLUME = 0 VPD - TRAFFIC GROWTH = 0.0% PER YEAR 3. DIVIDED ROADWAY 1 ADJACENT LANE(S) OF WIDTH = 12.0 FT. 4. CURVATURE = 0.0 DEGREES GRADE (PERCENTAGE) = 0.0 5. TRAFFIC BASELINE CURVATURE GRADE USER TOTAL VOLUME ENC. FACTOR FACTOR FACTOR ENC. ADJACENT 0 0.0000 1.00 1.00 1.00 0.0000 OPPOSING 0 0.0000 1.00 1.00 1.00 0.0000 6. DESIGN SPEED = 70 MPH ENCROACHMENT ANGLE = 11.6 DEGREES 7. LATERAL (A) = 8 LONGITUDINAL (L) = 200 WIDTH (W) = 1 FT. 8. INITIAL COLLISION FREQUENCY = 0.0000 IMPACTS PER YEAR ADJACENT CFT= 0.0000 CF1= 0.0000 CF2= 0.0000 CF3= 0.0000 OPPOSING CFT= 0.0000 CF4= 0.0000 CF5= 0.0000 CF6= 0.0000 9. SEVERITY INDEX = SU= 0.00 SD= 0.00 CU= 0.00 CD= 0.00 FACE=0.00 ACCIDENT COST $ 0 $ 0 $ 0 $ 0 $ 0 KT = 0.962 KJ = 0.962 CRF = 1.040 KC = 0.962 10. PROJECT LIFE = 1 YEARS DISCOUNT RATE = 4.0 % 11. INSTALLATION COST = $ 0 12. REPAIR COST/ACC $ SU= 0 SD= 0 CU= 0 CD= 0 F= 0 13. MAINTENANCE COST /YR = $ 0 14. SALVAGE VALUE = $ 0 15. PRESENT WORTH = $ 0 ANNUALIZED $ 0 HIGHWAY DEPT. COST = $ 0 ANNUALIZED $ 0 INPUT ITEM TO CHANGE (1 TO 14) OR FUNCTION KEY PLUS ENTER 1 PRINT 2 STORE 3 RECALL 4 HELP 5 GLOBAL 6 SI v $ 7 DIR 8 SI DEF 9 GRAPH 10 QUIT
VARIABLE DATA INPUT SCREEN Figure 49-10B
2012
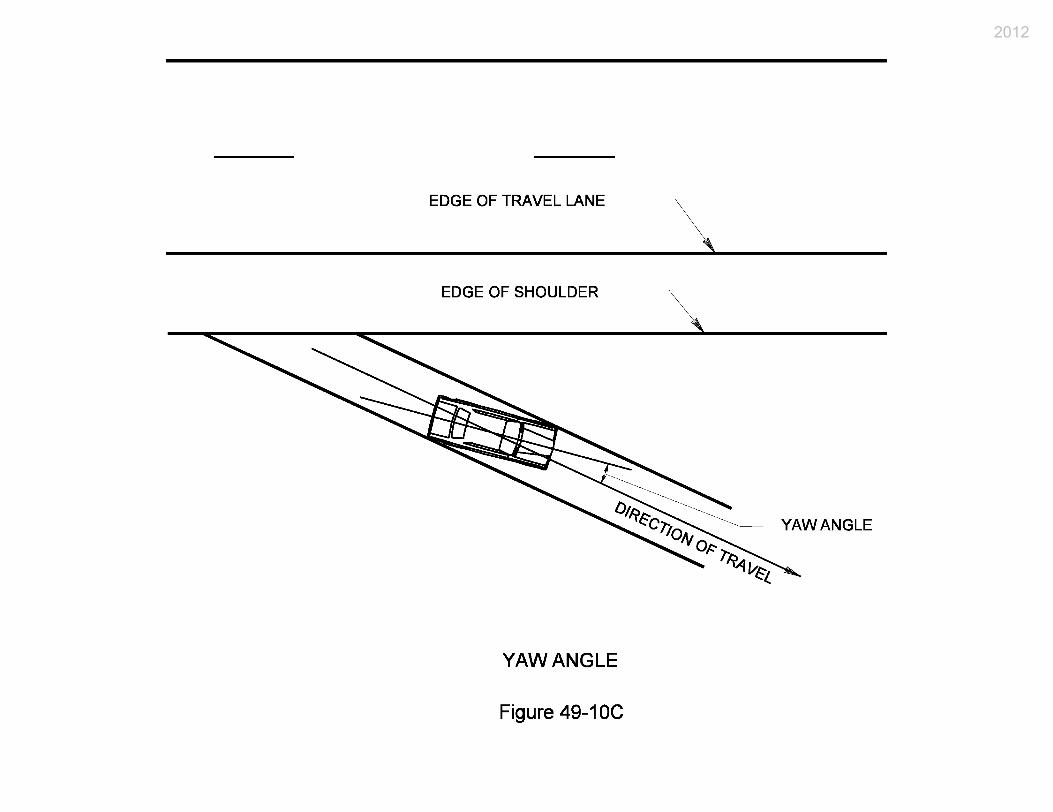
2012
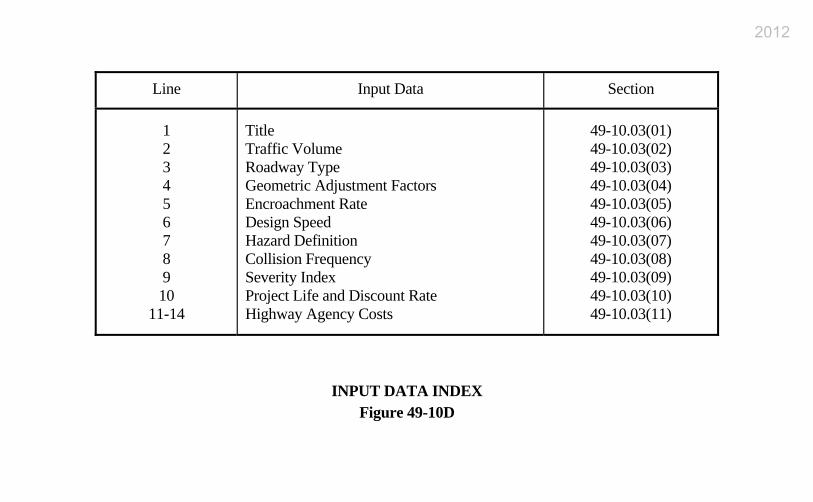
Line Input Data Section
1 2 3 4 5 6 7 8 9 10
11-14
Title Traffic Volume Roadway Type Geometric Adjustment Factors Encroachment Rate Design Speed Hazard Definition Collision Frequency Severity Index Project Life and Discount Rate Highway Agency Costs
49-10.03(01) 49-10.03(02) 49-10.03(03) 49-10.03(04) 49-10.03(05) 49-10.03(06) 49-10.03(07) 49-10.03(08) 49-10.03(09) 49-10.03(10) 49-10.03(11)
INPUT DATA INDEX Figure 49-10D
2012
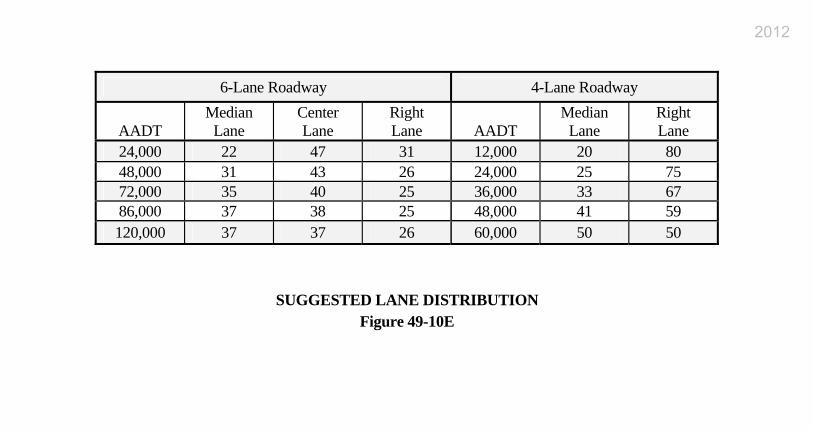
6-Lane Roadway 4-Lane Roadway
AADT Median
Lane Center Lane
Right Lane AADT
Median Lane
Right Lane
24,000 22 47 31 12,000 20 80 48,000 31 43 26 24,000 25 75 72,000 35 40 25 36,000 33 67 86,000 37 38 25 48,000 41 59 120,000 37 37 26 60,000 50 50
SUGGESTED LANE DISTRIBUTION Figure 49-10E
2012
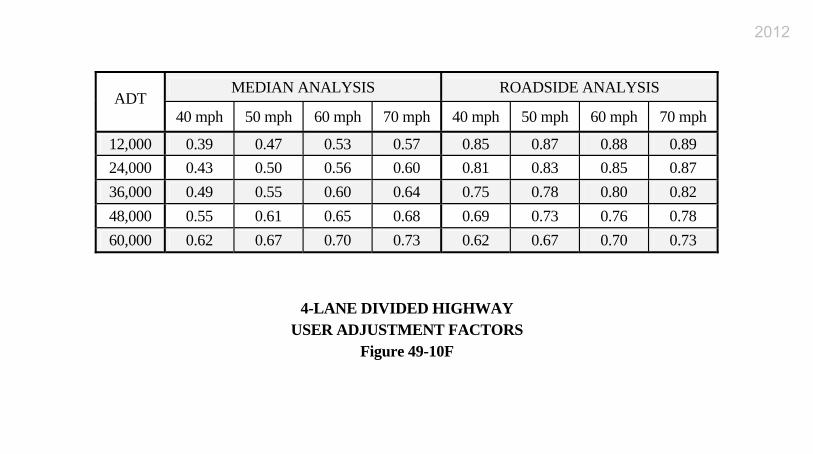
MEDIAN ANALYSIS ROADSIDE ANALYSIS ADT
40 mph 50 mph 60 mph 70 mph 40 mph 50 mph 60 mph 70 mph
12,000 0.39 0.47 0.53 0.57 0.85 0.87 0.88 0.89 24,000 0.43 0.50 0.56 0.60 0.81 0.83 0.85 0.87 36,000 0.49 0.55 0.60 0.64 0.75 0.78 0.80 0.82 48,000 0.55 0.61 0.65 0.68 0.69 0.73 0.76 0.78 60,000 0.62 0.67 0.70 0.73 0.62 0.67 0.70 0.73
4-LANE DIVIDED HIGHWAY USER ADJUSTMENT FACTORS
Figure 49-10F
2012
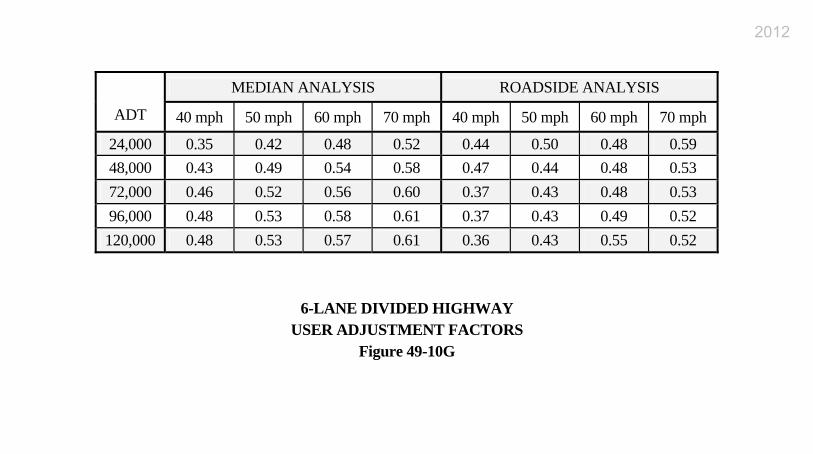
MEDIAN ANALYSIS ROADSIDE ANALYSIS
ADT 40 mph 50 mph 60 mph 70 mph 40 mph 50 mph 60 mph 70 mph
24,000 0.35 0.42 0.48 0.52 0.44 0.50 0.48 0.59 48,000 0.43 0.49 0.54 0.58 0.47 0.44 0.48 0.53 72,000 0.46 0.52 0.56 0.60 0.37 0.43 0.48 0.53 96,000 0.48 0.53 0.58 0.61 0.37 0.43 0.49 0.52 120,000 0.48 0.53 0.57 0.61 0.36 0.43 0.55 0.52
6-LANE DIVIDED HIGHWAY USER ADJUSTMENT FACTORS
Figure 49-10G
2012
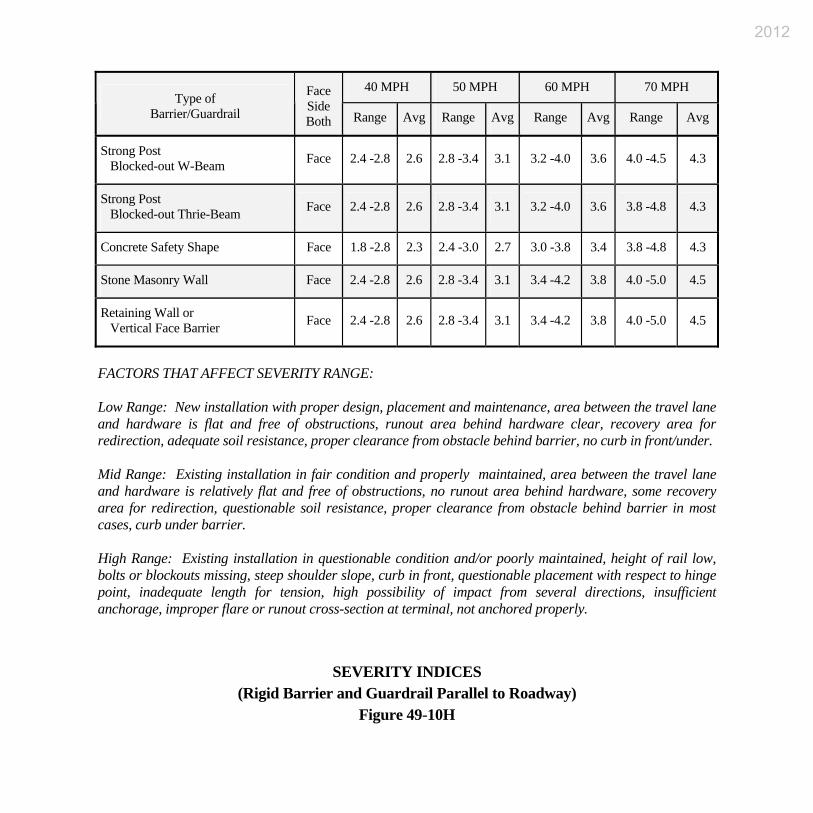
40 MPH 50 MPH 60 MPH 70 MPH Type of
Barrier/Guardrail
Face Side Both Range Avg Range Avg Range Avg Range Avg
Strong Post Blocked-out W-Beam Face 2.4 -2.8 2.6 2.8 -3.4 3.1 3.2 -4.0 3.6 4.0 -4.5 4.3
Strong Post Blocked-out Thrie-Beam Face 2.4 -2.8 2.6 2.8 -3.4 3.1 3.2 -4.0 3.6 3.8 -4.8 4.3
Concrete Safety Shape Face 1.8 -2.8 2.3 2.4 -3.0 2.7 3.0 -3.8 3.4 3.8 -4.8 4.3
Stone Masonry Wall Face 2.4 -2.8 2.6 2.8 -3.4 3.1 3.4 -4.2 3.8 4.0 -5.0 4.5
Retaining Wall or Vertical Face Barrier Face 2.4 -2.8 2.6 2.8 -3.4 3.1 3.4 -4.2 3.8 4.0 -5.0 4.5
FACTORS THAT AFFECT SEVERITY RANGE: Low Range: New installation with proper design, placement and maintenance, area between the travel lane and hardware is flat and free of obstructions, runout area behind hardware clear, recovery area for redirection, adequate soil resistance, proper clearance from obstacle behind barrier, no curb in front/under. Mid Range: Existing installation in fair condition and properly maintained, area between the travel lane and hardware is relatively flat and free of obstructions, no runout area behind hardware, some recovery area for redirection, questionable soil resistance, proper clearance from obstacle behind barrier in most cases, curb under barrier. High Range: Existing installation in questionable condition and/or poorly maintained, height of rail low, bolts or blockouts missing, steep shoulder slope, curb in front, questionable placement with respect to hinge point, inadequate length for tension, high possibility of impact from several directions, insufficient anchorage, improper flare or runout cross-section at terminal, not anchored properly.
SEVERITY INDICES (Rigid Barrier and Guardrail Parallel to Roadway)
Figure 49-10H
2012
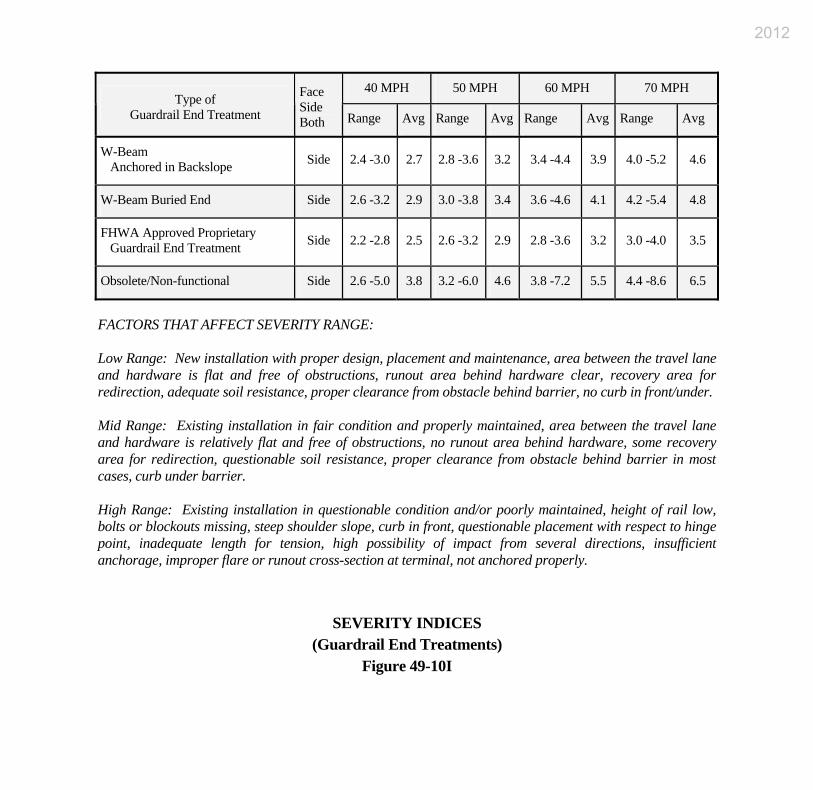
40 MPH 50 MPH 60 MPH 70 MPH Type of
Guardrail End Treatment
Face Side Both Range Avg Range Avg Range Avg Range Avg
W-Beam Anchored in Backslope Side 2.4 -3.0 2.7 2.8 -3.6 3.2 3.4 -4.4 3.9 4.0 -5.2 4.6
W-Beam Buried End Side 2.6 -3.2 2.9 3.0 -3.8 3.4 3.6 -4.6 4.1 4.2 -5.4 4.8
FHWA Approved Proprietary Guardrail End Treatment Side 2.2 -2.8 2.5 2.6 -3.2 2.9 2.8 -3.6 3.2 3.0 -4.0 3.5
Obsolete/Non-functional Side 2.6 -5.0 3.8 3.2 -6.0 4.6 3.8 -7.2 5.5 4.4 -8.6 6.5
FACTORS THAT AFFECT SEVERITY RANGE: Low Range: New installation with proper design, placement and maintenance, area between the travel lane and hardware is flat and free of obstructions, runout area behind hardware clear, recovery area for redirection, adequate soil resistance, proper clearance from obstacle behind barrier, no curb in front/under. Mid Range: Existing installation in fair condition and properly maintained, area between the travel lane and hardware is relatively flat and free of obstructions, no runout area behind hardware, some recovery area for redirection, questionable soil resistance, proper clearance from obstacle behind barrier in most cases, curb under barrier. High Range: Existing installation in questionable condition and/or poorly maintained, height of rail low, bolts or blockouts missing, steep shoulder slope, curb in front, questionable placement with respect to hinge point, inadequate length for tension, high possibility of impact from several directions, insufficient anchorage, improper flare or runout cross-section at terminal, not anchored properly.
SEVERITY INDICES (Guardrail End Treatments)
Figure 49-10I
2012
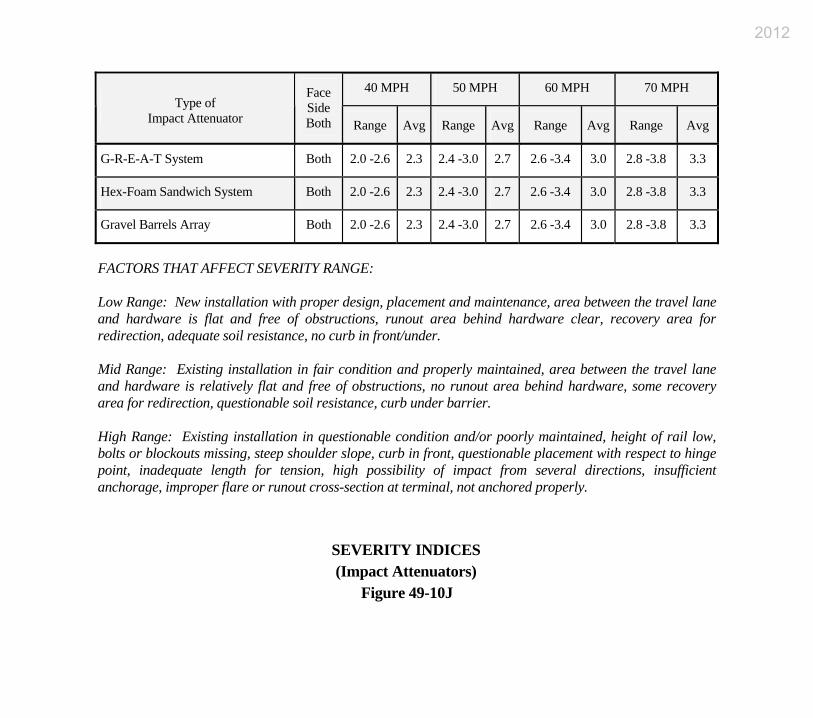
40 MPH 50 MPH 60 MPH 70 MPH Type of
Impact Attenuator
Face Side Both Range Avg Range Avg Range Avg Range Avg
G-R-E-A-T System Both 2.0 -2.6 2.3 2.4 -3.0 2.7 2.6 -3.4 3.0 2.8 -3.8 3.3
Hex-Foam Sandwich System Both 2.0 -2.6 2.3 2.4 -3.0 2.7 2.6 -3.4 3.0 2.8 -3.8 3.3
Gravel Barrels Array Both 2.0 -2.6 2.3 2.4 -3.0 2.7 2.6 -3.4 3.0 2.8 -3.8 3.3
FACTORS THAT AFFECT SEVERITY RANGE: Low Range: New installation with proper design, placement and maintenance, area between the travel lane and hardware is flat and free of obstructions, runout area behind hardware clear, recovery area for redirection, adequate soil resistance, no curb in front/under. Mid Range: Existing installation in fair condition and properly maintained, area between the travel lane and hardware is relatively flat and free of obstructions, no runout area behind hardware, some recovery area for redirection, questionable soil resistance, curb under barrier. High Range: Existing installation in questionable condition and/or poorly maintained, height of rail low, bolts or blockouts missing, steep shoulder slope, curb in front, questionable placement with respect to hinge point, inadequate length for tension, high possibility of impact from several directions, insufficient anchorage, improper flare or runout cross-section at terminal, not anchored properly.
SEVERITY INDICES (Impact Attenuators)
Figure 49-10J
2012
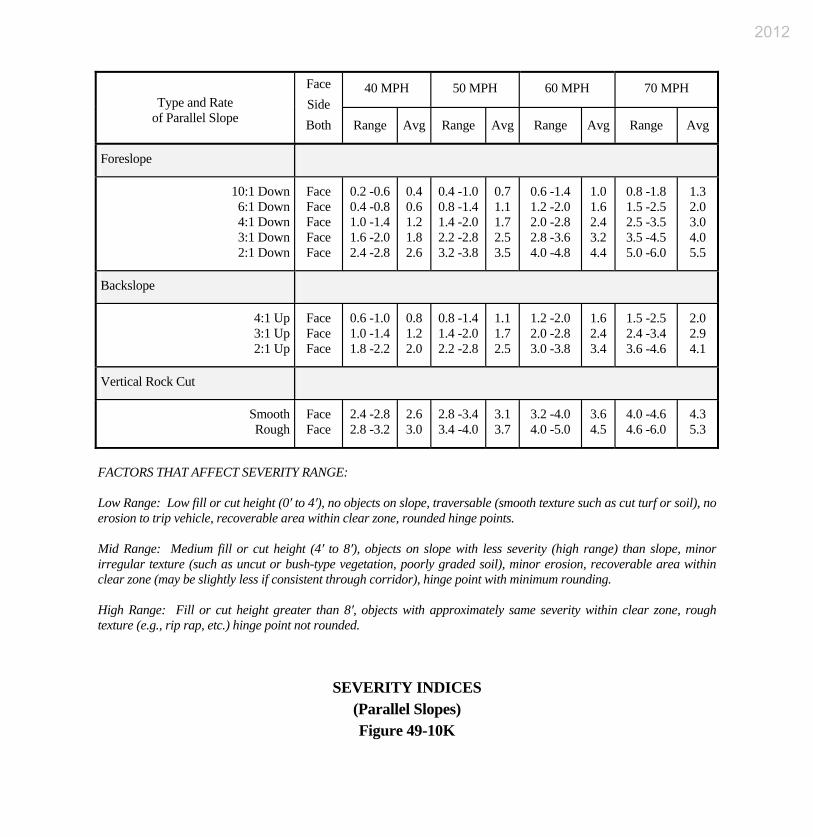
40 MPH 50 MPH 60 MPH 70 MPH Type and Rate
of Parallel Slope
Face Side Both Range Avg Range Avg Range Avg Range Avg
Foreslope
10:1 Down 6:1 Down 4:1 Down 3:1 Down 2:1 Down
Face Face Face Face Face
0.2 -0.6 0.4 -0.8 1.0 -1.4 1.6 -2.0 2.4 -2.8
0.4 0.6 1.2 1.8 2.6
0.4 -1.0 0.8 -1.4 1.4 -2.0 2.2 -2.8 3.2 -3.8
0.7 1.1 1.7 2.5 3.5
0.6 -1.4 1.2 -2.0 2.0 -2.8 2.8 -3.6 4.0 -4.8
1.0 1.6 2.4 3.2 4.4
0.8 -1.8 1.5 -2.5 2.5 -3.5 3.5 -4.5 5.0 -6.0
1.3 2.0 3.0 4.0 5.5
Backslope
4:1 Up 3:1 Up 2:1 Up
Face Face Face
0.6 -1.0 1.0 -1.4 1.8 -2.2
0.8 1.2 2.0
0.8 -1.4 1.4 -2.0 2.2 -2.8
1.1 1.7 2.5
1.2 -2.0 2.0 -2.8 3.0 -3.8
1.6 2.4 3.4
1.5 -2.5 2.4 -3.4 3.6 -4.6
2.0 2.9 4.1
Vertical Rock Cut
Smooth Rough
Face Face
2.4 -2.8 2.8 -3.2
2.6 3.0
2.8 -3.4 3.4 -4.0
3.1 3.7
3.2 -4.0 4.0 -5.0
3.6 4.5
4.0 -4.6 4.6 -6.0
4.3 5.3
FACTORS THAT AFFECT SEVERITY RANGE: Low Range: Low fill or cut height (0′ to 4′), no objects on slope, traversable (smooth texture such as cut turf or soil), no erosion to trip vehicle, recoverable area within clear zone, rounded hinge points. Mid Range: Medium fill or cut height (4′ to 8′), objects on slope with less severity (high range) than slope, minor irregular texture (such as uncut or bush-type vegetation, poorly graded soil), minor erosion, recoverable area within clear zone (may be slightly less if consistent through corridor), hinge point with minimum rounding. High Range: Fill or cut height greater than 8′, objects with approximately same severity within clear zone, rough texture (e.g., rip rap, etc.) hinge point not rounded.
SEVERITY INDICES (Parallel Slopes) Figure 49-10K
2012
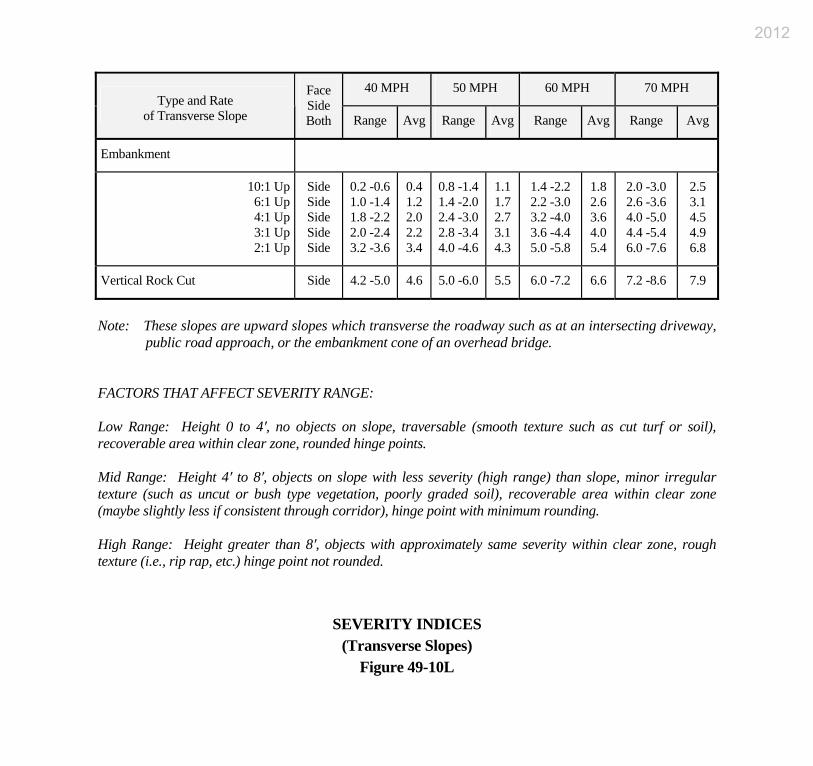
40 MPH 50 MPH 60 MPH 70 MPH Type and Rate
of Transverse Slope
Face Side Both Range Avg Range Avg Range Avg Range Avg
Embankment
10:1 Up 6:1 Up 4:1 Up 3:1 Up 2:1 Up
Side Side Side Side Side
0.2 -0.6 1.0 -1.4 1.8 -2.2 2.0 -2.4 3.2 -3.6
0.4 1.2 2.0 2.2 3.4
0.8 -1.4 1.4 -2.0 2.4 -3.0 2.8 -3.4 4.0 -4.6
1.1 1.7 2.7 3.1 4.3
1.4 -2.2 2.2 -3.0 3.2 -4.0 3.6 -4.4 5.0 -5.8
1.8 2.6 3.6 4.0 5.4
2.0 -3.0 2.6 -3.6 4.0 -5.0 4.4 -5.4 6.0 -7.6
2.5 3.1 4.5 4.9 6.8
Vertical Rock Cut Side 4.2 -5.0 4.6 5.0 -6.0 5.5 6.0 -7.2 6.6 7.2 -8.6 7.9
Note: These slopes are upward slopes which transverse the roadway such as at an intersecting driveway,
public road approach, or the embankment cone of an overhead bridge. FACTORS THAT AFFECT SEVERITY RANGE: Low Range: Height 0 to 4′, no objects on slope, traversable (smooth texture such as cut turf or soil), recoverable area within clear zone, rounded hinge points. Mid Range: Height 4′ to 8′, objects on slope with less severity (high range) than slope, minor irregular texture (such as uncut or bush type vegetation, poorly graded soil), recoverable area within clear zone (maybe slightly less if consistent through corridor), hinge point with minimum rounding. High Range: Height greater than 8′, objects with approximately same severity within clear zone, rough texture (i.e., rip rap, etc.) hinge point not rounded.
SEVERITY INDICES (Transverse Slopes)
Figure 49-10L
2012
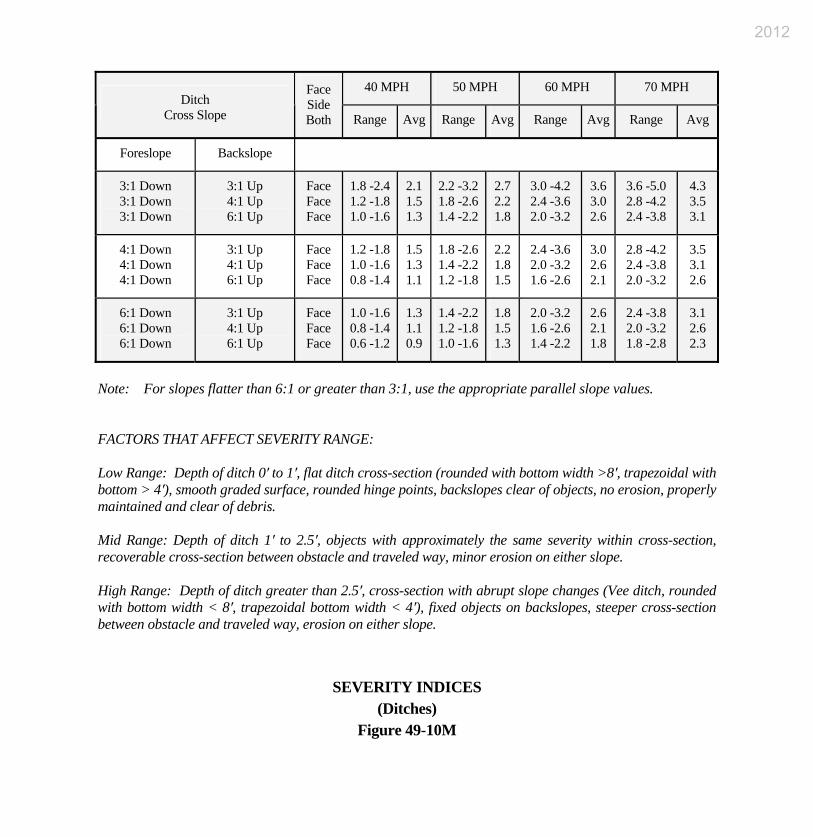
40 MPH 50 MPH 60 MPH 70 MPH Ditch
Cross Slope
Face Side Both Range Avg Range Avg Range Avg Range Avg
Foreslope Backslope
3:1 Down 3:1 Down 3:1 Down
3:1 Up 4:1 Up 6:1 Up
Face Face Face
1.8 -2.4 1.2 -1.8 1.0 -1.6
2.1 1.5 1.3
2.2 -3.2 1.8 -2.6 1.4 -2.2
2.7 2.2 1.8
3.0 -4.2 2.4 -3.6 2.0 -3.2
3.6 3.0 2.6
3.6 -5.0 2.8 -4.2 2.4 -3.8
4.3 3.5 3.1
4:1 Down 4:1 Down 4:1 Down
3:1 Up 4:1 Up 6:1 Up
Face Face Face
1.2 -1.8 1.0 -1.6 0.8 -1.4
1.5 1.3 1.1
1.8 -2.6 1.4 -2.2 1.2 -1.8
2.2 1.8 1.5
2.4 -3.6 2.0 -3.2 1.6 -2.6
3.0 2.6 2.1
2.8 -4.2 2.4 -3.8 2.0 -3.2
3.5 3.1 2.6
6:1 Down 6:1 Down 6:1 Down
3:1 Up 4:1 Up 6:1 Up
Face Face Face
1.0 -1.6 0.8 -1.4 0.6 -1.2
1.3 1.1 0.9
1.4 -2.2 1.2 -1.8 1.0 -1.6
1.8 1.5 1.3
2.0 -3.2 1.6 -2.6 1.4 -2.2
2.6 2.1 1.8
2.4 -3.8 2.0 -3.2 1.8 -2.8
3.1 2.6 2.3
Note: For slopes flatter than 6:1 or greater than 3:1, use the appropriate parallel slope values. FACTORS THAT AFFECT SEVERITY RANGE: Low Range: Depth of ditch 0′ to 1′, flat ditch cross-section (rounded with bottom width >8′, trapezoidal with bottom > 4′), smooth graded surface, rounded hinge points, backslopes clear of objects, no erosion, properly maintained and clear of debris. Mid Range: Depth of ditch 1′ to 2.5′, objects with approximately the same severity within cross-section, recoverable cross-section between obstacle and traveled way, minor erosion on either slope. High Range: Depth of ditch greater than 2.5′, cross-section with abrupt slope changes (Vee ditch, rounded with bottom width < 8′, trapezoidal bottom width < 4′), fixed objects on backslopes, steeper cross-section between obstacle and traveled way, erosion on either slope.
SEVERITY INDICES (Ditches)
Figure 49-10M
2012
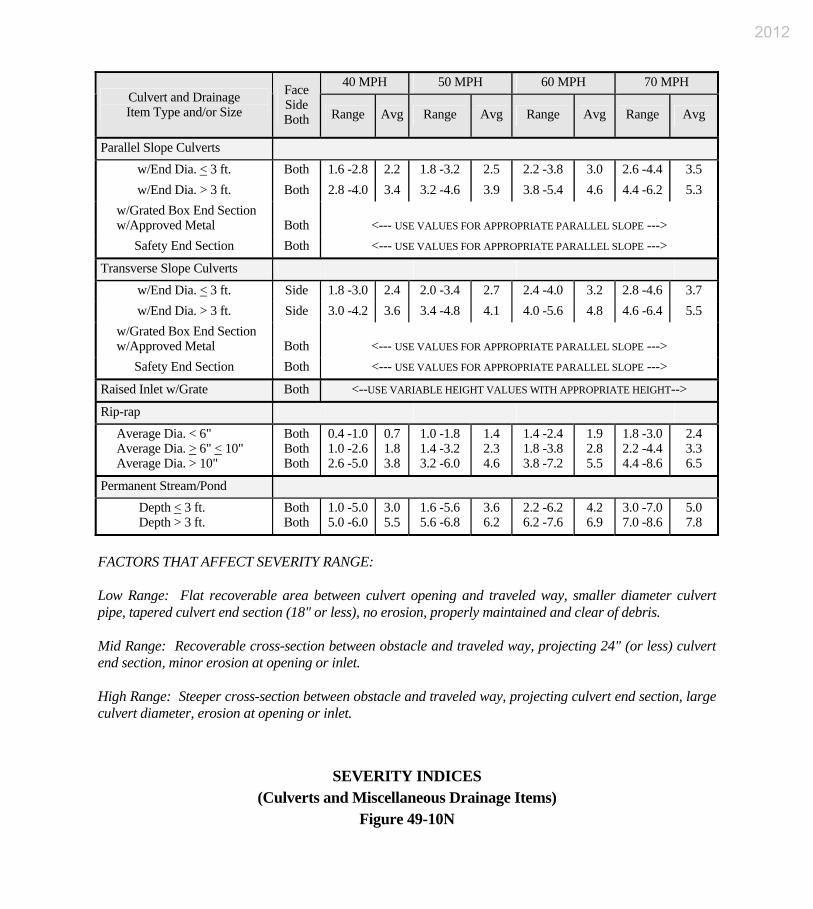
40 MPH 50 MPH 60 MPH 70 MPH Culvert and Drainage Item Type and/or Size
Face Side Both Range Avg Range Avg Range Avg Range Avg
Parallel Slope Culverts w/End Dia. < 3 ft. Both 1.6 -2.8 2.2 1.8 -3.2 2.5 2.2 -3.8 3.0 2.6 -4.4 3.5 w/End Dia. > 3 ft. Both 2.8 -4.0 3.4 3.2 -4.6 3.9 3.8 -5.4 4.6 4.4 -6.2 5.3
w/Grated Box End Section w/Approved Metal Both <--- USE VALUES FOR APPROPRIATE PARALLEL SLOPE --->
Safety End Section Both <--- USE VALUES FOR APPROPRIATE PARALLEL SLOPE --->
Transverse Slope Culverts
w/End Dia. < 3 ft. Side 1.8 -3.0 2.4 2.0 -3.4 2.7 2.4 -4.0 3.2 2.8 -4.6 3.7 w/End Dia. > 3 ft. Side 3.0 -4.2 3.6 3.4 -4.8 4.1 4.0 -5.6 4.8 4.6 -6.4 5.5
w/Grated Box End Section w/Approved Metal Both <--- USE VALUES FOR APPROPRIATE PARALLEL SLOPE --->
Safety End Section Both <--- USE VALUES FOR APPROPRIATE PARALLEL SLOPE --->
Raised Inlet w/Grate Both <--USE VARIABLE HEIGHT VALUES WITH APPROPRIATE HEIGHT-->
Rip-rap
Average Dia. < 6" Average Dia. > 6" < 10" Average Dia. > 10"
Both Both Both
0.4 -1.0 1.0 -2.6 2.6 -5.0
0.7 1.8 3.8
1.0 -1.8 1.4 -3.2 3.2 -6.0
1.4 2.3 4.6
1.4 -2.4 1.8 -3.8 3.8 -7.2
1.9 2.8 5.5
1.8 -3.0 2.2 -4.4 4.4 -8.6
2.4 3.3 6.5
Permanent Stream/Pond Depth < 3 ft. Depth > 3 ft.
Both Both
1.0 -5.0 5.0 -6.0
3.0 5.5
1.6 -5.6 5.6 -6.8
3.6 6.2
2.2 -6.2 6.2 -7.6
4.2 6.9
3.0 -7.0 7.0 -8.6
5.0 7.8
FACTORS THAT AFFECT SEVERITY RANGE: Low Range: Flat recoverable area between culvert opening and traveled way, smaller diameter culvert pipe, tapered culvert end section (18" or less), no erosion, properly maintained and clear of debris. Mid Range: Recoverable cross-section between obstacle and traveled way, projecting 24" (or less) culvert end section, minor erosion at opening or inlet. High Range: Steeper cross-section between obstacle and traveled way, projecting culvert end section, large culvert diameter, erosion at opening or inlet.
SEVERITY INDICES (Culverts and Miscellaneous Drainage Items)
Figure 49-10N
2012
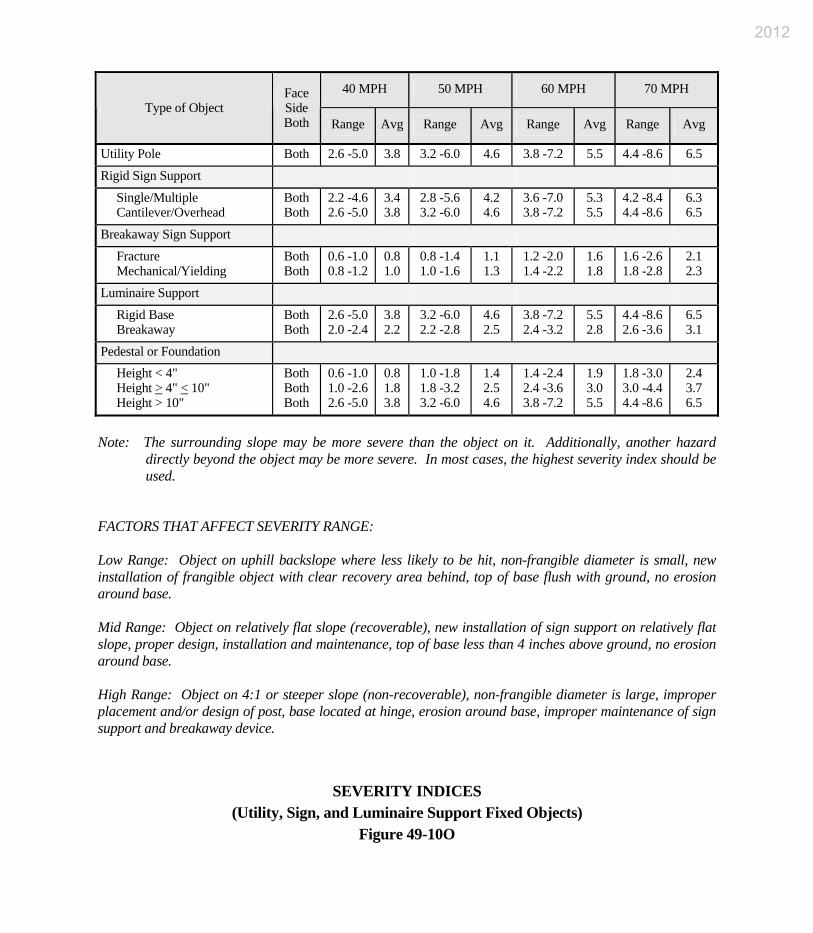
40 MPH 50 MPH 60 MPH 70 MPH Type of Object
Face Side Both Range Avg Range Avg Range Avg Range Avg
Utility Pole Both 2.6 -5.0 3.8 3.2 -6.0 4.6 3.8 -7.2 5.5 4.4 -8.6 6.5
Rigid Sign Support
Single/Multiple Cantilever/Overhead
Both Both
2.2 -4.6 2.6 -5.0
3.4 3.8
2.8 -5.6 3.2 -6.0
4.2 4.6
3.6 -7.0 3.8 -7.2
5.3 5.5
4.2 -8.4 4.4 -8.6
6.3 6.5
Breakaway Sign Support
Fracture Mechanical/Yielding
Both Both
0.6 -1.0 0.8 -1.2
0.8 1.0
0.8 -1.4 1.0 -1.6
1.1 1.3
1.2 -2.0 1.4 -2.2
1.6 1.8
1.6 -2.6 1.8 -2.8
2.1 2.3
Luminaire Support
Rigid Base Breakaway
Both Both
2.6 -5.0 2.0 -2.4
3.8 2.2
3.2 -6.0 2.2 -2.8
4.6 2.5
3.8 -7.2 2.4 -3.2
5.5 2.8
4.4 -8.6 2.6 -3.6
6.5 3.1
Pedestal or Foundation Height < 4" Height > 4" < 10" Height > 10"
Both Both Both
0.6 -1.0 1.0 -2.6 2.6 -5.0
0.8 1.8 3.8
1.0 -1.8 1.8 -3.2 3.2 -6.0
1.4 2.5 4.6
1.4 -2.4 2.4 -3.6 3.8 -7.2
1.9 3.0 5.5
1.8 -3.0 3.0 -4.4 4.4 -8.6
2.4 3.7 6.5
Note: The surrounding slope may be more severe than the object on it. Additionally, another hazard
directly beyond the object may be more severe. In most cases, the highest severity index should be used.
FACTORS THAT AFFECT SEVERITY RANGE: Low Range: Object on uphill backslope where less likely to be hit, non-frangible diameter is small, new installation of frangible object with clear recovery area behind, top of base flush with ground, no erosion around base. Mid Range: Object on relatively flat slope (recoverable), new installation of sign support on relatively flat slope, proper design, installation and maintenance, top of base less than 4 inches above ground, no erosion around base. High Range: Object on 4:1 or steeper slope (non-recoverable), non-frangible diameter is large, improper placement and/or design of post, base located at hinge, erosion around base, improper maintenance of sign support and breakaway device.
SEVERITY INDICES (Utility, Sign, and Luminaire Support Fixed Objects)
Figure 49-10O
2012
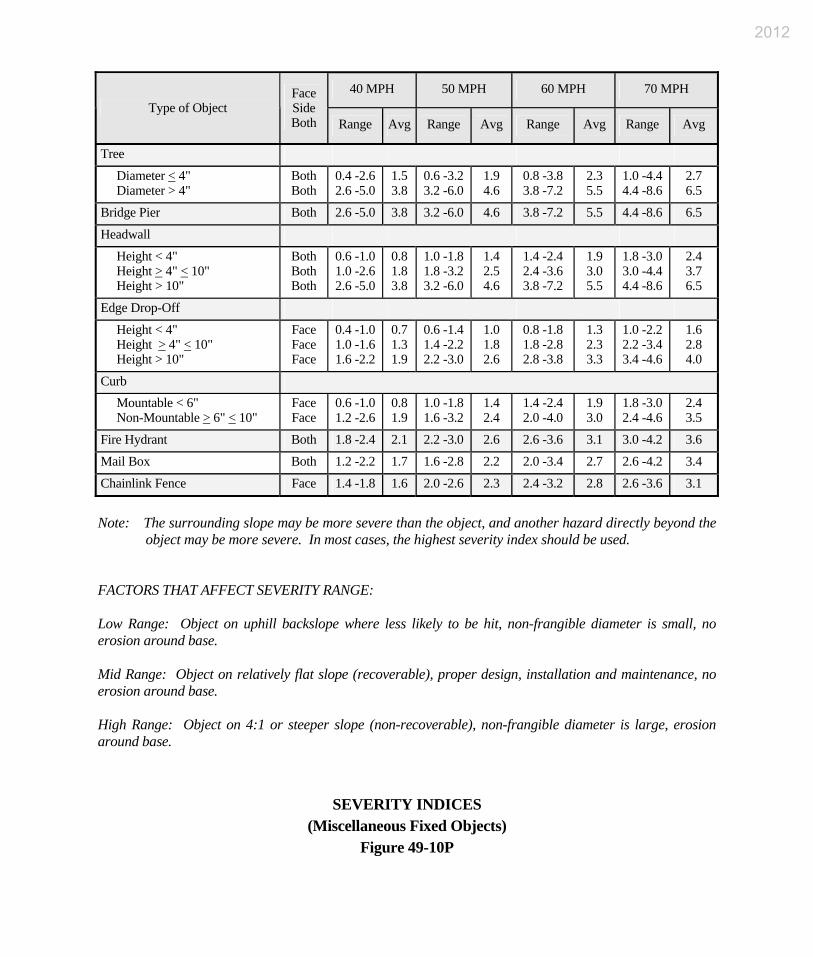
40 MPH 50 MPH 60 MPH 70 MPH Type of Object
Face Side Both Range Avg Range Avg Range Avg Range Avg
Tree
Diameter < 4" Diameter > 4"
Both Both
0.4 -2.6 2.6 -5.0
1.5 3.8
0.6 -3.2 3.2 -6.0
1.9 4.6
0.8 -3.8 3.8 -7.2
2.3 5.5
1.0 -4.4 4.4 -8.6
2.7 6.5
Bridge Pier Both 2.6 -5.0 3.8 3.2 -6.0 4.6 3.8 -7.2 5.5 4.4 -8.6 6.5
Headwall
Height < 4" Height > 4" < 10" Height > 10"
Both Both Both
0.6 -1.0 1.0 -2.6 2.6 -5.0
0.8 1.8 3.8
1.0 -1.8 1.8 -3.2 3.2 -6.0
1.4 2.5 4.6
1.4 -2.4 2.4 -3.6 3.8 -7.2
1.9 3.0 5.5
1.8 -3.0 3.0 -4.4 4.4 -8.6
2.4 3.7 6.5
Edge Drop-Off
Height < 4" Height > 4" < 10" Height > 10"
Face Face Face
0.4 -1.0 1.0 -1.6 1.6 -2.2
0.7 1.3 1.9
0.6 -1.4 1.4 -2.2 2.2 -3.0
1.0 1.8 2.6
0.8 -1.8 1.8 -2.8 2.8 -3.8
1.3 2.3 3.3
1.0 -2.2 2.2 -3.4 3.4 -4.6
1.6 2.8 4.0
Curb Mountable < 6" Non-Mountable > 6" < 10"
Face Face
0.6 -1.0 1.2 -2.6
0.8 1.9
1.0 -1.8 1.6 -3.2
1.4 2.4
1.4 -2.4 2.0 -4.0
1.9 3.0
1.8 -3.0 2.4 -4.6
2.4 3.5
Fire Hydrant Both 1.8 -2.4 2.1 2.2 -3.0 2.6 2.6 -3.6 3.1 3.0 -4.2 3.6
Mail Box Both 1.2 -2.2 1.7 1.6 -2.8 2.2 2.0 -3.4 2.7 2.6 -4.2 3.4
Chainlink Fence Face 1.4 -1.8 1.6 2.0 -2.6 2.3 2.4 -3.2 2.8 2.6 -3.6 3.1
Note: The surrounding slope may be more severe than the object, and another hazard directly beyond the
object may be more severe. In most cases, the highest severity index should be used. FACTORS THAT AFFECT SEVERITY RANGE: Low Range: Object on uphill backslope where less likely to be hit, non-frangible diameter is small, no erosion around base. Mid Range: Object on relatively flat slope (recoverable), proper design, installation and maintenance, no erosion around base. High Range: Object on 4:1 or steeper slope (non-recoverable), non-frangible diameter is large, erosion around base.
SEVERITY INDICES (Miscellaneous Fixed Objects)
Figure 49-10P
2012
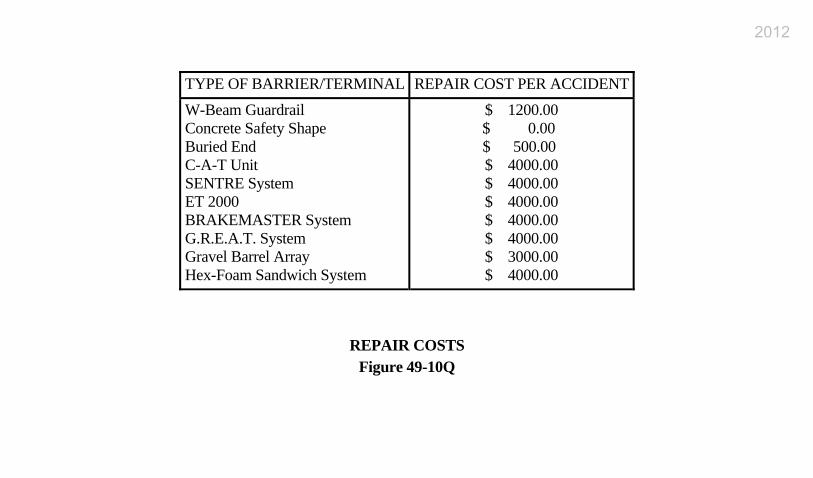
TYPE OF BARRIER/TERMINAL REPAIR COST PER ACCIDENT W-Beam Guardrail Concrete Safety Shape Buried End C-A-T Unit SENTRE System ET 2000 BRAKEMASTER System G.R.E.A.T. System Gravel Barrel Array Hex-Foam Sandwich System
$ 1200.00 $ 0.00 $ 500.00
$ 4000.00 $ 4000.00 $ 4000.00 $ 4000.00 $ 4000.00 $ 3000.00 $ 4000.00
REPAIR COSTS Figure 49-10Q
2012
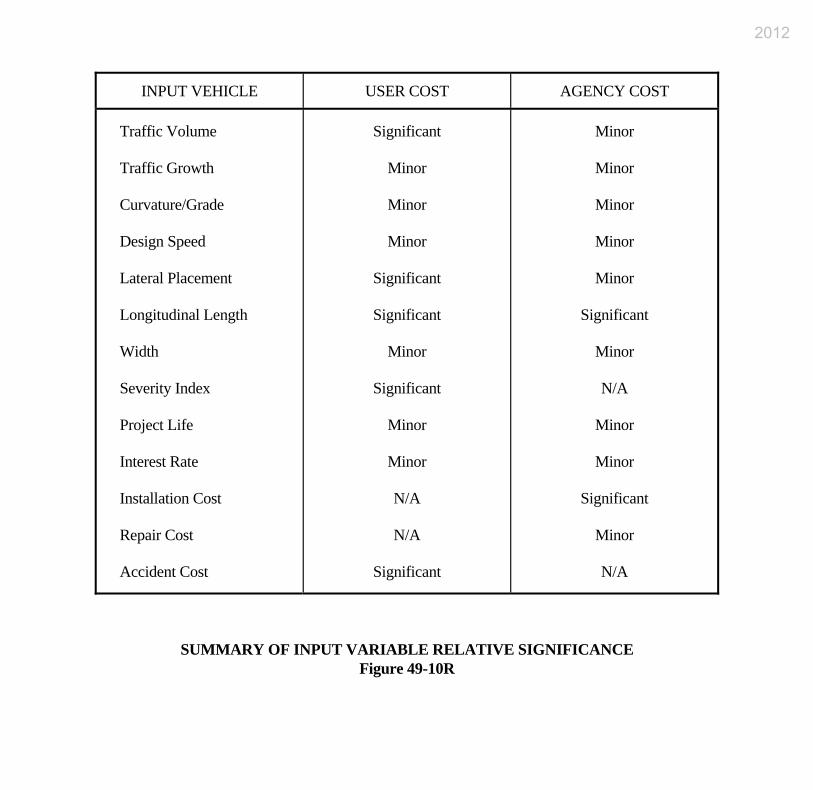
INPUT VEHICLE USER COST AGENCY COST
Traffic Volume
Traffic Growth
Curvature/Grade
Design Speed
Lateral Placement
Longitudinal Length
Width
Severity Index
Project Life
Interest Rate
Installation Cost
Repair Cost
Accident Cost
Significant
Minor
Minor
Minor
Significant
Significant
Minor
Significant
Minor
Minor
N/A
N/A
Significant
Minor
Minor
Minor
Minor
Minor
Significant
Minor
N/A
Minor
Minor
Significant
Minor
N/A
SUMMARY OF INPUT VARIABLE RELATIVE SIGNIFICANCE Figure 49-10R
2012

ADT Clearances (ft)
Severity Index(2)
Repair Costs ($) (4) GRET
Type 20-yr Current Lat Long.(1) Side Face
Installation Costs (3)
($) Side Face
Guardrail Present Worth
($)
Equivalent Embarkment
SI
I 700 471 10 1300 2.8 2.5 13,900 500 1200 13,500 5.664
I 1000 673 10 1350 2.8 2.5 14,400 500 1200 14,200 5.238
I 1500 1009 10 1350 2.8 2.5 14,400 500 1200 14,800 4.765
I 2000 1346 12 1350 2.8 2.5 14,400 500 1200 15,000 4.637
I 3000 2019 12 1380 2.8 2.5 14,700 500 1200 16,300 4.242
I 6000 4038 12 1380 2.8 2.5 14,700 500 1200 19,400 3.610
I 9000 6057 12 1450 2.8 2.5 15,400 500 1200 23,400 3.360
I 12000 8076 12 1450 2.8 2.5 15,400 500 1200 26,600 3.205
I 18000 12113 12 1450 2.8 2.5 15,400 500 1200 32,900 3.050 Notes: (1) Guardrail = 1000 ft + 2LR, where LR is from Figure 49-5F. Embankment = 1000 ft. (2) Severity Index interpolated for design speed from Figures 49-10H and 49-10 I. (3) Cost shown is based on $10/ft for guardrail + $900 for 2 GRET type I. If 2 GRET type OS or MS used instead, cost increases by $6100. (4) Repair Costs for side based on use of GRET type I. If GRET type OS or MS used instead, such cost becomes $4000.
BACKUP DATA FOR FIGURE 49-3B(40)
Figure 49-11A
2012
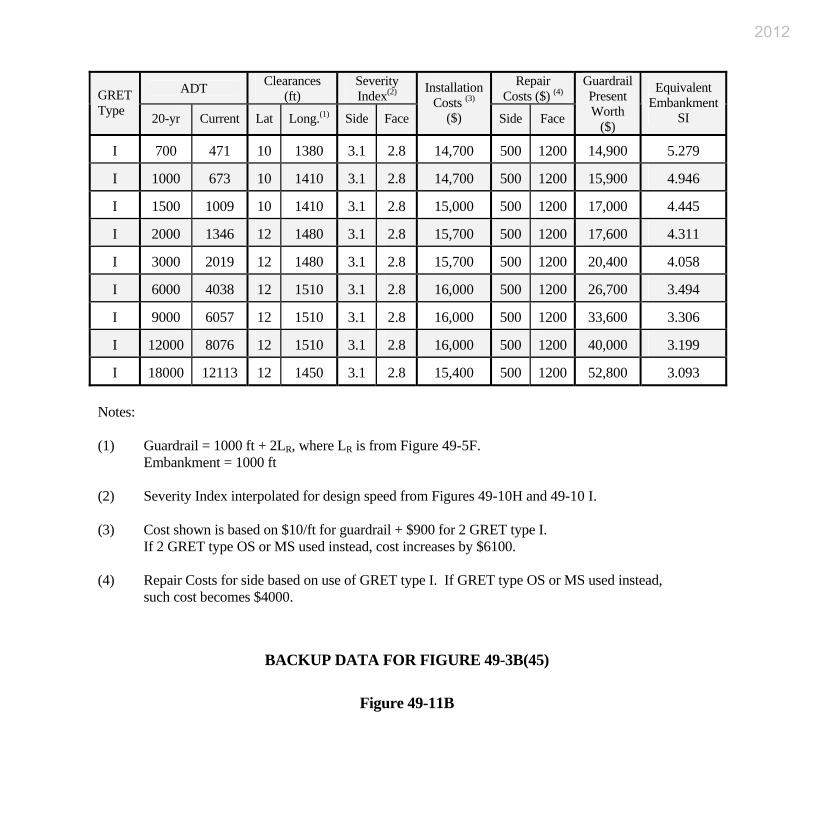
ADT Clearances (ft)
Severity Index(2)
Repair Costs ($) (4) GRET
Type 20-yr Current Lat Long.(1) Side Face
Installation Costs (3)
($) Side Face
Guardrail Present Worth
($)
Equivalent Embankment
SI
I 700 471 10 1380 3.1 2.8 14,700 500 1200 14,900 5.279
I 1000 673 10 1410 3.1 2.8 14,700 500 1200 15,900 4.946
I 1500 1009 10 1410 3.1 2.8 15,000 500 1200 17,000 4.445
I 2000 1346 12 1480 3.1 2.8 15,700 500 1200 17,600 4.311
I 3000 2019 12 1480 3.1 2.8 15,700 500 1200 20,400 4.058
I 6000 4038 12 1510 3.1 2.8 16,000 500 1200 26,700 3.494
I 9000 6057 12 1510 3.1 2.8 16,000 500 1200 33,600 3.306
I 12000 8076 12 1510 3.1 2.8 16,000 500 1200 40,000 3.199
I 18000 12113 12 1450 3.1 2.8 15,400 500 1200 52,800 3.093 Notes: (1) Guardrail = 1000 ft + 2LR, where LR is from Figure 49-5F. Embankment = 1000 ft (2) Severity Index interpolated for design speed from Figures 49-10H and 49-10 I. (3) Cost shown is based on $10/ft for guardrail + $900 for 2 GRET type I. If 2 GRET type OS or MS used instead, cost increases by $6100. (4) Repair Costs for side based on use of GRET type I. If GRET type OS or MS used instead, such cost becomes $4000.
BACKUP DATA FOR FIGURE 49-3B(45)
Figure 49-11B
2012
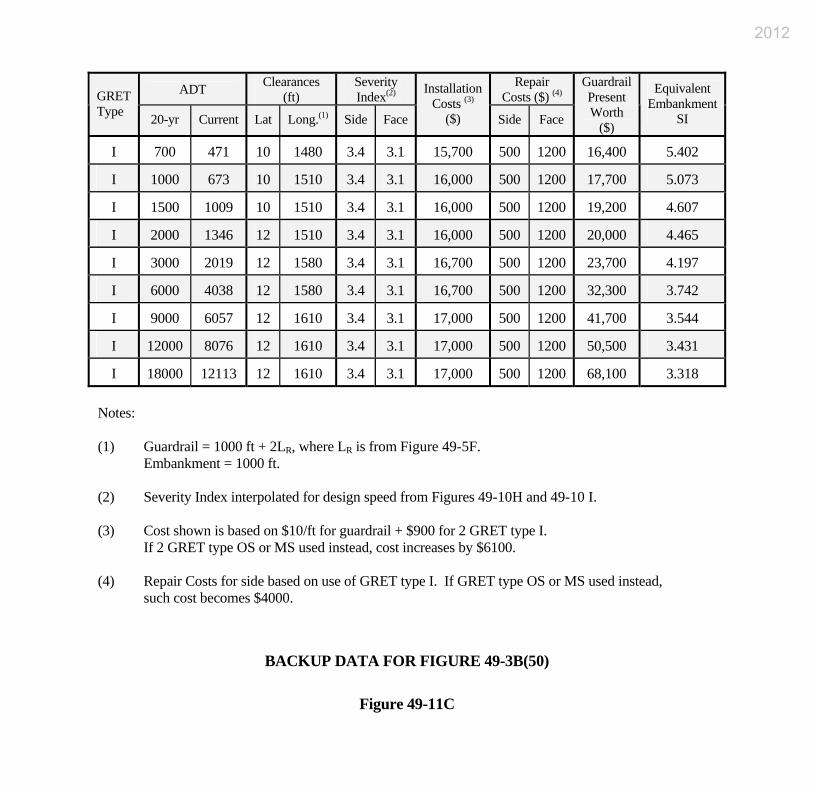
ADT Clearances (ft)
Severity Index(2)
Repair Costs ($) (4) GRET
Type 20-yr Current Lat Long.(1) Side Face
Installation Costs (3)
($) Side Face
Guardrail Present Worth
($)
Equivalent Embankment
SI
I 700 471 10 1480 3.4 3.1 15,700 500 1200 16,400 5.402
I 1000 673 10 1510 3.4 3.1 16,000 500 1200 17,700 5.073
I 1500 1009 10 1510 3.4 3.1 16,000 500 1200 19,200 4.607
I 2000 1346 12 1510 3.4 3.1 16,000 500 1200 20,000 4.465
I 3000 2019 12 1580 3.4 3.1 16,700 500 1200 23,700 4.197
I 6000 4038 12 1580 3.4 3.1 16,700 500 1200 32,300 3.742
I 9000 6057 12 1610 3.4 3.1 17,000 500 1200 41,700 3.544
I 12000 8076 12 1610 3.4 3.1 17,000 500 1200 50,500 3.431
I 18000 12113 12 1610 3.4 3.1 17,000 500 1200 68,100 3.318 Notes: (1) Guardrail = 1000 ft + 2LR, where LR is from Figure 49-5F. Embankment = 1000 ft. (2) Severity Index interpolated for design speed from Figures 49-10H and 49-10 I. (3) Cost shown is based on $10/ft for guardrail + $900 for 2 GRET type I. If 2 GRET type OS or MS used instead, cost increases by $6100. (4) Repair Costs for side based on use of GRET type I. If GRET type OS or MS used instead, such cost becomes $4000.
BACKUP DATA FOR FIGURE 49-3B(50)
Figure 49-11C
2012
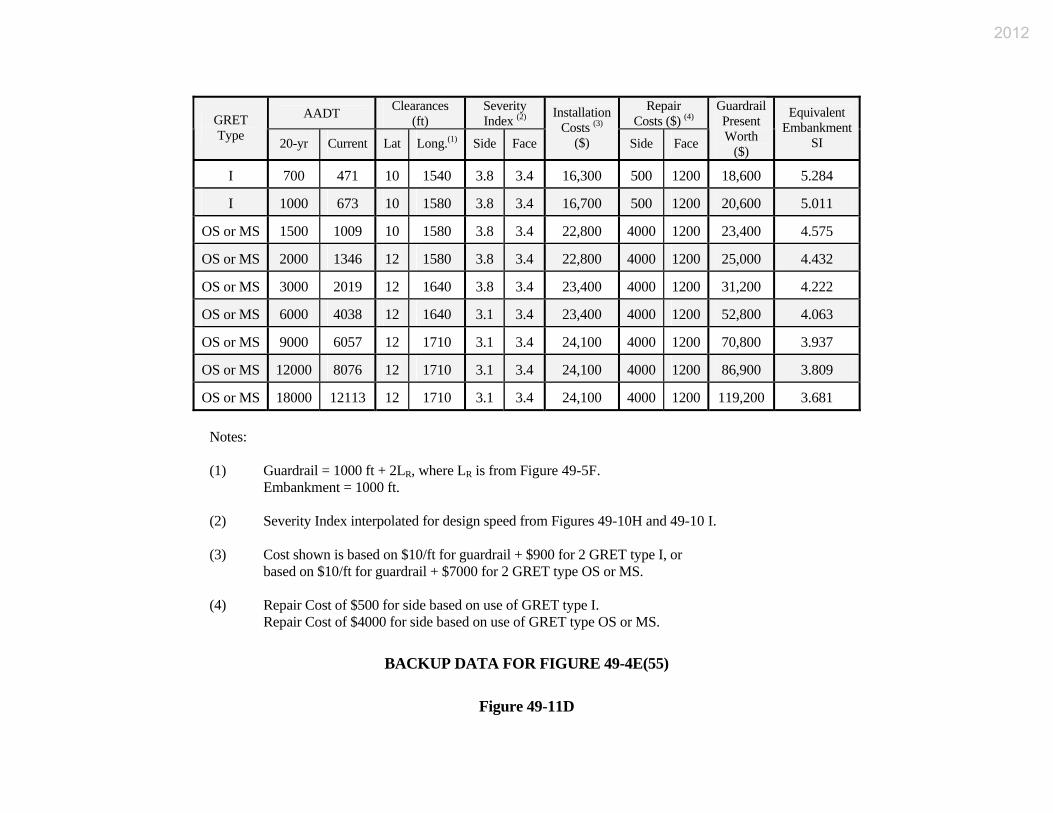
AADT Clearances (ft)
Severity Index (2)
Repair Costs ($) (4) GRET
Type 20-yr Current Lat Long.(1) Side Face
Installation Costs (3)
($) Side Face
Guardrail Present Worth
($)
Equivalent Embankment
SI
I 700 471 10 1540 3.8 3.4 16,300 500 1200 18,600 5.284
I 1000 673 10 1580 3.8 3.4 16,700 500 1200 20,600 5.011
OS or MS 1500 1009 10 1580 3.8 3.4 22,800 4000 1200 23,400 4.575
OS or MS 2000 1346 12 1580 3.8 3.4 22,800 4000 1200 25,000 4.432
OS or MS 3000 2019 12 1640 3.8 3.4 23,400 4000 1200 31,200 4.222
OS or MS 6000 4038 12 1640 3.1 3.4 23,400 4000 1200 52,800 4.063
OS or MS 9000 6057 12 1710 3.1 3.4 24,100 4000 1200 70,800 3.937
OS or MS 12000 8076 12 1710 3.1 3.4 24,100 4000 1200 86,900 3.809
OS or MS 18000 12113 12 1710 3.1 3.4 24,100 4000 1200 119,200 3.681
Notes:
(1) Guardrail = 1000 ft + 2LR, where LR is from Figure 49-5F. Embankment = 1000 ft.
(2) Severity Index interpolated for design speed from Figures 49-10H and 49-10 I.
(3) Cost shown is based on $10/ft for guardrail + $900 for 2 GRET type I, or
based on $10/ft for guardrail + $7000 for 2 GRET type OS or MS.
(4) Repair Cost of $500 for side based on use of GRET type I. Repair Cost of $4000 for side based on use of GRET type OS or MS.
BACKUP DATA FOR FIGURE 49-4E(55)
Figure 49-11D
2012
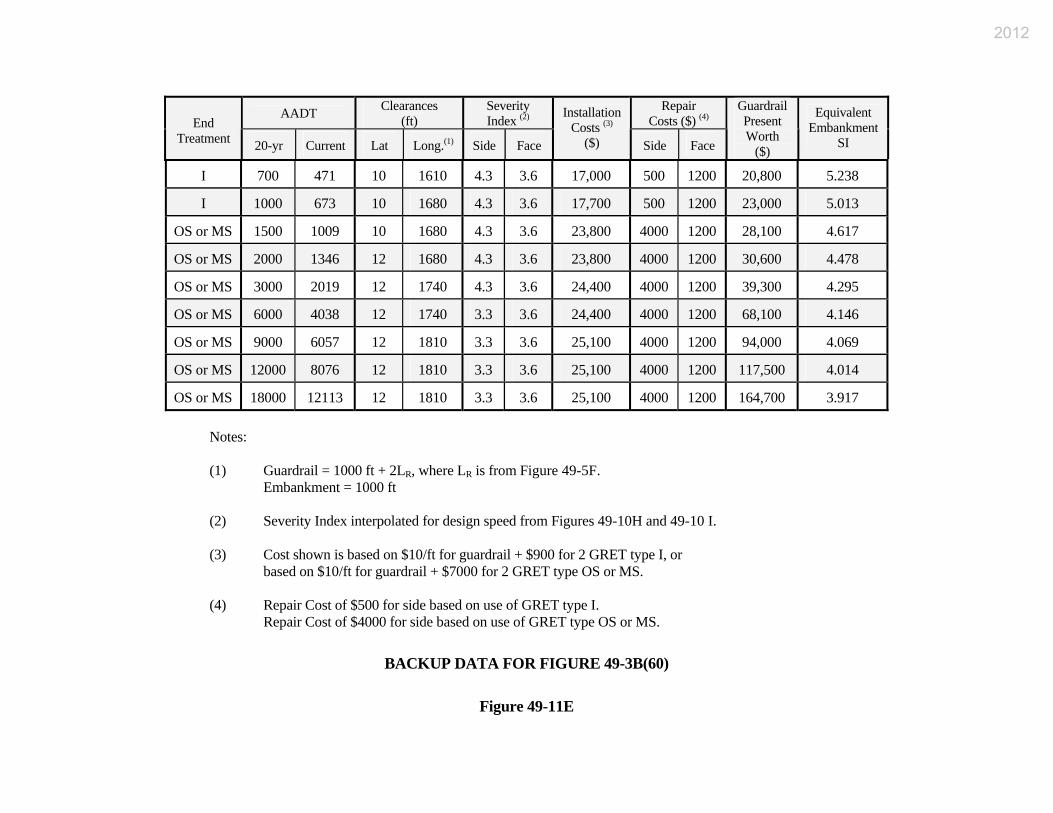
AADT Clearances (ft)
Severity Index (2)
Repair Costs ($) (4) End
Treatment 20-yr Current Lat Long.(1) Side Face
Installation Costs (3)
($) Side Face
Guardrail Present Worth
($)
Equivalent Embankment
SI
I 700 471 10 1610 4.3 3.6 17,000 500 1200 20,800 5.238
I 1000 673 10 1680 4.3 3.6 17,700 500 1200 23,000 5.013
OS or MS 1500 1009 10 1680 4.3 3.6 23,800 4000 1200 28,100 4.617
OS or MS 2000 1346 12 1680 4.3 3.6 23,800 4000 1200 30,600 4.478
OS or MS 3000 2019 12 1740 4.3 3.6 24,400 4000 1200 39,300 4.295
OS or MS 6000 4038 12 1740 3.3 3.6 24,400 4000 1200 68,100 4.146
OS or MS 9000 6057 12 1810 3.3 3.6 25,100 4000 1200 94,000 4.069
OS or MS 12000 8076 12 1810 3.3 3.6 25,100 4000 1200 117,500 4.014
OS or MS 18000 12113 12 1810 3.3 3.6 25,100 4000 1200 164,700 3.917 Notes: (1) Guardrail = 1000 ft + 2LR, where LR is from Figure 49-5F. Embankment = 1000 ft
(2) Severity Index interpolated for design speed from Figures 49-10H and 49-10 I.
(3) Cost shown is based on $10/ft for guardrail + $900 for 2 GRET type I, or
based on $10/ft for guardrail + $7000 for 2 GRET type OS or MS.
(4) Repair Cost of $500 for side based on use of GRET type I. Repair Cost of $4000 for side based on use of GRET type OS or MS.
BACKUP DATA FOR FIGURE 49-3B(60)
Figure 49-11E
2012

AADT Clearances (ft)
Severity Index (2)
Repair Costs ($) (4) GRET
Type 20-yr Current Lat Long.(1) Side Face
Installation Costs (3)
($) Side Face
Guardrail Present Worth
($)
Equivalent Embankment
SI
I 700 471 10 1680 4.7 4.2 17,700 500 1200 25,000 5.475
I 1000 673 10 1770 4.7 4.2 18,600 500 1200 30,500 5.269
OS or MS 1500 1009 10 1770 4.7 4.2 24,700 4000 1200 37,300 5.046
OS or MS 2000 1346 12 1770 4.7 4.2 24,700 4000 1200 41,500 4.941
OS or MS 3000 2019 12 1840 4.7 4.2 25,400 4000 1200 55,800 4.759
OS or MS 6000 4038 12 1840 3.5 4.2 25,400 4000 1200 100,100 4.597
OS or MS 9000 6057 12 1900 3.5 4.2 26,000 4000 1200 143,200 4.531
OS or MS 12000 8076 12 1900 3.5 4.2 26,000 4000 1200 182,800 4.474
OS or MS 18000 12113 12 1900 3.5 4.2 26,000 4000 1200 262,200 4.417
Notes: (1) Guardrail = 1000 ft + 2LR, where LR is from Figure 49-5F. Embankment = 1000 ft.
(2) Severity Index interpolated for design speed from Figures 49-10H and 49-10 I.
(3) Cost shown is based on $10/ft for guardrail + $900 for 2 GRET type I, or
based on $10/ft for guardrail + $7000 for 2 GRET type OS or MS.
(4) Repair Cost of $500 for side based on use of GRET type I. Repair Cost of $4000 for side based on use of GRET type OS or MS.
BACKUP DATA FOR FIGURE 49-3B(65)
Figure 49-11F
2012
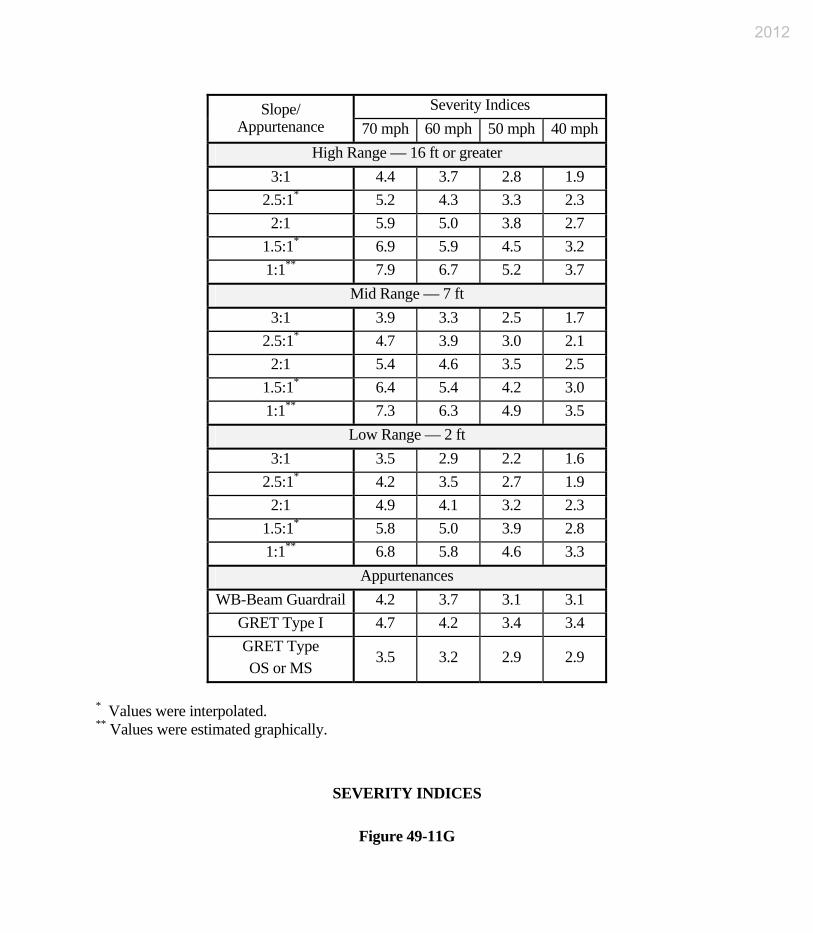
Severity Indices Slope/ Appurtenance 70 mph 60 mph 50 mph 40 mph
High Range — 16 ft or greater 3:1 4.4 3.7 2.8 1.9
2.5:1* 5.2 4.3 3.3 2.3 2:1 5.9 5.0 3.8 2.7
1.5:1* 6.9 5.9 4.5 3.2 1:1** 7.9 6.7 5.2 3.7
Mid Range — 7 ft 3:1 3.9 3.3 2.5 1.7
2.5:1* 4.7 3.9 3.0 2.1 2:1 5.4 4.6 3.5 2.5
1.5:1* 6.4 5.4 4.2 3.0 1:1** 7.3 6.3 4.9 3.5
Low Range — 2 ft 3:1 3.5 2.9 2.2 1.6
2.5:1* 4.2 3.5 2.7 1.9 2:1 4.9 4.1 3.2 2.3
1.5:1* 5.8 5.0 3.9 2.8 1:1** 6.8 5.8 4.6 3.3
Appurtenances WB-Beam Guardrail 4.2 3.7 3.1 3.1
GRET Type I 4.7 4.2 3.4 3.4 GRET Type OS or MS
3.5 3.2 2.9 2.9
* Values were interpolated. ** Values were estimated graphically.
SEVERITY INDICES
Figure 49-11G
2012