Table of Contents - Colorado State...
75
IMPROVE XRF Analysis TI 301A: LN2 Fill/Calibration Page 1 of 5 TI 301A: LN2 Fills and Detector Calibrations Table of Contents 1.0 PURPOSE AND APPLICABILITY ....................................................................................... 2 2.0 SUMMARY OF THE METHOD ........................................................................................ 2 3.0 SAFETY ........................................................................................................................... 2 4.0 PERSONNEL QUALIFICATIONS....................................................................................... 2 5.0 EQUIPMENT AND SUPPLIES .......................................................................................... 2 6.0 PROCEDURE .................................................................................................................. 2 6.1 Epsilon 5 LN2 Fill ..................................................................................................... 2 6.2 Epsilon 5 Detector Calibration ................................................................................ 3 6.3 Epsilon 5 Detector States ....................................................................................... 4 List of Figures Figure 1. Maintenance Master Screen................................................................................ 4
Transcript of Table of Contents - Colorado State...
IMPROVE XRF Analysis TI 301A: LN2 Fill/Calibration Page 1 of 5
TI 301A: LN2 Fills and Detector Calibrations
Table of Contents
1.0 PURPOSE AND APPLICABILITY ....................................................................................... 2
2.0 SUMMARY OF THE METHOD ........................................................................................ 2
3.0 SAFETY ........................................................................................................................... 2
4.0 PERSONNEL QUALIFICATIONS ....................................................................................... 2
5.0 EQUIPMENT AND SUPPLIES .......................................................................................... 2
6.0 PROCEDURE .................................................................................................................. 2
6.1 Epsilon 5 LN2 Fill ..................................................................................................... 2
6.2 Epsilon 5 Detector Calibration ................................................................................ 3
6.3 Epsilon 5 Detector States ....................................................................................... 4
List of Figures
Figure 1. Maintenance Master Screen ................................................................................ 4

IMPROVE XRF Analysis TI 301A: LN2 Fill/Calibration Page 2 of 5
1. PURPOSE AND APPLICABILITY
The purpose of this SOP is to describe the procedure used for the liquid nitrogen
(LN2) fill, liquid nitrogen calibration, and detector calibration for the Epsilon 5
instruments.
2. SUMMARY OF THE METHOD
The Epsilon 5 instruments use liquid nitrogen to cool the PAN‐32 Ge X‐Ray Detector.
Liquid nitrogen fills for each Epsilon are performed on a weekly basis. The liquid
nitrogen level is calibrated automatically. Several hours after the LN2 fill is completed,
detector calibration is performed for each instrument.
3. SAFETY
Liquid nitrogen should be handled with care in ventilated rooms. Wear a face shield
or safety glasses, safety gloves, and a laboratory coat when performing liquid nitrogen
fills. For more information, see section 3.3.3, “Liquid Nitrogen Handling,” in the Epsilon
5 EDXRF Spectrometer System User’s Guide, in addition to SOP 301, Attachment 1 on
liquid nitrogen safety.
4. PERSONNEL QUALIFICATIONS
Only trained lab personnel designated by the laboratory manager may perform
liquid nitrogen fills. A course offered on the UC Davis campus, “Safe Use of Cryogenic
Liquids,” is recommended (http://safetyservices.ucdavis.edu/tr/cd/suoclcd).
5. EQUIPMENT AND SUPPLIES
Liquid nitrogen tank
Safety glasses/face shield
Safety gloves
Laboratory coat
6. PROCEDURE
6.1 Epsilon 5 LN2 Fill
The detector in the Epsilon 5 should be filled on a weekly basis by staff that has
been fully trained in the safety hazards of working with liquid nitrogen.

IMPROVE XRF Analysis TI 301A: LN2 Fill/Calibration Page 3 of 5
1. The Epsilon 5 has several potential “detector states” that are displayed on
the Maintenance screen (circled in blue in Figure 1). These detector states
include Pre‐Operational, Operational, Long Grace, Short Grace, Filling
Allowed, Cooling, and Forced Heat‐Up. Ensure that the detector state is not
in Forced Heat‐Up prior to filling the detector with liquid nitrogen. Check this
by clicking on the picture of the liquid nitrogen dewar (circled in red in Figure
1).
2. Open the LN2 fill access door on the right‐hand side of the Epsilon 5.
3. Connect the fill tube to the detector fill line.
4. Insert the tube from the LN tank into the detector fill tube using the adapter.
5. Slowly open the valve on the LN tank while ensuring that the line from the LN
tank into the detector fill tube does not come apart.
6. Note the time required to fill the detector and the temperature of the
cabinet in the corresponding log book. Also create a new entry with the
same information in the Microsoft Access log on the desktop.
6.2 Epsilon 5 Detector Calibration
Before starting the detector calibration, abort analysis. No sample can be
running during detector calibration, as the Tungsten (W) underside of the vacuum seal is
utilized to perform the measurements.
1. Click on the “System” drop‐down menu, then “Detector Calibration.”
2. Select, “Calibrate All.”
3. When both the detector calibration and the liquid nitrogen calibration are
complete, copy the screen by pressing “ALT+Print Scrn.”
4. On the desktop, there is a folder named “Detector and LN Calibrations.”
Inside the folder is a document called Detector and LN Calibrations. Open it.
Type the date and press “CNTRL+V” to paste the screen shot. Save and close
the file.
5. On the Epsilon software, click on File, then Print. After making sure that the
resulting data would be copied to the clipboard in a delimited format, click
on OK. On the same folder, open an excel sheet called EpsilonName_
Detector and LN Calibrations. Paste the corresponding numbers at the
bottom of the data set based on their respective setting. Review the graphs
to make sure that visually there are no significant jumps or discrepancy with
the values that the detector was calibrated from last week. Save and close
the file.

IMPROVETI 301A: LPage 4 of
Figure 1.
6.3 Epsilo
The diffeoperatioscreen.
Filling all
The deteroom tem
Cooling
After thefilling theorder to
Pre‐oper
XRF AnalysisLN2 Fill/Calibr5
Maintenanc
on 5 Detecto
erent detecton, will be bri
lowed
ector is ‘warmmperature fo
e N2 level see dewar, oneallow the cr
ational
s ration
ce Master Sc
or States
or states whiefly describ
m’. Both theor at least on
nsor has dete has to waitrystal and th
Dewar Icon
creen.
ich may be eed. The user
e LN2 level sene hour. It is
tected moret for 6 hourse FET to coo
n
encounteredr software d
ensor as wels allowed to
e than 20 degs before switol down to ‐1
d by the usedisplays the s
ll as the detestart filling
grees tempetching on th178ºC.
er of Epsilon state in the d
ector tempewith liquid n
erature decre detector h
5 during detector sta
erature are anitrogen.
rease due tohigh tension
atus
at
o in

IMPROVE XRF Analysis TI 301A: LN2 Fill/Calibration Page 5 of 5
The system is available for normal use. As the liquid nitrogen consumption is not yet constant it can warm up a little quicker than expected.
Operational
The system is available for normal use.
Short grace period
The system is available for normal use. Please refill as soon as possible. There are 75 hours (3 days) left to refill the dewar.
Long grace
The system is available for normal use. Please refill as soon as possible. There are 100 hours (4 days) left to refill the dewar.
Forced heat‐up
The detector crystal has to be brought to room temperature. This can be done just waiting for the state ‘filling allowed’, which can be rather time consuming. Acceleration of this procedure can be achieved by blowing with dry air into the liquid nitrogen fill opening.

IMPROVE XRF Analysis TI 301B: Tray file creation Page 1 of 7
TI 301B: Tray file creation
Table of Contents
1.0 PURPOSE AND APPLICABILITY ....................................................................................... 2
2.0 SUMMARY OF THE METHOD ........................................................................................ 2
3.0 PRIVILEGES .................................................................................................................... 2
4.0 CAUTIONS...................................................................................................................... 2
5.0 PROCEDURE .................................................................................................................. 2
5.1 Tray files .................................................................................................................. 2
5.2 Preparation before Generating Tray files .............................................................. 3
5.3 Writing Trayfiles using SQL Server ......................................................................... 4
5.3.1 Accessing SQL Server Management Studio ................................................... 4
5.3.2 Running the Stored Procedure ..................................................................... 4
5.3.3 Checking the Trayfile IDs .............................................................................. 5
5.4 Using the Tray file Writer Application ................................................................... 5
5.5 Uploading Tray files to Sharepoint ........................................................................ 6
5.6 Updating the Properties on Sharepoint ................................................................ 6
List of Figures
Figure 1. 8‐position Tray file .................................................................................................. 3

IMPROVE XRF Analysis TI 301B: Tray file creation Page 2 of 7
1. PURPOSE AND APPLICABILITY
The purpose of this standard operating procedure is to describe the process of
generating tray files using SQL Server Management Studio. Tray files are a set of procedures
that are used to queue samples to the Epsilon 5 software.
2. SUMMARY OF THE METHOD
Trayfiles are generated by executing stored procedures in SQL Server Management
Studio. After tray file IDs have been assigned, the .XML files are created through a Tray file
Writer Application. These .XML files are archived at the IMPROVE Sharepoint share, where
they can be accessed when they are ready for use.
3. PRIVILEGES
The lab manager, spectroscopist, and designated lab technicians can generate tray files.
Permissions to access and work with SQL Server Management Studio are granted by the
IMPROVE Database Manager, or any member of the IMPROVE Software Development
Team.
4. CAUTIONS
Pay close attention when making modifications to the tray files. The information in a
tray file has to follow the format above precisely in order for the LIMS program to translate
the file properly.
5. PROCEDURE
5.1 Trayfiles
Written in .XML format, tray files are used to queue samples to the Epsilon software.
A diagram depicting the composition of a typical 8‐position tray file is shown in Figure 1.

IMPROVETI 301B: TPage 3 of
Fi
5
ge
co
ti
h
E
th
T
XRF AnalysisTray file creat7
igure 1. 8‐po
.2 Preparati
Contracto
enerated to
opies of thes
me of loadin
ow to updat
Generally
psilon Name
hat Contract
An examp
hor: D10, Se
s ion
osition tray file
on before Ge
or files shou
assure that
se files will b
ng the samp
te contracto
y, a request f
e: Quarter, S
tor File, Start
ple is given b
et 1, AContra
e.
enerating Tr
ld be update
the most cu
be placed wi
ples into the
or files, pleas
for tray files
Set Number,
ting Tray Po
below:
actor1, Shee
ray files
ed (regenera
urrent status
ithin each tr
Epsilons for
se refer to TI
s will include
, Contractor
sition (Tray
et 1, ACAD1
Trayfile ID
Tray Posit
will popul
Position N
particular
Sample Id
DateStatu
Applicatio
ated from lo
ses for all sa
ray of sample
r analysis. Fo
I 251 M.
e the followi
File Name,
file format)
1/3/2011, T
D: in format YYYY
tion: indicates w
ate
Number: indicate
tray file will pop
dentity: identifie
usCode
on: identifies wh
ogs) just befo
mples are a
es for a visu
or detailed in
ng informat
Sheet Numb
ray A (8‐pos
YMMDDFileNum
which Epsilon tra
es what position
pulate
es the filter,in fo
hich application t
ore tray files
pplied. The
al check at t
nstructions o
ion:
ber, First Filt
sition)
mber
ay the particular
n in the Epsilon t
rmat SiteSampli
the filter will run
s are
hard
the
on
ter in
tray file
tray the
ing
n
IMPROVE XRF Analysis TI 301B: Tray file creation Page 4 of 7
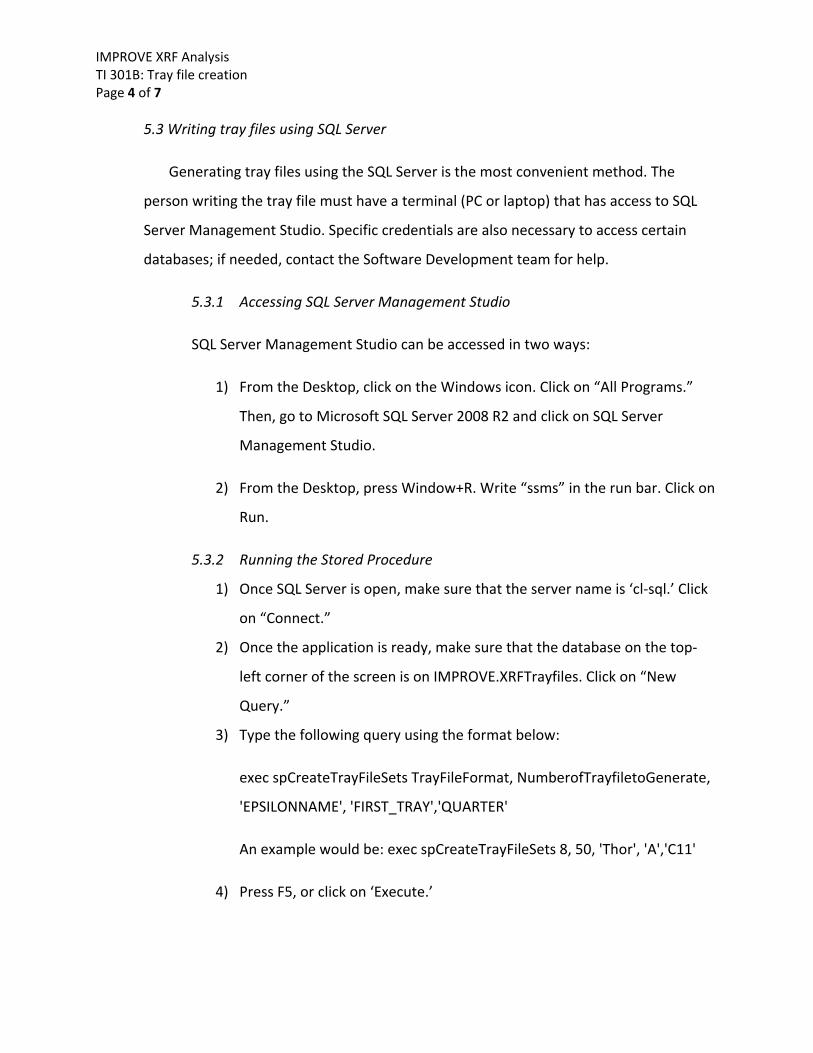
5.3 Writing tray files using SQL Server
Generating tray files using the SQL Server is the most convenient method. The
person writing the tray file must have a terminal (PC or laptop) that has access to SQL
Server Management Studio. Specific credentials are also necessary to access certain
databases; if needed, contact the Software Development team for help.
5.3.1 Accessing SQL Server Management Studio
SQL Server Management Studio can be accessed in two ways:
1) From the Desktop, click on the Windows icon. Click on “All Programs.”
Then, go to Microsoft SQL Server 2008 R2 and click on SQL Server
Management Studio.
2) From the Desktop, press Window+R. Write “ssms” in the run bar. Click on
Run.
5.3.2 Running the Stored Procedure
1) Once SQL Server is open, make sure that the server name is ‘cl‐sql.’ Click
on “Connect.”
2) Once the application is ready, make sure that the database on the top‐
left corner of the screen is on IMPROVE.XRFTrayfiles. Click on “New
Query.”
3) Type the following query using the format below:
exec spCreateTrayFileSets TrayFileFormat, NumberofTrayfiletoGenerate,
'EPSILONNAME', 'FIRST_TRAY','QUARTER'
An example would be: exec spCreateTrayFileSets 8, 50, 'Thor', 'A','C11'
4) Press F5, or click on ‘Execute.’
IMPROVE XRF Analysis TI 301B: Tray file creation Page 5 of 7
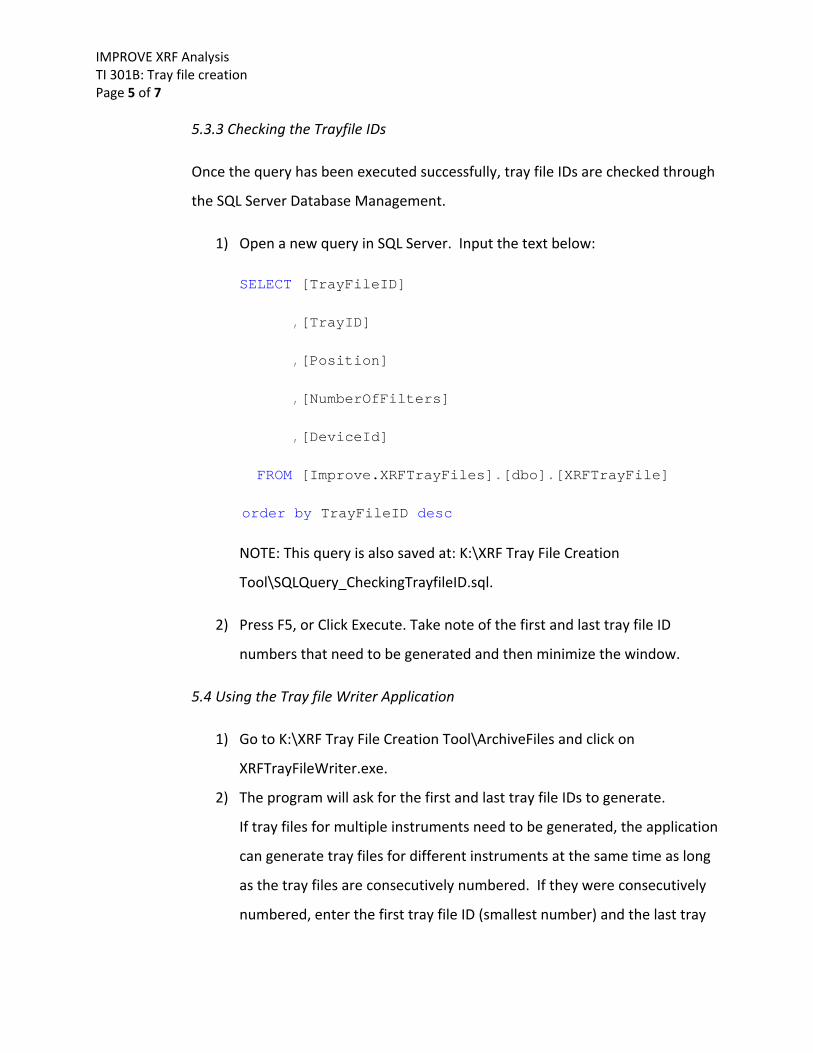
5.3.3 Checking the Trayfile IDs
Once the query has been executed successfully, tray file IDs are checked through
the SQL Server Database Management.
1) Open a new query in SQL Server. Input the text below:
SELECT [TrayFileID]
,[TrayID]
,[Position]
,[NumberOfFilters]
,[DeviceId]
FROM [Improve.XRFTrayFiles].[dbo].[XRFTrayFile]
order by TrayFileID desc
NOTE: This query is also saved at: K:\XRF Tray File Creation
Tool\SQLQuery_CheckingTrayfileID.sql.
2) Press F5, or Click Execute. Take note of the first and last tray file ID
numbers that need to be generated and then minimize the window.
5.4 Using the Tray file Writer Application
1) Go to K:\XRF Tray File Creation Tool\ArchiveFiles and click on
XRFTrayFileWriter.exe.
2) The program will ask for the first and last tray file IDs to generate.
If tray files for multiple instruments need to be generated, the application
can generate tray files for different instruments at the same time as long
as the tray files are consecutively numbered. If they were consecutively
numbered, enter the first tray file ID (smallest number) and the last tray

IMPROVE XRF Analysis TI 301B: Tray file creation Page 6 of 7
file ID (largest number). If the IDs are not consecutive, enter the series of
tray file IDs separately.
3) The program will now ask for the directory that the generated files would
be saved. It is advised to save a batch of trayfiles to a folder on one’s
desktop.
4) Once the application has completed the routine, close it. By now, all the
.XML tray files should be generated and stored to the specified directory.
There is no specific directory for the files generated by the application as
the tray files would be archived in Sharepoint later.
5.5 Uploading the Tray files to Sharepoint
1) Open Internet Explorer, and go to http://cl‐ds.ou.ad3.ucdavis.edu. Login
to Sharepoint using Kerberos credentials. Make sure the domain name is
“ad3.” If it is not, add ad3\ in front of the username.
2) Under “Libraries” on the left hand side of the screen, find “Panalytical
Tray Files” and click on it. At the top of the page, click on “Documents,”
which is under “Library Tools.” Then, go to the “Upload Document”
button. Click on it and select “Upload Multiple Documents.”
3) Return to the directory where the generated tray files were saved earlier
and select all of the files. Drag these files into the Sharepoint window.
Once the files are uploaded, uncheck the box for “Add as a New Version
to Existing Files.” Then, click “OK.”
4) After the files have been uploaded to Sharepoint, for organizational
purposes, delete the original directory where files were files initially
saved.
5.6 Updating the Properties on Sharepoint
1) While keeping Sharepoint open, re‐open SQL Server Management Studio.
Click on New Query and input the text below:

IMPROVE XRF Analysis TI 301B: Tray file creation Page 7 of 7
SELECT *
, LEFT([Source],13) ContractorFile
, RIGHT([source],9) ContractorSheet
FROM (SELECT TOP 400 [TrayFileItemID]
,[TrayFileID]
,[Position]
,[SampleIdent]
,[Application]
,[Source]
,[SeasonalQuarter]
,[MonthlyQuarter]
,[Repeat]
FROM [Improve.XRFTrayFiles].[dbo].[XRFTrayFileItem]
ORDER BY TrayFileID desc)b
WHERE Position = 1 ORDER BY trayfileid asc
NOTE: The query is also saved at: K:\XRF Tray File Creation
Tool\SQLQuery_EdittingProperties.
2) Press F5, or click on ‘Execute.’
3) Go back to Sharepoint and click on “Library,” which is under “Library
Tools.” Then click on “Data Sheet View.”
4) Return to the newly‐generated “Results” table in SQL. Using copy and
paste functions, fill in the newly downloaded tray files in Sharepoint with
their respective properties.
IMPROVE XRF Analysis TI 301C: Sample Changes for 8‐Position Trays Page 1 of 17
TI 301C: Sample Changes for 8‐Position Trays
Table of Contents
1.0 PURPOSE AND APPLICABILITY ....................................................................................... 3
2.0 SUMMARY OF THE METHOD ........................................................................................ 3
3.0 SAFETY ........................................................................................................................... 3
4.0 PERSONNEL QUALIFICATIONS ....................................................................................... 3
5.0 CAUTIONS...................................................................................................................... 3
6.0 EQUIPMENT AND SUPPLIES .......................................................................................... 4
7.0 PROCEDURE .................................................................................................................. 4
7.1 Overview and General Definitions ......................................................................... 4
7.2 Procedure for Unloading Analyzed Samples .......................................................... 7
7.3 Removing the Analyzed Filters from the Queue .................................................... 9
7.4 Weekly Check of the Designated Blank .................................................................. 9
7.5 Adding New Samples to the Queue with a Pre‐Made Batch File ........................... 10
7.6 Saving the New Queue ........................................................................................... 12
7.7 Loading New Samples into the Sample Changer .................................................... 12
7.8 Analyzing the “S” Tray ............................................................................................ 13
7.9 Recording Sample Changes .................................................................................... 13
8.0 ADDITIONAL CHECKS/PROCEDURES ............................................................................. 14
8.1 Accessing Pre‐Made Batch Files from the Sharepoint Website ............................. 14
8.2 Adding the New Samples to the Queue without a Pre‐Made Batch File ............... 15
8.3 Changing the Order of the Queue (Usually for the “S” Tray) ................................. 15
8.4 Aborting Sample Analysis ....................................................................................... 15
8.5 Special Circumstances When Using “Stop” to Suspend Analysis ........................... 15
8.6 Changing Status of Files on Sharepoint to “Analyzed” ........................................... 16
8.7 Creating Tray Files .................................................................................................. 16
8.8 Weekly Check of Blank Identities ........................................................................... 16
8.9 Changing Inserts in Filter Mount Cups ................................................................... 17

IMPROVE XRF Analysis TI 301C: Sample Changes for 8‐Position Trays Page 2 of 17
List of Figures
Figure 1. 8‐position tray contents ....................................................................................... 4
Figure 2. Sample changer compartment with trays ........................................................... 5
Figure 3. Tray keys .............................................................................................................. 5
Figure 4. Color‐coded samples............................................................................................ 6
Figure 5. Petri dish holder ................................................................................................... 6
Figure 6. “Free to open” light ............................................................................................. 7
Figure 7. Layout of petri dishes ........................................................................................... 8
Figure 8. Sample retaining cup handling and positioning ................................................. 8
Figure 9. Petri tray and inventory list ................................................................................. 9
Figure 10. Sample tray file .................................................................................................. 11
Figure 11. “Manual control” tab ......................................................................................... 12

IMPROVE XRF Analysis TI 301C: Sample Changes for 8‐Position Trays Page 3 of 17
1. PURPOSE AND APPLICABILITY
The purpose of this SOP is to describe the process of loading and unloading samples using standard cups in 8‐position trays in the Epsilon 5 EDXRF instruments.
2. SUMMARY OF THE METHOD
Tray files are transferred to the PANalytical sample changer software using a
program called LIMS. Filters are transferred from Petri dishes into cups in the order
designated by the corresponding tray file. The cups are placed into one of six 8‐position
trays (as designated by the tray file). The samples are queued in the software and the
trays are placed into the Epsilon 5 sample changer compartment. After analysis is
complete, trays are removed and filters are transferred back into labeled Petri dishes.
3. SAFETY
The Epsilon 5 produces X‐rays which can be dangerous if appropriate precautions
are not taken. Dosimeters must be worn during loading and unloading of samples.
4. PERSONNEL QUALIFICATIONS
The lab manager, spectroscopist, and designated lab technicians perform sample
changes on the Epsilon 5 instruments. Dosimeters must be worn, so all training and
instruction required by the University to receive dosimetry must be completed.
5. CAUTIONS
Once filters are placed into cups, they are completely unidentifiable beyond their
positions in the tray. Be very attentive when transferring filters into cups, and be sure
to place every filter in the correct tray as well as the proper position in the tray as
designated by the tray file.
Similar caution must be taken when unloading filters from the cups. Ensure that the
filters return to the proper labeled Petri dish.
Check the green “Free to Open” light on the control panel of the Epsilon 5 before
opening the sample changer cover. Only open the cover if the button is illuminated.
Report any mishaps or unusual occurrences that happen during a sample change. If
the Epsilon 5 generates an error message or has a software malfunction, note it in both
the physical log book at the station as well as the Microsoft Access log on the desktop at
the station. If a filter is dropped or appears unusual (hole, particles, uneven sampling,

IMPROVETI 301C: SPage 4 of
et
p
6. E
7. P
B
unloa
to sta
begin
7
sa
Fi
la
la
fi
tr
Sam
XRF AnalysisSample Chang17
tc.), fill out a
hysical log r
QUIPMENT
Filter mou
Sample re
8‐position
4‐position
Forceps
Tray files
Log books
Petri dish
ROCEDURE
ecause the E
aded before
ay consisten
n with the un
7.1 Overview
The fo
amples:
igure 1. 8‐po
The E
abeled A‐F.
abeled S. Th
lters, and a T
ray that is an
mple Retaining
T
s ges for 8‐Posi
a status adju
ecords are r
AND SUPPL
unt cups
etaining cup
n sample tra
n sample tra
s (physical a
holder
Epsilon 5 ins
tray files ca
t with how t
nloading of f
and Genera
ollowing pict
osition tray co
psilon 5 sam
Positions in
he “S” tray ho
Teflon® blan
nalyzed daily
g Cup
Tray
tion Trays
ustment form
required.
LIES
s
ys (labeled A
y (labeled S
nd electroni
struments ru
n be upload
the procedu
filters.
al Definitions
ture outlines
ontents.
mple changer
the tray are
ouse a Nucle
nk. Each Eps
y for monito
m explaining
A‐F)
)
ic)
un 24 hours
ded and new
re occurs in
s
s the terms g
r compartme
numbered #
epore blank,
silon 5 (Odin
ring samplin
g the issue. N
a day, seven
w filters can b
practice, th
given to eac
ent holds six
#1‐8. There
, 1 or 2 mult
n, Froya, and
ng performa
No notes in e
n days a wee
be loaded in
e procedure
ch element t
x 8‐position
e is also one
ti‐elemental
d Thor) have
nce.
Filt
electronic or
ek, trays mus
trays. In ord
e section wil
hat houses t
sample tray
4‐position t
reference
an assigned
ter Mount Cu
r
st be
der
l
the
ys
ray
d “S”
p

IMPROVETI 301C: SPage 5 of
Fi
sa
th
Fig
T
XRF AnalysisSample Chang17
igure 2. Samp
The le
ample chang
he sample ch
gure 3. Tray
The E
he individua
s ges for 8‐Posi
ple changer co
etter on each
ger. The tray
hanger; this
keys
psilon softw
al samples ar
Orange/G
Yellow/Or
tion Trays
ompartment
h sample tra
ys are keyed
ensures sam
ware displays
re color‐cod
ray: Not que
ange: Queue
S
with trays.
ay matches a
d to prevent
mples #1‐8 a
s the configu
ed. Example
eued to be m
ed to be me
A
B
C
E
an etched let
them from
are in the pro
uration of th
es are shown
measured (Ex
easured (Ex.
D
F
tter on the s
being loade
oper order.
e trays in th
n in the figur
x. E8)
F8, Tray A, T
surface of th
d backward
e compartm
re below:
Tray B)
he
s in
ment.

IMPROVETI 301C: SPage 6 of
Fig
w
la
la
st
F
XRF AnalysisSample Chang17
ure 4. Color‐c
The sa
with the emp
abeled with t
abeled with a
tack in each
igure 5. Petri
s ges for 8‐Posi
Green/Ora
Gray/Yello
coded sample
amples that
pty Petri dish
the instrume
a letter that
compartme
dish holder
tion Trays
ange: Measu
ow: Currentl
es.
are loaded i
hes located i
ent it is used
matches on
ent correspo
ured and oka
y analyzing (
in the sampl
n the Petri d
d with (Odin
ne of the tray
nds to the fi
ay (Ex. Trays
(F7)
le changer c
dish holder.
, Froya, or T
ys (A‐F, S). T
ilter in Posit
s S, C & D, E1
compartmen
Each Petri d
Thor). Each c
The top Petr
ion 1 for tha
1‐E7, F1‐F6)
nt correspon
dish holder is
compartmen
i dish in the
at tray.
d
s
nt is

IMPROVETI 301C: SPage 7 of
7
“F
XRF AnalysisSample Chang17
7.2 Procedure
Samp
Free to Ope
Figure
1)
2)
3)
4)
s ges for 8‐Posi
e for Unload
le changes c
n” light is illu
6. “Free to O
Note wh
alphabe
After m
open th
precaut
a time.
Set the t
changer
Remove
Petri dis
sticky ta
Line up
dish. Ma
matches
tion Trays
ding Analyzed
can be made
uminated.
Open” light
hich trays ha
etical order,
aking sure th
e sample ch
ionary meas
tray on the d
r cover.
e the Petri di
sh holder. T
ab to indicat
the Petri dis
ake sure tha
s the filter id
d Samples
e while the in
ave complet
starting with
hat all 8 sam
hanger cover
sure, perform
desk or sam
ishes in the
ypically, the
e that it is th
shes from lef
at the inform
dentities on
nstrument is
ed analysis.
h the earlies
mples in the t
r and remov
m sample ch
ple handling
correspondi
e top Petri di
he first tray
ft to right, st
mation in the
the screen.
s analyzing a
They will be
st letter.
tray have be
e the first tr
hanges for o
g table and c
ing compart
ish will be fla
that needs t
tarting with
e sticker of th
as long as th
e unloaded
een analyzed
ray of filters.
ne instrume
close the sam
ment of the
agged with a
to be unload
the top Pet
he Petri dish
e
in
d,
. As a
ent at
mple
a
ded.
ri
hes

IMPROVETI 301C: SPage 8 of
XRF AnalysisSample Chang17
Figure
5)
Figure
6)
7)
s ges for 8‐Posi
7. Layout of p
Pick up
the inne
upside d
8. Sample re
Now, re
filter mo
forceps
remains
Place th
holder).
invento
tion Trays
petri dishes
the sample
er filter mou
down and lin
etaining cup h
emove the sa
ounting cup.
and place it
s face‐up.
he Petri dish
. Confirm tha
ry list includ
retaining cu
nting cup fo
ne it above t
handling and
ample retain
. Pick up the
t in the Petri
in its white
at it is the co
ded in the tra
p from posit
or support, t
the first Petr
positioning
ning cup by l
e filter by its
dish. Make
Petri tray (lo
orrect tray b
ay.
tion A1. Pla
hen turn the
ri dish.
ifting it up a
s outer supp
e sure the sa
ocated next
by examining
ce one finge
e sampling c
and off of the
port ring usin
mple side
to the Petri
g the filter
er on
cup
e
ng
dish

IMPROVETI 301C: SPage 9 of
7
q
C
m
tr
n
7
m
A
XRF AnalysisSample Chang17
Figure
8)
9)
10)
7.3 Removing
After
ueue. Towa
lick on the s
middle of the
ray. It is also
ot delete th
7.4 Weekly Ch
On a w
make sure th
Analysis for m
s ges for 8‐Posi
9. Petri tray
Place th
Repeat
complet
unloade
instruct
placed b
them ou
NOTE: R
identifie
everyth
their co
g the Analyze
removing th
ards the righ
symbol to ac
e picture of t
o possible to
e S tray.
heck of the D
weekly basis
at the filter
more inform
tion Trays
and inventor
he filter mou
steps 5‐8 fo
ted trays exc
ed during rou
ions regardi
back into the
ut of the way
Remember t
er of any kin
ing in the pr
rresponding
ed Filters fro
he analyzed f
t side of the
tivate the “D
the complete
o delete one
Designated B
s, the blank f
is properly d
ation.
ry list
unt cup back
r positions 2
cept for the
utine sample
ng the analy
e sample cha
y until loadin
that for now
d. Therefor
roper order w
g Petri dishes
om the Queu
filters, they
e sample cha
Delete” func
ed tray and
sample at a
Blank
filter is chec
designated.
into the ret
2‐8, and then
“S” tray. Th
e changes. S
ysis the the “
anger compa
ng occurs.
w, the Teflon
re, it is extre
while the filt
s.
ue
need to be d
anger windo
ction. Then,
click once. T
a time by clic
ked before a
Please see T
taining cup.
n for the res
e “S” tray sh
See Section 7
“S” tray. Em
artment if n
® filters hav
mely import
ters are sep
deleted from
ow, there is a
move the m
This should
cking on eac
adding new
TI 301E QA_
st of the
hould not be
7.8 below fo
pty trays ma
ecessary to
ve no functio
tant to keep
arated from
m the Epsilon
a symbol.
mouse over t
delete the e
h position.
samples to
_QC of XRF
e
or
ay be
keep
onal
p
m
n
the
entire
Do

IMPROVE XRF Analysis TI 301C: Sample Changes for 8‐Position Trays Page 10 of 17
7.5 Adding New Samples to the Queue with a Pre‐Made Batch File
1) On the desktop of the Epsilon computer, there is a folder named “Tray files.”
This folder contains pre‐made bach files and a folder named “Queued.” If
there are no batch files in “Tray files,” download them from Sharepoint. For
instructions how to access pre‐made tray files, refer to Section 8.1 in the
Additional Checks/Procedures section.
2) There is one tray file for each tray. The naming format is YYYYMMDD(###)
Instrument, where YYYYMMDD is the date the file was created, ### is the
sequence number, and “Instrument” is the Epsilon the files are being created
for. For example, 20120209001ODIN was created on 02/09/12 for Odin. The
“001” means it is the first of the series created. This number is intended to
be used so that if the files are sorted in ascending order, they will be in the
correct loading order.
3) When the different tray files are sorted by name, the first file on the list will
be the first file that needs to be loaded. Check the file by clicking on it. See
figure 10 for an example.
4) Copy the necessary files to the folder called “Shortcut to LIMS.” Once the
files have been copied over, move them from their current location in the
“Trayfiles” folder to the “Queued” folder, so that the next user performing
sample changes can easily find the files that they need.

IMPROVETI 301C: SPage 11 o
Fi
XRF AnalysisSample Changof 17
igure 10. Sam
5) Fin
6) A
“O
“O
wi
co
in
7) No
Ch
s ges for 8‐Posi
mple tray file
nd the LIMS
small windo
Offline” that
Overview Scr
indow, filter
omplete, clos
the LIMS fo
ow, go to th
heck to make
tion Trays
2UAI.exe ico
ow will appea
will change
reen” in the
rs will begin
se the LIMS
lder will now
e “Manual C
e sure that t
on on the de
ar. There w
to a green h
“Measure B
to populate
window by
w be gone.
Control” tab.
the External
esktop and d
ill be red hig
highlighted “
Batch” tab of
the trays. W
clicking the
. Then click
Control Stat
double‐click
ghlighted tex
“remote.” T
f the sample
When all the
“X” in the w
on “Externa
te is “Offline
it.
xt saying
Then, in the
e changer
e trays are
window. The
al Control.”
e.” If not (an
e files
nd it

IMPROVETI 301C: SPage 12 o
Figure 11
7
7
XRF AnalysisSample Changof 17
wi
no
“O
. “Manual Co
7.6 Saving the
1)
2)
3)
4)
5)
6)
7.7 Loading N
1)
2)
3)
s ges for 8‐Posi
ill usually no
ot change aft
Offline.”
ntrol” tab
e New Queu
When all o
queue (ba
Batch List.
A list of wh
seconds to
On the rig
When the
be display
The forma
current_09
After ente
New Samples
Find the n
Line up th
these filte
Remove th
the sample
tion Trays
ot be), chang
ter clicking t
ue
of the sampl
tch) by first
.”
hat was just
o display.
ht hand side
“Save Batch
ed. The fold
at for saving
9172011.bat
ering the nam
s into the Sa
ext white Pe
e first eight
rs match the
he designate
e handling t
ge it to “Offl
the button, t
es have bee
clicking on t
loaded will
e, click “Save
h” screen ap
der is on the
batch files is
tch).
me, click “Sa
ample Chamb
etri tray with
filters on th
e correspond
ed 8‐position
able.
ine” and clic
try setting it
en queued to
the “Measur
appear. Som
e As.”
ppears, the c
e desktop an
s “current_m
ve.”
ber
h filters to be
e table from
ding tray file
n tray from t
ck “Set.” If th
t to “Local” a
o be measur
re Batch” ta
metimes, th
correct folde
d is called “
mmddyyyy.b
e analyzed.
m left to right
e.
the Epsilon a
he status do
and then
red, save the
b, then “Edit
is takes a fe
er should alre
Batch Files.”
batch” (ex.
t. Confirm t
and place it
oes
e
t
w
eady
”
that
on

IMPROVE XRF Analysis TI 301C: Sample Changes for 8‐Position Trays Page 13 of 17
4) Remove the mounting cups from the tray and place them directly behind
the samples.
5) Open the first Petri dish and use the forceps to lift the filter by the outer
support ring and place it on the mount. The sample side should be facing
up.
6) Next, place the sample retaining cup over the top of the mounting cup.
Tip the cup slightly and support the filter mount cup by applying gentle
pressure on the bottom of the cup. Then, turn the assembly upside down
and place it in the first position of the tray.
7) Continue with the rest of the samples, moving to position 2, then 3, etc.,
until all eight have been loaded. Double‐check that the physically‐loaded
filters match the filters displayed on the “Overview” screen.
8) Stack the empty Petri dishes with the far‐left Petri (for position 1) at the
top of the stack. Place the Petri dishes in the appropriate compartment
(A‐F) of the Petri dish holder.
9) Look at the front panel display of the Epsilon. Make sure the green “Free
to Open” light is lit. Then, open the sample changer cover.
10) Load the filled sample tray into the sample changer compartment with
the letter written on the sample tray matching the etched letter in the
sample changer.
11) Close the sample changer cover and repeat steps 2‐10 for the remaining
empty trays.
12) Add the newly populated filters to the analysis queue by clicking the
symbol (in the “Overview” screen of the “Measure Batch” tab. Then, click
on the newly‐loaded trays. The samples will change from gray to yellow.
7.8 Analyzing the “S” Tray
The “S” tray is analyzed once every day. The current method is to add the “S”
tray to run directly after the current tray being analyzed, and then continue with the A‐F
cycle. If the queue needs to be re‐ordered for the “S” Tray to be analyzed, refer to
Section 8.3 of Additional Checks/Procedures.
7.9 Recording Sample Changes
1) Each instrument has its own physical log book as well as an electronic log
in Microsoft Access. The physical log book is labeled with the instrument

IMPROVE XRF Analysis TI 301C: Sample Changes for 8‐Position Trays Page 14 of 17
name and is located on the shelf above the respective computer, while
the Access log is located on the computer desktop.
2) Open the physical log book to the first available row. Write the date,
time, first and last samples loaded, and the letters of the trays loaded.
Sign the entry. Make sure to follow the same format as previous entries.
3) Open the Access log by clicking on the icon entitled “Enter_LogBooks
.accdb.” Click on “Add New Record.” The date and time will
automatically fill in. The default Code Action is LD, for “Loading.” Fill in
the first and last filter information and the “Initials” box. Then click,
“Save This New Record.” Close the log.
8.0 Additional Checks/Procedures
8.1 Accessing Pre‐Made Batch Files from the Sharepoint Website
1) Open an internet browser.
2) Type in http://cl‐ds if on a CNL server. Otherwise, type in the full
address: http://cl‐ds.ou.ad3.ucdavis.edu.
3) If on a CNL server, login will happen automatically. If not on a CNL server,
Sharepoint requires Kerberos usernames and passwords to sign in. Make
sure to add ad3\ before the username.
4) On the left side of the Sharepoint home page, click on “Panalytical Tray
Files.”
5) On the top of the page, there will be a line that says “Home‐>Panalytical
Tray Files‐>Six Tray Files.” Click on “Six Tray Files” and a drop‐down
menu will appear. Click on “All Documents.” A list of files will appear,
one for each tray.
6) Go to the “XRF Device” column and select the appropriate instrument.
Then, click the “Downloaded” column and select “No,” to list the tray files
that have not yet been downloaded. The files should organize
themselves so that tray file ID #001 (or lowest number) is at the top of
the list. This is the first file that needs to be downloaded.
7) Move the mouse over the file name and right click. Then select “Save
Target As.” Save the file directly to the “Trayfiles” folder on the desktop.
If necessary, files can be saved one at a time onto a USB flash drive and
then moved to the “Trayfile” folder of the appropriate instrument.
8) After the file has been downloaded, right click the file name and click on
the arrow that appears.

IMPROVE XRF Analysis TI 301C: Sample Changes for 8‐Position Trays Page 15 of 17
9) Click on “Edit Properties.”
10) Click the “Downloaded” box and click “Save.”
8.2 Adding the New Samples to the Queue without a Pre‐Made Batch File
1) To add filters to the queue, double‐click on the first position that will be
loaded in the sample changing software. This will open the “Add
Measurement” screen.
2) The “location” should already be the correct position.
3) For “Application,” select the current version of the application being run
on the particular Epsilon. As of February 2013, Froya and Odin run on
“CNL‐IMPROVE‐V1.2A” and Thor runs on “CNL‐IMPROVE‐V1.2B.”
4) Place the cursor in the “Sample Identification” box.
5) Scan (if barcode is available) or type the ID of the filter.
6) Press F9 to save the entry and the program will automatically move on to
the next position.
8.3 Changing the Order of the Queue (Usually for “S” Tray)
1) In the “Measure Batch” tab, click on “Measure Queue.”
2) Highlight the samples of the “S” tray (or whatever samples need to be
moved).
3) Use the “Move Up” or “Move Down” buttons on the right as many times
as needed to change the order.
8.4 Aborting Sample Analysis
1) To abort a sample while in mid‐analysis, go to the “Measure Batch” tab,
then “Overview.”
2) Click the “Abort” button towards the bottom right.
3) The instrument will first come to air; then, the sample will be removed
and put back to its original tray position. No new analysis will begin until
the “Measure” button is clicked or the button is used to re‐queue.
8.5 Special Circumstances When Using “Stop” to Suspend Analysis
1) When activated, the “Stop” button will let the current sample finish
analyzing, then stop all actions without emptying the queue. The only
issue with this button is that it does not change the current sample to
green when completed, even though the data is in the “Results” file.

IMPROVE XRF Analysis TI 301C: Sample Changes for 8‐Position Trays Page 16 of 17
2) To be sure that the filter was successfully analyzed, click on “File,” then
“Open.”
3) On the left of the window that pops up, click on “Results.”
4) Then, click on the current version of the application being run on the
particular Epsilon. Click “Open.”
5) Check the boxes for “Routine,” “Measured,” “Standard,” and “Blank.”
Then type the name of the sample, standard, or blank. Click “Apply.”
6) If the filter was analyzed, it will appear on the list. Otherwise, use the
symbol to queue it for analysis.
8.6 Changing Status of Files on Sharepoint to “Analyzed”
1) Open an internet browser.
2) Type in the address of the Sharepoint site (http://cl‐ds.ou.ad3.ucdavis
.edu)
3) If not on a CNL server, the program will ask for login information. It
accepts Kerberos usernames and passwords.
4) On the left side, click on “Panalytical Tray Files.”
5) At the top, there will be a line named “Six Tray Files.” Click on it and a
drop‐down menu will appear. Click on “All Documents.”
6) One file per tray will appear. Locate the files that have been analyzed.
Sort by instrument if necessary.
7) Roll the mouse over the file name and a box will appear to the left.
Check the box.
8) Click on “Edit Properties.”
9) Check the “Analyzed” box and click “Save.”
8.7 Creating Tray Files
Detailed instructions on how to create tray files are located in TI 301B Tray file
creation.
8.8 Weekly Check of Blank Identities
1) On a weekly basis, the blank filter is checked to make sure it is properly
designated before new samples are loaded during the sample change. To
do this, look up the blank used for the last sample analyzed by first
clicking on “File,” then “Open.” On the left of the window that pops up,
click on “Results.”

IMPROVE XRF Analysis TI 301C: Sample Changes for 8‐Position Trays Page 17 of 17
2) Click on “CNL‐IMPROVE‐V#” with “V#” being the version number
currently being run on the Epsilon. Click “Open.”
3) In the window that pops up, type a “*” in the Sample ID box. Make sure
“Routine” and “Measured” are checked. Then, click “Apply.”
4) The list generated should be in descending order so that the top filter is
the last filter that was analyzed. Click on the top sample to highlight it
and the analysis data will appear.
5) Check that the Blank ID is correct for the Epsilon in use. Refer to the
laboratory manager or spectroscopist for the current Blank IDs for each
Epsilon. If the blank is not correct, make a note of it and inform the lab
manager and spectroscopist immediately. If the blank is correct, close
the “Results” window and continue.
8.9 Changing Inserts in Filter Mount Cups
The plastic inserts in the filter mount cups are changed on average every 2 days
or upon completion of the A‐F tray cycle. Inserts are removed from the filter mount
cups and placed in a bin, which is located in a cabinet drawer in the XRF Room. These
used inserts will later be cleaned with ethanol and Kimwipes™. Clean inserts can be
found in a labeled bin in the same drawer. Exchange used inserts for clean inserts, place
the new inserts in the filter mount cups, and continue with the sample change.

IMPROVE XRF Analysis TI 301D: XRF Data Processing Page 1 of 41
TI 301D: XRF Data Processing
Table of Contents
1.0 PURPOSE AND APPLICABILITY ....................................................................................... 2
2.0 DATABASE INFORMATION ............................................................................................ 2
3.0 TABLES ........................................................................................................................... 2
4.0 THE STORED PROCEDURES ........................................................................................... 3

IMPROVE XRF Analysis TI 301D: XRF Data Processing Page 2 of 41
1. PURPOSE AND APPLICABILITY
The purpose of this document is to explain the stored procedures/tables/workflows involved in the blank correction and conversion of PANalytical analysis data into mass loadings, as well as their respective error and detection limits. This document is intended for users of the stored procedures and those involved in the IMPROVE data processing in total. The general audience is required to have a fundamental knowledge of SQL. The audience who wants to use the stored procedures must understand how to query data and execute stored procedures with parameters.
2. DATABASE INFORMATION
The stored procedures will be located in the CL‐SQL (169.237.146.117), specifically in the database Improve.XRFProcessing. Users must have Execute/Insert/Select permissions on the
Improve.XRFProcessing database, and Select in the Improve database.
3. TABLES
Name Description
dbo.AnalysisXRFCalibrations Stores the calibration E values for each PANalytical XRF Machine. Many to one AnalysisXRFCalibrationSets on [CalibrationSetId].
dbo.AnalysisXRFCalibrationSets Set information for the calibrations. Which machine and dates the calibrations are pertinant. One to many AnalysisXRFCalibrations
dbo.AnalysisXRFConfiguration Contains the different configurations for the XRF Machines and their effective dates.
dbo.AnalysisXRFCountsCorrected Stores the analysis counts after blank subtraction using 25 field blanks and their median.
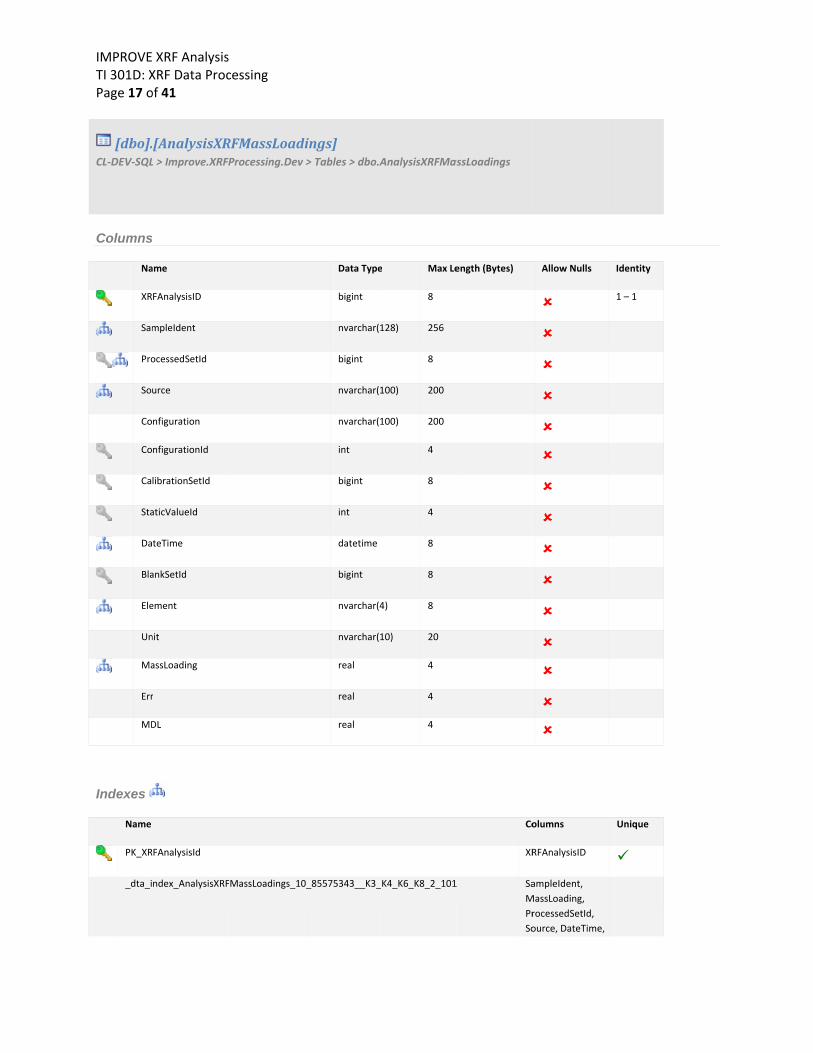
dbo.AnalysisXRFMassLoadings Stores the mass loadings for each result after processing the corrected counts using the Calibrations.
dbo.AnalysisXRFProcessingBlanks Stores the actual blanks used for blank correction. Many to one AnalysisXRFProcessingBlankSets on [BlankSetId].
dbo.AnalysisXRFProcessingBlankSets
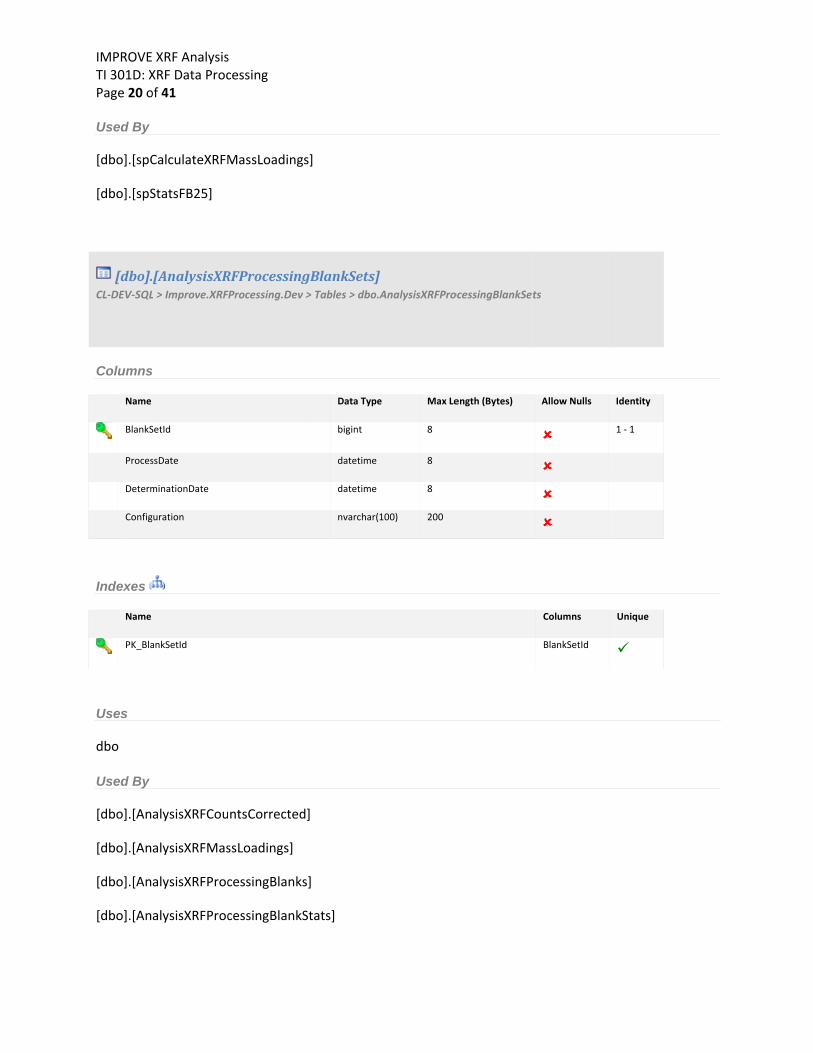
Stores the set information for field blanks: the configuration, determination date, processed date. One to many AnalysisXRFBlanks and AnalysisXRFBlankStats on [BlankSetId]

IMPROVE XRF Analysis TI 301D: XRF Data Processing Page 3 of 41 dbo.AnalysisXRFProcessingBlankStats
Contains the statistical calculations (median/95th) for each element in each field blank set. Many to one AnalysisXRFProcessingBlankSets on [BlankSetId]
dbo.AnalysisXRFProcessingCorrectedSets
Contains the information about each set of counts processed: the minimum/maximum date and processed date. One to many AnalysisXRFCountsCorrected on [ProcessedSetId].
dbo.AnalysisXRFQAModifications The QA Modification that have been made to the XRF data on validity, sampleident, xrfdate, and source. Used in tandem with spUpdateXRFDataQA to keep the migrated data up to date if it is ever reimported.
dbo.AnalysisXRFStaticValues The values chose by Warren to be used in the ERR and MDL calculations for each machine when they are converted into their mass loadings.
4. THE STORED PROCEDURES
1) dbo.spProcessAnalysisXRFCounts:This stored procedure is the start for the entire XRF Data Process. It accepts three parameters:
startdate(datetime), enddate (datetime), and number of field blanks (int). Dates are used so sets can be
processed outside of the normal month datespan. The number of field blanks will be 25, but the
parameter is there to allow future expansion.

IMPROVE XRF Analysis TI 301D: XRF Data Processing Page 4 of 41 SectionsofspProcessAnalysisXRfCounts
GeneratetheCorrectionSet:Inserts the stored procedure parameters into AnalysisXRFProcessingCorrectedSets for historical
purposes and binding the corrected values for this run of the stored procedures into a single set which
will be manipulated later.
ConfigurationCursor:The cursor is used to find all of the distinct active configurations that were used during the sampling
dates specified through the parameters. It uses each configuration in a loop to execute the rest of the
stored procedures.
CursorLoop:The cursor loop section opens the cursor and each distinct configuration is passed as parameters into
other stored procedures.
LoopMember–ChoosingFieldblanks:Executes the stored procedure spCreateAnalysisFieldBlanks passing in the startdate, enddate,
configuration, and number of fieldblanks as parameters. This generates the 25 field blanks per
configuration and their statistics
LoopMember–Correction:Executes the stored procedure spAnalysisXRFCorrection passing in the startdate, enddate, and
configuration as parameters. This performs the blank subtraction using the statistics generated in “Loop
Member – Choosing Fieldblanks”.
CalculateMassLoadings:This data is the converted to mass loadings values by applying the PANalytical machine calibration
values to the corrected energies calculated in section “Loop Member –Correction”.
2) dbo.spCreateAnalysisFieldBlanksThis stored procedure finds the 25 field blanks and their statistics for the configuration specified in the
parameters of this stored procedure. This procedure also needs a startdate and enddate as parameters
to select the correct field blanks.

IMPROVE XRF Analysis TI 301D: XRF Data Processing Page 5 of 41 SectionsofspCreateAnalysisFieldBlanks
DeterminationDate:This section finds the date that determines which field blanks to use. The date is determined by the
greatest analysis date of the sampling dates specified by the parameters for the configuration.
CreateBlankSet:This section generates the blank set value by inserting into dbo.analysisXRFProcessingBlankSets. It
inserts the run date, determination date, and XRF Machine Configuration.
ChooseBlanks:This section selects the 25 field blanks that will be members of the set. It selects 25 field blanks that
were analyzed from the determination date backwards. If it cannot fill 25, it will continue filling going
forwards from the determination date until it reaches 25.
GenerateFieldBlankStatistics:This section generates the median and 95th percentile for each element of the 24 we currently use. It
runs the stored procedure 24 times (one for each element). This was not hardcoded into a single stored
procedure to allow the expansion later on.
3) dbo.spStatsFB25This stored procedure generates the statistics (median/95th) for a given set of field blanks. It accepts the
parameters element and the blank set ID.
SectionsofspStatsFB25
GenerateFieldBlankStatistics:This section inserts the statistics for a given field blank set and given element as defined by the
parameters. It does this by ordering the values for the given element from least to greatest and selecting
the 13th (median) and 24th (95th percentile).
4) dbo.spAnalysisXRFCorrectionThis stored procedure corrects the XRF values for the datespan (it accepts as a parameter) using the
field blank statistics generated in the former stored procedure. It also accepts the configuration.
IMPROVE XRF Analysis TI 301D: XRF Data Processing Page 6 of 41 SectionsofspAnalysisXRFCorrection
SetIdentityColumns:This section selects the currently incremented identity values that were established in the previous
stored procedures: Blank set identity and corrected set. These are inserted with the corrected values to
establish relationships.
BlankCorrection:This section performs the actual blank correction of the date span; based on validity of the sample, the
configuration, and the field blank statistics. It inserts these values into dbo.AnalysisXRFCountsCorrected.
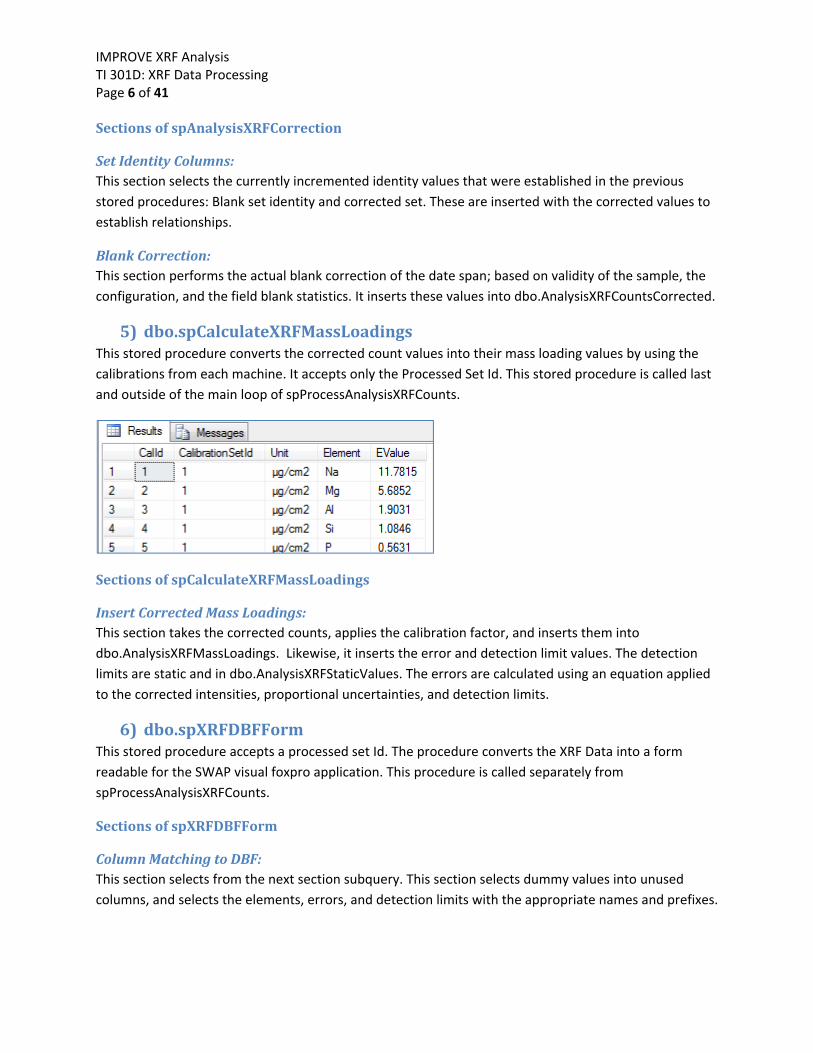
5) dbo.spCalculateXRFMassLoadingsThis stored procedure converts the corrected count values into their mass loading values by using the
calibrations from each machine. It accepts only the Processed Set Id. This stored procedure is called last
and outside of the main loop of spProcessAnalysisXRFCounts.
SectionsofspCalculateXRFMassLoadings
InsertCorrectedMassLoadings:This section takes the corrected counts, applies the calibration factor, and inserts them into
dbo.AnalysisXRFMassLoadings. Likewise, it inserts the error and detection limit values. The detection
limits are static and in dbo.AnalysisXRFStaticValues. The errors are calculated using an equation applied
to the corrected intensities, proportional uncertainties, and detection limits.
6) dbo.spXRFDBFFormThis stored procedure accepts a processed set Id. The procedure converts the XRF Data into a form
readable for the SWAP visual foxpro application. This procedure is called separately from
spProcessAnalysisXRFCounts.
SectionsofspXRFDBFForm
ColumnMatchingtoDBF:This section selects from the next section subquery. This section selects dummy values into unused
columns, and selects the elements, errors, and detection limits with the appropriate names and prefixes.

IMPROVE XRF Analysis TI 301D: XRF Data Processing Page 7 of 41 MaxValuesforthePivotQuery:This section holds the elemental select subquery which selects the maximum values for all columns for
each split record. Because it selects from a triple pivoted subquery, three records are generated for each
one record being pivoted. This query forces them back into one record by selecting the non‐null values
for each column per triplet record.
ThePivotedQuery:This section contains the initial query from dbo.AnalysisXRFMassLoadings. It casts the sampling dates,
and has the three pivots (and titles the pivoted columns). It pivots the data on the concentration, errors
and detection limits for each record.
7) dbo.spUpdateXRFDataQAThis stored procedure is separate and is used to update dbo.AnalysisXRFCountsMigrate by joining with
AnalysisXRFQAModifications. It also stores comments and the date performed.
Remarks:
Tips: [Columns], dbo.TableName, vwViewName, spStoredProcedureName, fxFunctionName are the
naming conventions both in this document and in the code.
cps/mA is referred to as counts or energies. ng/cm2 is usually referred to as mass loadings or
two dimensional density. These units are interchangeable by using the elemental calibrations of each PANalytical XRF machine.
CamelCasing is keeping multiple words together but making the first letter of each word capital.
This is useful for when only one word is allowed or if it makes it easier to deal with (column
names).
SAMDAT is always explicitly called [SAMDAT]. [XRFDate] and [DateTime] correspond to the
analysis date/time.
All properties of a filter (site,samdat,status) are derived from the [SAMPLEIDENT]. This is the
only way that properties of filter can be persisted through XRF analysis.
ChangeLog:Version Completion
Date Changes
0.900 6/25/2012 Initial Creation
0.905 6/27/2012 Fixed error with Thor checking for Odin data to determine BlankSet existence. Added the Processed set to identify processed data.
0.907 6/28/2012 Converted some Functions into correlated subqueries for performance. This translates to higher performance when there is more data. However, there is less performance when there is no data.

IMPROVE XRF Analysis TI 301D: XRF Data Processing Page 8 of 41 0.909 7/2/2012 Optimized queries (Median/95th, max/min
analysis date for configuration determination). Made the calibration import SP import the calibrations correctly assigning them to sets. Even if a calibration import contains data from multiple or one machine, it will assign sets correctly.
0.914 7/3/2012 Queries further optimized using multiple joins for the configuration aliases (incomplete). Created spCalculateXRFMassLoadings as a primitive form of the mass loading conversion.
0.925 7/5/2012 Changed the statistical queries to avoid joining to views. The performance increases are very good. The sp for creating the dbf view will now incorporate the static statistical values warren calcluated. Seeding for the static statistics The dbf view sp is not complete still.
0.965 7/6/2012 Massive overhaul of query structure. Especially for the blank correction. The table join was not effective given the possibility that the same set of data could be processed again. Instead the sproc was changed to accept a configuration paramter and run per configuration as part of the cursor in the calling procedure. Added indexing and some table statistics. The processing takes 2-4 seconds now. The competing factors are table size and SQL server query optimization. DBF view proc is tentatively complete. Columns must be verified. Values must also be verified. Function is complete. At first glance of the march data it seems to be pretty close to the Panalytical corrected values.
0.980 7/12/2012 Added the mass loading conversion as a hard coded table. This has increased processing time to 10-13 seconds. Testing has thus so far confirmed correct values at all levels of processing.

IMPROVE XRF Analysis TI 301D: XRF Data Processing Page 9 of 41
Appendices
Appendix1:StoredProcedureProcessFlowDiagram.

IMPROVETI 301D: XPage 10 o
Append
XRF AnalysisXRF Data Procof 41
dix2:Tabl
s cessing
leDesignaandRelatiionships.

IMPROVETI 301D: XPage 11 o
Append
ImproCL‐DEV‐SQL
Project In
Author
Created
TableCL‐DEV‐SQL
Name
dbo.AnalysisX
dbo.AnalysisX
dbo.AnalysisX
dbo.AnalysisX
dbo.AnalysisX
dbo.AnalysisX
dbo.AnalysisX
dbo.AnalysisX
dbo.AnalysisX
dbo.AnalysisX
dbo.AnalysisX
XRF AnalysisXRF Data Procof 41
dix3:Data
ove.XRFProcL > Improve.XRF
nformation
esL > Improve.XRF
XRFCalibrations
XRFCalibrationSets
XRFConfiguration
XRFCountsCorrect
XRFMassLoadings
XRFProcessingBlan
XRFProcessingBlan
XRFProcessingBlan
XRFProcessingCorr
XRFQAModificatio
XRFStaticValues
s cessing
abaseTech
cessing.DevFProcessing.Dev
FProcessing.Dev
s
ed
nks
nkSets
nkStats
rectedSets
ons
hnicalDes
vDatabase
> Tables
scription.
Leland Gee
25 June 2012 11:16

IMPROVETI 301D: XPage 12 o
[dbo].CL‐DEV‐SQL
Columns
Name
CalId
Calibra
Unit
Eleme
EValue
Indexes
Name
PK_Ca
Foreign K
Name
FK_AnalysisX
Uses
[dbo].[An
dbo
XRF AnalysisXRF Data Procof 41
[AnalysisXRL > Improve.XRF
s
ationSetId
nt
e
lId
Keys
RFCalibrations_An
alysisXRFCali
s cessing
RFCalibratioFProcessing.Dev
nalysisXRFCalibrat
brationSets]
ns]> Tables > dbo.A
Data Typ
bigint
bigint
nchar(10
nvarcha
float
ionSets
AnalysisXRFCali
pe Max Len
8
8
0) 20
r(4) 8
8
Columns
CalibrationSetId‐>
Sets].[Calibration
ibrations
ngth (Bytes)
>[dbo].[AnalysisXR
nSetId]
Allow Nulls
Columns
CalId
RFCalibration‐
Identity
1 – 1
Unique

IMPROVETI 301D: XPage 13 o
[dbo].CL‐DEV‐SQL
Columns
Name
Calibra
Source
Applic
Creatio
StartD
EndDa
Indexes
Name
PK_Ca
Uses
dbo
Used By
[dbo].[An
[dbo].[An
XRF AnalysisXRF Data Procof 41
[AnalysisXRL > Improve.XRF
s
ationSetId
e
ation
onDate
ate
ate
librationSetId
alysisXRFCali
alysisXRFMas
s cessing
RFCalibratioFProcessing.Dev
brations]
ssLoadings]
nSets]> Tables > dbo.A
Data Type
bigint
nvarchar(25
nvarchar(25
datetime
datetime
datetime
AnalysisXRFCali
Max Len
8
55) 510
55) 510
8
8
8
ibrationSets
ngth (Bytes)
Colu
Cali
Allow Nulls
umns
brationSetId
Identity
1 – 1
Unique

IMPROVETI 301D: XPage 14 o
[dbo].CL‐DEV‐SQL
Columns
Name
Config
Instrum
Config
Config
StartD
EndDa
Descri
Indexes
Name
PK_Co
Uses
dbo
Used By
[dbo].[An
[dbo].[An
[dbo].[spC
[dbo].[spI
XRF AnalysisXRF Data Procof 41
[AnalysisXRL > Improve.XRF
s
gurationId
ment
gurationName
gurationAlias
ate
ate
ption
onfigurationId
alysisXRFCou
alysisXRFMas
CalculateXRFM
mportAnalys
s cessing
RFConfiguraFProcessing.Dev
ntsCorrected
ssLoadings]
MassLoadings
sisXRFCalibrat
tion]> Tables > dbo.A
Data Type
int
nvarchar(1
nvarchar(1
nvarchar(1
datetime
datetime
nvarchar(m
d]
s]
tion]
AnalysisXRFCon
e Max Le
4
100) 200
100) 200
100) 200
8
8
max) max
nfiguration
ength (Bytes)
Col
Con
Allow Nulls
lumns
nfigurationId
Identity
1 – 1
Unique

IMPROVETI 301D: XPage 15 o
[dbo].CL‐DEV‐SQL
Columns
Indexes
Name
PK_Co
_dta_i
XRF AnalysisXRF Data Procof 41
[AnalysisXRL > Improve.XRF
s
Name
CorrID
SampleIdent
ProcessedSetId
Source
Configuration
ConfigurationId
DateTime
BlankSetId
Element
Unit
CorrectedIntensi
orrID
ndex_AnalysisXRF
s cessing
RFCountsCorFProcessing.Dev
ity
FCountsCorrected_
rrected]> Tables > dbo.A
Data Ty
bigint
nvarcha
bigint
nvarcha
nvarcha
int
datetim
bigint
nvarcha
nvarcha
real
_10_85575343__K
AnalysisXRFCou
ype Max
8
ar(128) 256
8
ar(100) 200
ar(100) 200
4
me 8
8
ar(4) 8
ar(10) 20
4
K3_K4_K6_K8_2_1
untsCorrected
x Length (Bytes)
Co
Co
110 Sa
Co
Pr
So
El
Allow Nulls
olumns
orrID
ampleIdent,
orrectedIntensity,
rocessedSetId,
ource, DateTime,
lement
Identity
1 – 1
Unique
,

IMPROVETI 301D: XPage 16 o Statistics
Name
_dta_stat_85
Foreign K
Name
FK_AnalysisX
Sets
FK_AnalysisX
Configuration
FK_AnalysisX
CorrectedSet
Uses
[dbo].[An
[dbo].[An
[dbo].[An
dbo
XRF AnalysisXRF Data Procof 41
s
5575343_3
Keys
RFCountsCorrecte
RFCountsCorrecte
n
RFCountsCorrecte
s
alysisXRFCon
alysisXRFProc
alysisXRFProc
s cessing
ed_AnalysisXRFPro
ed_AnalysisXRFPro
ed_AnalysisXRFPro
figuration]
cessingBlankS
cessingCorrec
ocessingBlank‐
ocessing‐
ocessing‐
Sets]
ctedSets]
Columns
ProcessedSetId
Columns
BlankSetId‐>[dbo
Id]
ConfigurationId‐>
XRFConfiguration
ProcessedSetId‐>
Sets].[ProcessedS
o].[AnalysisXRFPro
>[dbo].[Analysis‐
n].[ConfigurationId
>[dbo].[AnalysisXR
SetId]
ocessingBlankSets]
d]
RFProcessingCorre
.[BlankSet‐
cted‐
IMPROVETI 301D: XPage 17 o
[dbo].CL‐DEV‐SQL
Columns
Na
XR
Sam
Pro
So
Co
Co
Ca
Sta
Da
Bla
Ele
Un
Ma
Err
MD
Indexes
Name
PK_XR
_dta_i
XRF AnalysisXRF Data Procof 41
[AnalysisXRL > Improve.XRF
s
ame
FAnalysisID
mpleIdent
ocessedSetId
urce
nfiguration
nfigurationId
librationSetId
aticValueId
teTime
ankSetId
ement
nit
assLoading
r
DL
RFAnalysisId
ndex_AnalysisXRF
s cessing
RFMassLoadFProcessing.Dev
FMassLoadings_10
dings]> Tables > dbo.A
Data Type
bigint
nvarchar(
bigint
nvarchar(
nvarchar(
int
bigint
int
datetime
bigint
nvarchar(4
nvarchar(
real
real
real
0_85575343__K3_
AnalysisXRFMas
e Max Le
8
128) 256
8
100) 200
100) 200
4
8
4
8
8
4) 8
10) 20
4
4
4
_K4_K6_K8_2_101
assLoadings
ength (Bytes)
Co
XR
1 Sa
M
Pr
So
Allow Nulls
olumns
RFAnalysisID
ampleIdent,
MassLoading,
rocessedSetId,
ource, DateTime,
Identity
1 – 1
Unique

IMPROVETI 301D: XPage 18 o
Foreign K
Name
FK_AnalysisX
FK_AnalysisX
FK_AnalysisX
FK_AnalysisX
Sets
FK_AnalysisX
Uses
[dbo].[An
[dbo].[An
[dbo].[An
[dbo].[An
[dbo].[An
dbo
Used By
[dbo].[spA
XRF AnalysisXRF Data Procof 41
Keys
RFMassLoadings_
RFMassLoadings_
RFMassLoadings_
RFMassLoadings_
RFMassLoadings_
alysisXRFCali
alysisXRFCon
alysisXRFProc
alysisXRFProc
alysisXRFStat
AnalysisXRFCo
s cessing
_AnalysisXRFProce
_AnalysisXRFCalibr
_AnalysisXRFConfig
_AnalysisXRFProce
_AnalysisXRFStaticV
brationSets]
figuration]
cessingBlankS
cessingCorrec
ticValues]
orrection]
ssingBlankSets
ationSets
guration
ssingCorrected‐
Values
Sets]
ctedSets]
Columns
BlankSetId‐>[dbo
Id]
CalibrationSetId‐>
Sets].[Calibration
ConfigurationId‐>
XRFConfiguration
ProcessedSetId‐>
Sets].[ProcessedS
StaticValueId‐>[d
El
o].[AnalysisXRFPro
>[dbo].[AnalysisXR
nSetId]
>[dbo].[Analysis‐
n].[ConfigurationId
>[dbo].[AnalysisXR
SetId]
dbo].[AnalysisXRFS
lement
ocessingBlankSets]
RFCalibration‐
d]
RFProcessingCorre
StaticValues].[Stat
.[BlankSet‐
cted‐
icValueId]

IMPROVETI 301D: XPage 19 o
[dbo].CL‐DEV‐SQL
Columns
Indexes
Name
PK_Id
_dta_i
_dta_i
Foreign K
Name
FK_AnalysisX
Sets
Uses
[dbo].[An
dbo
XRF AnalysisXRF Data Procof 41
[AnalysisXRL > Improve.XRF
s
Name
Id
SampleIdent
XRFDate
BlankSetId
ndex_AnalysisXRF
ndex_AnalysisXRF
Keys
RFProcessingBlank
alysisXRFProc
s cessing
RFProcessingFProcessing.Dev
FProcessingBlanks_
FProcessingBlanks_
ks_AnalysisXRFPro
cessingBlankS
gBlanks]> Tables > dbo.A
Data Type
bigint
nvarchar(1
datetime
bigint
_10_117575457__
_10_117575457__
ocessingBlank‐
Sets]
AnalysisXRFPro
e Max Le
8
128) 256
8
8
_K4_K2_K3
_K4_K2_K6
Columns
BlankSetId‐>[dbo
Id]
ocessingBlanks
ength (Bytes)
Co
Id
Id
Sa
XR
Bl
Sa
XR
o].[AnalysisXRFPro
Allow Nulls
olumns
d
d, BlankSetId,
ampleIdent,
RFDate
lankSetId,
ampleIdent,
RFDate
ocessingBlankSets]
Identity
1 ‐ 1
Unique
.[BlankSet‐
IMPROVETI 301D: XPage 20 o Used By
[dbo].[spC
[dbo].[spS
[dbo].CL‐DEV‐SQL
Columns
Name
BlankS
Proces
Determ
Config
Indexes
Name
PK_Bla
Uses
dbo
Used By
[dbo].[An
[dbo].[An
[dbo].[An
[dbo].[An
XRF AnalysisXRF Data Procof 41
CalculateXRFM
StatsFB25]
[AnalysisXRL > Improve.XRF
s
SetId
ssDate
minationDate
guration
ankSetId
alysisXRFCou
alysisXRFMas
alysisXRFProc
alysisXRFProc
s cessing
MassLoadings
RFProcessingFProcessing.Dev
ntsCorrected
ssLoadings]
cessingBlanks
cessingBlankS
s]
gBlankSets]> Tables > dbo.A
Data Type
bigint
datetime
datetime
nvarchar(1
d]
s]
Stats]
AnalysisXRFPro
e Max Le
8
8
8
100) 200
ocessingBlankSe
ength (Bytes)
ts
Allow Nulls
Columns
BlankSetId
Identity
1 ‐ 1
Unique

IMPROVETI 301D: XPage 21 o [dbo].[spC
[dbo].CL‐DEV‐SQL
Columns
Name
StatId
BlankS
Eleme
Media
Percen
Indexes
Name
PK_Sta
Foreign K
Name
FK_AnalysisX
Uses
[dbo].[An
dbo
XRF AnalysisXRF Data Procof 41
CalculateXRFM
[AnalysisXRL > Improve.XRF
s
SetId
nt
n
ntile95
atId
Keys
RFBlankStats_Ana
alysisXRFProc
s cessing
MassLoadings
RFProcessingFProcessing.Dev
alysisXRFProcessin
cessingBlankS
s]
gBlankStats]> Tables > dbo.A
Data T
bigint
bigint
nchar(4
real
real
gBlankSets
Sets]
s]AnalysisXRFPro
ype Max Len
8
8
4) 8
4
4
Columns
BlankSetId‐>[dbo
Id]
ocessingBlankSta
ngth (Bytes)
o].[AnalysisXRFPro
ats
Allow Nulls
Columns
StatId
ocessingBlankSets]
Identity
1 ‐ 1
Unique
.[BlankSet‐

IMPROVETI 301D: XPage 22 o Used By
[dbo].[spS
[dbo].CL‐DEV‐SQL
Columns
Name
Proces
Proces
StartD
EndDa
Indexes
Name
PK_Pro
Uses
dbo
Used By
[dbo].[An
[dbo].[An
[dbo].[spI
XRF AnalysisXRF Data Procof 41
StatsFB25]
[AnalysisXRL > Improve.XRF
s
ssedSetId
ssDate
ate
ate
ocessedSetId
alysisXRFCou
alysisXRFMas
mportAnalys
s cessing
RFProcessingFProcessing.Dev
ntsCorrected
ssLoadings]
sisXRFCalibrat
gCorrectedS> Tables > dbo.A
Data T
bigint
datetim
datetim
datetim
d]
tion]
Sets]AnalysisXRFPro
ype Max Len
8
me 8
me 8
me 8
ocessingCorrecte
ngth (Bytes)
Colu
Proc
edSets
Allow Nulls
umns
cessedSetId
Identity
1 ‐ 1
Unique

IMPROVETI 301D: XPage 23 o
[dbo].CL‐DEV‐SQL
Columns
Name
Modifi
Sampl
XRFDa
Source
Validit
Sampl
XRFDa
Source
Validit
Chang
Comm
Indexes
Name
PK_Mo
Uses
dbo
Used By
[dbo].[spU
XRF AnalysisXRF Data Procof 41
[AnalysisXRL > Improve.XRF
s
icationId
eIdentOld
teOld
eOld
tyOld
eIdentNew
teNew
eNew
tyNew
eDate
ment
odificationId
UpdateXRFDa
s cessing
RFQAModificFProcessing.Dev
ataQA]
cations]> Tables > dbo.A
Data Type
bigint
nvarchar(10
datetime
nvarchar(10
int
nvarchar(10
datetime
nvarchar(10
int
datetime
nvarchar(40
AnalysisXRFQAM
Max Le
8
00) 200
8
00) 200
4
00) 200
8
00) 200
4
8
000) 8000
Modifications
ength (Bytes)
C
M
Allow Nulls
Columns
ModificationId
Identity
1 ‐ 1
Unique

IMPROVETI 301D: XPage 24 o
[dbo].CL‐DEV‐SQL
Columns
Name
StaticV
Instrum
Eleme
DL(ug/
Propor
Indexes
Name
PK_Va
Uses
dbo
Used By
[dbo].[An
XRF AnalysisXRF Data Procof 41
[AnalysisXRL > Improve.XRF
s
ValueId
mentConfiguration
nt
/cm2)
rtionalUncertainty
lueId
alysisXRFMas
s cessing
RFStaticValuFProcessing.Dev
n
y
ssLoadings]
ues]> Tables > dbo.A
Data Ty
int
nvarcha
nvarcha
float
float
AnalysisXRFStat
pe Max
4
r(255) 510
r(255) 510
8
8
ticValues
Length (Bytes)
C
S
Allow Nulls
Columns
StaticValueId
Identity
1 ‐ 1
Unique

IMPROVETI 301D: XPage 25 o
StoredCL‐DEV‐SQL
Name
dbo.spAnalys
dbo.spCalcula
dbo.spCreate
dbo.spImport
dbo.spProces
dbo.spStatsF
dbo.spUpdat
dbo.spXRFDB
[dbo].CL‐DEV‐SQL
Paramete
Name
@startdate
@enddate
@configurati
Uses
[dbo].[An
dbo
XRF AnalysisXRF Data Procof 41
dProcedureL > Improve.XRF
sisXRFCorrection
ateXRFMassLoadin
eAnalysisFieldBlan
tAnalysisXRFCalibr
ssAnalysisXRFCoun
B25
eXRFDataQA
BFForm
[spAnalysisXL > Improve.XRF
ers
on
alysisXRFMas
s cessing
esFProcessing.Dev
ngs
ks
ration
nts
XRFCorrectiFProcessing.Dev
ssLoadings]
> Stored Proced
ion]> Stored Proced
dures
dures > dbo.spAnalysisXRFCorre
Data Type
datetime
datetime
nvarchar(100)
ection
Max Length (
8
8
200
(Bytes)
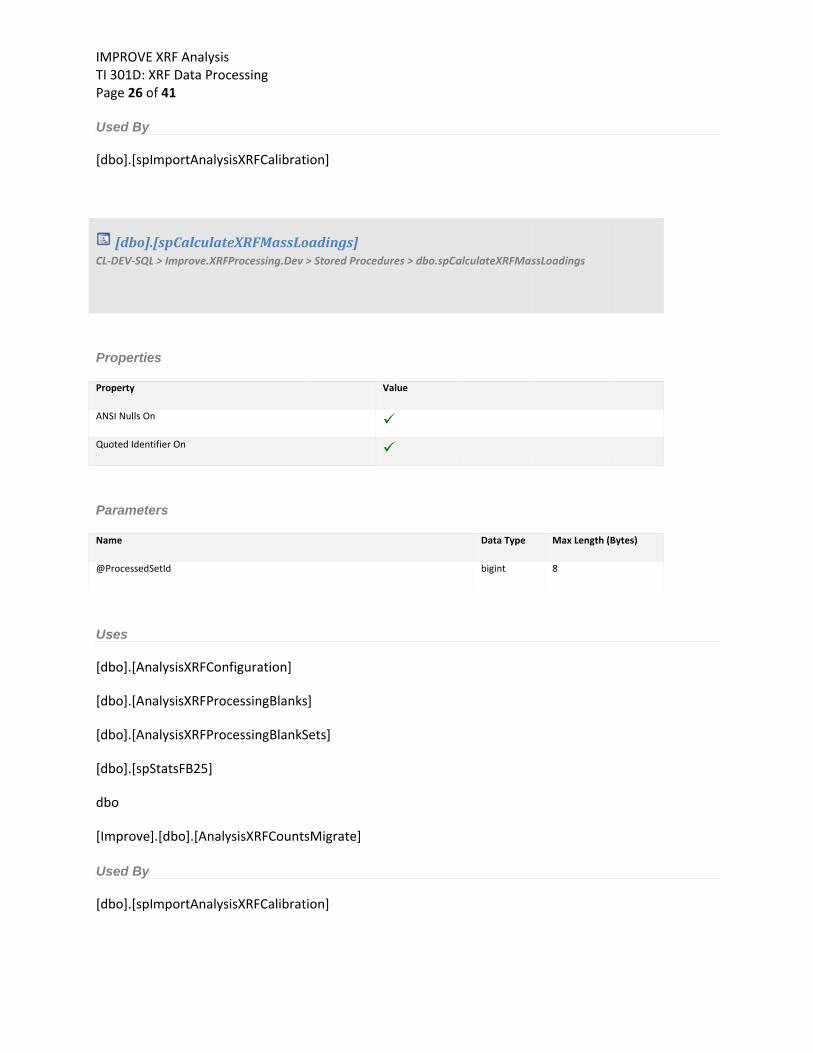
IMPROVETI 301D: XPage 26 o Used By
[dbo].[spI
[dbo].CL‐DEV‐SQL
Propertie
Property
ANSI Nulls On
Quoted Ident
Paramete
Name
@ProcessedS
Uses
[dbo].[An
[dbo].[An
[dbo].[An
[dbo].[spS
dbo
[Improve]
Used By
[dbo].[spI
XRF AnalysisXRF Data Procof 41
mportAnalys
[spCalculateL > Improve.XRF
es
n
tifier On
ers
SetId
alysisXRFCon
alysisXRFProc
alysisXRFProc
StatsFB25]
].[dbo].[Analy
mportAnalys
s cessing
sisXRFCalibrat
eXRFMassLoFProcessing.Dev
figuration]
cessingBlanks
cessingBlankS
ysisXRFCount
sisXRFCalibrat
tion]
oadings]> Stored Proced
s]
Sets]
sMigrate]
tion]
dures > dbo.spCa
Value
alculateXRFMas
Data Type
bigint
ssLoadings
Max Length (
8
(Bytes)
IMPROVETI 301D: XPage 27 o
[dbo].CL‐DEV‐SQL
Paramete
Name
@startdate
@enddate
@Configurati
@NumberOf
Uses
dbo
Used By
[dbo].[spI
[dbo].CL‐DEV‐SQL
Paramete
Name
@SourceTabl
@EffectiveSta
Uses
[dbo].[An
[dbo].[An
XRF AnalysisXRF Data Procof 41
[spCreateAnL > Improve.XRF
ers
ion
FieldBlanks
mportAnalys
[spImportAL > Improve.XRF
ers
le
art
alysisXRFCon
alysisXRFProc
s cessing
nalysisFieldBFProcessing.Dev
sisXRFCalibrat
nalysisXRFCFProcessing.Dev
figuration]
cessingCorrec
Blanks]> Stored Proced
tion]
Calibration]> Stored Proced
ctedSets]
dures > dbo.spCr
dures > dbo.spIm
reateAnalysisFie
Data Type
datetime
datetime
nvarchar(100)
int
mportAnalysisXR
Data Type
varchar(100)
varchar(10)
eldBlanks
Max Length (
8
8
200
4
RFCalibration
Max Length (
100
10
(Bytes)
(Bytes)
IMPROVETI 301D: XPage 28 o [dbo].[spA
[dbo].[spC
[dbo].[spC
dbo
[Improve]
[dbo].CL‐DEV‐SQL
Paramete
Name
@StartDate
@EndDate
@NumberOf
Uses
Dbo
[dbo].CL‐DEV‐SQL
Paramete
Name
@Element
@BlankSetId
XRF AnalysisXRF Data Procof 41
AnalysisXRFCo
CalculateXRFM
CreateAnalys
].[dbo].[Analy
[spProcessAL > Improve.XRF
ers
FieldBlanks
[spStatsFB2L > Improve.XRF
ers
s cessing
orrection]
MassLoadings
isFieldBlanks]
ysisXRFCount
AnalysisXRFFProcessing.Dev
25]FProcessing.Dev
s]
]
sMigrate]
FCounts]> Stored Proced
> Stored Proced
dures > dbo.spPr
dures > dbo.spSt
rocessAnalysisX
Data Type
datetime
datetime
int
tatsFB25
Data Type
nvarchar(4)
bigint
XRFCounts
Max Length (
8
8
4
Max Length (
8
8
(Bytes)
(Bytes)

IMPROVETI 301D: XPage 29 o
Uses
[dbo].[An
[dbo].[An
dbo
[Improve]
Used By
[dbo].[spC
[dbo].CL‐DEV‐SQL
Uses
[dbo].[An
dbo
[Improve]
[dbo].CL‐DEV‐SQL
Propertie
Property
ANSI Nulls On
Quoted Ident
XRF AnalysisXRF Data Procof 41
alysisXRFProc
alysisXRFProc
].[dbo].[Analy
CalculateXRFM
[spUpdateXL > Improve.XRF
alysisXRFQAM
].[dbo].[Analy
[spXRFDBFFL > Improve.XRF
es
n
tifier On
s cessing
cessingBlanks
cessingBlankS
ysisXRFCount
MassLoadings
XRFDataQA]FProcessing.Dev
Modifications
ysisXRFCount
Form]FProcessing.Dev
s]
Stats]
sMigrate]
s]
> Stored Proced
s]
sMigrate]
> Stored Proced
dures > dbo.spU
dures > dbo.spXR
Value
UpdateXRFDataQ
XRFDBFForm
QA

IMPROVE XRF Analysis TI 301D: XRF Data Processing Page 30 of 41
Parameters
Name Data Type Max Length (Bytes)
@ProcessedSetId bigint 8
Uses
Dbo

IMPROVE XRF Analysis TI 301D: XRF Data Processing Page 31 of 41
Appendix4:SourceCode.Note: Readability is decreased in .doc format. For better readability see the solution code itself in visual
studio.
CREATEPROCEDURE[dbo].[spProcessAnalysisXRFCounts]‐‐ ============================================= ‐‐ Author: Leland Gee ([email protected]) ‐‐ Create date: 7/12/2012 ‐‐ Description: Begins the Processing of XRF Data. ‐‐ ============================================= @StartDate datetime, @EndDate datetime, @NumberOfFieldBlanks integer AS set nocount on declare ‐‐ @configuration nvarchar(100), @processedsetId bigint, @today datetime = getdate() begin BEGIN TRAN T1 ‐‐ ============================================= ‐‐ Section: Generate the Correction Set ‐‐ Description: Inserts the SP parameters ‐‐ into AnalysisXRFProcessingCorrectedSets for historical purposes ‐‐ and binding the corrected values for this run of the SP into a single set ‐‐ ============================================= insert into AnalysisXRFProcessingCorrectedSets(ProcessDate,StartDate,EndDate) values (@today,@startdate,@enddate) ‐‐ ============================================= ‐‐ Section: Configuration Cursor ‐‐ Description: The cursor is used to find all of ‐‐ the distinct active configurations that were occuring ‐‐ during the sampling dates specified in the parameters ‐‐ and is also used to loop through other SPs. ‐‐ ============================================= declare configuration_cursor CURSOR for select distinct(f.ConfigurationAlias) from improve.dbo.AnalysisXRFCountsMigrate c join dbo.AnalysisXRFConfiguration f on c.[Source] = f.[Instrument] and c.[DateTime] between f.StartDate and isnull(f.EndDate,@today) where c.Validity = 1 and LEN(c.SampleIdent) = 15 and RIGHT(c.SampleIdent,2) in ('NM','QD','FB') and Cast(SUBSTRING(c.[SampleIdent],10,2)+ CHAR(47)+ SUBSTRING(c.[SampleIdent],12,2)+ CHAR(47)+ SUBSTRING(c.[SampleIdent],6,4)as DateTime) between @startdate and @enddate open configuration_cursor ‐‐ ============================================= ‐‐ Section: Cursor Loop ‐‐ Description: The Cursor is opened and each distinct ‐‐ configuration is processed through other SPs to generate the fieldblanks/statistics then correction. ‐‐ ============================================= Fetch Next from configuration_cursor into @configuration while @@FETCH_STATUS = 0 Begin

IMPROVE XRF Analysis TI 301D: XRF Data Processing Page 32 of 41 ‐‐ ============================================= ‐‐ Section: Loop Member ‐ Choosing FieldBlanks ‐‐ Description: Create Analysis Field Blank will ‐‐ generate the 25 fieldblank and statistics necessary for Blank Subtraction. ‐‐ ============================================= exec spCreateAnalysisFieldBlanks @StartDate, @EndDate, @configuration,@NumberOfFieldBlanks ‐‐ ============================================= ‐‐ Section: Loop Member ‐ Correction ‐‐ Description: Performs actual blank correction for the set of data. ‐‐ Using the statistics generated in the previous section. ‐‐ ============================================= exec spAnalysisXRFCorrection @StartDate, @EndDate, @configuration Fetch Next from configuration_cursor into @configuration End Close configuration_cursor DEALLOCATE configuration_cursor ‐‐Duplicity of data requested. ‐‐ ============================================= ‐‐ Section: Calculate Mass Loadings ‐‐ Description: This is an intentional duplicity of the counts data as mass loadings. ‐‐ In the future if everything goes as planned we should not have to store actual counts ‐‐ values that were generated, but merely the parameters/statistics that were part of their generation. ‐‐ ============================================= select @processedSetId = ident_Current ('AnalysisXRFProcessingCorrectedSets') exec spCalculateXRFMassLoadings @processedSetId if @@ERROR <>0 begin Rollback TRAN T1 End Else begin Commit TRAN T1 end end
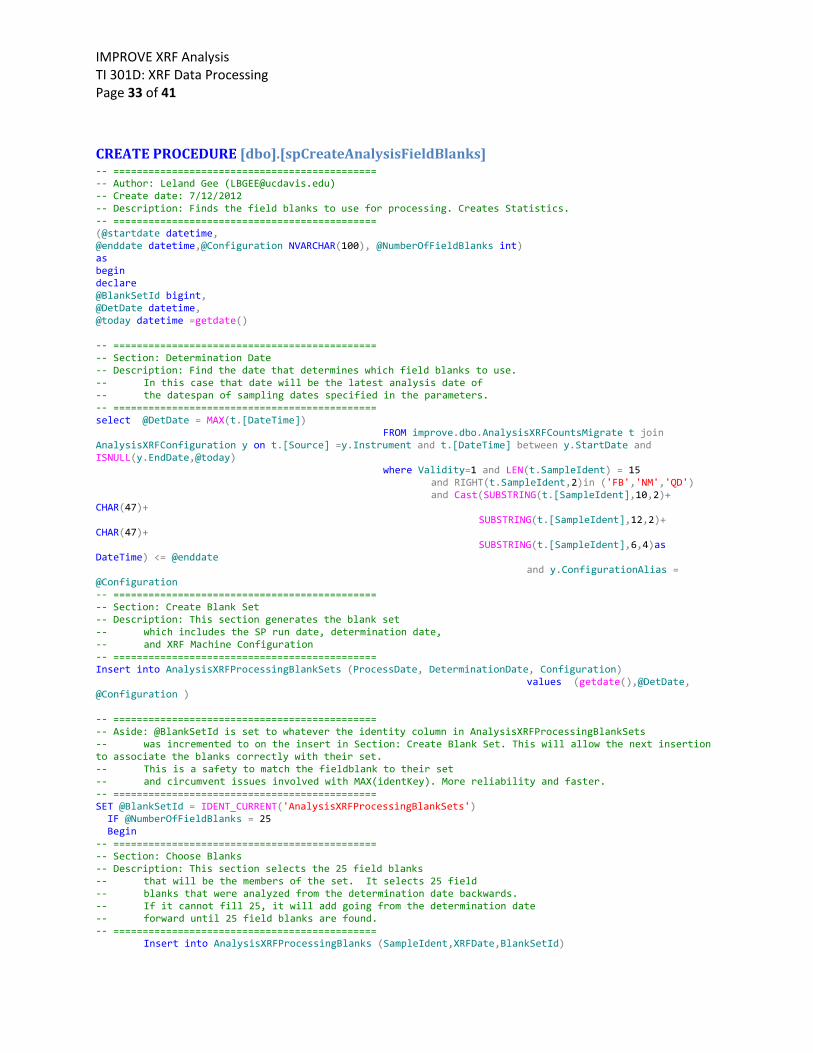
IMPROVE XRF Analysis TI 301D: XRF Data Processing Page 33 of 41
CREATEPROCEDURE[dbo].[spCreateAnalysisFieldBlanks]‐‐ ============================================= ‐‐ Author: Leland Gee ([email protected]) ‐‐ Create date: 7/12/2012 ‐‐ Description: Finds the field blanks to use for processing. Creates Statistics. ‐‐ ============================================= (@startdate datetime, @enddate datetime,@Configuration NVARCHAR(100), @NumberOfFieldBlanks int) as begin declare @BlankSetId bigint, @DetDate datetime, @today datetime =getdate() ‐‐ ============================================= ‐‐ Section: Determination Date ‐‐ Description: Find the date that determines which field blanks to use. ‐‐ In this case that date will be the latest analysis date of ‐‐ the datespan of sampling dates specified in the parameters. ‐‐ ============================================= select @DetDate = MAX(t.[DateTime]) FROM improve.dbo.AnalysisXRFCountsMigrate t join AnalysisXRFConfiguration y on t.[Source] =y.Instrument and t.[DateTime] between y.StartDate and ISNULL(y.EndDate,@today) where Validity=1 and LEN(t.SampleIdent) = 15 and RIGHT(t.SampleIdent,2)in ('FB','NM','QD') and Cast(SUBSTRING(t.[SampleIdent],10,2)+ CHAR(47)+ SUBSTRING(t.[SampleIdent],12,2)+ CHAR(47)+ SUBSTRING(t.[SampleIdent],6,4)as DateTime) <= @enddate and y.ConfigurationAlias = @Configuration ‐‐ ============================================= ‐‐ Section: Create Blank Set ‐‐ Description: This section generates the blank set ‐‐ which includes the SP run date, determination date, ‐‐ and XRF Machine Configuration ‐‐ ============================================= Insert into AnalysisXRFProcessingBlankSets (ProcessDate, DeterminationDate, Configuration) values (getdate(),@DetDate, @Configuration ) ‐‐ ============================================= ‐‐ Aside: @BlankSetId is set to whatever the identity column in AnalysisXRFProcessingBlankSets ‐‐ was incremented to on the insert in Section: Create Blank Set. This will allow the next insertion to associate the blanks correctly with their set. ‐‐ This is a safety to match the fieldblank to their set ‐‐ and circumvent issues involved with MAX(identKey). More reliability and faster. ‐‐ ============================================= SET @BlankSetId = IDENT_CURRENT('AnalysisXRFProcessingBlankSets') IF @NumberOfFieldBlanks = 25 Begin ‐‐ ============================================= ‐‐ Section: Choose Blanks ‐‐ Description: This section selects the 25 field blanks ‐‐ that will be the members of the set. It selects 25 field ‐‐ blanks that were analyzed from the determination date backwards. ‐‐ If it cannot fill 25, it will add going from the determination date ‐‐ forward until 25 field blanks are found. ‐‐ ============================================= Insert into AnalysisXRFProcessingBlanks (SampleIdent,XRFDate,BlankSetId)

IMPROVE XRF Analysis TI 301D: XRF Data Processing Page 34 of 41 Select top 25 SampleIdent,[DateTime]as XRFDate,@BlankSetId as BlankSetId FROM (select * from ( select top 25 n.SampleIdent, n.[DateTime] FROM improve.dbo.AnalysisXRFCountsMigrate n join AnalysisXRFConfiguration z on n.Source=z.Instrument and n.[DateTime] between z.StartDate and isnull(z.EndDate,@today) where Validity=1 and n.[DateTime] <= @DetDate and z.ConfigurationAlias= @Configuration and RIGHT(n.SampleIdent,2)='FB'and LEN(sampleident) =15 group by n.SampleIdent, n.[DateTime] order by DateTime desc)a union all select * from (select top 25 n.SampleIdent, n.[DateTime] FROM improve.dbo.AnalysisXRFCountsMigrate n join AnalysisXRFConfiguration z on n.Source=z.Instrument and n.[DateTime] between z.StartDate and isnull(z.EndDate,@today) where Validity=1 and n.[DateTime] > @DetDate and z.ConfigurationAlias= @Configuration and RIGHT(n.SampleIdent,2)='FB' and LEN(sampleident) =15 group by n.SampleIdent, n.[DateTime] order by DateTime asc)b)c ‐‐ ============================================= ‐‐ Section: Generate Field Blank Statistics ‐‐ Description: This section generates the median and ‐‐ 95th percentile for each element of the 24 we currently use. ‐‐ This has not been hardcoded into one stored procedure to allow expansion ‐‐ for more elements if necessary. The SPs take the @BlankSetId and generate the Median/95th ‐‐ using the fieldblanks associated with the set. ‐‐ ============================================= exec spStatsFB25 'Na', @BlankSetId exec spStatsFB25 'Mg', @BlankSetId exec spStatsFB25 'Al', @BlankSetId exec spStatsFB25 'Si', @BlankSetId exec spStatsFB25 'P', @BlankSetId exec spStatsFB25 'S', @BlankSetId exec spStatsFB25 'Cl', @BlankSetId exec spStatsFB25 'K', @BlankSetId exec spStatsFB25 'Ca', @BlankSetId exec spStatsFB25 'Ti', @BlankSetId exec spStatsFB25 'V', @BlankSetId exec spStatsFB25 'Cr', @BlankSetId exec spStatsFB25 'Mn', @BlankSetId exec spStatsFB25 'Fe', @BlankSetId exec spStatsFB25 'Ni', @BlankSetId exec spStatsFB25 'Cu', @BlankSetId exec spStatsFB25 'Zn', @BlankSetId exec spStatsFB25 N'As', @BlankSetId exec spStatsFB25 'Se', @BlankSetId exec spStatsFB25 'Br', @BlankSetId exec spStatsFB25 'Rb', @BlankSetId exec spStatsFB25 'Sr', @BlankSetId exec spStatsFB25 'Zr', @BlankSetId exec spStatsFB25 'Pb', @BlankSetId END End go

IMPROVE XRF Analysis TI 301D: XRF Data Processing Page 35 of 41
CREATEPROCEDURE[dbo].[spStatsFB25]‐‐ ============================================= ‐‐ Author: Leland Gee ([email protected]) ‐‐ Create date: 7/12/2012 ‐‐ Description: Generates the Median and 95th Percentile for 25 ‐‐ Field blanks that are associated with a blanksetId ‐‐ ============================================= (@Element nvarchar(4), @BlankSetId bigint) as begin ‐‐ ============================================= ‐‐ Section: Generate FieldBlank Statistics ‐‐ Description: This section inserts the statistics ‐‐ for a given Field Blank Set and a given Element as ‐‐ defined by the parameters. It does this by ordering ‐‐ the values for the given element from least to greatest ‐‐ and selecting the 13th (median) and 24th(95th) ‐‐ ============================================= Insert into AnalysisXRFProcessingBlankStats (BlankSetId, Element, Median, Percentile95) Select @BlankSetId as BlankSetId, @Element as Element, Median, Percentile95 from (select Median as Median, blanksetId from (select ROW_NUMBER() over (order by v.[RawIntensity] asc) R,BlankSetId , v.RawIntensity as Median from improve.dbo.AnalysisXRFCountsMigrate v join dbo.AnalysisXRfProcessingBlanks c on v.sampleident = c.sampleident and v.[DateTime] = c.XRFDate where v.Validity=1 and c.BlankSetId = @BlankSetId and v.element= @Element )t where R = 13)p join (select Percentile95,blanksetid from (select ROW_NUMBER() over (order by v.[RawIntensity] asc) R,BlankSetId, v.RawIntensity as Percentile95 from improve.dbo.AnalysisXRFCountsMigrate v join dbo.AnalysisXRfProcessingBlanks c on v.sampleident = c.sampleident and v.[DateTime] = c.XRFDate where v.Validity=1 and c.BlankSetId = @BlankSetId and v.element = @Element)i where R = 24)y on p.BlankSetId=y.BlankSetId End GO

IMPROVE XRF Analysis TI 301D: XRF Data Processing Page 36 of 41
CREATEPROCEDURE[dbo].[spAnalysisXRFCorrection]‐‐ ============================================= ‐‐ Author: Leland Gee ([email protected]) ‐‐ Create date: 7/12/2012 ‐‐ Description: Corrects the XRF values using the ‐‐ previously generated statistics. ‐‐ ============================================= (@startdate datetime, @enddate datetime, @configuration nvarchar(100)) as begin declare @AnalysisXRFCorrectionSet as bigint, @today as datetime = getdate(), @AnalysisBlankSet as bigint ‐‐ ============================================= ‐‐ Section: Set Identity Columns ‐‐ Description: The Currently incremented value of the blankset ‐‐ and corrected set is assigned to their respective ‐‐ variables so they can be associated with the corrected values. ‐‐ ============================================= select @AnalysisBlankSet = IDENT_CURRENT('AnalysisXRFProcessingBlankSets') select @AnalysisXRFCorrectionSet = IDENT_Current('AnalysisXRFProcessingCorrectedSets') ‐‐ ============================================= ‐‐ Section: Blank Correction ‐‐ Description: Performs the configuration specific blank ‐‐ correction by applying the statistic previously ‐‐ generated. ‐‐ ============================================= Insert into AnalysisXRFCountsCorrected (SampleIdent,ProcessedSetId,[Source],[Configuration],[ConfigurationId],[DateTime],BlankSetId,Element,Unit,CorrectedIntensity) select c.SampleIdent, @AnalysisXRFCorrectionSet as ProcessedSetId, c.[Source], x.ConfigurationAlias as [Configuration], x.ConfigurationId, c.[DateTime], @AnalysisBlankSet as BlankSetId, c.Element, c.Unit, (c.RawIntensity ‐ u.Median) as CorrIntensity from improve.dbo.AnalysisXRFCountsMigrate c join AnalysisXRFConfiguration x on c.[DateTime] between x.StartDate and isnull(x.EndDate,@today) and c.[Source] = x.Instrument join AnalysisXRFProcessingBlankStats u on u.BlankSetId = @analysisblankset and c.Element = u.Element where c.Validity=1 and x.ConfigurationAlias =@configuration and c.Element in ('Na','Mg','Al','Si','P','S','Cl','K','Ca','Ti','V','Cr','Mn','Fe','Ni','Cu','Zn' ,'As','Se','Br','Rb','Sr','Zr','Pb') and LEN(c.SampleIdent) = 15 and RIGHT(c.SampleIdent,2) in ('NM','QD') and Cast(SUBSTRING(c.[SampleIdent],10,2)+ CHAR(47)+ SUBSTRING(c.[SampleIdent],12,2)+ CHAR(47)+ SUBSTRING(c.[SampleIdent],6,4)as DateTime) between @startdate and @enddate END GO

IMPROVE XRF Analysis TI 301D: XRF Data Processing Page 37 of 41 CREATEPROCEDURE[dbo].[spCalculateXRFMassLoadings]‐‐ ============================================= ‐‐ Author: Leland Gee ([email protected]) ‐‐ Create date: 7/12/2012 ‐‐ Description: Converts the corrected count values into ‐‐ their mass loading values by using the calibrations ‐‐ from each machine. ‐‐ ============================================= @ProcessedSetId bigint AS declare @today as datetime set @today = GETDATE() ‐‐ ============================================= ‐‐ Section: Insert Corrected Mass Loadings ‐‐ Description: This section takes the corrected counts. ‐‐ applies the calibration factor, and inserts them into ‐‐ AnalysisXRFMassLoadings. It also calculates the uncertainties and inserts the MDLs ‐‐ ============================================= insert into AnalysisXRFMassLoadings (Sampleident, ProcessedSetId, Source, Configuration, CalibrationSetId, [DateTime], BlanksetId, Element, Unit, MassLoading, Err, MDL) SELECT c.SampleIdent, @ProcessedSetId as ProcessedSetId, c.Source,c.Configuration,q.CalibrationSetId,c.[DateTime], c.BlankSetId,c.Element ,'ng/cm2' as Unit, (c.CorrectedIntensity *p.EValue*1000) as MassLoading, SQRT(square(0.608*y.[DL(ug/cm2)]*1000)+square(y.ProportionalUncertainty*(case when c.CorrectedIntensity< 0 then 0 else c.CorrectedIntensity end)*1000*p.EValue)) as 'err', y.[DL(ug/cm2)]*1000 as 'mdl' from AnalysisXRFCountsCorrected c join AnalysisXRFCalibrationSets q on c.Source = q.Source and c.[DateTime] between q.StartDate and isnull(q.EndDate,@today) join AnalysisXRFCalibrations p on p.CalibrationSetId = q.CalibrationSetId and c.Element = p.Element join AnalysisXRFConfiguration t on c.Source = t.Instrument and c.[DateTime] between t.StartDate and ISNULL(t.EndDate,@today) join AnalysisXRFStaticValues y on t.ConfigurationAlias = y.InstrumentConfiguration and c.Element = y.Element where c.ProcessedSetId = @ProcessedSetId

IMPROVE XRF Analysis TI 301D: XRF Data Processing Page 38 of 41
CREATEPROCEDURE[dbo].[spXRFDBFForm] @ProcessedSetId bigint AS declare @today as datetime set @today = GETDATE() select [Site], Samdat, 0000 Strtim, 'NM' as Pesstat, CHAR(32)as Pixstat, [StatusCode] as Xrmstat, [StatusCode] as Xrcstat, 0.00 H, 0.00 H_err, 0.00 H_mdl, S, S_err, S_mdl, Cl, Cl_err, Cl_mdl, K, K_err, K_mdl, Ca, Ca_err, Ca_mdl, Char(32) Ba, Char(32) Ba_err, Char(32) Ba_mdl, Ti, Ti_err, Ti_mdl, V, V_err, V_mdl, Cr, Cr_err, Cr_mdl, Mn, Mn_err, Mn_mdl, Fe, Fe_err, Fe_mdl, Char(32) Co, Char(32) Co_err, Char(32) Co_mdl, Ni, Ni_err, Ni_mdl, Cu, Cu_err, Cu_mdl, Zn, Zn_err, Zn_mdl, Char(32) Ga, Char(32) Ga_err, Char(32) Ga_mdl, Char(32) Au, Char(32) Au_err, Char(32) Au_mdl, Char(32) Hg, Char(32) Hg_err,

IMPROVE XRF Analysis TI 301D: XRF Data Processing Page 39 of 41 Char(32) Hg_mdl, [As], As_err, As_mdl, Pb, Pb_err, Pb_mdl, Se, Se_err, Se_mdl, Br, Br_err, Br_mdl, Rb, Rb_err, Rb_mdl, Sr, Sr_err, Sr_mdl, Char(32) Y, Char(32) Y_err, Char(32) Y_mdl, Zr, Zr_err, Zr_mdl, Char(32) Cd, Char(32) Cd_err, Char(32) Cd_mdl, Char(32) Ag, Char(32) Ag_err, Char(32) Ag_mdl, na Yna, na_err Yna_err, na_mdl Yna_mdl, mg Ymg, mg_err Ymg_err, mg_mdl Ymg_mdl, al Yal, al_err Yal_err, al_mdl Yal_mdl, si Ysi, si_err Ysi_err, si_mdl Ysi_mdl, p Yp, p_err Yp_err, p_mdl Yp_mdl, s Ys, s_err Ys_err, s_mdl Ys_mdl, cl Ycl, cl_err Ycl_err, cl_mdl Ycl_mdl, k Yk, k_err Yk_err, k_mdl Yk_mdl, ca Yca, ca_err Yca_err, ca_mdl Yca_mdl, Char(32) Yba, Char(32) Yba_err, Char(32) Yba_mdl, ti Yti, ti_err Yti_err, ti_mdl Yti_mdl, v Yv, v_err Yv_err, v_mdl Yv_mdl,

IMPROVE XRF Analysis TI 301D: XRF Data Processing Page 40 of 41 cr Ycr, cr_err Ycr_error, cr_mdl Ycr_mdl, mn Ymn, mn_err Ymn_err, mn_mdl Ymn_mdl, fe Yfe, fe_err Yfe_err, fe_mdl Yfe_mdl, Char(32) Yco, Char(32) Yco_err, Char(32) Yco_mdl, ni Yni, ni_err Yni_err, ni_mdl Yni_mdl, 0.00 Pesalt, Char(32) Pixelt, 0.99 Xrmlt, 0.99 Xrclt, configuration Cuxrfid from( select Site,StatusCode,Samdat,Unit,Configuration,max(Na) as Na,max(Na_err) as Na_err, max(Na_mdl) as Na_mdl, max(Mg) as Mg, max(Mg_err) as Mg_err, max(Mg_mdl) as Mg_mdl, max(Al) as Al, max(Al_err) as Al_err, max(Al_mdl) as Al_mdl, max(Si) as Si, max(Si_err) as Si_err, max(Si_mdl) as Si_mdl, max(P) as P, max(P_err) as P_err, max(P_mdl) as P_mdl, max(S) as S, max(S_err) as S_err, max(S_mdl) as S_mdl, max(Cl) as Cl, max(Cl_err) as Cl_err, max(Cl_mdl) as Cl_mdl, max(K) as K, max(K_err) as K_err, max(K_mdl) as K_mdl, max(Ca) as Ca, max(Ca_err) as Ca_err, max(Ca_mdl) as Ca_mdl, max(Ti) as Ti, max(Ti_err) as Ti_err, max(Ti_mdl) as Ti_mdl, max(V) as V, max(V_err) as V_err, max(V_mdl) as V_mdl, max(Cr) as Cr, max(Cr_err) as Cr_err, max(Cr_mdl) as Cr_mdl, max(Mn) as Mn, max(Mn_err) as Mn_err, max(Mn_mdl) as Mn_mdl, max(Fe) as Fe, max(Fe_err) as Fe_err, max(Fe_mdl) as Fe_mdl, max(Ni) as Ni, max(Ni_err) as Ni_err, max(Ni_mdl) as Ni_mdl, max(Cu) as Cu, max(Cu_err) as Cu_err, max(Cu_mdl) as Cu_mdl, max(Zn) as Zn, max(Zn_err) as Zn_err, max(Zn_mdl) as Zn_mdl, max([As]) as [As], max([As_err]) as [As_err], max([As_mdl]) as [As_mdl], max(Se) as Se, max(Se_err) as Se_err, max(Se_mdl) as Se_mdl, max(Br) as Br, max(Br_err) as Br_err, max(Br_mdl) as Br_mdl, max(Rb) as Rb, max(Rb_err) as Rb_err, max(Rb_mdl) as Rb_mdl, max(Sr) as Sr, max(Sr_err) as Sr_err, max(Sr_mdl) as Sr_mdl, max(Zr) as Zr, max(Zr_err) as Zr_err, max(Zr_mdl) as Zr_mdl, max(Pb) as Pb, max(Pb_err) as Pb_err, max(Pb_mdl) as Pb_mdl from (SELECT LEFT(c.[SampleIdent],5) AS 'Site', RIGHT(c.[SampleIdent],2) AS 'StatusCode', Cast(SUBSTRING(c.[SampleIdent],10,2)+ CHAR(47)+ SUBSTRING(c.[SampleIdent],12,2)+ CHAR(47)+ SUBSTRING(c.[SampleIdent],6,4)as DateTime) AS 'Samdat', c.Unit, c.element, c.MassLoading, c.Err, c.Element+'_err' as Element_err, c.Element+'_mdl' as Element_mdl, mdl, c.Configuration from AnalysisXRFMassLoadings c where c.ProcessedSetId = @ProcessedSetId) as query pivot (max(MassLoading) for Element in (Na,Mg,Al,Si,P, S,Cl,K,Ca,Ti,V,Cr,Mn,Fe,Ni,Cu,Zn,

IMPROVE XRF Analysis TI 301D: XRF Data Processing Page 41 of 41 [As],Se,Br,Rb,Sr,Zr,Pb)) as pivot1 pivot (max(err) for Element_err in (Na_err, Mg_err, Al_err, Si_err, P_err, S_err, Cl_err, K_err, Ca_err, Ti_err, V_err, Cr_err, Mn_err, Fe_err, Ni_err, Cu_err, Zn_err, [As_err],Se_err,Br_err, Rb_err, Sr_err, Zr_err, Pb_err )) as pivot2 pivot (max(mdl) for Element_mdl in (Na_mdl, Mg_mdl, Al_mdl, Si_mdl, P_mdl, S_mdl, Cl_mdl, K_mdl, Ca_mdl, Ti_mdl, V_mdl, Cr_mdl, Mn_mdl, Fe_mdl, Ni_mdl, Cu_mdl, Zn_mdl, [As_mdl],Se_mdl,Br_mdl, Rb_mdl, Sr_mdl, Zr_mdl, Pb_mdl)) pivot3 group by Site,StatusCode,Samdat,Unit,Configuration)outside

IMPROVE XRF Analysis
TI 301E: QA/QC of XRF Analysis
Page 1 of 5
TI 301E: QA/QC of XRF Analysis Table of Contents
1.0 PURPOSE AND APPLICABILITY ....................................................................................... 2
2.0 EQUIPMENT AND SUPPLIES .......................................................................................... 2
3.0 DEFINITIONS .................................................................................................................. 2
4.0 PROCEDURE .................................................................................................................. 3
4.1 Calibration and Quality Assurance/Quality Check ................................................. 3
4.2 Quality Check for Routine Analysis ......................................................................... 4
IMPROVE XRF Analysis
TI 301E: QA/QC of XRF Analysis
Page 2 of 5
1. PURPOSE AND APPLICABILITY
The subject of this standard operating procedure (SOP) is the quality assurance/control (QA/QC) steps applied in the elemental mass loadings measurements of PM2.5 loaded filters collected in IMPROVE sites using EDXRF systems, namely Panalytical Epsilon5. The scope is to ensure good laboratory practice of measurements of elements on PM2.5 loaded filters including calibration, verification of calibration, regular quality control checks of calibration/EDXRF systems and air quality in the laboratory for three Epsilon 5 EDXRF spectrometers (E5s).
2. EQUIPMENT AND SUPPLIES
Micromatter thin film standards NIST SRM 2783 AWIM standards Teflon Filters (Pall Inc, 3 µm pore size, 25 mm diameter) Nuclepore Filters Provided from Micromatter inc. Microbalances (Mettler Toledo, XP6 with 1µg readability)
3. DEFINITIONS
Lab Blanks: Teflon and Nuclepore filters placed in the S trays of each Epsilon 5 (E5) for long term monitoring. Teflon blanks are drawn from those passing acceptance tests of filter lots for routine IMPROVE‐network sampling. Field Blanks: Teflon Blanks included in some filter cartridges to monitor possible contamination due to shipping, handling, and passive exposure. Field blanks are mounted in the sampler but have no air drawn through them. Reanalysis Samples: A fixed collection of 16 actively sampled IMPROVE filters and one NIST SRM 2783 sample that are reanalyzed monthly to monitor the stability and consistency of the three E5 instrument systems. Reference Values: All the values of 16 Reanalysis Samples obtained just after the calibration in Jan2013. Z‐score: The ratio of absolute difference between each result from monthly reanalysis and reference value to accompanying uncertainty. Z‐score should remain <1. Raw Intensity: The intensity (counts per second/mA, cps/mA) generated by the E5’s software without any blank subtraction. Corrected Intensity: The intensity (cps/mA) generated by the E5’s software with assigned blank subtraction. Mass Loading: The areal density (mass/cm2) of an element on a sample filter or standard. Calibration Factor: The instrumental sensitivity for an element ([cps/mA] / [µg/cm2]) determined from the linear regression between reference mass loadings and instrumental corrected intensities. Relative Expanded Uncertainty (Urel): The ratio of uncertainty estimated by the summation of contributions of each factor effective on the measurement to the result of measurement (%). Urel is estimated by the summation of contribution from the lack of fit of the linear regression between reference mass loadings and instrumental corrected intensities, repeatability and uncertainty of calibration standards.

IMPROVE XRF Analysis
TI 301E: QA/QC of XRF Analysis
Page 3 of 5
Bias: The ratio of difference between measured and assigned (reference) value to assigned value (%). Acceptance Limit for Teflon filters: The mean+3 SD (standards deviation) of net intensities of Teflon filters analyzed during the filter acceptance test
4. PROCEDURE
The operations included in this SOP are illustrated in the following flowchart:
Figure 1. the steps of quality assurance and quality checks in the XRF measurement 4.1 Calibration and Quality Assurance/Quality Check
1) Perform the calibrations of each E5s following instructions.
2) Estimate the relative expanded uncertainty (Urel) of each element’s calibration line. Use the designated excel sheet to calculate the uncertainty.
CALIBRATION
MICROMATTER+AWM1s
STANDARDS + NIST SRM
UNC.<10%
CHECK LINESCHECK OTHER E5
EXCLUDE STANDARD(S)
UNC.<10%
NO
YES
ANALYZE REANALYSIS
SAMPLES+SRMYES
Z-SCORE < 1
1) ANALYZE LAB BLANKS DAILY
2) ANALYZE SAMPLES
ANALYZE ME STANDARDS
DAILY
RAW INTS.<LIMIT
REPLACE BLANKBIASES < LIMIT
NO
3) ANALYZE REANALYSIS
SAMPLES+SRMMONTHLY AT ALL E5s
CHECK Z-SCORE FOR ALL
ELEMENTS AT ALL E5S
Z-SCORE < 1
CHECK BIASES OF ME
STANDARDS
BIASES < LIMIT YES
CHECK REANALYSIS
SAMPLES+SRM
Z-SCORE < 1
NOCHECK OTHER E5
CHECK STD(S)IF BIASES>LIMIT
YES
NO
NO
YES
NO
YES
YES
NO
YES
NO

IMPROVE XRF Analysis
TI 301E: QA/QC of XRF Analysis
Page 4 of 5
3) If Urel equals or is less than 10% for stoichiometric standards of IMPROVE reported elements, go to step 6.
4) If Urel for stoichiometric standards of IMPROVE reported elements is higher than 10%, check calibration lines to detect the reason of higher Urel. If any of standards deviate from the calibration line, inspect visually the corresponding standards for any defect. If defected, exclude from calibration and recalculate Urel. If recalculated Urel meets 10% criterion, go to step 6, otherwise, go to step 5.
5) Check the calibration lines of corresponding elements at other E5s. If similar deviations are observed on the other E5s, the orientation of the standard needs to be examined. If the orientation is correct, one can suspect the quality of corresponding standards and exclude them from calibration. In this case, recalculate Urel. If recalculated Urel meets 10% criterion, go to 6, otherwise, check the line again to determine deviated standards. If the problem cannot be solved with excluding standard(s), redo calibration with the current standards. If recalibration does not show changes from previous one, notify Laboratory Manager for further instructions (i.e. stop analysis, order new standards, etc.)
6) Verify the finalized calibration lines analyzing reanalysis samples (16 preselected IMPROVE samples) and NIST SRM. Check for Z‐score lower than 1.
7) If Z‐score lower than 1, continue analyzing S‐tray containing Teflon blank, Nuclepore blank and Micromatter ME sample. Check the compliance with the acceptance limits. If everything is within the limit, start analyzing IMPROVE samples.
8) If Z‐score is higher than 1, investigate the reason employing more tests and checking other E5s. If problem cannot be fixed, recalibrate the instrument.
9) If problem continues after recalibration, purchase new standards and recalibrate instruments. If recalibration does not solve the problematic one, notify Laboratory Manager for further instructions (i.e. stop analysis, etc.)
4.2 Quality Check for Routine Analysis
1) After initial checks following calibration, start analyzing IMPROVE samples, if all the initial checks are OK.
2) Every day, analyze S tray containing lab blanks and ME sample. Analyze once a week Al&Si ME standards on three E5s.
3) Analyze Reanalysis Samples and SRM monthly.
4) Every Friday, check the biases of daily/weekly analyzed ME standards. Use the designated excel file to plot the last week’s variation. If variations of elements in the MEs are within warning and acceptance limits (±3 and ±5% of assigned reference values) or are exceeded only once a week (random), continue analyzing IMPROVE samples. If the acceptance limits are exceeded at least 2 times for at least 2 elements, check for the same pattern in the Reanalysis Samples and SRM.
5) Every last Friday of the month, check the results of Reanalysis samples and SRM for being Z‐score lower than 1 for each instrument versus itself and versus the mean of other 2 E5. Put
IMPROVE XRF Analysis
TI 301E: QA/QC of XRF Analysis
Page 5 of 5
the results of each monthly analysis at the designated excel sheet. This excel sheet will show the mean z‐score of each E5. Check the mean Z‐score for 24 IMPROVE elements. Normally, the mean Z‐score of all elements except P remain lower than 1. Furthermore, another excel sheet will calculate slope and intercept of each monthly results versus assigned reference values of each instrument and versus other 2 E5 as well as the between instrument uncertainty and uncertainty of each instrument versus it’s’ reference values. Normally, for elements with well higher than detection limits (i.e., As, Si, S, K, Ca, Ti, Fe and Zn), the slopes are close to 1 and relative uncertainty remains at around 10%. If checking Z‐score is OK, continue analyzing IMPROVE samples. Otherwise, check monitoring ME standards (step 6).
8) If crosschecking of Reanalysis Samples/SRM and monitoring ME standards ends up with biases higher than acceptance limit, continue analyzing one more week, including analyses of Reanalysis Samples and SRM, even they are not in the routine analysis schedule. If the biases continue, recalibrate biased E5 only. Otherwise, continue analyzing IMPROVE samples following schedule.
9) The following will be in effect for samples analyzed during the period between valid and invalid checks (biased period). Notify Laboratory Manager for further instructions.
10) Every month, check the quality of delivered data checking ratio of sum of elements to mass of PM, correlated elements, ratios of crustal elements, outlier in the field blanks etc. To do that, use the designated excel workbook and follow the instructions. Notify the Laboratory Manager for any anomaly in the XRF data before delivery for final validation.