TABLE OF CONTENTS - Causeway Cap OF CONTENTS Letter to ... and consumer durables & apparel, ......
28
TABLE OF CONTENTS Letter to Shareholders 2 Schedule of Investments 6 Sector Diversification 10 Statement of Assets and Liabilities 11 Statement of Operations 12 Statements of Changes in Net Assets 13 Financial Highlights 14 Notes to Financial Statements 16 Disclosure of Fund Expenses 24
Transcript of TABLE OF CONTENTS - Causeway Cap OF CONTENTS Letter to ... and consumer durables & apparel, ......

T A B L E O F C O N T E N T S
Letter to Shareholders 2
Schedule of Investments 6
Sector Diversification 10
Statement of Assets and Liabilities 11
Statement of Operations 12
Statements of Changes in Net Assets 13
Financial Highlights 14
Notes to Financial Statements 16
Disclosure of Fund Expenses 24

L E T T E R T O S H A R E H O L D E R S
For the six months ended March 31, 2017, Causeway International Value Fund’s (the “Fund’s”) InstitutionalClass returned 8.26% and Investor Class returned 8.18% compared to the MSCI EAFE Index (Gross) (“EAFE Index”)return of 6.66%. Since the Fund’s inception on October 26, 2001, average annual total returns are 7.46% for theInstitutional Class and 7.20% for the Investor Class compared to the EAFE Index’s average annual total return of6.19%.
Performance ReviewGlobal equity markets were weak to begin the period in October and November, followed by strong performancefrom December through March as hopes for regulatory and tax reform in the U.S. drove improvement in business andconsumer confidence globally. Currency proved a headwind as major currencies declined against the U.S. dollar. Thebest performing markets in our investable universe included Italy, Spain, Austria, Australia, and France. The biggestlaggards in the EAFE Index included New Zealand, Belgium, Israel, Denmark, and Finland. The best performingindustry groups in the EAFE Index were banks, semiconductors & semiconductor equipment, and consumerdurables & apparel, while food beverage & tobacco, health care equipment & services, and retailing were the worstperforming industry groups.
Fund holdings in the technology hardware & equipment, banks, pharmaceuticals & biotechnology, materials, andinsurance industry groups contributed the most to the Fund’s performance relative to the EAFE Index. Holdings in thecapital goods, utilities, and software & services industry groups, along with an overweight position in the tele-communication services and transportation industry groups, offset some of the outperformance. The largest contrib-utor to absolute return was retail bank, CaixaBank SA (Spain). Additional top contributors included paints & coatingsproducer, Akzo Nobel NV (Netherlands), electronic equipment manufacturer, Samsung Electronics Co., Ltd. (SouthKorea), banking & financial services company, Barclays Plc (United Kingdom), and life insurer, Prudential Plc (UnitedKingdom). The biggest detractor from absolute return was telecommunication services provider, KDDI Corp. (Japan).Other notable detractors included baked goods food producer, Aryzta AG (Switzerland), mobile telecommunicationsoperator, China Mobile Ltd. (Hong Kong), tobacco & ginseng products company, KT&G Corp. (South Korea), andaerospace & defense manufacturer, Cobham Plc (United Kingdom).
Significant Portfolio ChangesOur disciplined purchase and sale process led the portfolio management team to reduce exposure to several holdingsthat approached fair value in our view. The largest sales during the period included integrated oil & gas company,Total (France), bank, Sumitomo Mitsui Financial Group, Inc. (Japan), and electronic equipment manufacturer,Samsung Electronics Co., Ltd. (South Korea), and two full sales from the Fund: print & publishing company, RELX NV(Netherlands) and low-voltage electronics manufacturer, Legrand SA (France). Significant purchases included fournew additions to the Fund: pharmaceutical company, AstraZeneca Plc (United Kingdom), banking & financial servicescompany, UniCredit S.p.A. (Italy), rail operator, Canadian Pacific Railway (Canada), and apparel manufacturer, GildanActivewear (Canada), along with an increased weight to power & automation technology company, ABB Ltd.(Switzerland).
2 Causeway International Value Fund

Investment OutlookU.S. federal funds interest rates have increased 50 basis points (“bps”) since early December of last year, while theU.S. 10-year bond yield has risen over 100 bps since last July. The Federal Reserve’s (“Fed’s”) tightening cycle, plusrising term premia, may restrict the more credit-sensitive segments of the U.S. economy. Recent data indicate a slow-ing of activity in pending U.S. house sales and automobile sales. This may be exactly what the Fed has in mind, stamp-ing out excesses. We believe the Fed intends to prolong the expansion by seeking to keep U.S. real gross domesticproduct growth at a sustainable annualized range of 2-3%. Regarding the potential Trump tax cuts and deregulation,markets appear to be waiting patiently for results. The improving global economic outlook has also benefited Euro-zone economies; European companies are starting to show broad-based earnings growth on the back of multi-yearhighs in both business and consumer confidence. However, the UK’s invocation of Article 50 to begin negotiations toleave the European Union or “Brexit” increases European political uncertainty over the next two years. We expectcooperation between the UK and the European Union as they are natural (and likely inextricable) trading partnerswith vested interests in each other’s success. The Bank of Japan should continue to engage in asset purchases as part ofthe broader quantitative easing and yield curve control policy — targeting the 10-year Japanese government bondyield at zero. Japan likely has benefited from China’s 2016 economic stimulus and the resulting global reflation trade.However, recent tightening of monetary policy in China — to curb asset inflation and stem capital outflows — mayreverse some of the pan-Asian growth.
The sharp upturn in demand in 2016 for undervalued cyclical stocks and those in the financial sector lasted only a fewquarters, then lost ground to growth stocks in early 2017. Of the value casualties, the energy sector generated theworst performance in otherwise buoyant equity markets. Our research in the oil & gas sector makes us optimistic overa one-year or longer time frame on both crude oil supply constraints and stable demand. Our bottom-up stockselection process has also led to a sizeable portfolio overweight to stocks domiciled in Europe. With reflation and itsbeneficial impact on pricing, the European earnings recovery should continue in calendar 2017. The Fund continuesto have underweight exposures relative to the EAFE Index to the consumer staples and commodity (non-energy)cyclical sectors, as valuations reflect overly optimistic demand expectations. We are scouring markets for companiesundergoing operational restructuring, assuming abundant financial strength. We complement the “self-help” portionof the Fund with consistent cash flow generators such as telephony and pharmaceutical companies. We believe thedramatic valuation multiple expansion of the last five years has ended, making active management and the identi-fication of improving corporate earnings and cash flow essential.
Causeway International Value Fund 3
We thank you for your continued confidence in Causeway International Value Fund.
March 31, 2017
Harry W. Hartford Sarah H. Ketterer James A. DoylePortfolio Manager Portfolio Manager Portfolio Manager
Jonathan P. Eng Conor MuldoonPortfolio Manager Portfolio Manager
Foster Corwith Alessandro Valentini Ellen LeePortfolio Manager Portfolio Manager Portfolio Manager
The above commentary expresses the portfolio managers’ views as of the date shown and should not be relied upon by the reader as research orinvestment advice. These views are subject to change. There is no guarantee that any forecasts made will come to pass. Holdings are subject to change.Securities mentioned do not make up entire portfolio and, in the aggregate, may represent a small percentage of the portfolio.
Investing involves risk including loss of principal. In addition to the normal risks associated with investing, international investments may involve risk of capitalloss from unfavorable fluctuation in currency values, from differences in generally accepted accounting principles or from economic or political instability inother nations. Emerging markets involve heightened risks related to the same factors as well as increased volatility and lower trading volume. Diversificationdoes not prevent all investment losses.
4 Causeway International Value Fund

March 31, 2017OneYear
Return
Annualized3 YearReturn
Annualized5 YearReturn
Annualized10 YearReturn
AnnualizedInception
to Date
Institutional Class 13.58% -0.52% 5.68% 2.07% 7.46%
Investor Class 13.38% -0.76% 5.42% 1.84% 7.20%
The performance data represents past performance and is not an indication of future results. Investment return and the principal value of an investmentwill fluctuate so that an investor’s shares, when redeemed, may be worth less than their original cost and current performance may be higher or lower thanthe performance quoted. For performance data current to the most recent month end, please call 1-866-947-7000 or visit www.causewayfunds.com.Investment performance reflects contractual fee waivers during certain periods. In the absence of such fee waivers, total return would have been reduced.Total returns assume reinvestment of dividends and capital gains distributions at net asset value when paid. Investor Class shares pay a shareholder servicefee of up to 0.25% per annum of average daily net assets. Institutional Class shares pay no shareholder service fee. Pursuant to the current January 26,2017 prospectus, the Fund’s gross ratios of expenses in relation to net assets were 0.91% and 1.16% for the Institutional Class and Investor Class,respectively. The Fund imposes a 2% redemption fee on the value of shares redeemed less than 60 days after purchase. If your account incurred aredemption fee, your performance will be lower than the performance shown here. For more information, please see the prospectus.
The MSCI EAFE Index (Gross) is an arithmetical average weighted by market value of the performance of approximately 1,000 non-U.S. companiesrepresenting 21 stock markets in Europe, Australasia and the Far East. The Index is gross of withholding taxes and assumes reinvestment of dividends andcapital gains. The Index does not reflect the payment of transaction costs, fees and expenses associated with an investment in the Fund. It is not possible toinvest directly in an index. There are special risks in foreign investing (please see Note 5 in the Notes to Financial Statements).
MSCI has not approved, reviewed, or produced this report, makes no express or implied warranties or representations, and is not liable whatsoever for anydata in this report. You may not redistribute the MSCI data or use it as a basis for other indices or investment products.
Causeway International Value Fund 5
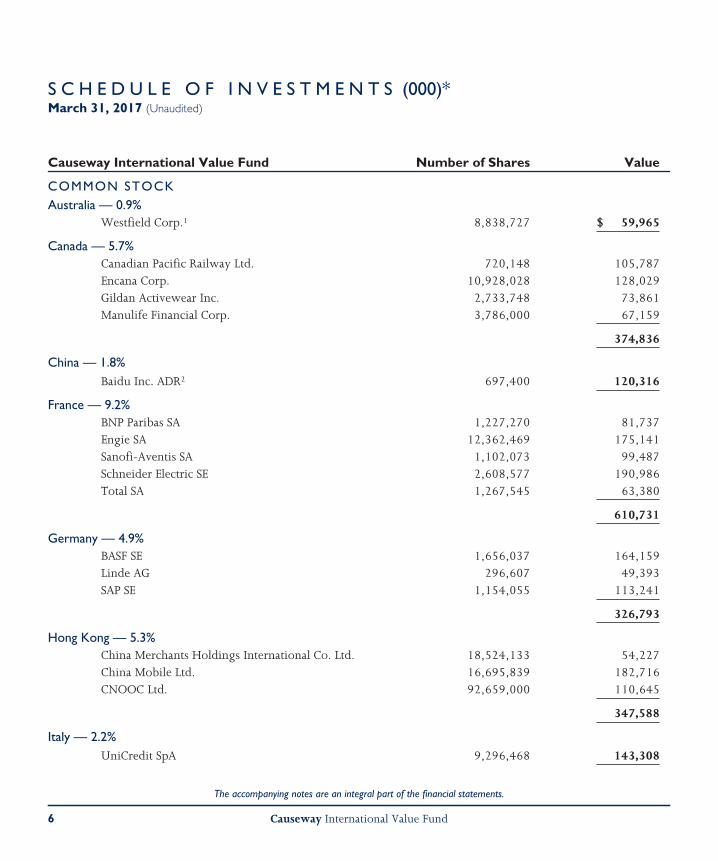
S C H E D U L E O F I N V E S T M E N T S (000)*March 31, 2017 (Unaudited)
Causeway International Value Fund Number of Shares Value
COMMON STOCKAustralia — 0.9%
Westfield Corp.1 8,838,727 $ 59,965
Canada — 5.7%Canadian Pacific Railway Ltd. 720,148 105,787Encana Corp. 10,928,028 128,029Gildan Activewear Inc. 2,733,748 73,861Manulife Financial Corp. 3,786,000 67,159
374,836
China — 1.8%Baidu Inc. ADR2 697,400 120,316
France — 9.2%BNP Paribas SA 1,227,270 81,737Engie SA 12,362,469 175,141Sanofi-Aventis SA 1,102,073 99,487Schneider Electric SE 2,608,577 190,986Total SA 1,267,545 63,380
610,731
Germany — 4.9%BASF SE 1,656,037 164,159Linde AG 296,607 49,393SAP SE 1,154,055 113,241
326,793
Hong Kong — 5.3%China Merchants Holdings International Co. Ltd. 18,524,133 54,227China Mobile Ltd. 16,695,839 182,716CNOOC Ltd. 92,659,000 110,645
347,588
Italy — 2.2%UniCredit SpA 9,296,468 143,308
The accompanying notes are an integral part of the financial statements.
6 Causeway International Value Fund

S C H E D U L E O F I N V E S T M E N T S (000)* (continued)
March 31, 2017 (Unaudited)
Causeway International Value Fund Number of Shares Value
Japan — 12.9%Asahi Group Holdings Ltd. 1,221,700 $ 46,177East Japan Railway Co. 1,850,300 161,114Hitachi Ltd. 26,401,000 142,878Japan Airlines Co. Ltd. 4,344,500 137,597KDDI Corp. 6,369,700 167,181Komatsu Ltd. 3,604,100 93,931Nikon Corp. 2,992,500 43,383Sumitomo Mitsui Financial Group Inc. 1,610,600 58,519
850,780
Netherlands — 5.0%Akzo Nobel NV 2,867,328 237,766ArcelorMittal2 5,220,425 43,918ING Groep NV 3,204,989 48,449
330,133
South Korea — 4.1%Samsung Electronics Co. Ltd. 57,193 105,354SK Telecom Co. Ltd. 735,431 165,724
271,078
Spain — 1.3%CaixaBank SA 19,298,110 82,946
Sweden — 1.0%Alfa Laval AB 3,384,505 63,870
Switzerland — 13.6%ABB Ltd. 8,179,514 191,330Aryzta AG2 2,174,975 69,810Cie Financiere Richemont SA 1,830,172 144,711Novartis AG 2,315,852 171,900Roche Holding AG 616,246 157,376UBS Group AG 2,771,221 44,350Zurich Insurance Group AG 452,913 120,909
900,386
The accompanying notes are an integral part of the financial statements.
Causeway International Value Fund 7

S C H E D U L E O F I N V E S T M E N T S (000)* (continued)
March 31, 2017 (Unaudited)
Causeway International Value Fund Number of Shares Value
United Kingdom — 26.2%AstraZeneca PLC 2,693,353 $ 165,772Aviva PLC 24,531,303 163,512Balfour Beatty PLC 18,326,317 61,857Barclays PLC 42,435,031 119,678British American Tobacco PLC 3,045,715 202,246Carnival PLC 2,102,792 120,611Cobham PLC 32,265,704 53,766Diageo PLC 2,454,992 70,237GlaxoSmithKline PLC 4,109,533 85,445Lloyds Banking Group PLC 132,143,125 109,801Prudential PLC 7,817,662 165,139Royal Dutch Shell PLC, Class B 7,780,266 212,942SSE PLC 4,311,574 79,733Vodafone Group PLC 44,209,037 115,265
1,726,004
Total Common Stock
(Cost $6,011,913) — 94.1% 6,208,734
PREFERRED STOCKGermany — 4.2%
Volkswagen AG 1,905,729 277,713
Total Preferred Stock
(Cost $327,492) — 4.2% 277,713
The accompanying notes are an integral part of the financial statements.
8 Causeway International Value Fund

S C H E D U L E O F I N V E S T M E N T S (000)* (concluded)
March 31, 2017 (Unaudited)
Causeway International Value Fund Number of Shares Value
SHORT-TERM INVESTMENTShort-Term Investments Trust: Government & Agency
Portfolio, Institutional Class, 0.610%** 117,789,044 $ 117,789
Total Short-Term Investment
(Cost $117,789) — 1.8% 117,789
Total Investments — 100.1%
(Cost $6,457,194) 6,604,236
Liabilities in Excess of Other Assets — (0.1)% (5,154)
Net Assets — 100.0% $6,599,082
* Except for share data.** The rate reported is the 7-day effective yield as of March 31, 2017.1 Real Estate Investment Trust.2 Non-income producing security.ADR American Depositary Receipt
The accompanying notes are an integral part of the financial statements.
Causeway International Value Fund 9

S E C T O R D I V E R S I F I C A T I O N
As of March 31, 2017, the sector diversification was as follows (Unaudited):
Causeway International Value FundCommon
StockPreferred
Stock% of
Net Assets
Financials 21.3% 0.0% 21.3%
Industrials 16.9 0.0 16.9
Health Care 10.3 0.0 10.3
Energy 10.3 0.0 10.3
Consumer Discretionary 5.8 4.2 10.0
Telecommunication Services 9.6 0.0 9.6
Information Technology 7.3 0.0 7.3
Materials 5.0 0.0 5.0
Utilities 3.9 0.0 3.9
Consumer Staples 2.8 0.0 2.8
Real Estate 0.9 0.0 0.9
Total 94.1 4.2 98.3
Short-Term Investment 1.8
Other Assets in Excess of Liabilities -0.1
Net Assets 100.0%
The accompanying notes are an integral part of the financial statements.
10 Causeway International Value Fund

S T A T E M E N T O F A S S E T S A N D L I A B I L I T I E S (000)*(Unaud i t ed )
CAUSEWAYINTERNATIONAL
VALUE FUND
3/31/17
ASSETS:Investments at Value (Cost $6,457,194) $6,604,236Receivable for Dividends 33,842Receivable for Tax Reclaims 19,145Receivable for Fund Shares Sold 12,833Receivable for Investment Securities Sold 4,291Prepaid Expenses 148
Total Assets 6,674,495LIABILITIES:
Payable for Fund Shares Redeemed 62,439Payable for Investment Securities Purchased 6,187Payable Due to Adviser 4,445Payable for Shareholder Service Fees — Investor Class 1,140Payable Due to Administrator 164Foreign Currency Payable (Cost $115) 115Payable for Trustees’ Fees 70Unrealized Depreciation on Spot Foreign Currency Contracts 19Other Accrued Expenses 834
Total Liabilities 75,413
Net Assets $6,599,082
NET ASSETS:Paid-in Capital (unlimited authorization — no par value) $6,932,493Undistributed Net Investment Income 37,623Accumulated Net Realized Loss on Investments and Foreign Currency Transactions (517,667)Net Unrealized Appreciation on Investments 147,042Net Unrealized Depreciation on Foreign Currencies and Translation of Other Assets and
Liabilities Denominated in Foreign Currencies (409)
Net Assets $6,599,082
Net Asset Value Per Share (based on net assets of$5,863,114,126 ÷ 392,125,293 shares) — Institutional Class $14.95
Net Asset Value Per Share (based on net assets of$735,968,036 ÷ 49,572,900 shares) — Investor Class $14.85
* Except for Net Asset Value data.
The accompanying notes are an integral part of the financial statements.
Causeway International Value Fund 11
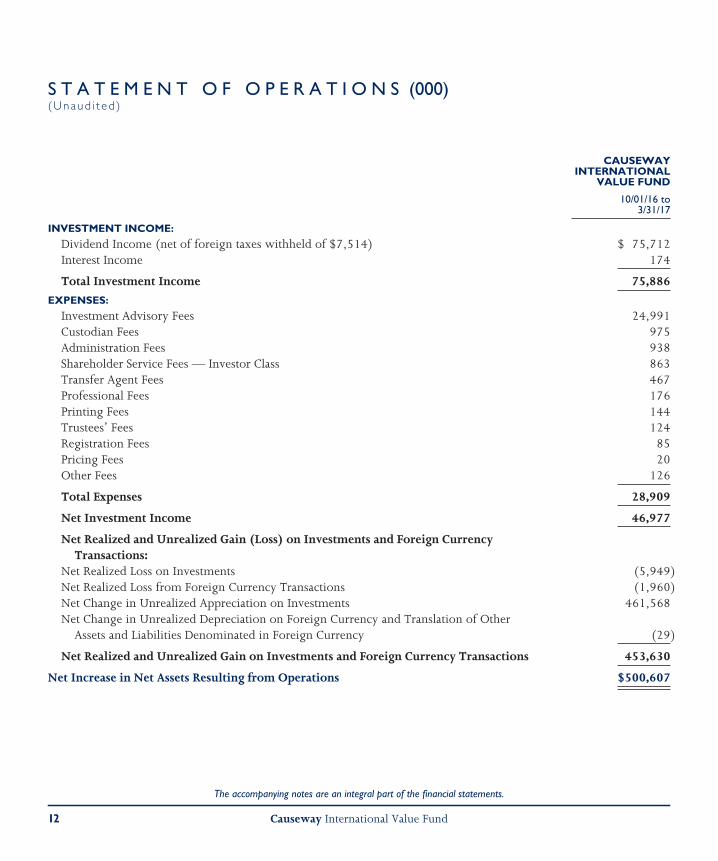
S T A T E M E N T O F O P E R A T I O N S (000)(Unaud i t ed )
CAUSEWAYINTERNATIONAL
VALUE FUND
10/01/16 to3/31/17
INVESTMENT INCOME:
Dividend Income (net of foreign taxes withheld of $7,514) $ 75,712Interest Income 174
Total Investment Income 75,886
EXPENSES:
Investment Advisory Fees 24,991Custodian Fees 975Administration Fees 938Shareholder Service Fees — Investor Class 863Transfer Agent Fees 467Professional Fees 176Printing Fees 144Trustees’ Fees 124Registration Fees 85Pricing Fees 20Other Fees 126
Total Expenses 28,909
Net Investment Income 46,977
Net Realized and Unrealized Gain (Loss) on Investments and Foreign CurrencyTransactions:
Net Realized Loss on Investments (5,949)Net Realized Loss from Foreign Currency Transactions (1,960)Net Change in Unrealized Appreciation on Investments 461,568Net Change in Unrealized Depreciation on Foreign Currency and Translation of Other
Assets and Liabilities Denominated in Foreign Currency (29)
Net Realized and Unrealized Gain on Investments and Foreign Currency Transactions 453,630
Net Increase in Net Assets Resulting from Operations $500,607
The accompanying notes are an integral part of the financial statements.
12 Causeway International Value Fund

S T A T E M E N T S O F C H A N G E S I N N E T A S S E T S (000)
CAUSEWAY INTERNATIONALVALUE FUND
10/01/16 to3/31/17
(Unaudited)
10/01/15 to9/30/16
(Audited)
OPERATIONS:
Net Investment Income $ 46,977 $ 122,351Net Realized Loss on Investments (5,949) (335,208)Net Realized Loss from Foreign Currency Transactions (1,960) (4,751)Net Change in Unrealized Appreciation on Investments 461,568 303,359Net Change in Unrealized Appreciation (Depreciation) on Foreign
Currency and Translation of Other Assets and Liabilities Denominated inForeign Currency (29) 678
Net Increase in Net Assets Resulting From Operations 500,607 86,429
DIVIDENDS AND DISTRIBUTIONS TO SHAREHOLDERS:
Dividends from Net Investment Income:Institutional Class (104,829) (117,116)Investor Class (11,049) (14,824)
Total Dividends from Net Investment Income (115,878) (131,940)
Net Decrease in Net Assets Derived from Capital Share Transactions(1) (88,439) (285,036)Redemption Fees(2) 57 246
Total Increase (Decrease) in Net Assets 296,347 (330,301)
NET ASSETS:
Beginning of Period 6,302,735 6,633,036
End of Period $6,599,082 $6,302,735
Undistributed Net Investment Income $ 37,623 $ 106,524
(1) See Note 7 in the Notes to Financial Statements.(2) See Note 2 in the Notes to Financial Statements.
The accompanying notes are an integral part of the financial statements.
Causeway International Value Fund 13
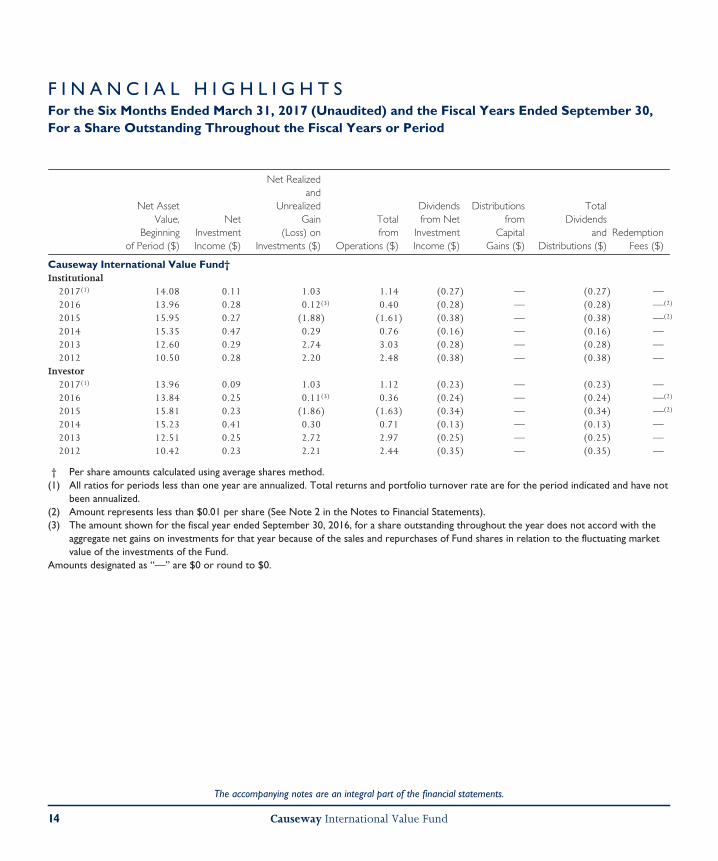
F I N A N C I A L H I G H L I G H T SFor the Six Months Ended March 31, 2017 (Unaudited) and the Fiscal Years Ended September 30,For a Share Outstanding Throughout the Fiscal Years or Period
Net AssetValue,
Beginningof Period ($)
NetInvestmentIncome ($)
Net Realizedand
UnrealizedGain
(Loss) onInvestments ($)
Totalfrom
Operations ($)
Dividendsfrom Net
InvestmentIncome ($)
Distributionsfrom
CapitalGains ($)
TotalDividends
andDistributions ($)
RedemptionFees ($)
Causeway International Value Fund†Institutional
2017(1) 14.08 0.11 1.03 1.14 (0.27) — (0.27) —2016 13.96 0.28 0.12(3) 0.40 (0.28) — (0.28) —(2)
2015 15.95 0.27 (1.88) (1.61) (0.38) — (0.38) —(2)
2014 15.35 0.47 0.29 0.76 (0.16) — (0.16) —2013 12.60 0.29 2.74 3.03 (0.28) — (0.28) —2012 10.50 0.28 2.20 2.48 (0.38) — (0.38) —
Investor2017(1) 13.96 0.09 1.03 1.12 (0.23) — (0.23) —2016 13.84 0.25 0.11(3) 0.36 (0.24) — (0.24) —(2)
2015 15.81 0.23 (1.86) (1.63) (0.34) — (0.34) —(2)
2014 15.23 0.41 0.30 0.71 (0.13) — (0.13) —2013 12.51 0.25 2.72 2.97 (0.25) — (0.25) —2012 10.42 0.23 2.21 2.44 (0.35) — (0.35) —
† Per share amounts calculated using average shares method.(1) All ratios for periods less than one year are annualized. Total returns and portfolio turnover rate are for the period indicated and have not
been annualized.(2) Amount represents less than $0.01 per share (See Note 2 in the Notes to Financial Statements).(3) The amount shown for the fiscal year ended September 30, 2016, for a share outstanding throughout the year does not accord with the
aggregate net gains on investments for that year because of the sales and repurchases of Fund shares in relation to the fluctuating marketvalue of the investments of the Fund.
Amounts designated as “—” are $0 or round to $0.
The accompanying notes are an integral part of the financial statements.
14 Causeway International Value Fund

Net AssetValue, End
of Period ($)Total
Return (%)
Net Assets,End ofPeriod($000)
Ratio ofExpenses to
Average NetAssets (%)
Ratioof Net
InvestmentIncome
to AverageNet Assets (%)
PortfolioTurnoverRate (%)
14.95 8.26 5,863,114 0.90 1.53 2014.08 2.80 5,592,874 0.91 2.03 4113.96 (10.26) 5,793,454 0.90 1.76 2815.95 5.00 5,734,313 0.91 2.89 2715.35 24.38 2,497,378 0.95 2.07 2212.60 24.29 1,204,193 0.99 2.37 21
14.85 8.18 735,968 1.15 1.29 2013.96 2.56 709,861 1.16 1.82 4113.84 (10.46) 839,582 1.15 1.48 2815.81 4.69 950,986 1.16 2.55 2715.23 24.07 649,169 1.20 1.84 2212.51 24.07 438,254 1.24 2.04 21
The accompanying notes are an integral part of the financial statements.
Causeway International Value Fund 15

N O T E S T O F I N A N C I A L S T A T E M E N T S (Unaudited)
1. Organization
Causeway International Value Fund (the “Fund”) is aseries of Causeway Capital Management Trust (the“Trust”). The Trust is an open-end managementinvestment company registered under the InvestmentCompany Act of 1940, as amended (the “1940 Act”)and is a Delaware statutory trust that was established onAugust 10, 2001. The Fund began operations onOctober 26, 2001. The Fund is authorized to offer twoclasses of shares, the Institutional Class and the InvestorClass. The Declaration of Trust authorizes the issuanceof an unlimited number of shares of beneficial interestof the Fund. The Fund is diversified. The Fund’s pro-spectus provides a description of the Fund’s investmentobjectives, policies and strategies. The Trust has fiveadditional series, the financial statements of which arepresented separately.
2. Significant Accounting Policies
The following is a summary of the significant account-ing policies consistently followed by the Fund.
Use of Estimates in the Preparation of Financial State-ments – The Fund is an investment company thatapplies the accounting and reporting guidance issued inTopic 946 by the U.S. Financial Accounting StandardsBoard. The Fund’s financial statements have been pre-pared to comply with U.S. generally accepted account-ing principles (“U.S. GAAP”). The preparation offinancial statements in conformity with U.S. GAAPrequires management to make estimates and assump-tions that affect the reported amount of net assets andliabilities and disclosure of contingent assets andliabilities at the date of the financial statements and thereported amounts of increases and decreases in netassets from operations during the reporting period.Actual results could differ from those estimates.
Security Valuation – Except as described below, securitieslisted on a securities exchange (except the NASDAQStock Market (“NASDAQ”)) or Over-the-Counter(“OTC”) for which market quotations are available arevalued at the last reported sale price as of the close ofregular trading on each business day, or, if there is nosuch reported sale, at the last reported bid price for longpositions. For securities traded on NASDAQ, the NAS-DAQ Official Closing Price is used. Securities listed onmultiple exchanges or OTC markets are valued on theexchange or OTC market considered by the Fund to bethe primary market. The prices for foreign securities arereported in local currency and converted to U.S. dollarsusing currency exchange rates. Prices for most securitiesheld in the Fund are provided daily by recognizedindependent pricing agents. If a security price cannot beobtained from an independent pricing agent, the Fundseeks to obtain a bid price from at least oneindependent broker. Investments in money marketfunds are valued daily at the net asset value per share.
Securities for which market prices are not “readily avail-able” are valued in accordance with fair value pricingprocedures approved by the Fund’s Board of Trustees(the “Board”). The Fund’s fair value pricing proceduresare implemented through a Fair Value Committee (the“Committee”) designated by the Board. Some of themore common reasons that may necessitate that a secu-rity be valued using fair value pricing proceduresinclude: the security’s trading has been halted or sus-pended; the security has been delisted from a nationalexchange; the security’s primary trading market istemporarily closed at a time when under normal con-ditions it would be open; or the security’s primary pric-ing source is not able or willing to provide a price.When the Committee values a security in accordancewith the fair value pricing procedures, the Committee
16 Causeway International Value Fund

N O T E S T O F I N A N C I A L S T A T E M E N T S (Unaudited)( con t i nued )
will determine the value after taking into considerationrelevant information reasonably available to theCommittee.
The Fund uses a third party vendor to fair value certainnon-U.S. securities if there is a movement in the U.S.market that exceeds thresholds established by theCommittee. The vendor provides fair values for foreignsecurities based on factors and methodologies involv-ing, generally, tracking valuation correlations betweenthe U.S. market and each non-U.S. security.
In accordance with the authoritative guidance on fairvalue measurements and disclosure under U.S. GAAP,the Fund discloses fair value of its investments in ahierarchy that prioritizes the inputs to valuation tech-niques used to measure the fair value. The objective of afair value measurement is to determine the price thatwould be received to sell an asset or paid to transfer aliability in an orderly transaction between marketparticipants at the measurement date (an exit price).Accordingly, the fair value hierarchy gives the highestpriority to quoted prices (unadjusted) in active marketsfor identical assets or liabilities (Level 1) and the lowestpriority to unobservable inputs (Level 3). The guidanceestablishes three levels of fair value hierarchy as follows:
• Level 1 — Unadjusted quoted prices in activemarkets for identical, unrestricted assets orliabilities that the Fund has the ability to access atthe measurement date;
• Level 2 — Quoted prices in markets which are notactive, or prices based on inputs that areobservable (either directly or indirectly) for sub-stantially the full term of the asset or liability; and
• Level 3 — Prices, inputs or exotic modeling tech-niques which are both significant to the fair value
measurement and unobservable (supported by lit-tle or no market activity).
Investments are classified within the level of the lowestsignificant input considered in determining fair value.Investments classified within Level 3 which fair valuemeasurement considers several inputs may includeLevel 1 or Level 2 inputs as components of the overallfair value measurement.
The following table sets forth information about thelevels within the fair value hierarchy at which theFund’s investments are measured at March 31, 2017(000):Investments inSecurities Level 1 Level 2† Level 3 Total
Common StockAustralia $ 59,965 $ — $— $ 59,965Canada 374,836 — — 374,836China 120,316 — — 120,316France 610,731 — — 610,731Germany 326,793 — — 326,793Hong Kong 110,645 236,943 — 347,588Italy 143,308 — — 143,308Japan 850,780 — — 850,780Netherlands 330,133 — — 330,133South Korea 271,078 — — 271,078Spain 82,946 — — 82,946Sweden 63,870 — — 63,870Switzerland 900,386 — — 900,386United Kingdom 1,726,004 — — 1,726,004
Total CommonStock 5,971,791 236,943 — 6,208,734
Preferred StockGermany 277,713 — — 277,713
Short-TermInvestment 117,789 — — 117,789
Total Investments inSecurities $6,367,293 $236,943 $— $6,604,236
† Holdings represent securities trading outside the United States,the values of which were adjusted as a result of significant marketmovements following the close of local trading. Securities with a
Causeway International Value Fund 17

N O T E S T O F I N A N C I A L S T A T E M E N T S (Unaudited)( con t i nued )
value of $5,633,767 (000), which represented 85.4% of the netassets of the Fund, transferred at period end from Level 2 toLevel 1 since the prior fiscal year end, primarily due to marketmovements following the close of local trading that triggered thefair valuation of certain securities at the beginning of the periodand did not trigger fair valuation at the end of the period. AtMarch 31, 2017, there were no transfers from Level 1 to Level 2investments in securities.
Please refer to the Schedule of Investments for addi-tional information regarding the composition of theamounts listed above.
Changes in valuation techniques may result in transfers inor out of an investment’s assigned level within the hier-archy during the reporting period. Changes in the classi-fication between Levels 1 and 2 at end of period occurprimarily when foreign equity securities are fair valued bythe Fund’s third party vendor using other observablemarket-based inputs in place of closing exchange pricesdue to events occurring after foreign market closures.
For the six months ended March 31, 2017, there were nosignificant changes to the Fund’s fair value methodologies.
Federal Income Taxes – The Fund intends to continue toqualify as a regulated investment company under Sub-chapter M of the Internal Revenue Code and to distrib-ute all of its taxable income. Accordingly, no provisionfor Federal income taxes has been made in the financialstatements.
The Fund evaluates tax positions taken or expected to betaken in the course of preparing the Fund’s tax returnsto determine whether it is “more-likely-than not” (e.g.,greater than 50-percent) that each tax position will besustained upon examination by a taxing authority basedon the technical merits of the position. Tax positionsnot deemed to meet the more-likely-than-not thresholdare recorded as a tax benefit or expense in the currentyear. The Fund did not record any tax provision in thecurrent period. However, management’s conclusions
regarding tax positions taken may be subject to reviewand adjustment at a later date based on factors includ-ing, but not limited to, examination by tax authorities(e.g., the last 3 tax years, as applicable), and on-goinganalysis of and changes to tax laws, regulations andinterpretations thereof.
As of and during the six months ended March 31,2017, the Fund did not have a liability for anyunrecognized tax benefits. The Fund recognizes interestand penalties, if any, related to unrecognized tax bene-fits as income tax expense in the Statement of Oper-ations. During the period, the Fund did not incur anysignificant interest or penalties.
Security Transactions and Related Income – Securitytransactions are accounted for on the date the security ispurchased or sold (trade date). Dividend income isrecognized on the ex-dividend date, and interestincome is recognized using the accrual basis of account-ing. Costs used in determining realized gains and losseson the sales of investment securities are those of thespecific securities sold.
Foreign Currency Translation – The books and records ofthe Fund are maintained in U.S. dollars on the follow-ing basis:
(1) the market value or fair value of investmentsecurities, assets and liabilities is converted at thecurrent rate of exchange; and
(2) purchases and sales of investment securities,income and expenses are converted at the relevantrates of exchange prevailing on the respective datesof such transactions.
The Fund does not isolate that portion of gains andlosses on investments in equity securities that is due tochanges in the foreign exchange rates from that whichis due to changes in market prices of equity securities.
18 Causeway International Value Fund

N O T E S T O F I N A N C I A L S T A T E M E N T S (Unaudited)( con t i nued )
Foreign Currency Exchange Contracts – When the Fundpurchases or sells foreign securities, it enters into corre-sponding foreign currency exchange contracts to settlethe securities transactions. Losses from these foreignexchange transactions may arise from changes in thevalue of the foreign currency between trade date andsettlement date or if the counterparties do not performunder the contract’s terms.
Expense/Classes – Expenses that are directly related toone Fund of the Trust are charged directly to that Fund.Other operating expenses of the Trust are prorated tothe Fund and the other series of the Trust on the basisof relative daily net assets. Class specific expenses areborne by that class of shares. Income, realized andunrealized gains/losses and non-class specific expensesare allocated to the respective classes on the basis ofrelative daily net assets.
Dividends and Distributions – Dividends from net invest-ment income, if any, are declared and paid on an annualbasis. Any net realized capital gains on sales of securitiesare distributed to shareholders at least annually.
Redemption Fee – The Fund imposes a redemption feeof 2% on the value of capital shares redeemed by share-holders less than 60 days after purchase. Theredemption fee also applies to exchanges from theFund. The redemption fee is paid to the Fund. Theredemption fee does not apply to shares purchasedthrough reinvested distributions or shares redeemedthrough designated systematic withdrawal plans. Theredemption fee does not normally apply to accountsdesignated as omnibus accounts with the transfer agent.These are arrangements through financial intermediarieswhere the purchase and sale orders of a number ofpersons are aggregated before being communicated tothe Fund. However, the Fund may seek agreementswith these intermediaries to impose the Fund’s
redemption fee or a different redemption fee on theircustomers if feasible, or to impose other appropriaterestrictions on excessive short-term trading. The officersof the Fund may waive the redemption fee for share-holders in asset allocation and similar investment pro-grams believed not to be engaged in short-term markettiming, including for holders of shares purchased byCauseway Capital Management LLC (the “Adviser”) forits clients to rebalance their portfolios. For the sixmonths ended March 31, 2017, the InstitutionalClass and Investor Class retained $53,308 and $3,712 inredemption fees, respectively.
Other – Brokerage commission recapture payments arecredited to realized capital gains and are included in netrealized gains from security transactions on the State-ment of Operations. For the six months endedMarch 31, 2017, the Fund received commissionrecapture payments of $93,146.
3. Investment Advisory, Administration, ShareholderService and Distribution Agreements
The Trust, on behalf of the Fund, has entered into anInvestment Advisory Agreement (the “AdvisoryAgreement”) with the Adviser. Under the AdvisoryAgreement, the Adviser is entitled to a monthly feeequal to an annual rate of 0.80% of the Fund’s averagedaily net assets. The Adviser has contractually agreedthrough January 31, 2018 to waive its fee and, to theextent necessary, reimburse the Fund to keep totalannual fund operating expenses (excluding broker-age fees and commissions, interest, taxes, shareholderservice fees, fees and expenses of other funds in whichthe Fund invests, and extraordinary expenses) fromexceeding 1.05% of Institutional Class and InvestorClass average daily net assets. No waivers orreimbursements were required for the six monthsended March 31, 2017.
Causeway International Value Fund 19

N O T E S T O F I N A N C I A L S T A T E M E N T S (Unaudited)( con t i nued )
The Trust and SEI Investments Global Funds Services(the “Administrator”) have entered into an Admin-istration Agreement. Under the terms of the Admin-istration Agreement, the Administrator is entitled to anannual fee which is calculated daily and paid monthlybased on the aggregate average daily net assets of theTrust subject to a minimum annual fee.
The Trust has adopted a Shareholder Service Plan andAgreement for Investor Class shares that allows theTrust to pay broker-dealers and other financial inter-mediaries a fee of up to 0.25% per annum of averagedaily net assets for services provided to InvestorClass shareholders. For the six months ended March 31,2017, the Investor Class paid 0.25% annualized of aver-age daily net assets under this plan.
The Trust and SEI Investments Distribution Co. (the“Distributor”) have entered into a Distribution Agree-ment. The Distributor receives no fees from the Fundfor its distribution services under this agreement.
The officers of the Trust are also officers or employeesof the Administrator or Adviser. They receive no feesfor serving as officers of the Trust.
As of March 31, 2017, approximately $8.666 million ofnet assets were held by affiliated investors.
4. Investment Transactions
The cost of security purchases and the proceedsfrom the sales of securities, other than short-terminvestments, during the six months ended March 31,2017, for the Fund were as follows (000):
Purchases Sales
$1,268,849 $1,258,931
5. Risks of Foreign Investing
Because the Fund invests most of its assets in foreignsecurities, the Fund is subject to risks in addition tothose of U.S. securities. For example, the value of theFund’s securities may be affected by social, political andeconomic developments and U.S. and foreign lawsrelating to foreign investment. Further, because theFund invests in securities denominated in foreign cur-rencies, the Fund’s securities may go down in valuedepending on foreign exchange rates. Other risksinclude trading, settlement, custodial, and other opera-tional risks; withholding or other taxes; and the lessstringent investor protection and disclosure standards ofsome foreign markets. All of these factors can makeforeign securities less liquid, more volatile and harderto value than U.S. securities. These risks are higher foremerging markets investments.
6. Federal Tax Information
The Fund is classified as a separate taxable entity forFederal income tax purposes. The Fund intends to con-tinue to qualify as a separate “regulated investmentcompany” under Subchapter M of the Internal RevenueCode and make the requisite distributions to share-holders that will be sufficient to relieve it from Federalincome tax and Federal excise tax. Therefore, no Federaltax provision is required. To the extent that dividendsfrom net investment income and distributions from netrealized capital gains exceed amounts reported in thefinancial statements, such amounts are reportedseparately.
The Fund may be subject to taxes imposed by countriesin which it invests in issuers existing or operating insuch countries. Such taxes are generally based onincome earned. The Fund accrues such taxes when therelated income is earned. Dividend and interest incomeis recorded net of non-U.S. taxes paid.
20 Causeway International Value Fund

N O T E S T O F I N A N C I A L S T A T E M E N T S (Unaudited)( con t i nued )
The amounts of distributions from net investmentincome and net realized capital gains are determined inaccordance with Federal income tax regulations, whichmay differ from those amounts determined under U.S.GAAP. These book/tax differences are either temporaryor permanent in nature. The character of distributionsmade during the year from net investment income ornet realized gains, and the timing of distributions madeduring the year may differ from those during the yearthat the income or realized gains (losses) were recordedby the Fund. To the extent these differences are perma-nent, adjustments are made to the appropriate equityaccounts in the period that the differences arise.
The tax character of dividends and distributionsdeclared during the fiscal years ended September 30,2016 and September 30, 2015 were as follows (000):
OrdinaryIncome Total
2016 $131,940 $131,940
2015 157,587 157,587
As of September 30, 2016, the components of distrib-utable earnings on a tax basis were as follows (000):
Undistributed Ordinary Income $ 108,424Capital Loss Carryforwards (138,403)Unrealized Depreciation (365,645)Post October Losses (322,512)Other Temporary Differences (4)
Total Accumulated Losses $(718,140)
Post-October Losses represent losses realized on secu-rities and currency transactions from November 1,2015 through September 30, 2016 that, in accordancewith Federal income tax regulations, the Fund may electto defer and treat as having arisen in the following fiscalyear.
For Federal income tax purposes, capital losses incurredin taxable years beginning before December 22, 2010
may be carried forward for a maximum period of eightyears and applied against future net realized gains. Thefollowing summarizes the pre-enactment capital losscarryforwards as of September 30, 2016 (000):
Expiring in Fiscal Year Amount
2018 $74,556
Total pre-enactment capital loss carryforwards $74,556
Under the Regulated Investment Company Moderniza-tion Act of 2010, the Fund is permitted to carry for-ward capital losses incurred in taxable years beginningafter December 22, 2010 for an unlimited period.However, any losses incurred during those future tax-able years are required to be used prior to the lossesincurred in pre-enactment taxable years. As a result ofthis ordering rule, pre-enactment capital loss carryfor-wards may be more likely to expire unused. Addition-ally, post-enactment capital losses that are carriedforward will retain their character as either short-termor long-term capital losses rather than being consideredall short-term as under previous law. Losses carriedforward are as follows (000):
Short-Termpost-
enactmentLoss
Long-Termpost-
enactmentLoss Total*
$63,847 $— $63,847
* This table should be used in conjunction with the pre-enactmentcapital loss carryforwards table.
At March 31, 2017, the total cost of securities forFederal income tax purposes and the aggregate grossunrealized appreciation and depreciation on investmentsecurities for the Fund were as follows (000):
FederalTax Cost
AppreciatedSecurities
DepreciatedSecurities
NetUnrealized
Appreciation
$6,457,194 $524,496 $(377,454) $147,042
Causeway International Value Fund 21

N O T E S T O F I N A N C I A L S T A T E M E N T S (Unaudited)( con t i nued )
7. Capital Shares Issued and Redeemed (000)Six Months Ended
March 31, 2017 (Unaudited)Fiscal Year Ended
September 30, 2016 (Audited)
Shares Value Shares Value
Institutional ClassShares Sold 51,080 $ 727,307 197,250 $ 2,725,099Shares Issued in Reinvestment of
Dividends and Distributions 6,847 94,769 7,425 106,098Shares Redeemed (62,929) (893,338) (222,603) (2,990,262)
Decrease in Shares OutstandingDerived from InstitutionalClass Transactions (5,002) (71,269) (17,928) (159,065)
Investor ClassShares Sold 6,248 87,831 14,077 190,671Shares Issued in Reinvestment of
Dividends and Distributions 777 10,681 959 13,624Shares Redeemed (8,284) (115,689) (24,860) (330,266)
Decrease in Shares OutstandingDerived from Investor Class Transactions (1,259) (17,177) (9,824) (125,971)
Decrease in Shares Outstanding fromCapital Share Transactions (6,261) $ (88,439) (27,752) $ (285,036)
8. Significant Shareholder Concentration
As of March 31, 2017, two of the Fund’s shareholdersof record owned 37% of net assets in the InstitutionalClass. The Fund may be adversely affected when ashareholder purchases or redeems large amounts ofshares, which may impact the Fund in the same manneras a high volume of redemption requests. Such largeshareholders may include, but are not limited to, otherfunds, institutional investors, and asset allocators whomake investment decisions on behalf of underlyingclients. Significant shareholder purchases andredemptions may adversely impact the Fund’s portfoliomanagement and may cause the Fund to make invest-ment decisions at inopportune times or prices or missattractive investment opportunities. Such transactionsmay also increase the Fund’s transaction costs, accel-erate the realization of taxable income if sales of secu-
rities result in gains, or otherwise cause the Fund toperform differently than intended.
9. Indemnifications
Under the Trust’s organizational documents, eachTrustee, officer, employee or other agent of the Trust isindemnified against certain liabilities that may arise outof the performance of his or her duties to the Fund.Additionally, in the normal course of business, the Fundenters into contracts, including the Fund’s servicingagreements, that contain a variety of indemnificationclauses. The Fund’s maximum exposure under thesearrangements is unknown as this would involve futureclaims that may be made against the Fund that have notyet occurred. The risk of material loss as a result of suchindemnification claims is considered remote.
22 Causeway International Value Fund

N O T E S T O F I N A N C I A L S T A T E M E N T S (Unaudited)( conc l uded )
10. Subsequent Events
The Fund has evaluated the need for disclosures and/oradjustments resulting from subsequent events throughthe date the financial statements were available to beissued. Based on this evaluation, no adjustments wererequired to the financial statements.
Causeway International Value Fund 23

D I S C L O S U R E O F F U N D E X P E N S E S (Unaudited)
As a shareholder of the Fund, you incur two types of costs: (1) transaction costs, including redemption fees, and(2) ongoing costs, including management fees, shareholder service fees, and other Fund expenses. It is important foryou to understand the impact of these costs on your investment returns.
Ongoing operating expenses are deducted from a mutual fund’s gross income and directly reduce its final investmentreturn. These expenses are expressed as a percentage of a mutual fund’s average net assets; this percentage is known asa mutual fund’s expense ratio.
The following examples use the expense ratio and are intended to help you understand the ongoing costs (in dollars)of investing in the Fund and to compare these costs with those of other mutual funds. The examples are based on aninvestment of $1,000 made at the beginning of the period shown and held for the entire period (October 1, 2016 toMarch 31, 2017).
The table on the next page illustrates the Fund’s costs in two ways:
Actual Fund Return. This section helps you to estimate the actual expenses after fee waivers that the Fund incurredover the period. The “Expenses Paid During Period” column shows the actual dollar expense cost incurred by a$1,000 investment in the Fund, and the “Ending Account Value” number is derived from deducting that expense costfrom the Fund’s gross investment return.
You can use this information, together with the actual amount you invested in the Fund, to estimate the expenses youpaid over that period. Simply divide your actual account value by $1,000 to arrive at a ratio (for example, an $8,600account value divided by $1,000 = 8.6), then multiply that ratio by the number shown under “Expenses Paid DuringPeriod.”
Hypothetical 5% Return. This section helps you compare the Fund’s costs with those of other mutual funds. Itassumes that the Fund had an annual 5% return before expenses during the year, but that the expense ratio(Column 3) for the period is unchanged. This example is useful in making comparisons because the Securities andExchange Commission requires all mutual funds to make this 5% calculation. You can assess the Fund’s comparativecost by comparing the hypothetical result for the Fund in the “Expenses Paid During Period” column with those thatappear in the same charts in the shareholder reports for other mutual funds.
NOTE: Because the return is set at 5% for comparison purposes — NOT the Fund’s actual return — the account valuesshown may not apply to your specific investment.
24 Causeway International Value Fund

D I S C L O S U R E O F F U N D E X P E N S E S (Unaudited)( conc l uded )
BeginningAccount
Value10/01/16
EndingAccount
Value03/31/17
AnnualizedExpenseRatios
ExpensesPaid
DuringPeriod*
Causeway International Value Fund
Actual Portfolio ReturnInstitutional Class $1,000.00 $1,082.60 0.90% $4.66
Hypothetical 5% ReturnInstitutional Class $1,000.00 $1,020.46 0.90% $4.52
Causeway International Value Fund
Actual Portfolio ReturnInvestor Class $1,000.00 $1,081.80 1.15% $5.95
Hypothetical 5% ReturnInvestor Class $1,000.00 $1,019.22 1.15% $5.77
* Expenses are equal to the Fund’s annualized expense ratio multiplied by the average account value over the period, multiplied by 182/365 (toreflect the one-half year period).
Causeway International Value Fund 25

N O T E S

N O T E S
INVESTMENT ADVISER:Causeway Capital Management LLC11111 Santa Monica Boulevard15th FloorLos Angeles, CA 90025
DISTRIBUTOR:SEI Investments Distribution Co.One Freedom Valley DriveOaks, PA 19456
TO OBTAIN MORE INFORMATION:Call 1-866-947-7000 or visit us online atwww.causewayfunds.com
This material must be preceded or accompanied by acurrent prospectus.
The Fund files its complete schedule of portfolioholdings with the Securities and ExchangeCommission (“Commission”) for the first and thirdquarters of each fiscal year on Form N-Q within sixtydays after the end of the period. The Fund’s FormsN-Q are available on the Commission’s website athttp://www.sec.gov, and may be reviewed and copiedat the Commission’s Public Reference Room inWashington, DC. Information on the operation of thePublic Reference Room may be obtained by calling1-800-SEC-0330.
A description of the policies and procedures that theFund uses to determine how to vote proxies relatingto portfolio securities, as well as information relatingto how the Trust voted proxies relating to portfoliosecurities during the most recent 12-month periodended June 30, is available (i) without charge, uponrequest, by calling 1-866-947-7000; and (ii) on theCommission’s website at http://www. sec.gov.
CCM-SA-003-1000
> SEMI-ANNUAL REPORTMARCH 31, 2017
Causeway InternationalValue Fund