Table of Contents - Caribbean - RBC · PDF fileManagement Discussion & Analysis 3 ... the...
87
Annual Report 2008 1 Table of Contents Chairman’s Report 2 Management Discussion & Analysis 3 Report of the Directors 5 Independent Auditors’ Report 7 Consolidated Balance Sheet 8 Consolidated Income Statement 9 Consolidated Statement of Changes in Equity 10 Consolidated Cash Flow Statement 11 Notes to the Consolidated Financial Statements 12–87
Transcript of Table of Contents - Caribbean - RBC · PDF fileManagement Discussion & Analysis 3 ... the...

Annual Report 2008 1
Table of Contents
Chairman’s Report 2
Management Discussion & Analysis 3
Report of the Directors 5
Independent Auditors’ Report 7
Consolidated Balance Sheet 8
Consolidated Income Statement 9
Consolidated Statement of Changes in Equity 10
Consolidated Cash Flow Statement 11
Notes to the Consolidated Financial Statements 12–87

Annual Report 20082
An Historic YearThis has been an eventful and historic year for the RBTT Group.
On October 2, 2007, the Royal Bank of Canada and the RBTT
Financial Group jointly announced an agreement to combine
RBC’s Caribbean retail banking operations with RBTT through the
acquisition of RBTT. The Board of Directors voted unanimously in
favour of the transaction, and the announcement ended months
of speculation about the future of RBTT.
Shareholders voted resoundingly in favour of the resolution to
amalgamate the two organisations at a Special Shareholders’
Meeting on March 26, 2008 with more than 98% of the votes
cast in support.
On June 16, RBC completed the sale, paying US$2.2 billion to
RBTT shareholders, 60% in cash and 40% in RBC shares.
The amalgamation with RBC has significantly extended our
banking network in the Caribbean. We now have a presence in
18 countries across the region, from the Bahamas in the North to
Suriname in the South. It has also connected RBTT to Canada’s
largest bank, and one of the world’s most highly rated financial
institutions.
This development not only ensures the further expansion of
the great franchise we have created over the years, it heralds
increased opportunities for our customers and employees.
Equally as important, it has provided our shareholders, with the
ability to realise an attractive return on their RBTT investment,
and have a stake in one of the world’s best-performing financial
institutions.
Technological TransformationDuring the year, we made significant progress with the Recast
project. The project, which involves the conversion of RBTT’s
business processes and technology onto a single platform, is
expected to be completed by December 2008. So far, Antigua;
St. Vincent and Bequia; and St Lucia have been converted.
Group Performance – Financial HighlightsFor the fiscal year ended March 31, 2008, the Group recorded
pre-tax earnings of $1,309 million, an improvement of 11% over
the previous year. This growth was underpinned by a strong
growth in net interest income of 10% generated by the Retail
and Commercial banking entities. Pre-tax earnings for the fourth
quarter were $401 million, an increase over the comparable
period last year of 26%.
Chairman’s Report
Profit attributable to shareholders remained flat over last year as
the Group’s tax charge increased significantly by $124 million or
50% over the previous year, due to several factors which include
higher taxable income generated by retail banking entities,
increased provisions for tax assessments and changes to the tax
legislation in one jurisdiction. Consequently, diluted earnings per
share remained the same as last year at $2.71.
The Retail and Commercial Banking units performed strongly,
with pre-tax earnings increasing by 31%. Our Investment Banking
business recorded a decline in earnings of 5%, while profits from
our Trust and Asset Management business fell marginally by 3%
in a period of sluggish market conditions.
Total assets increased by 11% or $5 billion to $53 billion,
principally due to growth in loans and advances of 12%.
Customer deposits also grew strongly by 13%.
The Directors declared a final dividend of 65¢ per share, which
was paid on May 28, 2008 to shareholders on record as at May
16, 2008, bringing the full-year dividend to $1.25 per share.
A Management Discussion & Analysis of the Group’s performance
is provided later in this report.
Board of DirectorsI would like to specially recognise and express my appreciation to
the members of the Board for their strong interest and insightful
contribution, which has helped to bring the organisation to where
it is today. I also thank retired Directors Arthur Lok Jack, Rodney
Prasad, Gaston Aguilera, Peter Ganteaume and John Andrews,
for the valued roles that they played in the process. I wish them
well in all their future endeavours.
Together ForwardI conclude this report by reiterating my positive outlook for the
combined RBC/RBTT entity. It is an exciting time in which we
have the opportunity to capitalise on the many advantages that
come with being a member of a distinguished global financial
services provider. I am confident that, together, we will elevate
the standard of banking in the Caribbean and make an indelible
mark in the industry.
Peter J. JulyChairman

Annual Report 2008 3
Management Discussion & Analysis
This Management Discussion and Analysis (MD&A) is provided to enable the reader to assess our financial condition and the results of our operation for the financial year ended March 31, 2008. This MD&A should be carefully read in conjunction with our consolidated financial statements and accompanying notes prepared in accordance with International Financial Reporting Standards (IFRS).
The fiscal year end of the parent company and some of its primary
operating subsidiaries is March 31 while other subsidiaries have a
fiscal year end of December 31. All dollar amounts in this MD&A
are in Trinidad and Tobago Dollars (TT$), unless otherwise stated.
Foreign currencies have been translated into TT$ at the average
of the Group’s bid and offer rates in Trinidad and Tobago for
the respective foreign currencies prevailing on March 31 of each
financial year.
Consolidated Results From Operations•Pre-taxearningswere$1,309million,up11%fromtheprior
year;
•Retail Bankingwas up 31%,while Investment Banking and
Trust and Asset Management business were down 5% and
3% respectively;
•Profitattributabletoshareholderswas$931million,thesame
as last year;
•Totalnetincomewas$3,327million,up10%fromtheprior
year;
•Costofcreditwasdown12%againsttheprioryear;
•Non-interest expenseswere$2,012million, up10%against
the prior year;
•Taxexpensewas$371million,up$124millionor50%over
the prior year.
Key Transactions and Events•OnOctober1,2007,RBTTFinancialGroup(RBTT)enteredinto
an agreement with Royal Bank of Canada (RBC) to combine
RBC’s Caribbean retail banking operations with RBTT through
the acquisition of RBTT for a total purchase consideration of
TT$13.8 billion (approximately US$2.2 billion at exchange
rate as of September 28, 2007). Under the agreement, RBTT
shareholders were offered a per share consideration of TT$40
payable in a combination of cash (60%) and RBC common
shares (40%). The number of RBC common shares received
by RBTT shareholders is subject to a plus or minus 10% collar
based on an RBC share price of US $54.42.
At a Special Meeting of the shareholders of RBTT held on
March 26, 2008, the amalgamation resolution was approved
by 98.2% of the votes cast by holders of ordinary shares.
The transaction was closed on June 16, 2008.
• InDecember2007,thebanksinAntigua,St.VincentandBequia
were converted to the new Temenos T-24 banking software
application system. This represented the first conversion of full
banking entities under the Recast Program.
Adoption of New and Revised Accounting Standards During the financial year the Group adopted IFRS 7 – Financial
Instruments: Disclosures and the complementary amendment
to IAS 1 – Capital disclosures. Both standards introduced new
disclosures relating to financial instruments and did not have any
impact on the valuation of the Group’s financial statements. The
standard requires the disclosure of qualitative and quantative
information about exposure to risks arising from financial
instruments.
ProfitsConsolidated pre-tax profits for the twelve months ended
March 31, 2008, were $1,309 million, an increase over last year
of $128 million or 11%. This growth was largely evident in the
fourth quarter which experienced year on year growth of 26%,
compared to 5%, 2% and 9% in the first, second and third
quarters respectively.
The results for the twelve months were influenced by strong
growth in net interest income of 14%, but sluggish growth in
non-interest income of 4.5%, resulting in growth in total net
income of 10%. On the expenses side, operating expenses
increased by 10%, resulting in a 10% growth in margin. Cost of
credit declined from the level of the previous year by 12%.
At the business segment level, the pre-tax profits performance
was consistent over the four quarters of the year, with retail
banking entities experiencing growth of 31%, underpinned
by strong growth performances from all the retail banking
groupings. By contrast, the Investment banking and Trust and
Asset management business segments experienced declines in
profitability of 5% and 3% respectively.
Profit attributable to shareholders for the twelve months was
$931 million, the same as last year, due largely to the increase in
the Group’s tax charge for the period of $124 million or 50%.
The diluted earnings per share remained flat at $2.71.

Annual Report 20084
IncomeTotal net income for the year was $3,327 million compared to
$3,026 million one year ago, an increase of $301 million or 10%.
Net interest income, which contributed $2,095 million or 63%
of total net income, grew solidly by 13.5%, while other income
(non-interest income), which contributed the remaining 37%,
grew sluggishly by 4%.
Net Interest IncomeThe strong growth in net interest income of 13.5% was
attributable to the healthy loan growth generated by the retail
business segment, coupled with the redeployment of cash
balances held by the Merchant Bank at the beginning of the
year into higher yielding investments. Loans in the retail business
segment grew by $3 billion during the year.
The net interest spread, which measures the profitability of the
Group’s intermediation business, showed that during the twelve-
month period, loan yields increased by 16 basis points over last
year with the installment loans, corporate demand loans and
mortgages contributing the major part of the improved returns.
By contrast, investment securities showed a decline in yield of four
basis points. On the funding side, cost of funds declined over last
year by 16 basis points. These positive occurrences contributed to
an improvement in the net interest spread of six basis points from
4.11% last year to 4.17% in the current period.
Non-Interest IncomeNon-interest income grew sluggishly over last year by $53 million
or 4%. The low rate of growth during the year was primarily as a
result of the performance of the fee and commissions earnings,
which declined by $51 million or 6%.
Non-Interest Expenses Non-interest expenses, excluding provisions for credit losses,
increased by $180 million or 10% over last year. The categories
of expenses that showed the most significant increases were
staff costs, which increased by $31 million or 3%, technology
expenses, which increased by $32 million or 19%, and other
expenses, which increased by $112 million or 26%.
The Group’s efficiency ratio for the year ended March 31, 2008,
as measured by the expression of operating expenses as a
percentage of total net income, was 61%, the same as last year.
This occurred because the 10% increase in total net income was
mirrored by the increase in operating expenses for the period.
Cost of Credit Cost of credit for the year declined by $3.5 million or 12%
compared with last year. The reduction reflects the lower amount
of provisions made in 2008 because of improvement in the credit
quality of the loan and investment securities portfolios.
Balance Sheet Highlights Over the twelve months to March 31, 2008, total assets increased
by $4.9 billion or 10%, with loans and advances accounting
for the most significant share ($2.6 billion) of the increase. The
growth in assets was funded largely by customers’ deposits, which
increased by $3.7 billion or 13%. Other significant movements
include investment securities and balances with Central Banks,
each of which increased by $0.8 billion.
Loans and Advances to CustomersLoans and Advances to customers grew by $2.6 billion or 11.8%
during the year. This growth occurred primarily in demand loans
($1.2 billion or 11.6%), mortgages ($485 million or 10.6%) and
installment loans ($496 million or 12.6%).
RBTT Bank N.V. and its subsidiaries grew their loans by
$1.081 billion or 17%, RBTT Bank Limited’s loans grew by
$561 million or 6.4%, the Eastern Caribbean’s grew by
$547 million or 35.1%, and RBTT Bank Jamaica Limited grew by
$515 million or 21.8%.
Deposit LiabilitiesCustomers’ deposits grew by $3.7 billion or 13% over the year
ended March 31, 2008. Term deposit balances led the growth
with $2.2 billion or 22.3%. This growth was attributable in
the main to RBTT Bank Limited, whose term deposit balances
increased by $1.5 billion, representing 68% of the Group’s
increase. Current account balances increased by $828 million
or 10.8% with major contributions from the Dutch Caribbean
($256 million) and RBTT Jamaica Limited ($158 million). Savings
balances increased by $662 million or 10.8%, of which the Dutch
Caribbean contributed $515 million.
Shareholders’ EquityShareholders’ equity increased by $647 million or 14.7%. This
increase includes the movement in retained profits for the year
of $372 million and an increase in the investment revaluation
reserve account balance of $173 million, mostly attributable to
the positive changes in value of the GHL shares held and the
available-for-sale portfolio of structured products.
Management Discussion & Analysis (continued)

Annual Report 2008 5
The Directors hereby submit their Report for the year ended March 31, 2008.
Consolidated Financial Results and Dividends TT$’000
Profit attributable to shareholders 931,139
Transfer to Statutory Reserve (78,761)
Transfers to General Banking Risk Reserve (25,996)
Other Reserves Movements (24,017)
Dividends:
Final Dividend of 65 cents for year ended March 31, 2007 paid on June 18, 2007 (223,466)
Interim Dividend of 60 cents per share paid on November 22, 2007 (206,439)
Total Dividend paid in financial year (429,905)
Retained Profits at beginning of year 2,929,660
Retained Profits at end of year 3,302,120
Directors’ and Substantial InterestsWe record hereunder particulars of the interest of each director of the Company and substantial interests in the Capital of the
Company as at the end of the Company’s Financial year, March 31, 2008:
DIRECTORS’ INTEREST
FULLY PAID UP ORDINARY SHARES
MARCH 31, 2008
DIRECTORS Beneficial Non-Beneficial
Peter July 975,461 Nil
Gaston Aguilera 143,011 Nil
John Andrews 60,000 Nil
Robert Bermudez 126,678 Nil
Garth Chatoor 49,000 Nil
Martin Daly, S.C. 6,098 Nil
Arthur Lok Jack 700,000 Nil
Miguel Pourier Nil Nil
Rodney Prasad 50,138 Nil
Suresh Sookoo 102,900 Nil
Gary Voss 7,920 Nil
Brian Young Nil Nil
SUBSTANTIAL INTERESTS as at March 31, 2008
SHAREHOLDERS FULLY PAID UP ORDINARY SHARES % OF ISSUED SHARE CAPITAL
National Insurance Board 69,377,607 20.18
Guardian Holdings Group 42,880,499 12.46
A substantial interest is a holding of 10% or more of the Issued Capital of the Company.
Report of the Directors

Annual Report 20086
Annual Meeting
Section 109 of the Companies Act, Chap. 81:01 states that the directors of a Company shall call an Annual Meeting of Shareholders
not later than fifteen (15) months after holding the last preceding Annual Meeting.
The 2008 Annual Meeting of RBTT Financial Holdings Limited was scheduled for July. No Annual Meeting of the Company was held
in view of the fact that the Company was acquired by Royal Bank of Canada on June 16, 2008. The acquisition was structured as
a statutory amalgamation under the Companies Act of Trinidad and Tobago, in which the Company amalgamated with a wholly
owned subsidiary of Royal Bank of Canada, RBC Holdings (Trinidad & Tobago) Limited. The Company and RBC Holdings (Trinidad
and Tobago) Limited then continued as one company, RBC Financial (Caribbean) Limited.
Nicole Richards
Corporate Secretary
Report of the Directors (continued)

Annual Report 2008 7
Independent Auditor’s Report
To the shareholders of RBTT Financial Holdings Limited
Report on the consolidated financial statements We have audited the accompanying consolidated financial statements of RBTT Financial Holdings (the Company) and its subsidiaries
(together, the Group) which comprise the consolidated balance sheet as at 31 March 2008 and the consolidated income statement,
consolidated statement of changes in equity and consolidated cash flow statement for the year then ended and a summary of
significant accounting policies and other explanatory notes.
Management’s responsibility for the financial statementsManagement is responsible for the preparation and the fair presentation of these consolidated financial statements in accordance
with International Financial Reporting Standards. This responsibility includes: designing, implementing and maintaining internal
control relevant to the preparation and fair presentation of financial statements that are free from material misstatement, whether
due to fraud or error; selecting and applying appropriate accounting policies; and making accounting estimates that are reasonable
in the circumstances.
Auditor’s responsibilityOur responsibility is to express an opinion on these consolidated financial statements based on our audit. We conducted our audit
in accordance with International Standards on Auditing. Those standards require that we comply with ethical requirements and plan
and perform the audit to obtain reasonable assurance whether the financial statements are free from material misstatement.
An audit involves performing procedures to obtain audit evidence about the amounts and disclosures in the financial statements.
The procedures selected depend on the auditor’s judgement, including the assessment of the risks of material misstatement of the
financial statements, whether due to fraud or error. In making those risk assessments, the auditor considers internal control relevant
to the entity’s preparation and fair presentation of the financial statements in order to design audit procedures that are appropriate
in the circumstances, but not for the purpose of expressing an opinion on the effectiveness of the entity’s internal control. An audit
also includes evaluating the appropriateness of accounting policies used and the reasonableness of accounting estimates made by
management, as well as evaluating the overall presentation of the financial statements.
We believe that the audit evidence we have obtained is sufficient and appropriate to provide a basis for our audit opinion.
OpinionIn our opinion, the accompanying consolidated financial statements present fairly, in all material respects, the financial position of the
Group as at 31 March 2008, and its financial performance and cash flows for the year then ended in accordance with International
Financial Reporting Standards.
PricewaterhouseCoopersPort of Spain
Trinidad, West Indies
2 June 2008

Annual Report 20088
At 31 March Note 2008 2007 ($’000) ($’000) (Restated)
Assets Cash on hand and due from banks 4 6,426,590 5,707,823 Balances with central banks 5 2,957,919 2,125,942 Loans and advances to customers 6 24,820,818 22,193,565 Investment securities 7 15,372,445 14,567,689 Investment in associate companies and joint venture 8 170,192 142,613 Due from associate companies 29,009 10,875 Derivative financial instruments 9 1,633,275 1,611,188 Goodwill 10 450,145 450,145 Premises and equipment 11 1,252,231 1,101,334 Deferred tax assets 12 33,906 40,754 Other assets 13 380,684 353,410 Total Assets 53,527,214 48,305,338
Liabilities Due to banks 1,594,699 1,168,744 Customers’ deposits 14 32,400,684 28,665,375 Other funding instruments 15 7,983,730 7,795,903 Other borrowed funds 16 2,441,390 2,221,175 Debt securities in issue 17 978,906 988,402 Derivative financial instruments 9 1,503,726 1,492,997 Post-retirement benefit obligations 18 94,146 126,670 Current income tax liabilities 324,251 249,179 Deferred tax liabilities 12 296,496 213,401 Other liabilities 823,559 952,857
Total Liabilities 48,441,587 43,874,703
Shareholders’ Equity Share capital 19 890,426 876,524 Statutory reserves 20 554,786 476,026 Other reserves 21 291,942 109,759 Retained earnings 3,302,120 2,929,660
Total Shareholders’ Equity 5,039,274 4,391,969
Minority Interest 22 46,353 38,666
Total Equity 5,085,627 4,430,635 Total Equity and Liabilities 53,527,214 48,305,338
The notes on pages 12 to 87 form an integral part of these consolidated financial statements.
On 2 June 2008, the Board of Directors of RBTT Financial Holdings Limited authorised these consolidated financial statements for issue.
______________________ Director ______________________ Director
Consolidated Balance SheetExpressed in Trinidad and Tobago Dollars

Annual Report 2008 9
Year ended 31 March Note 2008 2007 ($’000) ($’000) (Restated)
Interest income 23 3,768,972 3,374,342Interest expense 24 (1,673,571) (1,527,739)
Net Interest Income 2,095,401 1,846,603
Other income 25 1,232,355 1,179,704
Net Income 3,327,756 3,026,307
Operating expenses 26 (2,012,170) (1,832,462)Impairment losses on loans and advances 6.2 (35,075) (48,746)Impairment credit on investment securities 7.2 8,682 18,827
Total Non-Interest Expenses (2,038,563) (1,862,381)
Operating Profit 1,289,193 1,163,926 Share of profits of associate companies and joint venture before tax 20,069 16,892
Profit Before Taxation 1,309,262 1,180,818
Taxation 27 (370,567) (246,811)
Profit After Taxation 938,695 934,007
Attributable to:
Shareholders of the company 931,139 931,179Minority interest 7,556 2,828
938,695 934,007
Earnings per share for profit attributable to theshareholders of the parent company during the year(expressed in $ per share)
- Basic 28 $ 2.71 $ 2.71
- Diluted 28 $ 2.71 $ 2.71
The notes on pages 12 to 87 form an integral part of these consolidated financial statements.
Consolidated Income StatementExpressed in Trinidad and Tobago Dollars

Annual Report 200810
Total Share Statutory Other Retained Shareholders’ Minority Total Note Capital Reserves Reserves Earnings Equity Interest Equity ($’000) ($’000) ($’000) ($’000) ($’000) ($’000) ($’000)
Year ended 31 March 2007Balance at beginning of year as previously stated 864,021 407,118 117,768 2,641,087 4,029,994 35,760 4,065,754- Correction of prior period errors 38 -- -- (14,046) (69,764) (83,810) -- (83,810)- As adjusted 864,021 407,118 103,722 2,571,323 3,946,184 35,760 3,981,944Currency translation differences 21 -- (147) (25,710) (2) (25,859) 78 (25,781)Investment securities- Losses from changes in fair value 21 -- -- (49,418) -- (49,418) -- (49,418) - Losses transferred to net profit 21 -- -- 3,808 -- 3,808 -- 3,808Net income/(expense) recognised directly in equity -- (147) (71,320) (2) (71,469) 78 (71,391)Profit attributable to shareholders -- -- -- 931,179 931,179 2,828 934,007 Total recognised income -- (147) (71,320) 931,177 859,710 2,906 862,616
Transfer to statutory reserves 20 -- 69,055 -- (69,055) -- -- -- Transfer to general banking risks reserve 21 -- -- 39,750 (39,750) -- -- -- Employee share options- Value of services provided 19 8,526 -- -- -- 8,526 -- 8,526 - Proceeds from shares issued 19 3,977 -- -- -- 3,977 -- 3,977 Other reserve movements 21 -- -- 37,607 (34,558) 3,049 -- 3,049Dividends 29 -- -- -- (429,477) (429,477) -- (429,477)Balance at end of year 876,524 476,026 109,759 2,929,660 4,391,969 38,666 4,430,635
Year ended 31 March 2008Balance at beginning of year as restated 876,524 476,026 109,759 2,929,660 4,391,969 38,666 4,430,635Currency translation differences 21 -- (1) (34,631) -- (34,632) 621 (34,011)Investment securities- Gains from changes in fair value 21 -- -- 202,855 -- 202,855 -- 202,855- Gains transferred to net profit 21 -- -- (30,342) -- (30,342) -- (30,342)Net income/(expense) recognised directly in equity -- (1) 137,882 -- 137,881 621 138,502Profit attributable to shareholders -- -- -- 931,139 931,139 7,556 938,695Total recognised income -- (1) 137,882 931,139 1,069,020 8,177 1,077,197Transfer to statutory reserves 20 -- 78,761 -- (78,761) -- -- --Transfer to general banking risks reserve 21 -- -- 25,996 (25,996) -- -- --Employee share options- Value of services provided 19 7,468 -- -- -- 7,468 -- 7,468- Proceeds from shares issued 19 6,434 -- -- -- 6,434 -- 6,434Other reserve movements 21 -- -- 18,305 (24,017) (5,712) -- (5,712)Dividends 29 -- -- -- (429,905) (429,905) (490) (430,395)Balance at end of year 890,426 554,786 291,942 3,302,120 5,039,274 46,353 5,085,627
The notes on pages 12 to 87 form an integral part of these consolidated financial statements.
Consolidated Statement of Changes in EquityExpressed in Trinidad and Tobago Dollars

Annual Report 2008 11
Year ended 31 March Note 2008 2007 ($’000) ($’000) (Restated)
Consolidated Cash Flow StatementExpressed in Trinidad and Tobago Dollars, year ended 31 March 2007
Operating Activities Profit before taxation 1,309,262 1,180,818 Adjustments for: Impairment losses on loans and advances to customers 35,075 48,746 Post-retirement benefit expense (net of premiums paid) (30,671) (8,465) Capitalised interest on investment securities (46,335) (54,583) Net investment trading income (135,601) (115,336) Impairment credit on investment securities (8,682) (18,827) Depreciation 133,781 124,568 (Gain)/loss on disposal of premises and equipment (1,008) 2,965 Dividends received from associate companies and joint venture 5,243 5,359 Share of profits of associate companies and joint venture (20,069) (16,892) (Gains)/losses transferred from investment revaluation reserve (30,342) 3,808 Employee share options 7,468 8,526 Translation adjustment 36,677 23,792Operating Profit Before Changes In Operating Assets And Liabilities 1,254,798 1,184,479 (Increase)/decrease in operating assets Balances with central banks (831,977) (347,880) Loans and advances to customers (2,791,037) (2,788,030) Other assets (66,902) (16,519) Increase/(decrease) in operating liabilities Due to banks 427,949 (481,752) Customers’ deposits 3,872,054 4,650,840 Other funding instruments 284,317 1,698,258 Due from associate companies (18,134) (40,820) Other liabilities (84,379) (443,941) Corporation taxes paid (252,511) (182,485)Cash Provided By Operating Activities 1,794,178 3,232,150Investing Activities Investment in subsidiary, associate companies and joint venture, net of cash acquired (15,799) (3,791) Net increase in investment securities (565,805) (1,225,126) Additions to premises and equipment (305,728) (298,142) Proceeds from sale of premises and equipment 20,358 13,276Cash Used In Investing Activities (866,974) (1,513,783)Financing Activities Proceeds from issue of shares 6,434 3,977 Net increase in other borrowed funds 245,396 229,890 Net (decrease)/increase in debt securities in issue (9,496) 153,178 Dividends paid to company’s shareholders (429,905) (429,477) Dividends paid to minority interests (490) --Cash Used In Financing Activities (188,061) (42,432)Effect of exchange rate changes on cash resources (20,376) (9,709)Net Increase In Cash On Hand And Due From Banks 718,767 1,666,226Balance At Beginning Of Year 5,707,823 4,041,597Balance At End Of Year 6,426,590 5,707,823
The notes on pages 12 to 87 form an integral part of these consolidated financial statements.

Annual Report 200812
Notes to the Consolidated Financial StatementsExpressed in Trinidad and Tobago Dollars, year ended 31 March 2008
1 Incorporation And Business Activities of the Group
RBTT Financial Holdings Limited (the parent company) was incorporated in the Republic of Trinidad and Tobago in July 1998 as a holding company to acquire the Group’s investments which were previously held by the main banking unit, RBTT Bank Limited (formerly The Royal Bank of Trinidad and Tobago Limited). The latter entity was incorporated on 26 July 1971, however its history in the region began with the Union Bank of Halifax which was incorporated in Nova Scotia, Canada in 1856 and opened a branch in Port of Spain, Trinidad in 1902. The address of RBTT Financial Holdings Limited’s registered office is 19-21 Park Street, Port of Spain, Trinidad and Tobago.
The subsidiaries and associate companies of RBTT Financial Holdings Limited are engaged in banking and financial intermediation services, stock-broking services and property development.
The ordinary shares of the parent company are listed on the Trinidad and Tobago Stock Exchange, the Barbados Stock Exchange and the Jamaica Stock Exchange.
2 Significant Accounting Policies
a) Basis of preparationThe consolidated financial statements are prepared in Trinidad and Tobago dollars and in accordance with International Financial Reporting Standards. These consolidated financial statements are prepared under the historical cost convention as modified by the revaluation of available-for-sale investment securities, securities at fair value through profit or loss, investment properties, derivative financial instruments and other trading liabilities.
The preparation of these consolidated financial statements in conformity with IFRS requires the use of certain critical accounting estimates. It also requires management to exercise its judgement in the process of applying the Group’s accounting policies. The areas involving a higher degree of judgement or complexity, or areas where assumptions and estimates are significant to the financial statements are disclosed in note 3.
Amendments to published standards and interpretations effective January 1, 2007
IFRS 7 - Financial Instruments: Disclosures and the complementary amendment to IAS 1 - Capital disclosures. Both standards introduce new disclosures relating to financial instruments and do not have any impact on the classification and valuation of the group’s financial instruments or the disclosure relating to taxation. It requires the disclosure of qualitative and quantitative information about exposure to risks arising from financial instruments, including specified minimum disclosure about credit risk, liquidity risk and market risk.
The application of these new interpretations listed below did not have a material impact on the Group’s financial statements.
Effective datesIFRIC 8, Scope of IFRS 2 1 May 2006IFRIC 9, Reassessment of embedded derivative 1 June 2006IFRIC 10, Interim Financial Reporting and Impairment 1 November 2006IFRIC 11, IFRS 2 – Group Treasury Share Transactions 1 March 2007

Annual Report 2008 13
Notes to the Consolidated Financial Statements (continued)Expressed in Trinidad and Tobago Dollars, year ended 31 March 2008
2 Significant Accounting Policies (continued)
a) Basis of preparation (continued)
New standards and interpretations to published standards that are not yet effective and have not yet been early adopted by the Group. Effective datesIFRS 8, Operating segments 1 January 2009
IFRIC 12, Service Concession Arrangements 1 January 2009
b) Principles of consolidation
(i) Subsidiaries
Subsidiaries are all entities (including special purpose entities) over which the Group has the power to govern the financial and operating policies generally accompanying a shareholding of more than one half of the voting rights. The existence and effect of potential voting rights that are currently exercisable or convertible are considered when assessing whether the Group controls another entity. Subsidiaries are fully consolidated from the date on which control is transferred to the Group. They are de-consolidated from the date on which control ceases. Intercompany transactions, balances and unrealised gains on transactions between group companies are eliminated. Unrealised losses are also eliminated unless the transaction provides evidence of impairment of the asset transferred. The accounting policies of the subsidiaries have been changed where necessary to ensure consistency with the policies adopted by the Group.
A listing of the subsidiaries is set out in Note 37.
(ii) Associates
Associates are all entities over which the Group has significant influence but not control, generally accompanying a shareholding of between 20% and 50% of the voting rights. The investment in associate is initially recognised at cost and is subsequently accounted for using the equity method of accounting. The Group’s investment in associates includes goodwill (net of any accumulated impairment loss) identified on acquisition.
The Group’s share of its associates’ post acquisition profits or losses is recognised in the income statement and its share of post acquisition movements in reserves is recognised in reserves. The Group’s investment in the associates is carried on the balance sheet at an amount that reflects its share of the net assets of the associates. The associates’ accounting policies have been changed where necessary to ensure that consistency with the policies adopted by the Group.

Annual Report 200814
Notes to the Consolidated Financial Statements (continued)Expressed in Trinidad and Tobago Dollars, year ended 31 March 2008
2 Significant Accounting Policies (continued)
b) Principles of consolidation (continued)
(iii) Joint venture
Jointly controlled entities are those that involve the establishment of a corporation, partnership, or other entity in
which each venturer has an interest. The entity operates in the same way as other entities except that a contractual
arrangement between the venturers establishes joint control over the economic activity of the entity. The investment
in the joint venture is accounted for using the equity method.
A listing of the Group’s principal associate companies and joint venture undertaking is shown in Note 8.2 and 8.4.
There are a number of subsidiaries, associates and joint ventures with a reporting date different to the reporting date of
the Group. Adjustments are made for the effects of significant transactions or events that occur between that date and
the date of the Group’s financial statements. The difference between the reporting date of these entities and the Group
is no more than three months.
c) Foreign currency translation
Functional and presentation currency:
Items included in the financial statements of each of the Group’s entities are measured using the currency of the primary
economic environment in which the entity operates (the ‘functional’ currency). The consolidated financial statements are
presented in Trinidad and Tobago dollars which is the Group’s functional and presentation currency.
Transactions and balances:
Foreign currency transactions are translated into the functional currency using the exchange rates prevailing at the dates
of the transactions. Foreign exchange gains and losses resulting from the settlement of such transactions and from the
translation at year end exchange rates of monetary assets and liabilities denominated in foreign currencies are recognised
in the income statement.
Group companies:
The results and financial position of all the group entities that have a functional currency different from the presentation
currency are translated into the presentation currency as follows:
• Assetsandliabilitiesforeachbalancesheetpresentedaretranslatedattheclosingrateatthedateofthatbalance
sheet;
• Incomeandexpensesforeachincomestatementaretranslatedataverageexchangerates(unlessthisaverageisnot
a reasonable approximation of the cumulative effect of the rates prevailing on the transaction dates, in which case
income and expenses are translated at the dates of the transactions); and
• Allresultingexchangedifferencesarerecognisedasaseparatecomponentofequity.

Annual Report 2008 15
Notes to the Consolidated Financial Statements (continued)Expressed in Trinidad and Tobago Dollars, year ended 31 March 2008
2 Significant Accounting Policies (continued)
c) Foreign currency translation (continued)
On consolidation, exchange differences arising from the translation of the net investment in foreign entities, and of
borrowings and other currency instruments designated as hedges of such instruments, are taken to shareholders’ equity.
When a foreign operation is disposed of, such exchange differences are recognised in the income statement as part of
the gain or loss on sale.
Goodwill and fair value adjustments arising on acquisition of a foreign entity are treated as assets and liabilities of the
foreign entity and translated at the closing rate.
d) Financial assets
The Group classifies its financial assets into the following categories: financial assets at fair value through profit or loss,
loans and advances to customers; held-to-maturity investments; and available-for-sale financial assets. Management
determines the classification of its investments at initial recognition.
(i) Financial assets at fair value through profit or loss
This category has two sub-categories: financial assets held for trading, and those designated at fair value through
profit or loss from inception.
A financial asset is classified as held for trading if it is acquired or incurred principally for the purpose of selling
or repurchasing in the near term or if it is part of a portfolio of identified financial instruments that are managed
together and for which there is evidence of a recent actual pattern of short-term profit-taking. Derivatives are also
categorised as held for trading unless they are designated as hedging instruments.
Financial assets and liabilities are designated at fair value through profit or loss when:
•Thedesignationsignificantlyreducesmeasurementinconsistenciesthatwouldarisefrommeasuringtheassetsor
liabilities or recognising gains or losses on them on a different basis.
•Assetsandliabilitiesthatarepartofagroupoffinancialassets,financialliabilitiesorbothwhicharemanagedand
evaluated on a fair value basis in accordance with a documented risk management or investment strategy and
reported to key management personnel on that basis are designated at fair value through profit or loss; and
•Financial instruments, such as debt securities held, containingoneormore embeddedderivatives significantly
modify the cash flows, are designated at fair value through profit or loss.
Gains and losses arising from changes in the fair value of derivatives that are managed in conjunction with designated
financial assets or financial liabilities are included in ‘net trading income.’

Annual Report 200816
Notes to the Consolidated Financial Statements (continued)Expressed in Trinidad and Tobago Dollars, year ended 31 March 2008
2 Significant Accounting Policies (continued)
d) Financial assets (continued)
(ii) Loans and advances to customers
Loans and advances to customers are non-derivative financial assets with fixed or determinable payments that are not
quoted in an active market, other than: (a) those that the entity intends to sell immediately or in the short term, which
are classified as held for trading, and those that the entity upon initial recognition designates as at fair value through
profit or loss; (b) those that the entity upon initial recognition designates as available-for-sale; or (c) those for which
the holder may not recover substantially all of its initial investment, other than because of credit deterioration.
(iii) Held-to-maturity financial assets
Held-to-maturity investments are non-derivative financial assets with fixed or determinable payments and fixed
maturities that the Group’s management has the positive intention and the ability to hold to maturity. If the Group
were to sell other than an insignificant amount of held-to-maturity assets, the entire category would be reclassified
as available-for-sale.
(iv) Available-for-sale financial assets
Available-for-sale investments are those intended to be held for an indefinite period of time, which may be sold in
response to needs for liquidity or changes in interest rates, exchange rates or equity prices.
Purchases and sales of financial assets at fair value through profit or loss, held-to-maturity and available-for-sale are
recognised on the settlement date – the date on which there is a cash outflow or inflow.
Financial assets are initially recognised at fair value plus transaction costs for all financial assets not carried at fair value
thorough profit or loss. Financial assets carried at fair value through profit and loss are initially recognised at fair value,
and transaction costs are expensed in the income statement. Financial assets are derecognised when the rights to receive
cash flows from the financial assets have expired or where the Group has transferred substantially all risks and rewards of
ownership. Financial liabilities are derecognised when they are extinguished – that is, when the obligation is discharged,
cancelled or expires.
Available-for-sale financial assets and financial assets at fair value through profit or loss are subsequently carried at fair
value. Loans and advances to customers and receivables and held-to-maturity investments are carried at amortised cost
using the effective interest method. Gains and losses arising from changes in the fair value of the ‘financial assets at fair
value through profit or loss’ category are included in the income statement in the period in which they arise. Gains and
losses arising from changes in the fair value of available-for-sale financial assets are recognised directly in equity, until
the financial asset is derecognised or impaired. At this time, the cumulative gain or loss previously recognised in equity
is recognised in profit or loss. However, interest calculated using the effective interest method and foreign currency
gains and losses on monetary assets classified as available-for-sale are recognised in the income statement. Dividends on
available-for-sale equity instruments are recognised in the income statement when the entity’s right to receive payment
is established.

Annual Report 2008 17
Notes to the Consolidated Financial Statements (continued)Expressed in Trinidad and Tobago Dollars, year ended 31 March 2008
2 Significant Accounting Policies (continued)
d) Financial assets (continued)
The fair values of quoted investments in active markets are based on current bid prices. If there is no active market for a
financial asset, the Group establishes fair value using valuation techniques. These include the use of recent arm’s length
transactions, discounted cash flow analysis, option pricing models and other valuation techniques commonly used by
market participants.
e) Impairment of financial assets
(i) Financial assets carried at amortised cost
The Group assesses at each balance sheet date whether there is objective evidence that a financial asset or a group
of financial assets is impaired. A financial asset or group of financial assets is impaired and impairment losses are
incurred only if there is objective evidence of impairment as a result of one or more events that have occurred after
the initial recognition of the asset (a ‘loss event’) and that loss event (or events) has an impact on the estimated future
cash flows of the financial assets or group of financial assets that can be reliably estimated.
The criteria that the Group uses to determine that there is objective evidence of an impairment loss include:
(i) Delinquency in contractual payments of principal or interest;
(ii) Cash flow difficulties experienced by the borrower (e.g. equity ratio, net income percentage of sales);
(iii) Breach of loan covenants or conditions;
(iv) Initiation of bankruptcy proceedings;
(v) Deterioration of the borrower’s competitive position
(vi) Deterioration in the value of collateral; and
(vii) Downgrading of the asset.
The Group first assesses whether objective evidence of impairment exists individually for financial assets that are
individually significant. If the Group determines that no objective evidence of impairment exists for an individually
assessed financial asset, whether significant or not, it includes the asset in a group of financial assets with similar
credit risk characteristics and collectively assesses them for impairment. Assets that are individually assessed for
impairment and for which an impairment loss is or continues to be recognised are not included in a collective
assessment of impairment.
If there is objective evidence that an impairment loss has been incurred, the amount of the loss is measured as the
difference between the asset’s carrying amount and the present value of estimated future cash flows (excluding
future credit losses that have not been incurred) discounted at the financial asset’s original effective interest rate.
The carrying amount of the asset is reduced through the use of an allowance account and the amount of the loss is
recognised in the income statement. If a financial asset has a variable interest rate, the discount rate for measuring
any impairment loss is the current effective interest rate determined under the contract. As a practical expedient, the
Group may measure impairment on the basis of an instrument’s fair value using an observable market price.

Annual Report 200818
Notes to the Consolidated Financial Statements (continued)Expressed in Trinidad and Tobago Dollars, year ended 31 March 2008
2 Significant Accounting Policies (continued)
e) Impairment of financial assets (continued)
(i) Financial assets carried at amortised cost (continued)
The calculation of the present value of the estimated future cash flows of a collateralised financial asset reflects
the cash flows that may result from foreclosure less costs for obtaining and selling the collateral, whether or not
foreclosure is probable.
For the purpose of a collective evaluation of impairment, financial assets are grouped together on the basis of similar
credit risk characteristics. Those characteristics are relevant to the estimation of future cash flows for groups of such
assets by being indicative of the debtors’ ability to pay all amounts due according to the contractual terms of the
assets being evaluated.
When a financial asset is uncollectible, it is written off against the related provision for impairment loss. Such financial
assets are written off after all the necessary procedures have been completed and the amount of the loss has been
determined.
If in the subsequent period, the amount of the impairment loss decreases and the decrease can be related objectively
to an event occurring after the impairment was recognised (such as an improved credit rating), the previously
recognised impairment loss is reversed by adjusting the allowance account. The amount of the reversal is recognised
in the income statement.
(ii) Financial assets classified as available-for-sale
The Group assesses at each balance sheet date whether there is objective evidence that a financial asset or a group
of financial assets is impaired. A financial asset or a group of financial assets carried at fair value is impaired if its
carrying amount is greater than its estimated recoverable amount based on the present value of expected future cash
flows discounted at the current market rate of interest. If any such evidence exists for financial assets available-for-
sale, the cumulative loss measured as the difference between the acquisition cost and the current fair value, less any
impairment loss on that financial asset previously recognised in the income statement is removed from equity and
recognised in the income statement.
If in a subsequent period, the fair value of a financial asset classified as an investment security available-for-sale
increases and the increase can be objectively related to an event occurring after the impairment loss was recognised
in the income statement, the impairment loss is reversed through the income statement.
(iii) Renegotiated loans
Where possible, the Group seeks to restructure loans rather than to take possession of collateral. This may involve
extending the payment arrangements and the agreement of new loan conditions. Once the terms have been
renegotiated, the loan is no longer considered past due. Management continuously reviews renegotiated loans to
ensure that all criteria are met and that future payments are likely to occur.

Annual Report 2008 19
Notes to the Consolidated Financial Statements (continued)Expressed in Trinidad and Tobago Dollars, year ended 31 March 2008
2 Significant Accounting Policies (continued)
f) Sale and repurchase agreements
Securities sold under sale and repurchase agreements (‘repos’) are retained in the financial statements as securities held-
for-trading and the counterparty liability is included in other funding instruments. Securities purchased under agreements
to resell (‘reverse repos’) are recorded as loans to other banks or customers as appropriate. The difference between the
sale price and the repurchase price is treated as interest and accrued evenly over the life of the repos.
g) Derivative financial instruments and other trading liabilities
Derivative financial instruments
Derivative financial instruments including currency and interest rate swaps, equity and commodity options (both written
and purchased) are initially recognised in the balance sheet at fair value on the date on which a derivative contract is
entered into and subsequently measured at their fair value. Fair values are obtained from quoted market prices in active
markets including recent market transactions, and valuation techniques, including discounted cash flow models and
option pricing models as appropriate. All derivatives are carried as assets when fair value is positive and as liabilities when
fair value is negative.
Certain derivatives embedded in other financial instruments, such as the equity option in an index linked instrument, are
treated as separate derivatives when their economic characteristics and risks are not closely related to those of the host
contract and the host contract is not carried at fair value through profit or loss. These embedded derivatives are measured
at fair value with changes in fair value recognised in the income statement.
Changes in the fair value of derivatives are recognised immediately in the income statement and are included in net
trading income.
h) Acceptances, guarantees, indemnities and letters of credit
The Group’s potential liability under acceptances, guarantees and letters of credit is reported as a contingent liability. The
Group has equal and offsetting claims against its customers in the event of a call on these commitments.
i) Revenue recognition
(i) Interest income and expense
Interest income and interest expense are recognised in the income statement for all interest bearing instruments on
an accrual basis using the effective interest method.
The effective interest method is a method of calculating the amortised cost of a financial asset or a financial liability
and of allocating the interest income and interest expense over the relevant period. The effective interest rate is the
rate that exactly discounts estimated future cash payments or receipts through the expected life of the financial
instrument or where appropriate, a shorter period to the net carrying amount of the financial asset or liability.
When calculating the effective interest rate, the Group estimates cash flows considering all contractual terms of
the financial instrument but does not consider future credit losses. The calculation includes all fees paid or received
between parties to the contract that are an integral part of the effective interest rate, transactions costs and all other
premiums or discounts.

Annual Report 200820
Notes to the Consolidated Financial Statements (continued)Expressed in Trinidad and Tobago Dollars, year ended 31 March 2008
2 Significant Accounting Policies (continued)
i) Revenue recognition (continued)
(ii) Fees and commissions
The Group earns fees and commissions from a diverse range of services and products to its customers.
Fees and commissions are generally recognised on an accrual basis when the service has been provided. Loan
commitment fees for loans that are likely to be drawn down are deferred (together with related direct costs) and
recognised as an adjustment to the effective interest rate on the loan. Loan syndication fees are recognised as
revenue when the syndication has been completed and the Group has retained no part of the loan package for itself
or has retained a part at the same effective interest rate as the other participants. Commissions and fees arising
from negotiating, or participating in the negotiation of, a transaction for a third party – such as the arrangement of
the acquisition of shares or other securities or the purchase or sale of businesses – are recognised on completion of
the underlying transaction. Portfolio and other management advisory and service fees are recognised based on the
completion of the underlying applicable service contracts, usually on a time-apportionate basis. Asset management
fees related to investment funds are recognised rateably over the period in which the service is provided. The same
principle is applied for wealth management and custody services that are continuously provided over an extended
period of time. Performance linked fees or fee components are recognised when the performance criteria are
fulfilled.
(iii) Dividend income
Dividend income is recognised when the right to receive dividend is established.
j) Goodwill
Goodwill represents the excess of the cost of an acquisition over the fair value of the Group’s share of the net assets
of the acquired subsidiary or associate company at the date of acquisition. Goodwill arising on investments in associate
companies is included in investments in associate companies.
Goodwill is tested annually for impairment or more frequently if events or changes in circumstances indicate that the
carrying value may be impaired. Goodwill is carried at cost less accumulated impairment. Gains or losses realised on
disposal of an entity include the carrying amount of goodwill relating to the entity sold.
k) Premises and equipment
Premises and equipment are stated at cost less depreciation.
Depreciation is computed principally on the straight line method. Rates in effect are designed to write off the depreciable
amounts of assets over their estimated useful lives. The following rates are used:
Freehold properties - 2% to 4%
Leasehold properties and improvements - 2% to 20%
Equipment - 15% to 20%
Computer - 10% to 25%
Annual Report 2008 21
Notes to the Consolidated Financial Statements (continued)Expressed in Trinidad and Tobago Dollars, year ended 31 March 2008
2 Significant Accounting Policies (continued)
k) Premises and equipment (continued)
Gains and losses on disposal of premises and equipment are determined by reference to their carrying amounts and are
taken into account in determining operating profit. Costs of repairs and renewals are charged to the income statement
when the expenditure is incurred.
Borrowing costs incurred primarily for the purpose of acquiring, constructing or producing an asset that necessarily takes
a substantial period of time to get ready for its intended use is capitalised as part of its cost. Borrowing costs capitalised
will be mainly interest costs and exchange differences arising on foreign currency borrowings.
l) Impairment of non-financial assets
Assets that have an indefinite useful life are not subject to amortisation and are tested annually for impairment. Assets
that are subject to amortisation are reviewed for impairment whenever events or changes in circumstances indicate that
the carrying amount may not be recoverable. An impairment loss is recognised for the amount by which the asset’s
carrying amount exceeds its recoverable amount. The recoverable amount is the higher of an asset’s fair value less costs
to sell and value in use.
m) Cash and cash equivalents
Cash and cash equivalents comprise cash balances on hand, deposits with other banks and short term investments with
maturities of less than three months.
n) Leases
(i) A Group company is the lessee
The leases entered into by the Group which do not transfer substantially all the risk and benefits of ownership are
classified as operating leases. The total payments made under operating leases are charged to other operating
expenses in the income statement on a straight-line basis over the period of the lease.
When an operating lease is terminated before the lease period has expired, any payment required to be made to the
lessor by way of penalty is recognised as an expense in the period in which termination takes place.
(ii) A Group company is the lessor
When assets are held subject to a finance lease, the present value of the lease payments is recognised as a receivable
and reported in loans and advances to customers. Lease income is recognised over the term of the lease using the
net investment method (before tax), which reflects a constant period rate of return.
Leases where the Group does not transfer substantially all the risk and benefits of ownership of the asset are
classified as operating leases. Rental payments received under operating leases are recognised on a straight-line basis
over the lease period.

Annual Report 200822
Notes to the Consolidated Financial Statements (continued)Expressed in Trinidad and Tobago Dollars, year ended 31 March 2008
2 Significant Accounting Policies (continued)
o) Provisions
Provisions are recognised when the Group has a present legal or constructive obligation as a result of past events, it
is more likely than not that an outflow of resources will be required to settle the obligation and the amount has been
reliably estimated.
Where there are a number of similar obligations, the likelihood that an outflow will be required in settlement is determined
by considering the class of obligations as a whole. A provision is recognised even if the likelihood of an outflow with
respect to any one item included in the same class of obligations may be small.
p) Borrowings
Borrowings are recognised initially at cost, being their issue proceeds net of transaction costs incurred. Subsequently,
borrowings are stated at amortised cost and any difference between net proceeds and the redemption value is recognised
in the income statement over the period of the borrowings using the effective interest method.
q) Share Capital
Shares issued for cash are accounted for at the issue price less any transaction costs of the issue. Shares issued as
consideration for the acquisition of a business are recorded at the market price on the date of the issue.
r) Dividends
Dividends that are proposed and declared during the period are accounted for as an appropriation of retained earnings
in the statement of changes in equity.
Dividends that are proposed and declared after the balance sheet date are not shown as a liability on the balance sheet
but are disclosed as a note to the financial statements.
s) Employee benefits
(i) Pension obligations
The Group operates a number of defined contribution and defined benefit pension plans, the assets of which are
generally held in separate trustee-administered funds. The pension plans are generally funded by payments from
employees and by the relevant Group companies, taking account of the recommendations of independent qualified
actuaries.
For defined benefit plans maintained as part of multi-employer plans by certain group companies, the administrators
are unable to provide information on the companies’ proportionate share of the defined benefit obligation and plan
assets. These plans are accounted for as if they are defined contribution plans in accordance with IAS 19.
The Group’s contributions to the defined contribution pension plans are charged to the consolidated income
statement in the year to which they relate.

Annual Report 2008 23
Notes to the Consolidated Financial Statements (continued)Expressed in Trinidad and Tobago Dollars, year ended 31 March 2008
2 Significant Accounting Policies (continued)
s) Employee benefits (continued)
(ii) Equity compensation benefits
The Group operates an equity settled, share based compensation plan. The fair value of employee services received
in exchange for the grant of share options is recognised as an expense in the income statement with a corresponding
increase to share capital. The amount expensed is determined by reference to the fair value of share options granted
and the vesting conditions. At the balance sheet date, the Group revises its estimate of the number of options that
are expected to become exercisable. The impact, if any, of a revision is recognised in the income statement with a
corresponding adjustment to the share capital account over the remaining vesting period.
When options are exercised, the proceeds received net of any transaction costs are credited to the share capital
account.
(iii) Employee share ownership plan (ESOP)
The employees of subsidiaries incorporated in Trinidad and Tobago have the option to receive their bonuses in cash
and/or ordinary shares of the parent company purchased on the open market, in accordance with the terms outlined
in the Trust Deed governing an approved ESOP. The Group recognises an expense within staff costs when bonuses
are awarded.
iv) Other post-retirement benefits
Some Group companies provide other post-retirement benefits to their retirees. The entitlement to these benefits
is conditional on the employee remaining in service up to retirement age and the completion of a minimum service
period. The expected costs of these benefits are accrued over the period of employment using a methodology
similar to that for defined benefit pension plans. Actuarial gains and losses arising from experience adjustments, and
changes in actuarial assumptions, are charged or credited to income over the expected average remaining working
lives of the related employees. A full valuation of these obligations is carried out by independent qualified actuaries
every three years.
t) Deferred income tax
Deferred tax is provided in full, using the liability method, on temporary differences arising between the tax bases of assets
and liabilities and their carrying amounts in the consolidated financial statements. Deferred income tax is determined
using tax rates (and laws) that have been enacted or substantially enacted by the balance sheet date and are expected to
apply when the related deferred income tax asset is realised or the deferred income tax liability is settled.
The principal temporary differences arise from depreciation on equipment and the revaluation of certain financial assets
including derivative financial instruments.

Annual Report 200824
Notes to the Consolidated Financial Statements (continued)Expressed in Trinidad and Tobago Dollars, year ended 31 March 2008
2 Significant Accounting Policies (continued)
t) Deferred income tax (continued)
Deferred tax assets are recognised where it is probable that future taxable profit will be available against which temporary
differences can be utilised.
Deferred tax related to fair value re-measurement of financial assets available-for-sale is credited or charged directly to
equity and subsequently recognised in the income statement together with the deferred gain or loss.
u) Administered funds
The Group commonly acts as trustees and in other fiduciary capacities that result in the holding or placing of assets on
behalf of individuals, trusts, retirement benefit plans and other institutions. The assets and income arising thereon are
excluded from these financial statements, as they are not assets of the Group. Assets under administration/trusteeship as
at 31 March 2008 totalled $57.1 billion (2007 - $54.3 billion).
v) Offsetting
Financial assets and liabilities are offset and the net amount reported in the balance sheet when there is a legally
enforceable right to set off the recognised amounts and there is an intention to settle on a net basis, or realise the asset
and settle the liability simultaneously.
w) Segment reporting
Business segments provide products or services that are subject to risks and returns that are different from those of other
business segments. Geographical segments provide products or services within a particular economic environment that
are subject to risks and returns that are different from those of segments operating in other economic environments.
Segmental information is provided on both segment formats: the primary format reflects the Group’s management
structure – by geographic area. The secondary segment format reflects line of business. This distinction is based on
internal management and financial reporting systems and reflects the risks and earnings structure of the Group.
x) Comparative information
Where necessary, comparative figures have been adjusted to conform with changes in presentation in the current year.
Adjustments to previously reported results were made in accordance with International Accounting Standard #8 –
Accounting policies, changes in accounting estimates and errors. The impact of these adjustments and reclassifications
are summarised in Note 38 - Restatements and reclassifications.

Annual Report 2008 25
Notes to the Consolidated Financial Statements (continued)Expressed in Trinidad and Tobago Dollars, year ended 31 March 2008
3 Critical Accounting Estimates And Judgements In Applying Accounting Policies
The Group makes estimates and assumptions that affect the reported amounts of assets and liabilities within the next financial
year. Estimates and judgements are continually evaluated and are based on historical experience and other factors, including
expectations of future events that are believed to be reasonable under the circumstances.
a) Impairment on financial assets
The Group reviews its loan and investment portfolios to assess impairment at least on a quarterly basis. In determining
whether an impairment should be recorded in the income statement, the Group makes judgements as to whether there
is any observable data indicating that there is a measurable decrease in the estimated future cash flows from a portfolio
of assets before the decrease can be identified with an individual asset in that portfolio. This evidence may include
observable data indicating that there has been an adverse change in the payment status of borrowers in a group, or
national or local economic conditions that correlate with defaults on assets in the group. Management uses estimates
based on historical loss experience for assets with credit risk characteristics and objective evidence of impairment similar
to those in the portfolio when scheduling its future cash flows. The methodology and assumptions used for estimating
both the amount and timing of future cash flows are reviewed regularly to reduce any differences between loss estimates
and actual loss experience.
b) Fair value of financial instruments including derivatives
The fair value of financial instruments that are not quoted in active markets are determined by using valuation techniques.
Where valuation techniques (for example, models) are used to determine fair values, they are validated and periodically
reviewed by qualified personnel independent of the area that created them. To the extent practical, models use only
observable data, however areas such as credit risk (both own and counterparty), volatilities and correlations require
management to make estimates.
c) Held-to-maturity investments
The Group follows the guidance of IAS 39 on classifying non-derivative financial assets with fixed or determinable payments
and fixed maturity as held-to-maturity. This classification requires significant judgement. In making this judgement, the
Group evaluates its intention and ability to hold such investments to maturity.
d) Income taxes
The Group is subject to income taxes in several jurisdictions. Estimates are required in determining the provision for
income taxes. There are some transactions and calculations for which the ultimate tax determination is uncertain during
the ordinary course of business. The Group recognises liabilities for anticipated tax issues based on estimates of whether
additional taxes will be due. Where the final outcome of these matters is different from the amounts that were initially
recorded, such differences will impact the income tax and deferred tax provisions in the period in which such determination
is made.

Annual Report 200826
Notes to the Consolidated Financial Statements (continued)Expressed in Trinidad and Tobago Dollars, year ended 31 March 2008
3 Critical Accounting Estimates And Judgements In Applying Accounting Policies (continued)
e) Securitisations and special purpose entities
The Group supports the formation of special purpose entities (SPEs) primarily for the purpose of allowing clients to hold
investments for asset securitisation purposes and for buying and selling credit protection. The Group does not consolidate
SPEs that it does not control. As it can sometimes be difficult to determine whether the Group does control an SPE, it may
make judgements about its exposure to the risks and rewards as well as about its ability to make operational decisions
about the SPE in question. In many instances, elements are present that, when considered in isolation, indicate control
or lack of control over an SPE, but when considered together, make it difficult to reach a clear conclusion. In such cases,
the SPE is consolidated.
4 Cash On Hand And Due From Banks
2008 2007 ($’000) ($’000)
Cash on hand 1,610,996 1,263,465
Due from banks 4,815,594 4,444,358
6,426,590 5,707,823
Cash on hand represents cash held in tellers’ tills, the vault and cash dispensing machines.
Due from banks are deposits held with other banks on demand or for fixed periods not exceeding 90 days. Due from banks
also include items due from other banks in the process of clearing.
5 Balances With Central Banks
In accordance with the regulations governing banks in the region, the Group’s banking subsidiaries in Trinidad and Tobago,
the Eastern Caribbean, Barbados, Aruba, Netherlands Antilles, Jamaica and Suriname are required to maintain monetary
reserves with the respective Central Banks, which are based on a ratio to customers’ deposits and other specified liabilities.

Annual Report 2008 27
Notes to the Consolidated Financial Statements (continued)Expressed in Trinidad and Tobago Dollars, year ended 31 March 2008
6 Loans And Advances To Customers
2008 2007 ($’000) ($’000)
Retail 4,840,528 4,906,675
Commercial/corporate 14,469,457 12,200,468
Mortgages 5,072,086 4,592,789
Other 1,290,109 1,445,064
Gross loans and advances 25,672,180 23,144,996
Unearned interest (701,804) (715,953)
24,970,376 22,429,043
Interest receivable 164,935 150,126
Allowance for impairment losses (314,493) (385,604)
24,820,818 22,193,565
Neither past due nor impaired loans and advances 23,094,362 20,500,501
Past due but not impaired loans and advances 2,049,424 1,982,818
Impaired loans and advances 528,394 661,677
Gross loans and advances 25,672,180 23,144,996
Included in loans and advances are amounts pledged for
the benefit of investors in other funding instruments 663,265 1,366,523

Annual Report 200828
Notes to the Consolidated Financial Statements (continued)Expressed in Trinidad and Tobago Dollars, year ended 31 March 2008
6 Loans And Advances To Customers (continued)
2008 2007 ($’000) ($’000)
6.1 Allowance for impairment lossesBalance at beginning of year 385,604 395,063
Amounts previously provided for now being written off (125,365) (68,023)
Increase in allowance for the year (excluding recoveries) 51,419 57,996
Currency translation differences 2,835 568
Balance at end of year 314,493 385,604
Individual impairment 243,757 331,288
Collective impairment 70,736 54,316
314,493 385,604
Allowance for impairment losses by sector:
Retail 146,341 144,828
Commercial/corporate 118,651 161,556
Mortgages 40,032 69,573
Other 9,469 9,647
314,493 385,604
6.2 Impairment losses on loans and advances to customers
Increase in allowance for the year 51,419 57,996
Amounts not previously provided for being directly written off 797 1,701
Recoveries (17,141) (10,951)
35,075 48,746
Impairment losses by sector:
Retail 28,460 24,595
Commercial/corporate 10,374 30,743
Mortgages (2,024) (11,511)
Other (1,735) 4,919
35,075 48,746

Annual Report 2008 29
Notes to the Consolidated Financial Statements (continued)Expressed in Trinidad and Tobago Dollars, year ended 31 March 2008
7 Investment Securities
2008 2007 ($’000) ($’000)
Securities at fair value through profit or loss (including trading) 2,080,056 1,530,504
Securities available-for-sale at fair value 11,750,681 11,880,884
Securities held-to-maturity at amortised cost 1,377,254 1,020,662
15,207,991 14,432,050
Unearned interest (44,020) (66,584)
Interest receivable 218,058 220,274
Allowance for impairment
-Securities available-for-sale (9,584) (18,051)
15,372,445 14,567,689
Investment securities pledged for the benefit of investors
in other funding instruments 7,675,069 6,857,623
Securities at fair value through profit or loss (including trading)
Held for trading
Government and state-owned enterprises debt securities 442,266 199,418
Corporate debt securities 1,466,170 1,331,086
1,908,436 1,530,504
Designated upon initial recognition
Corporate debt securities 171,620 --
171,620 --
2,080,056 1,530,504
Securities available-for-sale at fair value
Treasury bills and treasury notes 2,236,881 1,728,291
Government and state owned enterprises debt securities 4,375,029 5,738,932
Corporate debt securities 2,476,301 2,352,154
Other debt securities 696,751 368,681
Money market instruments 1,202,203 1,115,325
Equity securities 763,516 577,501
11,750,681 11,880,884
Securities held-to-maturity at amortised cost
Government and state-owned enterprises debt securities 626,888 383,007
Corporate debt securities 623,215 636,090
Other debt securities 127,151 1,565
1,377,254 1,020,662

Annual Report 200830
Notes to the Consolidated Financial Statements (continued)Expressed in Trinidad and Tobago Dollars, year ended 31 March 2008
7 Investment Securities (continued)
2008 2007 ($’000) ($’000)
7.1 Provision for impairment
Balance at beginning of year 18,051 40,642
Foreign exchange adjustment 215 54
Amounts previously provided for now being written off -- (12,206)
Amounts previously written-off now reinstated -- 9,313
Decrease in allowance for the year (8,682) (19,752)
Balance at end of year 9,584 18,051
7.2 Impairment (credit)/expense
Amounts not previously provided for being directly written off -- 925
Decrease in allowance for the year (8,682) (19,752)
(8,682) (18,827)
Securities available-for-sale at fair value (8,682) (18,827)
(8,682) (18,827)
8 Investment In Associate Companies And Joint Venture
2008 2007 ($’000) ($’000)
Associate companies 64,134 55,406
Joint venture 106,058 87,207
170,192 142,613
8.1 Movement in equity interest in associate companies
Balance at beginning of year 55,406 48,089
Additional investment 8,723 --
Share of current year’s profits, net of tax 2,685 6,322
Share of current year’s reserves (2,345) 2,479
Dividends (335) (1,484)
Balance at end of year 64,134 55,406

Annual Report 2008 31
8 Investment In Associate Companies And Joint Venture
8.2 Associate companies
The Group’s interest in its principal associates, which are unlisted, are as follows:
Assets Liabilities Revenues Operating % of equity profit capital ($’000) ($’000) ($’000) ($’000) heldAt 31 March 2008Development Finance Limited 642,848 (492,789) 29,328 4,738 31.1%
Infolink Services Limited 31,888 (2,265) 14,230 6,008 25.0%
Park Court Limited 51,198 (36,750) -- -- 20.0%
KF Real Estate C.V. 20,111 (11,388) 360 335 33.3%
At 31 March 2007Development Finance Limited 522,026 (426,026) 48,965 12,466 31.1%
Infolink Services Limited 58,075 (1,214) 7,111 3,166 25.0%
Park Court Limited 51,198 (36,750) 2,569 819 20.0%
All associate companies except KF Real Estate C.V. are incorporated in the Republic of Trinidad and Tobago.
KF Real Estate is incorporated in Curaçao.
2008 2007 ($’000) ($’000)
8.3 Movement in interest in joint venture
Balance at beginning of year 87,207 78,013
Additional investment during the year 7,076 3,791
Share of current year’s profits, net of tax 16,683 9,278
Dividends (4,908) (3,875)
Balance at end of year 106,058 87,207
8.4 Interest in joint venture Country of Percentage of equity incorporation capital held Joint venture at 31 March 2008RGM Limited Republic of Trinidad and Tobago 33 1⁄3%
Joint venture at 31 March 2007RGM Limited Republic of Trinidad and Tobago 33 1⁄3%
Notes to the Consolidated Financial Statements (continued)Expressed in Trinidad and Tobago Dollars, year ended 31 March 2008
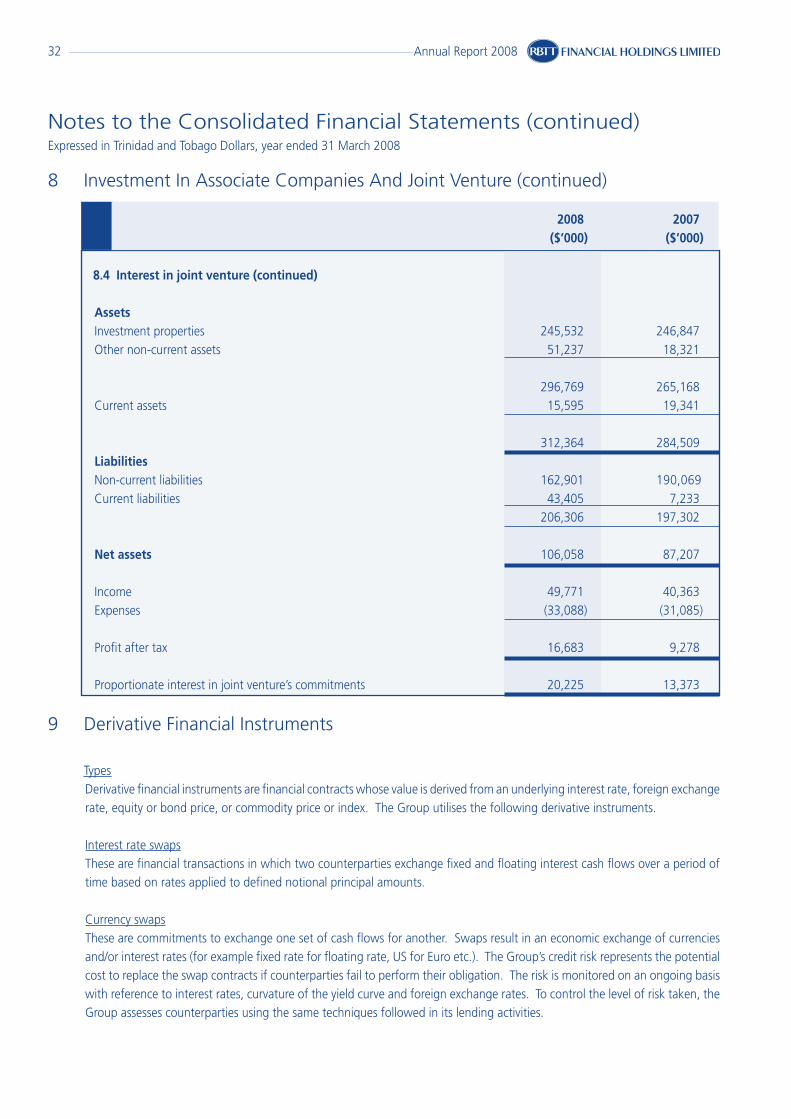
Annual Report 200832
Notes to the Consolidated Financial Statements (continued)Expressed in Trinidad and Tobago Dollars, year ended 31 March 2008
8 Investment In Associate Companies And Joint Venture (continued)
2008 2007 ($’000) ($’000)
8.4 Interest in joint venture (continued)
AssetsInvestment properties 245,532 246,847
Other non-current assets 51,237 18,321
296,769 265,168
Current assets 15,595 19,341
312,364 284,509
Liabilities
Non-current liabilities 162,901 190,069
Current liabilities 43,405 7,233
206,306 197,302
Net assets 106,058 87,207
Income 49,771 40,363
Expenses (33,088) (31,085)
Profit after tax 16,683 9,278
Proportionate interest in joint venture’s commitments 20,225 13,373
9 Derivative Financial Instruments Types
Derivative financial instruments are financial contracts whose value is derived from an underlying interest rate, foreign exchange
rate, equity or bond price, or commodity price or index. The Group utilises the following derivative instruments.
Interest rate swaps
These are financial transactions in which two counterparties exchange fixed and floating interest cash flows over a period of
time based on rates applied to defined notional principal amounts.
Currency swaps
These are commitments to exchange one set of cash flows for another. Swaps result in an economic exchange of currencies
and/or interest rates (for example fixed rate for floating rate, US for Euro etc.). The Group’s credit risk represents the potential
cost to replace the swap contracts if counterparties fail to perform their obligation. The risk is monitored on an ongoing basis
with reference to interest rates, curvature of the yield curve and foreign exchange rates. To control the level of risk taken, the
Group assesses counterparties using the same techniques followed in its lending activities.

Annual Report 2008 33
Notes to the Consolidated Financial Statements (continued)Expressed in Trinidad and Tobago Dollars, year ended 31 March 2008
9 Derivative Financial Instruments (continued) Notional amounts and fair values
The notional amount of certain types of financial instruments provide a basis for comparison with instruments recognised on
the balance sheet but do not necessarily indicate the amounts of future cash flows involved or the current fair value of the
instruments and, therefore, do not indicate the Group’s exposure to credit or price risks. The derivative instruments become
favourable (assets) or unfavourable (liabilities) as a result of fluctuations in market interest rates or foreign exchange rates,
commodity prices or indices relative to their terms. The aggregate contractual or notional amount of derivative financial
instruments on hand, the extent to which instruments are favourable or unfavourable and, thus the aggregate fair values of
derivative financial assets and liabilities can fluctuate significantly from time to time. The notional amounts and fair values of
derivative financial instruments held are set out in the following table.
Contract/Notional Fair Values Amount Assets Liabilities ($’000) ($’000) ($’000) Year ended 31 March 2008 Derivatives held-for-trading Interest rate swaps 891,806 51,436 31,930
Currency swaps 2,184,961 1,581,839 1,471,796
1,633,275 1,503,726
Year ended 31 March 2007 Derivatives held-for-trading Interest rate swaps 880,961 50,347 27,461
Currency swaps 1,373,882 1,560,841 1,465,536
1,611,188 1,492,997
Credit risk
Credit risk from derivative transactions is generated by the potential for the counterparty to default on its contractual obliga-
tions. The Group restricts its exposure to credit losses on derivative instruments by entering into master netting arrangements
contained in the “ISDA Agreements” with its counterparties and where applicable supplements its position with collateral.
10 Goodwill
2008 2007 ($’000) ($’000)
Balance at beginning of year 450,145 445,750
Hindsight adjustment -- 4,395
Balance at end of year 450,145 450,145
Goodwill on assets acquired was assessed to determine the need for an impairment provision as at the year end, in accordance
with IFRS 3 – Business Combinations. This assessment included, but was not restricted to, the review and consideration of the
cash flows, profitability, market positions and technology components of the acquired assets. Based on the results of the as-
sessment, goodwill was deemed not to be impaired as at 31 March 2008 and as such no impairment charge was required.

Annual Report 200834
Notes to the Consolidated Financial Statements (continued)Expressed in Trinidad and Tobago Dollars, year ended 31 March 2008
11 Premises And Equipment
Capital Freehold Leasehold Leasehold Work in Properties Properties Improvements Equipment Progress Total ($’000) ($’000) ($’000) ($’000) ($’000) ($’000)At 1 April 2006Cost 479,524 15,978 111,453 930,481 149,189 1,686,625
Accumulated depreciation (88,779) (1,784) (48,838) (598,112) -- (737,513)
Net book value 390,745 14,194 62,615 332,369 149,189 949,112
Year ended 31 March 2007Opening net book value 390,745 14,194 62,615 332,369 149,189 949,112
Translation adjustment (1,431) -- (73) (1,225) 27 (2,702)
Adjusted opening net
book value 389,314 14,194 62,542 331,144 149,216 946,410
Additions 10,123 -- 7,783 71,129 209,107 298,142
Disposals (13,157) -- (2,600) (2,861) (32) (18,650)
Transfers 4,396 -- 4,174 68,894 (77,464) - -
Depreciation charge (12,549) (295) (5,428) (106,296) -- (124,568)
Closing net book value 378,127 13,899 66,471 362,010 280,827 1,101,334
At 31 March 2007Cost 478,186 15,978 114,643 1,015,085 280,827 1,904,719
Accumulated depreciation (100,059) (2,079) (48,172) (653,075) -- (803,385)
Net book value 378,127 13,899 66,471 362,010 280,827 1,101,334
Year ended 31 March 2008Opening net book value 378,127 13,899 66,471 362,010 280,827 1,101,334
Translation adjustment (266) -- (332) (1,815) 713 (1,700)
Adjusted opening net
book value 377,861 13,899 66,139 360,195 281,540 1,099,634
Additions 8,849 -- 4,835 52,715 239,329 305,728
Disposals (7,705) (5,804) (69) (5,772) -- (19,350)
Transfers 13,829 25,634 9,158 79,916 (128,537) --
Depreciation charge (13,227) (541) (7,107) (112,906) -- (133,781)
Closing net book value 379,607 33,188 72,956 374,148 392,332 1,252,231
At 31 March 2008Cost 488,784 38,088 130,041 1,080,903 392,332 2,130,148
Accumulated depreciation (109,177) (4,900) (57,085) (706,755) -- (877,917)
Net book value 379,607 33,188 72,956 374,148 392,332 1,252,231

Annual Report 2008 35
2008 2007 ($’000) ($’000)
Notes to the Consolidated Financial Statements (continued)Expressed in Trinidad and Tobago Dollars, year ended 31 March 2008
11 Premises And Equipment (continued)
Included in premises and equipment is floor space leased by a Group company to third parties under operating leases:
2008 2007 ($’000) ($’000)
Aggregate rentals receivable:
Not later than one year 435 490
Later than one year and no later than five years 1,739 1,960
2,174 2,450
Borrowing costs capitalised as at 31 March 2008 totalled $12.8 million (2007 - $8.7 million).
12 Deferred Taxation
The following amounts are shown in the consolidated balance sheet:
Deferred tax assets 33,906 40,754
Deferred tax liabilities (296,496) (213,401)
(262,590) (172,647)
The movement on the deferred tax account is as follows:
At beginning of year (172,647) (158,048)
Effect of changes in exchange rate (386) 496
Income statement charge (Note 27) (36,355) (27,909)
Investment revaluation reserve
- Fair value (gains)/losses (66,072) 18,065
- Gain/(losses) transferred to the income statement 12,870 (5,251)
At end of year (262,590) (172,647)

Annual Report 200836
2008 2007 ($’000) ($’000)
Notes to the Consolidated Financial Statements (continued)Expressed in Trinidad and Tobago Dollars, year ended 31 March 2008
12 Deferred Taxation (continued)
2008 2007 ($’000) ($’000)
Deferred tax assets and liabilities are attributable to the following items:
Deferred tax assets Investment securities available-for-sale 14,433 10,669
Post retirement benefits -- 11,100
Accelerated tax depreciation 59 664
Tax losses 4,540 10,373
Interest payable 6,810 7,948
Allowance for impairment on loans and advances 8,064 --
33,906 40,754
Deferred tax liabilities
Accelerated goodwill amortisation 66,060 63,279
Accelerated tax depreciation 53,605 45,232
Post retirement benefits 429 7,696
Investment securities available-for-sale 80,797 23,623
Investment securities at fair value through profit or loss 17,420 3,935
Unrealised gains on derivative financial instruments 42,489 39,921
Regulatory loan loss reserve 19,593 17,032
Allowance for impairment losses on loans and advances (534) (4,763)
Interest receivable 15,705 17,446
Unrealised foreign exchange gains 932 --
296,496 213,401
13 Other Assets
‘
Corporation tax recoverable 43,669 45,949
Other taxes recoverable 48,939 41,300
Other 288,076 266,161
380,684 353,410

Annual Report 2008 37
2008 2007 ($’000) ($’000)
Notes to the Consolidated Financial Statements (continued)Expressed in Trinidad and Tobago Dollars, year ended 31 March 2008
14 Customers’ Deposits
2008 2007 ($’000) ($’000)
Savings 11,597,974 10,935,498
Term deposits 12,026,765 9,832,169
Current accounts 8,526,060 7,698,152
32,150,799 28,465,819
Accrued interest 249,885 199,556
32,400,684 28,665,375
Sectoral analysis
Consumers 16,048,359 14,022,275
Private sector 11,257,513 10,587,686
State sector 4,034,402 3,295,922
Other 810,525 559,936
32,150,799 28,465,819
15 Other Funding Instruments
Other funding instruments 7,872,925 7,699,863
Accrued interest 110,805 96,040
7,983,730 7,795,903
Sectoral analysis
Consumers 1,164,186 992,296
Private sector 4,380,692 3,512,666
State sector 2,040,454 2,853,538
Other 287,593 341,363
7,872,925 7,699,863
Other funding instruments consist of asset-backed fund raising instruments which include securities sold subject to repurchase
agreements (repos). Interest rates on other funding instruments ranged from 2.25% to 14.95% (2007 – 3% to 13.5%).

Annual Report 200838
Notes to the Consolidated Financial Statements (continued)Expressed in Trinidad and Tobago Dollars, year ended 31 March 2008
16 Other Borrowed Funds
2008 2007 ($’000) ($’000)
Short-term credit lines 656,777 404,754
Long-term loan agreements 1,060,422 781,741
Private placements 704,940 1,011,885
2,422,139 2,198,380
Accrued interest 19,251 22,795
2,441,390 2,221,175
As part of its fundraising activities, the Group accesses different sources of financing among short-term, long-term and
private placements.
Short-term borrowings consist of revolving credit lines and other bank credit line facilities with maturities up to one year.
Long term borrowings consist of bank borrowings with maturities in excess of five years. Private placements consist of
commercial paper issued by the Group to selected sophisticated investors with maturities of up to three years.
Interest rates on borrowings which are principally in US dollars as at 31 March 2008 ranged from 3.19% to 8.5%
(2007 – 5.32% to 7.19%).
17 Debt Securities In Issue
2008 2007 ($’000) ($’000)
Debt securities in issue 972,199 981,306
Accrued interest 6,707 7,096
978,906 988,402
Debt securities in issue as at 31 March 2008 include the following:
Maturity Term Date Interest Rate
TT$200 Million Bond 10 years April 2014 6.75% Fixed
US$100 Million Bond 10 years March 2015 6.60% Fixed
US$40 Million Bond 5 years December 2009 5.45% Floating
These financial statements account for debt securities only to the extent that they are participated in by third parties.

Annual Report 2008 39
Notes to the Consolidated Financial Statements (continued)Expressed in Trinidad and Tobago Dollars, year ended 31 March 2008
18 Post-Retirement Benefit Obligations Apart from the pension plans, the Group operates other post-retirement benefit plans. The method of accounting and the
frequency of valuations are similar to those used for defined benefit pension plans.
The amounts recognised on the balance sheet for other post-retirement benefit plans are as follows:
2008 2007 ($’000) ($’000)
Post-retirement benefit obligation 66,457 99,786
Unrecognised actuarial gain 27,689 26,884
Liability in the balance sheet 94,146 126,670
The movements in the liability recognised on the balance sheet are as follows:
At beginning of year 126,670 136,416
Net benefit credit (30,671) (8,465)
Benefits paid by group companies
(net of retirees’ premiums) (1,853) (1,281)
At end of year 94,146 126,670
Change in post-retirement benefit obligation:
Defined benefit obligation at beginning of year 99,786 117,894
Current service cost 2,192 6,800
Interest cost 5,396 9,077
Past service cost (37,131) (23,895)
Actuarial gains (1,933) (8,809)
Benefits paid (1,853) (1,281)
66,457 99,786
The amounts recognised in the income statement are as follows:
Current service cost 2,192 6,800
Interest cost 5,396 9,077
Amortised net gain (1,128) (447)
Past service cost (37,131) (23,895)
Net benefit credit included in staff costs (Note 26.1) (30,671) (8,465)
The principal actuarial assumptions used were as follows:
Discount rate 8.75% 8.75%
Medical costs trend rates 7.00% 7.00%

Annual Report 200840
19 Share Capital
Number of Ordinary Share Shares Capital (‘000) ($’000)Year ended 31 March 2007
At 1 April 2006 343,465 864,021
Share option plan:
-Value of services provided -- 8,526
- Proceeds from shares issued 254 3,977
At 31 March 2007 343,719 876,524
Year ended 31 March 2008
At 1 April 2007 343,719 876,524
Share option plan:
-Value of services provided -- 7,468
- Proceeds from shares issued 353 6,434
At 31 March 2008 344,072 890,426
The total authorised number of ordinary shares at year end was unlimited with no par value. All issued shares are fully
paid.
Combination Agreement signed with Royal Bank of Canada on 1 October 2007
On 1 October 2007, RBTT Financial Group (RBTT) entered into an agreement with Royal Bank of Canada (RBC) to combine
RBC’s Caribbean retail banking operations with RBTT’s, through the acquisition of RBTT for a total purchase consideration
of TT$13.8 billion (approximately US$2.2 billion at exchange rates as of 28 September 2007).
Under the agreement, RBTT shareholders will receive per share consideration of TT$40 payable in a combination of cash
(60%) and RBC common shares (40%). The number of RBC common shares to be received by RBTT shareholders is subject
to a plus or minus 10% “collar” based on RBC’s share price of US$54.42 (the average trading price of RBC common shares
on the New York Stock Exchange for the five consecutive trading days ending on 28 September 2007).
At a Special Meeting of the shareholders of RBTT held on 26 March 2008, the amalgamation resolution was approved by
98.2% of the votes cast by holders of ordinary shares.
The closing of the transaction is subject to the receipt of regulatory approvals which are expected in June 2008.
Notes to the Consolidated Financial Statements (continued)Expressed in Trinidad and Tobago Dollars, year ended 31 March 2008

Annual Report 2008 41
19 Share Capital
Share Options
At the Annual Meeting in 1999, the shareholders approved the establishment of a share option plan for non-executive
directors and senior management. The shareholders also approved the number of shares allocated to the Plan. Effective 17
April 2005, non-executive directors waived their rights to participate in additional grants of share options under the share
option plan.
The status of shares allocated to the plan as at the year end is as follows:
Number of share options 2008 2007
Total number of shares allocated to the plan 17,012,164 17,012,164
Issued pursuant to exercise of options (3,852,685) (3,499,596)
Outstanding options (3,855,743) (3,627,238)
Remaining shares allocated to the plan in respect of
which options have not been granted 9,303,736 9,885,330
The options granted are exercisable at the market value of the shares on the respective dates of grant and vest equally over
a four year period. The options are normally exercisable starting one year from the grant date up to the tenth anniversary
of the date of grant. The Group has no legal or constructive obligation to repurchase or settle the options in cash. See
amendment to the plan described below.
The movement in the number of share options outstanding for the year is as follows:
Number of share options 2008 2007
At beginning of year 3,627,238 3,408,118
Granted 816,418 672,740
Exercised (353,089) (254,585)
Lapsed (234,824) (199,035)
At end of year 3,855,743 3,627,238
Share options were granted on 1 April 2007 at a price of $32.00 (1 April 2006: $31.30) and expire on 31 March 2017 (prior
year – 31 March 2016), subject to the amendment described below. Options exercised during the financial year resulted in
353,089 shares being issued (2007 – 254,585 shares issued) at a weighted average price of $18.22 (2007: $15.62). Options
that lapsed during the financial year amounted to 234,824 options (2007: 199,035) at an average weighted price of $39.19
(2007: $39.45).
The value of services received for the year was $7.5 million (2007: $8.5 million) which was charged to the income
statement.
Notes to the Consolidated Financial Statements (continued)Expressed in Trinidad and Tobago Dollars, year ended 31 March 2008

Annual Report 200842
19 Share Capital (continued)
Share Options (Continued)
Share options outstanding at 31 March 2008 have the following expiry dates and exercise prices, subject to the amendment
described below:
Expiry date Exercise price Number of share $ options outstanding 2008 2007
31 March 2010 13.60 19,672 24,128
31 March 2011 12.00 123,831 137,675
31 March 2012 14.61 251,346 397,882
31 March 2013 21.60 538,155 726,408
31 March 2014 45.30 731,316 800,347
31 March 2015 43.26 793,967 868,058
31 March 2016 31.30 581,038 672,740
31 March 2017 32.00 816,418 --
3,855,743 3,627,238
The weighted average price of share options outstanding as at 31 March 2008 was $33.41 (2007: $32.63).
Using the binomial valuation model, the fair value of share options granted in 2008 was $10.98 (2007: $10.71). The
significant inputs to the model are the share price on the grant date, vesting period, risk free rate of return as at the grant
date, the volatility in share price over the last five years and the average attrition rate over the prior two years.
Amendment to Option Plan Pursuant to Combination Agreement dated 1 October 2007
Pursuant to the Combination Agreement, the RBTT Option Plan has been amended such that, subject to and conditional
upon closing of the combination transaction, (i) all issued and outstanding RBTT options will be deemed to have vested,
immediately prior to the closing date; (ii) each unexercised RBTT in-the-money option will be deemed cancelled, immediately
prior to the closing date, in exchange for a cash amount equal to the difference between the per share consideration and its
exercise price; (iii) each RBTT out-of-money option will be cancelled immediately prior to the closing date without payment
of any further consideration; and (iv) no exercises of RBTT options shall be permitted from and after the date that is five (5)
business days prior to the closing date.
20 Statutory Reserves
The Financial Institutions Act, 1993 requires financial institutions in Trinidad and Tobago to transfer annually a minimum of
10% of its profit after taxation to a reserve fund until the balance on this reserve is not less than the paid up capital of the
institution. The Central Banks of Aruba, Curaçao, Barbados, Jamaica and the Eastern Caribbean impose similar obligations
on financial institutions operating within their territories.
Notes to the Consolidated Financial Statements (continued)Expressed in Trinidad and Tobago Dollars, year ended 31 March 2008

Annual Report 2008 43
21 Other Reserves
2008 2007 ($’000) ($’000)
Capital reserves 156,079 137,202
Translation reserve (307,728) (272,863)
Investment revaluation reserve 170,795 (1,717)
General banking risks reserve 272,796 247,137
291,942 109,759
21.1 Capital reserves
Capital reserves include several reserve accounts, the most significant of which is the retained earnings reserve of
$153,111 million maintained by certain banking subsidiaries. The Banking Acts in certain jurisdictions permit the
transfer of any portion of net profits to a retained earnings reserve. Such transfers are made at the discretion of the
Board and must be notified to the Central Bank.
Balance at beginning of year 137,202 113,125
Prior year adjustment to reverse property revaluation reserve -- (12,946)
- as adjusted 137,202 100,179
Currency translation differences arising during the year -- (12)
Other reserve movements 18,877 37,035
Balance at end of year 156,079 137,202
21.2 Translation reserve
Balance at beginning of year (272,863) (244,871)
Translation movement on prior year adjustments -- (164)
- as adjusted (272,863) (245,035)
Currency translation differences arising during the year (34,865) (27,828)
Balance at end of year (307,728) (272,863)
21.3 Investment revaluation reserve – securities available-for-sale
Balance at beginning of year (1,717) 42,556
Prior year adjustment to reverse fair value movement -- (936)
- as adjusted (1,717) 41,620
Fair value gains/(losses) arising during the year, net of tax 202,855 (49,418)
Realised (gains)/losses transferred to income, net of tax (30,342) 3,808
Currency translation differences arising during the year (1) 2,273
Balance at end of year 170,795 (1,717)
Notes to the Consolidated Financial Statements (continued)Expressed in Trinidad and Tobago Dollars, year ended 31 March 2008

Annual Report 200844
21 Other Reserves (continued)
2008 2007 ($’000) ($’000)
21.4 General banking risks reserve
This is a non-distributable reserve representing the excess of the provision for credit losses determined in accordance
with regulatory requirements over the amount determined under IFRS.
Balance at beginning of year 247,137 206,958
Currency translation differences arising during the year 235 (143)
Transferred from retained earnings 25,996 39,750
Other reserve movements (572) 572
Balance at end of year 272,796 247,137
22 Minority Interest
This represents 38% shareholding in RBTT Bank Grenada Limited and 4.6% in RBTT Bank (SKN) Limited.
23 Interest Income
2008 2007 ($’000) ($’000)
Loans and advances to customers 2,542,510 2,226,282
Investment securities 1,080,323 1,013,165
Due from banks 146,139 134,895
3,768,972 3,374,342
24 Interest Expense
2008 2007 ($’000) ($’000)
Customers’ deposits 908,719 775,504
Due to banks 114,901 107,748
Other interest bearing liabilities 649,951 644,487
1,673,571 1,527,739
Notes to the Consolidated Financial Statements (continued)Expressed in Trinidad and Tobago Dollars, year ended 31 March 2008
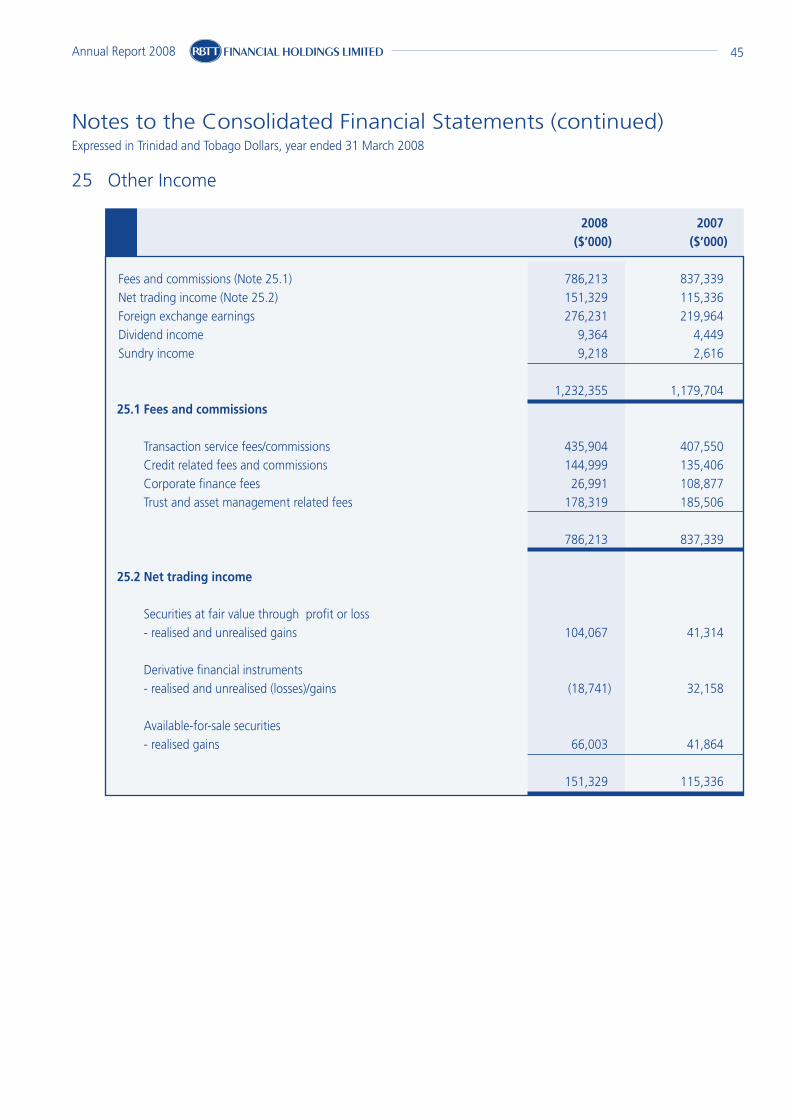
Annual Report 2008 45
25 Other Income
2008 2007 ($’000) ($’000)
Fees and commissions (Note 25.1) 786,213 837,339
Net trading income (Note 25.2) 151,329 115,336
Foreign exchange earnings 276,231 219,964
Dividend income 9,364 4,449
Sundry income 9,218 2,616
1,232,355 1,179,704
25.1 Fees and commissions
Transaction service fees/commissions 435,904 407,550
Credit related fees and commissions 144,999 135,406
Corporate finance fees 26,991 108,877
Trust and asset management related fees 178,319 185,506
786,213 837,339
25.2 Net trading income
Securities at fair value through profit or loss
- realised and unrealised gains 104,067 41,314
Derivative financial instruments
- realised and unrealised (losses)/gains (18,741) 32,158
Available-for-sale securities
- realised gains 66,003 41,864
151,329 115,336
Notes to the Consolidated Financial Statements (continued)Expressed in Trinidad and Tobago Dollars, year ended 31 March 2008

Annual Report 200846
Notes to the Consolidated Financial Statements (continued)Expressed in Trinidad and Tobago Dollars, year ended 31 March 2008
26 Operating Expenses
2008 2007 ($’000) ($’000)
Staff costs (Note 26.1) 1,071,397 1,040,089
Premises and equipment expenses, excluding
depreciation and operating lease rentals 189,783 171,602
Advertising 65,240 60,630
Depreciation 133,781 124,568
Deposit insurance premium (Note 26.2) 25,194 20,611
Operating lease rentals 81,291 70,392
Directors’ fees 7,799 8,952
Auditors’ fees 7,940 6,747
Other operating expenses 429,745 328,871
2,012,170 1,832,462
26.1 Staff costs
Wages and salaries including bonuses 1,032,290 959,366
Employees’ pension benefit expense 62,310 80,662
Employees’ post-retirement benefit credit (Note 18) (30,671) (8,465)
Share option plan-value of services provided 7,468 8,526
1,071,397 1,040,089
The average number of employees in 2008 was 5,327 (2007: 5,404).
26.2 Deposit insurance premium
Statutory regulations governing the operations of banks and other financial institutions in Trinidad and Tobago,
Barbados, St. Vincent and Jamaica stipulate that an annual premium be paid to a Deposit Insurance Fund based on
insurable deposit liabilities outstanding at the end of each quarter of the preceding year. The basis of calculation varies
across the legal jurisdictions.

Annual Report 2008 47
Notes to the Consolidated Financial Statements (continued)Expressed in Trinidad and Tobago Dollars, year ended 31 March 2008
27 Taxation
2008 2007 ($’000) ($’000)
Current tax charge 329,186 236,754
Green fund levy 3,642 2,672
Prior years 683 (21,816)
Net deferred tax charge (Note 12) 36,355 27,909
Share of tax charge of associate companies and joint venture 701 1,292
370,567 246,811
The tax on profit before taxation differs from the theoretical amount that would arise using the basic tax rate of the home
country of the parent company as follows:
Profit before tax 1,309,262 1,180,818
Prima facie tax calculated at a rate of 25% 327,316 295,205
Effect of different tax rates in other countries 55,723 52,443
Effect of different tax rates on certain sources of income (2,239) 1,427
Income exempt from tax (106,729) (126,544)
Expenses not deductible for tax 57,468 30,722
Utilisation of tax losses not previously recognised -- (4,450)
Effect of current year unrecognised tax losses 29,931 19,477
Prior years 683 (21,816)
Green fund levy 3,642 2,672
Business levy 432 464
Other 4,340 (2,789)
370,567 246,811
The deferred tax charge for the year comprises the following temporary differences:
Accelerated goodwill amortisation 1,910 2,834
Accelerated tax depreciation 9,756 9,655
Unrealised gains/(losses) on derivative financial instruments (1,364) 5,969
Allowance for impairment losses on loans and advances (4,100) 2,264
Investment securities at fair value through profit or loss 17,417 7,575
Post retirement benefits 3,741 7,422
Tax losses 5,901 4,383
Regulatory loan loss reserve 2,561 (12,018)
Other temporary differences 533 (175)
36,355 27,909

Annual Report 200848
Notes to the Consolidated Financial Statements (continued)Expressed in Trinidad and Tobago Dollars, year ended 31 March 2008
28 Earnings Per Share
Earnings per share is calculated by dividing the net profit attributable to shareholders by the weighted average number of
ordinary shares in issue during the year.
2008 2007 (’000) (’000)
Profit attributable to shareholders of the company $ 931,139 $931,179
Weighted average number of ordinary shares in issue 343,917 343,603
Basic earnings per share $2.71 $2.71
For the diluted earnings per share, the weighted average number of ordinary shares in issue is adjusted to assume conversion
of all dilutive potential ordinary shares. The company has one category of dilutive potential ordinary shares which is share
options granted to non-executive directors and senior management (See Note 19).
2008 2007 (’000) (’000)
Weighted average number of ordinary shares in issue $ 343,917 $ 343,603
Adjustment for:
- Share options -- --
Weighted average number of ordinary shares for diluted earnings per share 343,917 343,603
Diluted earnings per share $2.71 $2.71

Annual Report 2008 49
Notes to the Consolidated Financial Statements (continued)Expressed in Trinidad and Tobago Dollars, year ended 31 March 2008
29 Dividends
On 8 May 2008, the Board of Directors declared a final dividend of 65¢ per share bringing the total dividends in respect of the
current year to $1.25 per share (2007 - $1.25 per share). These financial statements do not reflect the final dividend which
will be accounted for as an appropriation of retained earnings in the subsequent reporting period.
Dividends accounted for as an appropriation of retained earnings are as follows:
2008 2007 ($’000) ($’000)
Final dividend for 2007 - 65¢ per share (2006 - 65¢ per share) 223,466 223,288
Interim dividend for 2008 - 60¢ per share (2007 - 60¢ per share) 206,439 206,189
429,905 429,477
30 Contingent Liabilities
a) Legal proceedings
As at 31 March 2008, there were certain legal proceedings outstanding against the Group. No provision has been made
as professional advice indicates that it is unlikely that any significant loss will arise.
b) Customers’ liability under acceptances, guarantees, indemnities and letters of credit
These represent the Group’s potential liability, for which there are equal and offsetting claims against its customers in
the event of a call on these commitments. These amounts are not reflected in the balance sheet.
2008 2007 ($’000) ($’000)
Bankers’ acceptances and participatory investment certificates 158,167 157,218
Guarantees, indemnities and letters of credit 1,694,641 1,930,109
1,852,808 2,087,327

Annual Report 200850
Notes to the Consolidated Financial Statements (continued)Expressed in Trinidad and Tobago Dollars, year ended 31 March 2008
31 Credit Commitments Gross Maximum Gross Maximum Exposure 2008 Exposure 2007
($’000) ($’000)
Consumer 134,532 138,318
Manufacturing 173,848 189,850
Distribution 469,768 392,402
Financial services 44,987 35,604
Transport 30,962 48,424
Construction 215,856 119,073
Petroleum 8,000 300
Agriculture 4,330 9,228
Real estate 264,896 252,545
Tourism 251,616 300,212
Professional services 124,033 134,222
Utilities 642,849 1,012,617
Health services 9,132 87
Government 6,554 --
Other 105,429 144,231
2,486,792 2,777,113
32 Capital And Lease Commitments
The Group’s capital commitments, principally in respect of building construction and renovation and information technology
projects are $88.9 million as at 31 March 2008 (2007 - $273 million).
2008 2007 ($’000) ($’000)
Operating lease commitments are as follows: Premises
Within one year 80,493 51,524
One to five years 232,755 188,879
Over five years 368,116 47,697
681,364 288,100

Annual Report 2008 51
33 Related Party Transactions
Parties are considered to be related if one party has the ability to control the other party or exercise significant influence over
the other party in making financial or operational decisions. The ultimate parent of the Group is RBTT Financial Holdings
Limited.
A number of banking transactions are entered into with related parties in the normal course of business. These transactions
are carried out on commercial terms and conditions and at market rates.
2008 2007 ($’000) ($’000)
Outstanding balances
Loans and investments
Associates 375,644 339,001
Directors and key management personnel 33,427 22,013
Other related parties 825,105 791,018
1,234,176 1,152,032
Deposits and other liabilitiesAssociates 27,691 47,109
Directors and key management personnel 21,193 31,148
Other related parties 417,891 375,548
466,775 453,805
Interest income
Associates 6,202 5,096
Directors and key management personnel 1,330 1,253
Other related parties 41,857 20,969
49,389 27,318
Fees and commissions
Other related parties -- 9,193
Interest expenseAssociates 1,393 1,920
Directors and key management personnel 584 1,200
Other related parties 697 517
2,674 3,637
Key management personnel are those persons having authority and
responsibility for planning, directing and controlling the actions of the Group.
Key management compensation
Salaries and other short term benefits 40,240 40,106
Share-based payments 7,468 8,526
47,708 48,632
Notes to the Consolidated Financial Statements (continued)Expressed in Trinidad and Tobago Dollars, year ended 31 March 2008

Annual Report 200852
34 Financial Risk Management
34.1 Risk Management
Risk is inherent in the Group’s activities but it is managed through a process of ongoing identification, measurement
and monitoring subject to risk limits and other controls. This process of risk management is critical to the Group’s
continuing profitability and each individual company within the Group is accountable for the risk exposures relating
to its responsibilities. The Group is exposed to credit risk, liquidity risk, operating risk and market risk, the latter being
subdivided into trading and non-trading risks.
Risk management structure
The Board of Directors is ultimately responsible for identifying and controlling risks; however, there are separate
independent bodies responsible for managing and monitoring risks.
Board of directors
The Board of Directors is responsible for the overall risk management approach and for approving the risk strategies and
principles.
Board risk committee
The Board of Directors discharges its responsibility for overall risk management through the Board Risk Committee
which has the overall responsibility to oversee the development, interpretation and implementation of Group policies for
identifying, evaluating, monitoring and measuring the significant risks to which the Group is exposed. The Committee
also approves all new policies and reviews such policies annually to ensure that they remain appropriate and prudent. The
Committee is comprised of three (3) Non-Executive Directors of the parent company together with the Group CEO.
Board credit and investment committee
This Committee is comprised of three (3) Non-Executive Directors of the parent company together with the Group CEO.
The Committee is responsible for the review and approval of all credits over limits delegated to management throughout
the Group. The Committee also reviews the amount, nature, risk characteristics and concentration of the Group’s credit
portfolio and ensures appropriate responses to changing conditions.
Risk management unit
A centralised Risk Management Unit provides oversight of the implementation and maintenance of risk related procedures
to ensure an independent control process. The unit which is sub-divided into three departments (Group Market Risk,
Group Credit Risk and Group Compliance and Operational Risk), is also responsible for monitoring compliance with risk
policies and limits across the Group in the three key areas of credit risk, market risk and operational risk. Each business
unit has decentralised units which are responsible for the independent control of risks, including monitoring the risk or
exposures against limits and the assessment of risks of new products and structured transactions. These decentralised
units also ensure the risks are completely captured in the risk measurement and reporting systems.
Notes to the Consolidated Financial Statements (continued)Expressed in Trinidad and Tobago Dollars, year ended 31 March 2008

Annual Report 2008 53
34 Financial Risk Management (continued)
34.1 Risk Management (continued)
Group asset/liability committee (ALCO)
The Group ALCO has a mandate which includes the recommendation of policies covering investments, liquidity and
market risk to the parent Board, and the monitoring of compliance with risk policies and limits in the areas of credit risk
and market risk.
Mark to market committee
The Group has established a Mark to Market Committee which is responsible for the review and validation of the policies
and procedures applied in the valuation of financial assets and liabilities. The Committee also approves the mark to
market valuation of financial assets and liabilities on a quarterly basis.
Internal audit
Risk management processes throughout the Group are audited by the internal audit function that examines both the
adequacy of the procedures and the Group’s compliance with the procedures. Internal Audit discusses the results of all
assessments with management, and reports its findings and recommendations to the parent Board Audit Committee
and subsidiary Boards Audit Committees.
Risk measurement and reporting systems
The Group’s risks are measured using methods which reflect the expected loss likely to arise in normal circumstances.
Monitoring and controlling risks is primarily performed based on limits established by the Group. These limits reflect the
business strategy and market environment of the Group as well as the level of risk that the Group is willing to accept,
with additional emphasis on selected industries and geographies.
Information compiled from all the business units is examined and processed in order to analyse, control and identify risks
early. This information which consists of several reports is presented and explained to the Board of Directors, the Board
Committees, the Asset/Liability Committees, and the head of each business unit. The reports include but are not limited
to aggregate credit exposure, open currency positions, liquidity ratios and risk profile changes. On a quarterly basis,
senior management assesses the appropriateness of the allowance for credit losses.
For all levels throughout the Group, specifically tailored risk reports are prepared and distributed in order to ensure that
all business units have access to necessary and up-to-date information.
Risk mitigation
As part of its overall risk management, the Group uses derivatives and other instruments to manage exposures resulting
from changes in interest rates and foreign currencies.
Notes to the Consolidated Financial Statements (continued)Expressed in Trinidad and Tobago Dollars, year ended 31 March 2008
Annual Report 200854
34 Financial Risk Management (continued)
34.1 Risk Management (continued)
Risk mitigation (continued)
The risk profile is assessed before entering into hedge transactions, which are authorised by the appropriate level of
seniority within the Group. The effectiveness of hedges is assessed by the Group Market Risk and Group Finance units
(based on economic considerations rather than the IFRS hedge accounting regulations). The effectiveness of all the
hedge relationships is monitored by the Group Market Risk Unit monthly.
The Group actively uses collateral to reduce its credit risks.
34.2 Liquidity Risk
Liquidity risk is the risk that the Group will be unable to meet its payment obligations when they fall due under normal
and stress circumstances. To limit this risk, management has arranged diversified funding sources in addition to its core
deposit base, manages assets with liquidity in mind, and monitors future cash flows and liquidity on a daily basis. This
incorporates an assessment of expected cash flows and the availability of high grade collateral which could be used to
secure additional funding if required.
The Group’s liquidity management process is carried out by the Treasury department of each business unit and monitored
by the Unit ALCO and Group ALCO. The Group’s liquidity management framework is designed to ensure that there are
adequate reserves of cash and other liquid securities to satisfy current and prospective commitments arising from either
on-balance sheet or off-balance sheet liabilities. The Group manages liquidity risk by preserving a large and diversified
base of core client deposits, by maintaining ongoing access to wholesale funding and by maintaining a liquid pool of
marketable securities dedicated to mitigating liquidity risk as a contingency measure. Each business unit has conservative
internal liquidity requirements, defined by the Group’s liquidity management framework, which are at least equal to, but
generally greater than, the statutory liquidity requirements.
Notes to the Consolidated Financial Statements (continued)Expressed in Trinidad and Tobago Dollars, year ended 31 March 2008
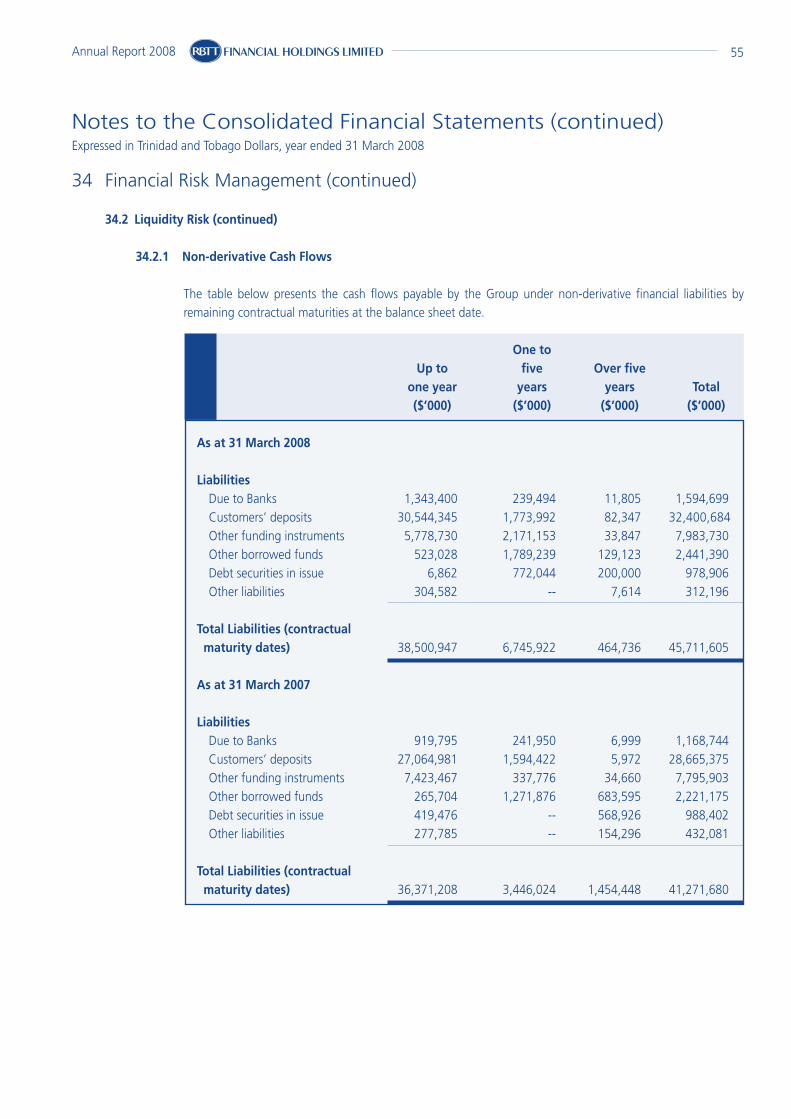
Annual Report 2008 55
34 Financial Risk Management (continued)
34.2 Liquidity Risk (continued)
34.2.1 Non-derivative Cash Flows
The table below presents the cash flows payable by the Group under non-derivative financial liabilities by
remaining contractual maturities at the balance sheet date.
One to Up to five Over five one year years years Total ($’000) ($’000) ($’000) ($’000)
As at 31 March 2008
LiabilitiesDue to Banks 1,343,400 239,494 11,805 1,594,699
Customers’ deposits 30,544,345 1,773,992 82,347 32,400,684
Other funding instruments 5,778,730 2,171,153 33,847 7,983,730
Other borrowed funds 523,028 1,789,239 129,123 2,441,390
Debt securities in issue 6,862 772,044 200,000 978,906
Other liabilities 304,582 -- 7,614 312,196
Total Liabilities (contractual maturity dates) 38,500,947 6,745,922 464,736 45,711,605
As at 31 March 2007
LiabilitiesDue to Banks 919,795 241,950 6,999 1,168,744
Customers’ deposits 27,064,981 1,594,422 5,972 28,665,375
Other funding instruments 7,423,467 337,776 34,660 7,795,903
Other borrowed funds 265,704 1,271,876 683,595 2,221,175
Debt securities in issue 419,476 -- 568,926 988,402
Other liabilities 277,785 -- 154,296 432,081
Total Liabilities (contractual maturity dates) 36,371,208 3,446,024 1,454,448 41,271,680
Notes to the Consolidated Financial Statements (continued)Expressed in Trinidad and Tobago Dollars, year ended 31 March 2008

Annual Report 200856
34 Financial Risk Management (continued)
34.2 Liquidity Risk (continued)
34.2.2 Derivative Cash Flows
The table below analyses the Group’s derivative financial instruments that will be settled on (a) a net basis and
(b) a gross basis into relevant maturity groupings based on the remaining period at the balance sheet date
to the contractual maturity date. The amounts disclosed in the table are the contractual undiscounted cash
flows.
One to Up to five Over five one year years years Total ($’000) ($’000) ($’000) ($’000)
As at 31 March 2008
a) Derivatives settled on a net basis - Foreign exchange derivatives -- -- -- --
- Interest rate derivatives -- -- -- --
-- -- -- --
b) Derivatives settled on a gross basisForeign exchange derivatives- Outflow (567,520) (827,198) (1,161,751) (2,556,468)
- Inflow 616,034 904,804 929,975 2,450,813
Interest rate derivatives- Outflow (13,508) (18,536) (2,337) (34,381)
- Inflow 19,357 29,359 7,287 56,003
Total outflow (581,028) (845,733) (1,164,088) (2,590,849)
Total inflow 635,391 934,163 937,262 2,506,816
Notes to the Consolidated Financial Statements (continued)Expressed in Trinidad and Tobago Dollars, year ended 31 March 2008

Annual Report 2008 57
34 Financial Risk Management (continued)
34.2 Liquidity Risk (continued)
34.2.2 Derivative Cash Flows (continued)
One to Up to five Over five one year years years Total ($’000) ($’000) ($’000) ($’000)
As at 31 March 2007
a) Derivatives settled on a net basis - Foreign exchange derivatives -- -- -- --
- Interest rate derivatives -- -- -- --
-- -- -- --
b) Derivatives settled on a gross basisForeign exchange derivatives- Outflow (476,012) (1,143,595) (1,261,445) (2,881,052)
- Inflow 484,314 1,234,868 1,171,809 2,890,991
Interest rate derivatives- Outflow (10,265) (21,424) (2,549) (34,238)
- Inflow 16,229 36,550 8,221 61,000
Total outflow (486,277) (1,165,019) (1,263,994) (2,915,290)
Total inflow 500,543 1,271,418 1,180,030 2,951,991
Notes to the Consolidated Financial Statements (continued)Expressed in Trinidad and Tobago Dollars, year ended 31 March 2008

Annual Report 200858
34 Financial Risk Management (continued)
34.2 Liquidity Risk (continued)
34.2.3 Contingent Liabilities and Commitments
The table below summarizes the Group’s contingent liabilities and commitments based on contractual maturity
dates.
One to Up to five Over five one year years years Total ($’000) ($’000) ($’000) ($’000)
As at 31 March 2008Guarantees, acceptances, indemnities
and letters of credit 1,750,562 49,069 53,177 1,852,808
Credit commitments 1,502,094 807,824 176,874 2,486,792
Operating lease commitments 80,493 232,755 368,116 681,364
Capital commitments 88,925 -- -- 88,925
3,422,074 1,089,648 598,167 5,109,889
As at 31 March 2007Guarantees, acceptances, indemnities
and letters of credit 1,824,122 176,419 86,786 2,087,327
Credit commitments 1,560,782 1,082,847 133,484 2,777,113
Operating lease commitments 51,524 188,879 47,697 288,100
Capital commitments 272,974 -- -- 272,974
3,709,402 1,448,145 267,967 5,425,514
Notes to the Consolidated Financial Statements (continued)Expressed in Trinidad and Tobago Dollars, year ended 31 March 2008

Annual Report 2008 59
34 Financial Risk Management (continued)
34.3 Market Risk
The Group takes on exposure to market risks, which is the risk that the fair value or future cash flows of a financial
instrument will fluctuate because of changes in market prices. Market risks arise from open positions in interest rate,
currency and equity products, all of which are exposed to general and specific market movements and changes in the
level of volatility of market rates or prices such as interest rates, credit spreads, foreign exchange rates and equity prices.
The Group separates exposures to market risk into either trading or non-trading portfolios.
The market risks arising from trading and non-trading activities are measured separately by the Group Market Risk
department who submits reports to the Group Asset/Liability Committee on a regular basis. Additionally, on a quarterly
basis, the Mark to Market Committee reviews and approves the valuation of all investment securities, derivatives and
trading liabilities.
Trading portfolios include those portfolios arising from market-making transactions where the Group acts as a principal
with clients or with the market.
Non-trading portfolios primarily arise from the interest-rate management of the Group’s retail and commercial banking
assets and liabilities. Non-trading portfolios also consist of interest rate, foreign exchange and equity risks arising from
the Group’s held-to-maturity and available-for-sale.
34.3.1 Market risk measurement techniques
The major measurement technique used by the Group to measure and control market risk is stress testing.
The Group applies stress tests to provide an indication of the potential size of losses that could arise in extreme
conditions. The stress tests carried out by Group Market Risk consist of risk sensitivity analyses by applying
possible stress events such as changes to interest rates and foreign currency rates on the Group’s positions. The
impact of the stress test is measured to calculate the effect on net interest income. The test does not measure
the impact on fair values.
34.3.2 Interest rate risk
Interest rate risk arises from the possibility that changes in interest rates will affect future cash flows or the
fair values of financial instruments. The Board has established limits on the level of mismatch of interest rate
repricing that may be taken, which is monitored by the Treasurers and Asset/Liability Committees of group
companies.
Sensitivity analyses were conducted to determine the effect on net profit and other components of equity
arising from a reasonable change in interest rates with all other variables held constant.
Notes to the Consolidated Financial Statements (continued)Expressed in Trinidad and Tobago Dollars, year ended 31 March 2008

Annual Report 200860
34 Financial Risk Management (continued)
34.3 Market Risk (continued)
34.3.2 Interest rate risk (continued)
Effect on Other Effect on Other Effect on Components of Effect on Components Net Profit Equity Net Profit Equity 2008 2008 2007 2007 $’000 $’000 $’000 $’000
Trinidad and Tobago, Eastern Caribbean, Dutch Caribbean, Suriname and Other
Change in interest rate
+ 1% 17,470 (202,375) 55,405 (132,639)
- 1% (8,038) 209,646 (48,807) 148,016
Jamaica
Change in interest rate
+ 2% 13,254 (54,410) 15,121 (26,223)
- 2% 3,832 32,499 (790) 51,100
Interest Sensitivity of Assets and Liabilities to Repricing Risk
The table below summarises the Group’s exposure to interest rate repricing risk. It includes the Group’s
financial instruments at carrying amounts, categorised by the earlier of contractual repricing or maturity
dates.
Notes to the Consolidated Financial Statements (continued)Expressed in Trinidad and Tobago Dollars, year ended 31 March 2008

Annual Report 2008 61
34 Financial Risk Management (continued)
34.3 Market Risk (continued)
34.3.2 Interest rate risk (continued)
Interest Sensitivity of Assets and Liabilities to Repricing Risk
The table below summarises the Group’s exposure to interest rate repricing risk. It includes the Group’s financial
instruments at carrying amounts, categorised by the earlier of contractual repricing or maturity dates.
One to Non- Up to five Over five interest one year years years bearing Total ($’000) ($’000) ($’000) ($’000) ($’000)
As at 31 March 2008
AssetsCash on hand and
due from banks 4,354,115 -- -- 2,072,475 6,426,590
Balances with central banks 335,163 -- -- 2,622,756 2,957,919
Loans and advances
to customers 16,820,312 3,759,441 4,076,130 164,935 24,820,818
Investment securities 7,708,981 1,970,737 4,711,537 981,190 15,372,445
Derivative financial
instruments 1,633,275 -- -- -- 1,633,275
Other assets 1,271 -- -- 165,473 166,744
Total financial assets 30,853,117 5,730,178 8,787,667 6,006,829 51,377,791
LiabilitiesDue to banks 962,066 17,629 4,830 610,174 1,594,699
Customers’ deposits 25,997,603 1,830,927 6,153 4,566,001 32,400,684
Other funding instruments 7,524,645 314,484 33,796 110,805 7,983,730
Other borrowed funds 1,240,174 1,181,965 -- 19,251 2,441,390
Debt securities in issue 147,690 -- 824,509 6,707 978,906
Derivative financial
instruments 1,503,726 -- -- -- 1,503,726
Other liabilities 1,888 -- -- 310,308 312,196
Total financial liabilities 37,377,792 3,345,005 869,288 5,623,246 47,215,331
Interest Sensitivity Gap (6,524,675) 2,385,173 7,918,379 --
Notes to the Consolidated Financial Statements (continued)Expressed in Trinidad and Tobago Dollars, year ended 31 March 2008

Annual Report 200862
34 Financial Risk Management (continued)
34.3 Market Risk (continued)
34.3.2 Interest rate risk (continued)
Interest Sensitivity of Assets and Liabilities to Repricing Risk (continued)
One to Non- Up to five Over five interest one year years years bearing Total ($’000) ($’000) ($’000) ($’000) ($’000)
As at 31 March 2007
AssetsCash on hand and
due from banks 4,011,219 -- -- 1,696,604 5,707,823
Balances with central banks 147,507 -- -- 1,978,435 2,125,942
Loans and advances
to customers 14,886,117 3,611,261 3,546,061 150,126 22,193,565
Investment securities 9,020,095 1,429,380 3,285,433 832,781 14,567,689
Derivative financial
instruments 1,611,188 -- -- -- 1,611,188
Other assets 4,174 -- -- 139,828 144,002
Total financial assets 29,680,300 5,040,641 6,831,494 4,797,774 46,350,209
LiabilitiesDue to banks 602,612 57,562 -- 508,570 1,168,744
Customers’ deposits 23,389,641 1,684,203 407 3,591,124 28,665,375
Other funding instruments 7,322,832 377,031 -- 96,040 7,795,903
Other borrowed funds 1,237,477 336,283 624,620 22,795 2,221,175
Debt securities in issue 412,384 -- 568,922 7,096 988,402
Derivative financial
instruments 1,492,997 -- -- -- 1,492,997
Other liabilities 41,596 -- -- 390,485 432,081
Total financial liabilities 34,499,539 2,455,079 1,193,949 4,616,110 42,764,677
Interest Sensitivity Gap (4,819,239) 2,585,562 5,637,545 --
Notes to the Consolidated Financial Statements (continued)Expressed in Trinidad and Tobago Dollars, year ended 31 March 2008

Annual Report 2008 63
34 Financial Risk Management (continued)
34.3 Market Risk (continued)
34.3.3 Other price risk
Other price risk arises due to the possibility that the fair value of future cash flows of a financial instrument
will fluctuate because of changes in market prices (other than those arising from interest rate risk or currency
risk), whether those changes are caused by factors specific to the individual financial instrument or its issuer, or
factors affecting all similar financial instruments traded in the market. The Group is affected by changing prices
of equity instruments mainly classified as available-for-sale securities with fair value movements recognised in
shareholders’ equity.
The Group’s exposure to equity price risk is principally related to changes in the fair value of the Guardian
Holdings Limited shares held as available-for-sale securities. The effect on equity as a result of reasonable
possible changes in the price of this share, with all other variables held constant are as follows:
Change in Price Effect on Equity 2008 2007 2008 2007 (%) (%) ($ Millions) ($ Millions)Guardian Holdings Limited shares +15 +15 104 82
-15 -15 -104 -82
34.4 Currency risk
Currency risk is the risk that the value of a financial instrument will fluctuate due to changes in foreign exchange rates.
The Board has set limits on positions by currency. Positions are monitored on a daily basis and hedging strategies are
used to ensure positions are maintained within established limits.
34.4.1 Concentrations of currency risk – on and off-balance sheet financial instruments
Assets are primarily funded by like currency liabilities thus reducing the element of cross-currency risk and
in most regional markets, US dollar denominated transactions must be officially sanctioned by the relevant
authorities thus reducing exposure. Currency exposure resides mainly in trading activity. The table overleaf
summarises the Group’s exposure to foreign currency exchange rate risk as at 31 March.
Notes to the Consolidated Financial Statements (continued)Expressed in Trinidad and Tobago Dollars, year ended 31 March 2008

Annual Report 200864
34 Financial Risk Management (continued)
34.4 Currency risk (continued)
34.4.1 Concentrations of currency risk – on and off-balance sheet financial instruments (continued)
Netherlands
Eastern Antilles
TT US Caribbean Florins JMD Other Total
($’000) ($’000) ($’000) ($’000) ($’000) ($’000) ($’000)
As at 31 March 2008
Assets
Cash on hand and due from banks 528,190 3,435,740 204,146 305,181 218,184 1,735,149 6,426,590
Balances with central banks 1,671,399 139,045 153,347 646,473 165,317 182,338 2,957,919
Loans and advances to customers 8,276,815 5,965,559 2,076,178 5,078,091 1,463,496 1,960,679 24,820,818
Investment securities 4,729,714 6,696,328 166,780 498,333 1,970,354 1,310,936 15,372,445
Derivative financial
instruments -- 1,626,657 -- -- -- 6,618 1,633,275
Other assets 58,120 36,630 7,836 10,684 22,146 31,328 166,744
Total financial assets 15,264,238 17,899,959 2,608,287 6,538,762 3,839,497 5,227,048 51,377,791
Liabilities
Due to banks 24,049 1,010,122 46,993 160,364 41,458 311,713 1,594,699
Customers’ deposits 9,237,894 9,441,827 2,469,799 5,604,270 1,884,609 3,762,285 32,400,684
Other funding nstruments 2,101,898 3,888,513 2,104 -- 1,256,733 734,482 7,983,730
Other borrowed funds -- 2,368,538 -- -- 72,852 -- 2,441,390
Debt securities in issue 206,440 772,466 -- -- -- -- 978,906
Derivative financial
instruments 1,129,183 31,984 -- -- -- 342,559 1,503,726
Other liabilities 45,613 38,856 37,400 104,515 37,727 48,085 312,196
Total financial liabilities 12,745,077 17,552,306 2,556,296 5,869,149 3,293,379 5,199,124 47,215,331
Net Balance Sheet Position 2,519,161 347,653 51,991 669,613 546,118 27,924 4,162,460
Credit Commitments 383,094 1,326,121 232,631 279,621 152,462 112,863 2,486,792
As at 31 March 2007
Total financial assets 13,461,220 16,943,018 2,086,585 5,724,054 4,247,834 3,887,498 46,350,209
Total financial liabilities 12,076,527 15,435,485 2,361,100 5,349,651 3,689,221 3,852,693 42,764,677
Net Balance Sheet Position 1,384,693 1,507,533 (274,515) 374,403 558,613 34,805 3,585,532
Credit Commitments 439,286 1,625,587 139,724 146,620 103,076 322,820 2,777,113
Notes to the Consolidated Financial Statements (continued)Expressed in Trinidad and Tobago Dollars, year ended 31 March 2008
Annual Report 2008 65
34 Financial Risk Management (continued)
34.4 Currency risk (continued)
34.4.2 Foreign currency exchange risk
Analysis was conducted to determine the sensitivity to reasonable possible movements of select currencies
against the Trinidad and Tobago dollar (TT dollar) to which the Group had significant exposure at 31 March in
respect of its assets and liabilities holding all other variables constant. The results revealed that as at 31 March
2008, if the TT dollar had weakened 1% against the US dollar currency, Eastern Caribbean dollar and Antillean
Guilders and 5% against the Jamaican dollar with all other variables held constant, profit before tax for the year
would have been $38 million (2007 – $44 million) higher and other components of equity would have been
$15 million (2007 – $11 million) higher. The lower foreign currency exchange rate sensitivity in profit in 2008
compared to 2007 is attributable to the decline in net US dollar holdings in monetary assets in 2008.
34.5 Credit Risk
Credit risk is the risk that the Group will incur a loss because its customers, clients or counterparties failed to discharge
their contractual obligations. The Group manages and controls credit risk by setting limits on the amount of risk it is
willing to accept for individual counterparties and for geographical and industry concentrations, and by monitoring
exposures in relation to such limits.
The Group has established a credit quality review process to provide early identification of possible changes in the
creditworthiness of counterparties, including regular collateral reviews. Counterparty limits for Corporate and Commercial
counterparties are established by the use of a credit risk classification system, which assigns each counterparty a risk
rating. Risk ratings are subject to regular revision. For the retail portfolio the Group has stringent lending criteria which
include conservative debt service coverage, loan to value ratios and stability of earnings. These exposures are continuously
monitored to identify any change in the credit worthiness of the borrower. The credit quality review process allows the
Group to assess the potential loss as a result of the risks to which it is exposed and take corrective action.
34.5.1 Credit risk management
a) Loans and advances to customers
The Group measures the credit risk of loan and advances to Corporate and Commercial customers and to
banks at the counterparty level using an internal risk rating matrix. The ratings are generated by combining
weighted financial and statistical criteria with credit officer judgment which is mapped against established
internal benchmarks at the time credit is granted. The Group risk rating is seven tiered as shown below and
reflects the perceived counterparty risk. This means that, in principle, exposures migrate between levels as
the assessment of their riskiness changes. The risk weightings and internal benchmarks are consistently
reviewed and upgraded as necessary.
Notes to the Consolidated Financial Statements (continued)Expressed in Trinidad and Tobago Dollars, year ended 31 March 2008

Annual Report 200866
34 Financial Risk Management (continued)
34.5 Credit Risk (continued)
34.5.1 Credit risk management (continued)
a) Loans and advances to customers (continued)
Group’s rating Description of the grade Credit quality
1 Excellent High grade
2 Very Good High grade
3 Good Standard grade
4 Special Mention Substandard grade
5 Unacceptable Past due or impaired
6 Bad and Doubtful Past due or impaired
7 Virtual Certain Loss Past due or impaired
b) Debt securities and other bills
For debt securities and other bills, external ratings such as Standard & Poor’s rating or their equivalents are
used by the Group Risk Management Unit for managing credit risk exposures.
34.5.2 Risk limit control and mitigation policies
The Group structures the levels of credit risk it undertakes by placing limits on the amount of risk accepted in
relation to one borrower, or group of borrowers, and to geographical and industry segments. Such risks are
monitored on a revolving basis and subject to an annual or more frequent review, when considered necessary.
Limits on the level of credit risk by product, industry sector and by country are approved quarterly by the Board
of Directors.
Collateral
The Group employs a range of policies and practices to mitigate credit risk. The most traditional of these is the
taking of security for funds advanced, which is common practice. The Group implements guidelines on the
acceptability of specific classes of collateral or credit risk mitigation. The principal collateral types for loans and
advances to customers are:
• Mortgagesoverresidentialproperties;
• Chargesoverbusinessassetssuchaspremises,inventoryandaccountsreceivable;
• Chargesoverfinancialinstrumentssuchasdebtsecuritiesandequities.
Management monitors the market value of collateral, requests additional collateral in accordance with the
underlying agreement and monitors the market value of collateral obtained during its periodic review of loan
accounts in arrears.
Notes to the Consolidated Financial Statements (continued)Expressed in Trinidad and Tobago Dollars, year ended 31 March 2008
Annual Report 2008 67
34 Financial Risk Management (continued)
34.5 Credit Risk (continued)
34.5.2 Risk limit control and mitigation policies (continued)
Derivatives
The amount subject to credit risk is limited to the current fair value of instruments that are favourable to the
Group (i.e. assets where their fair value is positive), which in relation to derivatives is only a small fraction of the
contract, or notional values used to express the volume of instruments outstanding. This credit risk exposure
is managed as part of the overall lending limits with customers, together with potential exposures from market
movements. Collateral or other security is not usually obtained for credit risk exposures on these instruments,
except where the Group requires margin deposits from counterparties.
Master netting arrangements
The Group further restricts its exposure to credit losses by entering into master netting arrangements with
counterparties with which it undertakes a significant volume of transactions. Master netting arrangements
do not generally result in an offset of balance sheet assets and liabilities, as transactions are usually settled
on a gross basis. However, the credit risk associated with favourable contracts is reduced by a master netting
arrangement to the extent that if a default occurs, all amounts with the counterparty are terminated and settled
on a net basis.
Credit-related commitments
The primary purpose of these instruments is to ensure that funds are available to a customer as required.
Guarantees and standby letters of credit carry the same credit risk as loans. Documentary and commercial
letters of credit – which are written undertakings by the Group on behalf of a customer authorizing a third party
to draw drafts on the Group up to a stipulated amount under specific terms and conditions – are collateralised
by the underlying shipments of goods to which they relate and therefore carry less risk than a direct loan.
34.5.3 Impairment and provisioning policies
Impairment provisions are recognised for financial reporting purposes only for losses that have been incurred
at the balance sheet date based on objective evidence of impairment (see Note 2.e). Due to the different
methodologies applied, the amount of incurred credit losses provided for in the financial statements are
usually lower than the amount determined from the expected loss model that is used for banking regulation
purposes.
The Group’s policy requires the review of individual financial assets that are above materiality thresholds at
least annually or more regularly when individual circumstances require. Impairment allowances on individually
assessed accounts are determined by an evaluation of the incurred loss at balance-sheet date on a case-by-case
basis, and are applied to all individually significant accounts.
The assessment normally encompasses collateral held (including re-confirmation of its enforceability) and the
anticipated receipts for that individual account.
Notes to the Consolidated Financial Statements (continued)Expressed in Trinidad and Tobago Dollars, year ended 31 March 2008

Annual Report 200868
34 Financial Risk Management (continued)
34.5 Credit Risk (continued)
34.5.4 Maximum exposure to credit risk before collateral held or other credit enhancements
Gross Gross maximum maximum exposure exposure 2008 2007 ($’000) ($’000)
Credit risk exposures relating to on-balance sheet
financial assets are as follows:
Due from banks 4,815,594 4,444,358
Loans and advances to customers 25,672,180 23,144,996
Securities at fair value through profit or loss 2,080,056 1,530,504
Securities available-for-sale at fair value 10,987,165 11,303,383
Securities held-to-maturity at amortised cost 1,377,254 1,020,662
Derivative financial instruments 1,633,275 1,611,188
46,565,524 43,055,091
Credit risk exposures relating to off-balance sheet
financial assets are as follows:
Contingent liabilities (letter of credit and financial guarantees) 1,852,808 2,087,327
Credit commitments 2,486,792 2,777,113
4,339,600 4,864,440
Total credit risk exposure 50,905,124 47,919,531
The above table represents a worst-case scenario of credit risk exposure to the Group without taking account
of any collateral held or other credit enhancement attached.
Notes to the Consolidated Financial Statements (continued)Expressed in Trinidad and Tobago Dollars, year ended 31 March 2008

Annual Report 2008 69
34 Financial Risk Management (continued)
34.5 Credit Risk (continued)
34.5.5 Concentration of risk of financial assets with credit risk exposure by industry sectors
The following table breaks down the Group’s main credit exposure of loans and advances as categorised by
industry sectors of counterparties.
Gross Gross maximum maximum exposure exposure 2008 2007 ($’000) ($’000)
Consumer 10,126,305 8,636,366
Manufacturing 1,354,815 1,444,996
Distribution 3,486,694 2,987,171
Financial services 963,939 770,943
Transport 715,070 891,327
Construction 1,411,398 1,214,156
Petroleum 174,390 246,349
Agriculture 115,937 164,292
Real estate 2,784,719 2,524,792
Tourism 1,497,485 1,080,601
Professional services 611,014 459,653
Utilities 347,019 729,552
Health services 291,423 87,247
Government 504,254 462,501
Other 1,287,718 1,445,050
25,672,180 23,144,996
34.5.6 Risk concentrations of the maximum exposure to credit risk
Concentration of risk is managed by client/counterparty, by geographical region and by industry sector. The
maximum credit exposure to any client or counterparty as at March 31, 2008 was $3,410,048,000 (2007:
$2,819,016,000) before taking account of collateral or other credit enhancements.
Notes to the Consolidated Financial Statements (continued)Expressed in Trinidad and Tobago Dollars, year ended 31 March 2008

Annual Report 200870
34 Financial Risk Management (continued)
34.5 Credit Risk (continued)
34.5.7 Credit quality by class of financial assets
Neither Past due past due but not nor impaired impaired Impaired Total ($’000) ($’000) ($’000) ($’000)
As at 31 March 2008
Due from banks: 4,815,594 -- -- 4,815,594
Loans and advances to customers:Retail 4,292,725 380,161 167,641 4,840,527
Commercial/Corporate 12,954,061 1,240,226 275,171 14,469,458
Mortgages 4,656,369 359,525 56,192 5,072,086
Other 1,191,207 69,512 29,390 1,290,109
Loans and advances (Gross) 23,094,362 2,049,424 528,394 25,672,180
Investment securities:Trading:
Government 440,693 -- 1,573 442,266
Corporate 1,186,397 -- -- 1,186,397
Other 451,393 -- -- 451,393
Available-for-sale:
Government 6,655,552 -- 29,544 6,685,096
Corporate 1,930,434 190,325 11,249 2,132,008
Other 2,170,061 -- -- 2,170,061
Held-to-maturity:
Government 626,888 -- -- 626,888
Corporate 623,215 -- -- 623,215
Other 127,151 -- -- 127,151
Investment securities (Gross) 14,211,784 190,325 42,366 14,444,475
Derivative financial instruments:Government 988,580 -- -- 988,580
Corporate 644,695 -- -- 644,695
1,633,275 -- -- 1,633,275
Total 43,755,015 2,239,749 570,760 46,565,524
Notes to the Consolidated Financial Statements (continued)Expressed in Trinidad and Tobago Dollars, year ended 31 March 2008

Annual Report 2008 71
34 Financial Risk Management (continued)
34.3 Credit Risk (continued)
34.5.7 Credit quality by class of financial assets (continued)
Neither Past due past due but not nor impaired impaired Impaired Total ($’000) ($’000) ($’000) ($’000)
As at 31 March 2007
Due from banks: 4,444,358 -- -- 4,444,358
Loans and advances to customers:Retail 4,364,741 393,995 147,939 4,906,675
Commercial/Corporate 10,636,403 1,155,053 409,012 12,200,468
Mortgages 4,149,772 394,580 48,437 4,592,789
Other 1,349,585 39,190 56,289 1,445,064
Loans and advances (Gross) 20,500,501 1,982,818 661,677 23,144,996
Investment securities:Trading:
Government 127,025 70,841 1,552 199,418
Corporate 719,385 80,221 -- 799,606
Other 531,480 -- -- 531,480
Available-for-sale:
Government 7,303,217 62 30,145 7,333,424
Corporate 1,999,638 291,273 34,580 2,325,491
Other 1,644,468 -- -- 1,644,468
Held-to-maturity:
Government 383,007 -- -- 383,007
Corporate 636,090 -- -- 636,090
Other 1,565 -- -- 1,565
Investment securities (Gross) 13,345,875 442,397 66,277 13,854,549
Derivative financial instruments:Government 1,165,544 -- -- 1,165,544
Corporate 445,644 -- -- 445,644
1,611,188 -- -- 1,611,188
Total 39,901,922 2,425,215 727,954 43,055,091
For those exposures that are neither past due nor impaired the majority are rated between standard (good)
to excellent which is high grade.
Notes to the Consolidated Financial Statements (continued)Expressed in Trinidad and Tobago Dollars, year ended 31 March 2008

Annual Report 200872
34 Financial Risk Management (continued)
34.5 Credit Risk (continued)
34.5.8 Aging analysis of past due but not impaired financial assets by sector
Less than 1-3 3-6 More than 1 mth mths mths 6 mths Total ($’000) ($’000) ($’000) ($’000) ($’000)
As at 31 March 2008
Loans and advances to customers:Retail 214,753 80,107 67,054 18,247 380,161Commercial/Corporate 474,715 520,022 197,856 47,633 1,240,226Mortgages 165,269 82,387 109,496 2,373 359,525Other 9,767 5,849 1,969 51,927 69,512
864,504 688,365 376,375 120,180 2,049,424
Investment securities:Available-for-sale: Corporate -- -- 190,325 -- 190,325
-- -- 190,325 -- 190,325
As at 31 March 2007
Loans and advances to customers:Retail 188,724 68,688 120,620 15,963 393,995Commercial/Corporate 462,210 544,011 35,245 113,587 1,155,053
Mortgages 73,744 94,651 225,523 662 394,580
Other 7,799 3,533 1,786 26,072 39,190
732,477 710,883 383,174 156,284 1,982,818
Investment securities:
Trading:
Government 70,841 -- -- -- 70,841
Corporate -- -- 80,221 -- 80,221
Available-for-sale:
Government -- 62 -- -- 62
Corporate -- -- 291,273 -- 291,273
70,841 62 371,494 -- 442,397
Notes to the Consolidated Financial Statements (continued)Expressed in Trinidad and Tobago Dollars, year ended 31 March 2008

Annual Report 2008 73
34 Financial Risk Management (continued)
34.5 Credit Risk (continued)
34.5.9 Credit risk exposure on due from banks, debt securities and other bills and derivative financial instruments based on the Group’s internal corporate rating system
The table below presents an analysis of debt securities, treasury bills and other eligible bills by internal and
equivalent rating agency designation.
Standard & Poor’s 2008 2007 Equivalent Total Total grades ($’000) ($’000)
Excellent AA BB+ 5,386,030 4,867,656
Very GoodA+ BB 1,065,431 1,082,094A BB-
GoodA- B+ 13,930,871 13,511,292B+ B
Special mentionB B- 488,792 427,131C+ CCC+
UnacceptableC CCC 10,999 10,865D+ CCC-
Bad and doubtfulD CC+ 11,221 11,057E+ CC
Virtual certain lossE CC- -- --
20,893,344 19,910,095
Notes to the Consolidated Financial Statements (continued)Expressed in Trinidad and Tobago Dollars, year ended 31 March 2008

Annual Report 200874
Notes to the Consolidated Financial Statements (continued)Expressed in Trinidad and Tobago Dollars, year ended 31 March 2008
34 Financial Risk Management (continued)
34.5 Credit Risk (continued)
34.5.10 Carrying amount per class of financial assets whose terms have been renegotiated
2008 2007 ($’000) ($’000)
Investment securities:
Securities at fair value through profit or loss
including trading:
Government -- --
Corporate -- 189,916
Other -- --
Securities available-for-sale:
Government 10,589 9,776
Corporate -- --
Other -- --
Securities held-to-maturity:
Government -- --
Corporate -- --
Other -- --
Total renegotiated investment securities 10,589 199,692
Loans and advances to customers:
Retail 19,413 11,547
Commercial / Corporate 139,362 301,091
Mortgages 11,436 2,572
Other 196 --
Total renegotiated loans and advances to customers 170,407 315,210
34.5.11 Repossessed collateral
Repossessed collateral are sold as soon as practicable, with the proceeds used to reduce the outstanding
indebtedness.

Annual Report 2008 75
Notes to the Consolidated Financial Statements (continued)Expressed in Trinidad and Tobago Dollars, year ended 31 March 2008
34 Financial Risk Management (continued)
34.6 Capital Management
The Group’s objectives when managing capital, which is a broader concept than the ‘equity’ on the face of balance
sheets, are:
• Tocomplywiththecapitalrequirementssetbytheregulatorsofthebankingmarketswheretheentitieswithinthe
Group operate;
• To safeguard theGroup’s ability to continue as agoing concern so that it can continue toprovide returns for
shareholders and benefits for other stakeholders; and
• Tomaintainastrongcapitalbasetosupportthedevelopmentofitsbusiness.
Capital adequacy and the use of regulatory capital are monitored by the Group’s management, employing techniques
based on the guidelines developed by the Basel Committee on Banking Supervision as implemented by the local banking
and non-banking regulators of the various territories in which the Group operates. The required information is filed with
the authorities on a monthly or quarterly basis as prescribed by the regulator.
The table below summarises the regulatory qualifying capital ratios of the individual licensed entities within the Group.
2008 2007
RBTT Bank Limited 12% 12%
RBTT Merchant Bank Limited 22% 21%
RBTT Trust Limited 98% 147%
RBTT Bank Caribbean Limited 18% 19%
RBTT Bank (SKN) Limited 23% 28%
RBTT Bank Grenada Limited 14% 14%
RBTT Bank N.V. 146% 155%
RBTT Bank International N.V. 22% 21%
RBTT Bank Aruba N.V. 12% 11%
RBTT Bank (Suriname) N.V. 12% 13%
RBTT Bank Jamaica Limited 15% 16%
RBTT Securities Jamaica Limited 114% 149%
The licensed banking entities in Trinidad and Tobago, the Eastern Caribbean, Barbados and Jamaica are required to
maintain a qualifying capital ratio (total regulatory capital to risk-weighted assets) of at least 8%. The banking entities
in the Netherlands Antilles and Aruba are required to maintain a minimum capital of 5 million guilders and in Suriname
4.5 million Suriname dollars.
The securities company in Jamaica is subject to capital requirements issued by the Financial Services Commission in
Jamaica as a licensed securities dealer. The Commission requires the company to hold a minimum level of regulatory
capital of 6% of total assets and as well to maintain a ratio of total regulatory capital to risk-weighted assets at or above
10%.
During the two years, the entities have complied with all of the externally imposed capital requirements to which they
are subject.

Annual Report 200876
Notes to the Consolidated Financial Statements (continued)Expressed in Trinidad and Tobago Dollars, year ended 31 March 2008
35 Segmental Information
By Geographic Segment
Trinidad and Tobago is the home country of the parent company and several other primary operating subsidiaries.
The Group’s exposures to credit risk are mainly concentrated in Trinidad and Tobago, Jamaica, the Netherlands Antilles,
Aruba, Barbados and Grenada. The Group accounts for a significant share of credit exposure to many sectors of these
economies. However, credit risk is well spread over a diversity of personal and commercial customers.
The Group’s operations are managed principally along four geographic regions within the Caribbean basin:
• TrinidadandTobago
• EasternCaribbeanandSuriname(includesBarbados,Antigua,St.Lucia,St.Vincent,St.KittsandNevis,Grenadaand
Suriname)
• DutchCaribbeanterritories(includesArubaandtheNetherlandsAntilles)
• Jamaica
Eastern
Trinidad Caribbean Dutch Intercompany
& Tobago & Suriname Caribbean Jamaica Eliminations Total
($’000) ($’000) ($’000) ($’000) ($’000) ($’000)
As at and for the year ended 31 March 2008
Total income 2,819,296 757,923 1,011,617 849,732 (437,241) 5,001,327
Operating profit 789,791 182,964 208,033 108,405 -- 1,289,193
Share of profits of associate
companies and joint venture
before tax 20,325 -- 335 -- (591) 20,069
Profit before taxation 810,116 182,964 208,368 108,405 (591) 1,309,262
Taxation (225,810) (45,363) (61,532) (38,040) 178 (370,567)
Profit after taxation 584,306 137,601 146,836 70,365 (413) 938,695
Minority interest -- (7,556) -- (413) 413 (7,556)
Profit attributable to
shareholders 584,306 130,045 146,836 69,952 -- 931,139
Loans and advances 10,686,205 5,268,917 7,402,669 2,884,529 (1,421,502) 24,820,818
Investment securities 10,095,929 1,322,176 2,798,943 2,500,977 (1,345,580) 15,372,445
Total assets 30,370,658 8,301,374 12,661,700 6,650,057 (4,456,575) 53,527,214
Customers’ deposits 13,320,762 6,291,983 10,550,626 2,900,742 (663,429) 32,400,684
Total liabilities 25,933,316 7,725,389 11,939,268 6,055,498 (3,211,884) 48,441,587

Annual Report 2008 77
Notes to the Consolidated Financial Statements (continued)Expressed in Trinidad and Tobago Dollars, year ended 31 March 2008
35 Segmental Information (continued)
By Geographic Segment (continued)
Eastern
Trinidad Caribbean Dutch Intercompany
& Tobago & Suriname Caribbean Jamaica Eliminations Total
($’000) ($’000) ($’000) ($’000) ($’000) ($’000)
As at and for the year ended 31 March 2008 (continued)
Other segment items:
Capital expenditure on
premises and equipment 186,083 32,291 64,587 22,767 -- 305,728
Depreciation expense 69,732 15,489 29,268 19,292 -- 133,781
Impairment (charge)/credit
- Loans and advances to customers (368) (7,064) (19,526) (8,117) -- (35,075)
- Investment securities 3,176 5,506 -- -- -- 8,682
Impairment charge –
Loans and advances to customers
- Impairments (6,299) (9,653) (26,110) (10,154) -- (52,216)
- Recoveries on previously
recognised impairment 5,931 2,589 6,584 2,037 -- 17,141
(368) (7,064) (19,526) (8,117) -- (35,075)
Impairment credit
- Investment securities
- Impairment credit 3,176 5,506 -- -- -- 8,682

Annual Report 200878
Notes to the Consolidated Financial Statements (continued)Expressed in Trinidad and Tobago Dollars, year ended 31 March 2008
35 Segmental Information
By Geographic Segment (continued)
Eastern
Trinidad Caribbean Dutch Intercompany
& Tobago & Suriname Caribbean Jamaica Eliminations Total
($’000) ($’000) ($’000) ($’000) ($’000) ($’000)
As at and for the year ended 31 March 2007
Total income 2,640,984 695,048 892,530 801,432 (475,948) 4,554,046
Operating profit 752,527 143,598 178,033 94,639 (4,871) 1,163,926
Share of profits of associate
companies and joint
venture before tax 16,892 -- -- -- -- 16,892
Profit before taxation 769,419 143,598 178,033 94,639 (4,871) 1,180,818
Taxation (158,558) (22,102) (40,433) (26,936) 1,218 (246,811)
Profit after taxation 610,861 121,496 137,600 67,703 (3,653) 934,007
Minority interest -- (2,828) -- -- -- (2,828)
Profit attributable to
shareholders 610,861 118,668 137,600 67,703 (3,653) 931,179
Loans and advances 10,481,530 4,445,671 6,321,945 2,369,705 (1,425,286) 22,193,565
Investment securities 9,052,396 1,470,112 2,715,111 2,814,406 (1,484,336) 14,567,689
Total assets 28,538,312 7,301,633 11,083,772 5,998,246 (4,616,625) 48,305,338
Customers’ deposits 11,832,512 5,457,135 9,291,405 2,509,726 (425,403) 28,665,375
Total liabilities 24,616,664 6,811,441 10,478,204 5,459,043 (3,490,649) 43,874,703

Annual Report 2008 79
Notes to the Consolidated Financial Statements (continued)Expressed in Trinidad and Tobago Dollars, year ended 31 March 2008
35 Segmental Information (continued)
By Geographic Segment (continued)
Eastern
Trinidad Caribbean Dutch Intercompany
& Tobago & Suriname Caribbean Jamaica Eliminations Total
($’000) ($’000) ($’000) ($’000) ($’000) ($’000)
As at and for the year ended 31 March 2007 (continued)
Other segment items:
Capital expenditure on
premises and equipment 169,451 42,754 48,567 37,370 -- 298,142
Depreciation expense 65,212 13,802 28,061 17,493 -- 124,568
Impairment (charge)/credit
- Loans and advances to customers (11,186) (13,957) (16,599) (7,004) -- (48,746)
- Investment securities 24,694 (5,346) (521) -- -- 18,827
Impairment charge
Loans and advances to customers
- Impairments 12,598 15,601 22,486 9,012 -- 59,697
- Recoveries on previously
recognised impairment (1,412) (1,644) (5,887) (2,008) -- (10,951)
11,186 13,957 16,599 7,004 -- 48,746
Impairment credit/(charge)
Investment securities
- Impairment credit/(charge) 24,694 (5,346) (521) -- -- 18,827

Annual Report 200880
Notes to the Consolidated Financial Statements (continued)Expressed in Trinidad and Tobago Dollars, year ended 31 March 2008
35 Segmental Information
By Business Lines
The segment information by business lines is provided to comply with IAS 14 and does not reflect the way the Group is
managed. Management believes that the analysis by geographic segment is a more meaningful representation of the
way in which the Group is managed.
Retail & Trust
Commercial Investment & Asset Intercompany
Banking Banking Management Other Eliminations Total
($’000) ($’000) ($’000) ($’000) ($’000) ($’000)
As at and for the year ended 31 March 2008
Total income 4,220,552 566,358 617,066 34,592 (437,241) 5,001,327
Profit before taxation 878,802 283,771 207,601 (60,321) (591) 1,309,262
Total assets 43,001,065 7,715,518 4,910,666 2,356,540 (4,456,575) 53,527,214
Total liabilities 39,728,068 6,227,964 4,446,698 1,250,741 (3,211,884) 48,441,587
Capital expenditure on
premises and equipment 303,355 1,150 1,223 -- -- 305,728
As at and for the year ended 31 March 2007
Total income 4,001,552 539,002 434,073 55,367 (475,948) 4,554,046
Profit before taxation 743,172 288,259 176,554 (22,296) (4,871) 1,180,818
Total assets 40,265,069 7,746,873 2,645,885 2,264,136 (4,616,625) 48,305,338
Total liabilities 37,231,880 6,410,802 2,386,830 1,335,840 (3,490,649) 43,874,703
Capital expenditure on
premises and equipment 294,105 1,690 2,347 -- -- 298,142

Annual Report 2008 81
Notes to the Consolidated Financial Statements (continued)Expressed in Trinidad and Tobago Dollars, year ended 31 March 2008
36 Fair Value of Financial Assets and Liabilities
Financial assets and liabilities not carried at fair value include cash resources, loans and advances to customers, investment
securities held-to-maturity, due to banks, customers’ deposits, other funding instruments, other borrowed funds and debt
securities in issue. The following comments are relevant to their fair value.
Assets
Cash on hand and due from banks and balances with central banks
Since these assets are short-term in nature, the values are taken as indicative of realisable value.
Loans and advances to customers
Loans and advances are stated net of specific provision for impairment. These assets result from transactions conducted under
typical market conditions and their values are not adversely affected by unusual terms. The estimated fair value of loans and
advances represents the discounted amount of estimated future cash flows expected to be received.
Investment securities held-to-maturity
Fair value for held-to-maturity assets is based on market prices or broker/dealer price quotations. Where this information is
not available, fair value is estimated using quoted market prices for securities with similar credit characteristics or discounted
cash flow models.
Carrying Value Fair Value ($’000) ($’000)
Balance at 31 March 2008 1,377,254 1,364,313
Balance at 31 March 2007 1,020,662 915,327
Liabilities
Due to banks, customers’ deposits, other funding instruments and other borrowed funds
The estimated fair value of deposits with no stated maturity, which includes non-interest bearing deposits, is the amount
repayable on demand.
Deposits with fixed rate characteristics are at rates that are not significantly different from current rates and are assumed to
have discounted cash flow values that approximate the carrying value.
Debt securities in issue
The fair value is calculated using a discounted cash flow model based on a current yield curve appropriate for the remaining
term to maturity.

Annual Report 200882
Notes to the Consolidated Financial Statements (continued)Expressed in Trinidad and Tobago Dollars, year ended 31 March 2008
36 Fair Value of Financial Assets and Liabilities (continued)
Liabilities
Due to banks, customers’ deposits, other funding instruments and other borrowed funds
The estimated fair value of deposits with no stated maturity, which includes non-interest bearing deposits, is the amount
repayable on demand.
Deposits with fixed rate characteristics are at rates that are not significantly different from current rates and are assumed to
have discounted cash flow values that approximate the carrying value.
Debt securities in issue
The fair value is calculated using a discounted cash flow model based on a current yield curve appropriate for the remaining
term to maturity.
Carrying Value Fair Value ($’000) ($’000)
Balance at 31 March 2008 972,199 856,995
Balance at 31 March 2007 981,306 1,011,520

Annual Report 2008 83
37 Subsidiaries
Percentage of equity Country of capital Incorporation held
RBTT Bank Limited Republic of Trinidad and Tobago 100%
RBTT Merchant Bank Limited Republic of Trinidad and Tobago 100%
RBTT Trust Limited Republic of Trinidad and Tobago 100%
RBTT Services Limited Republic of Trinidad and Tobago 100%
RBTT Insurance Holdings Limited Republic of Trinidad and Tobago 100%
RBTT Insurance Agency Limited Republic of Trinidad and Tobago 100%
RBTT Overseas Limited St. Lucia 100%
RBTT Bank (Suriname) N.V. Republic of Suriname 100%
RBTT Albion Limited Republic of Trinidad and Tobago 100%
R&M Holdings Limited St Vincent and the Grenadines 100%
RBTT Bank Caribbean Limited St. Vincent and the Grenadines 100%
RBTT Bank (SKN) Limited St. Kitts & Nevis 95.4%
RBTT Bank Grenada Limited Grenada 62%
ABC Holdings N.V. Netherlands Antilles 100%
ABC International N.V. Aruba 100%
RBTT Bank N.V. Netherlands Antilles 100%
RBTT Bank International N.V. Netherlands Antilles 100%
RBTT Bank Aruba N.V. Aruba 100%
RBTT International Limited St. Lucia 100%
RBTT Bank Jamaica Limited Jamaica 100%
RBTT Securities Jamaica Limited Jamaica 100%
West Indies Stockbrokers Limited Republic of Trinidad and Tobago 100%
RBTT Finance Limited British Virgin Islands 100%
RBTT Finance (BVI) Limited British Virgin Islands 100%
RBTT Trust Corporation Barbados 100%
RBTT Bank Barbados Limited Barbados 100%
Notes to the Consolidated Financial Statements (continued)Expressed in Trinidad and Tobago Dollars, year ended 31 March 2008

Annual Report 200884
38 Restatements and Re-classifications
Adjustments and re-classifications to prior year figures have been made to correct errors and to represent balances in conformity
with the current year’s reporting.
The effect of these changes to the 2007 balance sheet and income statement is summarised in the table below.
RBTT Albion Limited, a wholly owned subsidiary of RBTT Financial Holdings Limited, was consolidated in the prior year based
on unaudited financial statements. Adjustments were made to the prior year figures to reconcile to the audited financial
statements.
As RBTT Albion
previously Re- Limited Other Revised
Notes stated Classification Adjustments Adjustments balance
($’000) ($’000) ($’000) ($’000) ($’000)
BALANCE SHEET
Assets
Cash on hand and due from banks 6,047,968 (322,895) (17,250) -- 5,707,823
Balances with central banks 2,125,942 -- -- -- 2,125,942
Loans and advances to customers 22,170,586 22,979 -- -- 22,193,565
Investment securities 1 14,198,933 329,296 (2,033) 41,493 14,567,689
Investment in associate
companies and joint venture 142,613 -- -- -- 142,613
Due from associate companies 10,875 -- -- -- 10,875
Derivative financial instruments 1 413,068 -- -- 1,198,120 1,611,188
Goodwill -- 450,145 -- -- 450,145
Premises and equipment 2 1,136,487 (26,872) (254) (8,027) 1,101,334
Deferred tax assets 40,204 -- 550 -- 40,754
Other assets 350,190 (3,498) 6,718 -- 353,410
Total assets 47,087,011 (990) (12,269) 1,231,586 48,305,338
Liabilities
Due to banks 1,171,934 -- (3,190) -- 1,168,744
Customers’ deposits 28,665,375 -- -- -- 28,665,375
Other funding instruments 7,796,405 -- (502) -- 7,795,903
Other borrowed funds 2,221,175 -- -- -- 2,221,175
Debt securities in issue 988,402 -- -- -- 988,402
Derivative financial instruments 1 253,384 -- -- 1,239,613 1,492,997
Post retirement benefit obligations -- 126,670 -- -- 126,670
Provision for taxation 3 249,128 -- 880 (829) 249,179
Deferred tax liabilities 4 196,644 (275) -- 17,032 213,401
Other liabilities 5 885,130 -- 10,417 57,310 952,857
Total liabilities 42,554,247 (275) 7,605 1,313,126 43,874,703
Notes to the Consolidated Financial Statements (continued)Expressed in Trinidad and Tobago Dollars, year ended 31 March 2008

Annual Report 2008 85
Notes to the Consolidated Financial Statements (continued)Expressed in Trinidad and Tobago Dollars, year ended 31 March 2008
38 Restatements and Re-classifications (continued)
As RBTT Albion
previously Re- Limited Other Revised
Notes stated Classification Adjustments Adjustments balance
($’000) ($’000) ($’000) ($’000) ($’000)
BALANCE SHEET
Shareholders’ Equity
Share capital 876,524 -- -- -- 876,524
Statutory reserves 476,504 -- -- (478) 476,026
Other reserves 2 125,236 (715) (1,652) (13,110) 109,759
Retained earnings 6 3,015,834 -- (18,222) (67,952) 2,929,660
Total Shareholders’ Equity 4,494,098 (715) (19,874) (81,540) 4,391,969
Minority interest 38,666 -- -- -- 38,666
Total Equity 4,532,764 (715) (19,874) (81,540) 4,430,635
Total Equity and Liabilities 47,087,011 (990) (12,269) 1,231,586 48,305,338
INCOME STATEMENT
Interest income 3,374,345 2,879 (2,882) -- 3,374,342
Interest expense (1,526,656) -- (1,083) -- (1,527,739)
Net Interest Income 1,847,689 2,879 (3,965) -- 1,846,603
Other income 1,209,095 (13,163) (104) (16,124) 1,179,704
Net Income 3,056,784 (10,284) (4,069) (16,124) 3,026,307
Operating expenses (1,842,341) 10,284 (664) 259 (1,832,462)
Impairment losses on loans and advances (48,746) -- -- -- (48,746)
Impairment credit on investment securities 18,827 -- -- -- 18,827
Total Non-Interest Expenses (1,872,260) 10,284 (664) 259 (1,862,381)
Operating Profit 1,184,524 -- (4,733) (15,865) 1,163,926
Share of profits of associate
companies and joint venture before tax 16,892 -- -- -- 16,892
Profit before taxation 1,201,416 -- (4,733) (15,865) 1,180,818
Taxation (250,522) -- (878) 4,589 (246,811)
Profit After Taxation 950,894 -- (5,611) (11,276) 934,007

Annual Report 200886
38 Restatements and Re-classifications (continued)
As RBTT Albion
previously Re- Limited Other Revised
Notes stated Classification Adjustments Adjustments balance
($’000) ($’000) ($’000) ($’000) ($’000)
INCOME STATEMENT
Attributable to:
Shareholders of the company 948,066 -- (5,611) (11,276) 931,179
Minority interest 2,828 -- -- -- 2,828
950,894 -- (5,611) (11,276) 934,007
Description of restatements other than for RBTT Albion Limited
1. The currency swap derivatives valuation was amended to exclude certain cash flows that were incorrectly included in previous years and
reclassify to investments an amount previously recorded as a derivative;
2. Adjustments for reversal of property revaluation reserve;
3. Adjustment to current tax expense due to changes in profit for prior years;
4. Adjustment to deferred taxation due to correction in the deductions claimed for general loan loss provision in prior years;
5. Adjustment to correct the recognition of loan origination fees in prior years;
6. This adjustment comprises of the following:
($’000)
- Adjustment for reversal of property revaluation reserve 4,661
- Adjustment to correct the recognition of loan origination fee (57,278)
- Adjustment to correct tax expense (4,059)
Net adjustment to retained earnings at 1 April 2006 (56,676)
- Adjustment for reversal of revaluation reserve 259
- Adjustment to correct the recognition of loan origination fees (16,124)
- Adjustment to current tax expense 4,883
- Adjustment to correct deferred taxation for prior years (294)
Net adjustment to income statement for 2007 (11,276)
Net adjustments to retained earnings as at 31 March 2007 (67,952)
Summary of changes to shareholders’ equity
Reclassifications (715)
RBTT Albion (19,874)
Other adjustments (81,540)
Total (102,129)
Notes to the Consolidated Financial Statements (continued)Expressed in Trinidad and Tobago Dollars, year ended 31 March 2008

Annual Report 2008 87
38 Restatements and Re-classifications (continued)
Reconciliation of prior year adjustments to the statement of changes in shareholders’ equity
Total
Statutory Other Retained Shareholders’
Reserves Reserves Earnings Equity
($’000) ($’000) ($’000) ($’000)
Adjustments to opening shareholders
equity as at 1 April 2006 -- (14,046) (69,764) (83,810)
Adjustments during the year
ended 31 March 2007 (478) (1,431) (16,410) (18,319)
Total charge to equity (478) (15,477) (86,174) (102,129)
Notes to the Consolidated Financial Statements (continued)Expressed in Trinidad and Tobago Dollars, year ended 31 March 2008