Table DF-2: Capital Adequacy · 2 (e) Capital Adequacy Ratios (solo) Capital Adequacy Ratios for...
16
1 ANDHRA BANK ( A Govt. of India Undertaking) Disclosures under Basel III Capital Regulations (Pillar III) as on 30.06.2018 Table DF-2: Capital Adequacy Qualitative disclosures: A summary discussion of the bank’s approach to assessing the adequacy of its capital to support current and future activities: Bank is geared up to adopt global best practices while implementing risk management stipulations that are in conformity with the Basel II and Basel III framework. Comprehensive risk management architecture is in place to address various issues concerning Basel II and Basel III. For periodic assessment of Capital needs of the Bank, an Internal Capital Adequacy Assessment (ICAAP) Committee/ Capital Planning Committee comprising the top executives has been constituted, to monitor and assess the Capital requirement of the Bank over the medium horizon of 3-5 years, keeping in view the anticipated growth in the business and corresponding Risk Weighted Assets in Credit Risk, Market Risk and Operational Risk. The Committee meets regularly and decides on the capital related issues, with due focus on different options available for capital augmentation and realignment of Capital structure duly undertaking the scenario analysis for capital optimization. Quantitative disclosures: (Rs. in MIllion) Items Amount as on 30.06.2018 (b) Capital requirements for credit risk Portfolios subject to standardized approach Securitization exposures 127498.90 NIL (c) Capital requirements for market risk - Standardized duration approach Interest rate risk Foreign exchange risk (including gold) Equity position risk 7048.87 43.50 3568.50 (d) Capital requirements for operational risk - Basic indicator approach 15641.10
Transcript of Table DF-2: Capital Adequacy · 2 (e) Capital Adequacy Ratios (solo) Capital Adequacy Ratios for...

1
ANDHRA BANK
( A Govt. of India Undertaking) Disclosures under Basel III Capital Regulations (Pillar III) as on 30.06.2018
Table DF-2: Capital Adequacy
Qualitative disclosures: A summary discussion of the bank’s approach to assessing the adequacy of its capital to support current and future activities:
Bank is geared up to adopt global best practices while implementing risk management stipulations that are in conformity with the Basel II and Basel III framework. Comprehensive risk management architecture is in place to address various issues concerning Basel II and Basel III. For periodic assessment of Capital needs of the Bank, an Internal Capital Adequacy Assessment (ICAAP) Committee/ Capital Planning Committee comprising the top executives has been constituted, to monitor and assess the Capital requirement of the Bank over the medium horizon of 3-5 years, keeping in view the anticipated growth in the business and corresponding Risk Weighted Assets in Credit Risk, Market Risk and Operational Risk.
The Committee meets regularly and decides on the capital related issues, with due focus on different options available for capital augmentation and realignment of Capital structure duly undertaking the scenario analysis for capital optimization.
Quantitative disclosures: (Rs. in MIllion)
Items Amount as on 30.06.2018
(b) Capital requirements for credit risk Portfolios subject to standardized approach Securitization exposures
127498.90
NIL
(c) Capital requirements for market risk - Standardized duration approach
Interest rate risk Foreign exchange risk (including gold) Equity position risk
7048.87 43.50
3568.50
(d) Capital requirements for operational risk - Basic indicator approach
15641.10

2
(e) Capital Adequacy Ratios (solo) Common Equity Tier I Tier 1 CRAR (%) Total CRAR (%)
Capital Adequacy Ratios for the consolidated Position
Common Equity Tier I Tier 1 CRAR (%) Total CRAR (%)
Total and Tier I CRAR for the Significant Subsidiary which is not under consolidated group
5.56% 7.53%
10.92%
5.68% 7.65%
11.04%
NA

3
Table DF-3: Credit Risk: General Disclosures for All Banks Qualitative Disclosures:
(a) General qualitative disclosures with respect to credit risk
Discussion of the Bank’s Credit Risk Management Policy Strategies and Processes: Credit Risk is defined as "the possibility of losses associated with diminution in the credit quality of borrowers or counter parties". There is always a possibility for the borrower to default from his commitments for various reasons, resulting in crystallization of Credit risk to the Bank. These losses could stem from outright default due to inability or unwillingness of a customer or counter party to meet commitments in relation to lending, trading, settlement and other financial transactions. Alternatively, losses result from reduction in portfolio value arising from actual or perceived deterioration in credit quality. Credit risk is, therefore, a combined outcome of Default Risk & Exposure Risk and arises from the Bank's dealings with or lending to a corporate, individual, bank, financial institution or a sovereign. Credit risk may take the following forms:
in the case of direct lending: principal/and or interest amount may not be repaid; in the case of guarantees or letters of credit: funds may not be forthcoming from the constituents upon crystallization of the liability; in the case of treasury operations: the payment or series of payments due from the counter parties under the respective contracts may not be forthcoming or
ceases; in the case of securities trading businesses: funds/ securities settlement may not be effected; in the case of cross-border exposure: the availability and free transfer of foreign currency funds may either cease or restrictions may be imposed by the sovereign.
The effective management of credit risk is a critical component of comprehensive risk management and is essential for the long - term success of any banking institution. Credit Risk Management encompasses identification, measurement through credit rating/scoring, quantification through estimate of expected loan losses, pricing on a scientific basis and controlling through effective Loan Review Mechanism & Portfolio Management. The Bank has in place a Credit Risk Management Policy which is reviewed from time to time. Over the years, the policy and procedures in this regard have been refined as a result of evolving concepts and actual experience. The policy and procedures have been aligned to the approach laid down in Basel II/Basel-III guidelines The Credit Risk Management Policy is designed with the following Objectives.
1. Enhance the risk management capabilities to ensure orderly and healthy credit growth. 2. Maintain the Asset Quality. 3. Maintain credit risk exposure within acceptable parameters/prudential exposures. 4. Manage the asset portfolio in a manner that ensures bank has adequate capital to hedge risks. 5. Build database necessary for migration to the Internal Ratings Based (IRB) approach, using the Credit Risk Rating Model implemented in the Bank. 6. Mitigate and reduce the risk by streamlining the Systems and Controls.
4
Structure and organization of the Credit Risk management function Credit Risk Management structure of the Bank is as under-
Board of Directors Risk Management Committee of the Board Credit Risk Management Committee (CRMC) Chief Risk Officer ( CRO)-Head Office Credit Risk Management Cell, Integrated Risk Management Department, Head Office
Scope and nature of risk reporting and measurement systems: The measurement of Credit Risk includes setting up exposure limits to achieve a well diversified portfolio across dimensions such as companies, group companies, industries, collateral type and geography. For better risk management and avoidance of concentration of Credit Risks, internal guidelines on prudential exposure norms in respect of individual companies, group companies, Banks, individual borrowers, non-corporate entities, sensitive sectors such as capital market, real estate, sensitive commodities, etc., are in place. Policies for hedging and mitigating risk and strategies and processes for monitoring the continuing effectiveness of hedges/ mitigants: The bank also has a well defined Loan Policy in place. The bank has formulated policies & procedures on standards for presentation of credit proposals, financial covenants, rating standards and benchmarks, delegation of credit approving powers, prudential limits on large credit exposures, asset concentrations, standards for loan collateral, portfolio management, loan review mechanism, risk concentrations, risk monitoring and evaluation, pricing of loans, provisioning, regulatory/legal compliance etc.
Definition of past due and impaired (for accounting purposes):
An Asset, including a leased asset, becomes non-performing when it ceases to generate income for the bank. A “ Non Performing Asset” (NPA) is a loan or an advance where:
(i) interest and/ or installment of principal remain overdue for a period of more than 90 days in respect of a Term Loan, (ii) the account remains ‘out of order’ as indicated below, in respect of an Overdraft/Cash Credit (OD/CC), * (iii) the bill remains overdue for a period of more than 90 days in the case of bills purchased and discounted, (iv) the installment of principal or interest thereon remains overdue for two crop seasons for short duration crops, (v) the installment of principal or interest thereon remains overdue for one crop season for long duration crops, (vi) the amount of liquidity facility remains outstanding for more than 90 days, in respect of a securitization transaction undertaken in terms of guidelines on Securitization dated
February 1, 2006 (vii) in respect of derivative transactions, the overdue receivables representing positive mark-to-market value of a derivative contract, if these remain unpaid for a period of 90
days from the specified due date for payment.
In case of interest payments, banks should, classify an account as NPA only if the interest due and charged during any quarter is not serviced fully within 90 days from the end of the quarter.

5
*Out of Order’ status - An account is treated as 'out of order' if –
i. the outstanding balance remains continuously in excess of the sanctioned limit/drawing power;
ii. the outstanding balance in the principal operating account is less than the sanctioned limit/drawing power, but there are no credits continuously for 90 days as on the
date of Balance Sheet; or
iii. credits are not enough to cover the interest debited during the same period.
Accounts with temporary deficiencies - The classification of an asset as NPA is based on the record of recovery. Bank does not classify an advance account as NPA merely due
to the existence of some deficiencies which are temporary in nature such as non-availability of adequate drawing power based on the latest available stock statement, balance
outstanding exceeding the limit temporarily, non-submission of stock statements and non-renewal of the limits on the due date, etc. In the matter of classification of accounts
with such deficiencies the following guidelines are adopted:
Bank ensures that drawings in the working capital accounts are covered by the adequacy of current assets, since current assets are first appropriated in times of distress. Drawing power is arrived at based on the stock statement not older than 3 months. In case Drawings allowed against Stock statements and/or Book debts statements of more than three months old are treated as irregular drawings and accounts where such irregular drawings are allowed for a continuous period of 90 days are to be treated as NPA.
A working capital borrowal account will become NPA if drawings are permitted against stock statement of older than 3 months in the account for a continuous period
of 90 days even though the unit may be working or the borrower's financial position is satisfactory. - An account where the regular/ ad hoc credit limits have not been reviewed/ renewed within 180 days from the due date/ date of ad hoc sanction will be treated as
NPA. Agricultural advances:
A loan granted for short duration crops is treated as NPA, if the installment of principal or interest thereon remains overdue for two crop seasons. A loan granted for long duration crops is treated as NPA, if the installment of principal or interest thereon remains overdue for one crop season. For the purpose of these guidelines, “long duration” crops are crops with crop season longer than one year and crops, which are not “long duration” crops, are treated as “short duration” crops. The crop season for each crop, which means the period up to harvesting of the crops raised, would be as determined by the State Level Bankers’ Committee in each State. Depending upon the duration of crops raised by an agriculturist, the above NPA norms are also made applicable to agricultural term loans availed of by him.
Quantitative Disclosures: b) The total Gross Credit Risk Exposures are :
(Rs. in MIllion)
Category Amount as on 30.06.2018
Fund Based 1605069
Non Fund Based 216888

6
c) Bank has no Overseas Branches. Hence, Geographical exposures are not given.
d) Industry type distribution of exposures: INDUSTRY WISE FUNDED CREDIT EXPOSURE AS ON 30.06.2018
(Rs in Millions)
Sl.No
Industry Actual Fund Based Exposure as on
30.06.2018
1 TEXTILES 66434.10
2 PETROLEUM PRODUCTS 24009.20
3 POWER 158264.20
3.1 a)Renewable Energy 11050.20
4 ENGINEERING (HEAVY&LIGHT) 27543.80
5 NBFC 126546.00
5.1 a) NBFC of which against GOLD collaterals 15105.10
6 DIAMONDS GEMS & JEWELLERY 19992.60
7 RICE MILLS 44533.50
8 SUGAR 10056.20
9 DRUGS & PHARMACEUTICALS 25090.90
10 TOBACCO 12717.20
11 CEMENT & CEMENT PRODUCTS 10986.70
12 DISTILLERIES 2319.70
13 IRON & STEEL 75075.60
14 CONSTRUCTION & CONTRACTORS 71332.90
15 SOFTWARE 1027.70
16 HOSPITALS 7122.50
17 HOTELS 7230.50
18 EDUCATIONAL INSTITUTIONS 9950.10
19 REAL ESTATE 235912.30
19.1 COMMERCIAL REAL ESTATES 34592.60
19.2 HOUSING LOANS 201319.70
19.2.1 a)Housing Loans – Direct 181729.20
19.2.2 b) Housing Loans – Indirect 19590.50
TOTAL 936145.70
7
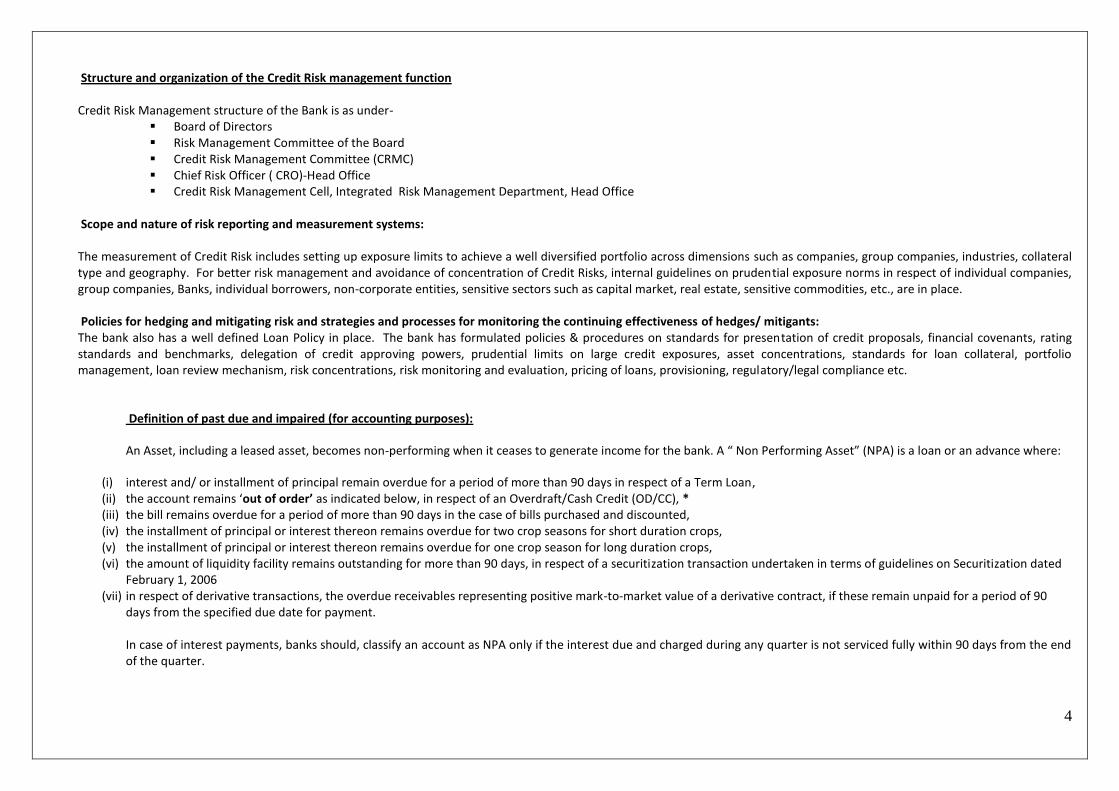
INDUSTRY WISE NON FUNDED CREDIT EXPOSURE AS ON 30.06.2018
(Rs in Millions)
Sl. No Industry Actual Non Fund based exposure as on 30.06.2018
1 TEXTILES 6226.20
2 PETROLEUM PRODUCTS 2346.90
3 POWER 23115.10
3.1 a)Renewable Energy 2285.10
4 ENGINEERING (HEAVY&LIGHT) 14622.40
5 NBFC 5035.50
5.1 a) NBFC of which against GOLD collaterals 0.00
6 DIAMONDS GEMS & JEWELLERY 952.70
7 RICE MILLS 6029.00
8 SUGAR 2101.30
9 DRUGS & PHARMACEUTICALS 7453.50
10 TOBACCO 126.70
11 CEMENT & CEMENT PRODUCTS 597.50
12 DISTILLERIES 131.20
13 IRON & STEEL 14756.00
14 CONSTRUCTION & CONTRACTORS 114088.10
15 SOFTWARE 811.40
16 HOSPITALS 1594.10
17 HOTELS 699.70
18 EDUCATIONAL INSTITUTIONS 1155.80
19 REAL ESTATE 2507.80
19.1 COMMERCIAL REAL ESTATES 2505.30
19.2 HOUSING LOANS 2.50
19.2.1 a)Housing Loans - Direct 0.00
19.2.2 b) Housing Loans - Indirect 2.50
TOTAL 204350.90

8
As on 30.06.2018, the Bank’s outstanding to the industries with more than 5% of the total gross credit risk exposure (FB+NFB) are given below
S.no Industry Percentage of the total gross credit exposure (FB+NFB)
1 HOUSING LOANS 10.14%
2 CONSTRUCTION &CONTRACTORS 8.39%
3 POWER 7.68%
4 NBFC 6.25%
e) Residual contractual Maturity breakdown of assets: (Rs. in Million)
Maturity Pattern Advances (Net) Investments Foreign Currency Assets
0 to 1 day 3669.40 254.60 1603.70
2 to 7 days 8207.20 1822.10 250.40
8 to 14 days 24806.40 1173.40 443.60
15 to 30 days 15485.40 4457.20 1754.30
31 days to 2 months 41796.60 9854.10 6594.10
Over 2 months to 3 months 67055.10 3404.00 15891.60
Over 3 months & upto 6 months 66603.00 30059.10 5099.80
Over 6 months & upto 1 year 116841.90 50327.10 451.90
Over 1 year & upto 3 year(s) 642776.90 36634.40 1.40
Over 3 year (s) & upto 5 year(s) 159283.40 42757.00 0.00
Over 5 year(s) 306482.80 468746.20 0.00
Total 1453008.10 649489.20 32090.80

9
f) Amount of NPAs (Gross):
(Rs. in Million)
CATEGORY AMOUNT
As on 30.06.2018
Sub-Std 48670.50
Doubtful-1 74101.00
Doubtful-2 107171.90
Doubtful-3 31307.30
Loss 6597.40
Total 267848.10
g) Net NPAs:
(Rs. in Million)
30.06.2018
Net NPAs 115613.00
h) NPA Ratios:
30.06.2018
Gross NPA to Gross Advances (%) 16.69%
Net NPA to Net Advances (%) 7.96%
i) Movement of NPAs (Gross): (Rs. in Million)
30.06.2018
(a) Opening Balance 281243.60
(b) Additions during the year 16002.70
(c) Reductions during the year 29398.20
(d) Closing Balance 267848.10
j) Movement of Provision for NPAs: (Rs. in Million)
30.06.2018
Movement of Specific Provisions for NPAs
(a) Opening Balance 154567.70
(b) Provisions made during the year 13994.70
(c) Write-off 14491.40
(d) Write-back of excess provisions 2143.10
(e) Closing Balance 151927.90

10
k) Amount of Non-Performing Investments : Rs. 13478.40 Million l) Amount of provisions held for non-performing investments: Rs.10955.30 Million m) Movement of provisions for depreciation on investments:
(Rs. in Million)
30.06.2018
(a) Opening Balance 13915.60
(b) Provisions made during the period 837.70
(c) Write –off 44.70
(d)Write back of excess provisions 603.40
(e) Closing Balance 14105.20
Write off and recoveries that have been booked directly to the income statement: (Rs. in Million)
Recovery in Technically Write Off accounts 793.70
Interest recovery in TWO accounts directly booked to Income statement 866.50

11
n) By major industry or counter party type: (Rs. in Millions)
Industry NPA Amount
Provisions
Write-offs during the current year
INFRASTRUCTURE 76660.20 30395.50 8974.50
IRON & STEEL 45117.90 29070.20 4870.10
CONSTRUCTION 14630.00 12199.30 71.20
ENGINEERING - OTHERS 14252.60 9359.60 6.20
TEXTILES - COTTON 12950.20 8169.20 35.10
OTHER INDUSTRIES 10222.20 7191.80 194.80
PETROLEUM 8891.70 8878.10 0.00
OTHER METAL & METAL PRODUCTS 6792.60 4467.60 1138.00
FOOD PRODUCTS - OTHERS 5935.90 3480.60 0.50
GEMS & JEWELLERY 5288.10 4847.50 0.00
VEHICLES, VEHICLE PARTS 4950.70 2296.10 0.00
FOOD PRODUCTS - EDIBLE OILS & VANASPATHI 3540.80 1283.60 0.00
BEVERAGES 3237.10 496.70 0.00
TEXTILES -OTHERS 3218.40 1102.80 0.40
FOOD PRODUCTS -SUGAR 3161.90 1063.60 226.90
CHEMICALS - OTHERS 2472.80 2133.40 0.00
CHEMICALS - DRUGS AND PHARMACEUTICALS 2330.20 1367.70 0.00
TEXTILES - JUTE 1061.90 792.50 0.10
PAPER AND PAPER PRODUCTS 1025.90 497.50 0.10
WOOD AND WOOD PRODUCTS 816.60 686.30 0.10
RUBBER, PLASTIC AND THEIR PRODUCTS 699.60 416.00 20.90
CEMENT AND CEMENT PRODUCTS 636.90 251.70 0.20
CHEMICALS - FERTILIZERS 628.10 399.30 0.00
ENGINEERING - ELECTRONICS 592.10 145.10 0.00
MINING AND QUARRYING 349.00 184.60 0.00
GLASS & GLASSWARE 336.80 332.60 0.00
TEXTILES –MAN-MADE 175.50 40.00 0.00
LEATHER AND LEATHER PRODUCTS 81.30 31.40 0.00
TOTAL 230057.00 131580.30 15539.10

12
n) Amount of NPAs broken down by significant geographic areas including the amounts of specific provisions related to each geographic area STATE-WISE NPA &PROVISIONS AS ON 30.06.2018
(Rs. In Millions)
S. No. Name of State NPA Amount Provision
1. ANDHRA PRADESH 18756.00 9393.30
2. ASSAM 3.40 1.20
3. BIHAR 163.10 38.20
4. CHANDIGARH 13938.80 8396.60
5. CHHATISGARH 179.50 148.10
6. DADRA-NAGAR HAVELI 9.30 1.90
7. DELHI 42292.50 24654.40
8. GOA 665.90 330.80
9. GUJARAT 2640.10 1523.80
10. HARYANA 2220.30 523.80
11. HIMACHAL PRADESH 4.10 2.00
12. JAMMU KASHMIR 1.40 0.50
13. JHARKHAND 95.40 60.00
14. KARNATAKA 11968.70 3905.20
15. KERALA 225.40 66.60
16. MADHYA PRADESH 445.90 285.80
17. MAHARASTRA 60935.80 44876.00
18. ODISHA 1676.00 1054.60
19. PONDICHERRY 583.80 108.80
20. PUNJAB 2575.30 1190.00
21. RAJASTHAN 680.60 373.70
22. SIKKIM 3.70 0.70
23. TAMIL NADU 12851.40 6749.30
24. TELANGANA 83736.10 41095.70
25. UTTAR PRADESH 875.40 349.30
26. UTTARAKHAND 137.60 32.60
27. WEST BENGAL 10182.60 6635.00
TOTAL 267848.10 151797.90

13
Table DF-4 - Credit Risk: Disclosures for Portfolios Subject to the Standardized Approach
Qualitative Disclosures:
(a) For portfolios under the standardized approach: Name of the credit rating agencies approved by the Reserve Bank of India and used.
Credit Rating Information Services India Limited (CRISIL)
Credit Analysis and Research Limited (CARE)
India Ratings and Research Private Limited
ICRA Limited
SMERA Ratings Limited
Brick Work Ratings India Private Limited
Infomerics Valuation and Rating Pvt. Ltd. (INFOMERICS) Types of exposure for which each agency is used:
For exposures with a contractual maturity of less than or equal to one year (except cash credit, overdraft) Short term rating given by approved Rating Agencies is used.
For domestic cash credit, overdraft and for term loan exposures of over 1 year, Long Term Rating is used.
The Bank uses only publicly available solicited ratings that are valid and reviewed by the recognized ECAIs.
The Bank does not simultaneously use the rating of one ECAI for one exposure and that of another ECAI for another exposure to the same borrower, unless the respective exposures are rated by only one of the chosen ECAIs. Further, the bank does not use rating assigned to a particular entity within a corporate group to risk weight other entities within the same group.
Where exposures/ borrowers have multiple ratings from the chosen ECAIs, the bank has adopted the following procedure for risk weight calculations: i. If there are two ratings accorded by chosen ECAIs, which map into different risk weights, the higher risk weight is applied. ii. If there are three or more ratings accorded by the chosen ECAIs which map into different risk weights, the ratings corresponding to the lowest 2 ratings are
referred to and higher of those two risk weights is applied. A description of the process used to transfer public issue ratings onto comparable assets in the banking book: No such process is applied

14
Quantitative Disclosures: (b) For exposure amounts after risk mitigation subject to the standardized approach, amount of bank’s outstandings (rated & unrated) in the following major risk buckets as well as those that are deducted:
(Rs. in Millions)
30.06.2018
Fund Based Non Fund Based
Below 100% risk weight 834870 95775
100% risk weight 468517 68383
More than 100% risk weight 175846 25069
Deducted (Mitigants) 125836 27661
Total 1605069 216888

15
Table DF-17: Summary Comparison of Accounting Assets vs. Leverage Ratio Exposure Measure
The Basel III leverage ratio is defined as the capital measure (Tier-1 capital of the risk based capital framework) divided by the exposure measure, expressed as a percentage. As per RBI
guidelines, disclosures required for leverage ratio for the Bank at the consolidated level at June 30, 2018 is as follows.
(Rs. in Million) S.No Particulars Amount
1 Total consolidated assets as per published financial statements 2380976.76
2 Adjustment for investments in banking, financial, insurance or commercial entities that are consolidated for accounting purposes but outside the scope of regulatory consolidation
- 37952.43
3 Adjustment for fiduciary assets recognised on the balance sheet pursuant to the operative accounting framework but excluded from the leverage ratio exposure measure
-
4 Adjustments for derivative financial instruments 2107.03
5 Adjustment for securities financing transactions (i.e. repos and similar secured lending)
-
6 Adjustment for off-balance sheet items (i.e. conversion to credit equivalent amounts of off- balance sheet exposures)
175569.17
7 Other adjustments -19349.58
8 Leverage ratio exposure 2501350.95

16
DF-18 – Leverage ratio common disclosure template
(Rs. in Million)
Leverage ratio framework
On-balance sheet exposures Amount
1 On-balance sheet items (excluding derivatives and SFTs, but including collateral) 2343024.33
2 (Asset amounts deducted in determining Basel III Tier 1 capital) -19349.58
3 Total on-balance sheet exposures (excluding derivatives and SFTs) (sum of lines 1 and 2) 2323674.75
Derivative exposures Amount
4 Replacement cost associated with all derivatives transactions (i.e. net of eligible cash variation margin) 896.46
5 Add-on amounts for PFE associated with all derivatives transactions 1210.57
6 Gross-up for derivatives collateral provided where deducted from the balance sheet assets pursuant to the operative accounting framework
-
7 (Deductions of receivables assets for cash variation margin provided in derivatives transactions) -
8 (Exempted CCP leg of client-cleared trade exposures) -
9 Adjusted effective notional amount of written credit derivatives -
10 (Adjusted effective notional offsets and add-on deductions for written credit derivatives) -
11 Total derivative exposures (sum of lines 4 to 10) 2107.03
Securities financing transaction exposures
12 Gross SFT assets (with no recognition of netting), after adjusting for -
13 (Netted amounts of cash payables and cash receivables of gross SFT assets) -
14 CCR exposure for SFT assets -
15 Agent transaction exposures -
16 Total securities financing transaction exposures (sum of lines 12 to 15)
Other off-balance sheet exposures
17 Off-balance sheet exposure at gross notional amount 496620.06
18 (Adjustments for conversion to credit equivalent amounts) -321050.89
19 Off-balance sheet items (sum of lines 17 and 18) 175569.17
Capital and total exposures
20 Tier 1 capital 108056.70
21 Total exposures (sum of lines 3, 11, 16 and 19) 2501350.95
Leverage Ratio 4.32%


![Capital Adequacy (E) Task Force - National Association of ... · Capital Adequacy (E) Task Force . RBC Proposal Form [ ] Capital Adequacy (E) Task Force ... LR004 – Mortgages –](https://static.fdocuments.in/doc/165x107/5f0a28317e708231d42a4995/capital-adequacy-e-task-force-national-association-of-capital-adequacy-e.jpg)