Table Detection in On-line Ink Notes - Columbia University
18
Table Detection in On-line Ink Notes Zhouchen Lin 1 Junfeng He 2 Zhicheng Zhong 3 Rongrong Wang 4 Heung-Yeung Shum 1 * 1 Microsoft Research Asia 2 Tsinghua University 3 Nankai University 4 Fudan University Abstract In documents a table is an important structured object that presents statistical and relational information. In this paper we present a robust system which is capable of detecting tables from free style on-line ink notes and extracting their structure so that they can be further edited in multiple ways. First, the primitive structure of tables, i.e., candidates for ruling lines and table bounding boxes, are detected among drawing strokes. Second, the logical structure of tables is determined by normalizing the table skeletons, identifying the skeleton structure, and extracting the cell contents. The detection process is similar to a decision tree in that invalid candidates can be ruled out quickly. Experimental results suggest that our sys- tem is robust and accurate in dealing with tables having complex structure or drawn under complex situations. Keywords: Table Detection, Table Recognition, Graphics Recognition, Handwriting Recog- nition, Document Analysis, Pen-Based Computing * Junfeng He, Zhicheng Zhong, and Rongrong Wang were visiting students to Microsoft Research Asia when this work was done.
Transcript of Table Detection in On-line Ink Notes - Columbia University
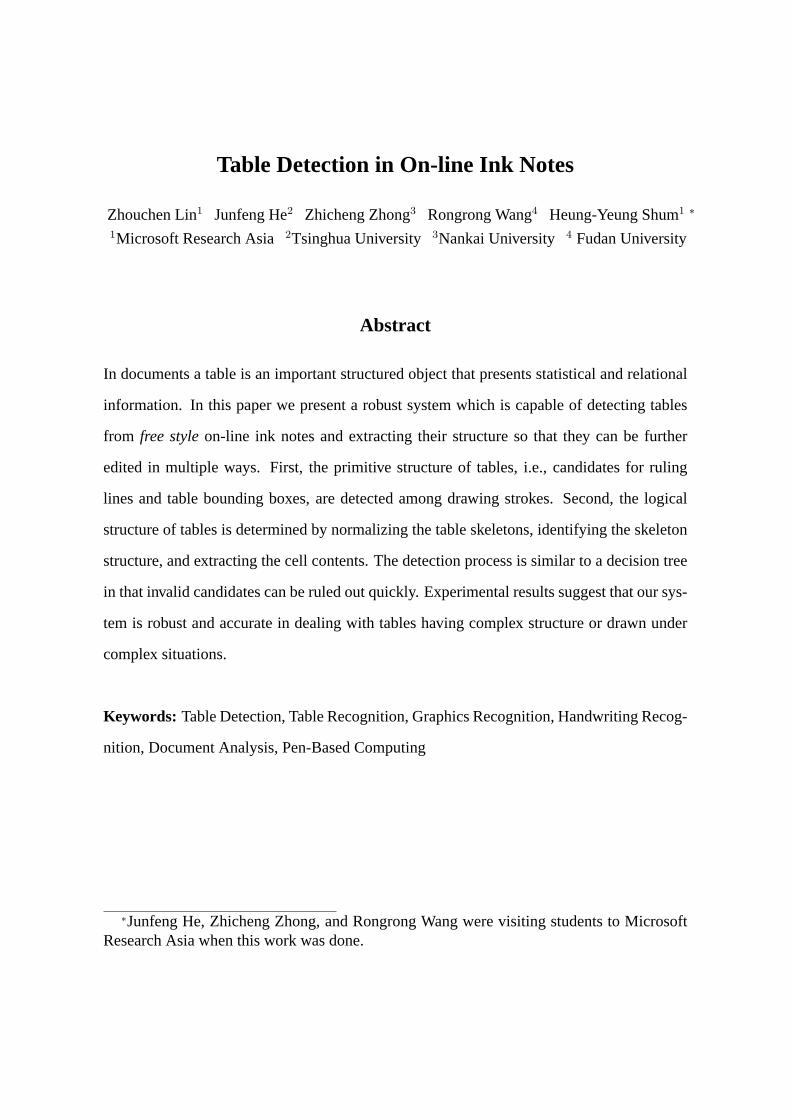
Table Detection in On-line Ink Notes
Zhouchen Lin1 Junfeng He2 Zhicheng Zhong3 Rongrong Wang4 Heung-Yeung Shum1 ∗
1Microsoft Research Asia2Tsinghua University 3Nankai University 4 Fudan University
Abstract
In documents a table is an important structured object that presents statistical and relational
information. In this paper we present a robust system which is capable of detecting tables
from free styleon-line ink notes and extracting their structure so that they can be further
edited in multiple ways. First, the primitive structure of tables, i.e., candidates for ruling
lines and table bounding boxes, are detected among drawing strokes. Second, the logical
structure of tables is determined by normalizing the table skeletons, identifying the skeleton
structure, and extracting the cell contents. The detection process is similar to a decision tree
in that invalid candidates can be ruled out quickly. Experimental results suggest that our sys-
tem is robust and accurate in dealing with tables having complex structure or drawn under
complex situations.
Keywords: Table Detection, Table Recognition, Graphics Recognition, Handwriting Recog-
nition, Document Analysis, Pen-Based Computing
∗Junfeng He, Zhicheng Zhong, and Rongrong Wang were visiting students to MicrosoftResearch Asia when this work was done.

Author Information:
Authors: Zhouchen Lin, Junfeng He, Zhicheng Zhong, Rongrong Wang, Heung-Yeung
Shum
Corresponding Author: Zhouchen Lin
Contact Information:
Zhouchen Lin
Microsoft Research Asia, 5th Floor, Sigma Building
Zhichun Road #49, Haidian District, Beijing 100080, P.R. China
Email: [email protected]
Junfeng He
Department of Automation, Tsinghua University
Haidian District, Beijing 100084, P.R. China
Email: [email protected]
Zhicheng Zhong
Department of Electronics Science and Technology, Nankai University
Weijin Road #94, Nankai District, Tianjin 300071, P.R. China
Email: [email protected]
Rongrong Wang
Department of Computer Science and Engineering, Fudan University
Handan Road #220, Shanghai 200433, P.R. China
Email: [email protected]
Heung-Yeung Shum
Microsoft Research Asia, 5th Floor, Sigma Building
Zhichun Road 49#, Haidian District Beijing, 100080, P.R. China
Email: [email protected]

1 Introduction
In the past decades, great effort (e.g. the numerous references in [1, 2]) has been spent
on off-line document analysis. With the advent of pen-based devices such as Tablet PCs and
Electronic White-boards, where whole-page or even multiple-page ink notes can be produced
easily, the demand for analysis of on-line documents, as an indispensable part of pen-based
computing, has become greater than ever. On-line documents contain more information
than off-line document images, such as stroke order and connectivity between stroke points.
Such extra information is very helpful for document analysis, e.g., waiving the need for
binarization and extracting connected components [1, 2] and better for isolating overlapping
strokes. Therefore, although there has been notable success in off-line document analysis, it
may be more efficient and robust to develop on-line approaches for on-line documents.
Table analysis plays an important role in document processing because tables are common
in documents for their power in describing statistical and relational information. Moreover,
many applications can be built upon table extraction, such as populating databases which can
then be queried or be converted into charts. These would help to accelerate office automation.
There have been many papers focusing on table detection (e.g. [6, 7, 8, 9, 10, 12] and
the references in [3, 4, 5], to name just a few). Generally speaking, besides ASCII tables in
electronic documents, there are two kinds of tables in document analysis: printed tables and
handwritten tables. The latter can further be classified as off-line or on-line. A great deal of
handwritten tables exist in spite of many table creating/editing user interfaces (UIs) provided
by pen-based devices. The dedicated UIs, mainly driven by gestures or menus, may be more
effective in certain cases, but the free-form table drawing has a significant advantage from
the user standpoint in that it does not require switching modes – the user can simply write
without concerning whether the correct drawing mode is enabled.
Most of the existing algorithms deal with printed tables, where the detection usually starts
from spotting the ruling lines and separating space [7, 10] or block segmentation [8, 12], or
using some prior knowledge of layout style of the tables [6]. Much less work has targeted
1
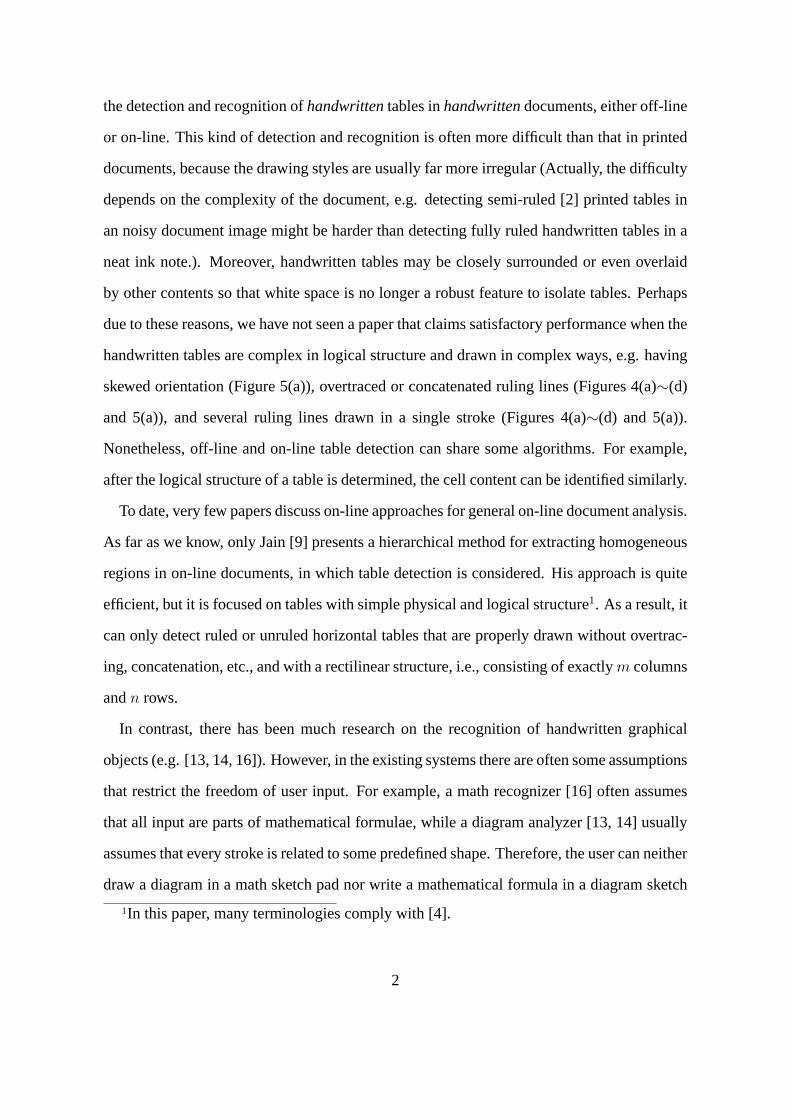
the detection and recognition ofhandwrittentables inhandwrittendocuments, either off-line
or on-line. This kind of detection and recognition is often more difficult than that in printed
documents, because the drawing styles are usually far more irregular (Actually, the difficulty
depends on the complexity of the document, e.g. detecting semi-ruled [2] printed tables in
an noisy document image might be harder than detecting fully ruled handwritten tables in a
neat ink note.). Moreover, handwritten tables may be closely surrounded or even overlaid
by other contents so that white space is no longer a robust feature to isolate tables. Perhaps
due to these reasons, we have not seen a paper that claims satisfactory performance when the
handwritten tables are complex in logical structure and drawn in complex ways, e.g. having
skewed orientation (Figure 5(a)), overtraced or concatenated ruling lines (Figures 4(a)∼(d)
and 5(a)), and several ruling lines drawn in a single stroke (Figures 4(a)∼(d) and 5(a)).
Nonetheless, off-line and on-line table detection can share some algorithms. For example,
after the logical structure of a table is determined, the cell content can be identified similarly.
To date, very few papers discuss on-line approaches for general on-line document analysis.
As far as we know, only Jain [9] presents a hierarchical method for extracting homogeneous
regions in on-line documents, in which table detection is considered. His approach is quite
efficient, but it is focused on tables with simple physical and logical structure1. As a result, it
can only detect ruled or unruled horizontal tables that are properly drawn without overtrac-
ing, concatenation, etc., and with a rectilinear structure, i.e., consisting of exactlym columns
andn rows.
In contrast, there has been much research on the recognition of handwritten graphical
objects (e.g. [13, 14, 16]). However, in the existing systems there are often some assumptions
that restrict the freedom of user input. For example, a math recognizer [16] often assumes
that all input are parts of mathematical formulae, while a diagram analyzer [13, 14] usually
assumes that every stroke is related to some predefined shape. Therefore, the user can neither
draw a diagram in a math sketch pad nor write a mathematical formula in a diagram sketch
1In this paper, many terminologies comply with [4].
2
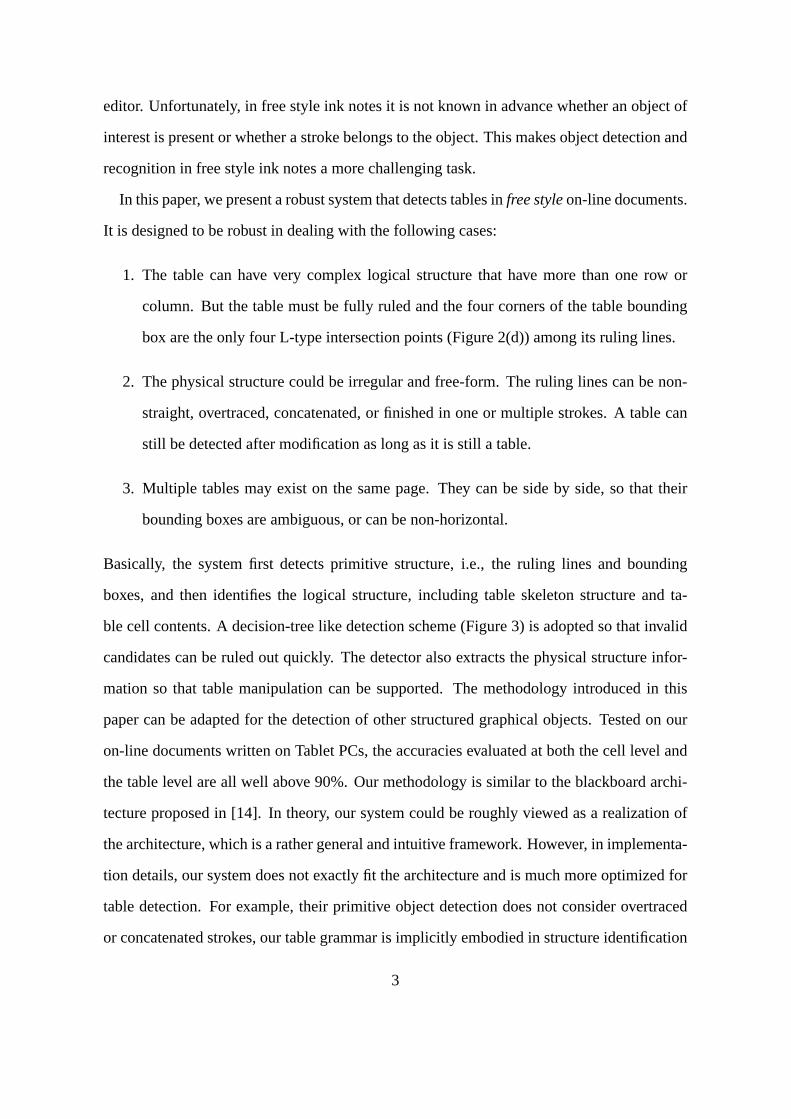
editor. Unfortunately, in free style ink notes it is not known in advance whether an object of
interest is present or whether a stroke belongs to the object. This makes object detection and
recognition in free style ink notes a more challenging task.
In this paper, we present a robust system that detects tables infree styleon-line documents.
It is designed to be robust in dealing with the following cases:
1. The table can have very complex logical structure that have more than one row or
column. But the table must be fully ruled and the four corners of the table bounding
box are the only four L-type intersection points (Figure 2(d)) among its ruling lines.
2. The physical structure could be irregular and free-form. The ruling lines can be non-
straight, overtraced, concatenated, or finished in one or multiple strokes. A table can
still be detected after modification as long as it is still a table.
3. Multiple tables may exist on the same page. They can be side by side, so that their
bounding boxes are ambiguous, or can be non-horizontal.
Basically, the system first detects primitive structure, i.e., the ruling lines and bounding
boxes, and then identifies the logical structure, including table skeleton structure and ta-
ble cell contents. A decision-tree like detection scheme (Figure 3) is adopted so that invalid
candidates can be ruled out quickly. The detector also extracts the physical structure infor-
mation so that table manipulation can be supported. The methodology introduced in this
paper can be adapted for the detection of other structured graphical objects. Tested on our
on-line documents written on Tablet PCs, the accuracies evaluated at both the cell level and
the table level are all well above 90%. Our methodology is similar to the blackboard archi-
tecture proposed in [14]. In theory, our system could be roughly viewed as a realization of
the architecture, which is a rather general and intuitive framework. However, in implementa-
tion details, our system does not exactly fit the architecture and is much more optimized for
table detection. For example, their primitive object detection does not consider overtraced
or concatenated strokes, our table grammar is implicitly embodied in structure identification
3
(Section 3.2), and our candidate pruning exists in every step of the detection (Section 4).
The rest of this paper is organized as follows. Sections 2 and 3 introduce the steps in
structure detection and the features for candidate selection and classification. Section 4 sum-
marizes the detection scheme and presents the classifier. Experimental results are shown in
Section 5. Finally, Section 6 provides our conclusions and the future work.
2 Primitive Structure Detection
A graphical object usually has some primitive structure. For a table, the primitive structure
includes ruling lines and the bounding box.
2.1 Ruling Line Candidate Detection
In this step, strokes which could serve as the ruling lines of tables are detected. In printed
table detection, the ruling lines are usually spotted by tracing black pixels along nearly hor-
izontal or vertical directions [10]. Unfortunately, in on-line ink notes, the ruling lines are
usually drawn flexibly. To achieve fast detection, writing/drawing classification and primary
grouping should be done beforehand. As our table detection system is a relatively indepen-
dent module of the more complete advanced ink parser developed by Microsoft Research
Asia, our system simply adopts the writing/drawing classification and primary grouping re-
sults from previous modules. However, our system can work without writing/drawing clas-
sification and primary grouping results with some sacrifice in speed and accuracy.
First, all the drawing strokes that are close to line segments are collected. The linearity of
a stroke is measured by:
fl =Bw
Bh + Bw
· Bw
L,
whereBw andBh are the width and height of the skewed bounding rectangle of the stroke,
whose principal direction is computed via least squares, andL is the length of the stroke.
Since the user may draw several ruling lines (such as the table bounding box) in a single
stroke, we should also examine whether a stroke is composed of multiple line segments. If
4

a stroke is not close to a line segment, we first apply Sklansky’s polygonal approximation
algorithm [11] to approximate the stroke with a polyline, then segment the stroke at high-
curvature points so that each sub-stroke can be approximated by a line segment. If the
number of approximating line segments is less than 5 (because the user usually draws no
more than four ruling lines in a stroke when drawing tables) and the turning angles between
successive line segments are close to either 0 degree, 90 degrees, or 180 degrees, then we
accept them as candidates for ruling lines. Thereafter, each accepted stroke is represented
by its approximating line segments in order to reduce complexity and save computation.
Our ruling line candidate detection algorithm is different from that in [9] where the Hough
transform was used and hence short ruling lines might not be detected.
Next, the accepted line segments are grouped into blocks according to their spatial position
in order to speed up detection, because there may be multiple tables that may not be close
to each other. For each block, all line segments within it are stored in a line list. Then a
histogram is built to count the number of line segments around each direction.
2.2 Bounding Box Candidate Detection
To detect the table bounding box, we first select line segments from the histogram built in the
previous step whose directions are close to or perpendicular to the direction that corresponds
to a peak. The peaks of the histogram will be tested one by one from the highest to the
lowest. Rotation follows so that the selected line segments become nearly horizontal or
vertical. Then we build the horizontal line list and the vertical line list. As we need to
deal with overtraced and concatenated ruling lines, the line lists also store allcompositeline
segments that are a combination of some original line segments that are nearly parallel and
can be merged or concatenated. For a composite line segment, its linearityfl is defined as
the product of the linearity of the component original line segments and the concatenation
strength between successive line segments defined as:
fcon = 1− θ · (A · |p|+ B)− C · p · (1 + |d|)2,
5
� �
� ��
��
�� � ��
�
� �
� � �
W
H
b∆r∆
t∆
l∆
� � � �
� �� �
���������
�� �
���������
�� �
���������
�� �
���������
�� �
����������
��
�
(b) (c) (d) (e) (f)
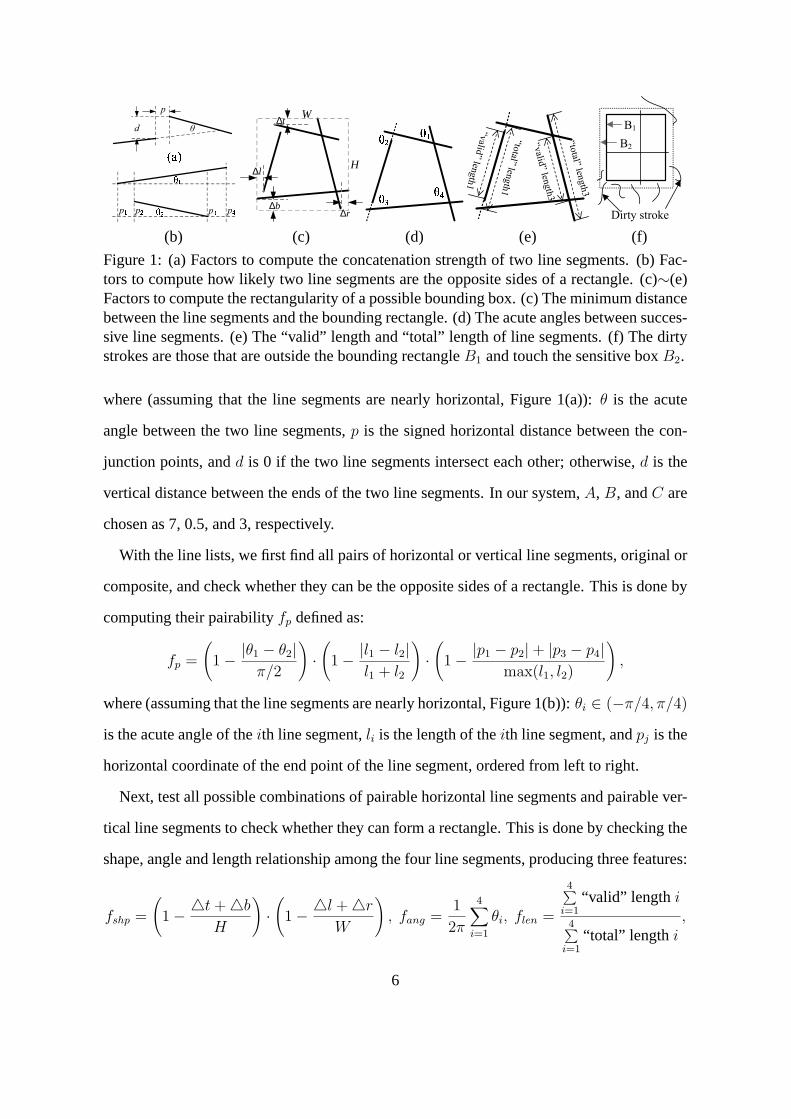
Figure 1: (a) Factors to compute the concatenation strength of two line segments. (b) Fac-tors to compute how likely two line segments are the opposite sides of a rectangle. (c)∼(e)Factors to compute the rectangularity of a possible bounding box. (c) The minimum distancebetween the line segments and the bounding rectangle. (d) The acute angles between succes-sive line segments. (e) The “valid” length and “total” length of line segments. (f) The dirtystrokes are those that are outside the bounding rectangleB1 and touch the sensitive boxB2.
where (assuming that the line segments are nearly horizontal, Figure 1(a)):θ is the acute
angle between the two line segments,p is the signed horizontal distance between the con-
junction points, andd is 0 if the two line segments intersect each other; otherwise,d is the
vertical distance between the ends of the two line segments. In our system,A, B, andC are
chosen as 7, 0.5, and 3, respectively.
With the line lists, we first find all pairs of horizontal or vertical line segments, original or
composite, and check whether they can be the opposite sides of a rectangle. This is done by
computing their pairabilityfp defined as:
fp =
(1− |θ1 − θ2|
π/2
)·(
1− |l1 − l2|l1 + l2
)·(
1− |p1 − p2|+ |p3 − p4|max(l1, l2)
),
where (assuming that the line segments are nearly horizontal, Figure 1(b)):θi ∈ (−π/4, π/4)
is the acute angle of theith line segment,li is the length of theith line segment, andpj is the
horizontal coordinate of the end point of the line segment, ordered from left to right.
Next, test all possible combinations of pairable horizontal line segments and pairable ver-
tical line segments to check whether they can form a rectangle. This is done by checking the
shape, angle and length relationship among the four line segments, producing three features:
fshp =
(1− 4t +4b
H
)·(
1− 4l +4r
W
), fang =
1
2π
4∑
i=1
θi, flen =
4∑i=1
“valid” length i
4∑i=1
“total” length i,
6
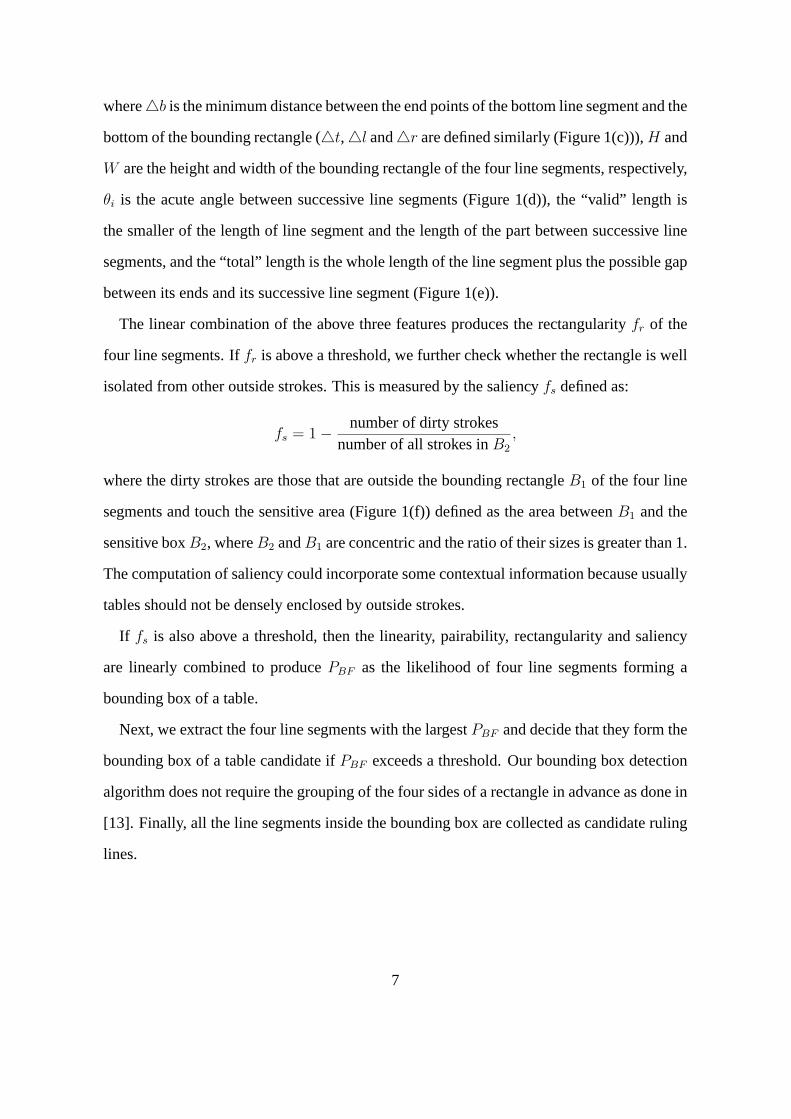
where4b is the minimum distance between the end points of the bottom line segment and the
bottom of the bounding rectangle (4t,4l and4r are defined similarly (Figure 1(c))),H and
W are the height and width of the bounding rectangle of the four line segments, respectively,
θi is the acute angle between successive line segments (Figure 1(d)), the “valid” length is
the smaller of the length of line segment and the length of the part between successive line
segments, and the “total” length is the whole length of the line segment plus the possible gap
between its ends and its successive line segment (Figure 1(e)).
The linear combination of the above three features produces the rectangularityfr of the
four line segments. Iffr is above a threshold, we further check whether the rectangle is well
isolated from other outside strokes. This is measured by the saliencyfs defined as:
fs = 1− number of dirty strokesnumber of all strokes inB2
,
where the dirty strokes are those that are outside the bounding rectangleB1 of the four line
segments and touch the sensitive area (Figure 1(f)) defined as the area betweenB1 and the
sensitive boxB2, whereB2 andB1 are concentric and the ratio of their sizes is greater than 1.
The computation of saliency could incorporate some contextual information because usually
tables should not be densely enclosed by outside strokes.
If fs is also above a threshold, then the linearity, pairability, rectangularity and saliency
are linearly combined to producePBF as the likelihood of four line segments forming a
bounding box of a table.
Next, we extract the four line segments with the largestPBF and decide that they form the
bounding box of a table candidate ifPBF exceeds a threshold. Our bounding box detection
algorithm does not require the grouping of the four sides of a rectangle in advance as done in
[13]. Finally, all the line segments inside the bounding box are collected as candidate ruling
lines.
7
�����������
���������� ��� ��
�� �� ���
������� ��
� ��� � �
�
�
� �
� �jiC i cell
�������
�
(a) (b) (c) (d) (e) (f)
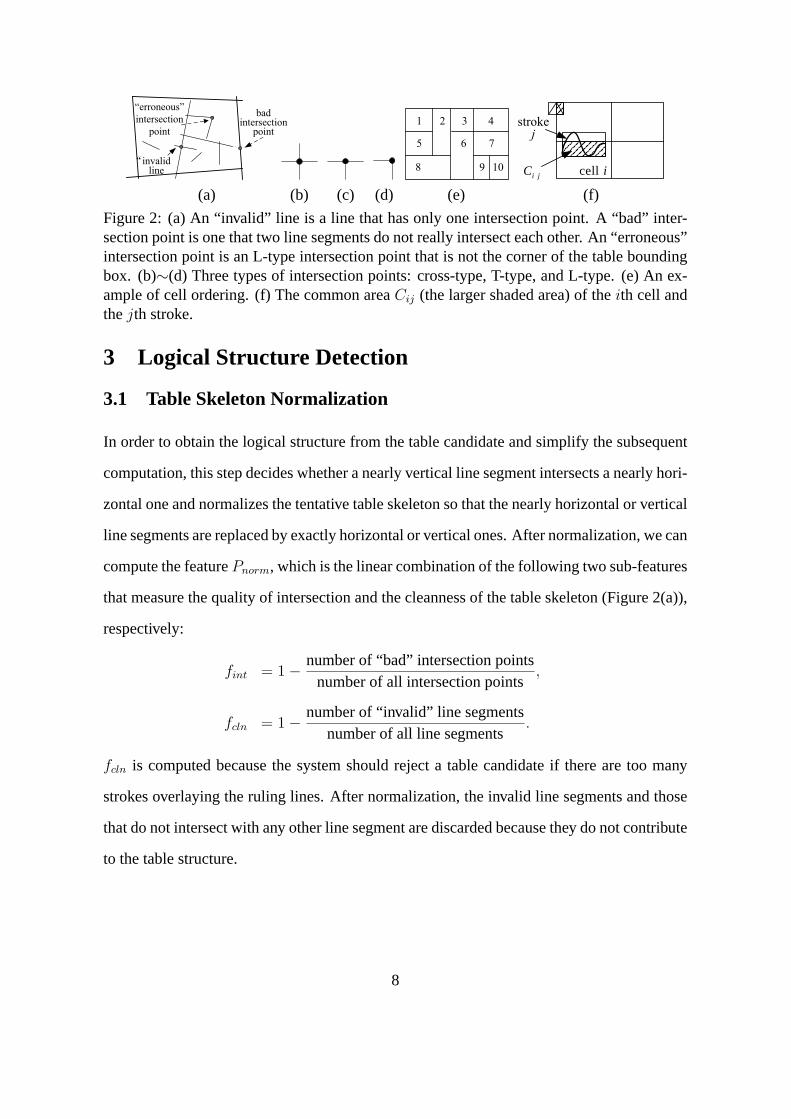
Figure 2: (a) An “invalid” line is a line that has only one intersection point. A “bad” inter-section point is one that two line segments do not really intersect each other. An “erroneous”intersection point is an L-type intersection point that is not the corner of the table boundingbox. (b)∼(d) Three types of intersection points: cross-type, T-type, and L-type. (e) An ex-ample of cell ordering. (f) The common areaCij (the larger shaded area) of theith cell andthejth stroke.
3 Logical Structure Detection
3.1 Table Skeleton Normalization
In order to obtain the logical structure from the table candidate and simplify the subsequent
computation, this step decides whether a nearly vertical line segment intersects a nearly hori-
zontal one and normalizes the tentative table skeleton so that the nearly horizontal or vertical
line segments are replaced by exactly horizontal or vertical ones. After normalization, we can
compute the featurePnorm, which is the linear combination of the following two sub-features
that measure the quality of intersection and the cleanness of the table skeleton (Figure 2(a)),
respectively:
fint = 1− number of “bad” intersection pointsnumber of all intersection points
,
fcln = 1− number of “invalid” line segmentsnumber of all line segments
.
fcln is computed because the system should reject a table candidate if there are too many
strokes overlaying the ruling lines. After normalization, the invalid line segments and those
that do not intersect with any other line segment are discarded because they do not contribute
to the table structure.
8

3.2 Table Skeleton Structure Identification
Now the intersection relationship among all ruling lines is available. The detector then recog-
nizes the logical structure of the table by examining the type of intersection points.
There are three types of intersection points: cross-type, T-type, and L-type (Figures 2(b)∼(d)). Similar classification of crossings has been used in [15] to register form images. Note
that if an intersection point is not one of the four corners of the bounding box, then it can
only be of cross-type or T-type. Therefore, the detector will remove all “erroneous” inter-
section points (Figure 2(a)), i.e., those L-type intersection points that are not any of the four
corner points of the table bounding box, by abandoning some line segments that form the
intersection points until the remaining ruling lines form a valid table skeleton structure. The
erroneous intersection points can also be fixed by inferring virtual ruling lines as done in
[10]. However, this strategy is more reasonable for off-line tables but less reasonable for
on-line tables because for off-line tables the ruling lines may be missing due to scanning and
binarization, while for on-line tables every stroke forming the table should be available.
After all erroneous intersection points are removed, the logical structure of the table can-
didate is determined. Then the table cells are ordered according to the coordinates of their
top-left corner, left to right and then top to bottom (Figure 2(e)).
This step produces the confidencePstr on the logical structure:
Pstr = 1− number of erroneous intersection pointsnumber of all intersection points
.
This will be used for the final table detection decision in Section 4.
3.3 Table Cell Content Extraction
This step finds the content of each cell in order to complete the table information. It checks
the bounding rectangle of each cell and those of other objects by the proportion of their
common area in the bounding rectangle of an object (such as paragraph, line, word, and
stroke. Note that now the rotation for table bounding box (Section 2.2) is also applied to
the other strokes that are spatially close to the bounding box.). It is done from the top level
9
������� ������� ������ � �������� ����������
�������� ������
���� ��������� �
���������������
�
�
�
�
�
�
�
�
�
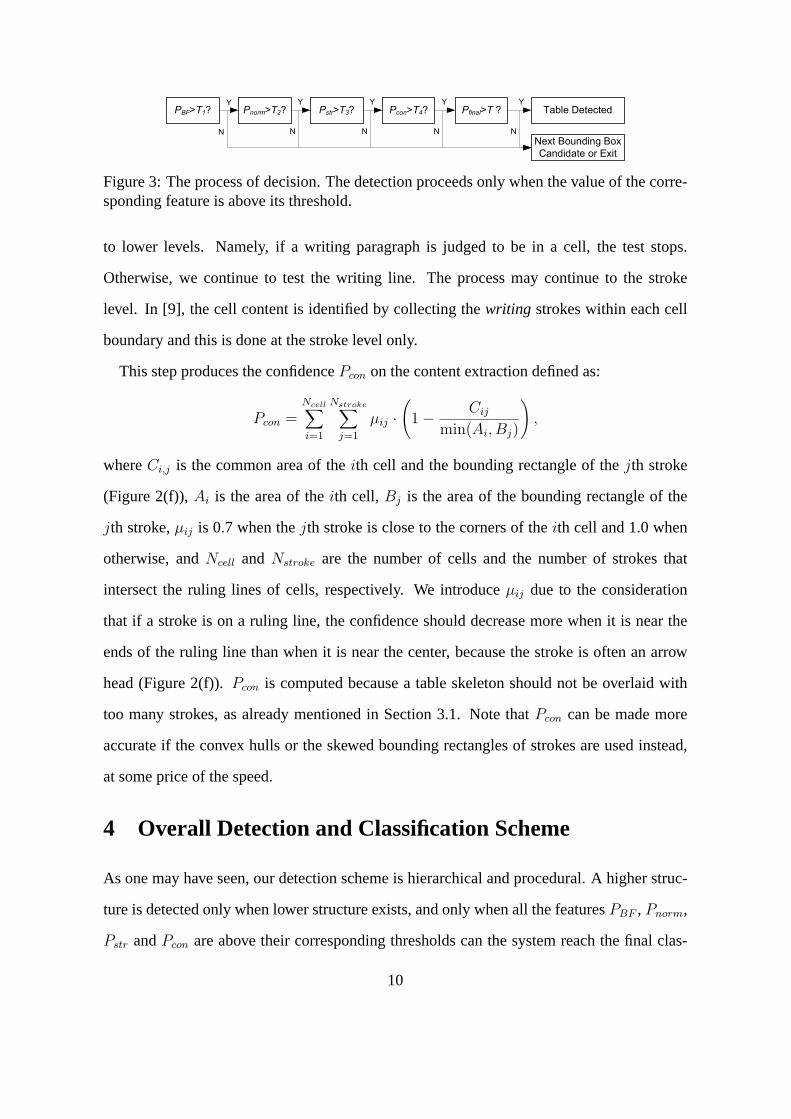
Figure 3: The process of decision. The detection proceeds only when the value of the corre-sponding feature is above its threshold.
to lower levels. Namely, if a writing paragraph is judged to be in a cell, the test stops.
Otherwise, we continue to test the writing line. The process may continue to the stroke
level. In [9], the cell content is identified by collecting thewriting strokes within each cell
boundary and this is done at the stroke level only.
This step produces the confidencePcon on the content extraction defined as:
Pcon =Ncell∑
i=1
Nstroke∑
j=1
µij ·(
1− Cij
min(Ai, Bj)
),
whereCi,j is the common area of theith cell and the bounding rectangle of thejth stroke
(Figure 2(f)),Ai is the area of theith cell, Bj is the area of the bounding rectangle of the
jth stroke,µij is 0.7 when thejth stroke is close to the corners of theith cell and 1.0 when
otherwise, andNcell and Nstroke are the number of cells and the number of strokes that
intersect the ruling lines of cells, respectively. We introduceµij due to the consideration
that if a stroke is on a ruling line, the confidence should decrease more when it is near the
ends of the ruling line than when it is near the center, because the stroke is often an arrow
head (Figure 2(f)).Pcon is computed because a table skeleton should not be overlaid with
too many strokes, as already mentioned in Section 3.1. Note thatPcon can be made more
accurate if the convex hulls or the skewed bounding rectangles of strokes are used instead,
at some price of the speed.
4 Overall Detection and Classification Scheme
As one may have seen, our detection scheme is hierarchical and procedural. A higher struc-
ture is detected only when lower structure exists, and only when all the featuresPBF , Pnorm,
Pstr andPcon are above their corresponding thresholds can the system reach the final clas-
10

Table 1: Performance of our table detection system at the cell level and the table level.Eval. total detected cor- splitt- merg- miss- false spu- correct/ correct/Level rect ing ing ing alarm rious detected total
Cell 3547 3479 3297 6 52 91 114 2 94.77% 92.95%Table 232 230 223 ————– 96.96% 96.12%
sification step, which uses a linear classifier that combines the four high-level features. If
the classifier decides that it is a table, then both the physical and logical structure informa-
tion is output, including the number of rows and columns, the sizes of the table bounding
box, the transform matrix between the local table coordinate (the top-left corner of the table
bounding box is the origin) and the global coordinate, the coordinates of intersection points
among the ruling lines in the local table coordinate, a matrix indicating whether a cell has
content, and which part of a stroke that forms the table skeleton corresponds to which ruling
line, etc. Such information is valuable for further table manipulation. Conceptually, our de-
tection procedure resembles a decision tree (Figure 3), which is common in table detection
and recognition [4].
5 Experimental Results
Our testing data set has 378 ink notes, which contains 195 handwritten documents written
in English, 84 in Chinese, 44 in French and 55 in German. Many ink notes are of multiple
pages. They were collected from many people with different nationalities, by asking them to
rewrite, without any restriction on their writing styles (e.g. not necessary write exactly in the
horizontal direction), pages that were selected by several people from books or magazines
across various categories. They may contain texts, graphics, diagrams, flow charts, tables,
and so on. Tables can be drawn at random, large or small, skewed or not, ruled or unruled.
We only deem fully-ruled tables as real tables. Those that are unruled or semi-ruled are
temporarily regarded as non-tables because our system is not designed to detect such kinds
of tables.
11
������������������������ ������������������������������������������ ����������������������������������������������������������
(a) (b)
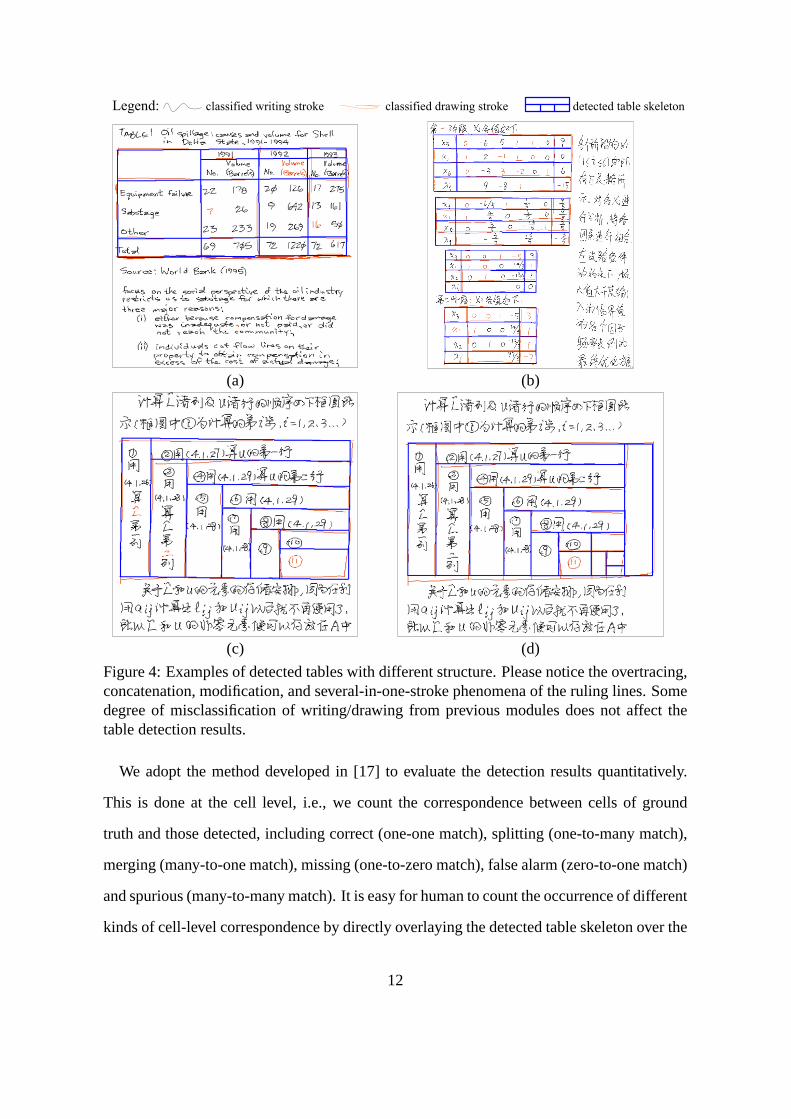
(c) (d)
Figure 4: Examples of detected tables with different structure. Please notice the overtracing,concatenation, modification, and several-in-one-stroke phenomena of the ruling lines. Somedegree of misclassification of writing/drawing from previous modules does not affect thetable detection results.
We adopt the method developed in [17] to evaluate the detection results quantitatively.
This is done at the cell level, i.e., we count the correspondence between cells of ground
truth and those detected, including correct (one-one match), splitting (one-to-many match),
merging (many-to-one match), missing (one-to-zero match), false alarm (zero-to-one match)
and spurious (many-to-many match). It is easy for human to count the occurrence of different
kinds of cell-level correspondence by directly overlaying the detected table skeleton over the
12

(a) (b)
(c) (d)
Figure 5: Examples of table manipulation. (a) An ink note with a skewed table. (b) There-orientation and cell right-justification of the table. (c) Resizing and cell left-justificationof the table. (d) Converting the table into a chart. Note that the ruling lines in (b) and (c) arestill natural ink strokes.
ink note (Figures 4 and 5). The cell-level detection results are shown in the second row of
Table 1. We also test our system at the table level, i.e., as long as a table is detected, it is
regarded as correct, no matter whether the cells of the table are all detected correctly. The
results are shown in the third row of Table 1. It can be seen that the accuracy is quite high at
both the cell level and the table level.
Figures 4 and 5(a) shows some concrete examples of detected tables, where the overlaid
straight lines are the detected table skeletons. Please note the overtracing, concatenation,
modification, and multiple ruling lines that are drawn in one stroke in those figures. More-
over, some mis-classified writing/drawing strokes do not affect the table detection results.
After table physical and logical structure information is extracted, table editing can be
performed, such as rotation, scaling, moving the whole table, and alignment of cell content.
13

(a) (b) (c)
Figure 6: Examples of failure cases. (a) Failure caused by overly casual drawing of tableskeletons. (b) Failure caused by incorrect grouping or writing/drawing classification of thestrokes. (c) Whether an ink object is a table is highly dependent on the semantic context.
Some table editing examples of our ink parser demo system are shown in Figures 5(b) and
(c). Note that the ruling lines therein are still natural ink strokes. Working with a handwriting
recognizer, a handwritten table can also be converted to a printed table or other graphical
objects, e.g. charts, as shown in Figures 5(d).
Although our system is robust and accurate, there are still several factors that can cause
failure. For example, overly casual drawing of the table skeletons (Figure 6(a)) may make the
bounding box or other ruling lines undetectable, and incorrect grouping or writing/drawing
classification (Figure 6(b)) may cause spurious or mis-detection of ruling lines. It is also
interesting to note that semantic context also matters. It is possible that locally an ink object
is a table, but globally it should not be regarded as a table (Figure 6(c)). Similar phenomenon
also occurs in other situations, e.g. [16].
6 Conclusions and Future Work
We have presented a robust table detection system that is capable of extracting free style
tables from on-line handwritten documents. This is a nontrivial task in that the ruling lines
and layout of hand-drawn tables are often far more irregular and complex than those of
printed tables. Our methodology can also be extended and applied to other graphical objects,
such as flowcharts, organization charts, bar or pie graphs, and annotations, whose structure
can be defined without ambiguity. For example, when the primitive structure of a graphical
object is lines, rectangles, and circles (e.g. the diagram in Figure 6(c)), our system could
14
detect it with some changes in detecting the primitive structure and logical structure.
As there are many parameters and thresholds in our system, currently only a portion of
them have been manually tuned on our specially designed test pages which have a dense
population of tables/non-tables on each page to facilitate quick human examination of detec-
tion accuracy and speed. They are believed to have significant influence on the accuracy and
the speed. The rest are fixed to our estimated values. As long as the thresholds are not too
high, it is the final classifier that mainly determines the detection accuracy. We plan to apply
genetic algorithms to tune the thresholds and parameters in full scale, where the detection
speedwill also be considered in order to make our system practical. And we would also like
to try other kinds of classifiers other than the linear classifier in use, such as support vector
machines. Moreover, other kinds of tables should also be considered, such as unruled or
semi-ruled tables2 [2]. This problem has been tackled for printed tables [6, 8, 12], but is still
not completely solved. [9] also presents an algorithm to detect unruled on-line tables by as-
suming that the whitespace is sufficient for table isolation. However, for general handwritten
tables in handwritten documents, this problem is not trivial, because the space that isolates
the tables may not be salient and the space between columns or rows may not be uniform
since the estimation of the directions of columns and rows is usually inaccurate. And for
semi-ruled tables, the ruling lines may be hard to distinguish from underlines if noa priori
knowledge is available. [18] also points out that without integrating linguistic information,
some inherent ambiguity in the table structure cannot be resolved. Finally, the integration
of off-line or perceptual grouping [19] techniques is also valuable, e.g., for improving the
treatment of overtracing and faster spatial grouping and searching.
References
[1] G. Nagy, “Twenty Years of Document Image Analysis in PAMI,”IEEE Trans. Pattern Analysisand Machine Intelligence, Vol.22, no.1, pp.38-62, 2000.
[2] J.C. Handley, “Chapter 8: Document Recognition,”(E.R. Dougherty, editor) Electronic ImagingTechnology, IS&T/SPIE Optical Engineering Press, Bellingham, WA, pp.289-316, 1999.
2Our current system can also detect ruled tables with incomplete bounding boxes.
15
[3] D. Lopresti and G. Nagy, “A Tabular Survey of Automated Table Processing,”The 3rd Int’lWorkshop on Graphics Recognition, Recent Advances, pp.93-120, 1999.
[4] R. Zanibbi, D. Blostein, and J.R. Cordy, “A Survey of Table Recognition: Models, Observations,Transformations, and Inferences,”Int’l J. Document Analysis and Recognition, Vol.7, No. 1,pp.1-16, 2004.
[5] D. Lopresti and G. Nagy, “Automated Table Processing: an (Opinionated) Survey.”Proc. 3rdInt’l Workshop on Graphics Recognition, Jaipur, India, pp.109-134, 1999.
[6] J.H. Shamilian, H.S. Baird, and T.L. Wood, “A Retargetable Table Reader”,Proc. IEEE Int’lConf. on Document Analysis and Recognition, pp.158-163, 1997.
[7] E. Green and M. Krishnamoorthy, “Model-based Analysis of Printed Tables”,Proc. IEEE Int’lConf. on Document Analysis and Recognition, pp.214-217, 1995.
[8] T.G. Kieninger, “Table Structure Recognition Based on Robust Block Segmentation,”Proc. 5thSPIE Conf. on Document Recognition, pp.22-32, 1998.
[9] A.K. Jain, A. Namboodiri, J. Subrahmonia,“Structure in On-line Documents,”Proc. IEEE Int’lConf. on Document Analysis and Recognition, pp.844-848, 2001.
[10] A. Laurentini and P. Viada, “Identifying and Understanding Tabular Material in CompoundDocuments,”Proc. 11th Int’l Conf. Pattern Recognition, pp.405-409, Hague, Netherlands, 1992.
[11] J. Sklansky and V. Gonzalez, “Fast Polygonal Approximation of Digitized Curves,”PatternRecognition, Vol.12, pp.327-331, 1980.
[12] Y. Wang, I.T. Phillips, and R.M. Haralick,“Table Structure Understanding and Its PerformanceEvaluation,”Pattern Recognition, Vol.37, No.7, pp.1479-1497, 2004.
[13] L.B. Kara and T. F. Stahovich, “Hierarchical Parsing and Recognition of Hand-Sketched Dia-grams,”Proc. 17th ACM Symp. on User Interface Software and Technology, pp.13-22, 2004.
[14] C. Alvarado, “A Framework for Multi-Domain Sketch Recognition,” In AAAI Spring Sympo-sium on Sketch Understanding, AAAI Technical Report SS-02-08, pp.1-8, Stanford University,2002. AAAI Press.
[15] S.L. Taylor, R.Fritzson, and J.A. Pastor, “Extraction of Data from Preprinted Forms,”MachineVision and Applications, Vol. 5, pp.211-222, 1992.
[16] J.J. LaViola Jr. and R. C. Zeleznik, “MathPad2: A System for the Creation and Exploration ofMathematical Sketches,”ACM Trans. Computer Graphics, Vol.24, No.3, pp.432-440, 2004.
[17] J. Liang, “Document Structure Analysis and Performance Evaluation,”Ph.D thesis, Univ. ofWashington, Seattle, WA, 1999.
[18] M. Hurst, “Layout and Language: An Efficient Algorithm for Detecting Text Blocks Based onSpatial and Linguistic Evidence,”Proc. Document Recognition and Retrieval VIII (IS&T/SPIEElectronic Imaging), Vol. 4307, pp.56-67, San Jose, CA, 2001.
[19] E. Saund, “Finding Perceptually Closed Paths in Sketches and Drawings,”IEEE Trans. PatternAnaysis and Machine Intelligence, Vol.25, No.4, pp.475-491, 2003.
16