Table 1/Tableau 1 Respiratory Virus Detections/Isolations ...
9
Table 1/Tableau 1 Respiratory Virus Detections/Isolations for the week ending January 31, 2015 (Reporting Week 201504) Détection/isolement de virus des voies respiratoires pour la semaine se terminant le 31 janvier 2015 (Code hebdomadaire 201504) Reporting Laboratory Flu/Grippe Flu/Grippe Flu/GrippeFlu/Grippe Flu/Grippe Flu/Grippe R.S.V. R.S.V. PIV PIV 1 PIV 2 PIV 3 PIV 4 Other/Autre Adeno Adeno hMPV hMPV Rhino Rhino Coron Coron Laboratoire rapporteur Test A(H1N1)pdm09 AH1 Pos. AH3 Pos. A Pos.(all) B Pos. Test Pos. Test Pos. Pos. Pos. Pos. PIV Pos. Test Pos. Test Pos. Test Pos. Test Pos. Newfoundland./Terre-Neuve 142 0 0 0 40 0 142 11 142 0 0 0 0 0 142 1 142 0 142 4 Not Tested Prince Edward Island./ Île-du-Prince-Édouar 32 0 0 13 13 0 11 1 4 0 0 0 0 0 4 0 4 0 4 0 4 1 Nova Scotia/Nouvelle-Écosse 217 0 0 32 70 6 195 13 28 0 0 1 2 0 28 0 28 0 28 1 28 1 New Brunswick/Nouveau-Brunswick 349 0 0 41 149 9 63 4 56 0 0 1 0 0 73 0 0 0 57 1 0 0 Atlantic/Atlantique 740 0 0 86 272 15 411 29 230 0 0 2 2 0 247 1 174 0 231 6 32 2 Région Nord-Est 308 0 0 0 35 7 234 54 0 0 0 0 0 0 0 0 0 0 Not Available 0 0 Québec-Chaudière-Appalaches 521 0 0 0 68 8 243 54 81 0 0 6 0 0 88 10 73 0 Not Available 73 0 Centre-du-Québec 559 0 0 0 134 16 295 69 6 0 0 0 0 0 6 0 0 0 Not Available 0 0 Montréal-Laval 1399 0 0 0 168 27 1024 134 433 0 1 3 1 0 443 13 380 0 Not Available 372 23 Ouest du Québec 266 0 0 0 57 10 68 18 0 0 0 0 0 0 0 0 0 0 Not Available 0 0 Montérégie 152 0 0 0 15 5 42 6 0 0 0 0 0 0 0 0 0 0 Not Available 0 0 Province of/de Québec 3205 0 0 0 477 73 1906 335 520 0 1 9 1 0 537 23 453 0 Not Available 445 23 Ottawa P.H.L. 33 0 0 3 8 1 39 8 39 3 0 4 0 0 39 1 39 0 19 3 17 1 CHEO/HEE0 - Ottawa N/A N/A N/A N/A N/A N/A N/A N/A N/A N/A N/A N/A N/A N/A N/A N/A N/A N/A N/A N/A N/A N/A Kingston P.H.L. 95 0 0 2 31 0 79 5 79 0 0 1 0 0 79 1 79 0 26 1 13 0 Toronto Medical Laboratory 323 0 0 0 45 0 323 26 0 0 0 0 0 0 0 0 0 0 0 0 0 0 P.H.O.L. - Toronto 1385 2 0 431 570 6 1027 45 1027 3 2 9 2 0 1027 5 992 8 228 27 191 11 Sick Kids'Hospital - Toronto 152 0 0 0 12 0 152 25 152 0 0 3 0 0 152 5 152 1 24 6 24 2 Sunnybrook & Women's College HSC 87 0 0 19 25 0 87 5 87 1 0 0 0 0 87 1 87 0 87 5 87 8 Sault Ste. Marie P.H.L. 28 0 0 0 3 0 30 2 30 0 0 1 1 0 30 0 30 0 9 1 6 1 Timmins P.H.L. 45 0 0 4 24 0 28 2 28 0 0 2 0 0 28 0 19 0 11 1 1 0 St. Joseph's - London 156 0 0 0 38 0 156 24 156 1 0 0 1 0 156 3 156 1 156 5 156 9 London P.H.L. 277 0 0 21 71 4 233 30 233 0 0 2 2 0 233 2 229 3 44 5 36 8 Orillia P.H.L. 151 0 0 1 33 0 151 19 151 1 0 1 1 0 151 0 150 1 10 0 7 1 Thunder Bay P.H.L. 79 0 0 5 25 0 56 3 56 2 0 1 0 0 56 1 56 2 5 2 5 1 Sudbury P.H.L. 101 0 0 4 23 0 81 4 81 0 1 1 0 0 81 0 81 0 11 1 11 1 Hamilton P.H.L. 246 0 0 15 72 0 198 16 198 0 0 1 1 0 198 1 192 1 37 7 26 8 Peterborough P.H.L. 132 0 0 6 25 0 133 11 133 0 0 3 0 0 133 2 129 1 39 6 30 3 Province of/de l'Ontario 3290 2 0 511 1005 11 2773 225 2450 11 3 29 8 0 2450 22 2391 18 706 70 610 54 Manitoba 330 0 0 6 54 5 177 34 105 1 0 2 1 0 105 1 53 0 105 4 53 6 Regina 326 0 0 41 45 1 326 64 326 2 1 12 2 0 326 7 326 0 326 11 326 36 Saskatoon 99 0 0 0 17 2 99 23 30 1 0 0 0 0 30 0 30 0 30 2 30 4 Province of/de la Saskatchewan 425 0 0 41 62 3 425 87 356 3 1 12 2 0 356 7 356 0 356 13 356 40 Province of/de l'Alberta 780 0 0 40 52 32 780 141 780 17 0 0 0 0 780 5 780 2 780 51 780 33 Prairies 1535 0 0 87 168 40 1382 262 1241 21 1 14 3 0 1241 13 1189 2 1241 68 1189 79 British Columbia/Colombie-Britannique 777 3 0 252 314 13 777 85 118 1 0 4 5 0 118 1 118 0 118 1 118 13 CANADA 9547 5 0 936 2236 152 7249 936 4559 33 5 58 19 0 4593 60 4325 20 2296 145 2394 171 Also available at: http://www.phac-aspc.gc.ca/bid-bmi/dsd-dsm/rvdi-divr/index-eng.php Aussi disponible sur le site: http://www.phac-aspc.gc.ca/bid-bmi/dsd-dsm/rvdi-divr/index-fra.php Delays in the reporting of data may cause data to change retrospectively. Certains délais quant à la soumission des rapports peuvent affecter les données de façon rétrospective.
Transcript of Table 1/Tableau 1 Respiratory Virus Detections/Isolations ...
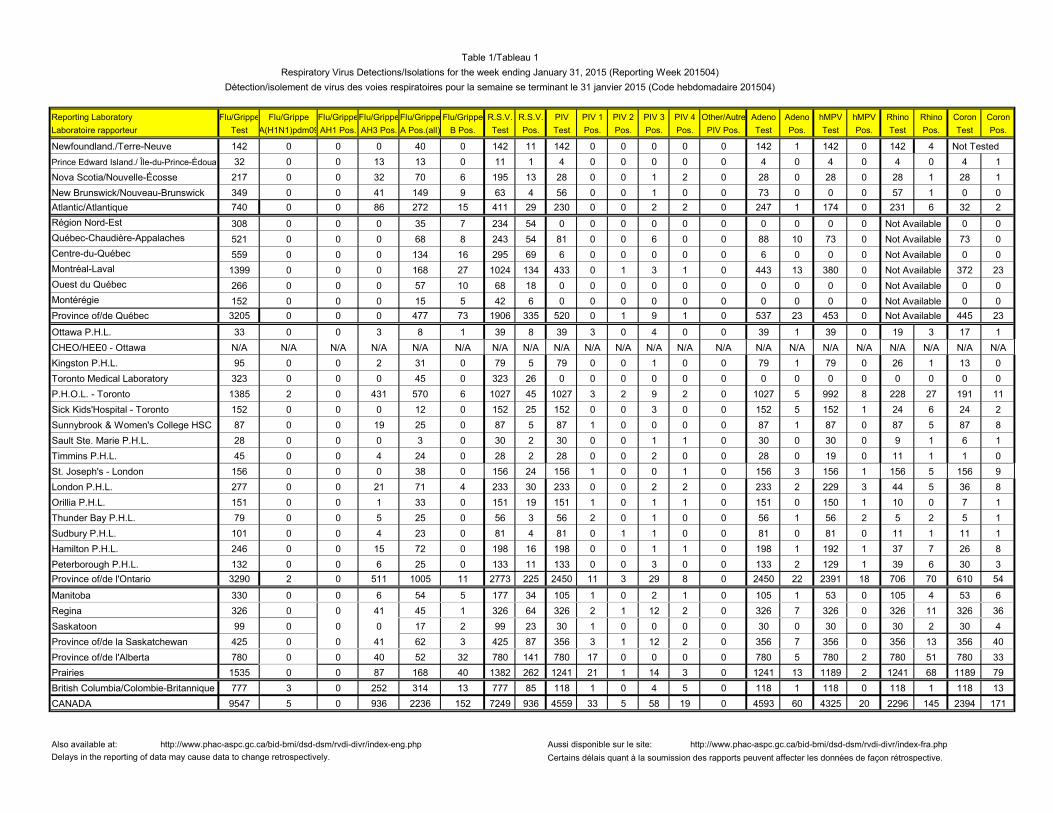
Table 1/Tableau 1
Respiratory Virus Detections/Isolations for the week ending January 31, 2015 (Reporting Week 201504)
Détection/isolement de virus des voies respiratoires pour la semaine se terminant le 31 janvier 2015 (Code hebdomadaire 201504)
Reporting Laboratory Flu/Grippe Flu/Grippe Flu/GrippeFlu/GrippeFlu/Grippe Flu/Grippe R.S.V. R.S.V. PIV PIV 1 PIV 2 PIV 3 PIV 4 Other/Autre Adeno Adeno hMPV hMPV Rhino Rhino Coron Coron
Laboratoire rapporteur Test A(H1N1)pdm09 AH1 Pos. AH3 Pos. A Pos.(all) B Pos. Test Pos. Test Pos. Pos. Pos. Pos. PIV Pos. Test Pos. Test Pos. Test Pos. Test Pos.
Newfoundland./Terre-Neuve 142 0 0 0 40 0 142 11 142 0 0 0 0 0 142 1 142 0 142 4 Not Tested
Prince Edward Island./ Île-du-Prince-Édouard 32 0 0 13 13 0 11 1 4 0 0 0 0 0 4 0 4 0 4 0 4 1
Nova Scotia/Nouvelle-Écosse 217 0 0 32 70 6 195 13 28 0 0 1 2 0 28 0 28 0 28 1 28 1
New Brunswick/Nouveau-Brunswick 349 0 0 41 149 9 63 4 56 0 0 1 0 0 73 0 0 0 57 1 0 0
Atlantic/Atlantique 740 0 0 86 272 15 411 29 230 0 0 2 2 0 247 1 174 0 231 6 32 2
Région Nord-Est 308 0 0 0 35 7 234 54 0 0 0 0 0 0 0 0 0 0 Not Available 0 0
Québec-Chaudière-Appalaches 521 0 0 0 68 8 243 54 81 0 0 6 0 0 88 10 73 0 Not Available 73 0
Centre-du-Québec 559 0 0 0 134 16 295 69 6 0 0 0 0 0 6 0 0 0 Not Available 0 0
Montréal-Laval 1399 0 0 0 168 27 1024 134 433 0 1 3 1 0 443 13 380 0 Not Available 372 23
Ouest du Québec 266 0 0 0 57 10 68 18 0 0 0 0 0 0 0 0 0 0 Not Available 0 0
Montérégie 152 0 0 0 15 5 42 6 0 0 0 0 0 0 0 0 0 0 Not Available 0 0
Province of/de Québec 3205 0 0 0 477 73 1906 335 520 0 1 9 1 0 537 23 453 0 Not Available 445 23
Ottawa P.H.L. 33 0 0 3 8 1 39 8 39 3 0 4 0 0 39 1 39 0 19 3 17 1
CHEO/HEE0 - Ottawa N/A N/A N/A N/A N/A N/A N/A N/A N/A N/A N/A N/A N/A N/A N/A N/A N/A N/A N/A N/A N/A N/A
Kingston P.H.L. 95 0 0 2 31 0 79 5 79 0 0 1 0 0 79 1 79 0 26 1 13 0
Toronto Medical Laboratory 323 0 0 0 45 0 323 26 0 0 0 0 0 0 0 0 0 0 0 0 0 0
P.H.O.L. - Toronto 1385 2 0 431 570 6 1027 45 1027 3 2 9 2 0 1027 5 992 8 228 27 191 11
Sick Kids'Hospital - Toronto 152 0 0 0 12 0 152 25 152 0 0 3 0 0 152 5 152 1 24 6 24 2
Sunnybrook & Women's College HSC 87 0 0 19 25 0 87 5 87 1 0 0 0 0 87 1 87 0 87 5 87 8
Sault Ste. Marie P.H.L. 28 0 0 0 3 0 30 2 30 0 0 1 1 0 30 0 30 0 9 1 6 1
Timmins P.H.L. 45 0 0 4 24 0 28 2 28 0 0 2 0 0 28 0 19 0 11 1 1 0
St. Joseph's - London 156 0 0 0 38 0 156 24 156 1 0 0 1 0 156 3 156 1 156 5 156 9
London P.H.L. 277 0 0 21 71 4 233 30 233 0 0 2 2 0 233 2 229 3 44 5 36 8
Orillia P.H.L. 151 0 0 1 33 0 151 19 151 1 0 1 1 0 151 0 150 1 10 0 7 1
Thunder Bay P.H.L. 79 0 0 5 25 0 56 3 56 2 0 1 0 0 56 1 56 2 5 2 5 1
Sudbury P.H.L. 101 0 0 4 23 0 81 4 81 0 1 1 0 0 81 0 81 0 11 1 11 1
Hamilton P.H.L. 246 0 0 15 72 0 198 16 198 0 0 1 1 0 198 1 192 1 37 7 26 8
Peterborough P.H.L. 132 0 0 6 25 0 133 11 133 0 0 3 0 0 133 2 129 1 39 6 30 3
Province of/de l'Ontario 3290 2 0 511 1005 11 2773 225 2450 11 3 29 8 0 2450 22 2391 18 706 70 610 54
Manitoba 330 0 0 6 54 5 177 34 105 1 0 2 1 0 105 1 53 0 105 4 53 6
Regina 326 0 0 41 45 1 326 64 326 2 1 12 2 0 326 7 326 0 326 11 326 36
Saskatoon 99 0 0 0 17 2 99 23 30 1 0 0 0 0 30 0 30 0 30 2 30 4
Province of/de la Saskatchewan 425 0 0 41 62 3 425 87 356 3 1 12 2 0 356 7 356 0 356 13 356 40
Province of/de l'Alberta 780 0 0 40 52 32 780 141 780 17 0 0 0 0 780 5 780 2 780 51 780 33
Prairies 1535 0 0 87 168 40 1382 262 1241 21 1 14 3 0 1241 13 1189 2 1241 68 1189 79
British Columbia/Colombie-Britannique 777 3 0 252 314 13 777 85 118 1 0 4 5 0 118 1 118 0 118 1 118 13
CANADA 9547 5 0 936 2236 152 7249 936 4559 33 5 58 19 0 4593 60 4325 20 2296 145 2394 171
Also available at: http://www.phac-aspc.gc.ca/bid-bmi/dsd-dsm/rvdi-divr/index-eng.php Aussi disponible sur le site: http://www.phac-aspc.gc.ca/bid-bmi/dsd-dsm/rvdi-divr/index-fra.php
Delays in the reporting of data may cause data to change retrospectively. Certains délais quant à la soumission des rapports peuvent affecter les données de façon rétrospective.
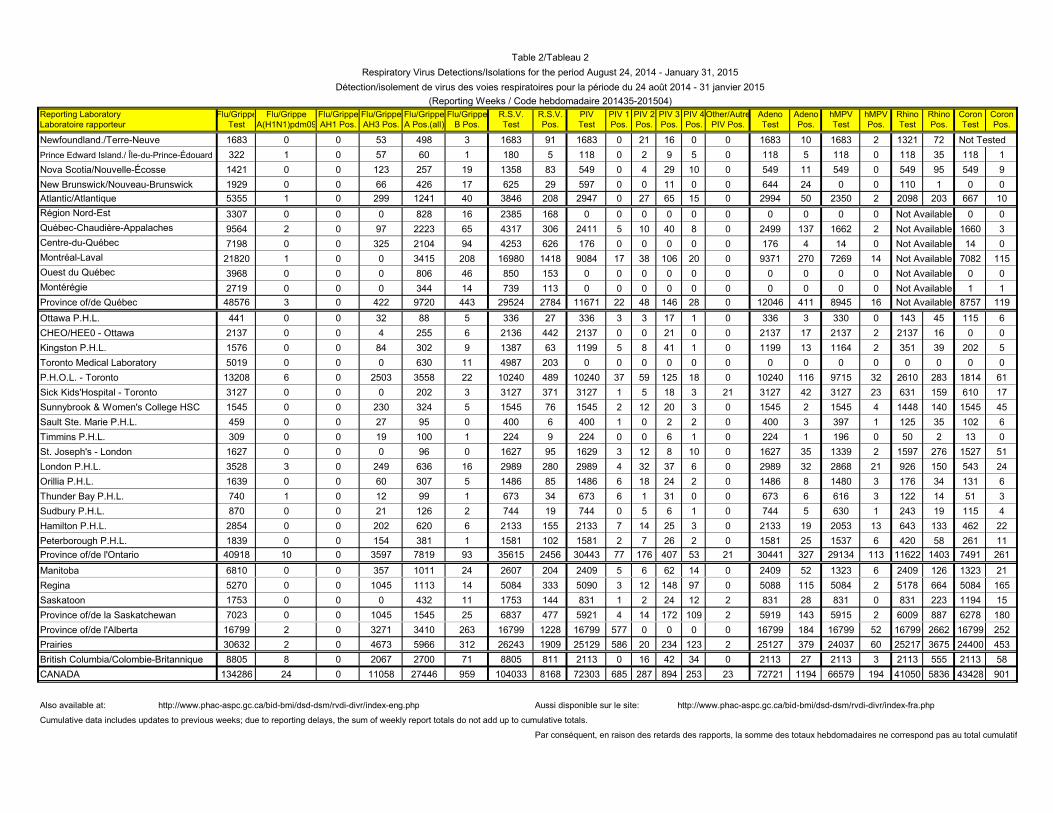
Table 2/Tableau 2
Respiratory Virus Detections/Isolations for the period August 24, 2014 - January 31, 2015
Détection/isolement de virus des voies respiratoires pour la période du 24 août 2014 - 31 janvier 2015
(Reporting Weeks / Code hebdomadaire 201435-201504)
Reporting Laboratory Flu/Grippe Flu/Grippe Flu/Grippe Flu/Grippe Flu/Grippe Flu/Grippe R.S.V. R.S.V. PIV PIV 1 PIV 2 PIV 3 PIV 4 Other/Autre Adeno Adeno hMPV hMPV Rhino Rhino Coron Coron
Laboratoire rapporteur Test A(H1N1)pdm09 AH1 Pos. AH3 Pos. A Pos.(all) B Pos. Test Pos. Test Pos. Pos. Pos. Pos. PIV Pos. Test Pos. Test Pos. Test Pos. Test Pos.
Newfoundland./Terre-Neuve 1683 0 0 53 498 3 1683 91 1683 0 21 16 0 0 1683 10 1683 2 1321 72 Not Tested
Prince Edward Island./ Île-du-Prince-Édouard 322 1 0 57 60 1 180 5 118 0 2 9 5 0 118 5 118 0 118 35 118 1
Nova Scotia/Nouvelle-Écosse 1421 0 0 123 257 19 1358 83 549 0 4 29 10 0 549 11 549 0 549 95 549 9
New Brunswick/Nouveau-Brunswick 1929 0 0 66 426 17 625 29 597 0 0 11 0 0 644 24 0 0 110 1 0 0
Atlantic/Atlantique 5355 1 0 299 1241 40 3846 208 2947 0 27 65 15 0 2994 50 2350 2 2098 203 667 10
Région Nord-Est 3307 0 0 0 828 16 2385 168 0 0 0 0 0 0 0 0 0 0 Not Available 0 0
Québec-Chaudière-Appalaches 9564 2 0 97 2223 65 4317 306 2411 5 10 40 8 0 2499 137 1662 2 Not Available 1660 3
Centre-du-Québec 7198 0 0 325 2104 94 4253 626 176 0 0 0 0 0 176 4 14 0 Not Available 14 0
Montréal-Laval 21820 1 0 0 3415 208 16980 1418 9084 17 38 106 20 0 9371 270 7269 14 Not Available 7082 115
Ouest du Québec 3968 0 0 0 806 46 850 153 0 0 0 0 0 0 0 0 0 0 Not Available 0 0
Montérégie 2719 0 0 0 344 14 739 113 0 0 0 0 0 0 0 0 0 0 Not Available 1 1
Province of/de Québec 48576 3 0 422 9720 443 29524 2784 11671 22 48 146 28 0 12046 411 8945 16 Not Available 8757 119
Ottawa P.H.L. 441 0 0 32 88 5 336 27 336 3 3 17 1 0 336 3 330 0 143 45 115 6
CHEO/HEE0 - Ottawa 2137 0 0 4 255 6 2136 442 2137 0 0 21 0 0 2137 17 2137 2 2137 16 0 0
Kingston P.H.L. 1576 0 0 84 302 9 1387 63 1199 5 8 41 1 0 1199 13 1164 2 351 39 202 5
Toronto Medical Laboratory 5019 0 0 0 630 11 4987 203 0 0 0 0 0 0 0 0 0 0 0 0 0 0
P.H.O.L. - Toronto 13208 6 0 2503 3558 22 10240 489 10240 37 59 125 18 0 10240 116 9715 32 2610 283 1814 61
Sick Kids'Hospital - Toronto 3127 0 0 0 202 3 3127 371 3127 1 5 18 3 21 3127 42 3127 23 631 159 610 17
Sunnybrook & Women's College HSC 1545 0 0 230 324 5 1545 76 1545 2 12 20 3 0 1545 2 1545 4 1448 140 1545 45
Sault Ste. Marie P.H.L. 459 0 0 27 95 0 400 6 400 1 0 2 2 0 400 3 397 1 125 35 102 6
Timmins P.H.L. 309 0 0 19 100 1 224 9 224 0 0 6 1 0 224 1 196 0 50 2 13 0
St. Joseph's - London 1627 0 0 0 96 0 1627 95 1629 3 12 8 10 0 1627 35 1339 2 1597 276 1527 51
London P.H.L. 3528 3 0 249 636 16 2989 280 2989 4 32 37 6 0 2989 32 2868 21 926 150 543 24
Orillia P.H.L. 1639 0 0 60 307 5 1486 85 1486 6 18 24 2 0 1486 8 1480 3 176 34 131 6
Thunder Bay P.H.L. 740 1 0 12 99 1 673 34 673 6 1 31 0 0 673 6 616 3 122 14 51 3
Sudbury P.H.L. 870 0 0 21 126 2 744 19 744 0 5 6 1 0 744 5 630 1 243 19 115 4
Hamilton P.H.L. 2854 0 0 202 620 6 2133 155 2133 7 14 25 3 0 2133 19 2053 13 643 133 462 22
Peterborough P.H.L. 1839 0 0 154 381 1 1581 102 1581 2 7 26 2 0 1581 25 1537 6 420 58 261 11
Province of/de l'Ontario 40918 10 0 3597 7819 93 35615 2456 30443 77 176 407 53 21 30441 327 29134 113 11622 1403 7491 261
Manitoba 6810 0 0 357 1011 24 2607 204 2409 5 6 62 14 0 2409 52 1323 6 2409 126 1323 21
Regina 5270 0 0 1045 1113 14 5084 333 5090 3 12 148 97 0 5088 115 5084 2 5178 664 5084 165
Saskatoon 1753 0 0 0 432 11 1753 144 831 1 2 24 12 2 831 28 831 0 831 223 1194 15
Province of/de la Saskatchewan 7023 0 0 1045 1545 25 6837 477 5921 4 14 172 109 2 5919 143 5915 2 6009 887 6278 180
Province of/de l'Alberta 16799 2 0 3271 3410 263 16799 1228 16799 577 0 0 0 0 16799 184 16799 52 16799 2662 16799 252
Prairies 30632 2 0 4673 5966 312 26243 1909 25129 586 20 234 123 2 25127 379 24037 60 25217 3675 24400 453
British Columbia/Colombie-Britannique 8805 8 0 2067 2700 71 8805 811 2113 0 16 42 34 0 2113 27 2113 3 2113 555 2113 58
CANADA 134286 24 0 11058 27446 959 104033 8168 72303 685 287 894 253 23 72721 1194 66579 194 41050 5836 43428 901
Also available at: http://www.phac-aspc.gc.ca/bid-bmi/dsd-dsm/rvdi-divr/index-eng.php Aussi disponible sur le site: http://www.phac-aspc.gc.ca/bid-bmi/dsd-dsm/rvdi-divr/index-fra.php
Cumulative data includes updates to previous weeks; due to reporting delays, the sum of weekly report totals do not add up to cumulative totals.
Par conséquent, en raison des retards des rapports, la somme des totaux hebdomadaires ne correspond pas au total cumulatif.
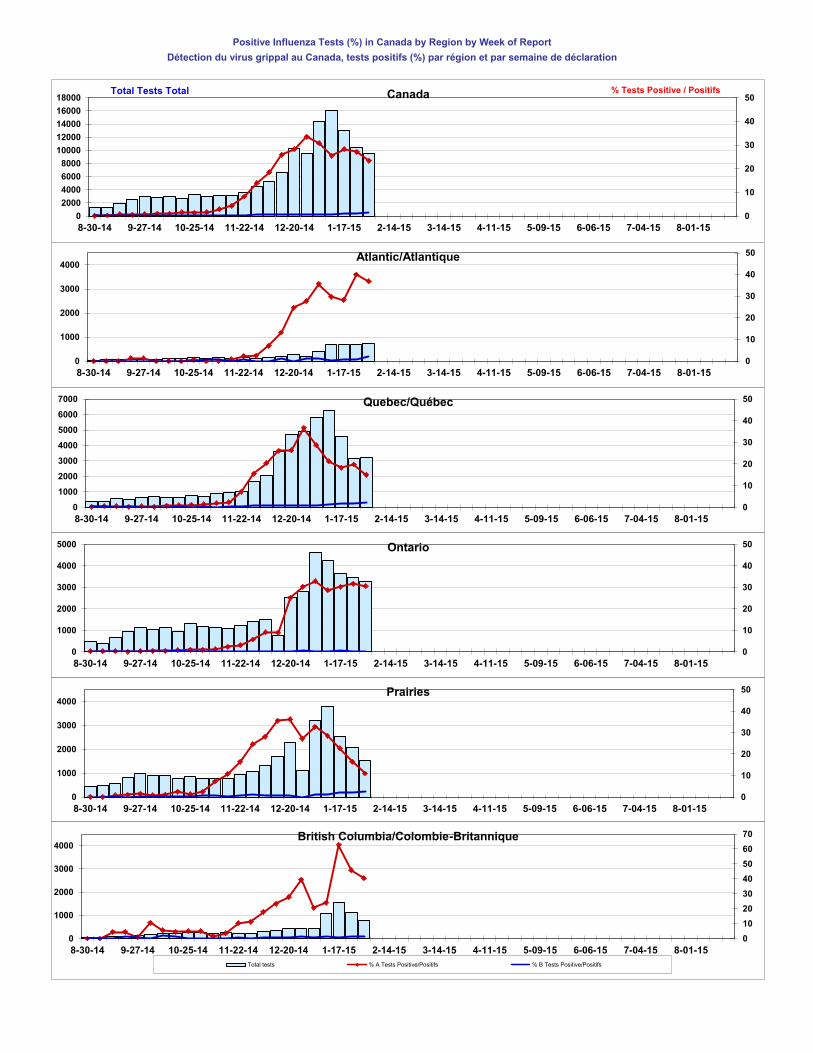
Positive Influenza Tests (%) in Canada by Region by Week of Report
Détection du virus grippal au Canada, tests positifs (%) par région et par semaine de déclaration
(Reporting Weeks / Code hebdomadaire 201135-201226)
44
45
46
47
48
49
50
51
52
53
1
2
3
4
5
6
7
8
9
10
11
12
13
14
15
16
17
18
19
20
21
22
% Tests Positive/Positifs
0
10
20
30
40
50
0
1000
2000
3000
4000
8-30-14 9-27-14 10-25-14 11-22-14 12-20-14 1-17-15 2-14-15 3-14-15 4-11-15 5-09-15 6-06-15 7-04-15 8-01-15
Prairies
0
10
20
30
40
50
0
2000
4000
6000
8000
10000
12000
14000
16000
18000
8-30-14 9-27-14 10-25-14 11-22-14 12-20-14 1-17-15 2-14-15 3-14-15 4-11-15 5-09-15 6-06-15 7-04-15 8-01-15
% Tests Positive / Positifs Total Tests Total Canada
0
10
20
30
40
50
0
1000
2000
3000
4000
8-30-14 9-27-14 10-25-14 11-22-14 12-20-14 1-17-15 2-14-15 3-14-15 4-11-15 5-09-15 6-06-15 7-04-15 8-01-15
Atlantic/Atlantique
0
10
20
30
40
50
0
1000
2000
3000
4000
5000
6000
7000
8-30-14 9-27-14 10-25-14 11-22-14 12-20-14 1-17-15 2-14-15 3-14-15 4-11-15 5-09-15 6-06-15 7-04-15 8-01-15
Quebec/Québec
0
10
20
30
40
50
0
1000
2000
3000
4000
5000
8-30-14 9-27-14 10-25-14 11-22-14 12-20-14 1-17-15 2-14-15 3-14-15 4-11-15 5-09-15 6-06-15 7-04-15 8-01-15
Ontario
0
10
20
30
40
50
60
70
0
1000
2000
3000
4000
8-30-14 9-27-14 10-25-14 11-22-14 12-20-14 1-17-15 2-14-15 3-14-15 4-11-15 5-09-15 6-06-15 7-04-15 8-01-15
British Columbia/Colombie-Britannique
Total tests % A Tests Positive/Positifs % B Tests Positive/Positifs
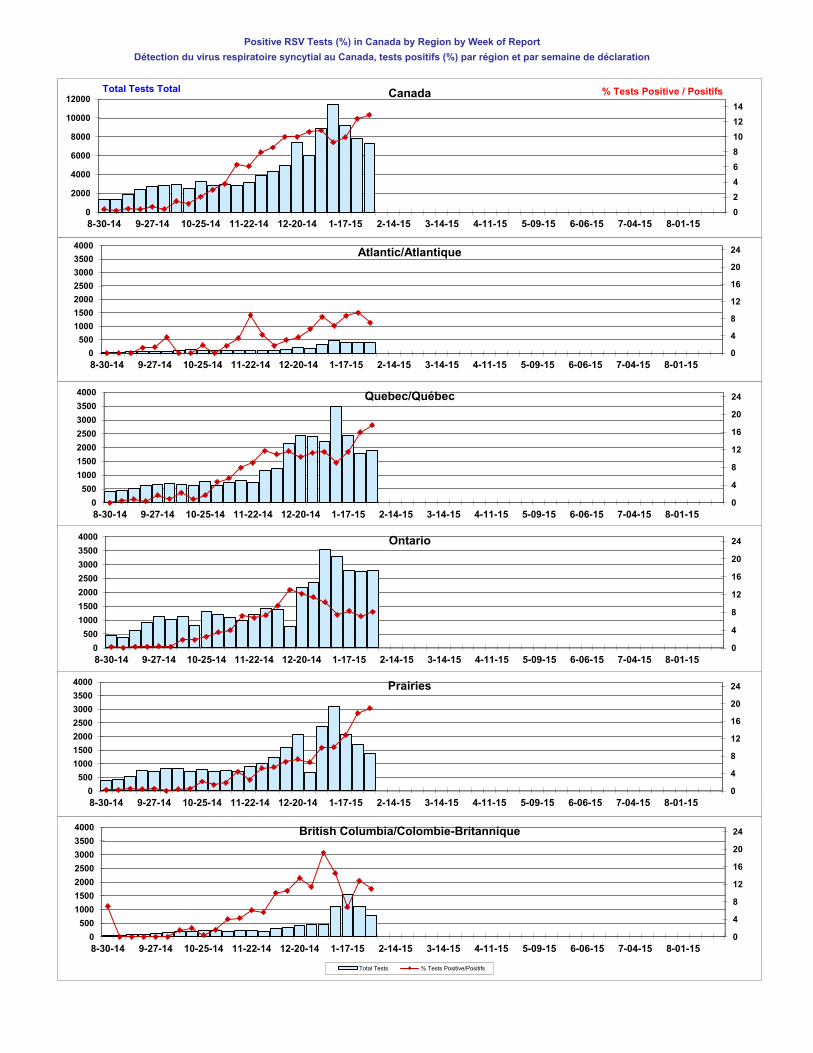
Positive RSV Tests (%) in Canada by Region by Week of Report
Détection du virus respiratoire syncytial au Canada, tests positifs (%) par région et par semaine de déclaration
(Reporting Weeks / Code hebdomadaire 201135-201226)
Not Avail.
Not Avail.
515
516
601
701
702
801
802
901
0
1
0
500
1000
1500
2000
1-01-00
% T
ests
Po
sit
ive /
P
osit
ifs
To
tal T
ests
To
tal
Canada
0
1
0
0.2
0.4
0.6
0.8
1
1-01-00
Atlantic/Atlantique
0
1
0
50
100
150
200
250
300
1-01-00
Quebec/Québec
0
1
0
0.2
0.4
0.6
0.8
1
1-01-00
Ontario
0
1
0
250
500
750
1000
1-01-00
Prairie
0
1
0
0.1
0.2
0.3
0.4
0.5
0.6
0.7
0.8
0.9
1
1-01-00
British Columbia/Colombie-Britannique
Series2 Series1
0
2
4
6
8
10
12
14
0
2000
4000
6000
8000
10000
12000
8-30-14 9-27-14 10-25-14 11-22-14 12-20-14 1-17-15 2-14-15 3-14-15 4-11-15 5-09-15 6-06-15 7-04-15 8-01-15
% Tests Positive / Positifs Total Tests Total Canada
0
4
8
12
16
20
24
0
500
1000
1500
2000
2500
3000
3500
4000
8-30-14 9-27-14 10-25-14 11-22-14 12-20-14 1-17-15 2-14-15 3-14-15 4-11-15 5-09-15 6-06-15 7-04-15 8-01-15
Atlantic/Atlantique
0
4
8
12
16
20
24
0
500
1000
1500
2000
2500
3000
3500
4000
8-30-14 9-27-14 10-25-14 11-22-14 12-20-14 1-17-15 2-14-15 3-14-15 4-11-15 5-09-15 6-06-15 7-04-15 8-01-15
Quebec/Québec
0
4
8
12
16
20
24
0
500
1000
1500
2000
2500
3000
3500
4000
8-30-14 9-27-14 10-25-14 11-22-14 12-20-14 1-17-15 2-14-15 3-14-15 4-11-15 5-09-15 6-06-15 7-04-15 8-01-15
Ontario
0
4
8
12
16
20
24
0
500
1000
1500
2000
2500
3000
3500
4000
8-30-14 9-27-14 10-25-14 11-22-14 12-20-14 1-17-15 2-14-15 3-14-15 4-11-15 5-09-15 6-06-15 7-04-15 8-01-15
Prairies
0
4
8
12
16
20
24
0
500
1000
1500
2000
2500
3000
3500
4000
8-30-14 9-27-14 10-25-14 11-22-14 12-20-14 1-17-15 2-14-15 3-14-15 4-11-15 5-09-15 6-06-15 7-04-15 8-01-15
British Columbia/Colombie-Britannique
Total Tests % Tests Positive/Positifs
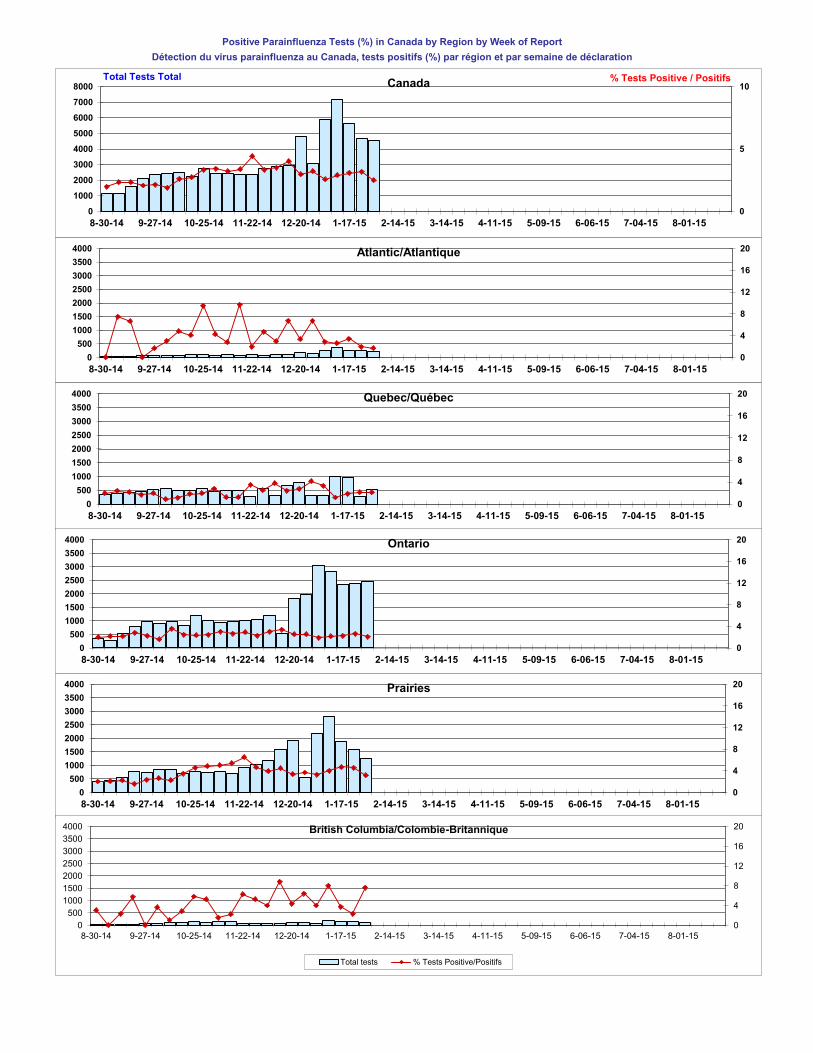
Positive Parainfluenza Tests (%) in Canada by Region by Week of Report
Détection du virus parainfluenza au Canada, tests positifs (%) par région et par semaine de déclaration
(Reporting Weeks / Code hebdomadaire 201135-201226)
44
45
46
47
48
49
50
51
52
53
1
2
3
4
5
6
7
8
9
10
11
12
13
14
15
16
17
18
1920
21
22
0123456789101112131415161718192021222324252627282930313233343536373839404142434445464748495051525354555657585960616263646566676869707172737475767778798081828384858687888990919293949596979899100101102103104105106107108109110111112113114115116117118119120121122123124125126127128129130131132133134135136137138139140141142143144145146147148149150151152153154155156157158159160161162163164165166167168169170171172173174175176177178179180181182183184185186187188189190191192193194195196197198199200201202203204205206207208209210211212213214215216217218219220221222223224225226227228229230231232233234235236237238239240241242243244245246247248249250251252253254255256257258259260261262263264265266267268269270271272273274275276277278279280281282283284285286287288289290291292293294295296297298299300301302303304305306307308309310311312313314315316317318319320321322323324325326327328329330331332333334335336337338339340341342343344345346347348349350351352353354355356357358359360361362363364365366367368369370371372373374375376377378379380381382383384385386387388389390391392393394395396397398399400401402403404405406407408409410411412413414415416417418419420421422423424
0
500
1000
1500
2000
1-01-00 1-02-00 1-03-00 1-04-00 1-02-00 1-03-00 1-00-00 1-00-00 1-00-00 1-00-00 1-00-00 1-00-00 1-00-00
% T
ests
Po
sit
ive /
P
osit
ifs
To
tal T
ests
To
tal
Canada
0
1
2
0
5
10
15
20
25
30
35
40
1-01-00 1-02-00 1-03-00 1-04-00 1-02-00 1-03-00 1-00-00 1-00-00 1-00-00 1-00-00 1-00-00 1-00-00 1-00-00
Atlantic/Atlantique
0
1
2
0
1-01-00 1-02-00 1-03-00 1-04-00 1-02-00 1-03-00 1-00-00 1-00-00 1-00-00 1-00-00 1-00-00 1-00-00 1-00-00
Quebec/Québec
0
1
2
0
0.2
0.4
0.6
0.8
1
1.2
1-01-00 1-02-00 1-03-00 1-04-00 1-02-00 1-03-00 1-00-00 1-00-00 1-00-00 1-00-00 1-00-00 1-00-00 1-00-00
Ontario
0
1
2
0
250
500
750
1000
1-01-00 1-02-00 1-03-00 1-04-00 1-02-00 1-03-00 1-00-00 1-00-00 1-00-00 1-00-00 1-00-00 1-00-00 1-00-00
Prairie
0
1
2
0
0.2
0.4
0.6
0.8
1
1.2
1-01-00 1-02-00 1-03-00 1-04-00 1-02-00 1-03-00 1-00-00 1-00-00 1-00-00 1-00-00 1-00-00 1-00-00 1-00-00
British Columbia/Colombie-Britannique
35
0
5
10
0
1000
2000
3000
4000
5000
6000
7000
8000
8-30-14 9-27-14 10-25-14 11-22-14 12-20-14 1-17-15 2-14-15 3-14-15 4-11-15 5-09-15 6-06-15 7-04-15 8-01-15
% Tests Positive / Positifs Total Tests Total Canada
0
4
8
12
16
20
0
500
1000
1500
2000
2500
3000
3500
4000
8-30-14 9-27-14 10-25-14 11-22-14 12-20-14 1-17-15 2-14-15 3-14-15 4-11-15 5-09-15 6-06-15 7-04-15 8-01-15
Atlantic/Atlantique
0
4
8
12
16
20
0
500
1000
1500
2000
2500
3000
3500
4000
8-30-14 9-27-14 10-25-14 11-22-14 12-20-14 1-17-15 2-14-15 3-14-15 4-11-15 5-09-15 6-06-15 7-04-15 8-01-15
Quebec/Québec
0
4
8
12
16
20
0
500
1000
1500
2000
2500
3000
3500
4000
8-30-14 9-27-14 10-25-14 11-22-14 12-20-14 1-17-15 2-14-15 3-14-15 4-11-15 5-09-15 6-06-15 7-04-15 8-01-15
Ontario
0
4
8
12
16
20
0
500
1000
1500
2000
2500
3000
3500
4000
8-30-14 9-27-14 10-25-14 11-22-14 12-20-14 1-17-15 2-14-15 3-14-15 4-11-15 5-09-15 6-06-15 7-04-15 8-01-15
Prairies
0
4
8
12
16
20
0
500
1000
1500
2000
2500
3000
3500
4000
8-30-14 9-27-14 10-25-14 11-22-14 12-20-14 1-17-15 2-14-15 3-14-15 4-11-15 5-09-15 6-06-15 7-04-15 8-01-15
British Columbia/Colombie-Britannique
Total tests % Tests Positive/Positifs
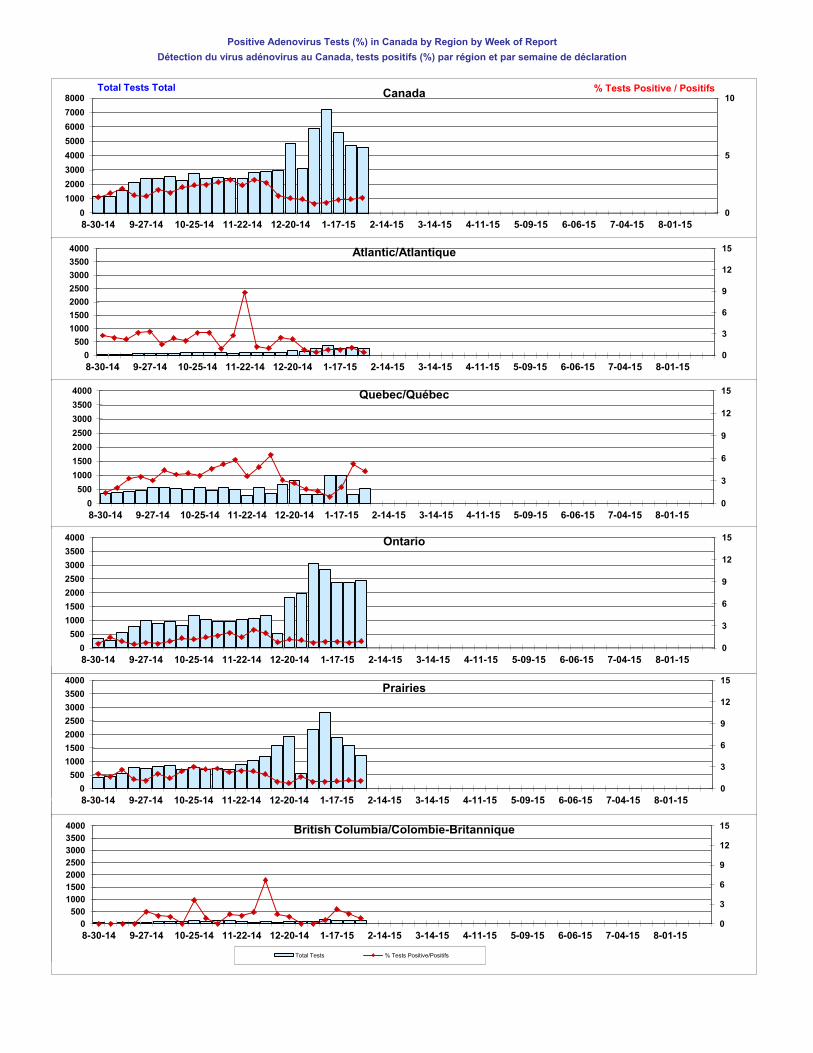
Positive Adenovirus Tests (%) in Canada by Region by Week of Report
Détection du virus adénovirus au Canada, tests positifs (%) par région et par semaine de déclaration
(Reporting Weeks / Code hebdomadaire 201135-201226)
Not Avail.
Not Avail.
515
516
601
701
702
801
802
901
01
0500100015002000
1-01-00
% T
ests
Po
sit
ive /
P
osit
ifs
To
tal T
ests
To
tal
Canada
0
1
0
0.2
0.4
0.6
0.8
1
1-01-00
Atlantic/Atlantique
0
1
0
50
100
150
200
250
300
1-01-00
Quebec/Québec
0
1
0
0.2
0.4
0.6
0.8
1
1-01-00
Ontario
0
1
0
250
500
750
1000
1-01-00
Prairie
0
1
0
0.1
0.2
0.3
0.4
0.5
0.6
0.7
0.8
0.9
1
1-01-00
British Columbia/Colombie-Britannique
Series2 Series1
0
5
10
0
1000
2000
3000
4000
5000
6000
7000
8000
8-30-14 9-27-14 10-25-14 11-22-14 12-20-14 1-17-15 2-14-15 3-14-15 4-11-15 5-09-15 6-06-15 7-04-15 8-01-15
% Tests Positive / Positifs Total Tests Total Canada
0
3
6
9
12
15
0
500
1000
1500
2000
2500
3000
3500
4000
8-30-14 9-27-14 10-25-14 11-22-14 12-20-14 1-17-15 2-14-15 3-14-15 4-11-15 5-09-15 6-06-15 7-04-15 8-01-15
Atlantic/Atlantique
0
3
6
9
12
15
0
500
1000
1500
2000
2500
3000
3500
4000
8-30-14 9-27-14 10-25-14 11-22-14 12-20-14 1-17-15 2-14-15 3-14-15 4-11-15 5-09-15 6-06-15 7-04-15 8-01-15
Quebec/Québec
0
3
6
9
12
15
0
500
1000
1500
2000
2500
3000
3500
4000
8-30-14 9-27-14 10-25-14 11-22-14 12-20-14 1-17-15 2-14-15 3-14-15 4-11-15 5-09-15 6-06-15 7-04-15 8-01-15
Ontario
0
3
6
9
12
15
0
500
1000
1500
2000
2500
3000
3500
4000
8-30-14 9-27-14 10-25-14 11-22-14 12-20-14 1-17-15 2-14-15 3-14-15 4-11-15 5-09-15 6-06-15 7-04-15 8-01-15
Prairies
0
3
6
9
12
15
0
500
1000
1500
2000
2500
3000
3500
4000
8-30-14 9-27-14 10-25-14 11-22-14 12-20-14 1-17-15 2-14-15 3-14-15 4-11-15 5-09-15 6-06-15 7-04-15 8-01-15
British Columbia/Colombie-Britannique
Total Tests % Tests Positive/Positifs
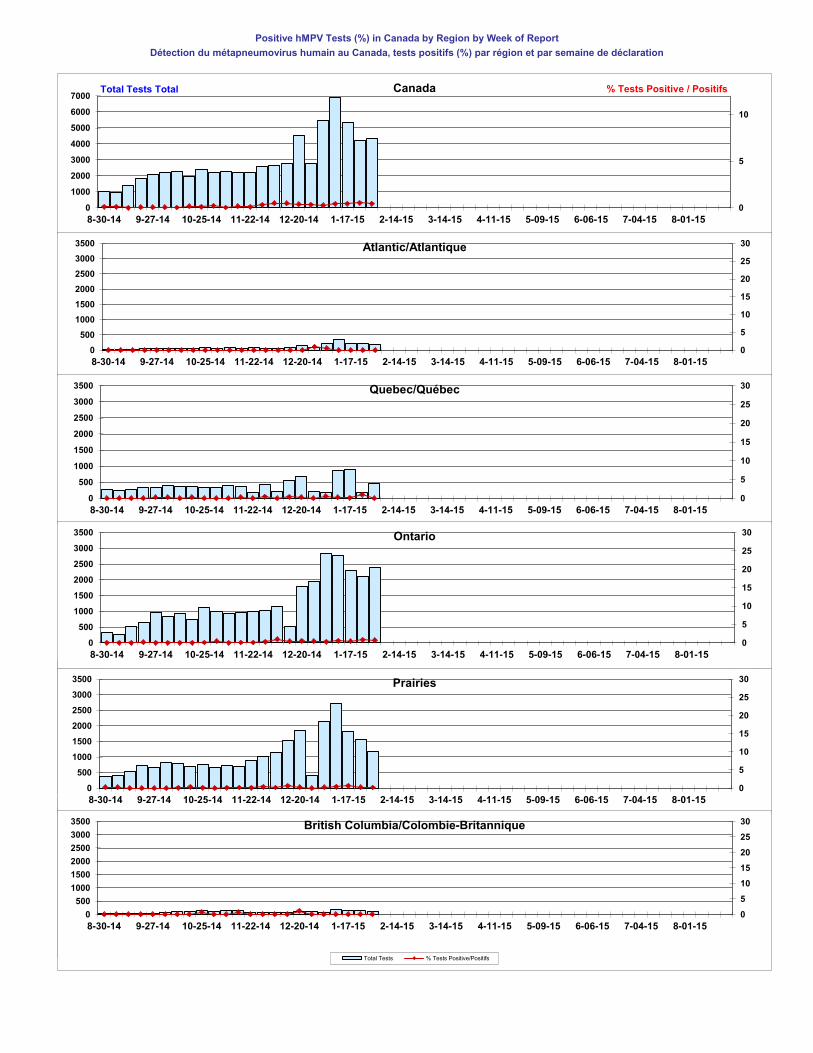
Positive hMPV Tests (%) in Canada by Region by Week of Report
Détection du métapneumovirus humain au Canada, tests positifs (%) par région et par semaine de déclaration
(Reporting Weeks / Code hebdomadaire 201135-201226)
Not Avail.
Not Avail.
515
516
601
701
702
801
802
901
0
1
0
500
1000
1500
2000
1-01-00
% T
ests
Po
sit
ive /
P
osit
ifs
To
tal T
ests
To
tal
Canada
0
1
0
0.2
0.4
0.6
0.8
1
1-01-00
Atlantic/Atlantique
0
1
0
50
100
150
200
250
300
1-01-00
Quebec/Québec
0
1
0
0.2
0.4
0.6
0.8
1
1-01-00
Ontario
0
1
0
250
500
750
1000
1-01-00
Prairie
0
1
0
0.1
0.2
0.3
0.4
0.5
0.6
0.7
0.8
0.9
1
1-01-00
British Columbia/Colombie-Britannique
Series2 Series1
0
5
10
0
1000
2000
3000
4000
5000
6000
7000
8-30-14 9-27-14 10-25-14 11-22-14 12-20-14 1-17-15 2-14-15 3-14-15 4-11-15 5-09-15 6-06-15 7-04-15 8-01-15
% Tests Positive / Positifs Total Tests Total Canada
0
5
10
15
20
25
30
0
500
1000
1500
2000
2500
3000
3500
8-30-14 9-27-14 10-25-14 11-22-14 12-20-14 1-17-15 2-14-15 3-14-15 4-11-15 5-09-15 6-06-15 7-04-15 8-01-15
Atlantic/Atlantique
0
5
10
15
20
25
30
0
500
1000
1500
2000
2500
3000
3500
8-30-14 9-27-14 10-25-14 11-22-14 12-20-14 1-17-15 2-14-15 3-14-15 4-11-15 5-09-15 6-06-15 7-04-15 8-01-15
Quebec/Québec
0
5
10
15
20
25
30
0
500
1000
1500
2000
2500
3000
3500
8-30-14 9-27-14 10-25-14 11-22-14 12-20-14 1-17-15 2-14-15 3-14-15 4-11-15 5-09-15 6-06-15 7-04-15 8-01-15
Ontario
0
5
10
15
20
25
30
0
500
1000
1500
2000
2500
3000
3500
8-30-14 9-27-14 10-25-14 11-22-14 12-20-14 1-17-15 2-14-15 3-14-15 4-11-15 5-09-15 6-06-15 7-04-15 8-01-15
Prairies
0
5
10
15
20
25
30
0
500
1000
1500
2000
2500
3000
3500
8-30-14 9-27-14 10-25-14 11-22-14 12-20-14 1-17-15 2-14-15 3-14-15 4-11-15 5-09-15 6-06-15 7-04-15 8-01-15
British Columbia/Colombie-Britannique
Total Tests % Tests Positive/Positifs
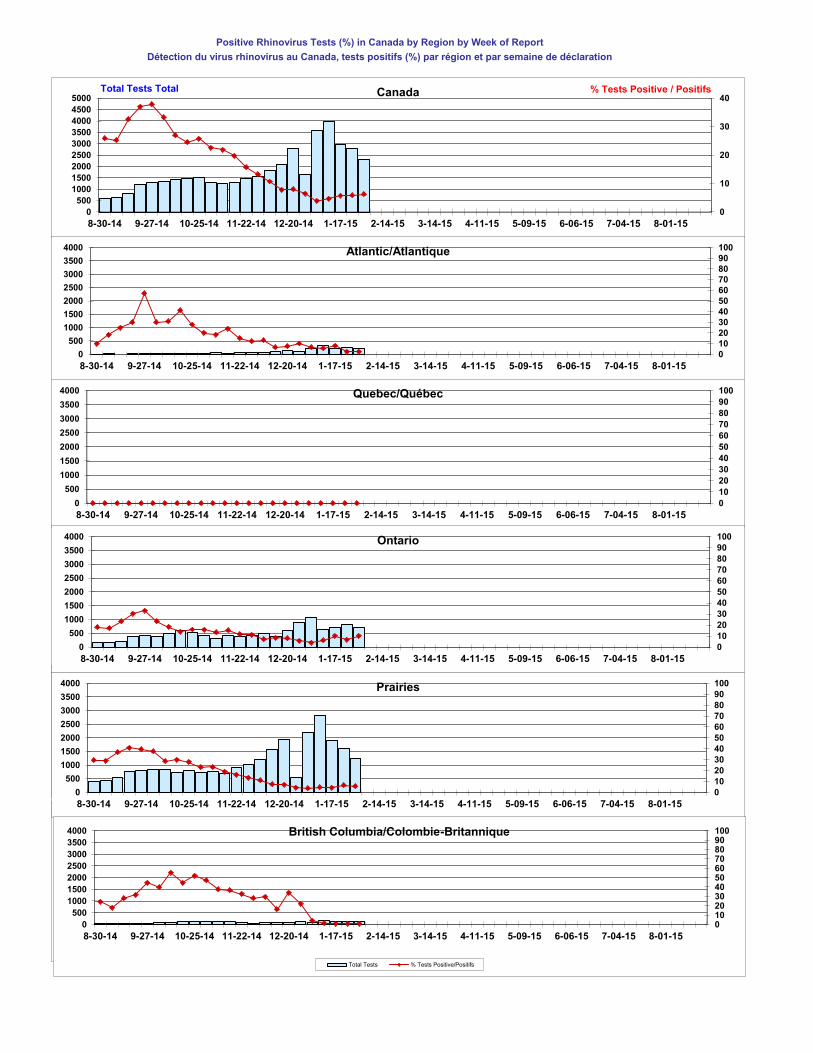
Positive Rhinovirus Tests (%) in Canada by Region by Week of Report
Détection du virus rhinovirus au Canada, tests positifs (%) par région et par semaine de déclaration
(Reporting Weeks / Code hebdomadaire 201135-201226)
44
45
46
47
48
49
50
51
52
53
1
2
3
4
5
6
7
8
9
10
11
12
13
14
15
16
17
18
19
20
21
22
01
0500100015002000
1-01-00
% T
ests
Po
sit
ive /
P
osit
ifs
To
tal T
ests
To
tal
Canada
0
1
0
0.2
0.4
0.6
0.8
1
1-01-00
Atlantic/Atlantique
0
1
0
50
100
150
200
250
300
1-01-00
Quebec/Québec
0
1
0
0.2
0.4
0.6
0.8
1
1-01-00
Ontario
0
1
0
250
500
750
1000
1-01-00
Prairie
0
1
0
0.1
0.2
0.3
0.4
0.5
0.6
0.7
0.8
0.9
1
1-01-00
British Columbia/Colombie-Britannique
Series2 Series1
0
10
20
30
40
0
500
1000
1500
2000
2500
3000
3500
4000
4500
5000
8-30-14 9-27-14 10-25-14 11-22-14 12-20-14 1-17-15 2-14-15 3-14-15 4-11-15 5-09-15 6-06-15 7-04-15 8-01-15
% Tests Positive / Positifs Total Tests Total Canada
0
10
20
30
40
50
60
70
80
90
100
0
500
1000
1500
2000
2500
3000
3500
4000
8-30-14 9-27-14 10-25-14 11-22-14 12-20-14 1-17-15 2-14-15 3-14-15 4-11-15 5-09-15 6-06-15 7-04-15 8-01-15
Atlantic/Atlantique
0
10
20
30
40
50
60
70
80
90
100
0
500
1000
1500
2000
2500
3000
3500
4000
8-30-14 9-27-14 10-25-14 11-22-14 12-20-14 1-17-15 2-14-15 3-14-15 4-11-15 5-09-15 6-06-15 7-04-15 8-01-15
Quebec/Québec
0
10
20
30
40
50
60
70
80
90
100
0
500
1000
1500
2000
2500
3000
3500
4000
8-30-14 9-27-14 10-25-14 11-22-14 12-20-14 1-17-15 2-14-15 3-14-15 4-11-15 5-09-15 6-06-15 7-04-15 8-01-15
Ontario
0
10
20
30
40
50
60
70
80
90
100
0
500
1000
1500
2000
2500
3000
3500
4000
8-30-14 9-27-14 10-25-14 11-22-14 12-20-14 1-17-15 2-14-15 3-14-15 4-11-15 5-09-15 6-06-15 7-04-15 8-01-15
Prairies
0102030405060708090100
0
500
1000
1500
2000
2500
3000
3500
4000
8-30-14 9-27-14 10-25-14 11-22-14 12-20-14 1-17-15 2-14-15 3-14-15 4-11-15 5-09-15 6-06-15 7-04-15 8-01-15
British Columbia/Colombie-Britannique
Total Tests % Tests Positive/Positifs
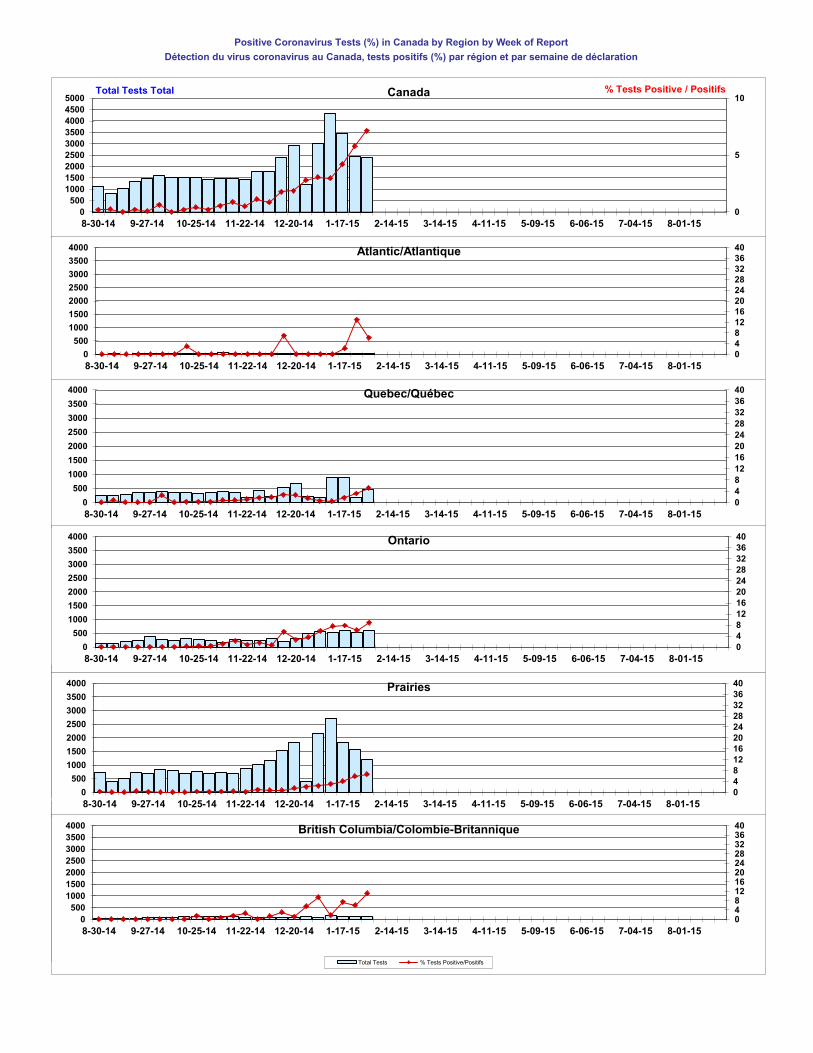
Positive Coronavirus Tests (%) in Canada by Region by Week of Report
Détection du virus coronavirus au Canada, tests positifs (%) par région et par semaine de déclaration
(Reporting Weeks / Code hebdomadaire 201135-201226)
44
45
46
47
48
49
50
51
52
53
1
2
3
4
5
6
7
8
9
10
11
12
13
14
15
16
17
18
19
20
21
22
0
1
0
500
1000
1500
2000
1-01-00
% T
ests
Po
sit
ive /
P
osit
ifs
To
tal T
ests
To
tal
Canada
0
1
0
0.2
0.4
0.6
0.8
1
1-01-00
Atlantic/Atlantique
0
1
0
50
100
150
200
250
300
1-01-00
Quebec/Québec
0
1
0
0.2
0.4
0.6
0.8
1
1-01-00
Ontario
0
1
0
250
500
750
1000
1-01-00
Prairie
0
1
0
0.1
0.2
0.3
0.4
0.5
0.6
0.7
0.8
0.9
1
1-01-00
British Columbia/Colombie-Britannique
Series2 Series1
0
5
10
0
500
1000
1500
2000
2500
3000
3500
4000
4500
5000
8-30-14 9-27-14 10-25-14 11-22-14 12-20-14 1-17-15 2-14-15 3-14-15 4-11-15 5-09-15 6-06-15 7-04-15 8-01-15
% Tests Positive / Positifs Total Tests Total Canada
0
4
8
12
16
20
24
28
32
36
40
0
500
1000
1500
2000
2500
3000
3500
4000
8-30-14 9-27-14 10-25-14 11-22-14 12-20-14 1-17-15 2-14-15 3-14-15 4-11-15 5-09-15 6-06-15 7-04-15 8-01-15
Atlantic/Atlantique
0
4
8
12
16
20
24
28
32
36
40
0
500
1000
1500
2000
2500
3000
3500
4000
8-30-14 9-27-14 10-25-14 11-22-14 12-20-14 1-17-15 2-14-15 3-14-15 4-11-15 5-09-15 6-06-15 7-04-15 8-01-15
Quebec/Québec
0
4
8
12
16
20
24
28
32
36
40
0
500
1000
1500
2000
2500
3000
3500
4000
8-30-14 9-27-14 10-25-14 11-22-14 12-20-14 1-17-15 2-14-15 3-14-15 4-11-15 5-09-15 6-06-15 7-04-15 8-01-15
Ontario
0
4
8
12
16
20
24
28
32
36
40
0
500
1000
1500
2000
2500
3000
3500
4000
8-30-14 9-27-14 10-25-14 11-22-14 12-20-14 1-17-15 2-14-15 3-14-15 4-11-15 5-09-15 6-06-15 7-04-15 8-01-15
Prairies
0481216202428323640
0
500
1000
1500
2000
2500
3000
3500
4000
8-30-14 9-27-14 10-25-14 11-22-14 12-20-14 1-17-15 2-14-15 3-14-15 4-11-15 5-09-15 6-06-15 7-04-15 8-01-15
British Columbia/Colombie-Britannique
Total Tests % Tests Positive/Positifs