TABLE 11: CCIL SETTLEMENT DETAILS e · 2004. 2003. e` s TABLE 11: CCIL SETTLEMENT DETAILS er...
77
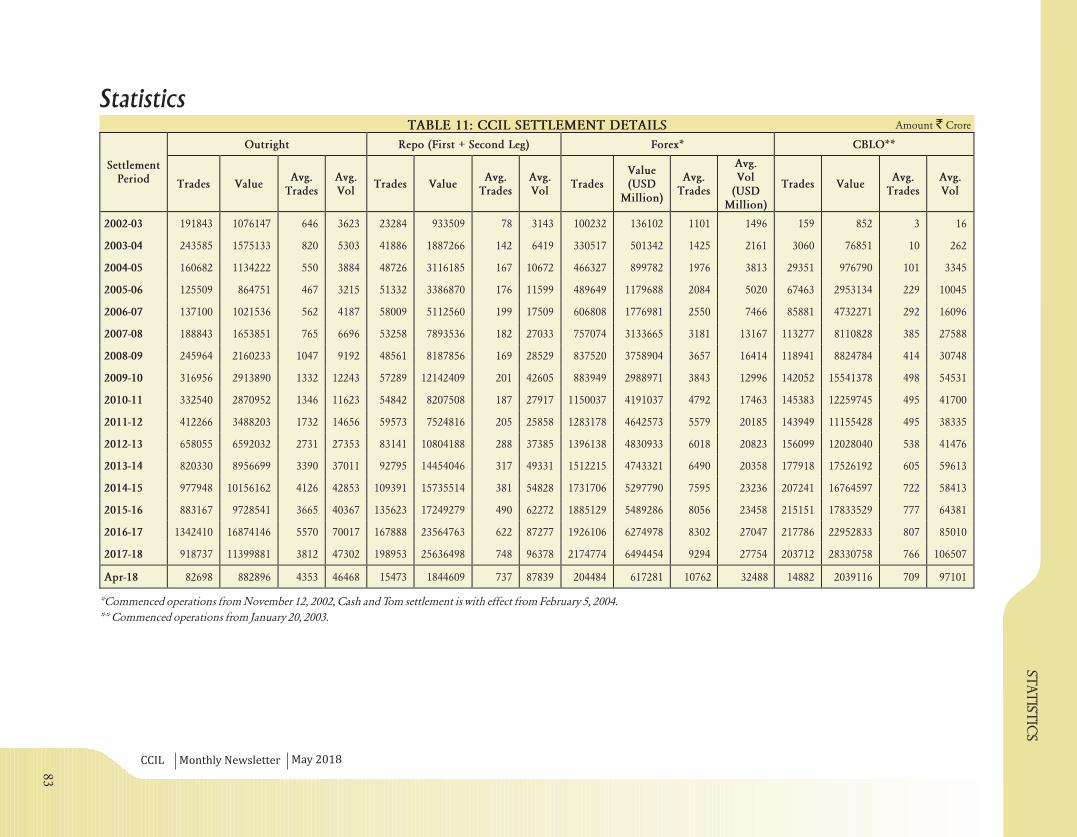
*Commenced operations from November 12, 2002, Cash and Tom settlement is with effect from February 5, 2004. ** Commenced operations from January 20, 2003. Amount Crore ` Statistics TABLE 11: CCIL SETTLEMENT DETAILS CCIL Monthly Newsletter statistics May 2018 Outright Repo (First + Second Leg) Forex* CBLO** Settlement Period Trades Value Avg. Trades Avg. Vol Trades Value Avg. Trades Avg. Vol Trades Value (USD Million) Avg. Trades Avg. Vol (USD Million) Trades Value Avg. Trades Avg. Vol 2002 -03 191843 1076 147 646 3623 23284 933509 78 3143 100232 136102 1101 1496 159 852 3 16 2003 -04 243585 1575133 820 5303 41886 1887266 142 6419 330517 501342 1425 2161 3060 76851 10 262 2004 -05 160682 1134222 550 3884 48726 3116185 167 10672 466327 899782 1976 3813 29351 976790 101 3345 2005 -06 125509 864751 467 3215 51332 3386870 176 11599 489649 1179688 2084 5020 67463 2953134 229 10045 2006 -07 137100 1021536 562 4187 58009 5112560 199 17509 6068 08 1776981 2550 7466 85881 4732271 292 16096 2007 -08 188843 1653851 765 6696 53258 7893536 182 27033 757074 3133665 3181 13167 113277 8110828 385 27588 2008 -09 245964 2160233 1047 9192 48561 8187856 169 28529 837520 3758 904 3657 16414 118941 8824784 414 30748 2009 -10 316956 2913890 1332 12243 57289 12142409 201 42605 883949 2988971 3843 12996 142052 15541378 498 54531 2010 -11 332540 2870952 1346 11623 54842 8207508 187 27917 1150037 41910 37 4792 17463 145383 12259745 495 41700 2011 -12 412266 3488203 1732 14656 59573 7524816 205 25858 1283178 4642573 5579 20185 143949 11155428 495 38335 2012 -13 658055 6592032 2731 27353 83141 10804188 288 37385 1396138 4830 933 6018 20823 156099 12028040 538 41476 2013 -14 820330 8956699 3390 37011 92795 14454046 317 49331 1512215 4743321 6490 20358 177918 17526192 605 59613 2014 -15 977948 10156162 4126 42853 109391 15735514 381 54828 1731706 5297790 7595 23236 207241 16764597 722 58413 2015 -16 883167 9728541 3665 40367 135623 17249279 490 62272 1885129 5489286 8056 23458 215151 17833529 777 64381 2016 -17 1342410 16874146 5570 70017 167888 23564763 622 87277 1926106 6274978 8302 27047 217786 22952833 807 85010 2017 -18 918737 11399881 3812 47302 198953 25636498 748 96378 2174774 6494454 9294 27754 203712 28330758 766 106507 Apr-18 82698 882896 4353 46468 15473 1844609 737 87839 204484 617281 10762 32488 14882 2039116 709 97101 83
-
Upload
truongduong -
Category
Documents
-
view
215 -
download
0
Transcript of TABLE 11: CCIL SETTLEMENT DETAILS e · 2004. 2003. e` s TABLE 11: CCIL SETTLEMENT DETAILS er...
*Commenced operations from November 12, 2002, Cash and Tom settlement is with effect from February 5, 2004.
** Commenced operations from January 20, 2003.
Amount Crore`
StatisticsTABLE 11: CCIL SETTLEMENT DETAILS
CCIL Monthly Newsletter
statis
tic
s
May 2018
Outright Repo (First + Second Leg) Forex* CBLO**
SettlementPeriod Trades Value
Avg.Trades
Avg.Vol
Trades ValueAvg.
TradesAvg.Vol
TradesValue(USD
Million)
Avg.Trades
Avg.Vol
(USDMillion)
Trades ValueAvg.
TradesAvg.Vol
2002-03 191843 1076147 646 3623 23284 933509 78 3143 100232 136102 1101 1496 159 852 3 16
2003-04 243585 1575133 820 5303 41886 1887266 142 6419 330517 501342 1425 2161 3060 76851 10 262
2004-05 160682 1134222 550 3884 48726 3116185 167 10672 466327 899782 1976 3813 29351 976790 101 3345
2005-06 125509 864751 467 3215 51332 3386870 176 11599 489649 1179688 2084 5020 67463 2953134 229 10045
2006-07 137100 1021536 562 4187 58009 5112560 199 17509 606808 1776981 2550 7466 85881 4732271 292 16096
2007-08 188843 1653851 765 6696 53258 7893536 182 27033 757074 3133665 3181 13167 113277 8110828 385 27588
2008-09 245964 2160233 1047 9192 48561 8187856 169 28529 837520 3758904 3657 16414 118941 8824784 414 30748
2009-10 316956 2913890 1332 12243 57289 12142409 201 42605 883949 2988971 3843 12996 142052 15541378 498 54531
2010-11 332540 2870952 1346 11623 54842 8207508 187 27917 1150037 4191037 4792 17463 145383 12259745 495 41700
2011-12 412266 3488203 1732 14656 59573 7524816 205 25858 1283178 4642573 5579 20185 143949 11155428 495 38335
2012-13 658055 6592032 2731 27353 83141 10804188 288 37385 1396138 4830933 6018 20823 156099 12028040 538 41476
2013-14 820330 8956699 3390 37011 92795 14454046 317 49331 1512215 4743321 6490 20358 177918 17526192 605 59613
2014-15 977948 10156162 4126 42853 109391 15735514 381 54828 1731706 5297790 7595 23236 207241 16764597 722 58413
2015-16 883167 9728541 3665 40367 135623 17249279 490 62272 1885129 5489286 8056 23458 215151 17833529 777 64381
2016-17 1342410 16874146 5570 70017 167888 23564763 622 87277 1926106 6274978 8302 27047 217786 22952833 807 85010
2017-18 918737 11399881 3812 47302 198953 25636498 748 96378 2174774 6494454 9294 27754 203712 28330758 766 106507
Apr-18 82698 882896 4353 46468 15473 1844609 737 87839 204484 617281 10762 32488 14882 2039116 709 97101
83

CC
ILM
on
thly
Ne
wsl
ett
er
TABLE 12: CATEGORYWISE BUYING ACTIVITY Percent
* Call, Notice and Term Money segment.** Includes Small Finance and Payment Banks
TABLE 13: CATEGORYWISE SELLING ACTIVITY
* Call, Notice and Term Money segment.** Includes Small Finance and Payment Banks
Ma
y 2
01
8
Outright
ReverseRepo
(FundsLending)
CBLOLending
UncollateralisedMoney Market
Lending*Forex
IRS-MIBOR
IRS-MIFOR
Co-operative Banks 3.89 0.26 1.26 35.57** 0.18 - -
Financial Institutions 0.32 0.19 0.18 - 0.00 - -
Foreign Banks 26.15 23.95 3.73 6.33 41.59 55.68 64.79
Insurance Companies 2.85 5.53 16.11 - - - -
Mutual Funds 8.65 23.85 63.26 - - - -
Others 5.19 0.01 6.51 - - - -
Primary Dealers 14.03 2.55 0.01 0.02 - 21.52 0.00
Private Sector Banks 24.20 23.41 1.68 21.78 27.64 18.64 35.21
Public Sector Banks 14.72 20.24 7.27 36.29 30.59 4.16 0.00
Category
Outright RepoCBLO
Borrowing
UncollateralisedMoney Market
Borrowing*Forex
IRS-MIBOR
IRS-MIFOR
Co-operative Banks 3.52 2.53 2.04 1.81** 0.17 - -
Financial Institutions 0.18 0.38 12.25 - 0.00 - -
Foreign Banks 25.99 22.93 5.66 14.82 41.80 54.63 54.45
Insurance Companies 2.20 0.00 0.52 - - - -
Mutual Funds 8.48 0.13 15.82 - - - -
Others 2.83 5.58 6.48 - - - -
Primary Dealers 16.26 29.53 6.93 28.64 - 23.63 0.00
Private Sector Banks 24.56 17.47 12.06 32.43 27.63 17.23 45.55
Public Sector Banks 15.99 21.46 38.23 22.30 30.39 4.51 0.00
Category
84
statistics
CCIL Monthly Newsletter
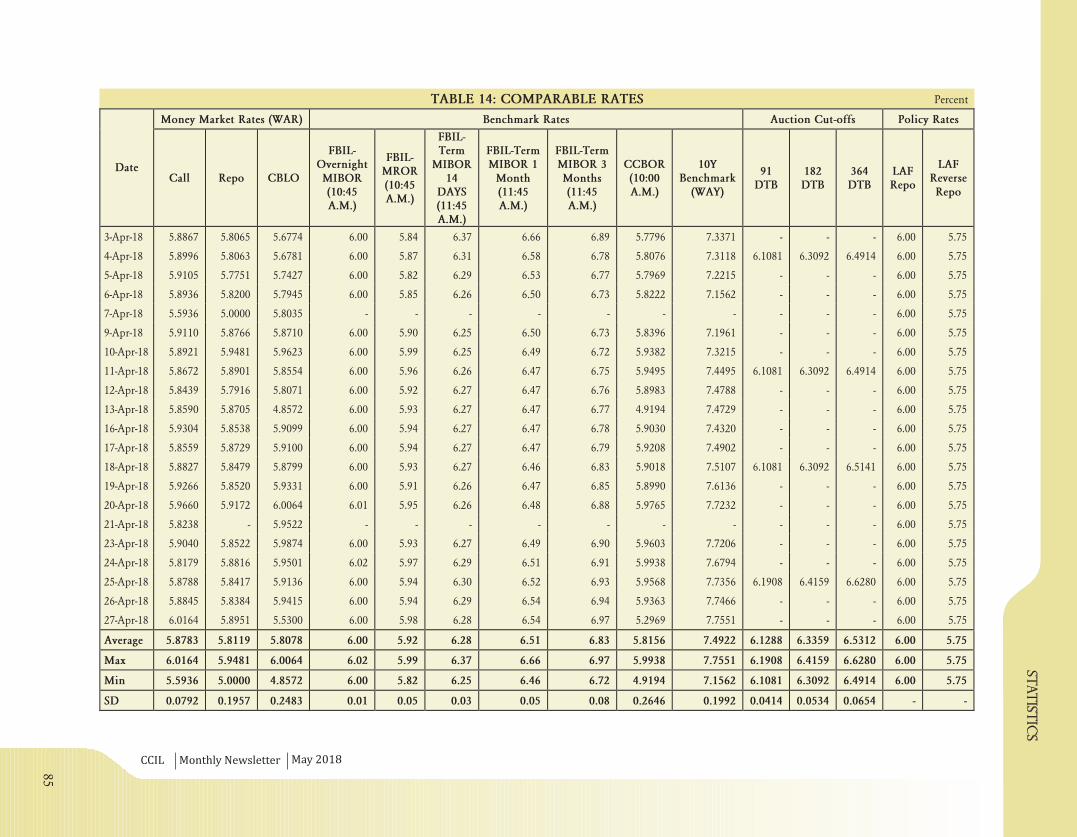
TABLE 14: COMPARABLE RATES Percent
statis
tic
s
May 2018
Money Market Rates (WAR) Benchmark Rates Auction Cut-offs Policy Rates
DateCall Repo CBLO
FBIL-OvernightMIBOR(10:45A.M.)
FBIL-MROR(10:45A.M.)
FBIL-Term
MIBOR14
DAYS(11:45A.M.)
FBIL-TermMIBOR 1
Month(11:45A.M.)
FBIL-TermMIBOR 3Months(11:45A.M.)
CCBOR(10:00A.M.)
10YBenchmark
(WAY)
91DTB
182DTB
364DTB
LAFRepo
LAFReverseRepo
3-Apr-18 5.8867 5.8065 5.6774 6.00 5.84 6.37 6.66 6.89 5.7796 7.3371 - - - 6.00 5.75
4-Apr-18 5.8996 5.8063 5.6781 6.00 5.87 6.31 6.58 6.78 5.8076 7.3118 6.1081 6.3092 6.4914 6.00 5.75
5-Apr-18 5.9105 5.7751 5.7427 6.00 5.82 6.29 6.53 6.77 5.7969 7.2215 - - - 6.00 5.75
6-Apr-18 5.8936 5.8200 5.7945 6.00 5.85 6.26 6.50 6.73 5.8222 7.1562 - - - 6.00 5.75
7-Apr-18 5.5936 5.0000 5.8035 - - - - - - - - - - 6.00 5.75
9-Apr-18 5.9110 5.8766 5.8710 6.00 5.90 6.25 6.50 6.73 5.8396 7.1961 - - - 6.00 5.75
10-Apr-18 5.8921 5.9481 5.9623 6.00 5.99 6.25 6.49 6.72 5.9382 7.3215 - - - 6.00 5.75
11-Apr-18 5.8672 5.8901 5.8554 6.00 5.96 6.26 6.47 6.75 5.9495 7.4495 6.1081 6.3092 6.4914 6.00 5.75
12-Apr-18 5.8439 5.7916 5.8071 6.00 5.92 6.27 6.47 6.76 5.8983 7.4788 - - - 6.00 5.75
13-Apr-18 5.8590 5.8705 4.8572 6.00 5.93 6.27 6.47 6.77 4.9194 7.4729 - - - 6.00 5.75
16-Apr-18 5.9304 5.8538 5.9099 6.00 5.94 6.27 6.47 6.78 5.9030 7.4320 - - - 6.00 5.75
17-Apr-18 5.8559 5.8729 5.9100 6.00 5.94 6.27 6.47 6.79 5.9208 7.4902 - - - 6.00 5.75
18-Apr-18 5.8827 5.8479 5.8799 6.00 5.93 6.27 6.46 6.83 5.9018 7.5107 6.1081 6.3092 6.5141 6.00 5.75
19-Apr-18 5.9266 5.8520 5.9331 6.00 5.91 6.26 6.47 6.85 5.8990 7.6136 - - - 6.00 5.75
20-Apr-18 5.9660 5.9172 6.0064 6.01 5.95 6.26 6.48 6.88 5.9765 7.7232 - - - 6.00 5.75
21-Apr-18 5.8238 - 5.9522 - - - - - - - - - - 6.00 5.75
23-Apr-18 5.9040 5.8522 5.9874 6.00 5.93 6.27 6.49 6.90 5.9603 7.7206 - - - 6.00 5.75
24-Apr-18 5.8179 5.8816 5.9501 6.02 5.97 6.29 6.51 6.91 5.9938 7.6794 - - - 6.00 5.75
25-Apr-18 5.8788 5.8417 5.9136 6.00 5.94 6.30 6.52 6.93 5.9568 7.7356 6.1908 6.4159 6.6280 6.00 5.75
26-Apr-18 5.8845 5.8384 5.9415 6.00 5.94 6.29 6.54 6.94 5.9363 7.7466 - - - 6.00 5.75
27-Apr-18 6.0164 5.8951 5.5300 6.00 5.98 6.28 6.54 6.97 5.2969 7.7551 - - - 6.00 5.75
Average 5.8783 5.8119 5.8078 6.00 5.92 6.28 6.51 6.83 5.8156 7.4922 6.1288 6.3359 6.5312 6.00 5.75
Max 6.0164 5.9481 6.0064 6.02 5.99 6.37 6.66 6.97 5.9938 7.7551 6.1908 6.4159 6.6280 6.00 5.75
Min 5.5936 5.0000 4.8572 6.00 5.82 6.25 6.46 6.72 4.9194 7.1562 6.1081 6.3092 6.4914 6.00 5.75
SD 0.0792 0.1957 0.2483 0.01 0.05 0.03 0.05 0.08 0.2646 0.1992 0.0414 0.0534 0.0654 - -
85
CC
ILM
on
thly
Ne
wsl
ett
er
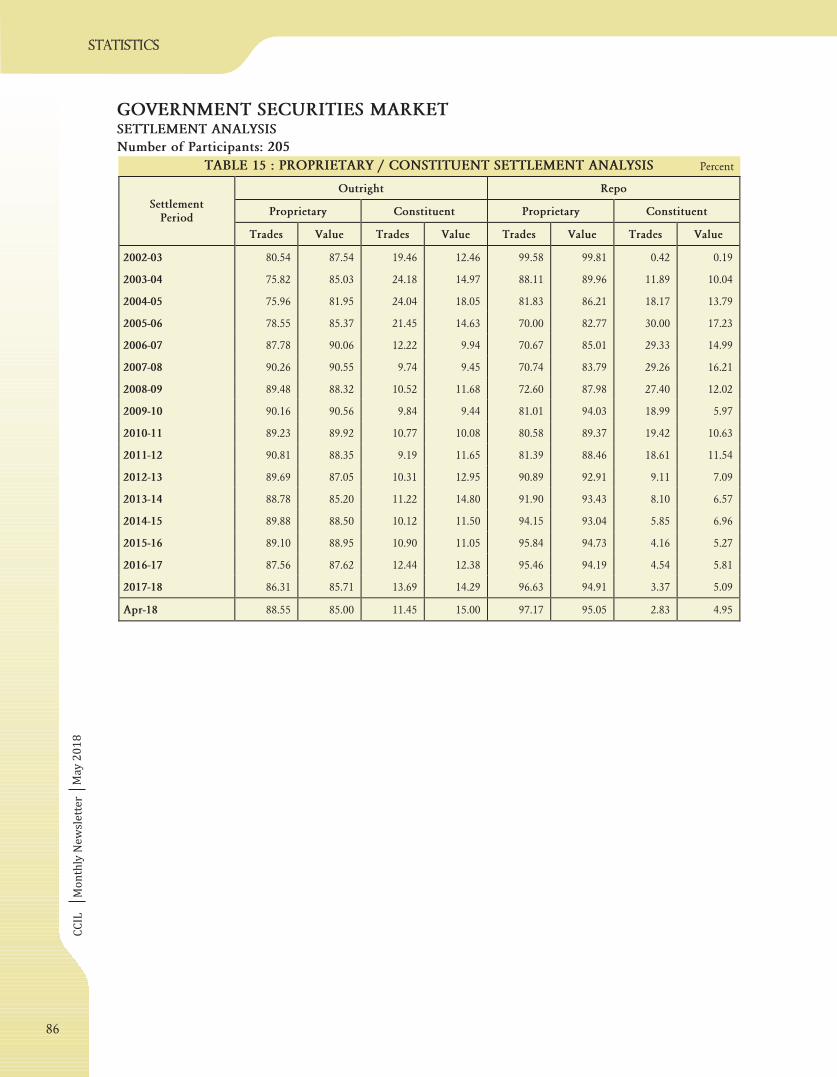
TABLE 15 : PROPRIETARY / CONSTITUENT SETTLEMENT ANALYSIS
GOVERNMENT SECURITIES MARKETSETTLEMENT ANALYSIS
Number of Participants: 205
Percent
statistics
Ma
y 2
01
8
Outright Repo
Proprietary Constituent Proprietary ConstituentSettlement
Period
Trades Value Trades Value Trades Value Trades Value
2002-03 80.54 87.54 19.46 12.46 99.58 99.81 0.42 0.19
2003-04 75.82 85.03 24.18 14.97 88.11 89.96 11.89 10.04
2004-05 75.96 81.95 24.04 18.05 81.83 86.21 18.17 13.79
2005-06 78.55 85.37 21.45 14.63 70.00 82.77 30.00 17.23
2006-07 87.78 90.06 12.22 9.94 70.67 85.01 29.33 14.99
2007-08 90.26 90.55 9.74 9.45 70.74 83.79 29.26 16.21
2008-09 89.48 88.32 10.52 11.68 72.60 87.98 27.40 12.02
2009-10 90.16 90.56 9.84 9.44 81.01 94.03 18.99 5.97
2010-11 89.23 89.92 10.77 10.08 80.58 89.37 19.42 10.63
2011-12 90.81 88.35 9.19 11.65 81.39 88.46 18.61 11.54
2012-13 89.69 87.05 10.31 12.95 90.89 92.91 9.11 7.09
2013-14 88.78 85.20 11.22 14.80 91.90 93.43 8.10 6.57
2014-15 89.88 88.50 10.12 11.50 94.15 93.04 5.85 6.96
2015-16 89.10 88.95 10.90 11.05 95.84 94.73 4.16 5.27
2016-17 87.56 87.62 12.44 12.38 95.46 94.19 4.54 5.81
2017-18 86.31 85.71 13.69 14.29 96.63 94.91 3.37 5.09
Apr-18 88.55 85.00 11.45 15.00 97.17 95.05 2.83 4.95
86
CC
ILM
on
thly
Ne
wsl
ett
er
statistics
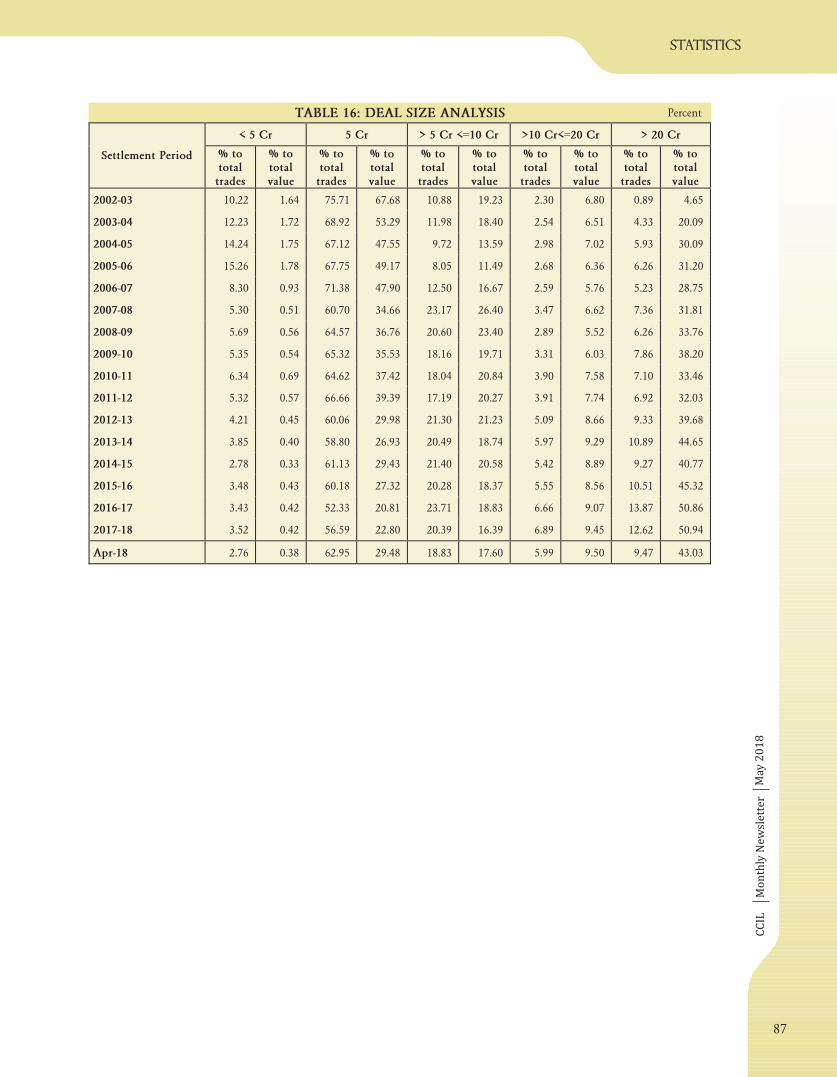
TABLE 16: DEAL SIZE ANALYSIS Percent
Ma
y 2
01
8
< 5 Cr 5 Cr > 5 Cr <=10 Cr >10 Cr<=20 Cr > 20 Cr
Settlement Period % tototaltrades
% tototalvalue
% tototaltrades
% tototalvalue
% tototaltrades
% tototalvalue
% tototaltrades
% tototalvalue
% tototaltrades
% tototalvalue
2002-03 10.22 1.64 75.71 67.68 10.88 19.23 2.30 6.80 0.89 4.65
2003-04 12.23 1.72 68.92 53.29 11.98 18.40 2.54 6.51 4.33 20.09
2004-05 14.24 1.75 67.12 47.55 9.72 13.59 2.98 7.02 5.93 30.09
2005-06 15.26 1.78 67.75 49.17 8.05 11.49 2.68 6.36 6.26 31.20
2006-07 8.30 0.93 71.38 47.90 12.50 16.67 2.59 5.76 5.23 28.75
2007-08 5.30 0.51 60.70 34.66 23.17 26.40 3.47 6.62 7.36 31.81
2008-09 5.69 0.56 64.57 36.76 20.60 23.40 2.89 5.52 6.26 33.76
2009-10 5.35 0.54 65.32 35.53 18.16 19.71 3.31 6.03 7.86 38.20
2010-11 6.34 0.69 64.62 37.42 18.04 20.84 3.90 7.58 7.10 33.46
2011-12 5.32 0.57 66.66 39.39 17.19 20.27 3.91 7.74 6.92 32.03
2012-13 4.21 0.45 60.06 29.98 21.30 21.23 5.09 8.66 9.33 39.68
2013-14 3.85 0.40 58.80 26.93 20.49 18.74 5.97 9.29 10.89 44.65
2014-15 2.78 0.33 61.13 29.43 21.40 20.58 5.42 8.89 9.27 40.77
2015-16 3.48 0.43 60.18 27.32 20.28 18.37 5.55 8.56 10.51 45.32
2016-17 3.43 0.42 52.33 20.81 23.71 18.83 6.66 9.07 13.87 50.86
2017-18 3.52 0.42 56.59 22.80 20.39 16.39 6.89 9.45 12.62 50.94
Apr-18 2.76 0.38 62.95 29.48 18.83 17.60 5.99 9.50 9.47 43.03
87
CC
ILM
on
thly
Ne
wsl
ett
er
statistics
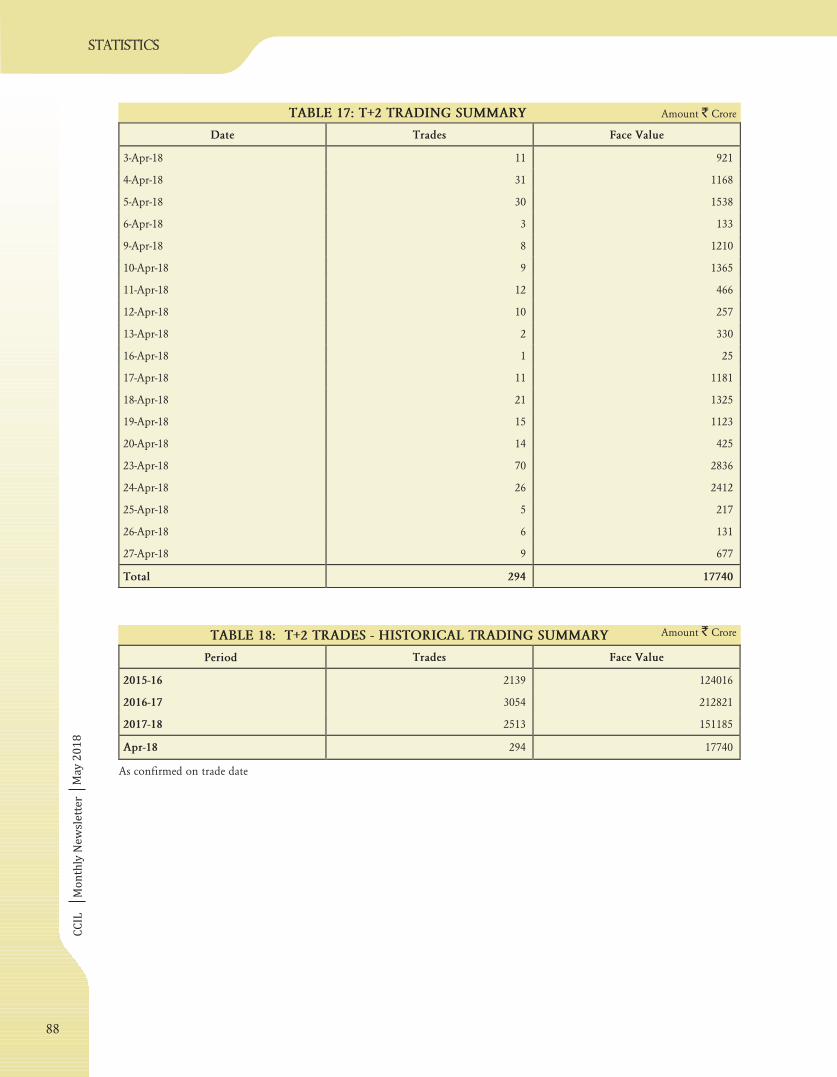
TABLE 18: T+2 TRADES - HISTORICAL TRADING SUMMARY Amount Crore`
TABLE 17: T+2 TRADING SUMMARY Amount Crore`
As confirmed on trade date
Ma
y 2
01
8
Date Trades Face Value
3-Apr-18 11 921
4-Apr-18 31 1168
5-Apr-18 30 1538
6-Apr-18 3 133
9-Apr-18 8 1210
10-Apr-18 9 1365
11-Apr-18 12 466
12-Apr-18 10 257
13-Apr-18 2 330
16-Apr-18 1 25
17-Apr-18 11 1181
18-Apr-18 21 1325
19-Apr-18 15 1123
20-Apr-18 14 425
23-Apr-18 70 2836
24-Apr-18 26 2412
25-Apr-18 5 217
26-Apr-18 6 131
27-Apr-18 9 677
Total 294 17740
Period Trades Face Value
2015-16 2139 124016
2016-17 3054 212821
2017-18 2513 151185
Apr-18 294 17740
88

CC
ILM
on
thly
Ne
wsl
ett
er
statistics
TABLE 19: INSTRUMENT WISE BREAKUP OF OUTRIGHT TRADES Amount Crore`
Ma
y 2
01
8
Cen. Govt. Dated Securities Treasury Bills State Development LoansSettlement
Period ValueAvg.Value
% Share ValueAvg.Value
% Share ValueAvg.Value
% Share
2002-03 1032185 3475 95.91 37443 126 3.48 6519 22 0.61
2003-04 1458665 4911 92.61 102299 344 6.49 14169 48 0.90
2004-05 862820 2955 76.07 246703 845 21.75 24700 85 2.18
2005-06 657213 2443 76.00 189839 706 21.95 17700 66 2.05
2006-07 883248 4723 86.46 126956 679 12.43 11332 61 1.11
2007-08 1467704 5942 88.74 171914 696 10.39 14234 58 0.86
2008-09 1955412 8321 90.52 170436 725 7.89 34385 146 1.59
2009-10 2480850 10424 85.14 363283 1526 12.47 69757 293 2.39
2010-11 2552181 10333 88.90 275095 1114 9.58 43677 177 1.52
2011-12 3099108 13021 88.85 345237 1451 9.90 43859 184 1.26
2012-13 5920929 24568 89.82 552943 2294 8.39 118159 490 1.79
2013-14 7968661 32928 88.97 833191 3443 9.30 154847 640 1.73
2014-15 9149608 38606 90.09 823470 3475 8.11 183083 773 1.80
2015-16 8557672 35509 87.96 854390 3545 8.78 316479 1313 3.25
2016-17 15198472 63064 90.07 1073461 4454 6.36 602213 2499 3.57
2017-18 9830117 40789 86.23 1006055 4175 8.83 563709 2339 4.94
Apr-18 781381 41125 88.50 56127 2954 6.36 45388 2389 5.14
89
CC
ILM
on
thly
Ne
wsl
ett
er
statistics
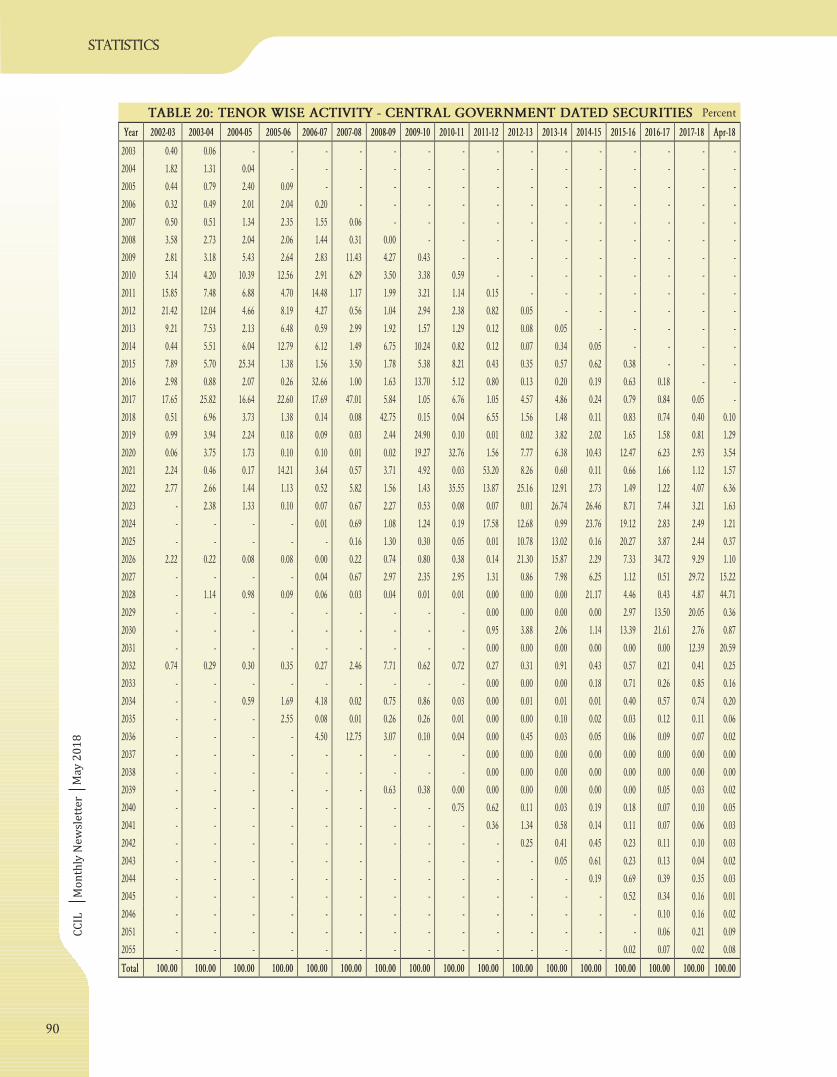
TABLE 20: TENOR WISE ACTIVITY - CENTRAL GOVERNMENT DATED SECURITIES Percent
Ma
y 2
01
8
Year 2002-03 2003-04 2004-05 2005-06 2006-07 2007-08 2008-09 2009-10 2010-11 2011-12 2012-13 2013-14 2014-15 2015-16 2016-17 2017-18 Apr-18
2003 0.40 0.06 - - - - - - - - - - - - - - -
2004 1.82 1.31 0.04 - - - - - - - - - - - - - -
2005 0.44 0.79 2.40 0.09 - - - - - - - - - - - - -
2006 0.32 0.49 2.01 2.04 0.20 - - - - - - - - - - - -
2007 0.50 0.51 1.34 2.35 1.55 0.06 - - - - - - - - - - -
2008 3.58 2.73 2.04 2.06 1.44 0.31 0.00 - - - - - - - - - -
2009 2.81 3.18 5.43 2.64 2.83 11.43 4.27 0.43 - - - - - - - - -
2010 5.14 4.20 10.39 12.56 2.91 6.29 3.50 3.38 0.59 - - - - - - - -
2011 15.85 7.48 6.88 4.70 14.48 1.17 1.99 3.21 1.14 0.15 - - - - - - -
2012 21.42 12.04 4.66 8.19 4.27 0.56 1.04 2.94 2.38 0.82 0.05 - - - - - -
2013 9.21 7.53 2.13 6.48 0.59 2.99 1.92 1.57 1.29 0.12 0.08 0.05 - - - - -
2014 0.44 5.51 6.04 12.79 6.12 1.49 6.75 10.24 0.82 0.12 0.07 0.34 0.05 - - - -
2015 7.89 5.70 25.34 1.38 1.56 3.50 1.78 5.38 8.21 0.43 0.35 0.57 0.62 0.38 - - -
2016 2.98 0.88 2.07 0.26 32.66 1.00 1.63 13.70 5.12 0.80 0.13 0.20 0.19 0.63 0.18 - -
2017 17.65 25.82 16.64 22.60 17.69 47.01 5.84 1.05 6.76 1.05 4.57 4.86 0.24 0.79 0.84 0.05 -
2018 0.51 6.96 3.73 1.38 0.14 0.08 42.75 0.15 0.04 6.55 1.56 1.48 0.11 0.83 0.74 0.40 0.10
2019 0.99 3.94 2.24 0.18 0.09 0.03 2.44 24.90 0.10 0.01 0.02 3.82 2.02 1.65 1.58 0.81 1.29
2020 0.06 3.75 1.73 0.10 0.10 0.01 0.02 19.27 32.76 1.56 7.77 6.38 10.43 12.47 6.23 2.93 3.54
2021 2.24 0.46 0.17 14.21 3.64 0.57 3.71 4.92 0.03 53.20 8.26 0.60 0.11 0.66 1.66 1.12 1.57
2022 2.77 2.66 1.44 1.13 0.52 5.82 1.56 1.43 35.55 13.87 25.16 12.91 2.73 1.49 1.22 4.07 6.36
2023 - 2.38 1.33 0.10 0.07 0.67 2.27 0.53 0.08 0.07 0.01 26.74 26.46 8.71 7.44 3.21 1.63
2024 - - - - 0.01 0.69 1.08 1.24 0.19 17.58 12.68 0.99 23.76 19.12 2.83 2.49 1.21
2025 - - - - - 0.16 1.30 0.30 0.05 0.01 10.78 13.02 0.16 20.27 3.87 2.44 0.37
2026 2.22 0.22 0.08 0.08 0.00 0.22 0.74 0.80 0.38 0.14 21.30 15.87 2.29 7.33 34.72 9.29 1.10
2027 - - - - 0.04 0.67 2.97 2.35 2.95 1.31 0.86 7.98 6.25 1.12 0.51 29.72 15.22
2028 - 1.14 0.98 0.09 0.06 0.03 0.04 0.01 0.01 0.00 0.00 0.00 21.17 4.46 0.43 4.87 44.71
2029 - - - - - - - - - 0.00 0.00 0.00 0.00 2.97 13.50 20.05 0.36
2030 - - - - - - - - - 0.95 3.88 2.06 1.14 13.39 21.61 2.76 0.87
2031 - - - - - - - - - 0.00 0.00 0.00 0.00 0.00 0.00 12.39 20.59
2032 0.74 0.29 0.30 0.35 0.27 2.46 7.71 0.62 0.72 0.27 0.31 0.91 0.43 0.57 0.21 0.41 0.25
2033 - - - - - - - - - 0.00 0.00 0.00 0.18 0.71 0.26 0.85 0.16
2034 - - 0.59 1.69 4.18 0.02 0.75 0.86 0.03 0.00 0.01 0.01 0.01 0.40 0.57 0.74 0.20
2035 - - - 2.55 0.08 0.01 0.26 0.26 0.01 0.00 0.00 0.10 0.02 0.03 0.12 0.11 0.06
2036 - - - - 4.50 12.75 3.07 0.10 0.04 0.00 0.45 0.03 0.05 0.06 0.09 0.07 0.02
2037 - - - - - - - - - 0.00 0.00 0.00 0.00 0.00 0.00 0.00 0.00
2038 - - - - - - - - - 0.00 0.00 0.00 0.00 0.00 0.00 0.00 0.00
2039 - - - - - - 0.63 0.38 0.00 0.00 0.00 0.00 0.00 0.00 0.05 0.03 0.02
2040 - - - - - - - - 0.75 0.62 0.11 0.03 0.19 0.18 0.07 0.10 0.05
2041 - - - - - - - - - 0.36 1.34 0.58 0.14 0.11 0.07 0.06 0.03
2042 - - - - - - - - - - 0.25 0.41 0.45 0.23 0.11 0.10 0.03
2043 - - - - - - - - - - 0.05 0.61 0.23 0.13 0.04 0.02
2044 - - - - - - - - - - - - 0.19 0.69 0.39 0.35 0.03
2045 - - - - - - - - - - - - - 0.52 0.34 0.16 0.01
2046 - - - - - - - - - - - - - - 0.10 0.16 0.02
2051 - - - - - - - - - - - - - - 0.06 0.21 0.09
2055 - - - - - - - - - - - - - 0.02 0.07 0.02 0.08
Total 100.00 100.00 100.00 100.00 100.00 100.00 100.00 100.00 100.00 100.00 100.00 100.00 100.00 100.00 100.00 100.00 100.00
90
CC
ILM
on
thly
Ne
wsl
ett
er
statistics
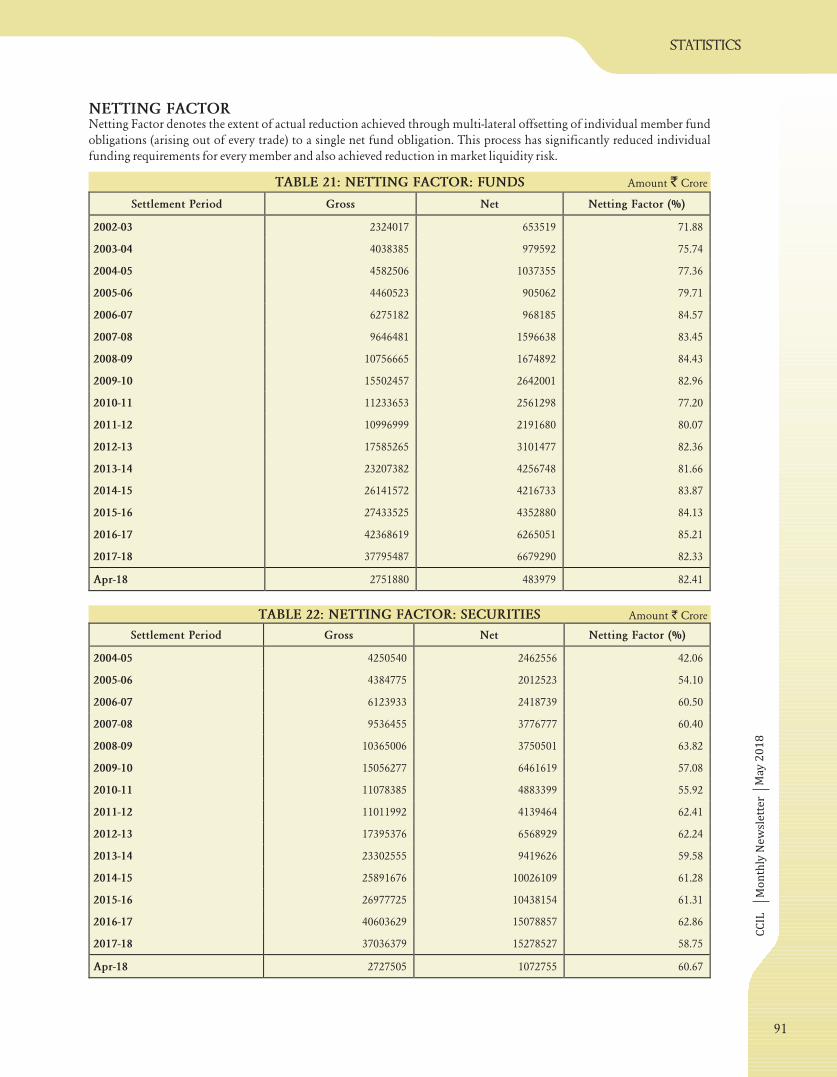
TABLE 21: NETTING FACTOR: FUNDS
Netting Factor denotes the extent of actual reduction achieved through multi-lateral offsetting of individual member fund
obligations (arising out of every trade) to a single net fund obligation. This process has significantly reduced individual
funding requirements for every member and also achieved reduction in market liquidity risk.
Amount Crore`
NETTING FACTOR
Ma
y 2
01
8
Settlement Period Gross Net Netting Factor (%)
2002-03 2324017 653519 71.88
2003-04 4038385 979592 75.74
2004-05 4582506 1037355 77.36
2005-06 4460523 905062 79.71
2006-07 6275182 968185 84.57
2007-08 9646481 1596638 83.45
2008-09 10756665 1674892 84.43
2009-10 15502457 2642001 82.96
2010-11 11233653 2561298 77.20
2011-12 10996999 2191680 80.07
2012-13 17585265 3101477 82.36
2013-14 23207382 4256748 81.66
2014-15 26141572 4216733 83.87
2015-16 27433525 4352880 84.13
2016-17 42368619 6265051 85.21
2017-18 37795487 6679290 82.33
Apr-18 2751880 483979 82.41
TABLE 22: NETTING FACTOR: SECURITIES Amount Crore`
Settlement Period Gross Net Netting Factor (%)
2004-05 4250540 2462556 42.06
2005-06 4384775 2012523 54.10
2006-07 6123933 2418739 60.50
2007-08 9536455 3776777 60.40
2008-09 10365006 3750501 63.82
2009-10 15056277 6461619 57.08
2010-11 11078385 4883399 55.92
2011-12 11011992 4139464 62.41
2012-13 17395376 6568929 62.24
2013-14 23302555 9419626 59.58
2014-15 25891676 10026109 61.28
2015-16 26977725 10438154 61.31
2016-17 40603629 15078857 62.86
2017-18 37036379 15278527 58.75
Apr-18 2727505 1072755 60.67
91
CCIL Monthly Newsletter
statis
tic
s
May 2018
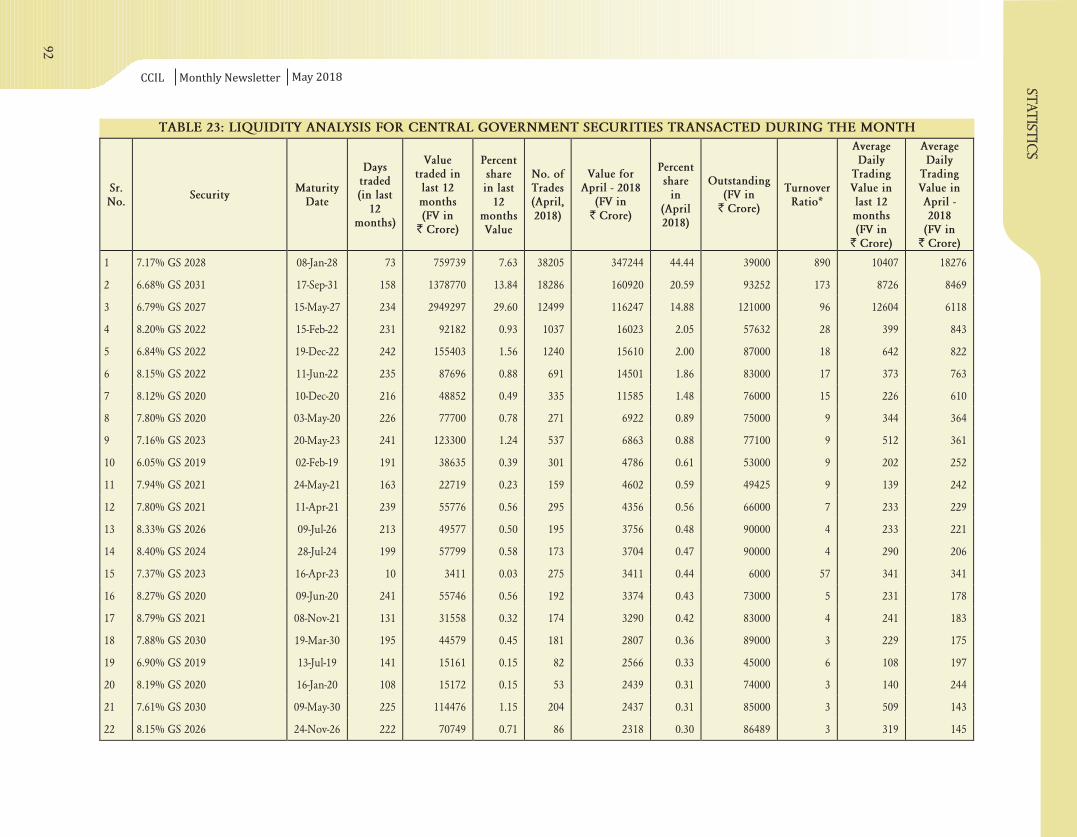
TABLE 23: LIQUIDITY ANALYSIS FOR CENTRAL GOVERNMENT SECURITIES TRANSACTED DURING THE MONTH
Sr.No.
SecurityMaturity
Date
Daystraded(in last
12months)
Valuetraded inlast 12months(FV in
` Crore)
Percentsharein last
12monthsValue
No. ofTrades(April,2018)
Value forApril - 2018
(FV in` Crore)
Percentshare
in(April2018)
Outstanding(FV in
` Crore)
TurnoverRatio*
AverageDaily
TradingValue inlast 12months(FV in
` Crore)
AverageDaily
TradingValue inApril -2018
(FV in` Crore)
1 7.17% GS 2028 08-Jan-28 73 759739 7.63 38205 347244 44.44 39000 890 10407 18276
2 6.68% GS 2031 17-Sep-31 158 1378770 13.84 18286 160920 20.59 93252 173 8726 8469
3 6.79% GS 2027 15-May-27 234 2949297 29.60 12499 116247 14.88 121000 96 12604 6118
4 8.20% GS 2022 15-Feb-22 231 92182 0.93 1037 16023 2.05 57632 28 399 843
5 6.84% GS 2022 19-Dec-22 242 155403 1.56 1240 15610 2.00 87000 18 642 822
6 8.15% GS 2022 11-Jun-22 235 87696 0.88 691 14501 1.86 83000 17 373 763
7 8.12% GS 2020 10-Dec-20 216 48852 0.49 335 11585 1.48 76000 15 226 610
8 7.80% GS 2020 03-May-20 226 77700 0.78 271 6922 0.89 75000 9 344 364
9 7.16% GS 2023 20-May-23 241 123300 1.24 537 6863 0.88 77100 9 512 361
10 6.05% GS 2019 02-Feb-19 191 38635 0.39 301 4786 0.61 53000 9 202 252
11 7.94% GS 2021 24-May-21 163 22719 0.23 159 4602 0.59 49425 9 139 242
12 7.80% GS 2021 11-Apr-21 239 55776 0.56 295 4356 0.56 66000 7 233 229
13 8.33% GS 2026 09-Jul-26 213 49577 0.50 195 3756 0.48 90000 4 233 221
14 8.40% GS 2024 28-Jul-24 199 57799 0.58 173 3704 0.47 90000 4 290 206
15 7.37% GS 2023 16-Apr-23 10 3411 0.03 275 3411 0.44 6000 57 341 341
16 8.27% GS 2020 09-Jun-20 241 55746 0.56 192 3374 0.43 73000 5 231 178
17 8.79% GS 2021 08-Nov-21 131 31558 0.32 174 3290 0.42 83000 4 241 183
18 7.88% GS 2030 19-Mar-30 195 44579 0.45 181 2807 0.36 89000 3 229 175
19 6.90% GS 2019 13-Jul-19 141 15161 0.15 82 2566 0.33 45000 6 108 197
20 8.19% GS 2020 16-Jan-20 108 15172 0.15 53 2439 0.31 74000 3 140 244
21 7.61% GS 2030 09-May-30 225 114476 1.15 204 2437 0.31 85000 3 509 143
22 8.15% GS 2026 24-Nov-26 222 70749 0.71 86 2318 0.30 86489 3 319 145
92
CCIL Monthly Newsletter
statis
tic
s
May 2018
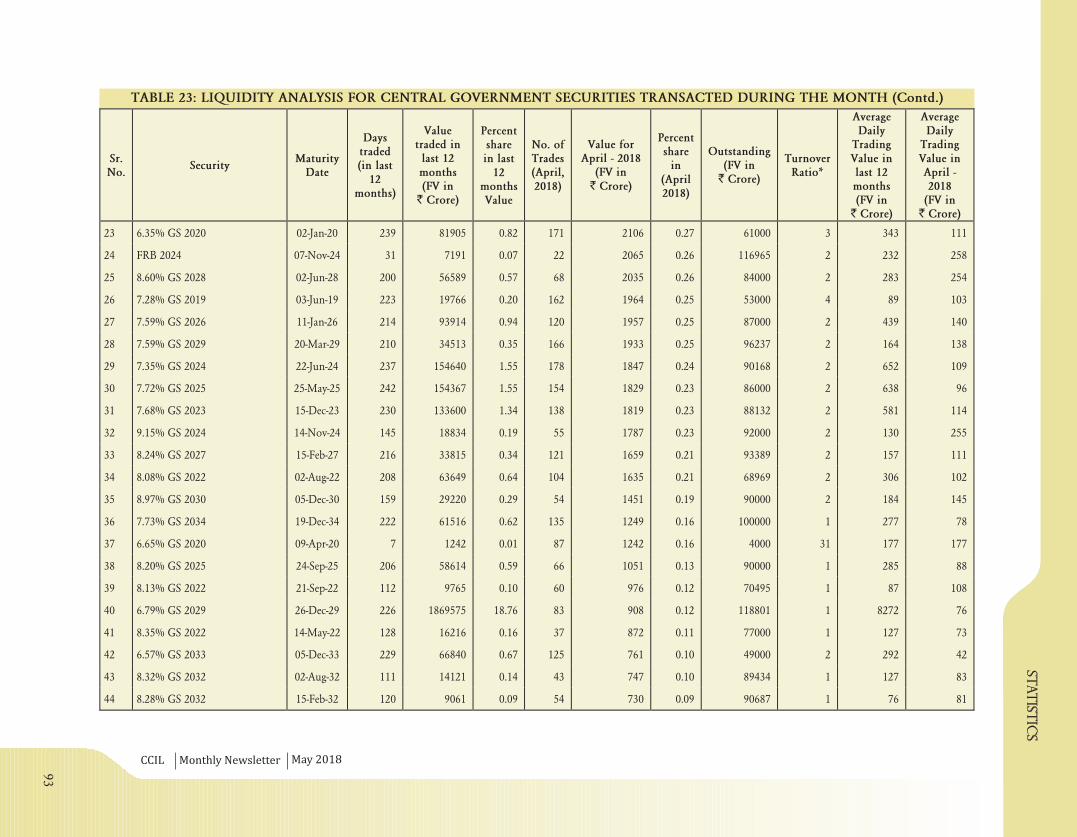
TABLE 23: LIQUIDITY ANALYSIS FOR CENTRAL GOVERNMENT SECURITIES TRANSACTED DURING THE MONTH (Contd.)
Sr.No.
SecurityMaturity
Date
Daystraded(in last
12months)
Valuetraded inlast 12months(FV in
` Crore)
Percentsharein last
12monthsValue
No. ofTrades(April,2018)
Value forApril - 2018
(FV in` Crore)
Percentshare
in(April2018)
Outstanding(FV in
` Crore)
TurnoverRatio*
AverageDaily
TradingValue inlast 12months(FV in
` Crore)
AverageDaily
TradingValue inApril -2018
(FV in` Crore)
23 6.35% GS 2020 02-Jan-20 239 81905 0.82 171 2106 0.27 61000 3 343 111
24 FRB 2024 07-Nov-24 31 7191 0.07 22 2065 0.26 116965 2 232 258
25 8.60% GS 2028 02-Jun-28 200 56589 0.57 68 2035 0.26 84000 2 283 254
26 7.28% GS 2019 03-Jun-19 223 19766 0.20 162 1964 0.25 53000 4 89 103
27 7.59% GS 2026 11-Jan-26 214 93914 0.94 120 1957 0.25 87000 2 439 140
28 7.59% GS 2029 20-Mar-29 210 34513 0.35 166 1933 0.25 96237 2 164 138
29 7.35% GS 2024 22-Jun-24 237 154640 1.55 178 1847 0.24 90168 2 652 109
30 7.72% GS 2025 25-May-25 242 154367 1.55 154 1829 0.23 86000 2 638 96
31 7.68% GS 2023 15-Dec-23 230 133600 1.34 138 1819 0.23 88132 2 581 114
32 9.15% GS 2024 14-Nov-24 145 18834 0.19 55 1787 0.23 92000 2 130 255
33 8.24% GS 2027 15-Feb-27 216 33815 0.34 121 1659 0.21 93389 2 157 111
34 8.08% GS 2022 02-Aug-22 208 63649 0.64 104 1635 0.21 68969 2 306 102
35 8.97% GS 2030 05-Dec-30 159 29220 0.29 54 1451 0.19 90000 2 184 145
36 7.73% GS 2034 19-Dec-34 222 61516 0.62 135 1249 0.16 100000 1 277 78
37 6.65% GS 2020 09-Apr-20 7 1242 0.01 87 1242 0.16 4000 31 177 177
38 8.20% GS 2025 24-Sep-25 206 58614 0.59 66 1051 0.13 90000 1 285 88
39 8.13% GS 2022 21-Sep-22 112 9765 0.10 60 976 0.12 70495 1 87 108
40 6.79% GS 2029 26-Dec-29 226 1869575 18.76 83 908 0.12 118801 1 8272 76
41 8.35% GS 2022 14-May-22 128 16216 0.16 37 872 0.11 77000 1 127 73
42 6.57% GS 2033 05-Dec-33 229 66840 0.67 125 761 0.10 49000 2 292 42
43 8.32% GS 2032 02-Aug-32 111 14121 0.14 43 747 0.10 89434 1 127 83
44 8.28% GS 2032 15-Feb-32 120 9061 0.09 54 730 0.09 90687 1 76 81
93
CCIL Monthly Newsletter
statis
tic
s
May 2018
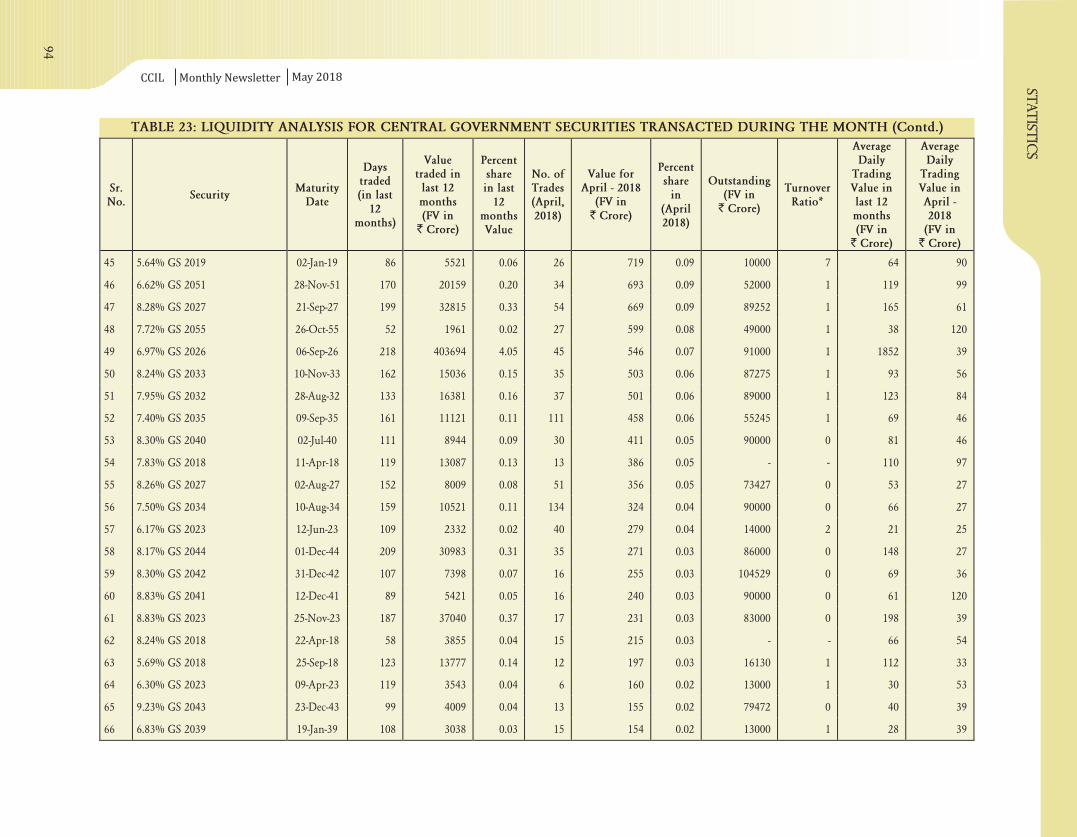
TABLE 23: LIQUIDITY ANALYSIS FOR CENTRAL GOVERNMENT SECURITIES TRANSACTED DURING THE MONTH (Contd.)
Sr.No.
SecurityMaturity
Date
Daystraded(in last
12months)
Valuetraded inlast 12months(FV in
` Crore)
Percentsharein last
12monthsValue
No. ofTrades(April,2018)
Value forApril - 2018
(FV in` Crore)
Percentshare
in(April2018)
Outstanding(FV in
` Crore)
TurnoverRatio*
AverageDaily
TradingValue inlast 12months(FV in
` Crore)
AverageDaily
TradingValue inApril -2018
(FV in` Crore)
45 5.64% GS 2019 02-Jan-19 86 5521 0.06 26 719 0.09 10000 7 64 90
46 6.62% GS 2051 28-Nov-51 170 20159 0.20 34 693 0.09 52000 1 119 99
47 8.28% GS 2027 21-Sep-27 199 32815 0.33 54 669 0.09 89252 1 165 61
48 7.72% GS 2055 26-Oct-55 52 1961 0.02 27 599 0.08 49000 1 38 120
49 6.97% GS 2026 06-Sep-26 218 403694 4.05 45 546 0.07 91000 1 1852 39
50 8.24% GS 2033 10-Nov-33 162 15036 0.15 35 503 0.06 87275 1 93 56
51 7.95% GS 2032 28-Aug-32 133 16381 0.16 37 501 0.06 89000 1 123 84
52 7.40% GS 2035 09-Sep-35 161 11121 0.11 111 458 0.06 55245 1 69 46
53 8.30% GS 2040 02-Jul-40 111 8944 0.09 30 411 0.05 90000 0 81 46
54 7.83% GS 2018 11-Apr-18 119 13087 0.13 13 386 0.05 - 110 97
55 8.26% GS 2027 02-Aug-27 152 8009 0.08 51 356 0.05 73427 0 53 27
56 7.50% GS 2034 10-Aug-34 159 10521 0.11 134 324 0.04 90000 0 66 27
57 6.17% GS 2023 12-Jun-23 109 2332 0.02 40 279 0.04 14000 2 21 25
58 8.17% GS 2044 01-Dec-44 209 30983 0.31 35 271 0.03 86000 0 148 27
59 8.30% GS 2042 31-Dec-42 107 7398 0.07 16 255 0.03 104529 0 69 36
60 8.83% GS 2041 12-Dec-41 89 5421 0.05 16 240 0.03 90000 0 61 120
61 8.83% GS 2023 25-Nov-23 187 37040 0.37 17 231 0.03 83000 0 198 39
62 8.24% GS 2018 22-Apr-18 58 3855 0.04 15 215 0.03 - - 66 54
63 5.69% GS 2018 25-Sep-18 123 13777 0.14 12 197 0.03 16130 1 112 33
64 6.30% GS 2023 09-Apr-23 119 3543 0.04 6 160 0.02 13000 1 30 53
65 9.23% GS 2043 23-Dec-43 99 4009 0.04 13 155 0.02 79472 0 40 39
66 6.83% GS 2039 19-Jan-39 108 3038 0.03 15 154 0.02 13000 1 28 39
-
94

CCIL Monthly Newsletter
TABLE 23: LIQUIDITY ANALYSIS FOR CENTRAL GOVERNMENT SECURITIES TRANSACTED DURING THE MONTH (Contd.)
statis
tic
s
May 2018
Sr.No.
SecurityMaturity
Date
Daystraded(in last
12months)
Valuetraded inlast 12months(FV in
` Crore)
Percentsharein last
12monthsValue
No. ofTrades(April,2018)
Value forApril - 2018
(FV in` Crore)
Percentshare
in(April2018)
Outstanding(FV in
` Crore)
TurnoverRatio*
AverageDaily
TradingValue inlast 12months(FV in
` Crore)
AverageDaily
TradingValue inApril -2018
(FV in` Crore)
67 8.33% GS 2036 07-Jun-36 91 5297 0.05 15 143 0.02 86000 0 58 24
68 7.06% GS 2046 10-Oct-46 185 16108 0.16 30 129 0.02 58000 0 87 13
69 9.20% GS 2030 30-Sep-30 102 7509 0.08 9 100 0.01 61885 0 74 50
70 8.13% GS 2045 22-Jun-45 181 14883 0.15 15 94 0.01 73000 0 82 19
71 6.05% GS 2019 12-Jun-19 81 3356 0.03 11 61 0.01 11000 1 41 9
72 6.01% GS 2028 25-Mar-28 79 628 0.01 10 60 0.01 15000 0 8 20
73 5.87% GS 2022 28-Aug-22 7 68 0.00 1 45 0.01 11000 0 10 45
74 8.03% FCI SB 2024 15-Dec-24 15 28 0.00 1 14 0.00 5000 0 2 14
75 8.20% OMC SB 2024 15-Sep-24 24 106 0.00 4 5 0.00 10306 0 4 2
76 10.25% GS 2021 30-May-21 40 436 0.00 4 5 0.00 26213 0 11 2
77 8.30% FERT SB 2023 07-Dec-23 18 42 0.00 2 4 0.00 3880 0 2 4
78 8.15% FCI SB 2022 16-Oct-22 35 127 0.00 5 2 0.00 5000 0 4 1
79 8.20% OMC SB 2023 10-Nov-23 15 13 0.00 2 2 0.00 22000 0 1 2
80 8.40% OMC SB 2026 29-Mar-26 11 27 0.00 3 2 0.00 4971 0 2 1
81 8.01% OMC SB 2023 15-Dec-23 8 5 0.00 1 2 0.00 88132 0 1 2
82 7.95% OMC SB 2025 18-Jan-25 9 41 0.00 3 1 0.00 11257 0 5 1
83 8.35% SBI SB 2024 27-Mar-24 3 26 0.00 1 1 0.00 9996 0 9 1
84 10.03% GS 2019 09-Aug-19 15 422 0.00 2 1 0.00 6000 0 28 1
85 10.70% GS 2020 22-Apr-20 21 66 0.00 1 1 0.00 6000 0 3 1
86 8.13% OMC SB 2021 16-Oct-21 6 20 0.00 3 1 0.00 5000 0 3 1
87 8.23% FCI SB 2027 12-Feb-27 17 30 0.00 1 0 0.00 6200 0 2 0
95
CCIL Monthly Newsletter
statis
tic
s
May 2018
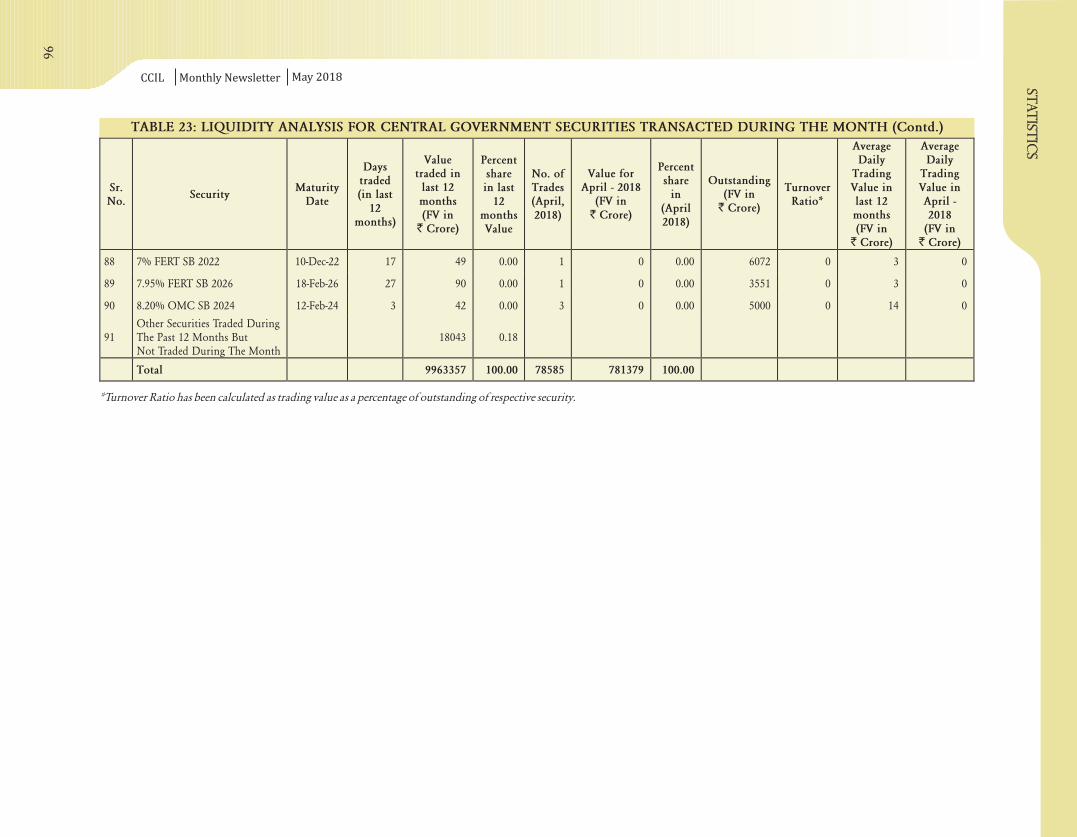
TABLE 23: LIQUIDITY ANALYSIS FOR CENTRAL GOVERNMENT SECURITIES TRANSACTED DURING THE MONTH (Contd.)
*Turnover Ratio has been calculated as trading value as a percentage of of respective security.outstanding
Sr.No.
SecurityMaturity
Date
Daystraded(in last
12months)
Valuetraded inlast 12months(FV in
` Crore)
Percentsharein last
12monthsValue
No. ofTrades(April,2018)
Value forApril - 2018
(FV in` Crore)
Percentshare
in(April2018)
Outstanding(FV in
` Crore)
TurnoverRatio*
AverageDaily
TradingValue inlast 12months(FV in
` Crore)
AverageDaily
TradingValue inApril -2018
(FV in` Crore)
88 7% FERT SB 2022 10-Dec-22 17 49 0.00 1 0 0.00 6072 0 3 0
89 7.95% FERT SB 2026 18-Feb-26 27 90 0.00 1 0 0.00 3551 0 3 0
90 8.20% OMC SB 2024 12-Feb-24 3 42 0.00 3 0 0.00 5000 0 14 0
91Other Securities Traded DuringThe Past 12 Months ButNot Traded During The Month
18043 0.18
Total 9963357 100.00 78585 781379 100.00
96
CC
ILM
on
thly
Ne
wsl
ett
er
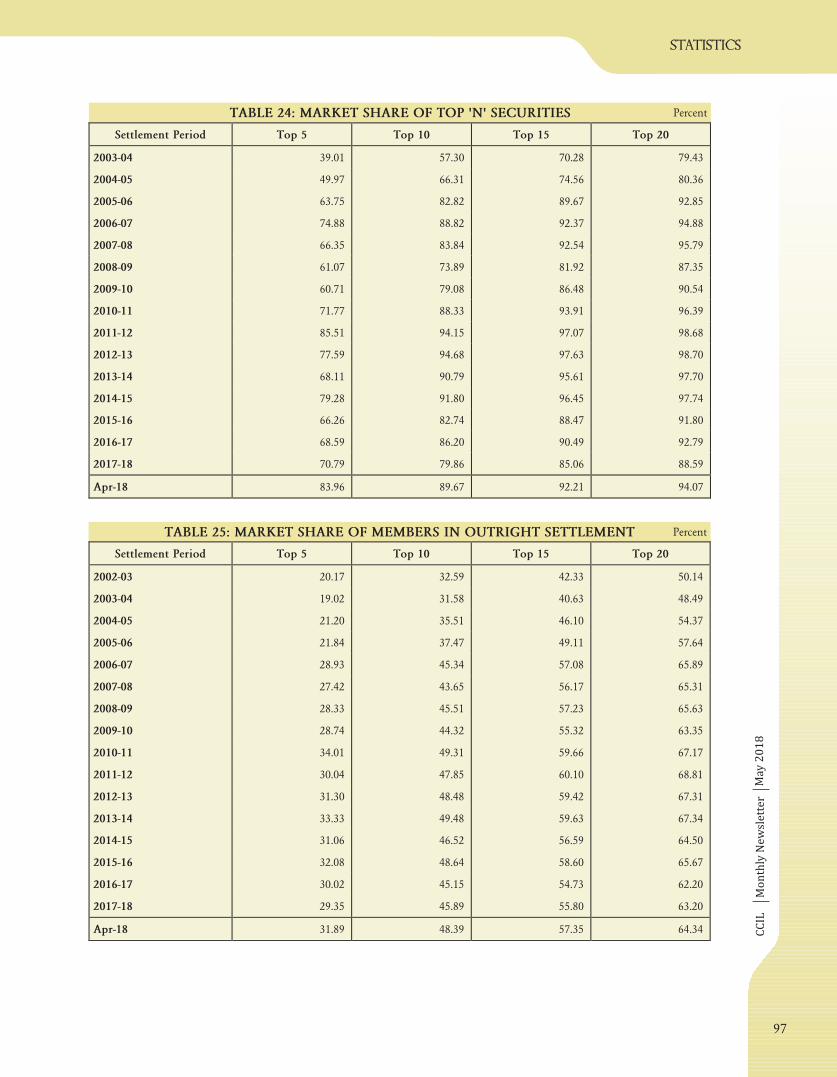
TABLE 24: MARKET SHARE OF TOP 'N' SECURITIES Percent
statistics
Ma
y 2
01
8
TABLE 25: MARKET SHARE OF MEMBERS IN OUTRIGHT SETTLEMENT Percent
Settlement Period Top 5 Top 10 Top 15 Top 20
2003-04 39.01 57.30 70.28 79.43
2004-05 49.97 66.31 74.56 80.36
2005-06 63.75 82.82 89.67 92.85
2006-07 74.88 88.82 92.37 94.88
2007-08 66.35 83.84 92.54 95.79
2008-09 61.07 73.89 81.92 87.35
2009-10 60.71 79.08 86.48 90.54
2010-11 71.77 88.33 93.91 96.39
2011-12 85.51 94.15 97.07 98.68
2012-13 77.59 94.68 97.63 98.70
2013-14 68.11 90.79 95.61 97.70
2014-15 79.28 91.80 96.45 97.74
2015-16 66.26 82.74 88.47 91.80
2016-17 68.59 86.20 90.49 92.79
2017-18 70.79 79.86 85.06 88.59
Apr-18 83.96 89.67 92.21 94.07
Settlement Period Top 5 Top 10 Top 15 Top 20
2002-03 20.17 32.59 42.33 50.14
2003-04 19.02 31.58 40.63 48.49
2004-05 21.20 35.51 46.10 54.37
2005-06 21.84 37.47 49.11 57.64
2006-07 28.93 45.34 57.08 65.89
2007-08 27.42 43.65 56.17 65.31
2008-09 28.33 45.51 57.23 65.63
2009-10 28.74 44.32 55.32 63.35
2010-11 34.01 49.31 59.66 67.17
2011-12 30.04 47.85 60.10 68.81
2012-13 31.30 48.48 59.42 67.31
2013-14 33.33 49.48 59.63 67.34
2014-15 31.06 46.52 56.59 64.50
2015-16 32.08 48.64 58.60 65.67
2016-17 30.02 45.15 54.73 62.20
2017-18 29.35 45.89 55.80 63.20
Apr-18 31.89 48.39 57.35 64.34
97

TRADING ANALYSIS
TABLE 27: TRADING PLATFORM ANALYSIS OF OUTRIGHT TRADES* Amount Crore`
*as on trade date
CC
ILM
on
thly
Ne
wsl
ett
er
statistics
Ma
y 2
01
8
TABLE 26: MARKET SHARE OF TOP FIVE MEMBERS (CATEGORYWISE) Percent
CategoriesCooperative
BanksForeignBanks
PublicSector Banks
PrivateSector Banks
MutualFunds
PrimaryDealers
No of Members 54 38 20 20 26 7
2002-03 87.04 75.91 41.44 50.65 59.76 62.00
2003-04 76.72 75.48 43.88 53.33 55.47 62.96
2004-05 82.30 77.94 51.20 69.12 56.99 61.90
2005-06 75.10 77.91 53.45 71.55 56.49 56.95
2006-07 77.20 76.04 52.57 73.68 68.00 72.44
2007-08 86.70 74.99 55.29 73.01 70.20 86.20
2008-09 82.16 76.26 52.53 76.79 66.10 86.83
2009-10 72.08 79.86 47.99 79.61 64.19 82.44
2010-11 62.05 83.05 48.99 74.60 66.49 84.80
2011-12 61.15 75.91 51.48 74.43 68.01 82.38
2012-13 55.50 77.32 48.92 83.43 65.36 82.08
2013-14 55.31 81.15 45.68 86.53 65.08 85.35
2014-15 58.68 82.14 47.58 80.35 66.19 87.29
2015-16 60.56 86.10 50.22 83.16 63.90 89.18
2016-17 56.83 87.23 45.98 79.16 62.48 93.18
2017-18 58.90 80.40 59.40 80.72 56.80 91.62
Apr-18 66.83 75.41 55.53 84.45 55.08 91.97
OTC NDS-OM TotalPeriod
Trades Value % Share % Share Trades Value % Share % Share Trades Value
2005-06 38809 292515 50.36 56.98 38251 220890 49.64 43.02 77060 513405
2006-07 35322 368704 25.79 36.11 101641 652270 74.21 63.89 136963 1020974
2007-08 31020 453226 16.43 27.42 157823 1199919 83.57 72.58 188843 1653145
2008-09 35288 613229 14.35 28.36 210585 1548906 85.65 71.64 245873 2162135
2009-10 40736 798397 12.87 27.41 275769 2113896 87.13 72.59 316505 2912293
2010-11 42710 622558 12.85 21.73 289636 2241886 87.15 78.27 332346 2864444
2011-12 44908 731938 10.89 20.96 367495 2760795 89.11 79.04 412403 3492733
2012-13 57757 1179701 8.79 17.91 599316 5408334 91.21 82.09 657073 6588036
2013-14 57545 1501310 7.03 16.79 760964 7437982 92.97 83.21 818509 8939292
2014-15 57293 1635278 5.85 16.09 921361 8531024 94.15 83.91 978654 10166302
2015-16 60560 1891410 6.86 19.42 822803 7846591 93.14 80.58 883363 9738000
2016-17 84504 2804041 6.30 16.64 1255872 14051698 93.70 83.36 1340376 16855738
2017-18 66190 2685956 7.21 23.59 851940 8699962 92.79 76.41 918130 11385918
Apr-18 4794 176553 5.92 20.34 76165 691530 94.08 79.66 80959 868083
98

CC
ILM
on
thly
Ne
wsl
ett
er
statistics
TABLE 29: MARKET SHARE - PROPRIETARY TRADES* Percent
* Trade Data
TABLE 28A: WHEN-ISSUED TRADING - HISTORICAL Amount Crore`
Ma
y 2
01
8
Period Trades Value
2006-07 154 1270
2007-08 169 1530
2008-09 335 3000
2009-10 320 3180
2010-11 306 2715
2011-12 391 2985
2012-13 1586 11805
2013-14 1406 11295
2014-15 1232 11265
2015-16 679 5755
2016-17 1400 13535
2017-18 966 9555
Apr-18 9 65
TABLE 28B: WHEN-ISSUED TRADING DETAILS Amount Crore`
Security Description Maturity Date Trades Value
6.65% GS 2020 9-Apr-20 3 15
7.37% GS 2023 16-Apr-23 2 20
7.17% GS 2028 08-Jan-28 4 30
Total 9 65
Buy SellCategory
Trades Value Trades Value
Co-operative Banks 6.68 3.71 6.49 3.48
Financial Institutions 0.60 0.31 0.35 0.19
Foreign Banks 18.93 23.08 20.01 22.63
Insurance Companies 2.13 2.80 1.65 2.21
Mutual Funds 6.67 8.88 7.73 8.73
Others 5.04 3.93 4.33 2.55
Primary Dealers 15.25 14.07 17.88 16.42
Private Sector Banks 20.32 19.86 19.68 21.42
Provident Funds 0.20 0.77 0.00 0.00
Public Sector Banks 16.93 14.10 16.95 15.65
99
CC
ILM
on
thly
Ne
wsl
ett
er
statistics
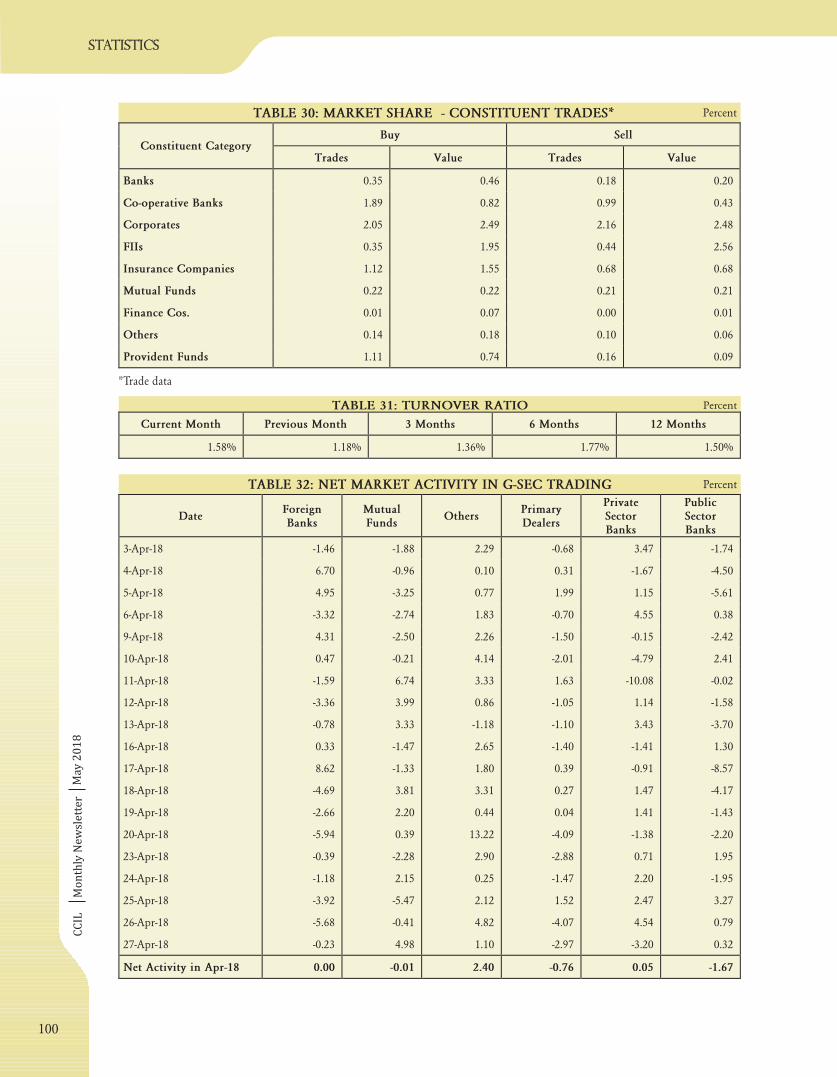
TABLE 30: MARKET SHARE - CONSTITUENT TRADES* Percent
*Trade data
PercentTABLE 31: TURNOVER RATIO
TABLE 32: NET MARKET ACTIVITY IN G-SEC TRADING Percent
Ma
y 2
01
8
Current Month Previous Month 3 Months 6 Months 12 Months
1.58% 1.18% 1.36% 1.77% 1.50%
DateForeignBanks
MutualFunds
OthersPrimaryDealers
PrivateSectorBanks
PublicSectorBanks
3-Apr-18 -1.46 -1.88 2.29 -0.68 3.47 -1.74
4-Apr-18 6.70 -0.96 0.10 0.31 -1.67 -4.50
5-Apr-18 4.95 -3.25 0.77 1.99 1.15 -5.61
6-Apr-18 -3.32 -2.74 1.83 -0.70 4.55 0.38
9-Apr-18 4.31 -2.50 2.26 -1.50 -0.15 -2.42
10-Apr-18 0.47 -0.21 4.14 -2.01 -4.79 2.41
11-Apr-18 -1.59 6.74 3.33 1.63 -10.08 -0.02
12-Apr-18 -3.36 3.99 0.86 -1.05 1.14 -1.58
13-Apr-18 -0.78 3.33 -1.18 -1.10 3.43 -3.70
16-Apr-18 0.33 -1.47 2.65 -1.40 -1.41 1.30
17-Apr-18 8.62 -1.33 1.80 0.39 -0.91 -8.57
18-Apr-18 -4.69 3.81 3.31 0.27 1.47 -4.17
19-Apr-18 -2.66 2.20 0.44 0.04 1.41 -1.43
20-Apr-18 -5.94 0.39 13.22 -4.09 -1.38 -2.20
23-Apr-18 -0.39 -2.28 2.90 -2.88 0.71 1.95
24-Apr-18 -1.18 2.15 0.25 -1.47 2.20 -1.95
25-Apr-18 -3.92 -5.47 2.12 1.52 2.47 3.27
26-Apr-18 -5.68 -0.41 4.82 -4.07 4.54 0.79
27-Apr-18 -0.23 4.98 1.10 -2.97 -3.20 0.32
Net Activity in Apr-18 0.00 -0.01 2.40 -0.76 0.05 -1.67
Buy SellConstituent Category
Trades Value Trades Value
Banks 0.35 0.46 0.18 0.20
Co-operative Banks 1.89 0.82 0.99 0.43
Corporates 2.05 2.49 2.16 2.48
FIIs 0.35 1.95 0.44 2.56
Insurance Companies 1.12 1.55 0.68 0.68
Mutual Funds 0.22 0.22 0.21 0.21
Finance Cos. 0.01 0.07 0.00 0.01
Others 0.14 0.18 0.10 0.06
Provident Funds 1.11 0.74 0.16 0.09
100
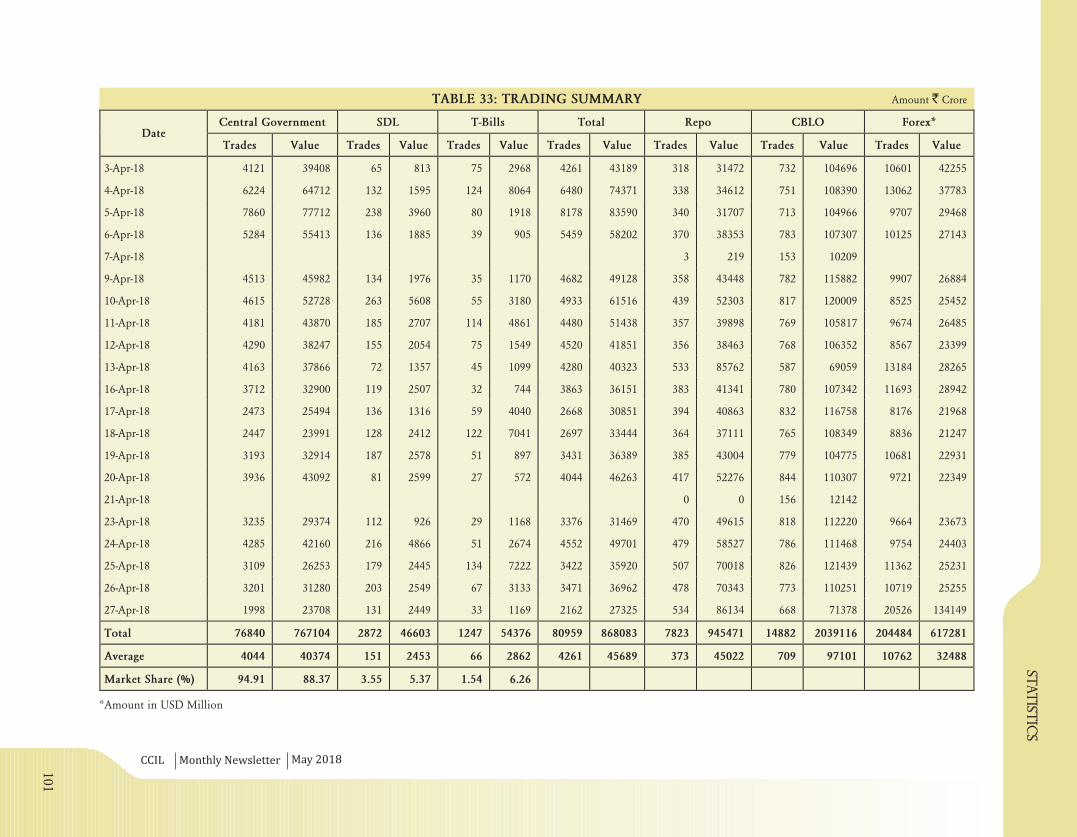
TABLE 33: TRADING SUMMARY Amount Crore`
*Amount in USD Million
CCIL Monthly Newsletter
statis
tic
s
May 2018
Central Government SDL T-Bills Total Repo CBLO Forex*Date
Trades Value Trades Value Trades Value Trades Value Trades Value Trades Value Trades Value
3-Apr-18 4121 39408 65 813 75 2968 4261 43189 318 31472 732 104696 10601 42255
4-Apr-18 6224 64712 132 1595 124 8064 6480 74371 338 34612 751 108390 13062 37783
5-Apr-18 7860 77712 238 3960 80 1918 8178 83590 340 31707 713 104966 9707 29468
6-Apr-18 5284 55413 136 1885 39 905 5459 58202 370 38353 783 107307 10125 27143
7-Apr-18 3 219 153 10209
9-Apr-18 4513 45982 134 1976 35 1170 4682 49128 358 43448 782 115882 9907 26884
10-Apr-18 4615 52728 263 5608 55 3180 4933 61516 439 52303 817 120009 8525 25452
11-Apr-18 4181 43870 185 2707 114 4861 4480 51438 357 39898 769 105817 9674 26485
12-Apr-18 4290 38247 155 2054 75 1549 4520 41851 356 38463 768 106352 8567 23399
13-Apr-18 4163 37866 72 1357 45 1099 4280 40323 533 85762 587 69059 13184 28265
16-Apr-18 3712 32900 119 2507 32 744 3863 36151 383 41341 780 107342 11693 28942
17-Apr-18 2473 25494 136 1316 59 4040 2668 30851 394 40863 832 116758 8176 21968
18-Apr-18 2447 23991 128 2412 122 7041 2697 33444 364 37111 765 108349 8836 21247
19-Apr-18 3193 32914 187 2578 51 897 3431 36389 385 43004 779 104775 10681 22931
20-Apr-18 3936 43092 81 2599 27 572 4044 46263 417 52276 844 110307 9721 22349
21-Apr-18 0 0 156 12142
23-Apr-18 3235 29374 112 926 29 1168 3376 31469 470 49615 818 112220 9664 23673
24-Apr-18 4285 42160 216 4866 51 2674 4552 49701 479 58527 786 111468 9754 24403
25-Apr-18 3109 26253 179 2445 134 7222 3422 35920 507 70018 826 121439 11362 25231
26-Apr-18 3201 31280 203 2549 67 3133 3471 36962 478 70343 773 110251 10719 25255
27-Apr-18 1998 23708 131 2449 33 1169 2162 27325 534 86134 668 71378 20526 134149
Total 76840 767104 2872 46603 1247 54376 80959 868083 7823 945471 14882 2039116 204484 617281
Average 4044 40374 151 2453 66 2862 4261 45689 373 45022 709 97101 10762 32488
Market Share (%) 94.91 88.37 3.55 5.37 1.54 6.26
101
CCIL Monthly Newsletter
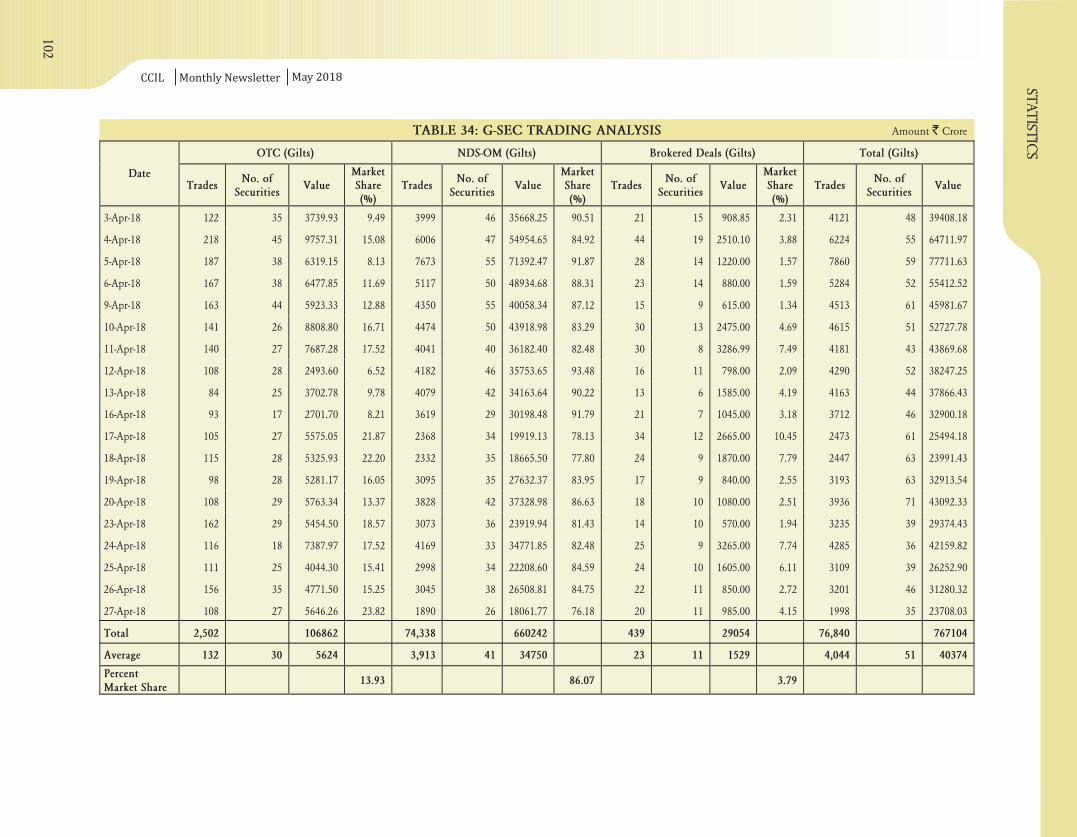
TABLE 34: G-SEC TRADING ANALYSIS Amount Crore`
statis
tic
s
May 2018
OTC (Gilts) NDS-OM (Gilts) Brokered Deals (Gilts) Total (Gilts)
DateTrades
No. ofSecurities
ValueMarketShare(%)
TradesNo. of
SecuritiesValue
MarketShare(%)
TradesNo. of
SecuritiesValue
MarketShare(%)
TradesNo. of
SecuritiesValue
3-Apr-18 122 35 3739.93 9.49 3999 46 35668.25 90.51 21 15 908.85 2.31 4121 48 39408.18
4-Apr-18 218 45 9757.31 15.08 6006 47 54954.65 84.92 44 19 2510.10 3.88 6224 55 64711.97
5-Apr-18 187 38 6319.15 8.13 7673 55 71392.47 91.87 28 14 1220.00 1.57 7860 59 77711.63
6-Apr-18 167 38 6477.85 11.69 5117 50 48934.68 88.31 23 14 880.00 1.59 5284 52 55412.52
9-Apr-18 163 44 5923.33 12.88 4350 55 40058.34 87.12 15 9 615.00 1.34 4513 61 45981.67
10-Apr-18 141 26 8808.80 16.71 4474 50 43918.98 83.29 30 13 2475.00 4.69 4615 51 52727.78
11-Apr-18 140 27 7687.28 17.52 4041 40 36182.40 82.48 30 8 3286.99 7.49 4181 43 43869.68
12-Apr-18 108 28 2493.60 6.52 4182 46 35753.65 93.48 16 11 798.00 2.09 4290 52 38247.25
13-Apr-18 84 25 3702.78 9.78 4079 42 34163.64 90.22 13 6 1585.00 4.19 4163 44 37866.43
16-Apr-18 93 17 2701.70 8.21 3619 29 30198.48 91.79 21 7 1045.00 3.18 3712 46 32900.18
17-Apr-18 105 27 5575.05 21.87 2368 34 19919.13 78.13 34 12 2665.00 10.45 2473 61 25494.18
18-Apr-18 115 28 5325.93 22.20 2332 35 18665.50 77.80 24 9 1870.00 7.79 2447 63 23991.43
19-Apr-18 98 28 5281.17 16.05 3095 35 27632.37 83.95 17 9 840.00 2.55 3193 63 32913.54
20-Apr-18 108 29 5763.34 13.37 3828 42 37328.98 86.63 18 10 1080.00 2.51 3936 71 43092.33
23-Apr-18 162 29 5454.50 18.57 3073 36 23919.94 81.43 14 10 570.00 1.94 3235 39 29374.43
24-Apr-18 116 18 7387.97 17.52 4169 33 34771.85 82.48 25 9 3265.00 7.74 4285 36 42159.82
25-Apr-18 111 25 4044.30 15.41 2998 34 22208.60 84.59 24 10 1605.00 6.11 3109 39 26252.90
26-Apr-18 156 35 4771.50 15.25 3045 38 26508.81 84.75 22 11 850.00 2.72 3201 46 31280.32
27-Apr-18 108 27 5646.26 23.82 1890 26 18061.77 76.18 20 11 985.00 4.15 1998 35 23708.03
Total 2,502 106862 74,338 660242 439 29054 76,840 767104
Average 132 30 5624 3,913 41 34750 23 11 1529 4,044 51 40374
PercentMarket Share
13.93 86.07 3.79
102
CCIL Monthly Newsletter
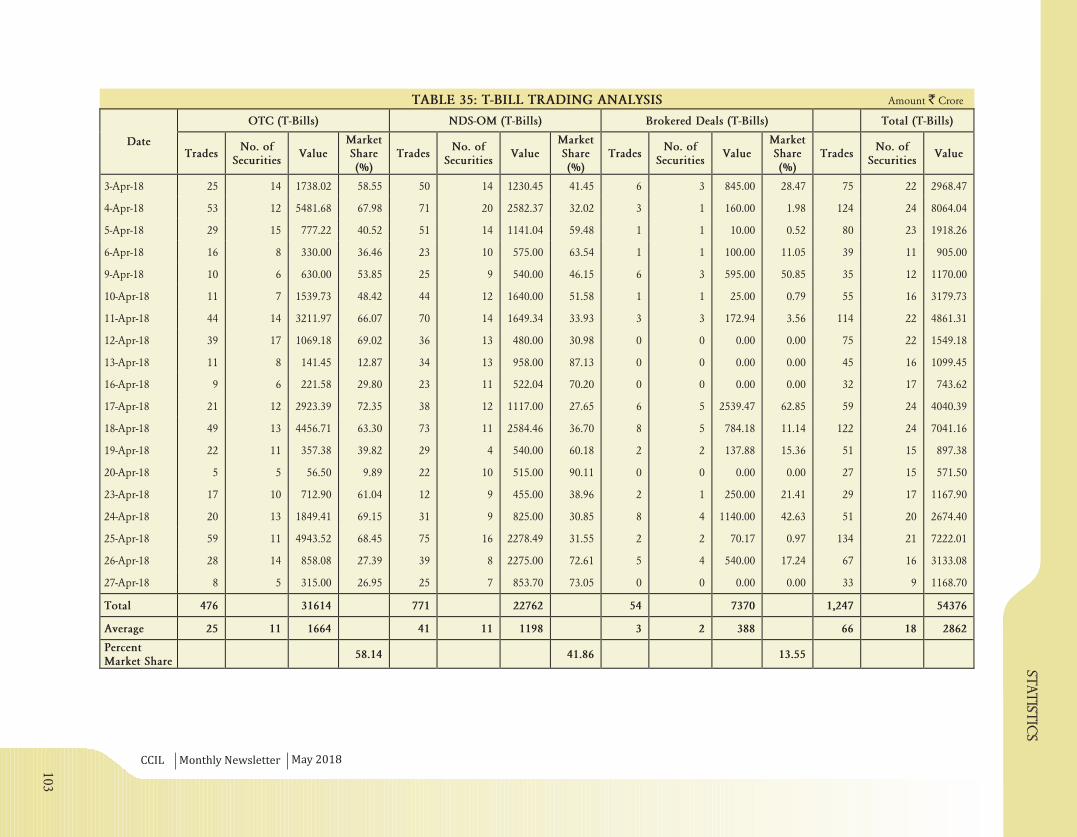
TABLE 35: T-BILL TRADING ANALYSIS Amount Crore`
statis
tic
s
May 2018
OTC (T-Bills) NDS-OM (T-Bills) Brokered Deals (T-Bills) Total (T-Bills)
DateTrades
No. ofSecurities
ValueMarketShare(%)
TradesNo. of
SecuritiesValue
MarketShare(%)
TradesNo. of
SecuritiesValue
MarketShare(%)
TradesNo. of
SecuritiesValue
3-Apr-18 25 14 1738.02 58.55 50 14 1230.45 41.45 6 3 845.00 28.47 75 22 2968.47
4-Apr-18 53 12 5481.68 67.98 71 20 2582.37 32.02 3 1 160.00 1.98 124 24 8064.04
5-Apr-18 29 15 777.22 40.52 51 14 1141.04 59.48 1 1 10.00 0.52 80 23 1918.26
6-Apr-18 16 8 330.00 36.46 23 10 575.00 63.54 1 1 100.00 11.05 39 11 905.00
9-Apr-18 10 6 630.00 53.85 25 9 540.00 46.15 6 3 595.00 50.85 35 12 1170.00
10-Apr-18 11 7 1539.73 48.42 44 12 1640.00 51.58 1 1 25.00 0.79 55 16 3179.73
11-Apr-18 44 14 3211.97 66.07 70 14 1649.34 33.93 3 3 172.94 3.56 114 22 4861.31
12-Apr-18 39 17 1069.18 69.02 36 13 480.00 30.98 0 0 0.00 0.00 75 22 1549.18
13-Apr-18 11 8 141.45 12.87 34 13 958.00 87.13 0 0 0.00 0.00 45 16 1099.45
16-Apr-18 9 6 221.58 29.80 23 11 522.04 70.20 0 0 0.00 0.00 32 17 743.62
17-Apr-18 21 12 2923.39 72.35 38 12 1117.00 27.65 6 5 2539.47 62.85 59 24 4040.39
18-Apr-18 49 13 4456.71 63.30 73 11 2584.46 36.70 8 5 784.18 11.14 122 24 7041.16
19-Apr-18 22 11 357.38 39.82 29 4 540.00 60.18 2 2 137.88 15.36 51 15 897.38
20-Apr-18 5 5 56.50 9.89 22 10 515.00 90.11 0 0 0.00 0.00 27 15 571.50
23-Apr-18 17 10 712.90 61.04 12 9 455.00 38.96 2 1 250.00 21.41 29 17 1167.90
24-Apr-18 20 13 1849.41 69.15 31 9 825.00 30.85 8 4 1140.00 42.63 51 20 2674.40
25-Apr-18 59 11 4943.52 68.45 75 16 2278.49 31.55 2 2 70.17 0.97 134 21 7222.01
26-Apr-18 28 14 858.08 27.39 39 8 2275.00 72.61 5 4 540.00 17.24 67 16 3133.08
27-Apr-18 8 5 315.00 26.95 25 7 853.70 73.05 0 0 0.00 0.00 33 9 1168.70
Total 476 31614 771 22762 54 7370 1,247 54376
Average 25 11 1664 41 11 1198 3 2 388 66 18 2862
PercentMarket Share
58.14 41.86 13.55
103
CCIL Monthly Newsletter
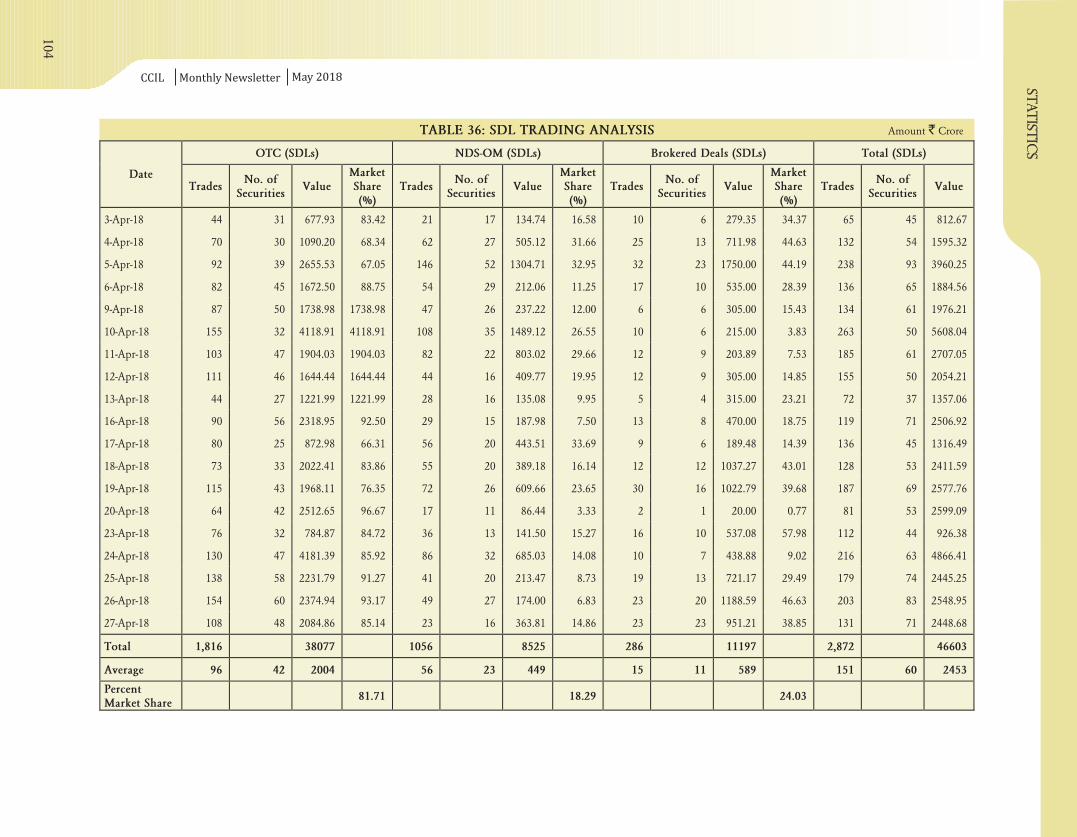
TABLE 36: SDL TRADING ANALYSIS Amount Crore`
statis
tic
s
May 2018
OTC (SDLs) NDS-OM (SDLs) Brokered Deals (SDLs) Total (SDLs)
DateTrades
No. ofSecurities
ValueMarketShare(%)
TradesNo. of
SecuritiesValue
MarketShare(%)
TradesNo. of
SecuritiesValue
MarketShare(%)
TradesNo. of
SecuritiesValue
3-Apr-18 44 31 677.93 83.42 21 17 134.74 16.58 10 6 279.35 34.37 65 45 812.67
4-Apr-18 70 30 1090.20 68.34 62 27 505.12 31.66 25 13 711.98 44.63 132 54 1595.32
5-Apr-18 92 39 2655.53 67.05 146 52 1304.71 32.95 32 23 1750.00 44.19 238 93 3960.25
6-Apr-18 82 45 1672.50 88.75 54 29 212.06 11.25 17 10 535.00 28.39 136 65 1884.56
9-Apr-18 87 50 1738.98 1738.98 47 26 237.22 12.00 6 6 305.00 15.43 134 61 1976.21
10-Apr-18 155 32 4118.91 4118.91 108 35 1489.12 26.55 10 6 215.00 3.83 263 50 5608.04
11-Apr-18 103 47 1904.03 1904.03 82 22 803.02 29.66 12 9 203.89 7.53 185 61 2707.05
12-Apr-18 111 46 1644.44 1644.44 44 16 409.77 19.95 12 9 305.00 14.85 155 50 2054.21
13-Apr-18 44 27 1221.99 1221.99 28 16 135.08 9.95 5 4 315.00 23.21 72 37 1357.06
16-Apr-18 90 56 2318.95 92.50 29 15 187.98 7.50 13 8 470.00 18.75 119 71 2506.92
17-Apr-18 80 25 872.98 66.31 56 20 443.51 33.69 9 6 189.48 14.39 136 45 1316.49
18-Apr-18 73 33 2022.41 83.86 55 20 389.18 16.14 12 12 1037.27 43.01 128 53 2411.59
19-Apr-18 115 43 1968.11 76.35 72 26 609.66 23.65 30 16 1022.79 39.68 187 69 2577.76
20-Apr-18 64 42 2512.65 96.67 17 11 86.44 3.33 2 1 20.00 0.77 81 53 2599.09
23-Apr-18 76 32 784.87 84.72 36 13 141.50 15.27 16 10 537.08 57.98 112 44 926.38
24-Apr-18 130 47 4181.39 85.92 86 32 685.03 14.08 10 7 438.88 9.02 216 63 4866.41
25-Apr-18 138 58 2231.79 91.27 41 20 213.47 8.73 19 13 721.17 29.49 179 74 2445.25
26-Apr-18 154 60 2374.94 93.17 49 27 174.00 6.83 23 20 1188.59 46.63 203 83 2548.95
27-Apr-18 108 48 2084.86 85.14 23 16 363.81 14.86 23 23 951.21 38.85 131 71 2448.68
Total 1,816 38077 1056 8525 286 11197 2,872 46603
Average 96 42 2004 56 23 449 15 11 589 151 60 2453
PercentMarket Share
81.71 18.29 24.03
104

CC
ILM
on
thly
Ne
wsl
ett
er
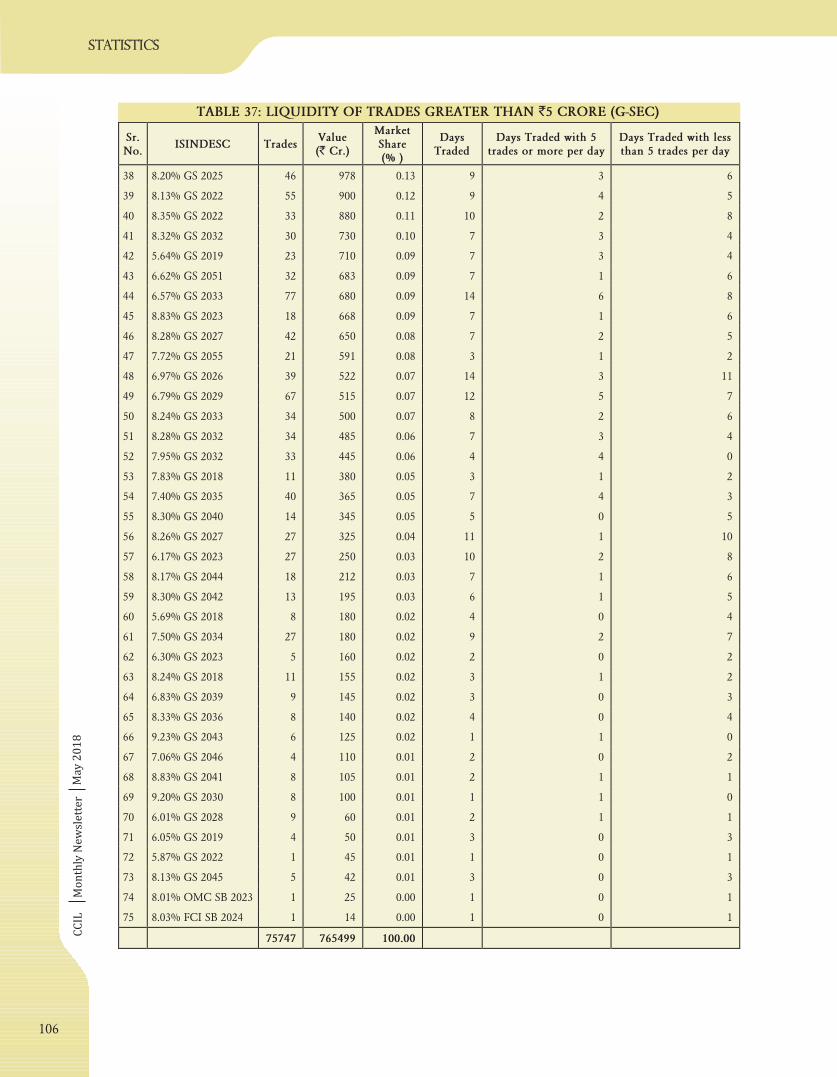
TABLE 3 : LIQUIDITY OF TRADES GREATER THAN 5 CRORE (G-SEC)7 `
statistics
Ma
y 2
01
8
Sr.No.
ISINDESC TradesValue(` Cr.)
MarketShare(% )
DaysTraded
Days Traded with 5trades or more per day
Days Traded with lessthan 5 trades per day
1 7.17% GS 2028 37494 339925 44.41 20 20 0
2 6.68% GS 2031 17634 157292 20.55 20 20 0
3 6.79% GS 2027 11841 108890 14.22 20 20 0
4 6.84% GS 2022 1310 17194 2.25 20 19 1
5 8.20% GS 2022 1052 16460 2.15 20 19 1
6 8.15% GS 2022 722 14325 1.87 20 19 1
7 8.12% GS 2020 298 11250 1.47 20 15 5
8 7.80% GS 2020 272 7305 0.95 20 15 5
9 7.16% GS 2023 487 6699 0.88 20 18 2
10 7.80% GS 2021 276 4807 0.63 20 15 5
11 7.94% GS 2021 163 4782 0.62 20 10 10
12 6.05% GS 2019 292 4700 0.61 20 14 6
13 7.37% GS 2023 305 4536 0.59 11 10 1
14 8.27% GS 2020 188 4047 0.53 19 12 7
15 8.33% GS 2026 187 3740 0.49 16 12 4
16 8.40% GS 2024 162 3611 0.47 17 9 8
17 8.79% GS 2021 177 3350 0.44 16 12 4
18 8.19% GS 2020 53 2795 0.37 10 3 7
19 7.88% GS 2030 169 2777 0.36 15 11 4
20 6.90% GS 2019 80 2560 0.33 13 7 6
21 7.61% GS 2030 166 2350 0.31 17 13 4
22 8.15% GS 2026 72 2305 0.30 14 6 8
23 7.28% GS 2019 149 2292 0.30 20 10 10
24 6.35% GS 2020 155 2155 0.28 20 10 10
25 FRB 2024 21 2060 0.27 7 1 6
26 7.35% GS 2024 147 1986 0.26 17 14 3
27 8.60% GS 2028 63 1916 0.25 7 4 3
28 7.59% GS 2026 101 1835 0.24 14 7 7
29 7.68% GS 2023 136 1801 0.24 16 12 4
30 9.15% GS 2024 52 1785 0.23 6 4 2
31 8.08% GS 2022 99 1739 0.23 16 5 11
32 7.72% GS 2025 135 1688 0.22 18 11 7
33 7.59% GS 2029 127 1604 0.21 12 7 5
34 8.24% GS 2027 99 1591 0.21 14 6 8
35 8.97% GS 2030 46 1440 0.19 8 4 4
36 6.65% GS 2020 82 1222 0.16 7 5 2
37 7.73% GS 2034 86 1039 0.14 12 8 4
105
CC
ILM
on
thly
Ne
wsl
ett
er
TABLE 3 : LIQUIDITY OF TRADES GREATER THAN 5 CRORE (G-SEC)7 `
statistics
Ma
y 2
01
8
Sr.No.
ISINDESC TradesValue(` Cr.)
MarketShare(% )
DaysTraded
Days Traded with 5trades or more per day
Days Traded with lessthan 5 trades per day
38 8.20% GS 2025 46 978 0.13 9 3 6
39 8.13% GS 2022 55 900 0.12 9 4 5
40 8.35% GS 2022 33 880 0.11 10 2 8
41 8.32% GS 2032 30 730 0.10 7 3 4
42 5.64% GS 2019 23 710 0.09 7 3 4
43 6.62% GS 2051 32 683 0.09 7 1 6
44 6.57% GS 2033 77 680 0.09 14 6 8
45 8.83% GS 2023 18 668 0.09 7 1 6
46 8.28% GS 2027 42 650 0.08 7 2 5
47 7.72% GS 2055 21 591 0.08 3 1 2
48 6.97% GS 2026 39 522 0.07 14 3 11
49 6.79% GS 2029 67 515 0.07 12 5 7
50 8.24% GS 2033 34 500 0.07 8 2 6
51 8.28% GS 2032 34 485 0.06 7 3 4
52 7.95% GS 2032 33 445 0.06 4 4 0
53 7.83% GS 2018 11 380 0.05 3 1 2
54 7.40% GS 2035 40 365 0.05 7 4 3
55 8.30% GS 2040 14 345 0.05 5 0 5
56 8.26% GS 2027 27 325 0.04 11 1 10
57 6.17% GS 2023 27 250 0.03 10 2 8
58 8.17% GS 2044 18 212 0.03 7 1 6
59 8.30% GS 2042 13 195 0.03 6 1 5
60 5.69% GS 2018 8 180 0.02 4 0 4
61 7.50% GS 2034 27 180 0.02 9 2 7
62 6.30% GS 2023 5 160 0.02 2 0 2
63 8.24% GS 2018 11 155 0.02 3 1 2
64 6.83% GS 2039 9 145 0.02 3 0 3
65 8.33% GS 2036 8 140 0.02 4 0 4
66 9.23% GS 2043 6 125 0.02 1 1 0
67 7.06% GS 2046 4 110 0.01 2 0 2
68 8.83% GS 2041 8 105 0.01 2 1 1
69 9.20% GS 2030 8 100 0.01 1 1 0
70 6.01% GS 2028 9 60 0.01 2 1 1
71 6.05% GS 2019 4 50 0.01 3 0 3
72 5.87% GS 2022 1 45 0.01 1 0 1
73 8.13% GS 2045 5 42 0.01 3 0 3
74 8.01% OMC SB 2023 1 25 0.00 1 0 1
75 8.03% FCI SB 2024 1 14 0.00 1 0 1
75747 765499 100.00
106
CC
ILM
on
thly
Ne
wsl
ett
er
statistics
Ma
y 2
01
8
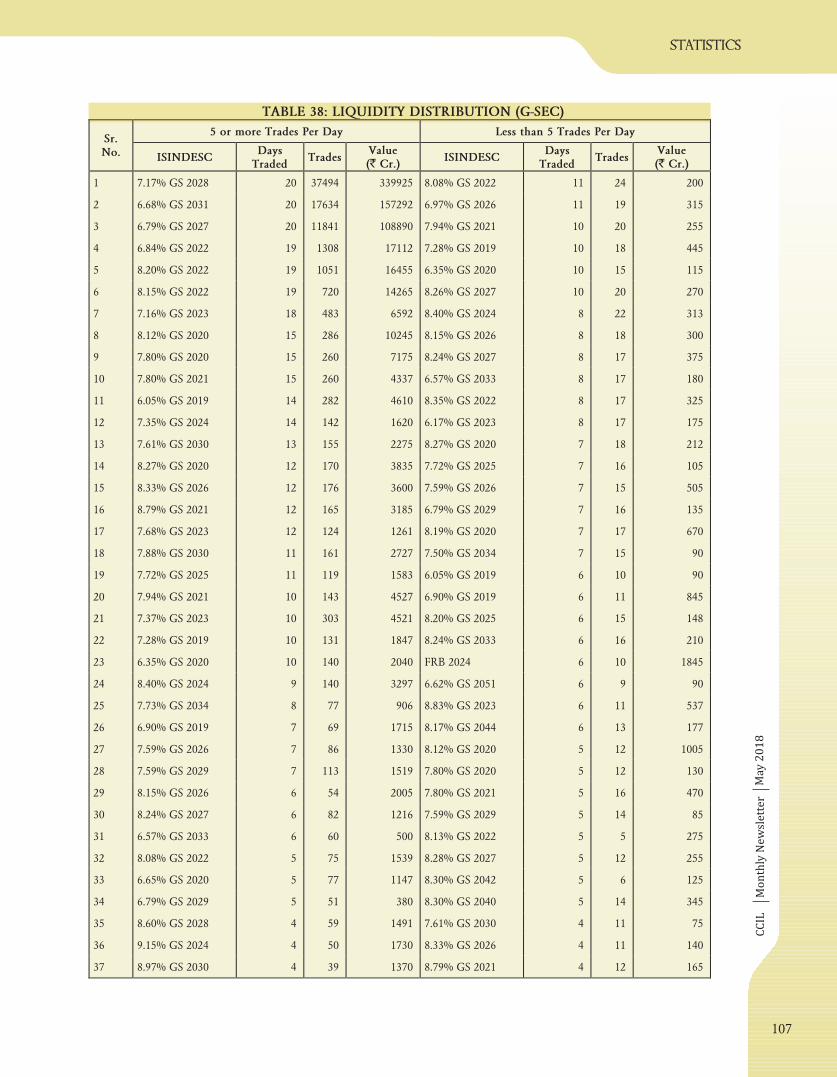
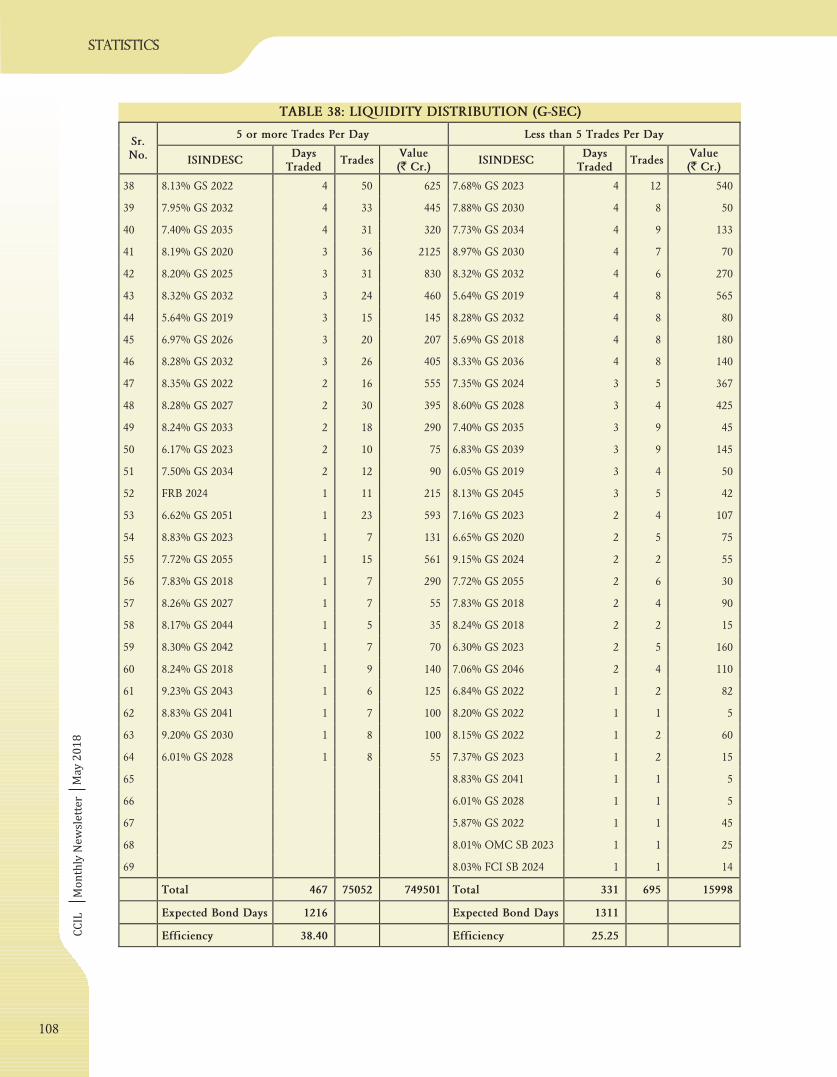
TABLE 38: LIQUIDITY DISTRIBUTION (G-SEC)
5 or more Trades Per Day Less than 5 Trades Per DaySr.No. ISINDESC
DaysTraded
TradesValue(` Cr.)
ISINDESCDays
TradedTrades
Value(` Cr.)
1 7.17% GS 2028 20 37494 339925 8.08% GS 2022 11 24 200
2 6.68% GS 2031 20 17634 157292 6.97% GS 2026 11 19 315
3 6.79% GS 2027 20 11841 108890 7.94% GS 2021 10 20 255
4 6.84% GS 2022 19 1308 17112 7.28% GS 2019 10 18 445
5 8.20% GS 2022 19 1051 16455 6.35% GS 2020 10 15 115
6 8.15% GS 2022 19 720 14265 8.26% GS 2027 10 20 270
7 7.16% GS 2023 18 483 6592 8.40% GS 2024 8 22 313
8 8.12% GS 2020 15 286 10245 8.15% GS 2026 8 18 300
9 7.80% GS 2020 15 260 7175 8.24% GS 2027 8 17 375
10 7.80% GS 2021 15 260 4337 6.57% GS 2033 8 17 180
11 6.05% GS 2019 14 282 4610 8.35% GS 2022 8 17 325
12 7.35% GS 2024 14 142 1620 6.17% GS 2023 8 17 175
13 7.61% GS 2030 13 155 2275 8.27% GS 2020 7 18 212
14 8.27% GS 2020 12 170 3835 7.72% GS 2025 7 16 105
15 8.33% GS 2026 12 176 3600 7.59% GS 2026 7 15 505
16 8.79% GS 2021 12 165 3185 6.79% GS 2029 7 16 135
17 7.68% GS 2023 12 124 1261 8.19% GS 2020 7 17 670
18 7.88% GS 2030 11 161 2727 7.50% GS 2034 7 15 90
19 7.72% GS 2025 11 119 1583 6.05% GS 2019 6 10 90
20 7.94% GS 2021 10 143 4527 6.90% GS 2019 6 11 845
21 7.37% GS 2023 10 303 4521 8.20% GS 2025 6 15 148
22 7.28% GS 2019 10 131 1847 8.24% GS 2033 6 16 210
23 6.35% GS 2020 10 140 2040 FRB 2024 6 10 1845
24 8.40% GS 2024 9 140 3297 6.62% GS 2051 6 9 90
25 7.73% GS 2034 8 77 906 8.83% GS 2023 6 11 537
26 6.90% GS 2019 7 69 1715 8.17% GS 2044 6 13 177
27 7.59% GS 2026 7 86 1330 8.12% GS 2020 5 12 1005
28 7.59% GS 2029 7 113 1519 7.80% GS 2020 5 12 130
29 8.15% GS 2026 6 54 2005 7.80% GS 2021 5 16 470
30 8.24% GS 2027 6 82 1216 7.59% GS 2029 5 14 85
31 6.57% GS 2033 6 60 500 8.13% GS 2022 5 5 275
32 8.08% GS 2022 5 75 1539 8.28% GS 2027 5 12 255
33 6.65% GS 2020 5 77 1147 8.30% GS 2042 5 6 125
34 6.79% GS 2029 5 51 380 8.30% GS 2040 5 14 345
35 8.60% GS 2028 4 59 1491 7.61% GS 2030 4 11 75
36 9.15% GS 2024 4 50 1730 8.33% GS 2026 4 11 140
37 8.97% GS 2030 4 39 1370 8.79% GS 2021 4 12 165
107
CC
ILM
on
thly
Ne
wsl
ett
er
Ma
y 2
01
8
TABLE 38: LIQUIDITY DISTRIBUTION (G-SEC)
5 or more Trades Per Day Less than 5 Trades Per DaySr.No. ISINDESC
DaysTraded
TradesValue(` Cr.)
ISINDESCDays
TradedTrades
Value(` Cr.)
38 8.13% GS 2022 4 50 625 7.68% GS 2023 4 12 540
39 7.95% GS 2032 4 33 445 7.88% GS 2030 4 8 50
40 7.40% GS 2035 4 31 320 7.73% GS 2034 4 9 133
41 8.19% GS 2020 3 36 2125 8.97% GS 2030 4 7 70
42 8.20% GS 2025 3 31 830 8.32% GS 2032 4 6 270
43 8.32% GS 2032 3 24 460 5.64% GS 2019 4 8 565
44 5.64% GS 2019 3 15 145 8.28% GS 2032 4 8 80
45 6.97% GS 2026 3 20 207 5.69% GS 2018 4 8 180
46 8.28% GS 2032 3 26 405 8.33% GS 2036 4 8 140
47 8.35% GS 2022 2 16 555 7.35% GS 2024 3 5 367
48 8.28% GS 2027 2 30 395 8.60% GS 2028 3 4 425
49 8.24% GS 2033 2 18 290 7.40% GS 2035 3 9 45
50 6.17% GS 2023 2 10 75 6.83% GS 2039 3 9 145
51 7.50% GS 2034 2 12 90 6.05% GS 2019 3 4 50
52 FRB 2024 1 11 215 8.13% GS 2045 3 5 42
53 6.62% GS 2051 1 23 593 7.16% GS 2023 2 4 107
54 8.83% GS 2023 1 7 131 6.65% GS 2020 2 5 75
55 7.72% GS 2055 1 15 561 9.15% GS 2024 2 2 55
56 7.83% GS 2018 1 7 290 7.72% GS 2055 2 6 30
57 8.26% GS 2027 1 7 55 7.83% GS 2018 2 4 90
58 8.17% GS 2044 1 5 35 8.24% GS 2018 2 2 15
59 8.30% GS 2042 1 7 70 6.30% GS 2023 2 5 160
60 8.24% GS 2018 1 9 140 7.06% GS 2046 2 4 110
61 9.23% GS 2043 1 6 125 6.84% GS 2022 1 2 82
62 8.83% GS 2041 1 7 100 8.20% GS 2022 1 1 5
63 9.20% GS 2030 1 8 100 8.15% GS 2022 1 2 60
64 6.01% GS 2028 1 8 55 7.37% GS 2023 1 2 15
65 8.83% GS 2041 1 1 5
66 6.01% GS 2028 1 1 5
67 5.87% GS 2022 1 1 45
68 8.01% OMC SB 2023 1 1 25
69 8.03% FCI SB 2024 1 1 14
Total 467 75052 749501 Total 331 695 15998
Expected Bond Days 1216 Expected Bond Days 1311
Efficiency 38.40 Efficiency 25.25
108
statistics
CC
ILM
on
thly
Ne
wsl
ett
er
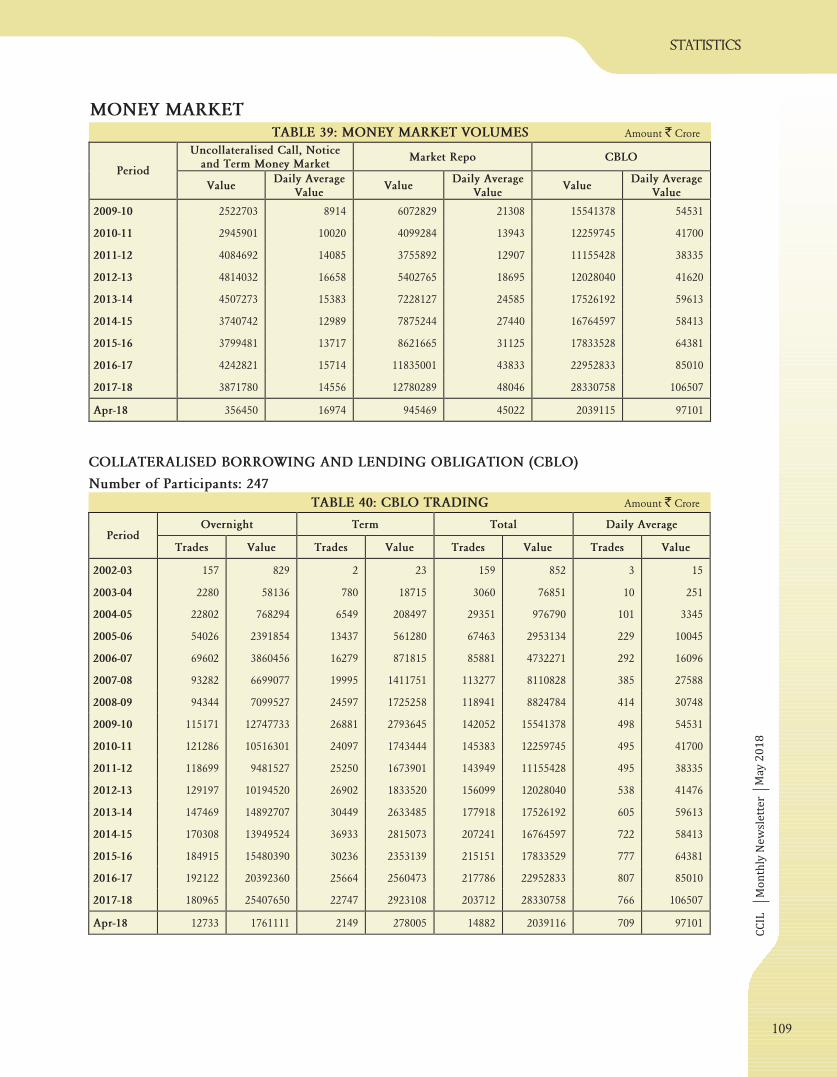
Amount Crore`TABLE 39: MONEY MARKET VOLUMES
statistics
MONEY MARKET
Ma
y 2
01
8
COLLATERALISED BORROWING AND LENDING OBLIGATION (CBLO)
Number of Participants: 247
TABLE 40: CBLO TRADING Amount Crore`
Overnight Term Total Daily AveragePeriod
Trades Value Trades Value Trades Value Trades Value
2002-03 157 829 2 23 159 852 3 15
2003-04 2280 58136 780 18715 3060 76851 10 251
2004-05 22802 768294 6549 208497 29351 976790 101 3345
2005-06 54026 2391854 13437 561280 67463 2953134 229 10045
2006-07 69602 3860456 16279 871815 85881 4732271 292 16096
2007-08 93282 6699077 19995 1411751 113277 8110828 385 27588
2008-09 94344 7099527 24597 1725258 118941 8824784 414 30748
2009-10 115171 12747733 26881 2793645 142052 15541378 498 54531
2010-11 121286 10516301 24097 1743444 145383 12259745 495 41700
2011-12 118699 9481527 25250 1673901 143949 11155428 495 38335
2012-13 129197 10194520 26902 1833520 156099 12028040 538 41476
2013-14 147469 14892707 30449 2633485 177918 17526192 605 59613
2014-15 170308 13949524 36933 2815073 207241 16764597 722 58413
2015-16 184915 15480390 30236 2353139 215151 17833529 777 64381
2016-17 192122 20392360 25664 2560473 217786 22952833 807 85010
2017-18 180965 25407650 22747 2923108 203712 28330758 766 106507
Apr-18 12733 1761111 2149 278005 14882 2039116 709 97101
Uncollateralised Call, Noticeand Term Money Market
Market Repo CBLOPeriod
ValueDaily Average
ValueValue
Daily AverageValue
ValueDaily Average
Value
2009-10 2522703 8914 6072829 21308 15541378 54531
2010-11 2945901 10020 4099284 13943 12259745 41700
2011-12 4084692 14085 3755892 12907 11155428 38335
2012-13 4814032 16658 5402765 18695 12028040 41620
2013-14 4507273 15383 7228127 24585 17526192 59613
2014-15 3740742 12989 7875244 27440 16764597 58413
2015-16 3799481 13717 8621665 31125 17833528 64381
2016-17 4242821 15714 11835001 43833 22952833 85010
2017-18 3871780 14556 12780289 48046 28330758 106507
Apr-18 356450 16974 945469 45022 2039115 97101
109
CC
ILM
on
thly
Ne
wsl
ett
er
statistics
Ma
y 2
01
8
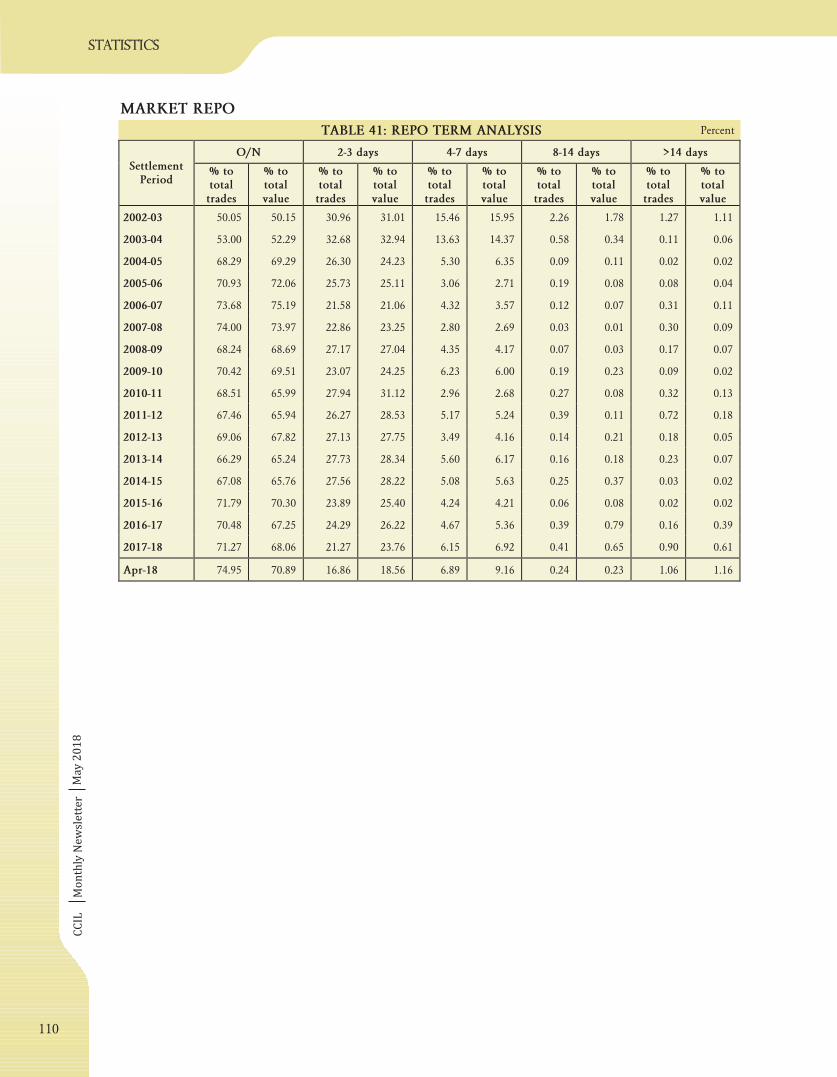
MARKET REPO
TABLE 41: REPO TERM ANALYSIS Percent
O/N 2-3 days 4-7 days 8-14 days >14 daysSettlement
Period% tototaltrades
% tototalvalue
% tototaltrades
% tototalvalue
% tototaltrades
% tototalvalue
% tototaltrades
% tototalvalue
% tototaltrades
% tototalvalue
2002-03 50.05 50.15 30.96 31.01 15.46 15.95 2.26 1.78 1.27 1.11
2003-04 53.00 52.29 32.68 32.94 13.63 14.37 0.58 0.34 0.11 0.06
2004-05 68.29 69.29 26.30 24.23 5.30 6.35 0.09 0.11 0.02 0.02
2005-06 70.93 72.06 25.73 25.11 3.06 2.71 0.19 0.08 0.08 0.04
2006-07 73.68 75.19 21.58 21.06 4.32 3.57 0.12 0.07 0.31 0.11
2007-08 74.00 73.97 22.86 23.25 2.80 2.69 0.03 0.01 0.30 0.09
2008-09 68.24 68.69 27.17 27.04 4.35 4.17 0.07 0.03 0.17 0.07
2009-10 70.42 69.51 23.07 24.25 6.23 6.00 0.19 0.23 0.09 0.02
2010-11 68.51 65.99 27.94 31.12 2.96 2.68 0.27 0.08 0.32 0.13
2011-12 67.46 65.94 26.27 28.53 5.17 5.24 0.39 0.11 0.72 0.18
2012-13 69.06 67.82 27.13 27.75 3.49 4.16 0.14 0.21 0.18 0.05
2013-14 66.29 65.24 27.73 28.34 5.60 6.17 0.16 0.18 0.23 0.07
2014-15 67.08 65.76 27.56 28.22 5.08 5.63 0.25 0.37 0.03 0.02
2015-16 71.79 70.30 23.89 25.40 4.24 4.21 0.06 0.08 0.02 0.02
2016-17 70.48 67.25 24.29 26.22 4.67 5.36 0.39 0.79 0.16 0.39
2017-18 71.27 68.06 21.27 23.76 6.15 6.92 0.41 0.65 0.90 0.61
Apr-18 74.95 70.89 16.86 18.56 6.89 9.16 0.24 0.23 1.06 1.16
110
CC
ILM
on
thly
Ne
wsl
ett
er
statistics
Ma
y 2
01
8
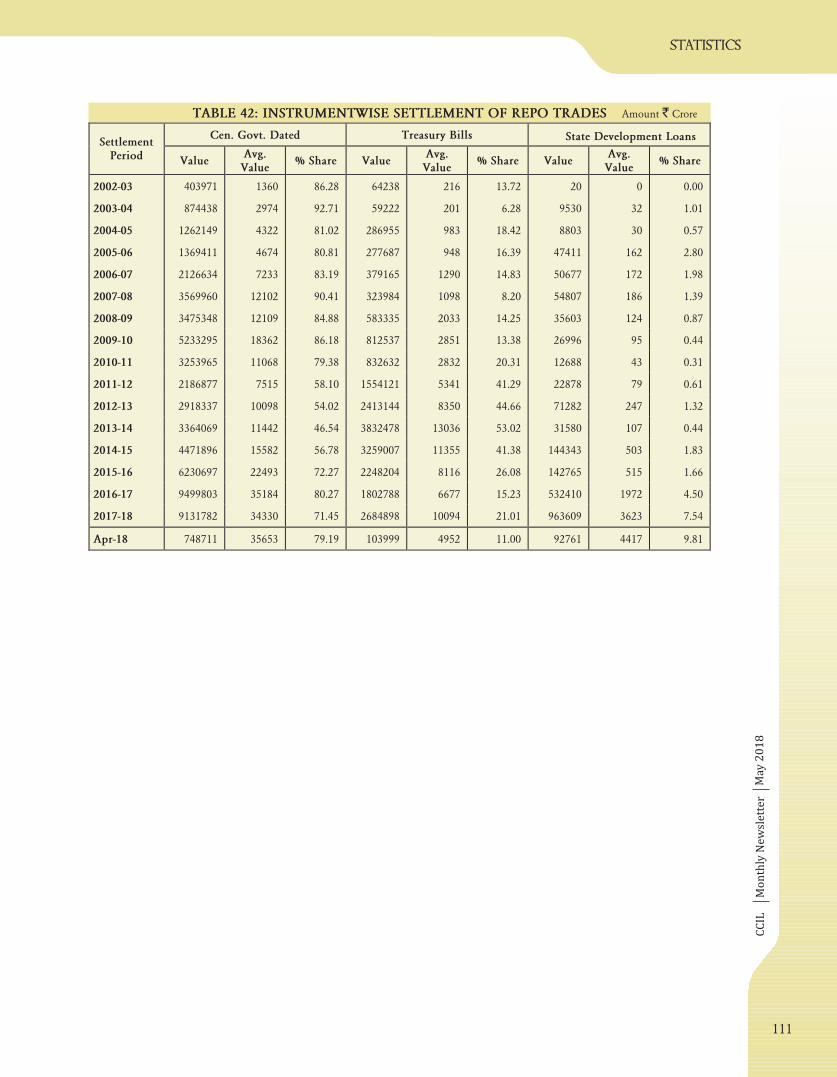
TABLE 42: INSTRUMENTWISE SETTLEMENT OF REPO TRADES Amount Crore`
State Development LoansCen. Govt. Dated Treasury BillsSettlement
Period ValueAvg.Value
% Share ValueAvg.Value
% Share ValueAvg.Value
% Share
2002-03 403971 1360 86.28 64238 216 13.72 20 0 0.00
2003-04 874438 2974 92.71 59222 201 6.28 9530 32 1.01
2004-05 1262149 4322 81.02 286955 983 18.42 8803 30 0.57
2005-06 1369411 4674 80.81 277687 948 16.39 47411 162 2.80
2006-07 2126634 7233 83.19 379165 1290 14.83 50677 172 1.98
2007-08 3569960 12102 90.41 323984 1098 8.20 54807 186 1.39
2008-09 3475348 12109 84.88 583335 2033 14.25 35603 124 0.87
2009-10 5233295 18362 86.18 812537 2851 13.38 26996 95 0.44
2010-11 3253965 11068 79.38 832632 2832 20.31 12688 43 0.31
2011-12 2186877 7515 58.10 1554121 5341 41.29 22878 79 0.61
2012-13 2918337 10098 54.02 2413144 8350 44.66 71282 247 1.32
2013-14 3364069 11442 46.54 3832478 13036 53.02 31580 107 0.44
2014-15 4471896 15582 56.78 3259007 11355 41.38 144343 503 1.83
2015-16 6230697 22493 72.27 2248204 8116 26.08 142765 515 1.66
2016-17 9499803 35184 80.27 1802788 6677 15.23 532410 1972 4.50
2017-18 9131782 34330 71.45 2684898 10094 21.01 963609 3623 7.54
Apr-18 748711 35653 79.19 103999 4952 11.00 92761 4417 9.81
111

CC
ILM
on
thly
Ne
wsl
ett
er
statistics
Ma
y 2
01
8
TABLE 43: CROMS TRADING ACTIVITY
Number of Participants: 154 Amount Crore`
CROMS Special CROMS Basket CROMS - Total Repo
DateTrades Value WAR Trades Value WAR Trades Value WAR Trades Value WAR
% Shareof
CROMSin Repovolumes
3-Apr-18 207 14258 5.7669 96 14519 5.8519 303 28777 5.8098 318 31472 5.8065 91.44
4-Apr-18 210 13996 5.7458 116 18084 5.8692 326 32080 5.8153 338 34612 5.8063 92.68
5-Apr-18 217 13114 5.7212 111 16111 5.8217 328 29225 5.7766 340 31707 5.7751 92.17
6-Apr-18 223 16552 5.7698 138 19352 5.8741 361 35904 5.8260 370 38353 5.8200 93.61
9-Apr-18 209 16181 5.8229 138 24809 5.9170 347 40990 5.8799 358 43448 5.8766 94.34
10-Apr-18 249 16378 5.8998 181 33495 5.9849 430 49873 5.9570 439 52303 5.9481 95.35
11-Apr-18 223 15561 5.7970 125 21998 5.9667 348 37559 5.8964 357 39898 5.8901 94.14
12-Apr-18 235 16807 5.6565 111 19494 5.9082 346 36301 5.7916 356 38463 5.7916 94.38
13-Apr-18 255 22748 5.7619 264 60115 5.9131 519 82863 5.8716 533 85762 5.8705 96.62
16-Apr-18 230 17845 5.7460 138 20917 5.9481 368 38762 5.8551 383 41341 5.8538 93.76
17-Apr-18 263 19067 5.7951 117 19376 5.9390 380 38443 5.8676 394 40863 5.8729 84.90
18-Apr-18 252 19537 5.7832 100 15155 5.9257 352 34692 5.8455 364 37111 5.8479 103.59
19-Apr-18 256 20136 5.7678 118 20259 5.9437 374 40395 5.8560 385 43004 5.8520 93.93
20-Apr-18 268 19574 5.8026 138 30208 5.9950 406 49782 5.9193 417 52276 5.9172 95.23
23-Apr-18 316 21919 5.7391 143 25185 5.9722 459 47104 5.8637 470 49615 5.8522 94.94
24-Apr-18 307 21975 5.7415 161 34149 5.9755 468 56124 5.8839 479 58527 5.8816 95.89
25-Apr-18 298 22539 5.6462 199 45614 5.9409 497 68153 5.8435 507 70018 5.8417 97.34
26-Apr-18 286 21910 5.5823 181 46273 5.9571 467 68183 5.8366 478 70343 5.8384 96.93
27-Apr-18 251 20928 5.6147 268 62178 5.9921 519 83106 5.8971 534 86134 5.8951 96.48
Total 4755 351025 2843 547290 7598 898315 7820 945252 95.03
112
CC
ILM
on
thly
Ne
wsl
ett
er
statistics
Ma
y 2
01
8
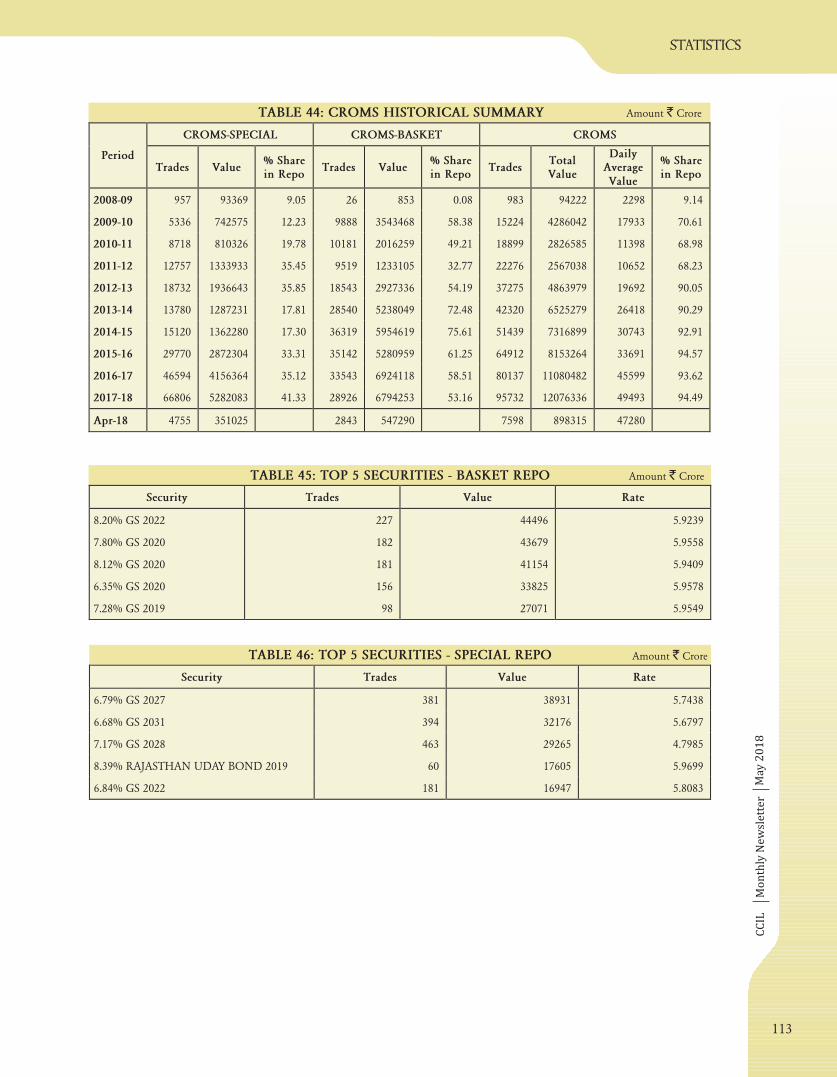
TABLE 45: TOP 5 SECURITIES - BASKET REPO
TABLE 46: TOP 5 SECURITIES - SPECIAL REPO
Amount Crore`
Amount Crore`
TABLE 44: CROMS HISTORICAL SUMMARY Amount Crore`
CROMS-SPECIAL CROMS-BASKET CROMS
PeriodTrades Value
% Sharein Repo
Trades Value% Sharein Repo
TradesTotalValue
DailyAverageValue
% Sharein Repo
2008-09 957 93369 9.05 26 853 0.08 983 94222 2298 9.14
2009-10 5336 742575 12.23 9888 3543468 58.38 15224 4286042 17933 70.61
2010-11 8718 810326 19.78 10181 2016259 49.21 18899 2826585 11398 68.98
2011-12 12757 1333933 35.45 9519 1233105 32.77 22276 2567038 10652 68.23
2012-13 18732 1936643 35.85 18543 2927336 54.19 37275 4863979 19692 90.05
2013-14 13780 1287231 17.81 28540 5238049 72.48 42320 6525279 26418 90.29
2014-15 15120 1362280 17.30 36319 5954619 75.61 51439 7316899 30743 92.91
2015-16 29770 2872304 33.31 35142 5280959 61.25 64912 8153264 33691 94.57
2016-17 46594 4156364 35.12 33543 6924118 58.51 80137 11080482 45599 93.62
2017-18 66806 5282083 41.33 28926 6794253 53.16 95732 12076336 49493 94.49
Apr-18 4755 351025 2843 547290 7598 898315 47280
Security Trades Value Rate
8.20% GS 2022 227 44496 5.9239
7.80% GS 2020 182 43679 5.9558
8.12% GS 2020 181 41154 5.9409
6.35% GS 2020 156 33825 5.9578
7.28% GS 2019 98 27071 5.9549
Security Trades Value Rate
6.79% GS 2027 381 38931 5.7438
6.68% GS 2031 394 32176 5.6797
7.17% GS 2028 463 29265 4.7985
8.39% RAJASTHAN UDAY BOND 2019 60 17605 5.9699
6.84% GS 2022 181 16947 5.8083
113

CC
ILM
on
thly
Ne
wsl
ett
er
statistics
Ma
y 2
01
8
TABLE 47: DEALT TRANSACTIONS ON THE NDS-CALL PLATFORM
CALL MONEY MARKET
Amount Crore`
CALL NOTICE TERM TOTALDate
Trade Value WAR Trade Value WAR Trade Value WAR Trade Value
3-Apr-18 152 14287 5.9424 - - - 23 2100 6.3919 175 16387
4-Apr-18 153 14180 5.9615 - - - 16 1075 6.6144 169 15255
5-Apr-18 161 16417 5.9595 1 25 5.7500 7 475 6.4247 169 16917
6-Apr-18 152 13237 5.9374 4 440 6.0114 13 550 6.2468 169 14227
7-Apr-18 18 1179 5.7989 - - - - - - 18 1179
9-Apr-18 182 16551 5.9527 2 200 6.0500 2 75 6.2900 186 16826
10-Apr-18 100 8507 5.9708 - - - 5 625 6.5220 105 9132
11-Apr-18 74 6162 5.9663 - - - 3 425 6.6000 77 6587
12-Apr-18 90 8168 5.9110 - - - 1 100 6.2500 91 8268
13-Apr-18 190 17414 5.8955 - - - 1 90 6.7500 191 17504
16-Apr-18 145 12413 6.0000 - - - 5 484 6.8949 150 12897
17-Apr-18 74 5647 5.9266 13 990 5.9841 3 55 6.2909 90 6692
18-Apr-18 100 7871 5.9491 1 2 5.8500 8 763 6.5705 109 8636
19-Apr-18 122 10108 6.0168 1 35 5.7500 4 70 6.2429 127 10213
20-Apr-18 136 12318 6.0254 2 20 5.7875 7 405 6.2821 145 12743
21-Apr-18 30 3023 5.9969 - - - - - - 30 3023
23-Apr-18 110 8570 6.0020 1 65 5.9000 8 360 6.3472 119 8995
24-Apr-18 94 9252 5.8704 1 200 6.0000 7 445 6.3528 102 9897
25-Apr-18 153 15469 5.9311 1 2 5.9000 10 1200 6.4833 164 16671
26-Apr-18 138 13694 5.9430 1 90 6.0000 6 605 6.5273 145 14389
27-Apr-18 278 36678 6.0497 - - - 2 75 6.4000 280 36753
Total 2652 251142 5.9664 28 2069 5.9870 131 9977 6.4754 2811 263188
114
CC
ILM
on
thly
Ne
wsl
ett
er
statistics
Ma
y 2
01
8
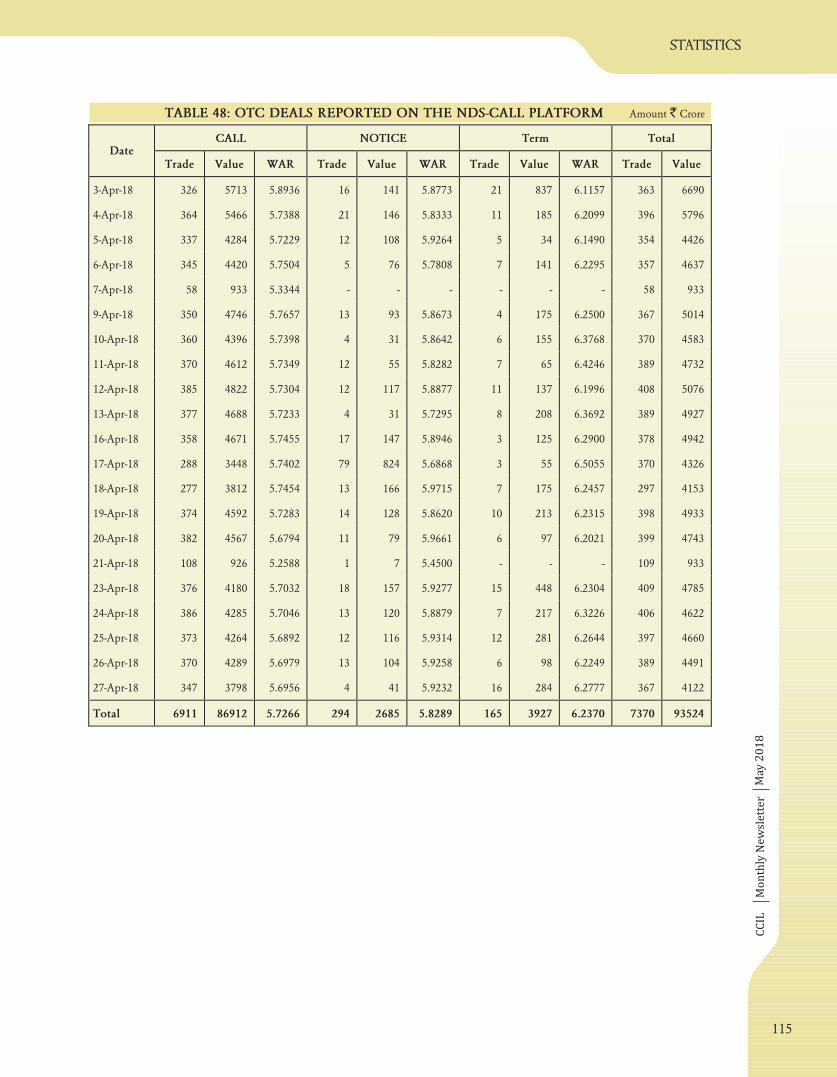
TABLE 48: OTC DEALS REPORTED ON THE NDS-CALL PLATFORM Amount Crore`
CALL NOTICE Term TotalDate
Trade Value WAR Trade Value WAR Trade Value WAR Trade Value
3-Apr-18 326 5713 5.8936 16 141 5.8773 21 837 6.1157 363 6690
4-Apr-18 364 5466 5.7388 21 146 5.8333 11 185 6.2099 396 5796
5-Apr-18 337 4284 5.7229 12 108 5.9264 5 34 6.1490 354 4426
6-Apr-18 345 4420 5.7504 5 76 5.7808 7 141 6.2295 357 4637
7-Apr-18 58 933 5.3344 - - - - - - 58 933
9-Apr-18 350 4746 5.7657 13 93 5.8673 4 175 6.2500 367 5014
10-Apr-18 360 4396 5.7398 4 31 5.8642 6 155 6.3768 370 4583
11-Apr-18 370 4612 5.7349 12 55 5.8282 7 65 6.4246 389 4732
12-Apr-18 385 4822 5.7304 12 117 5.8877 11 137 6.1996 408 5076
13-Apr-18 377 4688 5.7233 4 31 5.7295 8 208 6.3692 389 4927
16-Apr-18 358 4671 5.7455 17 147 5.8946 3 125 6.2900 378 4942
17-Apr-18 288 3448 5.7402 79 824 5.6868 3 55 6.5055 370 4326
18-Apr-18 277 3812 5.7454 13 166 5.9715 7 175 6.2457 297 4153
19-Apr-18 374 4592 5.7283 14 128 5.8620 10 213 6.2315 398 4933
20-Apr-18 382 4567 5.6794 11 79 5.9661 6 97 6.2021 399 4743
21-Apr-18 108 926 5.2588 1 7 5.4500 - - - 109 933
23-Apr-18 376 4180 5.7032 18 157 5.9277 15 448 6.2304 409 4785
24-Apr-18 386 4285 5.7046 13 120 5.8879 7 217 6.3226 406 4622
25-Apr-18 373 4264 5.6892 12 116 5.9314 12 281 6.2644 397 4660
26-Apr-18 370 4289 5.6979 13 104 5.9258 6 98 6.2249 389 4491
27-Apr-18 347 3798 5.6956 4 41 5.9232 16 284 6.2777 367 4122
Total 6911 86912 5.7266 294 2685 5.8289 165 3927 6.2370 7370 93524
115
CC
ILM
on
thly
Ne
wsl
ett
er
statistics
Ma
y 2
01
8
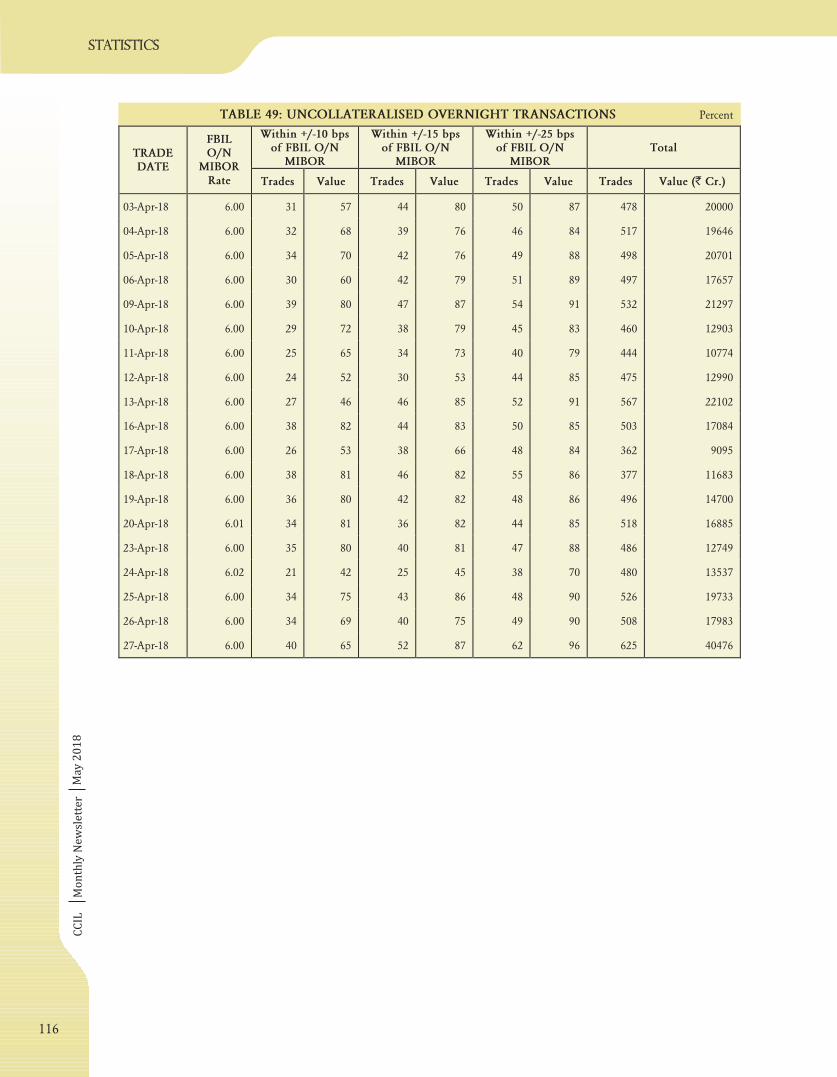
TABLE 49: UNCOLLATERALISED OVERNIGHT TRANSACTIONS Percent
Within +/-10 bpsof FBIL O/N
MIBOR
Within +/-15 bpsof FBIL O/N
MIBOR
Within +/-25 bpsof FBIL O/N
MIBORTotalTRADE
DATE
FBILO/N
MIBORRate Trades Value Trades Value Trades Value Trades Value (` Cr.)
03-Apr-18 6.00 31 57 44 80 50 87 478 20000
04-Apr-18 6.00 32 68 39 76 46 84 517 19646
05-Apr-18 6.00 34 70 42 76 49 88 498 20701
06-Apr-18 6.00 30 60 42 79 51 89 497 17657
09-Apr-18 6.00 39 80 47 87 54 91 532 21297
10-Apr-18 6.00 29 72 38 79 45 83 460 12903
11-Apr-18 6.00 25 65 34 73 40 79 444 10774
12-Apr-18 6.00 24 52 30 53 44 85 475 12990
13-Apr-18 6.00 27 46 46 85 52 91 567 22102
16-Apr-18 6.00 38 82 44 83 50 85 503 17084
17-Apr-18 6.00 26 53 38 66 48 84 362 9095
18-Apr-18 6.00 38 81 46 82 55 86 377 11683
19-Apr-18 6.00 36 80 42 82 48 86 496 14700
20-Apr-18 6.01 34 81 36 82 44 85 518 16885
23-Apr-18 6.00 35 80 40 81 47 88 486 12749
24-Apr-18 6.02 21 42 25 45 38 70 480 13537
25-Apr-18 6.00 34 75 43 86 48 90 526 19733
26-Apr-18 6.00 34 69 40 75 49 90 508 17983
27-Apr-18 6.00 40 65 52 87 62 96 625 40476
116
CC
ILM
on
thly
Ne
wsl
ett
er
statistics
Ma
y 2
01
8
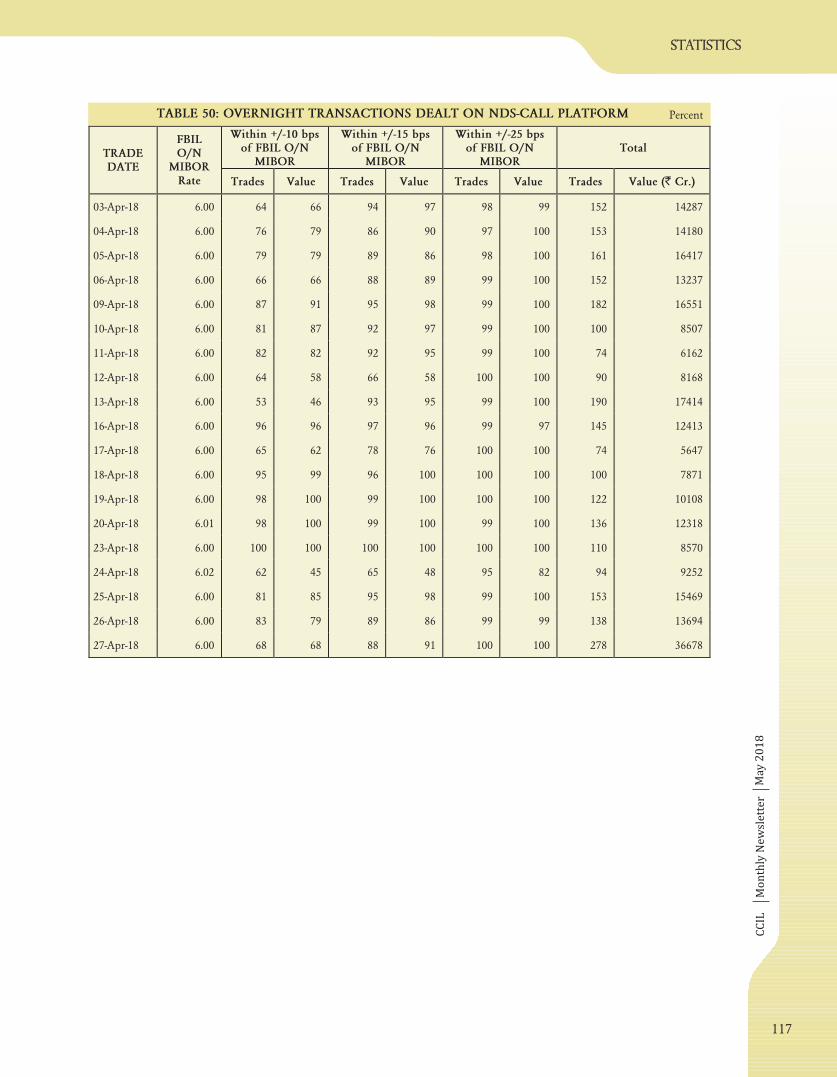
TABLE 50: OVERNIGHT TRANSACTIONS DEALT ON NDS-CALL PLATFORM Percent
Within +/-10 bpsof FBIL O/N
MIBOR
Within +/-15 bpsof FBIL O/N
MIBOR
Within +/-25 bpsof FBIL O/N
MIBORTotalTRADE
DATE
FBILO/N
MIBORRate Trades Value Trades Value Trades Value Trades Value (` Cr.)
03-Apr-18 6.00 64 66 94 97 98 99 152 14287
04-Apr-18 6.00 76 79 86 90 97 100 153 14180
05-Apr-18 6.00 79 79 89 86 98 100 161 16417
06-Apr-18 6.00 66 66 88 89 99 100 152 13237
09-Apr-18 6.00 87 91 95 98 99 100 182 16551
10-Apr-18 6.00 81 87 92 97 99 100 100 8507
11-Apr-18 6.00 82 82 92 95 99 100 74 6162
12-Apr-18 6.00 64 58 66 58 100 100 90 8168
13-Apr-18 6.00 53 46 93 95 99 100 190 17414
16-Apr-18 6.00 96 96 97 96 99 97 145 12413
17-Apr-18 6.00 65 62 78 76 100 100 74 5647
18-Apr-18 6.00 95 99 96 100 100 100 100 7871
19-Apr-18 6.00 98 100 99 100 100 100 122 10108
20-Apr-18 6.01 98 100 99 100 99 100 136 12318
23-Apr-18 6.00 100 100 100 100 100 100 110 8570
24-Apr-18 6.02 62 45 65 48 95 82 94 9252
25-Apr-18 6.00 81 85 95 98 99 100 153 15469
26-Apr-18 6.00 83 79 89 86 99 99 138 13694
27-Apr-18 6.00 68 68 88 91 100 100 278 36678
117
CC
ILM
on
thly
Ne
wsl
ett
er
statistics
Ma
y 2
01
8
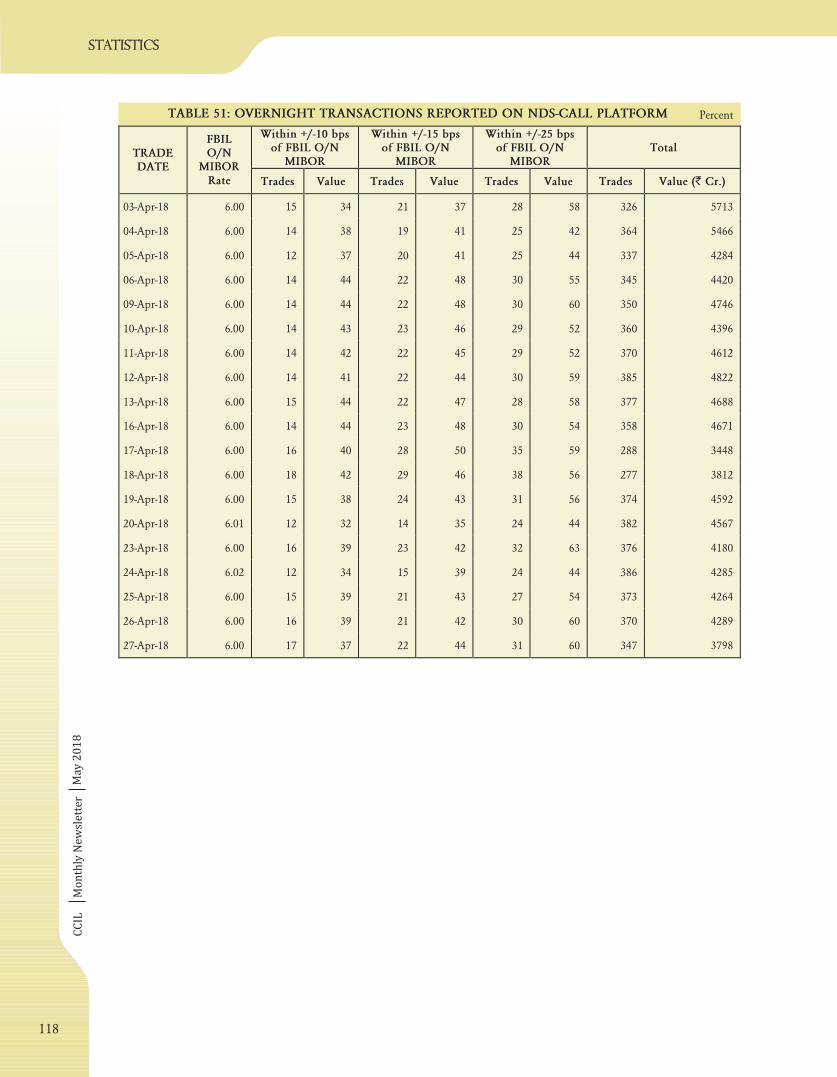
TABLE 51: OVERNIGHT TRANSACTIONS REPORTED ON NDS-CALL PLATFORM Percent
Within +/-10 bpsof FBIL O/N
MIBOR
Within +/-15 bpsof FBIL O/N
MIBOR
Within +/-25 bpsof FBIL O/N
MIBORTotalTRADE
DATE
FBILO/N
MIBORRate Trades Value Trades Value Trades Value Trades Value (` Cr.)
03-Apr-18 6.00 15 34 21 37 28 58 326 5713
04-Apr-18 6.00 14 38 19 41 25 42 364 5466
05-Apr-18 6.00 12 37 20 41 25 44 337 4284
06-Apr-18 6.00 14 44 22 48 30 55 345 4420
09-Apr-18 6.00 14 44 22 48 30 60 350 4746
10-Apr-18 6.00 14 43 23 46 29 52 360 4396
11-Apr-18 6.00 14 42 22 45 29 52 370 4612
12-Apr-18 6.00 14 41 22 44 30 59 385 4822
13-Apr-18 6.00 15 44 22 47 28 58 377 4688
16-Apr-18 6.00 14 44 23 48 30 54 358 4671
17-Apr-18 6.00 16 40 28 50 35 59 288 3448
18-Apr-18 6.00 18 42 29 46 38 56 277 3812
19-Apr-18 6.00 15 38 24 43 31 56 374 4592
20-Apr-18 6.01 12 32 14 35 24 44 382 4567
23-Apr-18 6.00 16 39 23 42 32 63 376 4180
24-Apr-18 6.02 12 34 15 39 24 44 386 4285
25-Apr-18 6.00 15 39 21 43 27 54 373 4264
26-Apr-18 6.00 16 39 21 42 30 60 370 4289
27-Apr-18 6.00 17 37 22 44 31 60 347 3798
118
CC
ILM
on
thly
Ne
wsl
ett
er
statistics
Ma
y 2
01
8
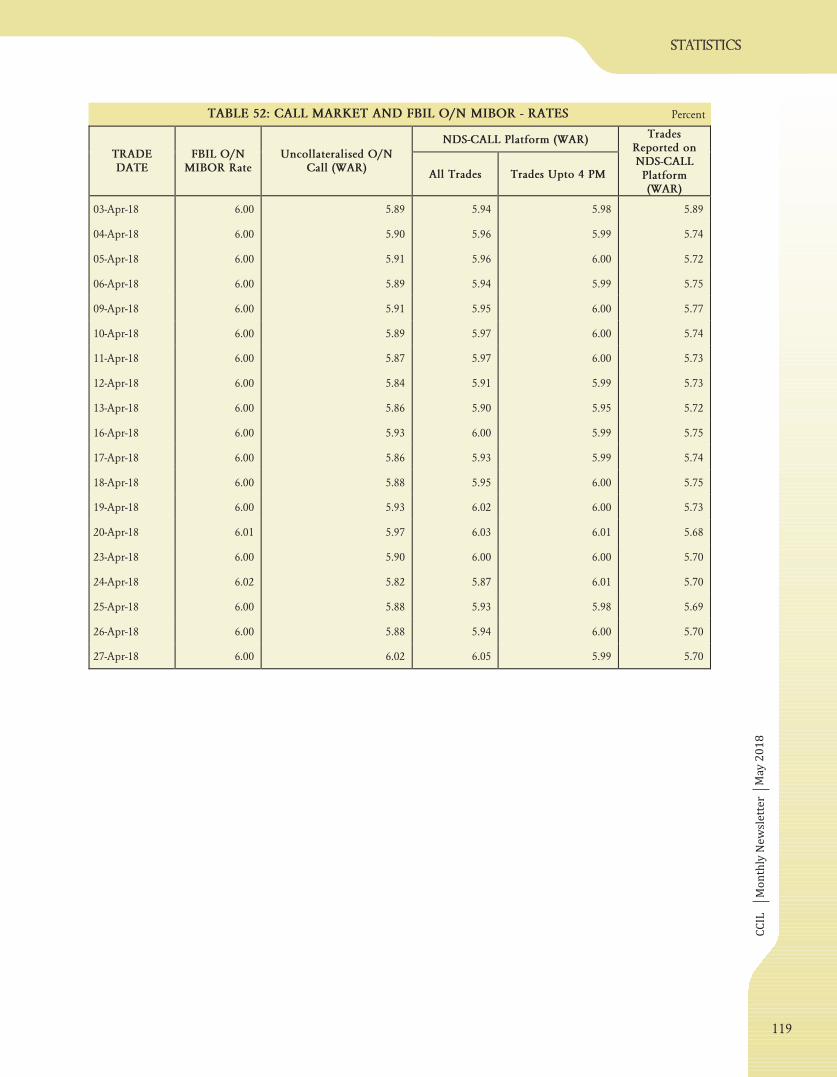
TABLE 52: CALL MARKET AND FBIL O/N MIBOR - RATES Percent
NDS-CALL Platform (WAR)
TRADEDATE
FBIL O/NMIBOR Rate
Uncollateralised O/NCall (WAR)
All Trades Trades Upto 4 PM
TradesReported onNDS-CALLPlatform(WAR)
03-Apr-18 6.00 5.89 5.94 5.98 5.89
04-Apr-18 6.00 5.90 5.96 5.99 5.74
05-Apr-18 6.00 5.91 5.96 6.00 5.72
06-Apr-18 6.00 5.89 5.94 5.99 5.75
09-Apr-18 6.00 5.91 5.95 6.00 5.77
10-Apr-18 6.00 5.89 5.97 6.00 5.74
11-Apr-18 6.00 5.87 5.97 6.00 5.73
12-Apr-18 6.00 5.84 5.91 5.99 5.73
13-Apr-18 6.00 5.86 5.90 5.95 5.72
16-Apr-18 6.00 5.93 6.00 5.99 5.75
17-Apr-18 6.00 5.86 5.93 5.99 5.74
18-Apr-18 6.00 5.88 5.95 6.00 5.75
19-Apr-18 6.00 5.93 6.02 6.00 5.73
20-Apr-18 6.01 5.97 6.03 6.01 5.68
23-Apr-18 6.00 5.90 6.00 6.00 5.70
24-Apr-18 6.02 5.82 5.87 6.01 5.70
25-Apr-18 6.00 5.88 5.93 5.98 5.69
26-Apr-18 6.00 5.88 5.94 6.00 5.70
27-Apr-18 6.00 6.02 6.05 5.99 5.70
119
CCIL Monthly Newsletter
statis
tic
s
May 2018
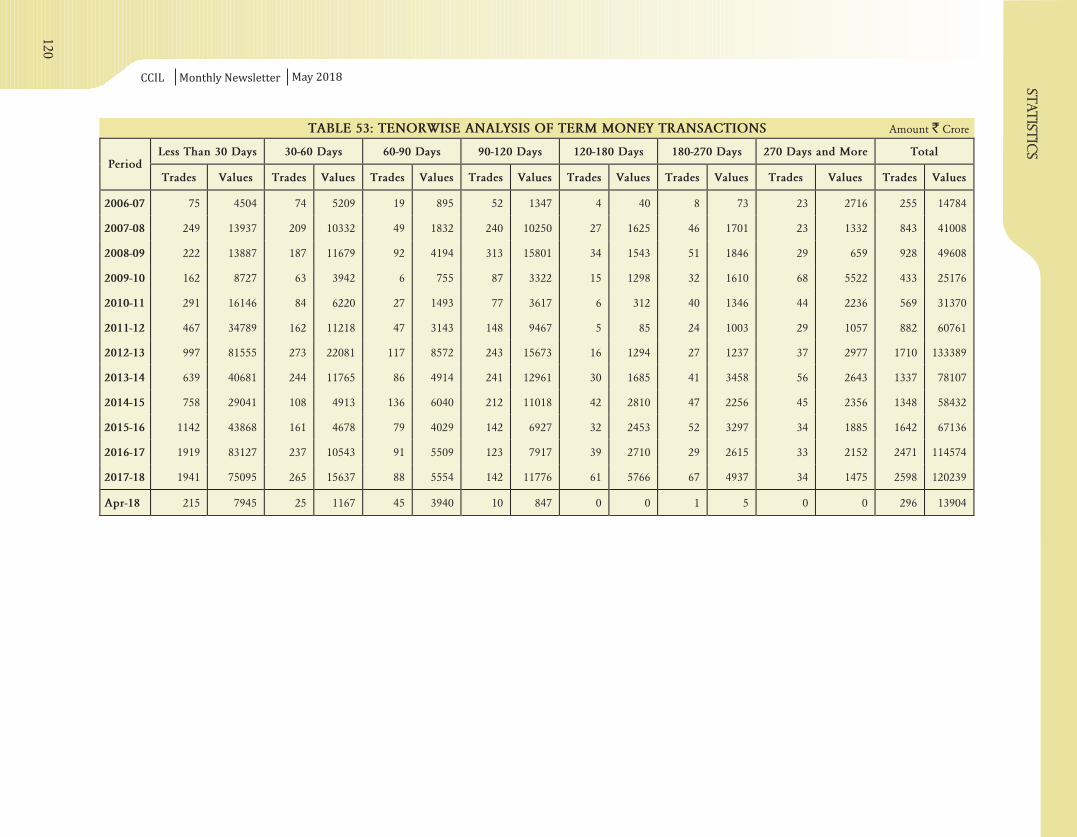
TABLE :53 TENORWISE ANALYSIS OF TERM MONEY TRANSACTIONS Amount Crore`
Less Than 30 Days 30-60 Days 60-90 Days 90-120 Days 120-180 Days 180-270 Days 270 Days and More TotalPeriod
Trades Values Trades Values Trades Values Trades Values Trades Values Trades Values Trades Values Trades Values
2006-07 75 4504 74 5209 19 895 52 1347 4 40 8 73 23 2716 255 14784
2007-08 249 13937 209 10332 49 1832 240 10250 27 1625 46 1701 23 1332 843 41008
2008-09 222 13887 187 11679 92 4194 313 15801 34 1543 51 1846 29 659 928 49608
2009-10 162 8727 63 3942 6 755 87 3322 15 1298 32 1610 68 5522 433 25176
2010-11 291 16146 84 6220 27 1493 77 3617 6 312 40 1346 44 2236 569 31370
2011-12 467 34789 162 11218 47 3143 148 9467 5 85 24 1003 29 1057 882 60761
2012-13 997 81555 273 22081 117 8572 243 15673 16 1294 27 1237 37 2977 1710 133389
2013-14 639 40681 244 11765 86 4914 241 12961 30 1685 41 3458 56 2643 1337 78107
2014-15 758 29041 108 4913 136 6040 212 11018 42 2810 47 2256 45 2356 1348 58432
2015-16 1142 43868 161 4678 79 4029 142 6927 32 2453 52 3297 34 1885 1642 67136
2016-17 1919 83127 237 10543 91 5509 123 7917 39 2710 29 2615 33 2152 2471 114574
2017-18 1941 75095 265 15637 88 5554 142 11776 61 5766 67 4937 34 1475 2598 120239
Apr-18 215 7945 25 1167 45 3940 10 847 0 0 1 5 0 0 296 13904
120
CCIL Monthly Newsletter
statis
tic
s
May 2018
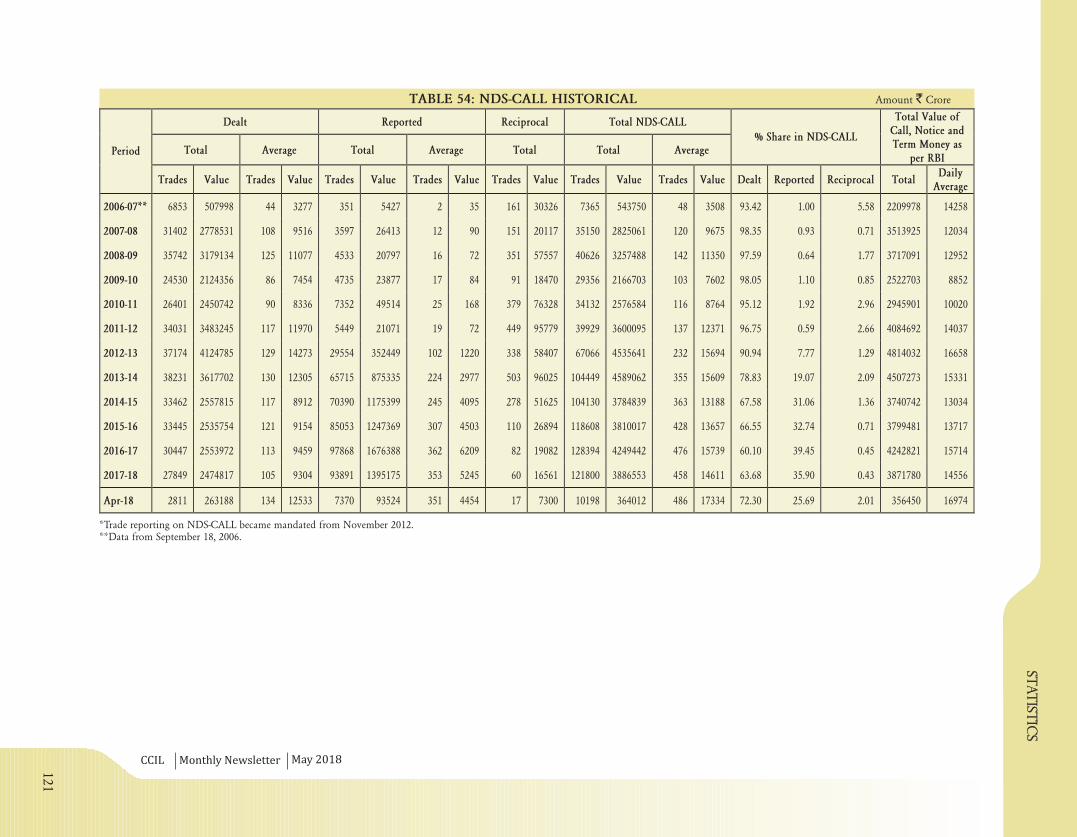
TABLE 54: NDS-CALL HISTORICAL Amount Crore`
*Trade reporting on NDS-CALL became mandated from November 2012.**Data from September 18, 2006.
Dealt Reported Reciprocal Total NDS-CALL
Total Average Total Average Total Total Average% Share in NDS-CALL
Total Value ofCall, Notice andTerm Money as
per RBIPeriod
Trades Value Trades Value Trades Value Trades Value Trades Value Trades Value Trades Value Dealt Reported Reciprocal TotalDaily
Average
2006-07** 6853 507998 44 3277 351 5427 2 35 161 30326 7365 543750 48 3508 93.42 1.00 5.58 2209978 14258
2007-08 31402 2778531 108 9516 3597 26413 12 90 151 20117 35150 2825061 120 9675 98.35 0.93 0.71 3513925 12034
2008-09 35742 3179134 125 11077 4533 20797 16 72 351 57557 40626 3257488 142 11350 97.59 0.64 1.77 3717091 12952
2009-10 24530 2124356 86 7454 4735 23877 17 84 91 18470 29356 2166703 103 7602 98.05 1.10 0.85 2522703 8852
2010-11 26401 2450742 90 8336 7352 49514 25 168 379 76328 34132 2576584 116 8764 95.12 1.92 2.96 2945901 10020
2011-12 34031 3483245 117 11970 5449 21071 19 72 449 95779 39929 3600095 137 12371 96.75 0.59 2.66 4084692 14037
2012-13 37174 4124785 129 14273 29554 352449 102 1220 338 58407 67066 4535641 232 15694 90.94 7.77 1.29 4814032 16658
2013-14 38231 3617702 130 12305 65715 875335 224 2977 503 96025 104449 4589062 355 15609 78.83 19.07 2.09 4507273 15331
2014-15 33462 2557815 117 8912 70390 1175399 245 4095 278 51625 104130 3784839 363 13188 67.58 31.06 1.36 3740742 13034
2015-16 33445 2535754 121 9154 85053 1247369 307 4503 110 26894 118608 3810017 428 13657 66.55 32.74 0.71 3799481 13717
2016-17 30447 2553972 113 9459 97868 1676388 362 6209 82 19082 128394 4249442 476 15739 60.10 39.45 0.45 4242821 15714
2017-18 27849 2474817 105 9304 93891 1395175 353 5245 60 16561 121800 3886553 458 14611 63.68 35.90 0.43 3871780 14556
Apr-18 2811 263188 134 12533 7370 93524 351 4454 17 7300 10198 364012 486 17334 72.30 25.69 2.01 356450 16974
121
CCIL Monthly Newsletter
statis
tic
s
May 2018
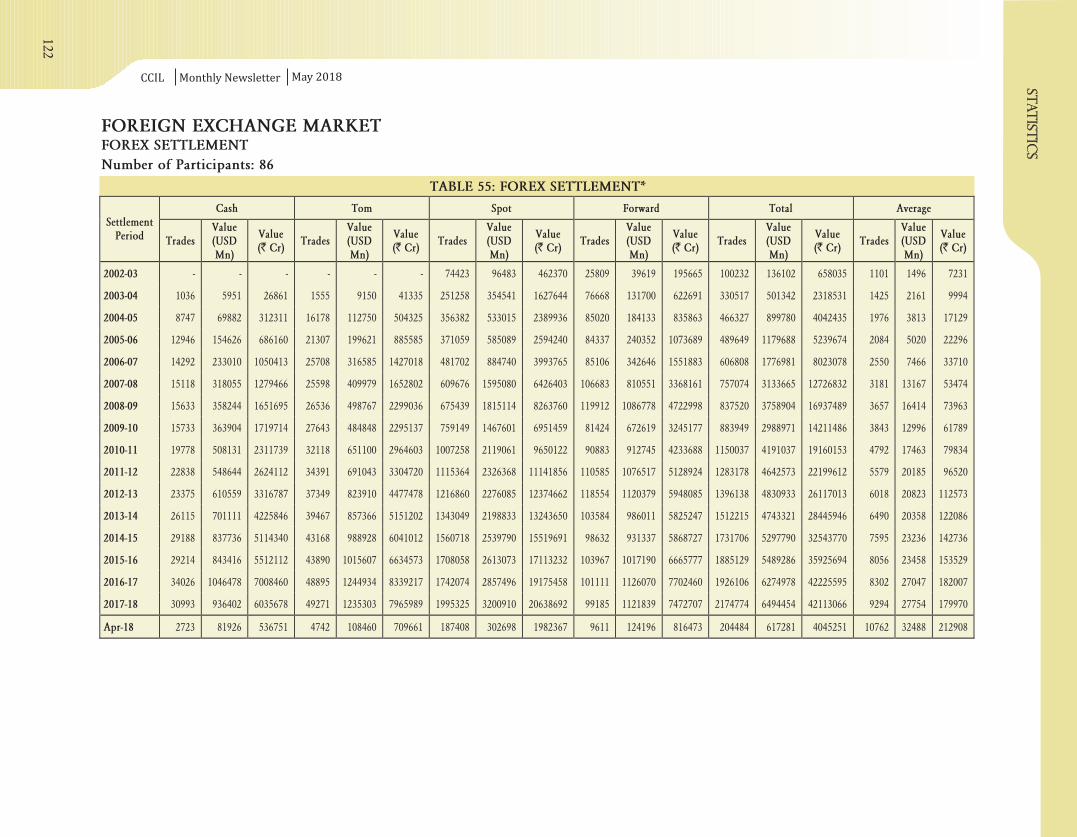
TABLE 55: FOREX SETTLEMENT*
FOREIGN EXCHANGE MARKETFOREX SETTLEMENT
Number of Participants: 86
Cash Tom Spot Forward Total AverageSettlement
Period TradesValue(USDMn)
Value(` Cr)
TradesValue(USDMn)
Value(` Cr)
TradesValue(USDMn)
Value(` Cr)
TradesValue(USDMn)
Value(` Cr)
TradesValue(USDMn)
Value(` Cr)
TradesValue(USDMn)
Value(` Cr)
2002-03 - - - - - - 74423 96483 462370 25809 39619 195665 100232 136102 658035 1101 1496 7231
2003-04 1036 5951 26861 1555 9150 41335 251258 354541 1627644 76668 131700 622691 330517 501342 2318531 1425 2161 9994
2004-05 8747 69882 312311 16178 112750 504325 356382 533015 2389936 85020 184133 835863 466327 899780 4042435 1976 3813 17129
2005-06 12946 154626 686160 21307 199621 885585 371059 585089 2594240 84337 240352 1073689 489649 1179688 5239674 2084 5020 22296
2006-07 14292 233010 1050413 25708 316585 1427018 481702 884740 3993765 85106 342646 1551883 606808 1776981 8023078 2550 7466 33710
2007-08 15118 318055 1279466 25598 409979 1652802 609676 1595080 6426403 106683 810551 3368161 757074 3133665 12726832 3181 13167 53474
2008-09 15633 358244 1651695 26536 498767 2299036 675439 1815114 8263760 119912 1086778 4722998 837520 3758904 16937489 3657 16414 73963
2009-10 15733 363904 1719714 27643 484848 2295137 759149 1467601 6951459 81424 672619 3245177 883949 2988971 14211486 3843 12996 61789
2010-11 19778 508131 2311739 32118 651100 2964603 1007258 2119061 9650122 90883 912745 4233688 1150037 4191037 19160153 4792 17463 79834
2011-12 22838 548644 2624112 34391 691043 3304720 1115364 2326368 11141856 110585 1076517 5128924 1283178 4642573 22199612 5579 20185 96520
2012-13 23375 610559 3316787 37349 823910 4477478 1216860 2276085 12374662 118554 1120379 5948085 1396138 4830933 26117013 6018 20823 112573
2013-14 26115 701111 4225846 39467 857366 5151202 1343049 2198833 13243650 103584 986011 5825247 1512215 4743321 28445946 6490 20358 122086
2014-15 29188 837736 5114340 43168 988928 6041012 1560718 2539790 15519691 98632 931337 5868727 1731706 5297790 32543770 7595 23236 142736
2015-16 29214 843416 5512112 43890 1015607 6634573 1708058 2613073 17113232 103967 1017190 6665777 1885129 5489286 35925694 8056 23458 153529
2016-17 34026 1046478 7008460 48895 1244934 8339217 1742074 2857496 19175458 101111 1126070 7702460 1926106 6274978 42225595 8302 27047 182007
2017-18 30993 936402 6035678 49271 1235303 7965989 1995325 3200910 20638692 99185 1121839 7472707 2174774 6494454 42113066 9294 27754 179970
Apr-18 2723 81926 536751 4742 108460 709661 187408 302698 1982367 9611 124196 816473 204484 617281 4045251 10762 32488 212908
122
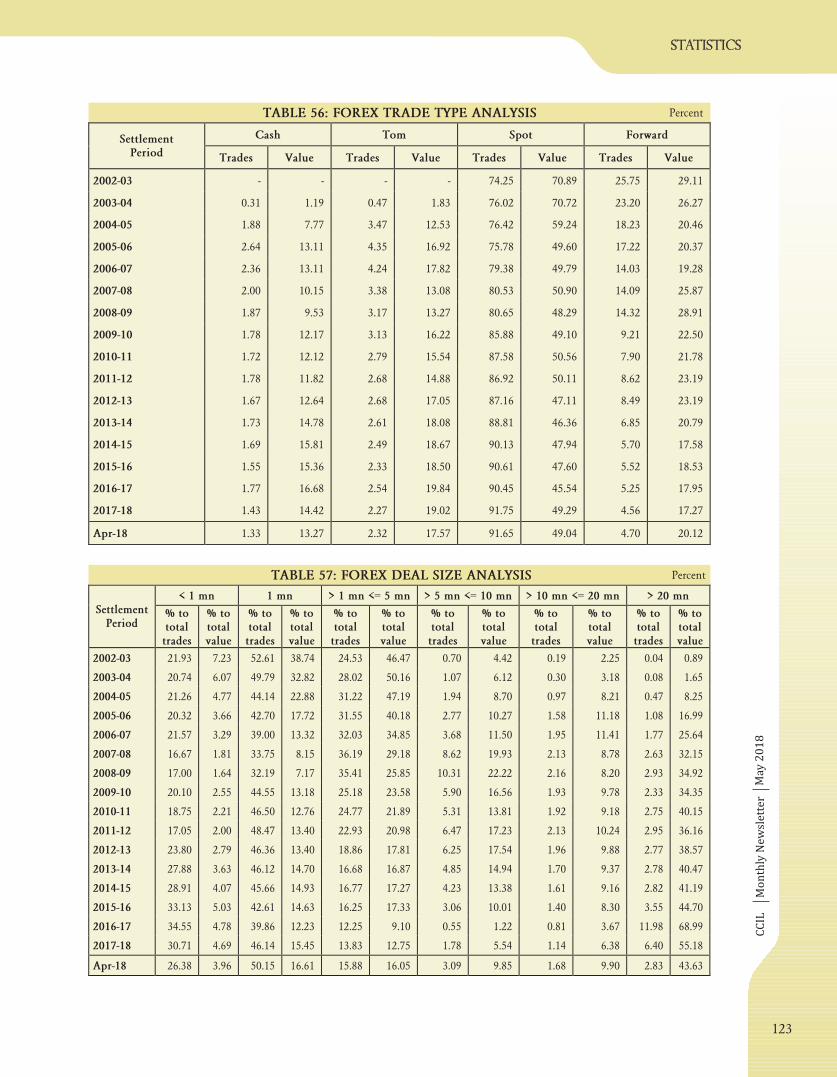
CC
ILM
on
thly
Ne
wsl
ett
er
statistics
Ma
y 2
01
8
TABLE 56: FOREX TRADE TYPE ANALYSIS Percent
Cash Tom Spot ForwardSettlementPeriod Trades Value Trades Value Trades Value Trades Value
2002-03 - - - - 74.25 70.89 25.75 29.11
2003-04 0.31 1.19 0.47 1.83 76.02 70.72 23.20 26.27
2004-05 1.88 7.77 3.47 12.53 76.42 59.24 18.23 20.46
2005-06 2.64 13.11 4.35 16.92 75.78 49.60 17.22 20.37
2006-07 2.36 13.11 4.24 17.82 79.38 49.79 14.03 19.28
2007-08 2.00 10.15 3.38 13.08 80.53 50.90 14.09 25.87
2008-09 1.87 9.53 3.17 13.27 80.65 48.29 14.32 28.91
2009-10 1.78 12.17 3.13 16.22 85.88 49.10 9.21 22.50
2010-11 1.72 12.12 2.79 15.54 87.58 50.56 7.90 21.78
2011-12 1.78 11.82 2.68 14.88 86.92 50.11 8.62 23.19
2012-13 1.67 12.64 2.68 17.05 87.16 47.11 8.49 23.19
2013-14 1.73 14.78 2.61 18.08 88.81 46.36 6.85 20.79
2014-15 1.69 15.81 2.49 18.67 90.13 47.94 5.70 17.58
2015-16 1.55 15.36 2.33 18.50 90.61 47.60 5.52 18.53
2016-17 1.77 16.68 2.54 19.84 90.45 45.54 5.25 17.95
2017-18 1.43 14.42 2.27 19.02 91.75 49.29 4.56 17.27
Apr-18 1.33 13.27 2.32 17.57 91.65 49.04 4.70 20.12
TABLE 57: FOREX DEAL SIZE ANALYSIS Percent
< 1 mn 1 mn > 1 mn <= 5 mn > 5 mn <= 10 mn > 10 mn <= 20 mn > 20 mnSettlement
Period% tototaltrades
% tototalvalue
% tototaltrades
% tototalvalue
% tototaltrades
% tototalvalue
% tototaltrades
% tototalvalue
% tototaltrades
% tototalvalue
% tototaltrades
% tototalvalue
2002-03 21.93 7.23 52.61 38.74 24.53 46.47 0.70 4.42 0.19 2.25 0.04 0.89
2003-04 20.74 6.07 49.79 32.82 28.02 50.16 1.07 6.12 0.30 3.18 0.08 1.65
2004-05 21.26 4.77 44.14 22.88 31.22 47.19 1.94 8.70 0.97 8.21 0.47 8.25
2005-06 20.32 3.66 42.70 17.72 31.55 40.18 2.77 10.27 1.58 11.18 1.08 16.99
2006-07 21.57 3.29 39.00 13.32 32.03 34.85 3.68 11.50 1.95 11.41 1.77 25.64
2007-08 16.67 1.81 33.75 8.15 36.19 29.18 8.62 19.93 2.13 8.78 2.63 32.15
2008-09 17.00 1.64 32.19 7.17 35.41 25.85 10.31 22.22 2.16 8.20 2.93 34.92
2009-10 20.10 2.55 44.55 13.18 25.18 23.58 5.90 16.56 1.93 9.78 2.33 34.35
2010-11 18.75 2.21 46.50 12.76 24.77 21.89 5.31 13.81 1.92 9.18 2.75 40.15
2011-12 17.05 2.00 48.47 13.40 22.93 20.98 6.47 17.23 2.13 10.24 2.95 36.16
2012-13 23.80 2.79 46.36 13.40 18.86 17.81 6.25 17.54 1.96 9.88 2.77 38.57
2013-14 27.88 3.63 46.12 14.70 16.68 16.87 4.85 14.94 1.70 9.37 2.78 40.47
2014-15 28.91 4.07 45.66 14.93 16.77 17.27 4.23 13.38 1.61 9.16 2.82 41.19
2015-16 33.13 5.03 42.61 14.63 16.25 17.33 3.06 10.01 1.40 8.30 3.55 44.70
2016-17 34.55 4.78 39.86 12.23 12.25 9.10 0.55 1.22 0.81 3.67 11.98 68.99
2017-18 30.71 4.69 46.14 15.45 13.83 12.75 1.78 5.54 1.14 6.38 6.40 55.18
Apr-18 26.38 3.96 50.15 16.61 15.88 16.05 3.09 9.85 1.68 9.90 2.83 43.63
123
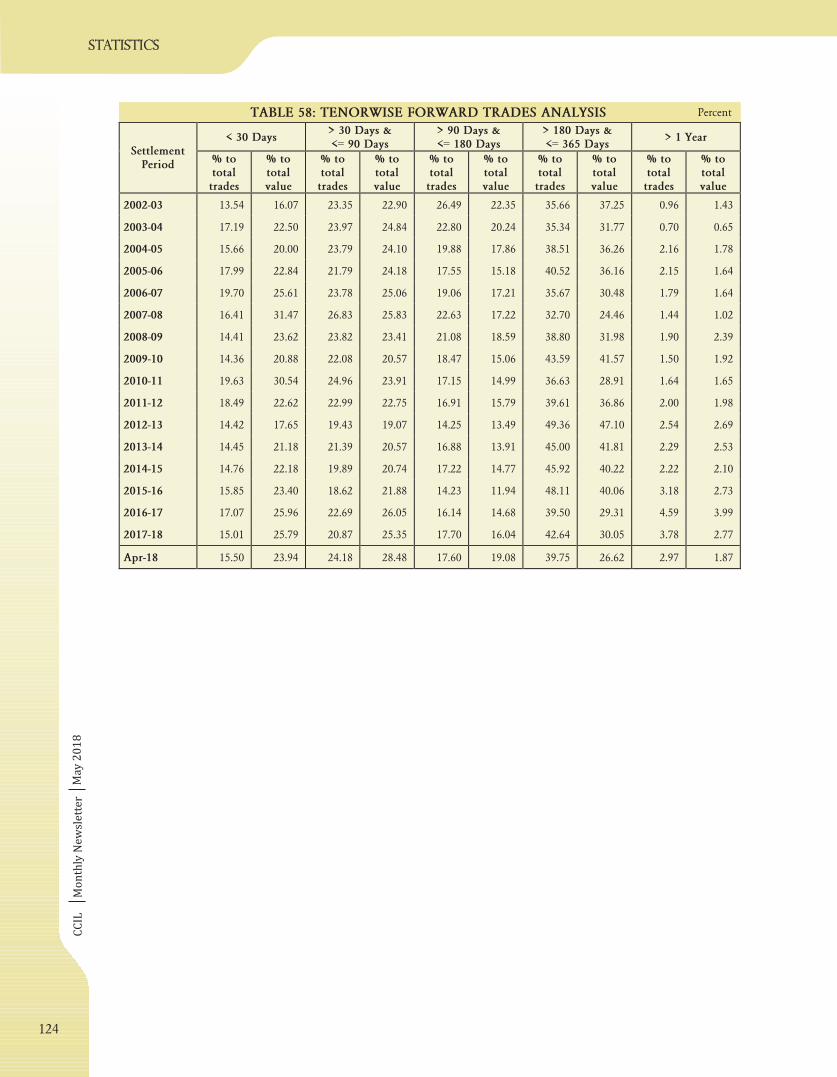
CC
ILM
on
thly
Ne
wsl
ett
er
statistics
Ma
y 2
01
8
TABLE 58: TENORWISE FORWARD TRADES ANALYSIS Percent
< 30 Days> 30 Days &<= 90 Days
> 90 Days &<= 180 Days
> 180 Days &<= 365 Days
> 1 YearSettlement
Period% tototaltrades
% tototalvalue
% tototaltrades
% tototalvalue
% tototaltrades
% tototalvalue
% tototaltrades
% tototalvalue
% tototaltrades
% tototalvalue
2002-03 13.54 16.07 23.35 22.90 26.49 22.35 35.66 37.25 0.96 1.43
2003-04 17.19 22.50 23.97 24.84 22.80 20.24 35.34 31.77 0.70 0.65
2004-05 15.66 20.00 23.79 24.10 19.88 17.86 38.51 36.26 2.16 1.78
2005-06 17.99 22.84 21.79 24.18 17.55 15.18 40.52 36.16 2.15 1.64
2006-07 19.70 25.61 23.78 25.06 19.06 17.21 35.67 30.48 1.79 1.64
2007-08 16.41 31.47 26.83 25.83 22.63 17.22 32.70 24.46 1.44 1.02
2008-09 14.41 23.62 23.82 23.41 21.08 18.59 38.80 31.98 1.90 2.39
2009-10 14.36 20.88 22.08 20.57 18.47 15.06 43.59 41.57 1.50 1.92
2010-11 19.63 30.54 24.96 23.91 17.15 14.99 36.63 28.91 1.64 1.65
2011-12 18.49 22.62 22.99 22.75 16.91 15.79 39.61 36.86 2.00 1.98
2012-13 14.42 17.65 19.43 19.07 14.25 13.49 49.36 47.10 2.54 2.69
2013-14 14.45 21.18 21.39 20.57 16.88 13.91 45.00 41.81 2.29 2.53
2014-15 14.76 22.18 19.89 20.74 17.22 14.77 45.92 40.22 2.22 2.10
2015-16 15.85 23.40 18.62 21.88 14.23 11.94 48.11 40.06 3.18 2.73
2016-17 17.07 25.96 22.69 26.05 16.14 14.68 39.50 29.31 4.59 3.99
2017-18 15.01 25.79 20.87 25.35 17.70 16.04 42.64 30.05 3.78 2.77
Apr-18 15.50 23.94 24.18 28.48 17.60 19.08 39.75 26.62 2.97 1.87
124

CC
ILM
on
thly
Ne
wsl
ett
er
statistics
TABLE 59: MARKET SHARE - FOREX Percent
TABLE 60: CATEGORYWISE FOREX ACTIVITY - DEAL TYPE
Market Share (%)
Ma
y 2
01
8
Top 'n' Players Top 5 Top 10 Top 15 Top 20
2002-03 33.65 57.73 72.42 83.30
2003-04 30.53 54.83 69.59 79.45
2004-05 29.00 49.45 63.61 73.61
2005-06 30.59 52.45 68.38 78.89
2006-07 31.15 50.93 65.08 73.69
2007-08 39.66 61.31 76.24 84.55
2008-09 39.65 62.30 76.97 85.71
2009-10 33.13 55.14 71.31 81.51
2010-11 34.94 57.30 73.56 82.97
2011-12 31.01 54.09 70.57 80.23
2012-13 31.53 52.64 68.22 78.40
2013-14 28.35 49.26 64.60 75.27
2014-15 29.05 49.51 64.62 74.95
2015-16 29.29 49.46 63.40 73.98
2016-17 30.16 50.82 65.10 75.09
2017-18 33.21 55.62 69.87 79.60
Apr-18 29.88 53.83 68.59 78.76
Category CASH TOM SPOT FORWARD
Foreign Banks 42.03 42.56 41.04 42.31
Public Sector Banks 30.38 27.25 32.46 28.61
Private Sector Banks 27.46 30.09 26.25 28.96
Cooperative Banks 0.11 0.10 0.25 0.12
Financial Institutions 0.01 0.00 0.00 0.00
125
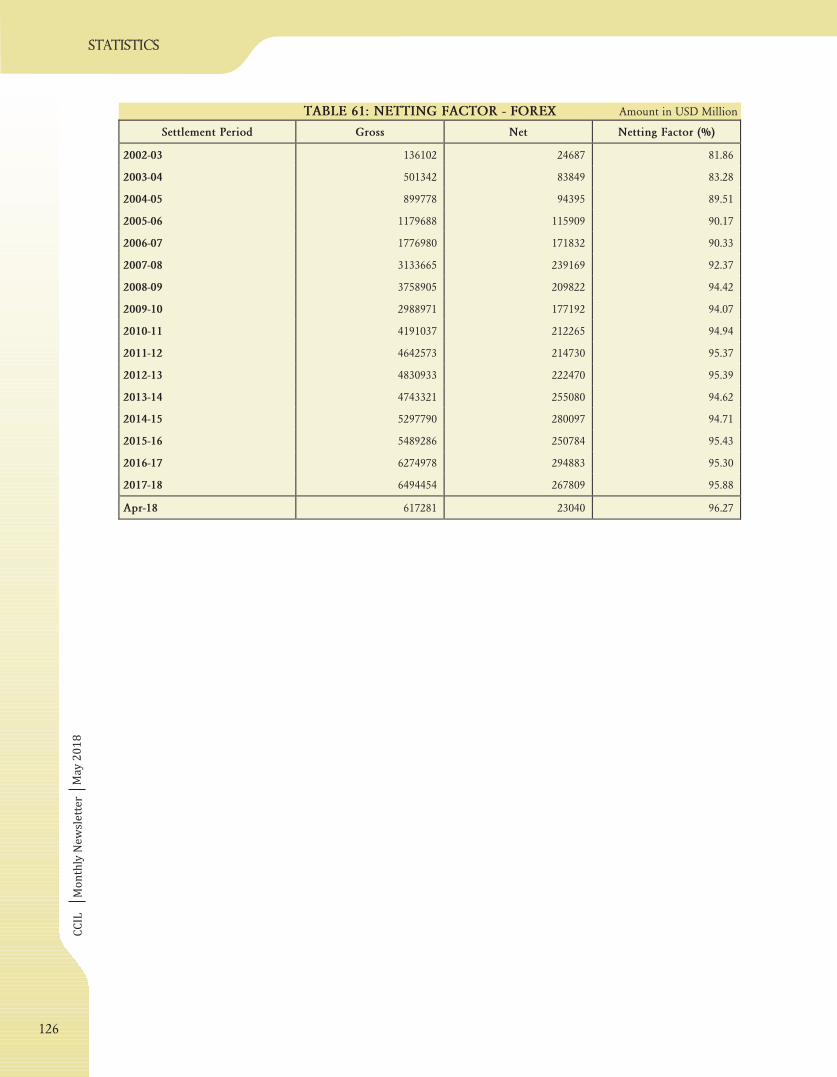
CC
ILM
on
thly
Ne
wsl
ett
er
statistics
TABLE 61: NETTING FACTOR - FOREX Amount in USD Million
Ma
y 2
01
8
Settlement Period Gross Net Netting Factor (%)
2002-03 136102 24687 81.86
2003-04 501342 83849 83.28
2004-05 899778 94395 89.51
2005-06 1179688 115909 90.17
2006-07 1776980 171832 90.33
2007-08 3133665 239169 92.37
2008-09 3758905 209822 94.42
2009-10 2988971 177192 94.07
2010-11 4191037 212265 94.94
2011-12 4642573 214730 95.37
2012-13 4830933 222470 95.39
2013-14 4743321 255080 94.62
2014-15 5297790 280097 94.71
2015-16 5489286 250784 95.43
2016-17 6274978 294883 95.30
2017-18 6494454 267809 95.88
Apr-18 617281 23040 96.27
126
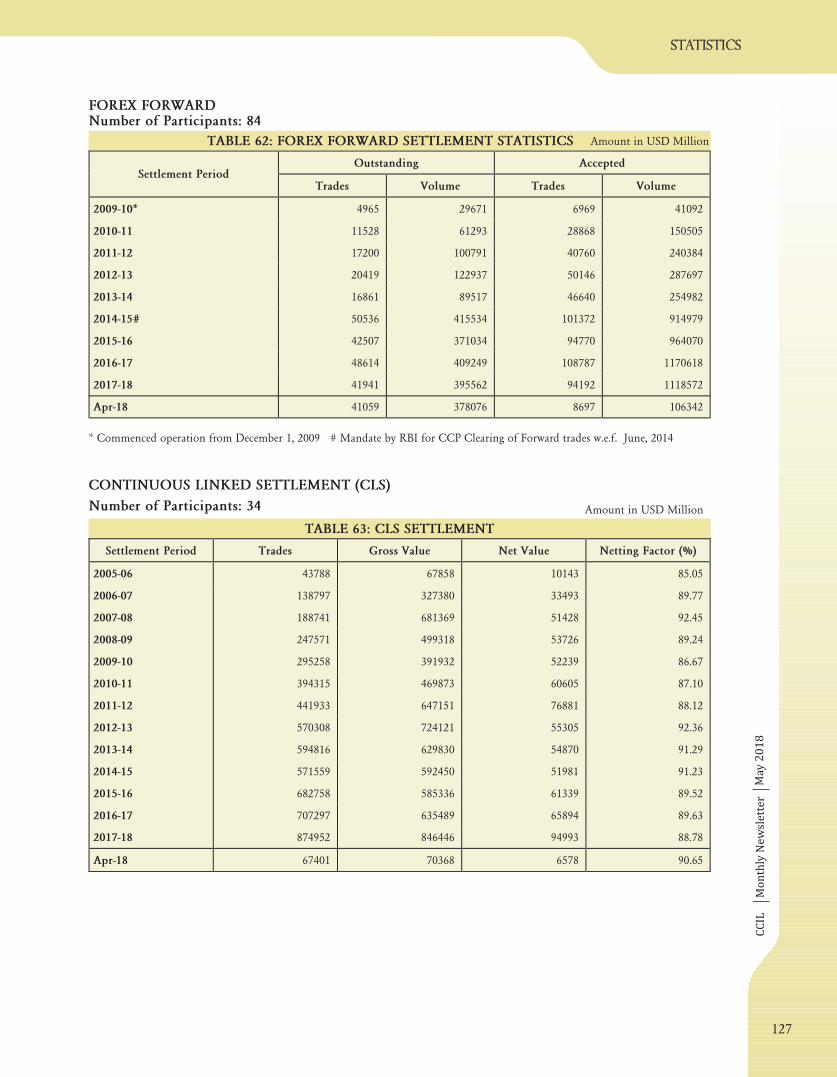
CC
ILM
on
thly
Ne
wsl
ett
er
TABLE 62: FOREX FORWARD SETTLEMENT STATISTICS
* Commenced operation from December 1, 2009 # Mandate by RBI for CCP Clearing of Forward trades w.e.f. June, 2014
Number of Participants: 84FOREX FORWARD
Amount in USD Million
statistics
TABLE 63: CLS SETTLEMENT
CONTINUOUS LINKED SETTLEMENT (CLS)
Number of Participants: 34 Amount in USD Million
Ma
y 2
01
8
Settlement Period Trades Gross Value Net Value Netting Factor (%)
2005-06 43788 67858 10143 85.05
2006-07 138797 327380 33493 89.77
2007-08 188741 681369 51428 92.45
2008-09 247571 499318 53726 89.24
2009-10 295258 391932 52239 86.67
2010-11 394315 469873 60605 87.10
2011-12 441933 647151 76881 88.12
2012-13 570308 724121 55305 92.36
2013-14 594816 629830 54870 91.29
2014-15 571559 592450 51981 91.23
2015-16 682758 585336 61339 89.52
2016-17 707297 635489 65894 89.63
2017-18 874952 846446 94993 88.78
Apr-18 67401 70368 6578 90.65
Outstanding AcceptedSettlement Period
Trades Volume Trades Volume
2009-10* 4965 29671 6969 41092
2010-11 11528 61293 28868 150505
2011-12 17200 100791 40760 240384
2012-13 20419 122937 50146 287697
2013-14 16861 89517 46640 254982
2014-15# 50536 415534 101372 914979
2015-16 42507 371034 94770 964070
2016-17 48614 409249 108787 1170618
2017-18 41941 395562 94192 1118572
Apr-18 41059 378076 8697 106342
127
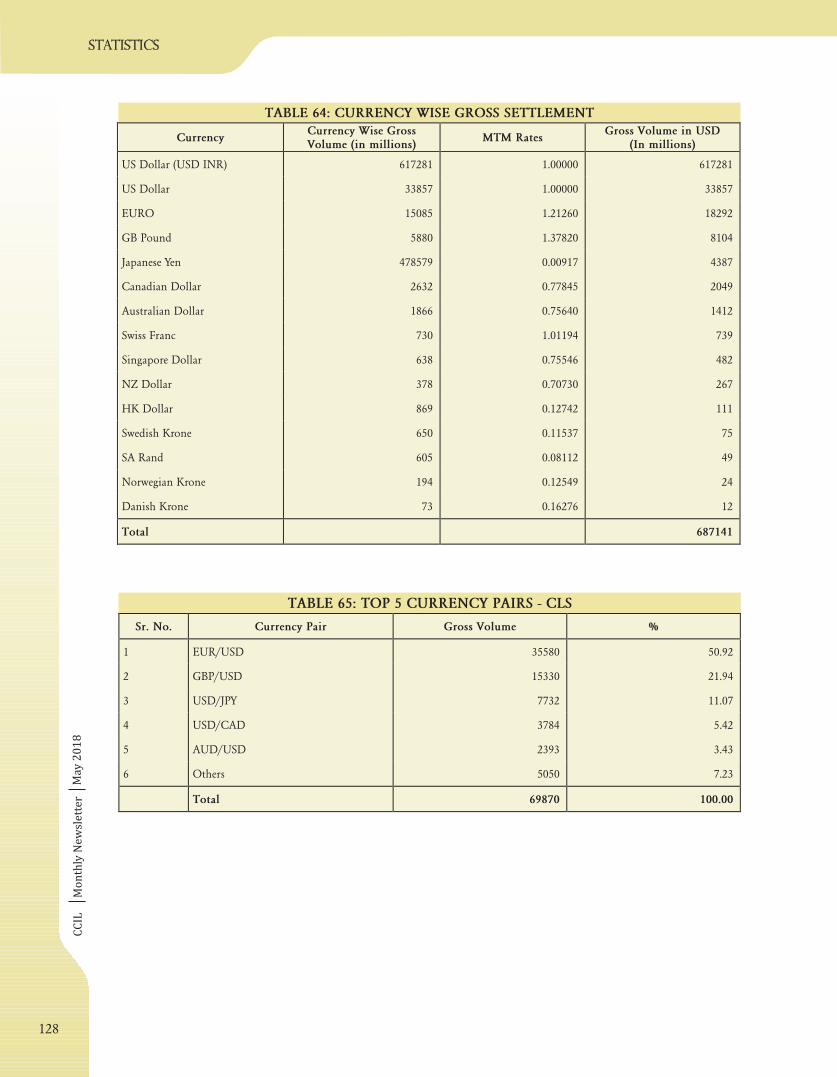
CC
ILM
on
thly
Ne
wsl
ett
er
statistics
TABLE 64: CURRENCY WISE GROSS SETTLEMENT
TABLE 65: TOP 5 CURRENCY PAIRS - CLS
Ma
y 2
01
8
CurrencyCurrency Wise GrossVolume (in millions)
MTM RatesGross Volume in USD
(In millions)
US Dollar (USD INR) 617281 1.00000 617281
US Dollar 33857 1.00000 33857
EURO 15085 1.21260 18292
GB Pound 5880 1.37820 8104
Japanese Yen 478579 0.00917 4387
Canadian Dollar 2632 0.77845 2049
Australian Dollar 1866 0.75640 1412
Swiss Franc 730 1.01194 739
Singapore Dollar 638 0.75546 482
NZ Dollar 378 0.70730 267
HK Dollar 869 0.12742 111
Swedish Krone 650 0.11537 75
SA Rand 605 0.08112 49
Norwegian Krone 194 0.12549 24
Danish Krone 73 0.16276 12
Total 687141
Sr. No. Currency Pair Gross Volume %
1 EUR/USD 35580 50.92
2 GBP/USD 15330 21.94
3 USD/JPY 7732 11.07
4 USD/CAD 3784 5.42
5 AUD/USD 2393 3.43
6 Others 5050 7.23
Total 69870 100.00
128
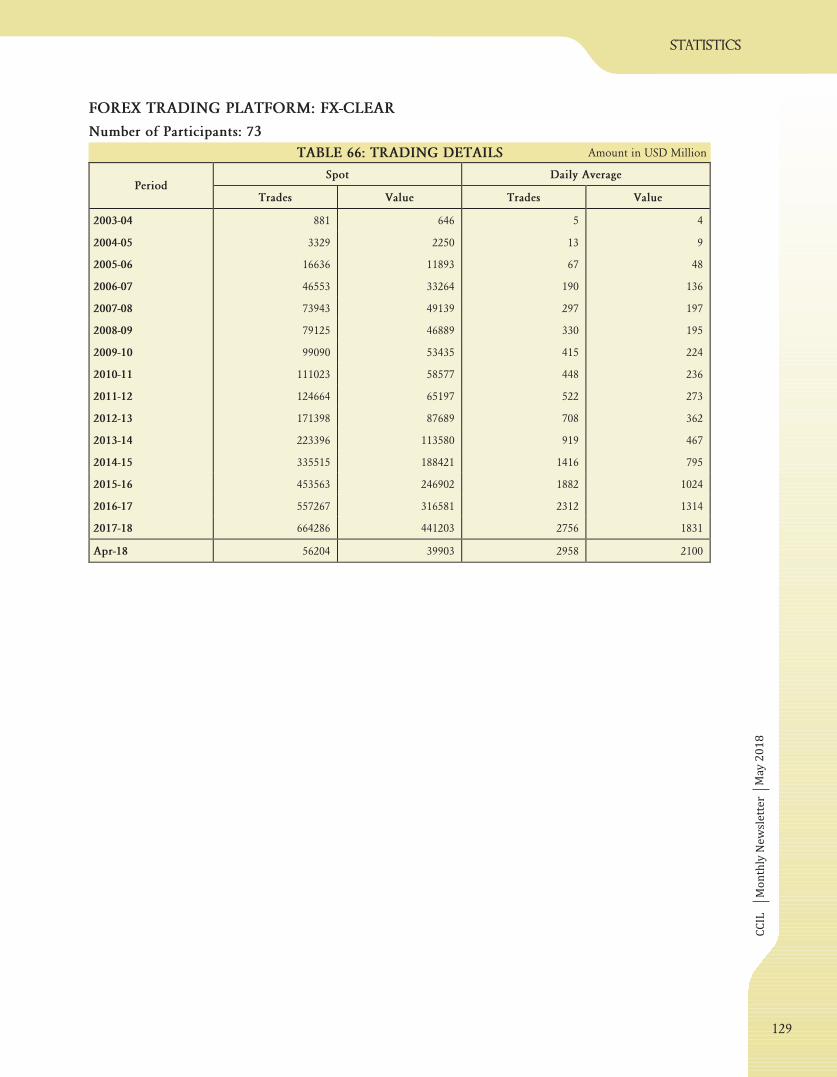
CC
ILM
on
thly
Ne
wsl
ett
er
statistics
FOREX TRADING PLATFORM: FX-CLEAR
3Number of Participants: 7
TABLE 66: TRADING DETAILS Amount in USD Million
Ma
y 2
01
8
Spot Daily AveragePeriod
Trades Value Trades Value
2003-04 881 646 5 4
2004-05 3329 2250 13 9
2005-06 16636 11893 67 48
2006-07 46553 33264 190 136
2007-08 73943 49139 297 197
2008-09 79125 46889 330 195
2009-10 99090 53435 415 224
2010-11 111023 58577 448 236
2011-12 124664 65197 522 273
2012-13 171398 87689 708 362
2013-14 223396 113580 919 467
2014-15 335515 188421 1416 795
2015-16 453563 246902 1882 1024
2016-17 557267 316581 2312 1314
2017-18 664286 441203 2756 1831
Apr-18 56204 39903 2958 2100
129
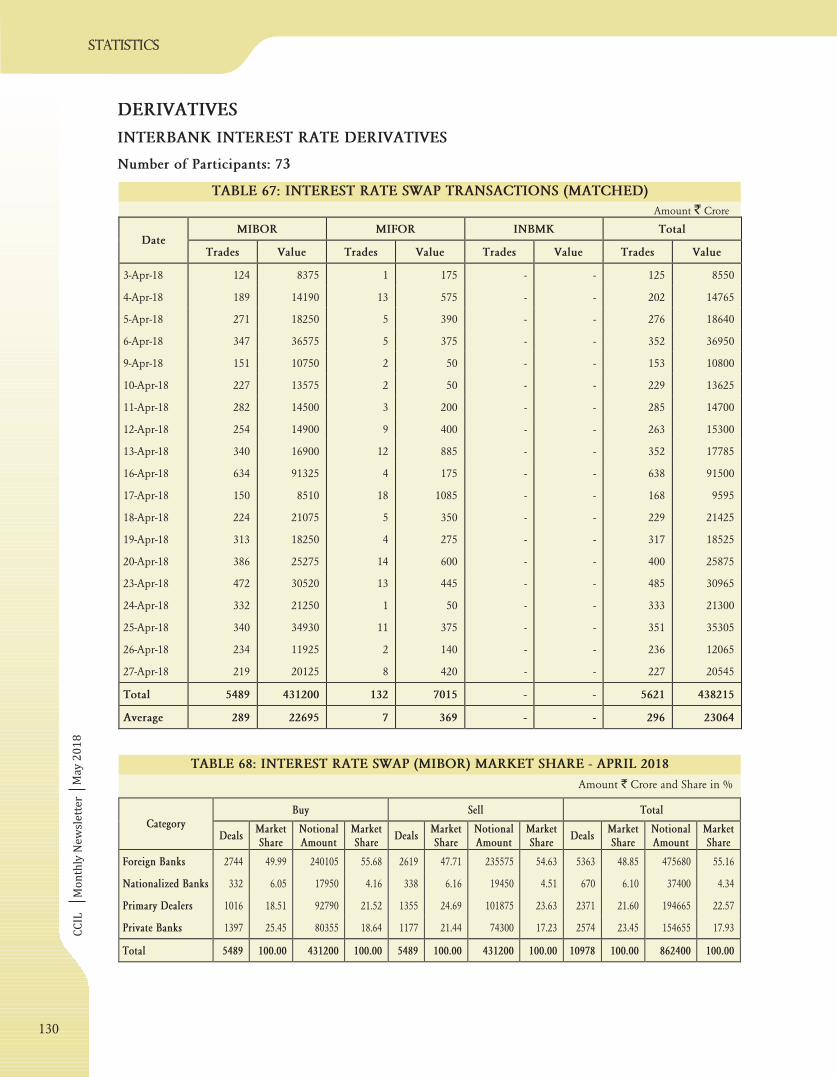
CC
ILM
on
thly
Ne
wsl
ett
er
statistics
DERIVATIVES
Number of Participants: 7
INTERBANK INTEREST RATE DERIVATIVES
3
Amount Crore`
Amount Crore and Share in %`
TABLE : INTEREST RATE SWAP TRANSACTIONS (MATCHED)67
TABLE : INTEREST RATE SWAP (MIBOR) MARKET SHARE -68 APRIL 2018
Ma
y 2
01
8
MIBOR MIFOR INBMK TotalDate
Trades Value Trades Value Trades Value Trades Value
3-Apr-18 124 8375 1 175 - - 125 8550
4-Apr-18 189 14190 13 575 - - 202 14765
5-Apr-18 271 18250 5 390 - - 276 18640
6-Apr-18 347 36575 5 375 - - 352 36950
9-Apr-18 151 10750 2 50 - - 153 10800
10-Apr-18 227 13575 2 50 - - 229 13625
11-Apr-18 282 14500 3 200 - - 285 14700
12-Apr-18 254 14900 9 400 - - 263 15300
13-Apr-18 340 16900 12 885 - - 352 17785
16-Apr-18 634 91325 4 175 - - 638 91500
17-Apr-18 150 8510 18 1085 - - 168 9595
18-Apr-18 224 21075 5 350 - - 229 21425
19-Apr-18 313 18250 4 275 - - 317 18525
20-Apr-18 386 25275 14 600 - - 400 25875
23-Apr-18 472 30520 13 445 - - 485 30965
24-Apr-18 332 21250 1 50 - - 333 21300
25-Apr-18 340 34930 11 375 - - 351 35305
26-Apr-18 234 11925 2 140 - - 236 12065
27-Apr-18 219 20125 8 420 - - 227 20545
Total 5489 431200 132 7015 - - 5621 438215
Average 289 22695 7 369 - - 296 23064
Buy Sell TotalCategory
DealsMarketShare
NotionalAmount
MarketShare
DealsMarketShare
NotionalAmount
MarketShare
DealsMarketShare
NotionalAmount
MarketShare
Foreign Banks 2744 49.99 240105 55.68 2619 47.71 235575 54.63 5363 48.85 475680 55.16
Nationalized Banks 332 6.05 17950 4.16 338 6.16 19450 4.51 670 6.10 37400 4.34
Primary Dealers 1016 18.51 92790 21.52 1355 24.69 101875 23.63 2371 21.60 194665 22.57
Private Banks 1397 25.45 80355 18.64 1177 21.44 74300 17.23 2574 23.45 154655 17.93
Total 5489 100.00 431200 100.00 5489 100.00 431200 100.00 10978 100.00 862400 100.00
130

CC
ILM
on
thly
Ne
wsl
ett
er
statistics
Amount Crore and Share in %`
TABLE 70: TOP ‘N’ MARKET SHARE - IRS
TABLE 71: IRS TRADE SUMMARY (MATCHED) Amount Crore`
Percent
TABLE 6 : INTEREST RATE SWAP (MIFOR) MARKET SHARE - 20189 APRIL
Ma
y 2
01
8
MIBOR MIFOR
Top 1 24.37 15.68
Top 5 63.49 58.34
Top 10 83.75 84.21
Buy Sell TotalCategory
DealsMarketShare
NotionalAmount
MarketShare
DealsMarketShare
NotionalAmount
MarketShare
DealsMarketShare
NotionalAmount
MarketShare
Foreign Banks 81 61.36 4545 64.79 69 52.27 3820 54.45 150 56.82 8365 59.62
Private Banks 51 38.64 2470 35.21 63 47.73 3195 45.55 114 43.18 5665 40.38
Total 132 100.00 7015 100.00 132 100.00 7015 100.00 264 100.00 14030 100.00
MIBOR MIFOR INBMKPeriod
Trades Value Trades Value Trades Value
2007-08 79495 4728077 18139 647609 385 14365
2008-09 40912 2644846 4799 223663 132 6575
2009-10 20352 1452058 1050 53867 77 5125
2010-11 33057 2359722 1291 74911 150 8775
2011-12 33642 2451048 2101 109973 14 860
2012-13 22713 2021607 1252 75435 11 635
2013-14 25514 2296732 1437 79780 1 350
2014-15 21153 2029225 1932 119779 5 275
2015-16 20746 2132920 1372 99340 4 300
2016-17 21036 1923460 2120 125436 - -
2017-18 41494 3380770 2107 111195 - -
Apr-18 5489 431200 132 7015 - -
131
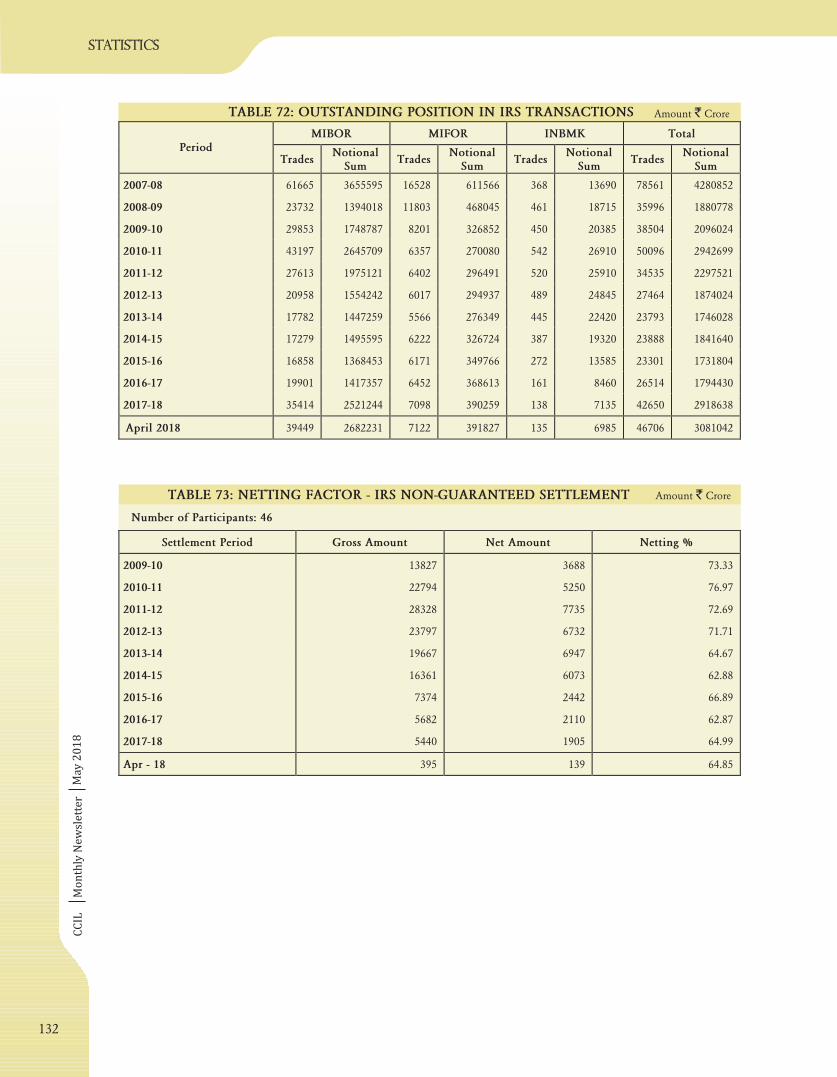
CC
ILM
on
thly
Ne
wsl
ett
er
Number of Participants: 46
TABLE 72: OUTSTANDING POSITION IN IRS TRANSACTIONS Amount Crore`
TABLE 73: NETTING FACTOR - IRS NON-GUARANTEED SETTLEMENT Amount Crore`
Ma
y 2
01
8
MIBOR MIFOR INBMK TotalPeriod
TradesNotional
SumTrades
NotionalSum
TradesNotional
SumTrades
NotionalSum
2007-08 61665 3655595 16528 611566 368 13690 78561 4280852
2008-09 23732 1394018 11803 468045 461 18715 35996 1880778
2009-10 29853 1748787 8201 326852 450 20385 38504 2096024
2010-11 43197 2645709 6357 270080 542 26910 50096 2942699
2011-12 27613 1975121 6402 296491 520 25910 34535 2297521
2012-13 20958 1554242 6017 294937 489 24845 27464 1874024
2013-14 17782 1447259 5566 276349 445 22420 23793 1746028
2014-15 17279 1495595 6222 326724 387 19320 23888 1841640
2015-16 16858 1368453 6171 349766 272 13585 23301 1731804
2016-17 19901 1417357 6452 368613 161 8460 26514 1794430
2017-18 35414 2521244 7098 390259 138 7135 42650 2918638
April 2018 39449 2682231 7122 391827 135 6985 46706 3081042
Settlement Period Gross Amount Net Amount Netting %
2009-10 13827 3688 73.33
2010-11 22794 5250 76.97
2011-12 28328 7735 72.69
2012-13 23797 6732 71.71
2013-14 19667 6947 64.67
2014-15 16361 6073 62.88
2015-16 7374 2442 66.89
2016-17 5682 2110 62.87
2017-18 5440 1905 64.99
Apr - 18 395 139 64.85
132
statistics
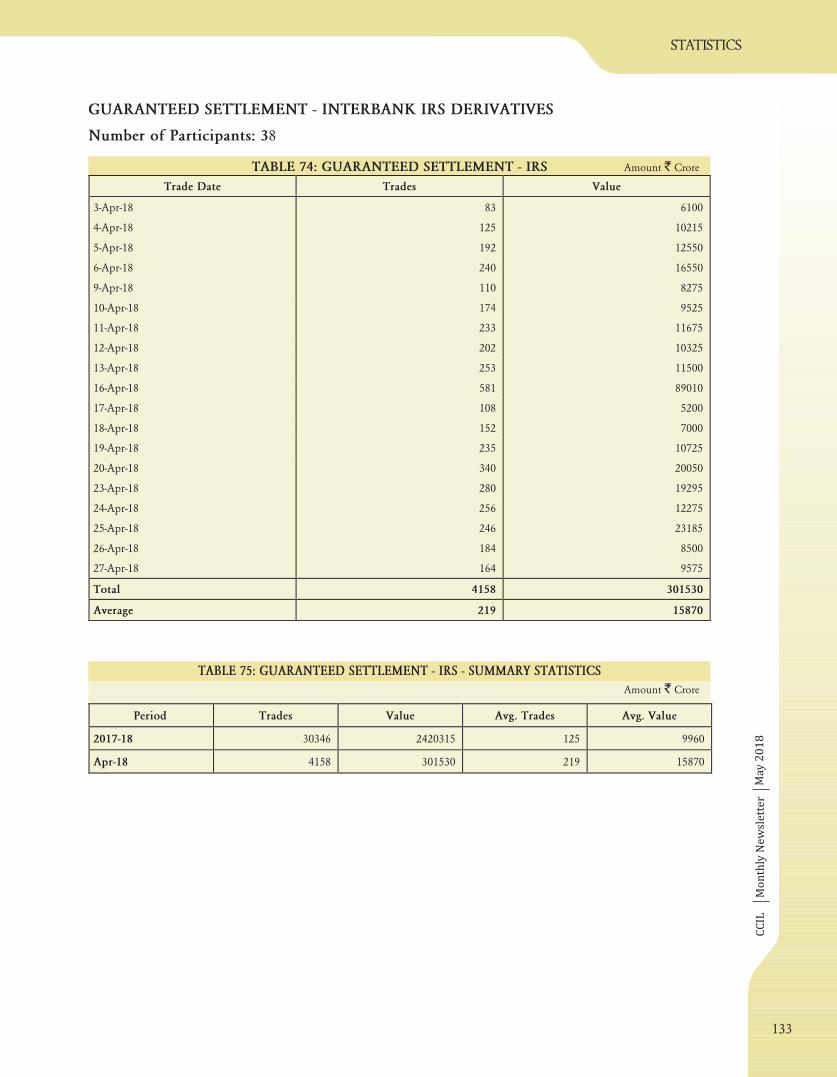
CC
ILM
on
thly
Ne
wsl
ett
er
TABLE 74: GUARANTEED SETTLEMENT - IRS Amount Crore`
TABLE 75: GUARANTEED SETTLEMENT - IRS - SUMMARY STATISTICS
Amount Crore`
GUARANTEED SETTLEMENT -
Number of Participants: 3
INTERBANK IRS DERIVATIVES
8
statistics
Ma
y 2
01
8
Trade Date Trades Value
3-Apr-18 83 6100
4-Apr-18 125 10215
5-Apr-18 192 12550
6-Apr-18 240 16550
9-Apr-18 110 8275
10-Apr-18 174 9525
11-Apr-18 233 11675
12-Apr-18 202 10325
13-Apr-18 253 11500
16-Apr-18 581 89010
17-Apr-18 108 5200
18-Apr-18 152 7000
19-Apr-18 235 10725
20-Apr-18 340 20050
23-Apr-18 280 19295
24-Apr-18 256 12275
25-Apr-18 246 23185
26-Apr-18 184 8500
27-Apr-18 164 9575
Total 4158 301530
Average 219 15870
Period Trades Value Avg. Trades Avg. Value
2017-18 30346 2420315 125 9960
Apr-18 4158 301530 219 15870
133
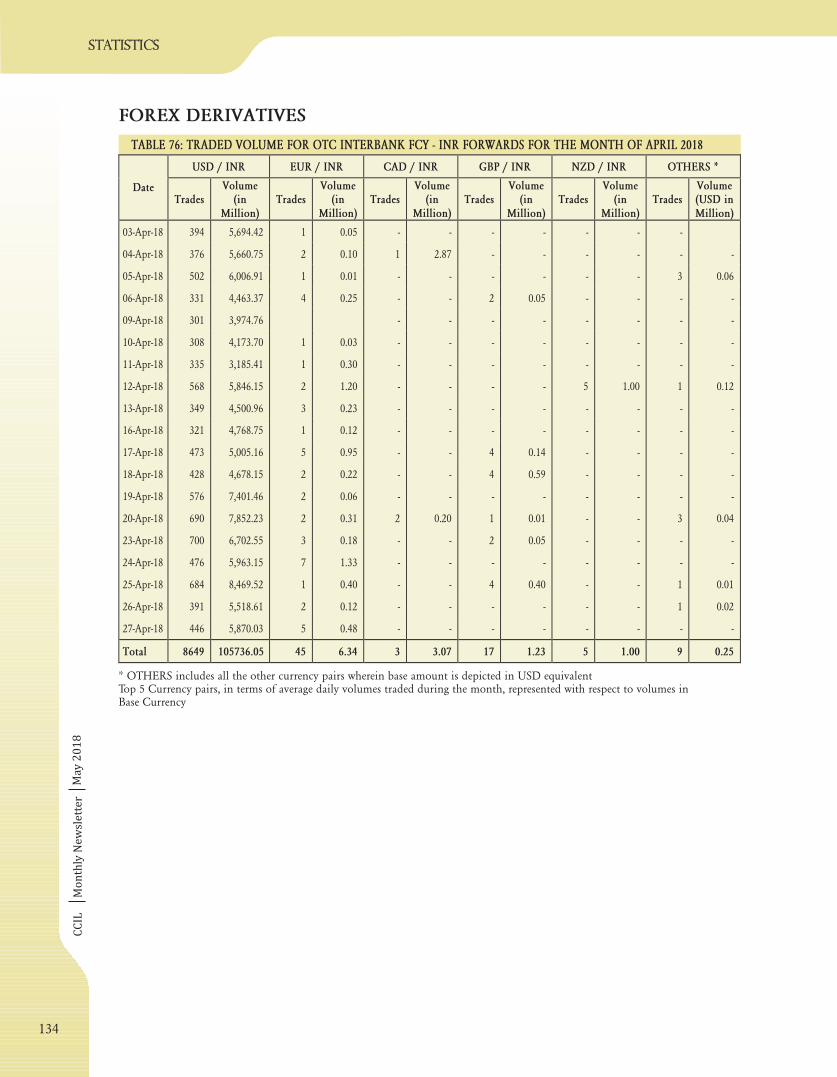
CC
ILM
on
thly
Ne
wsl
ett
er
TABLE : TRADED VOLUME FOR OTC INTERBANK FCY - INR FORWARDS FOR THE MONTH OF76 APRIL 2018
FOREX DERIVATIVES
* OTHERS includes all the other currency pairs wherein base amount is depicted in USD equivalentTop 5 Currency pairs, in terms of average daily volumes traded during the month, represented with respect to volumes inBase Currency
Ma
y 2
01
8
USD / INR EUR / INR CAD / INR GBP / INR NZD / INR OTHERS *
DateTrades
Volume(in
Million)Trades
Volume(in
Million)Trades
Volume(in
Million)Trades
Volume(in
Million)Trades
Volume(in
Million)Trades
Volume(USD inMillion)
03-Apr-18 394 5,694.42 1 0.05 - - - - - - -
04-Apr-18 376 5,660.75 2 0.10 1 2.87 - - - - - -
05-Apr-18 502 6,006.91 1 0.01 - - - - - - 3 0.06
06-Apr-18 331 4,463.37 4 0.25 - - 2 0.05 - - - -
09-Apr-18 301 3,974.76 - - - - - - - -
10-Apr-18 308 4,173.70 1 0.03 - - - - - - - -
11-Apr-18 335 3,185.41 1 0.30 - - - - - - - -
12-Apr-18 568 5,846.15 2 1.20 - - - - 5 1.00 1 0.12
13-Apr-18 349 4,500.96 3 0.23 - - - - - - - -
16-Apr-18 321 4,768.75 1 0.12 - - - - - - - -
17-Apr-18 473 5,005.16 5 0.95 - - 4 0.14 - - - -
18-Apr-18 428 4,678.15 2 0.22 - - 4 0.59 - - - -
19-Apr-18 576 7,401.46 2 0.06 - - - - - - - -
20-Apr-18 690 7,852.23 2 0.31 2 0.20 1 0.01 - - 3 0.04
23-Apr-18 700 6,702.55 3 0.18 - - 2 0.05 - - - -
24-Apr-18 476 5,963.15 7 1.33 - - - - - - - -
25-Apr-18 684 8,469.52 1 0.40 - - 4 0.40 - - 1 0.01
26-Apr-18 391 5,518.61 2 0.12 - - - - - - 1 0.02
27-Apr-18 446 5,870.03 5 0.48 - - - - - - - -
Total 8649 105736.05 45 6.34 3 3.07 17 1.23 5 1.00 9 0.25
134
statistics
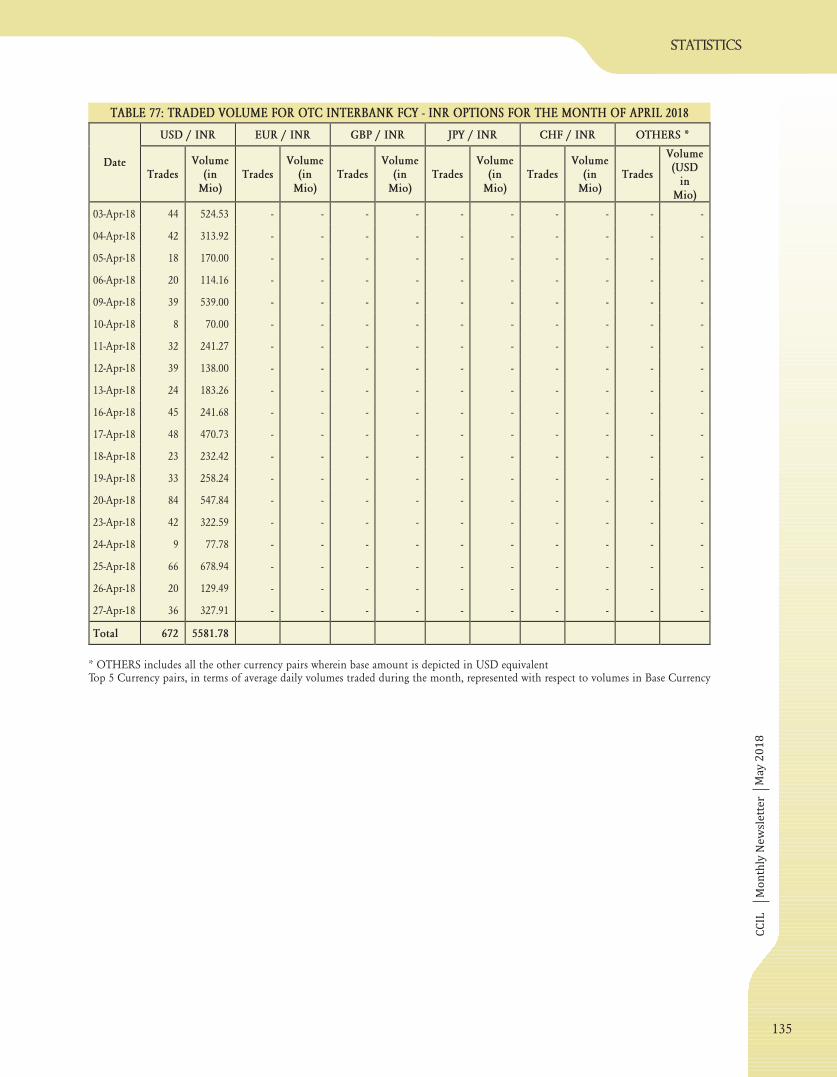
CC
ILM
on
thly
Ne
wsl
ett
er
TABLE 7 : TRADED VOLUME FOR OTC INTERBANK FCY - INR OPTIONS FOR THE MONTH OF7 APRIL 2018
* OTHERS includes all the other currency pairs wherein base amount is depicted in USD equivalentTop 5 Currency pairs, in terms of average daily volumes traded during the month, represented with respect to volumes in Base Currency
statistics
Ma
y 2
01
8
USD / INR EUR / INR GBP / INR JPY / INR CHF / INR OTHERS *
DateTrades
Volume(in
Mio)Trades
Volume(in
Mio)Trades
Volume(in
Mio)Trades
Volume(in
Mio)Trades
Volume(in
Mio)Trades
Volume(USD
inMio)
03-Apr-18 44 524.53 - - - - - - - - - -
04-Apr-18 42 313.92 - - - - - - - - - -
05-Apr-18 18 170.00 - - - - - - - - - -
06-Apr-18 20 114.16 - - - - - - - - - -
09-Apr-18 39 539.00 - - - - - - - - - -
10-Apr-18 8 70.00 - - - - - - - - - -
11-Apr-18 32 241.27 - - - - - - - - - -
12-Apr-18 39 138.00 - - - - - - - - - -
13-Apr-18 24 183.26 - - - - - - - - - -
16-Apr-18 45 241.68 - - - - - - - - - -
17-Apr-18 48 470.73 - - - - - - - - - -
18-Apr-18 23 232.42 - - - - - - - - - -
19-Apr-18 33 258.24 - - - - - - - - - -
20-Apr-18 84 547.84 - - - - - - - - - -
23-Apr-18 42 322.59 - - - - - - - - - -
24-Apr-18 9 77.78 - - - - - - - - - -
25-Apr-18 66 678.94 - - - - - - - - - -
26-Apr-18 20 129.49 - - - - - - - - - -
27-Apr-18 36 327.91 - - - - - - - - - -
Total 672 5581.78
135
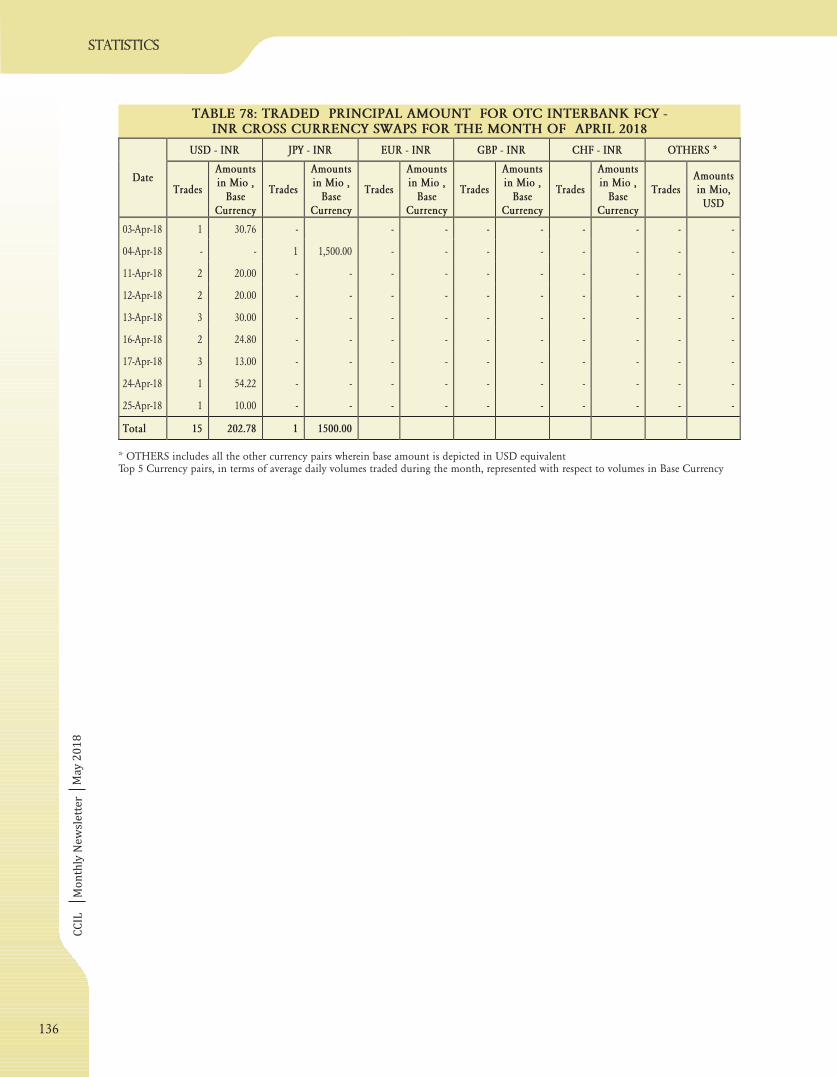
CC
ILM
on
thly
Ne
wsl
ett
er
TABLE 78: TRADED PRINCIPAL AMOUNT FOR OTC INTERBANK FCY -INR CROSS CURRENCY SWAPS FOR THE MONTH OF APRIL 2018
* OTHERS includes all the other currency pairs wherein base amount is depicted in USD equivalentTop 5 Currency pairs, in terms of average daily volumes traded during the month, represented with respect to volumes in Base Currency
Ma
y 2
01
8
USD - INR JPY - INR EUR - INR GBP - INR CHF - INR OTHERS *
DateTrades
Amountsin Mio ,
BaseCurrency
Trades
Amountsin Mio ,
BaseCurrency
Trades
Amountsin Mio ,
BaseCurrency
Trades
Amountsin Mio ,
BaseCurrency
Trades
Amountsin Mio ,
BaseCurrency
TradesAmountsin Mio,USD
03-Apr-18 1 30.76 - - - - - - - - -
04-Apr-18 - - 1 1,500.00 - - - - - - - -
11-Apr-18 2 20.00 - - - - - - - - - -
12-Apr-18 2 20.00 - - - - - - - - - -
13-Apr-18 3 30.00 - - - - - - - - - -
16-Apr-18 2 24.80 - - - - - - - - - -
17-Apr-18 3 13.00 - - - - - - - - - -
24-Apr-18 1 54.22 - - - - - - - - - -
25-Apr-18 1 10.00 - - - - - - - - - -
Total 15 202.78 1 1500.00
136
statistics
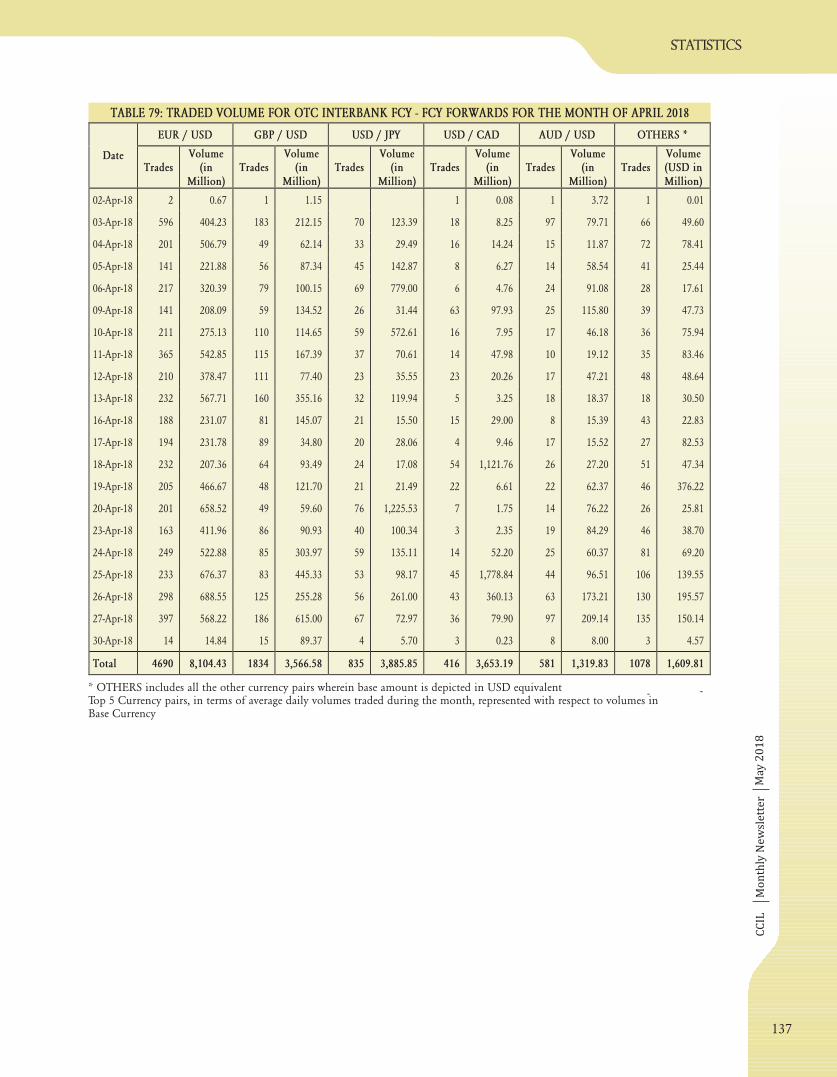
CC
ILM
on
thly
Ne
wsl
ett
er
TABLE 7 : TRADED VOLUME FOR OTC INTERBANK FCY - FCY FORWARDS FOR THE MONTH OF9 APRIL 2018
* OTHERS includes all the other currency pairs wherein base amount is depicted in USD equivalentTop 5 Currency pairs, in terms of average daily volumes traded during the month, represented with respect to volumes inBase Currency
statistics
--
Ma
y 2
01
8
EUR / USD GBP / USD USD / JPY USD / CAD AUD / USD OTHERS *
DateTrades
Volume(in
Million)Trades
Volume(in
Million)Trades
Volume(in
Million)Trades
Volume(in
Million)Trades
Volume(in
Million)Trades
Volume(USD inMillion)
02-Apr-18 2 0.67 1 1.15 1 0.08 1 3.72 1 0.01
03-Apr-18 596 404.23 183 212.15 70 123.39 18 8.25 97 79.71 66 49.60
04-Apr-18 201 506.79 49 62.14 33 29.49 16 14.24 15 11.87 72 78.41
05-Apr-18 141 221.88 56 87.34 45 142.87 8 6.27 14 58.54 41 25.44
06-Apr-18 217 320.39 79 100.15 69 779.00 6 4.76 24 91.08 28 17.61
09-Apr-18 141 208.09 59 134.52 26 31.44 63 97.93 25 115.80 39 47.73
10-Apr-18 211 275.13 110 114.65 59 572.61 16 7.95 17 46.18 36 75.94
11-Apr-18 365 542.85 115 167.39 37 70.61 14 47.98 10 19.12 35 83.46
12-Apr-18 210 378.47 111 77.40 23 35.55 23 20.26 17 47.21 48 48.64
13-Apr-18 232 567.71 160 355.16 32 119.94 5 3.25 18 18.37 18 30.50
16-Apr-18 188 231.07 81 145.07 21 15.50 15 29.00 8 15.39 43 22.83
17-Apr-18 194 231.78 89 34.80 20 28.06 4 9.46 17 15.52 27 82.53
18-Apr-18 232 207.36 64 93.49 24 17.08 54 1,121.76 26 27.20 51 47.34
19-Apr-18 205 466.67 48 121.70 21 21.49 22 6.61 22 62.37 46 376.22
20-Apr-18 201 658.52 49 59.60 76 1,225.53 7 1.75 14 76.22 26 25.81
23-Apr-18 163 411.96 86 90.93 40 100.34 3 2.35 19 84.29 46 38.70
24-Apr-18 249 522.88 85 303.97 59 135.11 14 52.20 25 60.37 81 69.20
25-Apr-18 233 676.37 83 445.33 53 98.17 45 1,778.84 44 96.51 106 139.55
26-Apr-18 298 688.55 125 255.28 56 261.00 43 360.13 63 173.21 130 195.57
27-Apr-18 397 568.22 186 615.00 67 72.97 36 79.90 97 209.14 135 150.14
30-Apr-18 14 14.84 15 89.37 4 5.70 3 0.23 8 8.00 3 4.57
Total 4690 8,104.43 1834 3,566.58 835 3,885.85 416 3,653.19 581 1,319.83 1078 1,609.81
137
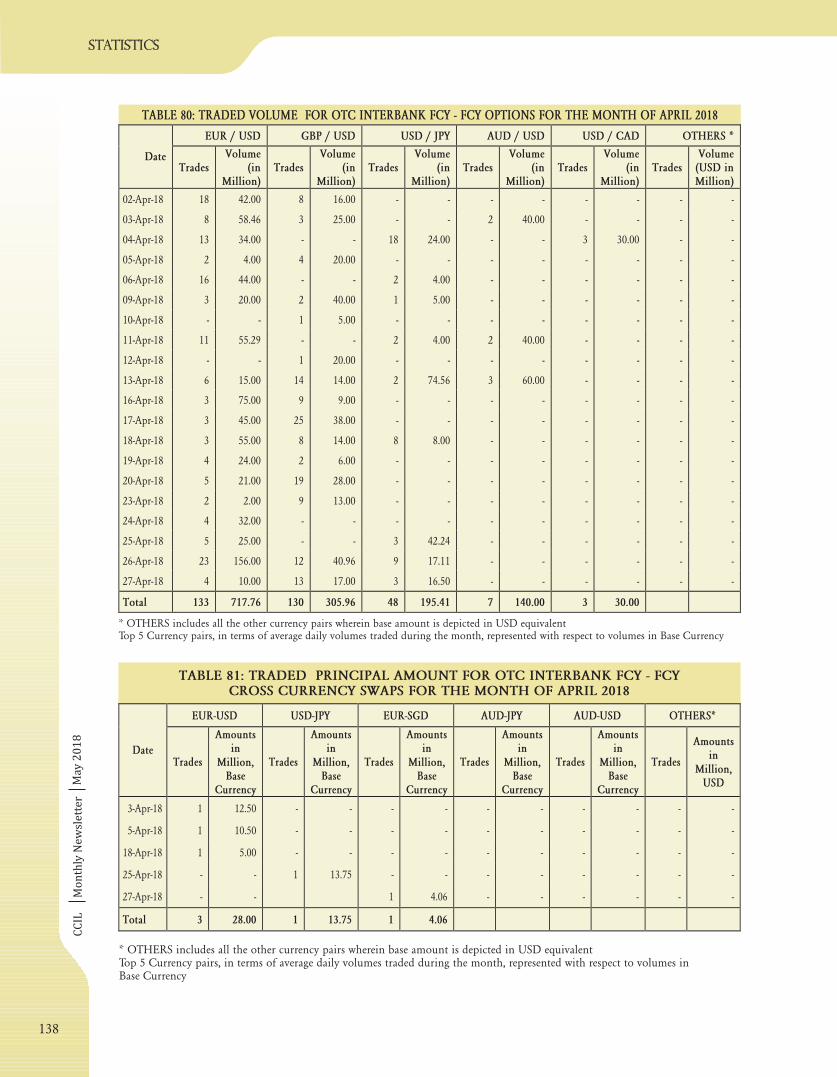
CC
ILM
on
thly
Ne
wsl
ett
er
TABLE : TRADED PRINCIPAL AMOUNT FOR OTC INTERBANK FCY - FCYCROSS CURRENCY SWAPS FOR THE MONTH OF81
APRIL 2018
* OTHERS includes all the other currency pairs wherein base amount is depicted in USD equivalentTop 5 Currency pairs, in terms of average daily volumes traded during the month, represented with respect to volumes inBase Currency
TABLE TRADED VOLUME FOR OTC INTERBANK FCY - FCY OPTIONS FOR THE MONTH OF80: APRIL 2018
* OTHERS includes all the other currency pairs wherein base amount is depicted in USD equivalentTop 5 Currency pairs, in terms of average daily volumes traded during the month, represented with respect to volumes in Base Currency
Ma
y 2
01
8
EUR-USD USD-JPY EUR-SGD AUD-JPY AUD-USD OTHERS*
DateTrades
Amountsin
Million,Base
Currency
Trades
Amountsin
Million,Base
Currency
Trades
Amountsin
Million,Base
Currency
Trades
Amountsin
Million,Base
Currency
Trades
Amountsin
Million,Base
Currency
Trades
Amountsin
Million,USD
3-Apr-18 1 12.50 - - - - - - - - - -
5-Apr-18 1 10.50 - - - - - - - - - -
18-Apr-18 1 5.00 - - - - - - - - - -
25-Apr-18 - - 1 13.75 - - - - - - - -
27-Apr-18 - - 1 4.06 - - - - - -
Total 3 28.00 1 13.75 1 4.06
EUR / USD GBP / USD USD / JPY AUD / USD USD / CAD OTHERS *
DateTrades
Volume(in
Million)Trades
Volume(in
Million)Trades
Volume(in
Million)Trades
Volume(in
Million)Trades
Volume(in
Million)Trades
Volume(USD inMillion)
02-Apr-18 18 42.00 8 16.00 - - - - - - - -
03-Apr-18 8 58.46 3 25.00 - - 2 40.00 - - - -
04-Apr-18 13 34.00 - - 18 24.00 - - 3 30.00 - -
05-Apr-18 2 4.00 4 20.00 - - - - - - - -
06-Apr-18 16 44.00 - - 2 4.00 - - - - - -
09-Apr-18 3 20.00 2 40.00 1 5.00 - - - - - -
10-Apr-18 - - 1 5.00 - - - - - - - -
11-Apr-18 11 55.29 - - 2 4.00 2 40.00 - - - -
12-Apr-18 - - 1 20.00 - - - - - - - -
13-Apr-18 6 15.00 14 14.00 2 74.56 3 60.00 - - - -
16-Apr-18 3 75.00 9 9.00 - - - - - - - -
17-Apr-18 3 45.00 25 38.00 - - - - - - - -
18-Apr-18 3 55.00 8 14.00 8 8.00 - - - - - -
19-Apr-18 4 24.00 2 6.00 - - - - - - - -
20-Apr-18 5 21.00 19 28.00 - - - - - - - -
23-Apr-18 2 2.00 9 13.00 - - - - - - - -
24-Apr-18 4 32.00 - - - - - - - - - -
25-Apr-18 5 25.00 - - 3 42.24 - - - - - -
26-Apr-18 23 156.00 12 40.96 9 17.11 - - - - - -
27-Apr-18 4 10.00 13 17.00 3 16.50 - - - - - -
Total 133 717.76 130 305.96 48 195.41 7 140.00 3 30.00
138
statistics
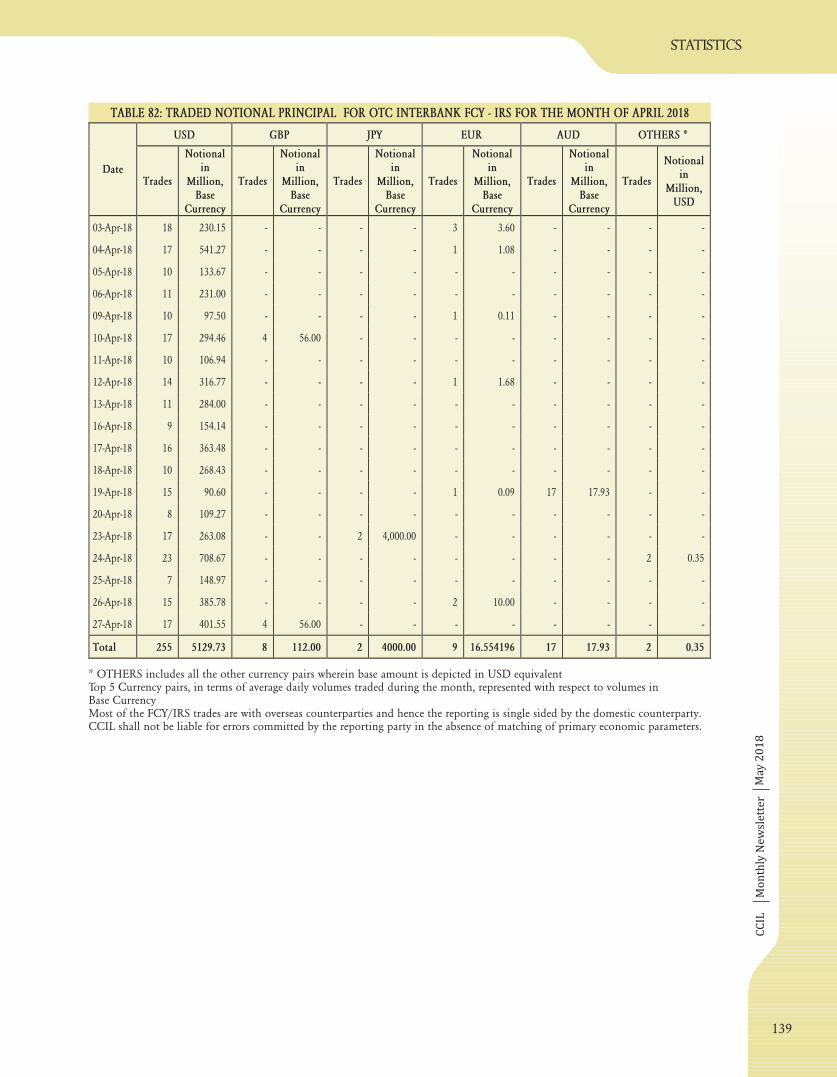
CC
ILM
on
thly
Ne
wsl
ett
er
TABLE : TRADED NOTIONAL PRINCIPAL FOR OTC INTERBANK FCY - IRS FOR THE MONTH OF82 APRIL 2018
* OTHERS includes all the other currency pairs wherein base amount is depicted in USD equivalentTop 5 Currency pairs, in terms of average daily volumes traded during the month, represented with respect to volumes inBase CurrencyMost of the FCY/IRS trades are with overseas counterparties and hence the reporting is single sided by the domestic counterparty.CCIL shall not be liable for errors committed by the reporting party in the absence of matching of primary economic parameters.
statistics
Ma
y 2
01
8
USD GBP JPY EUR AUD OTHERS *
DateTrades
Notionalin
Million,Base
Currency
Trades
Notionalin
Million,Base
Currency
Trades
Notionalin
Million,Base
Currency
Trades
Notionalin
Million,Base
Currency
Trades
Notionalin
Million,Base
Currency
Trades
Notionalin
Million,USD
03-Apr-18 18 230.15 - - - - 3 3.60 - - - -
04-Apr-18 17 541.27 - - - - 1 1.08 - - - -
05-Apr-18 10 133.67 - - - - - - - - - -
06-Apr-18 11 231.00 - - - - - - - - - -
09-Apr-18 10 97.50 - - - - 1 0.11 - - - -
10-Apr-18 17 294.46 4 56.00 - - - - - - - -
11-Apr-18 10 106.94 - - - - - - - - - -
12-Apr-18 14 316.77 - - - - 1 1.68 - - - -
13-Apr-18 11 284.00 - - - - - - - - - -
16-Apr-18 9 154.14 - - - - - - - - - -
17-Apr-18 16 363.48 - - - - - - - - - -
18-Apr-18 10 268.43 - - - - - - - - - -
19-Apr-18 15 90.60 - - - - 1 0.09 17 17.93 - -
20-Apr-18 8 109.27 - - - - - - - - - -
23-Apr-18 17 263.08 - - 2 4,000.00 - - - - - -
24-Apr-18 23 708.67 - - - - - - - - 2 0.35
25-Apr-18 7 148.97 - - - - - - - - - -
26-Apr-18 15 385.78 - - - - 2 10.00 - - - -
27-Apr-18 17 401.55 4 56.00 - - - - - - - -
Total 255 5129.73 8 112.00 2 4000.00 9 16.554196 17 17.93 2 0.35
139
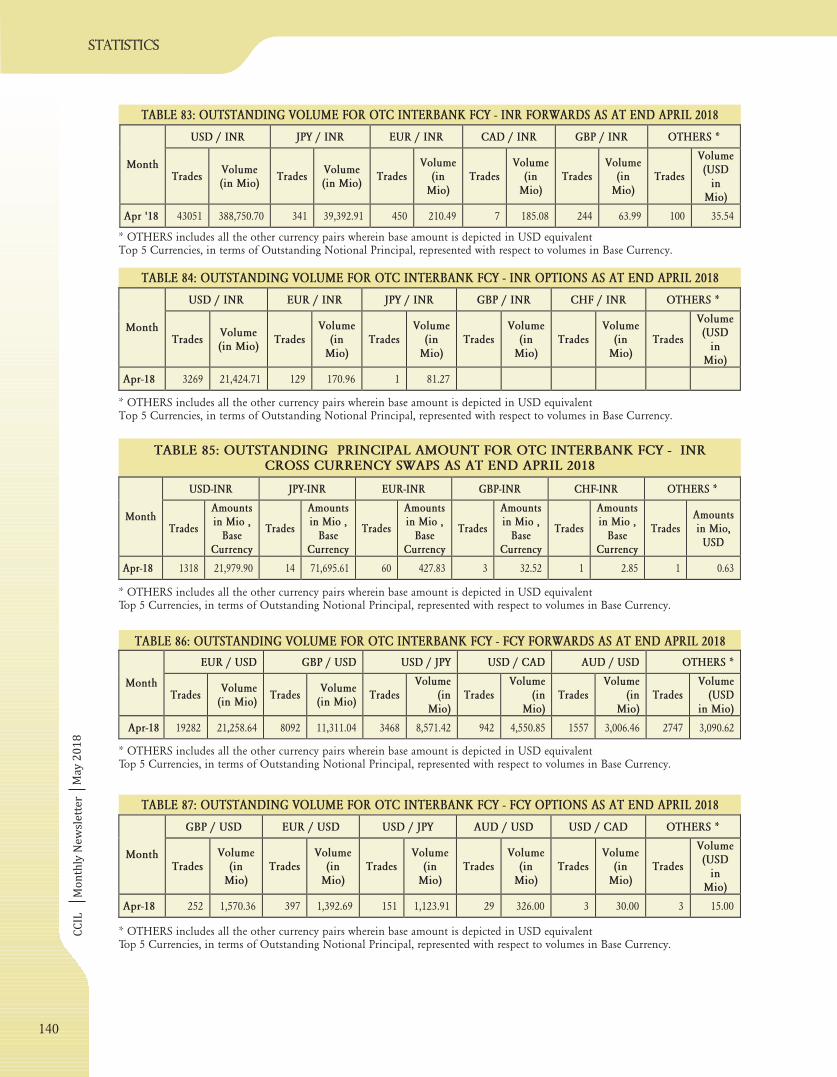
CC
ILM
on
thly
Ne
wsl
ett
er
TABLE : OUTSTANDING PRINCIPAL AMOUNT FOR OTC INTERBANK FCY - INRCROSS CURRENCY SWAPS AS AT END
85APRIL 2018
TABLE : OUTSTANDING VOLUME FOR OTC INTERBANK FCY - INR FORWARDS AS AT END83 APRIL 2018
TABLE : OUTSTANDING VOLUME FOR OTC INTERBANK FCY - INR OPTIONS AS AT END84 APRIL 2018
* OTHERS includes all the other currency pairs wherein base amount is depicted in USD equivalentTop 5 Currencies, in terms of Outstanding Notional Principal, represented with respect to volumes in Base Currency.
* OTHERS includes all the other currency pairs wherein base amount is depicted in USD equivalentTop 5 Currencies, in terms of Outstanding Notional Principal, represented with respect to volumes in Base Currency.
* OTHERS includes all the other currency pairs wherein base amount is depicted in USD equivalentTop 5 Currencies, in terms of Outstanding Notional Principal, represented with respect to volumes in Base Currency.
TABLE : OUTSTANDING VOLUME FOR OTC INTERBANK FCY - FCY OPTIONS AS AT END87 APRIL 2018
* OTHERS includes all the other currency pairs wherein base amount is depicted in USD equivalentTop 5 Currencies, in terms of Outstanding Notional Principal, represented with respect to volumes in Base Currency.
* OTHERS includes all the other currency pairs wherein base amount is depicted in USD equivalentTop 5 Currencies, in terms of Outstanding Notional Principal, represented with respect to volumes in Base Currency.
TABLE 86: OUTSTANDING VOLUME FOR OTC INTERBANK FCY - FCY FORWARDS AS AT END APRIL 2018
Ma
y 2
01
8
USD / INR JPY / INR EUR / INR CAD / INR GBP / INR OTHERS *
MonthTrades
Volume(in Mio)
TradesVolume(in Mio)
TradesVolume
(inMio)
TradesVolume
(inMio)
TradesVolume
(inMio)
Trades
Volume(USD
inMio)
Apr '18 43051 388,750.70 341 39,392.91 450 210.49 7 185.08 244 63.99 100 35.54
USD / INR EUR / INR JPY / INR GBP / INR CHF / INR OTHERS *
MonthTrades
Volume(in Mio)
TradesVolume
(inMio)
TradesVolume
(inMio)
TradesVolume
(inMio)
TradesVolume
(inMio)
Trades
Volume(USD
inMio)
Apr-18 3269 21,424.71 129 170.96 1 81.27
USD-INR JPY-INR EUR-INR GBP-INR CHF-INR OTHERS *
MonthTrades
Amountsin Mio ,
BaseCurrency
Trades
Amountsin Mio ,
BaseCurrency
Trades
Amountsin Mio ,
BaseCurrency
Trades
Amountsin Mio ,
BaseCurrency
Trades
Amountsin Mio ,
BaseCurrency
TradesAmountsin Mio,USD
Apr-18 1318 21,979.90 14 71,695.61 60 427.83 3 32.52 1 2.85 1 0.63
EUR / USD GBP / USD USD / JPY USD / CAD AUD / USD OTHERS *
MonthTrades
Volume(in Mio)
TradesVolume
(in Mio)Trades
Volume(in
Mio)Trades
Volume(in
Mio)Trades
Volume(in
Mio)Trades
Volume(USD
in Mio)
Apr-18 19282 21,258.64 8092 11,311.04 3468 8,571.42 942 4,550.85 1557 3,006.46 2747 3,090.62
GBP / USD EUR / USD USD / JPY AUD / USD USD / CAD OTHERS *
MonthTrades
Volume(in
Mio)Trades
Volume(in
Mio)Trades
Volume(in
Mio)Trades
Volume(in
Mio)Trades
Volume(in
Mio)Trades
Volume(USD
inMio)
Apr-18 252 1,570.36 397 1,392.69 151 1,123.91 29 326.00 3 30.00 3 15.00
140
statistics
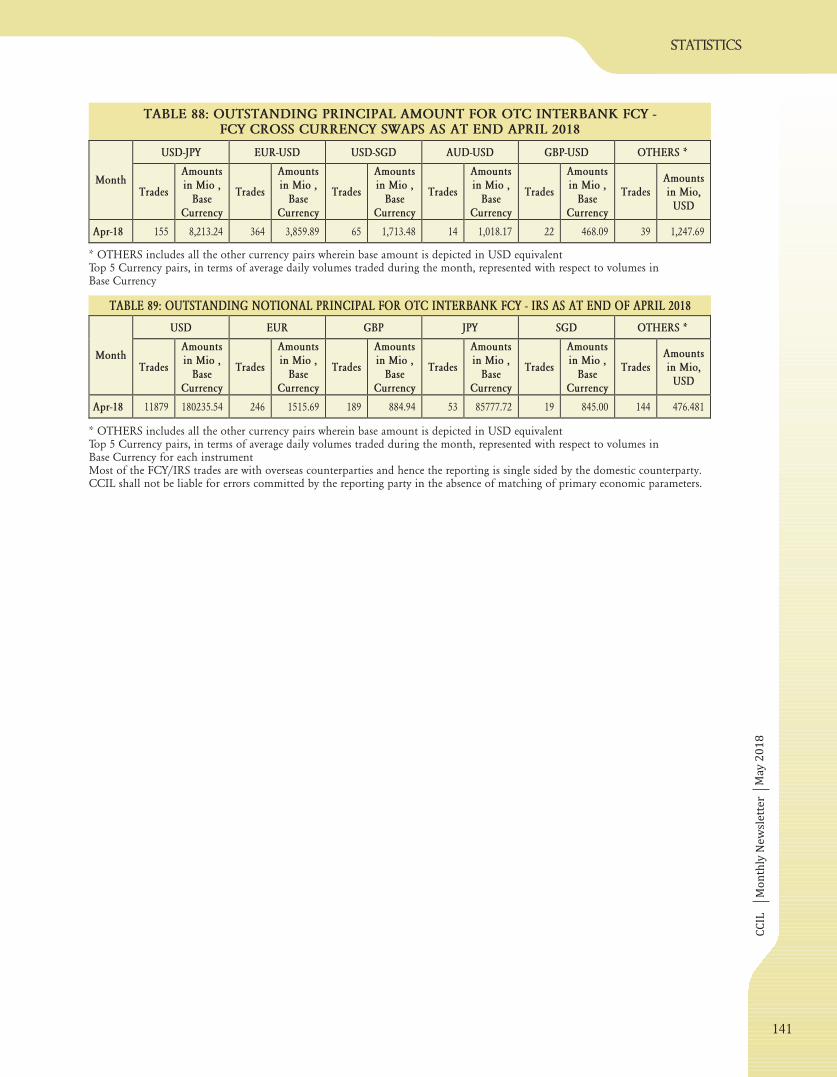
CC
ILM
on
thly
Ne
wsl
ett
er
TABLE 8 : OUTSTANDING NOTIONAL PRINCIPAL FOR OTC INTERBANK FCY - IRS AS AT END OF9 APRIL 2018
* OTHERS includes all the other currency pairs wherein base amount is depicted in USD equivalentTop 5 Currency pairs, in terms of average daily volumes traded during the month, represented with respect to volumes inBase Currency for each instrumentMost of the FCY/IRS trades are with overseas counterparties and hence the reporting is single sided by the domestic counterparty.CCIL shall not be liable for errors committed by the reporting party in the absence of matching of primary economic parameters.
TABLE 8 : OUTSTANDING PRINCIPAL AMOUNT FOR OTC INTERBANK FCY -FCY CROSS CURRENCY SWAPS AS AT END
8APRIL 2018
* OTHERS includes all the other currency pairs wherein base amount is depicted in USD equivalentTop 5 Currency pairs, in terms of average daily volumes traded during the month, represented with respect to volumes inBase Currency
statistics
Ma
y 2
01
8
USD-JPY EUR-USD USD-SGD AUD-USD GBP-USD OTHERS *
MonthTrades
Amountsin Mio ,
BaseCurrency
Trades
Amountsin Mio ,
BaseCurrency
Trades
Amountsin Mio ,
BaseCurrency
Trades
Amountsin Mio ,
BaseCurrency
Trades
Amountsin Mio ,
BaseCurrency
TradesAmountsin Mio,USD
Apr-18 155 8,213.24 364 3,859.89 65 1,713.48 14 1,018.17 22 468.09 39 1,247.69
USD EUR GBP JPY SGD OTHERS *
MonthTrades
Amountsin Mio ,
BaseCurrency
Trades
Amountsin Mio ,
BaseCurrency
Trades
Amountsin Mio ,
BaseCurrency
Trades
Amountsin Mio ,
BaseCurrency
Trades
Amountsin Mio ,
BaseCurrency
TradesAmountsin Mio,USD
Apr-18 11879 180235.54 246 1515.69 189 884.94 53 85777.72 19 845.00 144 476.481
141
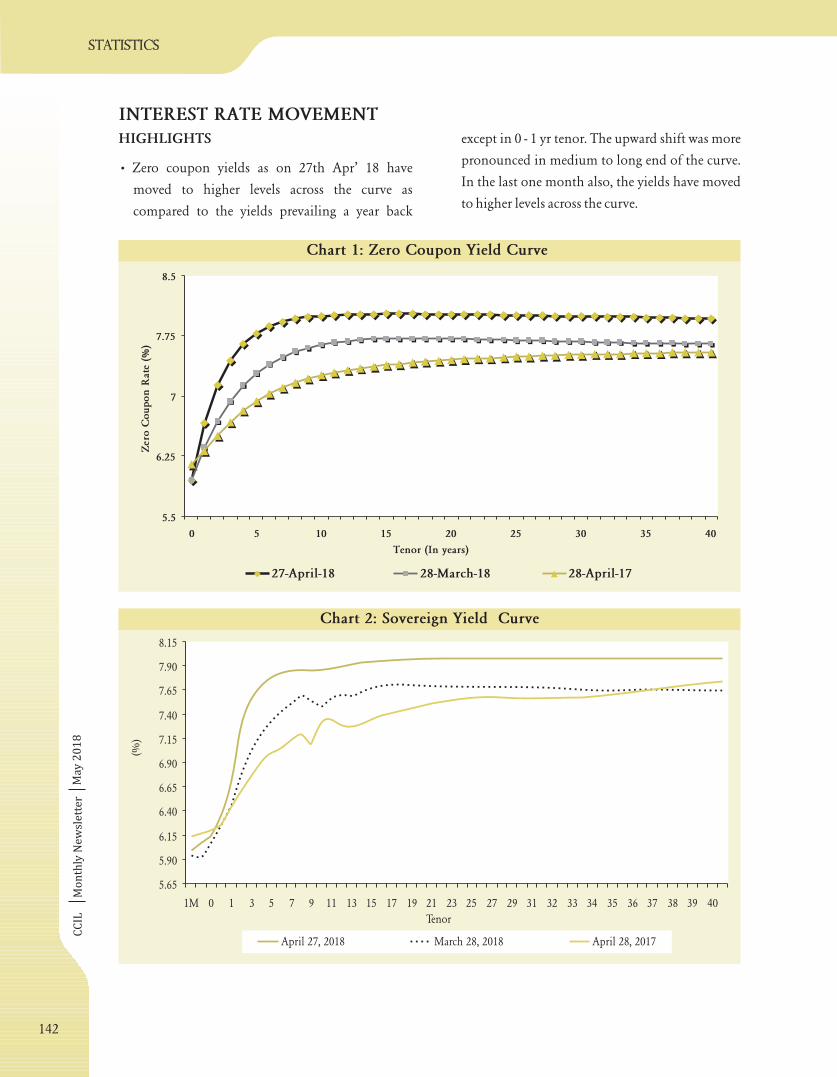
5.5
6.25
7
7.75
8.5
0 5 10 15 20 25 30 35 40
Tenor (In years)
Zer
oC
oupon
Rat
e(%
)
27-April-18 28-March-18 28-April-17
CC
ILM
on
thly
Ne
wsl
ett
er
HIGHLIGHTS
• Zero coupon yields as on 27th Apr’ 18 have
moved to higher levels across the curve as
compared to the yields prevailing a year back
except in 0 - 1 yr tenor. The upward shift was more
pronounced in medium to long end of the curve.
In the last one month also, the yields have moved
to higher levels across the curve.
INTEREST RATE MOVEMENT
Chart 1: Zero Coupon Yield Curve
Chart 2: Sovereign Yield Curve
Ma
y 2
01
8
5.65
5.90
6.15
6.40
6.65
6.90
7.15
7.40
7.65
7.90
8.15
1M 0 1 3 5 7 9 11 13 15 17 19 21 23 25 27 29 31 32 33 34 35 36 37 38 39 40
Tenor
(%)
April 27, 2018 March 28, 2018 April 28, 2017
142
statistics
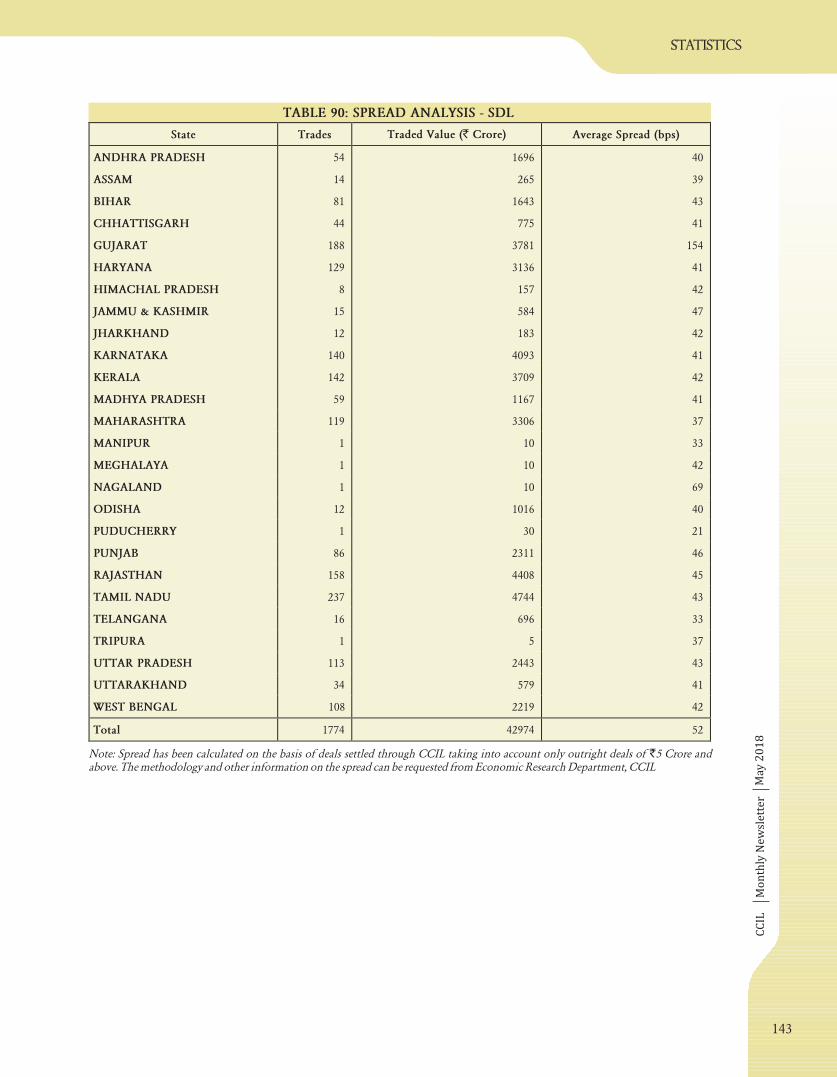
CC
ILM
on
thly
Ne
wsl
ett
er
TABLE 90: SPREAD ANALYSIS - SDL
Note: Spread has been calculated on the basis of deals settled through CCIL taking into account only outright deals of 5 Crore andabove. The methodology and other information on the spread can be requested from Economic Research Department, CCIL
`
statistics
Ma
y 2
01
8
State Trades Traded Value (` Crore) Average Spread (bps)
ANDHRA PRADESH 54 1696 40
ASSAM 14 265 39
BIHAR 81 1643 43
CHHATTISGARH 44 775 41
GUJARAT 188 3781 154
HARYANA 129 3136 41
HIMACHAL PRADESH 8 157 42
JAMMU & KASHMIR 15 584 47
JHARKHAND 12 183 42
KARNATAKA 140 4093 41
KERALA 142 3709 42
MADHYA PRADESH 59 1167 41
MAHARASHTRA 119 3306 37
MANIPUR 1 10 33
MEGHALAYA 1 10 42
NAGALAND 1 10 69
ODISHA 12 1016 40
PUDUCHERRY 1 30 21
PUNJAB 86 2311 46
RAJASTHAN 158 4408 45
TAMIL NADU 237 4744 43
TELANGANA 16 696 33
TRIPURA 1 5 37
UTTAR PRADESH 113 2443 43
UTTARAKHAND 34 579 41
WEST BENGAL 108 2219 42
Total 1774 42974 52
143
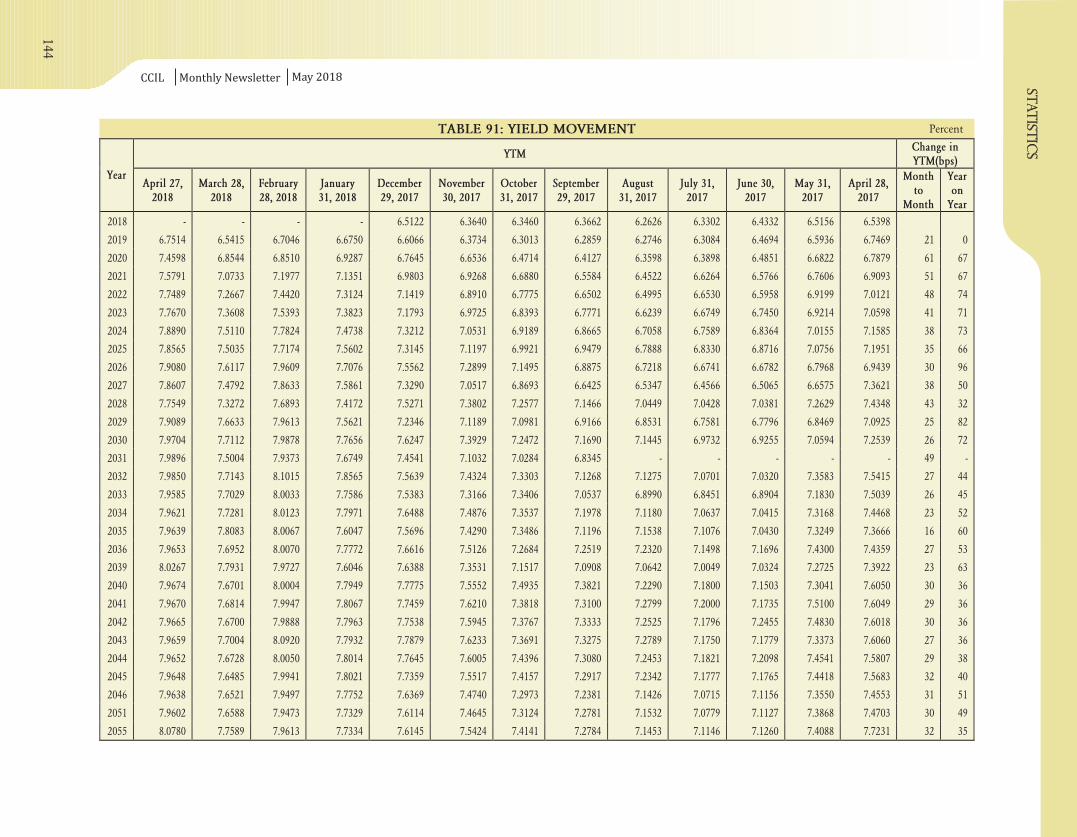
CCIL Monthly Newsletter
TABLE 91: YIELD MOVEMENT Percent
May 2018
YTMChange inYTM(bps)
YearApril 27,
2018March 28,
2018February28, 2018
January31, 2018
December29, 2017
November30, 2017
October31, 2017
September29, 2017
August31, 2017
July 31,2017
June 30,2017
May 31,2017
April 28,2017
Monthto
Month
Yearon
Year
2018 - - - - 6.5122 6.3640 6.3460 6.3662 6.2626 6.3302 6.4332 6.5156 6.5398
2019 6.7514 6.5415 6.7046 6.6750 6.6066 6.3734 6.3013 6.2859 6.2746 6.3084 6.4694 6.5936 6.7469 21 0
2020 7.4598 6.8544 6.8510 6.9287 6.7645 6.6536 6.4714 6.4127 6.3598 6.3898 6.4851 6.6822 6.7879 61 67
2021 7.5791 7.0733 7.1977 7.1351 6.9803 6.9268 6.6880 6.5584 6.4522 6.6264 6.5766 6.7606 6.9093 51 67
2022 7.7489 7.2667 7.4420 7.3124 7.1419 6.8910 6.7775 6.6502 6.4995 6.6530 6.5958 6.9199 7.0121 48 74
2023 7.7670 7.3608 7.5393 7.3823 7.1793 6.9725 6.8393 6.7771 6.6239 6.6749 6.7450 6.9214 7.0598 41 71
2024 7.8890 7.5110 7.7824 7.4738 7.3212 7.0531 6.9189 6.8665 6.7058 6.7589 6.8364 7.0155 7.1585 38 73
2025 7.8565 7.5035 7.7174 7.5602 7.3145 7.1197 6.9921 6.9479 6.7888 6.8330 6.8716 7.0756 7.1951 35 66
2026 7.9080 7.6117 7.9609 7.7076 7.5562 7.2899 7.1495 6.8875 6.7218 6.6741 6.6782 6.7968 6.9439 30 96
2027 7.8607 7.4792 7.8633 7.5861 7.3290 7.0517 6.8693 6.6425 6.5347 6.4566 6.5065 6.6575 7.3621 38 50
2028 7.7549 7.3272 7.6893 7.4172 7.5271 7.3802 7.2577 7.1466 7.0449 7.0428 7.0381 7.2629 7.4348 43 32
2029 7.9089 7.6633 7.9613 7.5621 7.2346 7.1189 7.0981 6.9166 6.8531 6.7581 6.7796 6.8469 7.0925 25 82
2030 7.9704 7.7112 7.9878 7.7656 7.6247 7.3929 7.2472 7.1690 7.1445 6.9732 6.9255 7.0594 7.2539 26 72
2031 7.9896 7.5004 7.9373 7.6749 7.4541 7.1032 7.0284 6.8345 - - - - - 49 -
2032 7.9850 7.7143 8.1015 7.8565 7.5639 7.4324 7.3303 7.1268 7.1275 7.0701 7.0320 7.3583 7.5415 27 44
2033 7.9585 7.7029 8.0033 7.7586 7.5383 7.3166 7.3406 7.0537 6.8990 6.8451 6.8904 7.1830 7.5039 26 45
2034 7.9621 7.7281 8.0123 7.7971 7.6488 7.4876 7.3537 7.1978 7.1180 7.0637 7.0415 7.3168 7.4468 23 52
2035 7.9639 7.8083 8.0067 7.6047 7.5696 7.4290 7.3486 7.1196 7.1538 7.1076 7.0430 7.3249 7.3666 16 60
2036 7.9653 7.6952 8.0070 7.7772 7.6616 7.5126 7.2684 7.2519 7.2320 7.1498 7.1696 7.4300 7.4359 27 53
2039 8.0267 7.7931 7.9727 7.6046 7.6388 7.3531 7.1517 7.0908 7.0642 7.0049 7.0324 7.2725 7.3922 23 63
2040 7.9674 7.6701 8.0004 7.7949 7.7775 7.5552 7.4935 7.3821 7.2290 7.1800 7.1503 7.3041 7.6050 30 36
2041 7.9670 7.6814 7.9947 7.8067 7.7459 7.6210 7.3818 7.3100 7.2799 7.2000 7.1735 7.5100 7.6049 29 36
2042 7.9665 7.6700 7.9888 7.7963 7.7538 7.5945 7.3767 7.3333 7.2525 7.1796 7.2455 7.4830 7.6018 30 36
2043 7.9659 7.7004 8.0920 7.7932 7.7879 7.6233 7.3691 7.3275 7.2789 7.1750 7.1779 7.3373 7.6060 27 36
2044 7.9652 7.6728 8.0050 7.8014 7.7645 7.6005 7.4396 7.3080 7.2453 7.1821 7.2098 7.4541 7.5807 29 38
2045 7.9648 7.6485 7.9941 7.8021 7.7359 7.5517 7.4157 7.2917 7.2342 7.1777 7.1765 7.4418 7.5683 32 40
2046 7.9638 7.6521 7.9497 7.7752 7.6369 7.4740 7.2973 7.2381 7.1426 7.0715 7.1156 7.3550 7.4553 31 51
2051 7.9602 7.6588 7.9473 7.7329 7.6114 7.4645 7.3124 7.2781 7.1532 7.0779 7.1127 7.3868 7.4703 30 49
2055 8.0780 7.7589 7.9613 7.7334 7.6145 7.5424 7.4141 7.2784 7.1453 7.1146 7.1260 7.4088 7.7231 32 35
144
statis
tic
s
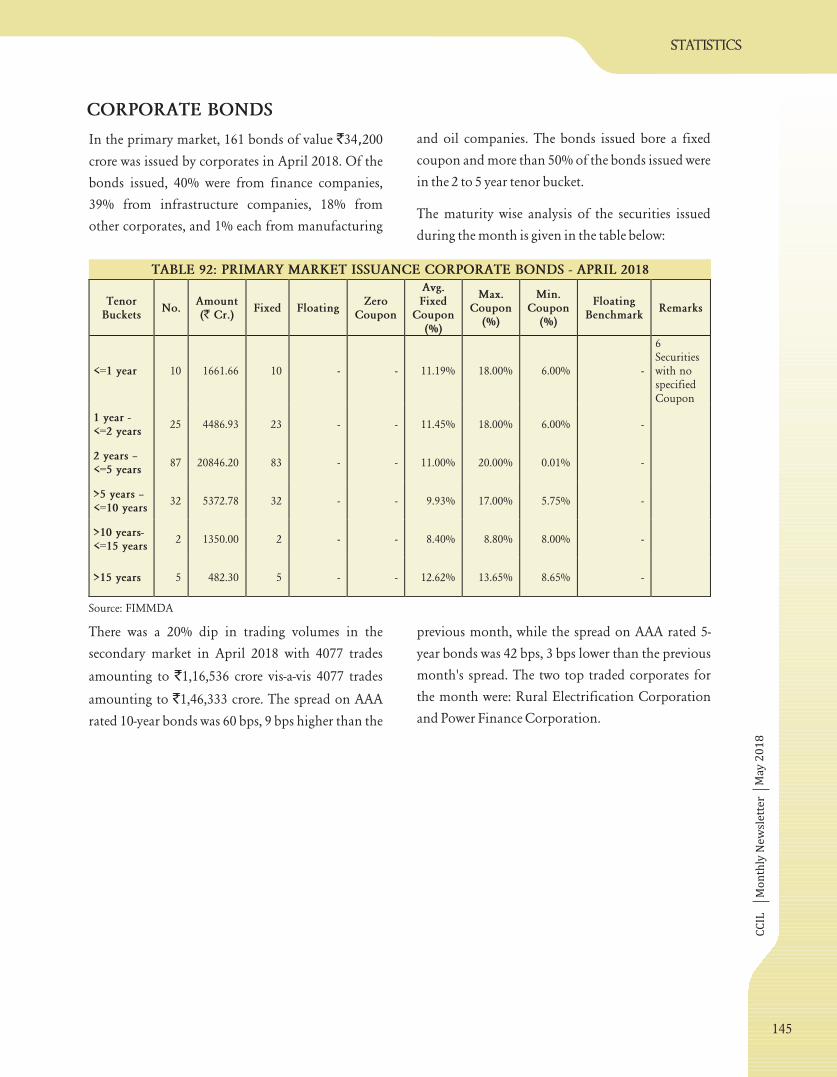
CC
ILM
on
thly
Ne
wsl
ett
er
In the primary market, 161 bonds of value 34 200
crore was issued by corporates in April 2018. Of the
bonds issued, 40% were from finance companies,
39% from infrastructure companies, 18% from
other corporates, and 1% each from manufacturing
and oil companies. The bonds issued bore a fixed
coupon and more than 50% of the bonds issued were
in the 2 to 5 year tenor bucket.
The maturity wise analysis of the securities issued
during the month is given in the table below:
` ,
TABLE 92: PRIMARY MARKET ISSUANCE CORPORATE BONDS - APRIL 2018
There was a 20% dip in trading volumes in the
secondary market in April 2018 with 4077 trades
amounting to 1,16,536 crore vis-a-vis 4077 trades
amounting to 1,46,333 crore. The spread on AAA
rated 10-year bonds was 60 bps, 9 bps higher than the
previous month, while the spread on AAA rated 5-
year bonds was 42 bps, 3 bps lower than the previous
month's spread. The two top traded corporates for
the month were: Rural Electrification Corporation
and Power Finance Corporation.
`
`
Source: FIMMDA
CORPORATE BONDS
statistics
Ma
y 2
01
8
TenorBuckets
No.Amount(` Cr.)
Fixed FloatingZero
Coupon
Avg.Fixed
Coupon(%)
Max.Coupon
(%)
Min.Coupon
(%)
FloatingBenchmark
Remarks
<=1 year 10 1661.66 10 - - 11.19% 18.00% 6.00% -
6Securitieswith nospecifiedCoupon
1 year -<=2 years
25 4486.93 23 - - 11.45% 18.00% 6.00% -
2 years –
<=5 years87 20846.20 83 - - 11.00% 20.00% 0.01% -
>5 years –
<=10 years32 5372.78 32 - - 9.93% 17.00% 5.75% -
>10 years-<=15 years
2 1350.00 2 - - 8.40% 8.80% 8.00% -
>15 years 5 482.30 5 - - 12.62% 13.65% 8.65% -
145
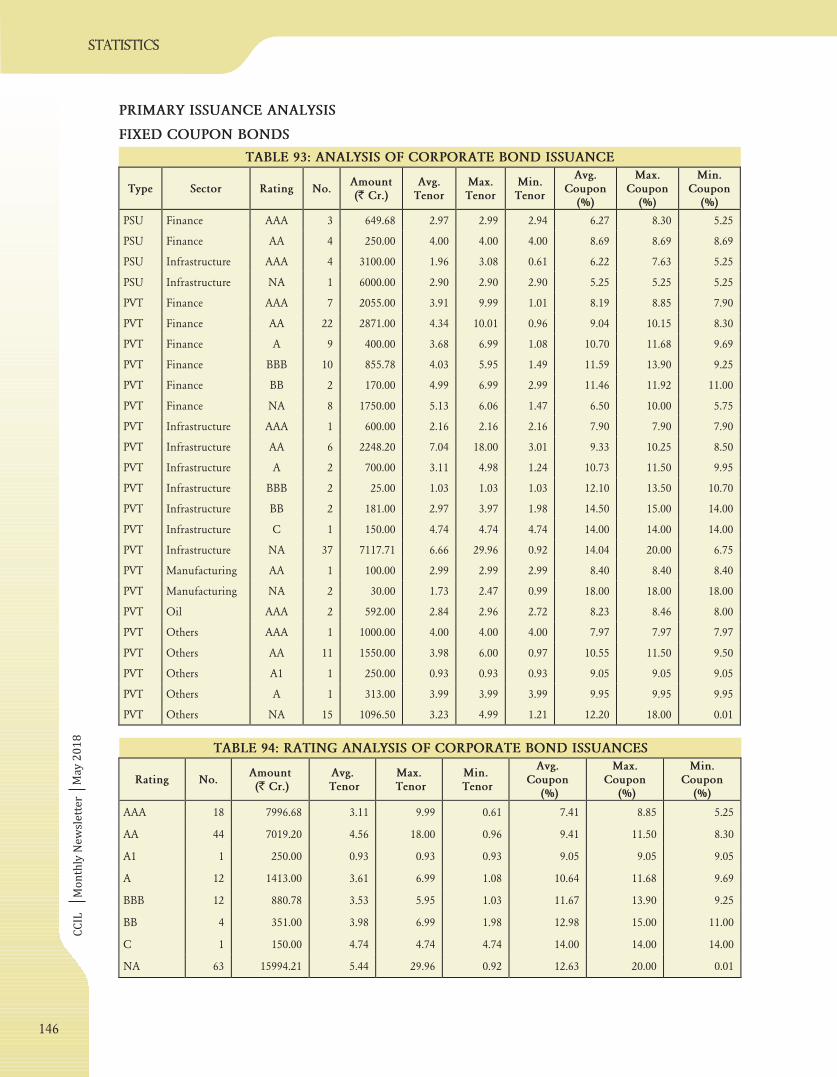
CC
ILM
on
thly
Ne
wsl
ett
er
PRIMARY ISSUANCE ANALYSIS
FIXED COUPON BONDS
TABLE 93: ANALYSIS OF CORPORATE BOND ISSUANCE
TABLE 94: RATING ANALYSIS OF CORPORATE BOND ISSUANCES
Ma
y 2
01
8
Type Sector Rating No.Amount(` Cr.)
Avg.Tenor
Max.Tenor
Min.Tenor
Avg.Coupon
(%)
Max.Coupon
(%)
Min.Coupon
(%)
PSU Finance AAA 3 649.68 2.97 2.99 2.94 6.27 8.30 5.25
PSU Finance AA 4 250.00 4.00 4.00 4.00 8.69 8.69 8.69
PSU Infrastructure AAA 4 3100.00 1.96 3.08 0.61 6.22 7.63 5.25
PSU Infrastructure NA 1 6000.00 2.90 2.90 2.90 5.25 5.25 5.25
PVT Finance AAA 7 2055.00 3.91 9.99 1.01 8.19 8.85 7.90
PVT Finance AA 22 2871.00 4.34 10.01 0.96 9.04 10.15 8.30
PVT Finance A 9 400.00 3.68 6.99 1.08 10.70 11.68 9.69
PVT Finance BBB 10 855.78 4.03 5.95 1.49 11.59 13.90 9.25
PVT Finance BB 2 170.00 4.99 6.99 2.99 11.46 11.92 11.00
PVT Finance NA 8 1750.00 5.13 6.06 1.47 6.50 10.00 5.75
PVT Infrastructure AAA 1 600.00 2.16 2.16 2.16 7.90 7.90 7.90
PVT Infrastructure AA 6 2248.20 7.04 18.00 3.01 9.33 10.25 8.50
PVT Infrastructure A 2 700.00 3.11 4.98 1.24 10.73 11.50 9.95
PVT Infrastructure BBB 2 25.00 1.03 1.03 1.03 12.10 13.50 10.70
PVT Infrastructure BB 2 181.00 2.97 3.97 1.98 14.50 15.00 14.00
PVT Infrastructure C 1 150.00 4.74 4.74 4.74 14.00 14.00 14.00
PVT Infrastructure NA 37 7117.71 6.66 29.96 0.92 14.04 20.00 6.75
PVT Manufacturing AA 1 100.00 2.99 2.99 2.99 8.40 8.40 8.40
PVT Manufacturing NA 2 30.00 1.73 2.47 0.99 18.00 18.00 18.00
PVT Oil AAA 2 592.00 2.84 2.96 2.72 8.23 8.46 8.00
PVT Others AAA 1 1000.00 4.00 4.00 4.00 7.97 7.97 7.97
PVT Others AA 11 1550.00 3.98 6.00 0.97 10.55 11.50 9.50
PVT Others A1 1 250.00 0.93 0.93 0.93 9.05 9.05 9.05
PVT Others A 1 313.00 3.99 3.99 3.99 9.95 9.95 9.95
PVT Others NA 15 1096.50 3.23 4.99 1.21 12.20 18.00 0.01
Rating No.Amount(` Cr.)
Avg.Tenor
Max.Tenor
Min.Tenor
Avg.Coupon
(%)
Max.Coupon
(%)
Min.Coupon
(%)
AAA 18 7996.68 3.11 9.99 0.61 7.41 8.85 5.25
AA 44 7019.20 4.56 18.00 0.96 9.41 11.50 8.30
A1 1 250.00 0.93 0.93 0.93 9.05 9.05 9.05
A 12 1413.00 3.61 6.99 1.08 10.64 11.68 9.69
BBB 12 880.78 3.53 5.95 1.03 11.67 13.90 9.25
BB 4 351.00 3.98 6.99 1.98 12.98 15.00 11.00
C 1 150.00 4.74 4.74 4.74 14.00 14.00 14.00
NA 63 15994.21 5.44 29.96 0.92 12.63 20.00 0.01
146
statistics

CC
ILM
on
thly
Ne
wsl
ett
er
TABLE 97: CATEGORY ANALYSIS
TABLE 98: NON-FIXED RATE BOND ISSUANCE ANALYSIS
VARIABLE/ZERO COUPON BONDS
TABLE 95: TOP 5 ISSUANCES
TABLE 96: SECTOR ANALYSIS
statistics
Ma
y 2
01
8
Company No.Amount(` Cr.)
Avg.Tenor
Max.Tenor
Min.Tenor
Avg.Coupon
(%)
Max.Coupon
(%)
Min.Coupon
(%)
%Share
NATIONAL HIGHWAYS AUTHORITY OF INDIA 1 6000.00 2.90 2.90 2.90 5.25 5.25 5.25 17.62
RURAL ELECTRIFICATION CORPORATION LIMITED 3 3000.00 1.59 2.97 0.61 5.75 6.00 5.25 8.81
LODHA DEVELOPERS LIMITED 1 1650.00 3.96 3.96 3.96 12.75 12.75 12.75 4.85
VEDANTA LIMITED 1 1650.00 3.19 3.19 3.19 8.50 8.50 8.50 4.85
SAI ASHRAY DEVELOPERS PVT LTD 1 1200.00 5.97 5.97 5.97 14.00 14.00 14.00 3.52
Sector No.Amount(` Cr.)
Avg.Tenor
Max.Tenor
Min.Tenor
Avg.Coupon
(%)
Max.Coupon
(%)
Min.Coupon
(%)
Finance 65 9001.46 4.19 10.01 0.96 9.18 13.90 5.25
Infrastructure 56 20121.91 5.72 29.96 0.61 12.53 20.00 5.25
Manufacturing 3 130.00 2.15 2.99 0.99 14.80 18.00 8.40
Oil 2 592.00 2.84 2.96 2.72 8.23 8.46 8.00
Others 29 4209.50 3.49 6.00 0.93 11.24 18.00 0.01
Type No.Amount(` Cr.)
Avg.Tenor
Max.Tenor
Min.Tenor
Avg.Coupon
(%)
Max.Coupon
(%)
Min.Coupon
(%)
PSU 12 9999.68 2.97 4.00 0.61 6.97 8.69 5.25
PVT 143 24055.19 4.69 29.96 0.92 11.20 20.00 0.01
Type No. Amount (` Cr.) Avg. Tenor Max. Tenor Min Tenor Remarks
Floating Rate - - - - - -
Zero Coupon Bond - - - - - -
147
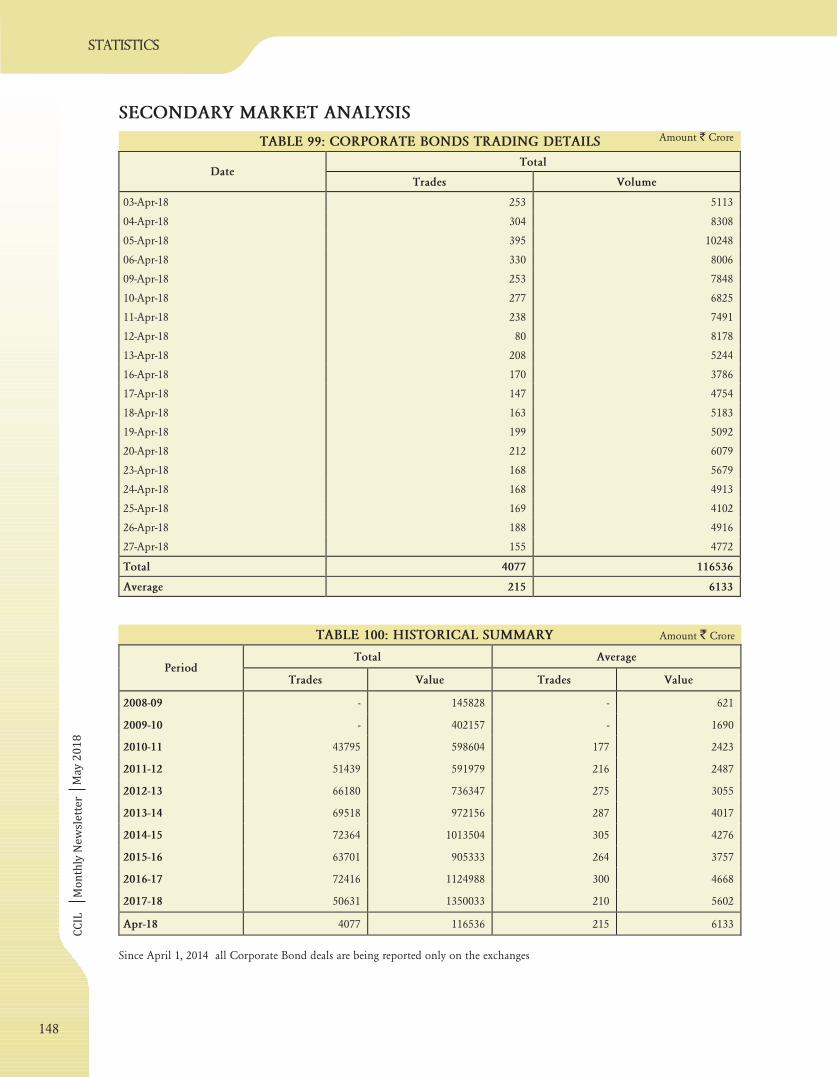
CC
ILM
on
thly
Ne
wsl
ett
er
SECONDARY MARKET ANALYSIS
Amount Crore`TABLE 99: CORPORATE BONDS TRADING DETAILS
TABLE 100: HISTORICAL SUMMARY Amount Crore`
Since April 1, 2014 all Corporate Bond deals are being reported only on the exchanges
Ma
y 2
01
8
TotalDate
Trades Volume
03-Apr-18 253 5113
04-Apr-18 304 8308
05-Apr-18 395 10248
06-Apr-18 330 8006
09-Apr-18 253 7848
10-Apr-18 277 6825
11-Apr-18 238 7491
12-Apr-18 80 8178
13-Apr-18 208 5244
16-Apr-18 170 3786
17-Apr-18 147 4754
18-Apr-18 163 5183
19-Apr-18 199 5092
20-Apr-18 212 6079
23-Apr-18 168 5679
24-Apr-18 168 4913
25-Apr-18 169 4102
26-Apr-18 188 4916
27-Apr-18 155 4772
Total 4077 116536
Average 215 6133
Total AveragePeriod
Trades Value Trades Value
2008-09 - 145828 - 621
2009-10 - 402157 - 1690
2010-11 43795 598604 177 2423
2011-12 51439 591979 216 2487
2012-13 66180 736347 275 3055
2013-14 69518 972156 287 4017
2014-15 72364 1013504 305 4276
2015-16 63701 905333 264 3757
2016-17 72416 1124988 300 4668
2017-18 50631 1350033 210 5602
Apr-18 4077 116536 215 6133
148
statistics
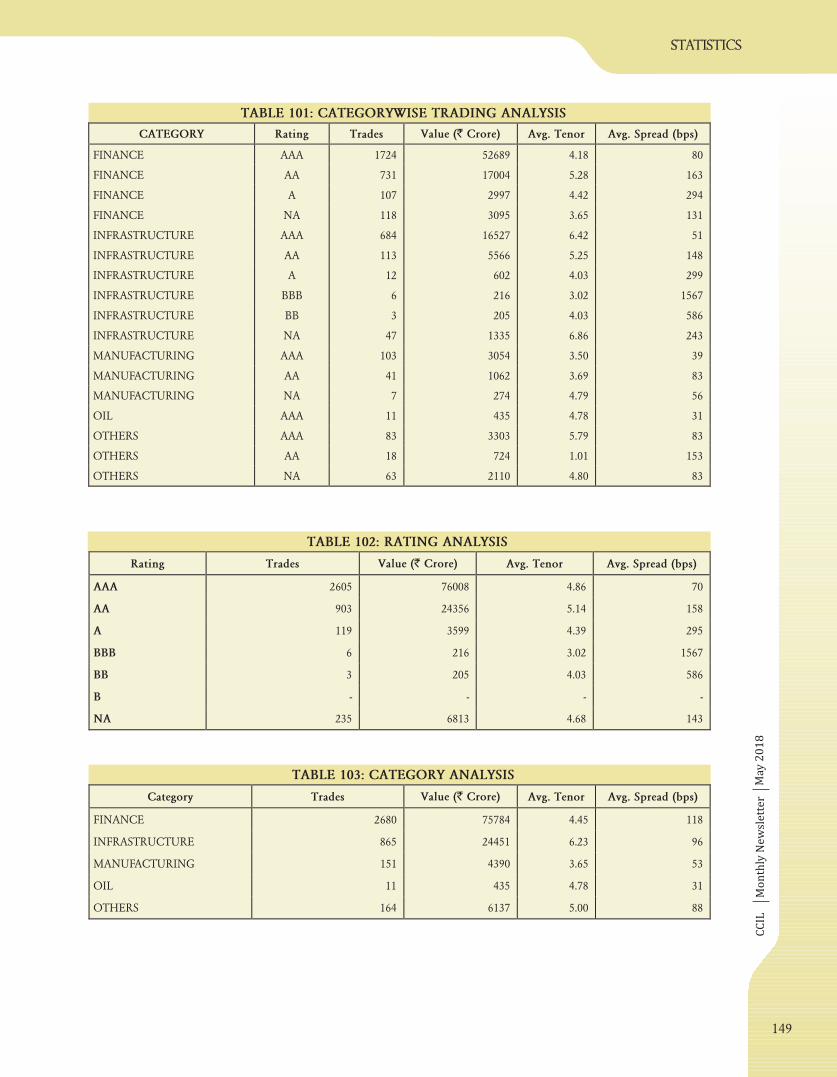
CC
ILM
on
thly
Ne
wsl
ett
er
TABLE 101: CATEGORYWISE TRADING ANALYSIS
TABLE 102: RATING ANALYSIS
TABLE 103: CATEGORY ANALYSIS
statistics
Ma
y 2
01
8
CATEGORY Rating Trades Value (` Crore) Avg. Tenor Avg. Spread (bps)
FINANCE AAA 1724 52689 4.18 80
FINANCE AA 731 17004 5.28 163
FINANCE A 107 2997 4.42 294
FINANCE NA 118 3095 3.65 131
INFRASTRUCTURE AAA 684 16527 6.42 51
INFRASTRUCTURE AA 113 5566 5.25 148
INFRASTRUCTURE A 12 602 4.03 299
INFRASTRUCTURE BBB 6 216 3.02 1567
INFRASTRUCTURE BB 3 205 4.03 586
INFRASTRUCTURE NA 47 1335 6.86 243
MANUFACTURING AAA 103 3054 3.50 39
MANUFACTURING AA 41 1062 3.69 83
MANUFACTURING NA 7 274 4.79 56
OIL AAA 11 435 4.78 31
OTHERS AAA 83 3303 5.79 83
OTHERS AA 18 724 1.01 153
OTHERS NA 63 2110 4.80 83
Rating Trades Value (` Crore) Avg. Tenor Avg. Spread (bps)
AAA 2605 76008 4.86 70
AA 903 24356 5.14 158
A 119 3599 4.39 295
BBB 6 216 3.02 1567
BB 3 205 4.03 586
B - - - -
NA 235 6813 4.68 143
Category Trades Value (` Crore) Avg. Tenor Avg. Spread (bps)
FINANCE 2680 75784 4.45 118
INFRASTRUCTURE 865 24451 6.23 96
MANUFACTURING 151 4390 3.65 53
OIL 11 435 4.78 31
OTHERS 164 6137 5.00 88
149
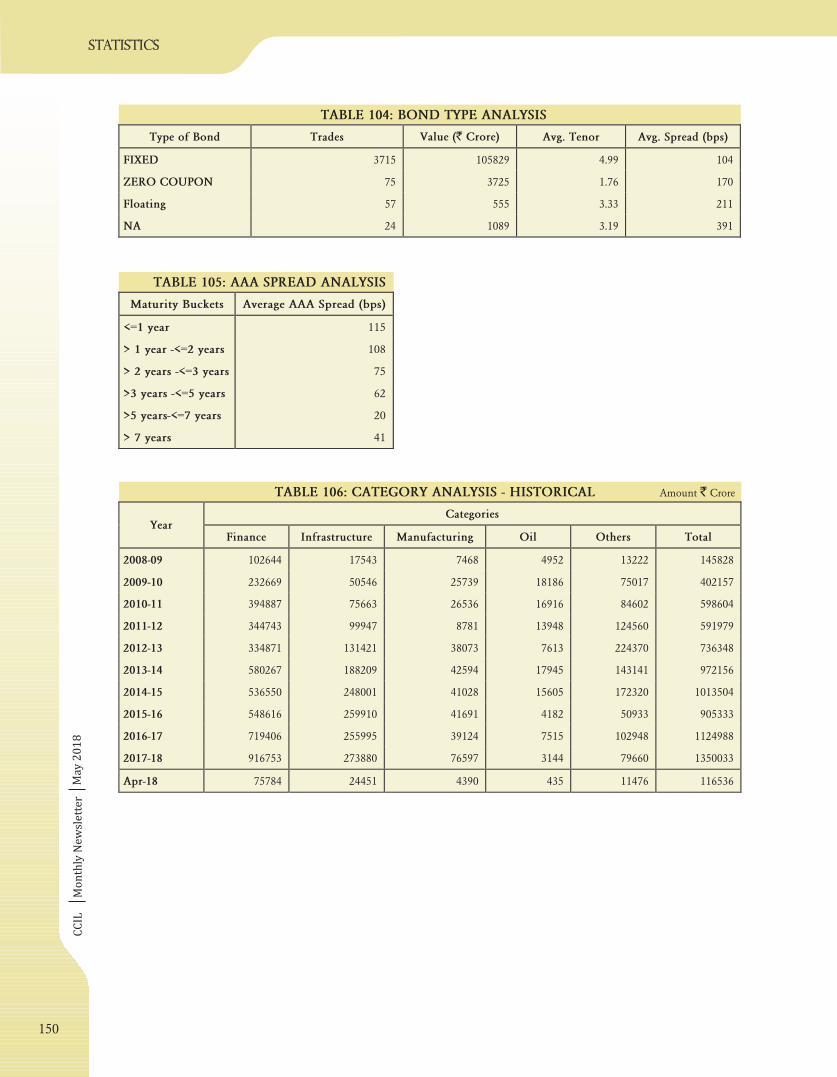
CC
ILM
on
thly
Ne
wsl
ett
er
TABLE 104: BOND TYPE ANALYSIS
TABLE 105: AAA SPREAD ANALYSIS
TABLE :106 CATEGORY ANALYSIS - HISTORICAL Amount Crore`
Ma
y 2
01
8
Type of Bond Trades Value (` Crore) Avg. Tenor Avg. Spread (bps)
FIXED 3715 105829 4.99 104
ZERO COUPON 75 3725 1.76 170
Floating 57 555 3.33 211
NA 24 1089 3.19 391
CategoriesYear
Finance Infrastructure Manufacturing Oil Others Total
2008-09 102644 17543 7468 4952 13222 145828
2009-10 232669 50546 25739 18186 75017 402157
2010-11 394887 75663 26536 16916 84602 598604
2011-12 344743 99947 8781 13948 124560 591979
2012-13 334871 131421 38073 7613 224370 736348
2013-14 580267 188209 42594 17945 143141 972156
2014-15 536550 248001 41028 15605 172320 1013504
2015-16 548616 259910 41691 4182 50933 905333
2016-17 719406 255995 39124 7515 102948 1124988
2017-18 916753 273880 76597 3144 79660 1350033
Apr-18 75784 24451 4390 435 11476 116536
Maturity Buckets Average AAA Spread (bps)
<=1 year 115
> 1 year -<=2 years 108
> 2 years -<=3 years 75
>3 years -<=5 years 62
>5 years-<=7 years 20
> 7 years 41
150
statistics
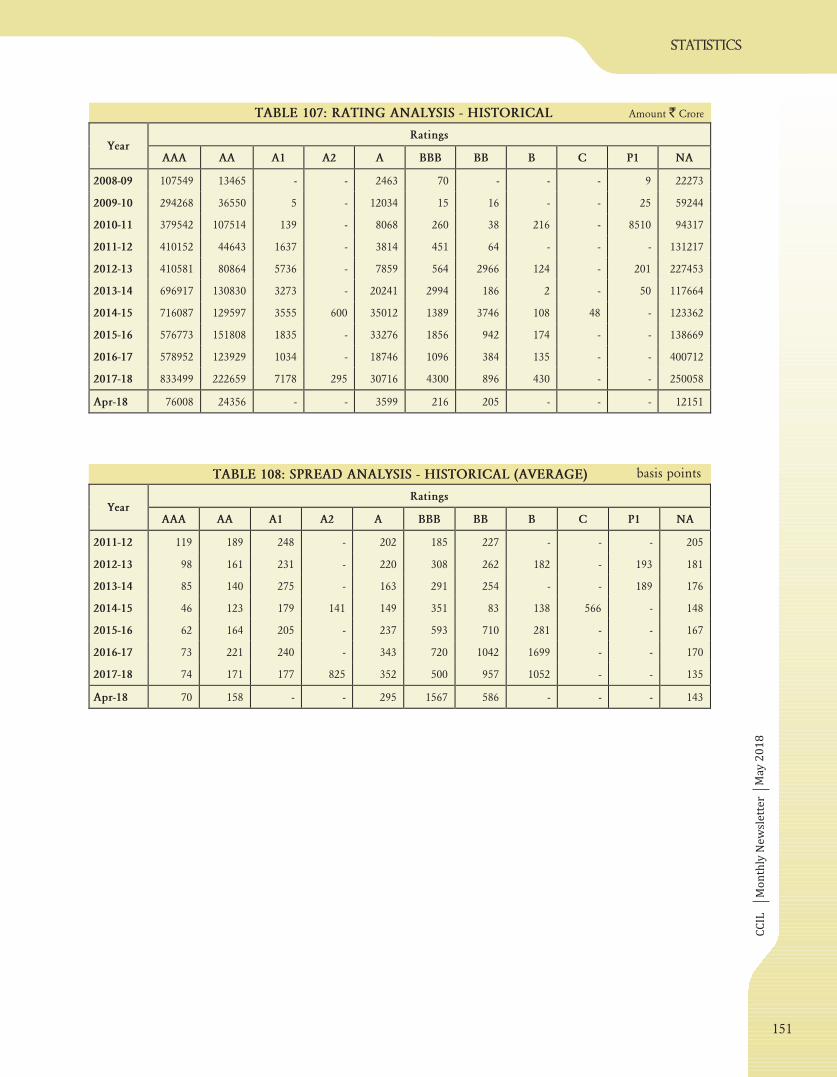
CC
ILM
on
thly
Ne
wsl
ett
er
TABLE : SPREAD ANALYSIS108 - HISTORICAL (AVERAGE) basis points
TABLE :107 RATING ANALYSIS - HISTORICAL Amount Crore`
statistics
Ma
y 2
01
8
RatingsYear
AAA AA A1 A2 A BBB BB B C P1 NA
2008-09 107549 13465 - - 2463 70 - - - 9 22273
2009-10 294268 36550 5 - 12034 15 16 - - 25 59244
2010-11 379542 107514 139 - 8068 260 38 216 - 8510 94317
2011-12 410152 44643 1637 - 3814 451 64 - - - 131217
2012-13 410581 80864 5736 - 7859 564 2966 124 - 201 227453
2013-14 696917 130830 3273 - 20241 2994 186 2 - 50 117664
2014-15 716087 129597 3555 600 35012 1389 3746 108 48 - 123362
2015-16 576773 151808 1835 - 33276 1856 942 174 - - 138669
2016-17 578952 123929 1034 - 18746 1096 384 135 - - 400712
2017-18 833499 222659 7178 295 30716 4300 896 430 - - 250058
Apr-18 76008 24356 - - 3599 216 205 - - - 12151
RatingsYear
AAA AA A1 A2 A BBB BB B C P1 NA
2011-12 119 189 248 - 202 185 227 - - - 205
2012-13 98 161 231 - 220 308 262 182 - 193 181
2013-14 85 140 275 - 163 291 254 - - 189 176
2014-15 46 123 179 141 149 351 83 138 566 - 148
2015-16 62 164 205 - 237 593 710 281 - - 167
2016-17 73 221 240 - 343 720 1042 1699 - - 170
2017-18 74 171 177 825 352 500 957 1052 - - 135
Apr-18 70 158 - - 295 1567 586 - - - 143
151
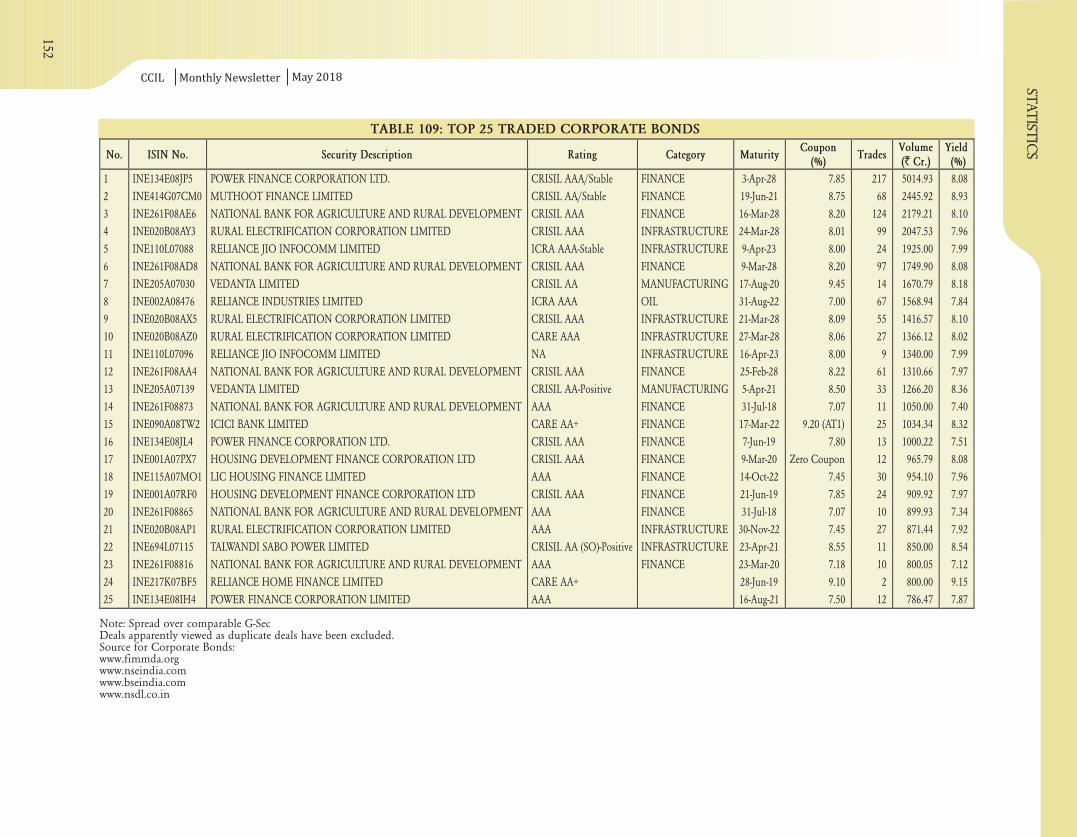
CCIL Monthly Newsletter
TABLE 109: TOP 25 TRADED CORPORATE BONDS
Note: Spread over comparable G-SecDeals apparently viewed as duplicate deals have been excluded.Source for Corporate Bonds:www.fimmda.orgwww.nseindia.comwww.bseindia.comwww.nsdl.co.in
May 2018
No. ISIN No. Security Description Rating Category MaturityCoupon
(%)Trades
Volume(` Cr.)
Yield(%)
1 INE134E08JP5 POWER FINANCE CORPORATION LTD. CRISIL AAA/Stable FINANCE 3-Apr-28 7.85 217 5014.93 8.08
2 INE414G07CM0 MUTHOOT FINANCE LIMITED CRISIL AA/Stable FINANCE 19-Jun-21 8.75 68 2445.92 8.93
3 INE261F08AE6 NATIONAL BANK FOR AGRICULTURE AND RURAL DEVELOPMENT CRISIL AAA FINANCE 16-Mar-28 8.20 124 2179.21 8.10
4 INE020B08AY3 RURAL ELECTRIFICATION CORPORATION LIMITED CRISIL AAA INFRASTRUCTURE 24-Mar-28 8.01 99 2047.53 7.96
5 INE110L07088 RELIANCE JIO INFOCOMM LIMITED ICRA AAA-Stable INFRASTRUCTURE 9-Apr-23 8.00 24 1925.00 7.99
6 INE261F08AD8 NATIONAL BANK FOR AGRICULTURE AND RURAL DEVELOPMENT CRISIL AAA FINANCE 9-Mar-28 8.20 97 1749.90 8.08
7 INE205A07030 VEDANTA LIMITED CRISIL AA MANUFACTURING 17-Aug-20 9.45 14 1670.79 8.18
8 INE002A08476 RELIANCE INDUSTRIES LIMITED ICRA AAA OIL 31-Aug-22 7.00 67 1568.94 7.84
9 INE020B08AX5 RURAL ELECTRIFICATION CORPORATION LIMITED CRISIL AAA INFRASTRUCTURE 21-Mar-28 8.09 55 1416.57 8.10
10 INE020B08AZ0 RURAL ELECTRIFICATION CORPORATION LIMITED CARE AAA INFRASTRUCTURE 27-Mar-28 8.06 27 1366.12 8.02
11 INE110L07096 RELIANCE JIO INFOCOMM LIMITED NA INFRASTRUCTURE 16-Apr-23 8.00 9 1340.00 7.99
12 INE261F08AA4 NATIONAL BANK FOR AGRICULTURE AND RURAL DEVELOPMENT CRISIL AAA FINANCE 25-Feb-28 8.22 61 1310.66 7.97
13 INE205A07139 VEDANTA LIMITED CRISIL AA-Positive MANUFACTURING 5-Apr-21 8.50 33 1266.20 8.36
14 INE261F08873 NATIONAL BANK FOR AGRICULTURE AND RURAL DEVELOPMENT AAA FINANCE 31-Jul-18 7.07 11 1050.00 7.40
15 INE090A08TW2 ICICI BANK LIMITED CARE AA+ FINANCE 17-Mar-22 9.20 (AT1) 25 1034.34 8.32
16 INE134E08JL4 POWER FINANCE CORPORATION LTD. CRISIL AAA FINANCE 7-Jun-19 7.80 13 1000.22 7.51
17 INE001A07PX7 HOUSING DEVELOPMENT FINANCE CORPORATION LTD CRISIL AAA FINANCE 9-Mar-20 Zero Coupon 12 965.79 8.08
18 INE115A07MO1 LIC HOUSING FINANCE LIMITED AAA FINANCE 14-Oct-22 7.45 30 954.10 7.96
19 INE001A07RF0 HOUSING DEVELOPMENT FINANCE CORPORATION LTD CRISIL AAA FINANCE 21-Jun-19 7.85 24 909.92 7.97
20 INE261F08865 NATIONAL BANK FOR AGRICULTURE AND RURAL DEVELOPMENT AAA FINANCE 31-Jul-18 7.07 10 899.93 7.34
21 INE020B08AP1 RURAL ELECTRIFICATION CORPORATION LIMITED AAA INFRASTRUCTURE 30-Nov-22 7.45 27 871.44 7.92
22 INE694L07115 TALWANDI SABO POWER LIMITED CRISIL AA (SO)-Positive INFRASTRUCTURE 23-Apr-21 8.55 11 850.00 8.54
23 INE261F08816 NATIONAL BANK FOR AGRICULTURE AND RURAL DEVELOPMENT AAA FINANCE 23-Mar-20 7.18 10 800.05 7.12
24 INE217K07BF5 RELIANCE HOME FINANCE LIMITED CARE AA+ 28-Jun-19 9.10 2 800.00 9.15
25 INE134E08IH4 POWER FINANCE CORPORATION LIMITED AAA 16-Aug-21 7.50 12 786.47 7.87
152
statis
tic
s
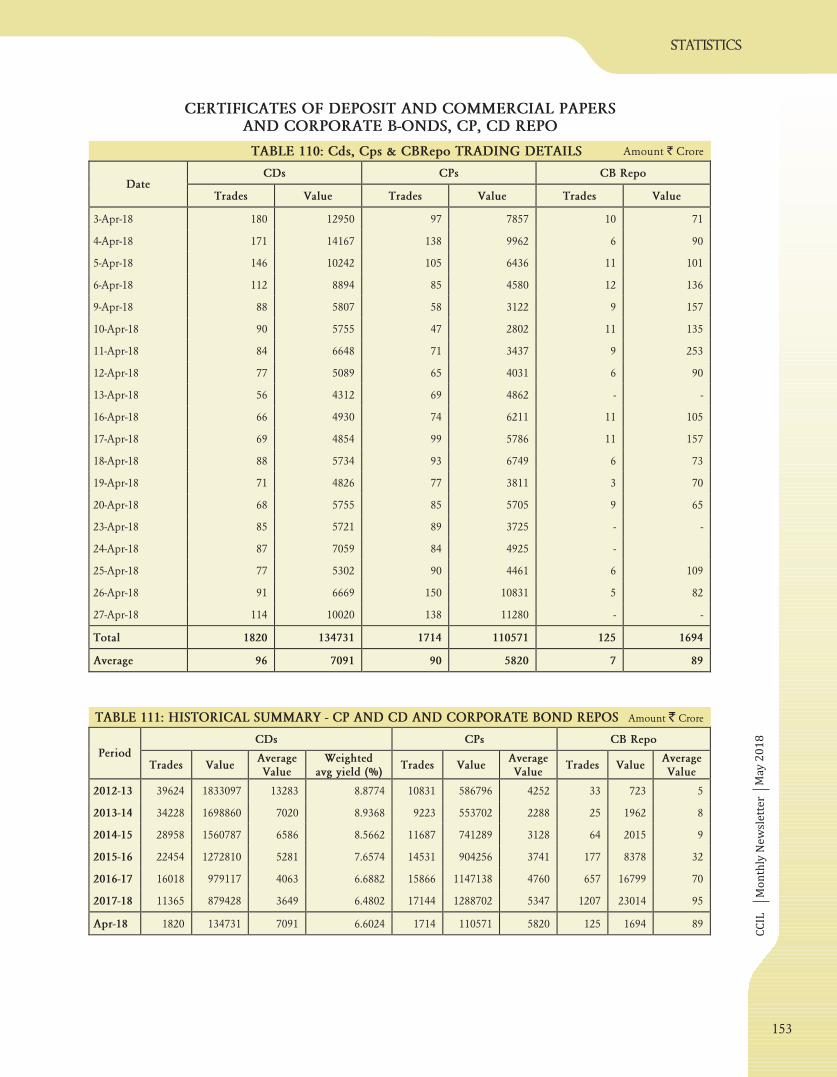
CC
ILM
on
thly
Ne
wsl
ett
er
CERTIFICATES OF DEPOSIT AND COMMERCIAL PAPERSAND CORPORATE B-ONDS, CP, CD REPO
TABLE 110: Cds, Cps & CBRepo TRADING DETAILS Amount Crore`
TABLE 111: HISTORICAL SUMMARY - CP AND CD AND CORPORATE BOND REPOS Amount Crore`
statistics
Ma
y 2
01
8
153
CDs CPs CB RepoPeriod
Trades ValueAverageValue
Weightedavg yield (%)
Trades ValueAverageValue
Trades ValueAverageValue
2012-13 39624 1833097 13283 8.8774 10831 586796 4252 33 723 5
2013-14 34228 1698860 7020 8.9368 9223 553702 2288 25 1962 8
2014-15 28958 1560787 6586 8.5662 11687 741289 3128 64 2015 9
2015-16 22454 1272810 5281 7.6574 14531 904256 3741 177 8378 32
2016-17 16018 979117 4063 6.6882 15866 1147138 4760 657 16799 70
2017-18 11365 879428 3649 6.4802 17144 1288702 5347 1207 23014 95
Apr-18 1820 134731 7091 6.6024 1714 110571 5820 125 1694 89
CDs CPs CB RepoDate
Trades Value Trades Value Trades Value
3-Apr-18 180 12950 97 7857 10 71
4-Apr-18 171 14167 138 9962 6 90
5-Apr-18 146 10242 105 6436 11 101
6-Apr-18 112 8894 85 4580 12 136
9-Apr-18 88 5807 58 3122 9 157
10-Apr-18 90 5755 47 2802 11 135
11-Apr-18 84 6648 71 3437 9 253
12-Apr-18 77 5089 65 4031 6 90
13-Apr-18 56 4312 69 4862 - -
16-Apr-18 66 4930 74 6211 11 105
17-Apr-18 69 4854 99 5786 11 157
18-Apr-18 88 5734 93 6749 6 73
19-Apr-18 71 4826 77 3811 3 70
20-Apr-18 68 5755 85 5705 9 65
23-Apr-18 85 5721 89 3725 - -
24-Apr-18 87 7059 84 4925 -
25-Apr-18 77 5302 90 4461 6 109
26-Apr-18 91 6669 150 10831 5 82
27-Apr-18 114 10020 138 11280 - -
Total 1820 134731 1714 110571 125 1694
Average 96 7091 90 5820 7 89
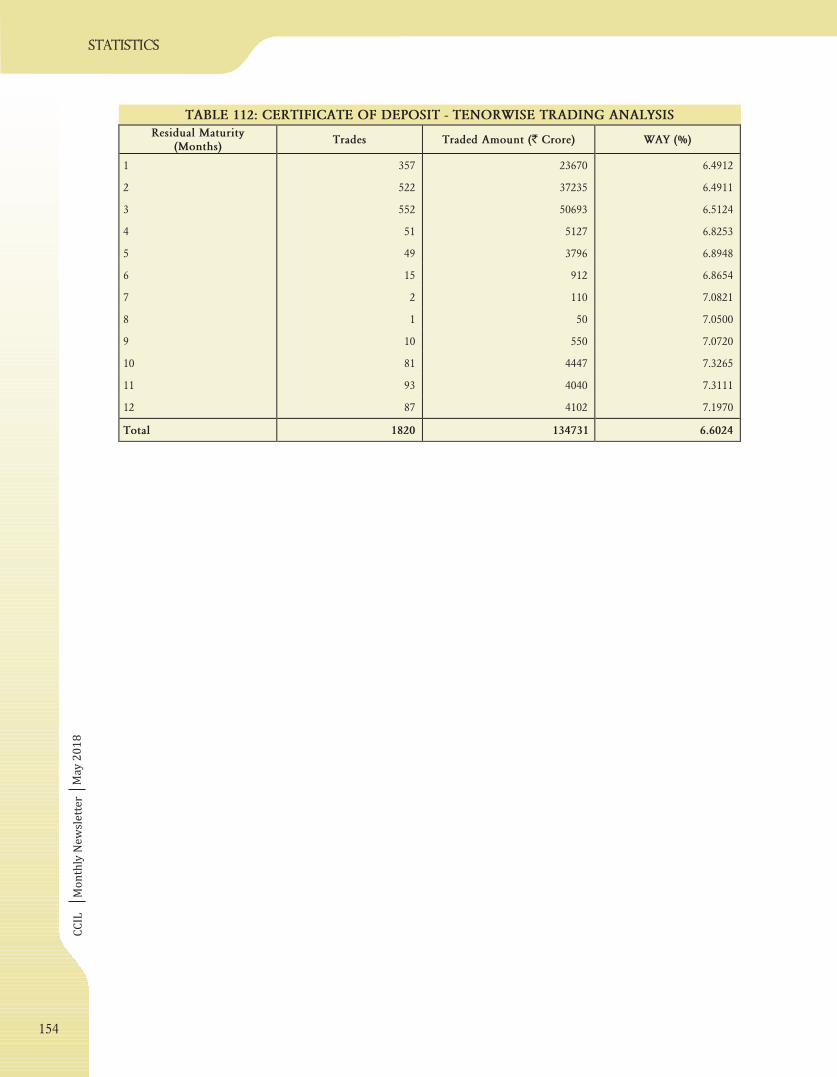
CC
ILM
on
thly
Ne
wsl
ett
er
TABLE 112: CERTIFICATE OF DEPOSIT - TENORWISE TRADING ANALYSIS
Ma
y 2
01
8
Residual Maturity(Months)
Trades Traded Amount (` Crore) WAY (%)
1 357 23670 6.4912
2 522 37235 6.4911
3 552 50693 6.5124
4 51 5127 6.8253
5 49 3796 6.8948
6 15 912 6.8654
7 2 110 7.0821
8 1 50 7.0500
9 10 550 7.0720
10 81 4447 7.3265
11 93 4040 7.3111
12 87 4102 7.1970
Total 1820 134731 6.6024
154
statistics
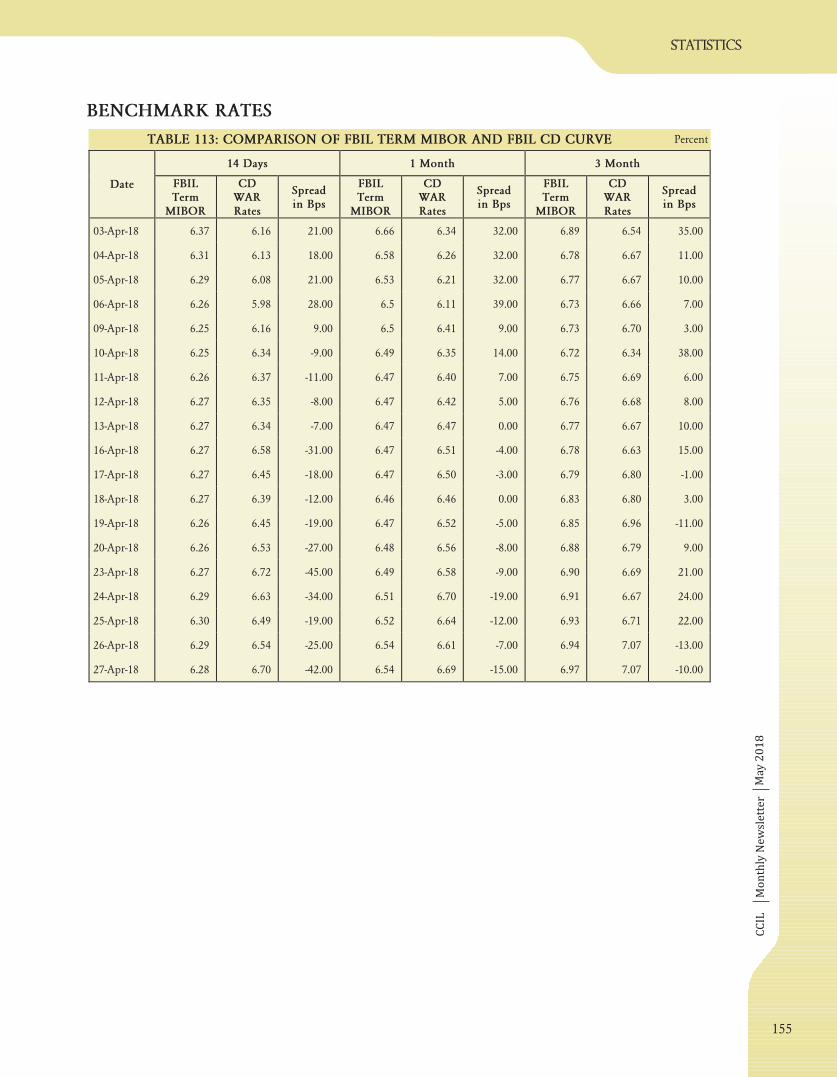
CC
ILM
on
thly
Ne
wsl
ett
er
TABLE 113: COMPARISON OF FBIL TERM MIBOR AND FBIL CD CURVE
BENCHMARK RATES
Percent
statistics
Ma
y 2
01
8
14 Days 1 Month 3 Month
Date FBILTerm
MIBOR
CDWARRates
Spreadin Bps
FBILTerm
MIBOR
CDWARRates
Spreadin Bps
FBILTerm
MIBOR
CDWARRates
Spreadin Bps
03-Apr-18 6.37 6.16 21.00 6.66 6.34 32.00 6.89 6.54 35.00
04-Apr-18 6.31 6.13 18.00 6.58 6.26 32.00 6.78 6.67 11.00
05-Apr-18 6.29 6.08 21.00 6.53 6.21 32.00 6.77 6.67 10.00
06-Apr-18 6.26 5.98 28.00 6.5 6.11 39.00 6.73 6.66 7.00
09-Apr-18 6.25 6.16 9.00 6.5 6.41 9.00 6.73 6.70 3.00
10-Apr-18 6.25 6.34 -9.00 6.49 6.35 14.00 6.72 6.34 38.00
11-Apr-18 6.26 6.37 -11.00 6.47 6.40 7.00 6.75 6.69 6.00
12-Apr-18 6.27 6.35 -8.00 6.47 6.42 5.00 6.76 6.68 8.00
13-Apr-18 6.27 6.34 -7.00 6.47 6.47 0.00 6.77 6.67 10.00
16-Apr-18 6.27 6.58 -31.00 6.47 6.51 -4.00 6.78 6.63 15.00
17-Apr-18 6.27 6.45 -18.00 6.47 6.50 -3.00 6.79 6.80 -1.00
18-Apr-18 6.27 6.39 -12.00 6.46 6.46 0.00 6.83 6.80 3.00
19-Apr-18 6.26 6.45 -19.00 6.47 6.52 -5.00 6.85 6.96 -11.00
20-Apr-18 6.26 6.53 -27.00 6.48 6.56 -8.00 6.88 6.79 9.00
23-Apr-18 6.27 6.72 -45.00 6.49 6.58 -9.00 6.90 6.69 21.00
24-Apr-18 6.29 6.63 -34.00 6.51 6.70 -19.00 6.91 6.67 24.00
25-Apr-18 6.30 6.49 -19.00 6.52 6.64 -12.00 6.93 6.71 22.00
26-Apr-18 6.29 6.54 -25.00 6.54 6.61 -7.00 6.94 7.07 -13.00
27-Apr-18 6.28 6.70 -42.00 6.54 6.69 -15.00 6.97 7.07 -10.00
155
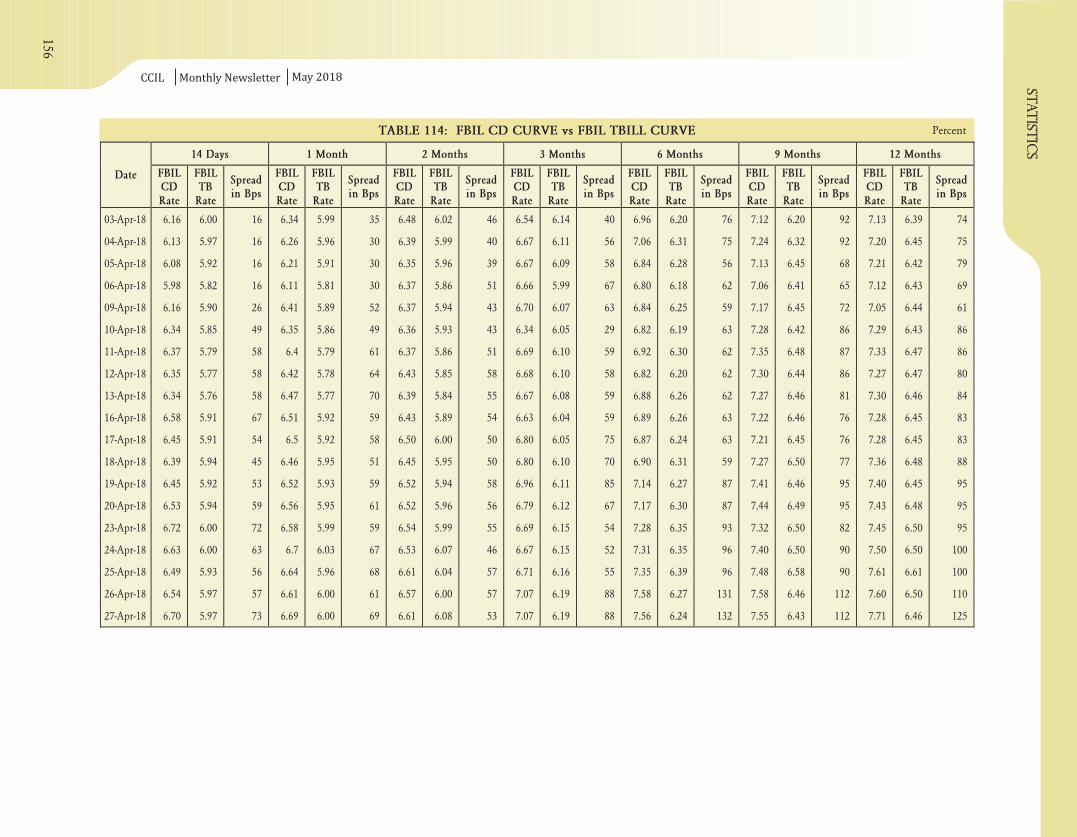
CCIL Monthly Newsletter
PercentTABLE 114: FBIL CD CURVE vs FBIL TBILL CURVE
May 2018
14 Days 1 Month 2 Months 3 Months 6 Months 9 Months 12 Months
Date FBILCDRate
FBILTB
Rate
Spreadin Bps
FBILCDRate
FBILTB
Rate
Spreadin Bps
FBILCDRate
FBILTB
Rate
Spreadin Bps
FBILCDRate
FBILTB
Rate
Spreadin Bps
FBILCDRate
FBILTB
Rate
Spreadin Bps
FBILCDRate
FBILTB
Rate
Spreadin Bps
FBILCDRate
FBILTB
Rate
Spreadin Bps
03-Apr-18 6.16 6.00 16 6.34 5.99 35 6.48 6.02 46 6.54 6.14 40 6.96 6.20 76 7.12 6.20 92 7.13 6.39 74
04-Apr-18 6.13 5.97 16 6.26 5.96 30 6.39 5.99 40 6.67 6.11 56 7.06 6.31 75 7.24 6.32 92 7.20 6.45 75
05-Apr-18 6.08 5.92 16 6.21 5.91 30 6.35 5.96 39 6.67 6.09 58 6.84 6.28 56 7.13 6.45 68 7.21 6.42 79
06-Apr-18 5.98 5.82 16 6.11 5.81 30 6.37 5.86 51 6.66 5.99 67 6.80 6.18 62 7.06 6.41 65 7.12 6.43 69
09-Apr-18 6.16 5.90 26 6.41 5.89 52 6.37 5.94 43 6.70 6.07 63 6.84 6.25 59 7.17 6.45 72 7.05 6.44 61
10-Apr-18 6.34 5.85 49 6.35 5.86 49 6.36 5.93 43 6.34 6.05 29 6.82 6.19 63 7.28 6.42 86 7.29 6.43 86
11-Apr-18 6.37 5.79 58 6.4 5.79 61 6.37 5.86 51 6.69 6.10 59 6.92 6.30 62 7.35 6.48 87 7.33 6.47 86
12-Apr-18 6.35 5.77 58 6.42 5.78 64 6.43 5.85 58 6.68 6.10 58 6.82 6.20 62 7.30 6.44 86 7.27 6.47 80
13-Apr-18 6.34 5.76 58 6.47 5.77 70 6.39 5.84 55 6.67 6.08 59 6.88 6.26 62 7.27 6.46 81 7.30 6.46 84
16-Apr-18 6.58 5.91 67 6.51 5.92 59 6.43 5.89 54 6.63 6.04 59 6.89 6.26 63 7.22 6.46 76 7.28 6.45 83
17-Apr-18 6.45 5.91 54 6.5 5.92 58 6.50 6.00 50 6.80 6.05 75 6.87 6.24 63 7.21 6.45 76 7.28 6.45 83
18-Apr-18 6.39 5.94 45 6.46 5.95 51 6.45 5.95 50 6.80 6.10 70 6.90 6.31 59 7.27 6.50 77 7.36 6.48 88
19-Apr-18 6.45 5.92 53 6.52 5.93 59 6.52 5.94 58 6.96 6.11 85 7.14 6.27 87 7.41 6.46 95 7.40 6.45 95
20-Apr-18 6.53 5.94 59 6.56 5.95 61 6.52 5.96 56 6.79 6.12 67 7.17 6.30 87 7.44 6.49 95 7.43 6.48 95
23-Apr-18 6.72 6.00 72 6.58 5.99 59 6.54 5.99 55 6.69 6.15 54 7.28 6.35 93 7.32 6.50 82 7.45 6.50 95
24-Apr-18 6.63 6.00 63 6.7 6.03 67 6.53 6.07 46 6.67 6.15 52 7.31 6.35 96 7.40 6.50 90 7.50 6.50 100
25-Apr-18 6.49 5.93 56 6.64 5.96 68 6.61 6.04 57 6.71 6.16 55 7.35 6.39 96 7.48 6.58 90 7.61 6.61 100
26-Apr-18 6.54 5.97 57 6.61 6.00 61 6.57 6.00 57 7.07 6.19 88 7.58 6.27 131 7.58 6.46 112 7.60 6.50 110
27-Apr-18 6.70 5.97 73 6.69 6.00 69 6.61 6.08 53 7.07 6.19 88 7.56 6.24 132 7.55 6.43 112 7.71 6.46 125
156
statis
tic
s
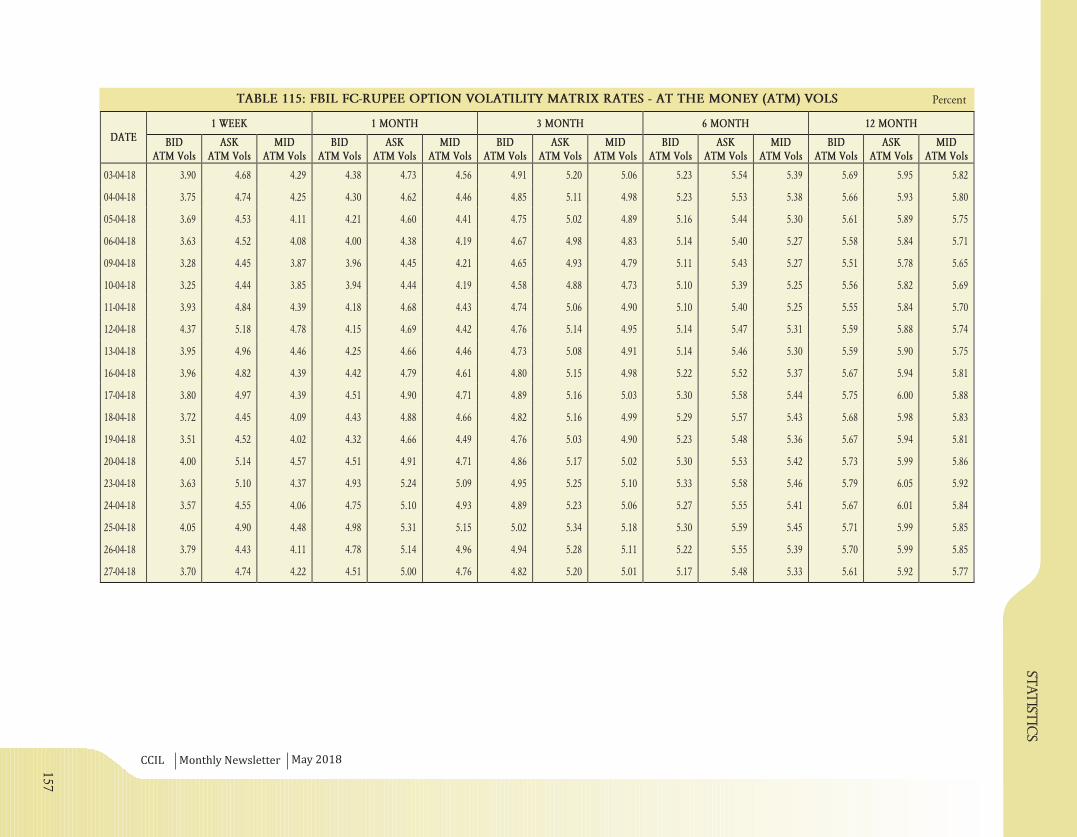
CCIL Monthly Newsletter
statis
tic
s
PercentTABLE 115: FBIL FC-RUPEE OPTION VOLATILITY MATRIX RATES - AT THE MONEY (ATM) VOLS
May 2018
1 WEEK 1 MONTH 3 MONTH 6 MONTH 12 MONTHDATE BID
ATM VolsASK
ATM VolsMID
ATM VolsBID
ATM VolsASK
ATM VolsMID
ATM VolsBID
ATM VolsASK
ATM VolsMID
ATM VolsBID
ATM VolsASK
ATM VolsMID
ATM VolsBID
ATM VolsASK
ATM VolsMID
ATM Vols
03-04-18 3.90 4.68 4.29 4.38 4.73 4.56 4.91 5.20 5.06 5.23 5.54 5.39 5.69 5.95 5.82
04-04-18 3.75 4.74 4.25 4.30 4.62 4.46 4.85 5.11 4.98 5.23 5.53 5.38 5.66 5.93 5.80
05-04-18 3.69 4.53 4.11 4.21 4.60 4.41 4.75 5.02 4.89 5.16 5.44 5.30 5.61 5.89 5.75
06-04-18 3.63 4.52 4.08 4.00 4.38 4.19 4.67 4.98 4.83 5.14 5.40 5.27 5.58 5.84 5.71
09-04-18 3.28 4.45 3.87 3.96 4.45 4.21 4.65 4.93 4.79 5.11 5.43 5.27 5.51 5.78 5.65
10-04-18 3.25 4.44 3.85 3.94 4.44 4.19 4.58 4.88 4.73 5.10 5.39 5.25 5.56 5.82 5.69
11-04-18 3.93 4.84 4.39 4.18 4.68 4.43 4.74 5.06 4.90 5.10 5.40 5.25 5.55 5.84 5.70
12-04-18 4.37 5.18 4.78 4.15 4.69 4.42 4.76 5.14 4.95 5.14 5.47 5.31 5.59 5.88 5.74
13-04-18 3.95 4.96 4.46 4.25 4.66 4.46 4.73 5.08 4.91 5.14 5.46 5.30 5.59 5.90 5.75
16-04-18 3.96 4.82 4.39 4.42 4.79 4.61 4.80 5.15 4.98 5.22 5.52 5.37 5.67 5.94 5.81
17-04-18 3.80 4.97 4.39 4.51 4.90 4.71 4.89 5.16 5.03 5.30 5.58 5.44 5.75 6.00 5.88
18-04-18 3.72 4.45 4.09 4.43 4.88 4.66 4.82 5.16 4.99 5.29 5.57 5.43 5.68 5.98 5.83
19-04-18 3.51 4.52 4.02 4.32 4.66 4.49 4.76 5.03 4.90 5.23 5.48 5.36 5.67 5.94 5.81
20-04-18 4.00 5.14 4.57 4.51 4.91 4.71 4.86 5.17 5.02 5.30 5.53 5.42 5.73 5.99 5.86
23-04-18 3.63 5.10 4.37 4.93 5.24 5.09 4.95 5.25 5.10 5.33 5.58 5.46 5.79 6.05 5.92
24-04-18 3.57 4.55 4.06 4.75 5.10 4.93 4.89 5.23 5.06 5.27 5.55 5.41 5.67 6.01 5.84
25-04-18 4.05 4.90 4.48 4.98 5.31 5.15 5.02 5.34 5.18 5.30 5.59 5.45 5.71 5.99 5.85
26-04-18 3.79 4.43 4.11 4.78 5.14 4.96 4.94 5.28 5.11 5.22 5.55 5.39 5.70 5.99 5.85
27-04-18 3.70 4.74 4.22 4.51 5.00 4.76 4.82 5.20 5.01 5.17 5.48 5.33 5.61 5.92 5.77
157

CC
ILM
on
thly
Ne
wsl
ett
er
TABLE 116: FBIL FC-RUPEE OPTION VOLATILITY MATRIX RATES - 25 DELTA RISK REVERSAL
Risk Reversal is the spread between the put and call vol for 25 delta25 delta is the market standard for out of the money option strike
Percent
Ma
y 2
01
8
25 DELTA RRDATE
1 WEEK 1 MONTH 3 MONTHS 6 MONTHS 12 MONTHS
3-Apr-18 0.51 0.49 0.64 0.76 0.81
4-Apr-18 0.50 0.46 0.62 0.74 0.80
5-Apr-18 0.35 0.45 0.62 0.75 0.79
6-Apr-18 0.31 0.44 0.60 0.72 0.78
9-Apr-18 0.31 0.44 0.60 0.72 0.78
10-Apr-18 0.31 0.44 0.58 0.72 0.78
11-Apr-18 0.31 0.44 0.59 0.73 0.78
12-Apr-18 0.31 0.44 0.59 0.73 0.78
13-Apr-18 0.31 0.44 0.59 0.73 0.78
16-Apr-18 0.31 0.44 0.59 0.72 0.78
17-Apr-18 0.31 0.44 0.58 0.75 0.79
18-Apr-18 0.31 0.44 0.59 0.76 0.79
19-Apr-18 0.31 0.49 0.58 0.75 0.81
20-Apr-18 0.32 0.55 0.61 0.77 0.80
23-Apr-18 0.38 0.59 0.65 0.82 0.87
24-Apr-18 0.41 0.56 0.65 0.80 0.86
25-Apr-18 0.40 0.59 0.65 0.80 0.86
26-Apr-18 0.40 0.59 0.65 0.80 0.86
27-Apr-18 0.40 0.51 0.62 0.78 0.80
158
statistics
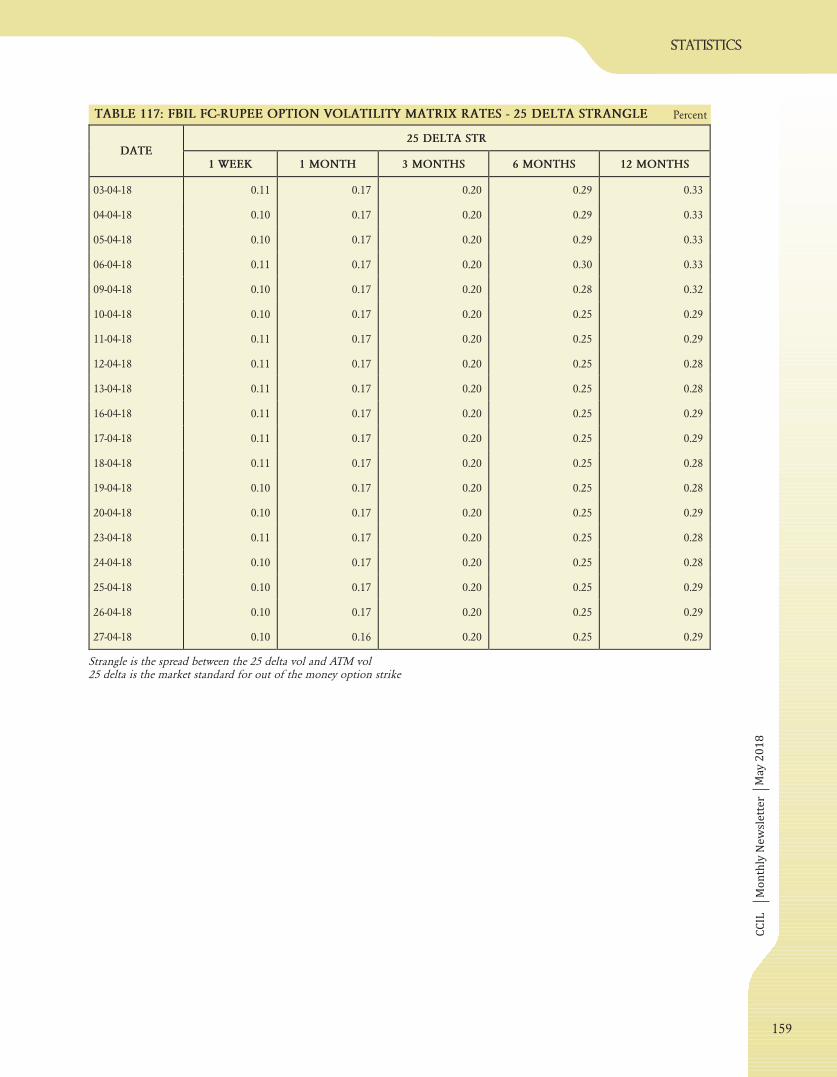
CC
ILM
on
thly
Ne
wsl
ett
er
statistics
TABLE 117: FBIL FC-RUPEE OPTION VOLATILITY MATRIX RATES - 25 DELTA STRANGLE
Strangle is the spread between the 25 delta vol and ATM vol25 delta is the market standard for out of the money option strike
Percent
Ma
y 2
01
8
25 DELTA STRDATE
1 WEEK 1 MONTH 3 MONTHS 6 MONTHS 12 MONTHS
03-04-18 0.11 0.17 0.20 0.29 0.33
04-04-18 0.10 0.17 0.20 0.29 0.33
05-04-18 0.10 0.17 0.20 0.29 0.33
06-04-18 0.11 0.17 0.20 0.30 0.33
09-04-18 0.10 0.17 0.20 0.28 0.32
10-04-18 0.10 0.17 0.20 0.25 0.29
11-04-18 0.11 0.17 0.20 0.25 0.29
12-04-18 0.11 0.17 0.20 0.25 0.28
13-04-18 0.11 0.17 0.20 0.25 0.28
16-04-18 0.11 0.17 0.20 0.25 0.29
17-04-18 0.11 0.17 0.20 0.25 0.29
18-04-18 0.11 0.17 0.20 0.25 0.28
19-04-18 0.10 0.17 0.20 0.25 0.28
20-04-18 0.10 0.17 0.20 0.25 0.29
23-04-18 0.11 0.17 0.20 0.25 0.28
24-04-18 0.10 0.17 0.20 0.25 0.28
25-04-18 0.10 0.17 0.20 0.25 0.29
26-04-18 0.10 0.17 0.20 0.25 0.29
27-04-18 0.10 0.16 0.20 0.25 0.29
159