
T24_vg1.8_disk 11WNSDVG1.8 CLIC_G un-damped @ 11.424 GHz measurements versus simulations A.Grudiev...
29
T24_vg1.8_disk 11WNSDVG1.8 CLIC_G un-damped @ 11.424 GHz measurements versus simulations A.Grudiev CERN 1.07.2009
-
date post
19-Dec-2015 -
Category
Documents
-
view
216 -
download
2
Transcript of T24_vg1.8_disk 11WNSDVG1.8 CLIC_G un-damped @ 11.424 GHz measurements versus simulations A.Grudiev...

T24_vg1.8_disk 11WNSDVG1.8
CLIC_G un-damped @ 11.424 GHzmeasurements versus simulations
A. GrudievCERN
1.07.2009

Acknowledgements
CERN:M. GerbauxR. ZennaroA. OlyuninW. Wuensch
SLAC:Z. Li

First cellHs/EaEs/Ea Sc/Ea
2
a [mm] 3.307
d [mm] 1.753
e 1.16
f [GHz] 11.433
Q(Cu) 6814
vg/c [%] 1.83
r’/Q [LinacΩ/m] 15198
Es/Ea 1.95
Hs/Ea [mA/V] 2.6
Sc/Ea2 [mA/V] 0.37

Middle cellHs/EaEs/Ea Sc/Ea
2
a [mm] 2.887
d [mm] 1.402
e 1.15
f [GHz] 11.432
Q(Cu) 6980
vg/c [%] 1.33
r’/Q [LinacΩ/m] 16960
Es/Ea 1.95
Hs/Ea [mA/V] 2.45
Sc/Ea2 [mA/V] 0.34

Last cellHs/EaEs/Ea Sc/Ea
2
a [mm] 2.467
d [mm] 1.05
e 1.13
f [GHz] 11.426
Q(Cu) 7157
vg/c [%] 0.92
r’/Q [LinacΩ/m] 18713
Es/Ea 1.9
Hs/Ea [mA/V] 2.3
Sc/Ea2 [mA/V] 0.28

6
Gradient in 24 regular cells
Number of regular cells: Nc 24Bunch population: N 3.72x10⁹
Number of bunches: Nb 312 Bunch separation: Ncycl 6 rf cycles
Average unloaded of 100 MV/m Average loaded of 100 MV/m
0 4 8 12 16 20 24240
50
100
150
200
250
iris number
P [
MW
] (b
lack
), E
s (
gre
en),
Ea (
red
) [M
V/m
],
T
[K
] (b
lue)
, S
c*50
[MW
/mm
2 ] (m
agen
ta)
7.5 8.4
176
205
3.03.2
90
108
41.1
23.4
Pinload = 41.1 MW, P
outload = 23.4 MW
Eff = 0.0 % tr = 0.0 ns, t
f = 0.0 ns, t
p = 100.0 ns
0 4 8 12 16 20 240
50
100
150
200
250
iris number
P [
MW
] (b
lack
), E
s (
gre
en),
Ea (
red
) [M
V/m
],
T
[K
] (b
lue)
, S
c*50
[MW
/mm
2 ] (m
agen
ta)
15.0 16.8
206
240
4.1
4.5
105
126
56.4
32.2
Pinload = 56.4 MW, P
outload = 14.7 MW
Eff = 28.9 % tr = 20.7 ns, t
f = 54.8 ns, t
p = 238.8 ns
2
1'PI
Q
R
vP
Qvdz
dP
gg

Simulation setup 1 & 2HFSS-quad
HFSS simulation of ¼ of the structure:Surface conductivity (Cu): 58e6 S/mSurface approximation: ds=6 μm, Total number of tetrahedra: Ntetr = 1170348Mesh density: ~ 40000 tetr / ¼ cell
S3P-quadS3P simulation of ¼ of the structure made by Zenghai Li at SLAC-ACDSurface conductivity (Cu): 57e6 S/m different
HFSS v10.1

Simulation setup 3 HFSS-cells + couplers
HFSS simulation of ¼ of input coupler + segment of 5 deg. of the cells + ¼ of output coupler :Surface conductivity (Cu): 58e6 S/mSurface approximation: ds=1 μm, Total number of tetrahedra for cells: Ntetr = 506075Mesh density: ~ 350000 tetr / ¼ cell (10 times higher than in HFSS-quad setup)
HFSS v11.1

Measurement setup 1 (reflections)
Perfectload
Perfectload
VNAport1
VNAport2
1
2 3
4
Reflection = S11+S12
Frequency correction due to air (ε = 1.00059) Frequency in vacuum: f’ = f*sqrt(1.00059) ≈ f + 3.5 MHz @ X-band

Reflection: comparison
There is very small (~1MHz) or no difference in frequency between simulations and the air corrected measurements
11.4 11.405 11.41 11.415 11.42 11.425 11.43 11.435 11.44-45
-40
-35
-30
-25
-20
-15
-10
-5
0Input
f [GHz]
Ref
lect
ion
[dB
]
measurement (Vac)
HFSS-cells
HFSS-quadS3P-quad
mode launcher
11.4 11.405 11.41 11.415 11.42 11.425 11.43 11.435 11.44-45
-40
-35
-30
-25
-20
-15
-10
-5
0Output
f [GHz]R
efle
ctio
n [d
B]
measurement (Vac)
HFSS-cells
HFSS-quadS3P-quad
mode launcher

1
2 3
4
Measurement setup 2 (transmission)Perfect load
Perfect load
VNA port1
VNA port2Transmission = S13+S23
1
2 3
4
Perfect load
VNA port2VNA port1
Perfect load

Transmission: comparison
• There is small difference between HFSS and S3P simulation results due to different conductivity used in the simulations• Both simulation results show higher transmission than air corrected measurements by about 0.2 dB
11.4 11.405 11.41 11.415 11.42 11.425 11.43 11.435 11.44-3.6
-3.4
-3.2
-3
-2.8
-2.6
-2.4
f [GHz]
Tra
nsm
isio
n [d
B]
measurement (Vac)
HFSS-cellsHFSS-quad
S3P-quad

Some useful equationsnattenuatio ln 12
2 where SτePP inout
structure lossfreein energy stored -
structurelossy in energy stored -
delay group timefilling - )arg(
factorquality average -
0
120
where
W
W
d
Sd
P
Wt
P
WQePP
inf
loss
Q
t
inout
f
On the other hand
Finally
2
ftQ

Transmission: comparing group delay
There is no difference between both HFSS and S3P simulations and the air corrected measurements
11.4 11.405 11.41 11.415 11.42 11.425 11.43 11.435 11.4454
56
58
60
62
64
66
f [GHz]
d/d
[
ns]
measurement (Vac)
HFSS-cells
S3P-quad

Transmission: comparing Q-factor • There is no difference in Q-factor (~7000) between HFSS and S3P simulations.• The measured Q-factor of about 6600 is lower than the simulated value by about 6 %.
11.4 11.405 11.41 11.415 11.42 11.425 11.43 11.435 11.445800
6000
6200
6400
6600
6800
7000
7200
f [GHz]
Q
measurement: (Vac)
HFSS-cells
S3P-quad

Measurement setup 3 (bead pull)
Perfectload
Perfectload
VNAport1
VNAport2
1
2 3
4
E2 ~ S11-<S11>

-50 0 50-50
0
50
ImE
z [k
V/m
]
f=11.42 GHz
-50 0 50-50
0
50f=11.421 GHz
-50 0 50-50
0
50f=11.422 GHz
-50 0 50-50
0
50
ImE
z [k
V/m
]
f=11.423 GHz
-50 0 50-50
0
50f=11.424 GHz
-50 0 50-50
0
50f=11.425 GHz
-50 0 50-50
0
50
ImE
z [k
V/m
]
f=11.426 GHz
-50 0 50-50
0
50f=11.427 GHz
-50 0 50-50
0
50f=11.428 GHz
-50 0 50-50
0
50
ReEz [kV/m]
ImE
z [k
V/m
]
f=11.429 GHz
-50 0 50-50
0
50
ReEz [kV/m]
f=11.43 GHz
-50 0 50-50
0
50
ReEz [kV/m]
f=11.431 GHz
Bead pull in complex plane
-0.05 0 0.05
-0.05
0
0.05
ImS
11
f=11.415 GHz
-0.05 0 0.05
-0.05
0
0.05
f=11.416 GHz
-0.05 0 0.05
-0.05
0
0.05
f=11.417 GHz
-0.05 0 0.05
-0.05
0
0.05
ImS
11
f=11.418 GHz
-0.05 0 0.05
-0.05
0
0.05
f=11.419 GHz
-0.05 0 0.05
-0.05
0
0.05
f=11.42 GHz
-0.05 0 0.05
-0.05
0
0.05
ImS
11
f=11.421 GHz
-0.05 0 0.05
-0.05
0
0.05
f=11.422 GHz
-0.05 0 0.05
-0.05
0
0.05
f=11.423 GHz
-0.05 0 0.05
-0.05
0
0.05
ReS11
ImS
11
f=11.424 GHz
-0.05 0 0.05
-0.05
0
0.05
ReS11
f=11.425 GHz
-0.05 0 0.05
-0.05
0
0.05
ReS11
Measurements: S11-<S11> HFSS-cells: E

0 100 2000
20
40
|Ez|
[kV
/m]
f=11.42 GHz
0 100 2000
20
40
f=11.421 GHz
0 100 2000
20
40
f=11.422 GHz
0 100 2000
20
40
|Ez|
[kV
/m]
f=11.423 GHz
0 100 2000
20
40
f=11.424 GHz
0 100 2000
20
40
f=11.425 GHz
0 100 2000
20
40
|Ez|
[kV
/m]
f=11.426 GHz
0 100 2000
20
40
f=11.427 GHz
0 100 2000
20
40
f=11.428 GHz
0 100 2000
20
40
z [mm]
|Ez|
[kV
/m]
f=11.429 GHz
0 100 2000
20
40
z [mm]
f=11.43 GHz
0 100 2000
20
40
z [mm]
f=11.431 GHz
200 400 6000
0.1
0.2
|Ez|
[a.
u.]
f=11.415 GHz
200 400 6000
0.1
0.2
f=11.416 GHz
200 400 6000
0.1
0.2
f=11.417 GHz
200 400 6000
0.1
0.2
|Ez|
[a.
u.]
f=11.418 GHz
200 400 6000
0.1
0.2
f=11.419 GHz
200 400 6000
0.1
0.2
f=11.42 GHz
200 400 6000
0.1
0.2
|Ez|
[a.
u.]
f=11.421 GHz
200 400 6000
0.1
0.2
f=11.422 GHz
200 400 6000
0.1
0.2
f=11.423 GHz
200 400 6000
0.1
0.2
z [a.u.]
|Ez|
[a.
u.]
f=11.424 GHz
200 400 6000
0.1
0.2
z [a.u.]
f=11.425 GHz
200 400 6000
0.1
0.2
z [a.u.]
Bead pull: field magnitudeMeasurements: |sqrt(S11-<S11>)| HFSS-cells: |E|

Field distribution at different frequencies
0 50 100 150 200 250 300 3500
0.2
0.4
0.6
0.8
1
1.2
z [mm]
|Ez|
[a.
u.]
HFSS-cells: f=11.42 GHz
measurement: f=11.418 GHz
0 50 100 150 200 250 300 3500
0.2
0.4
0.6
0.8
1
1.2
z [mm]
|Ez|
[a.
u.]
HFSS-cells: f=11.424 GHz
measurement: f=11.421 GHz
120o rf phase advance per cell frequency11.424 GHz
Best match frequency11.420 GHz

RF phase advance per cell at different frequencies
0 5 10 15 20 25-8
-6
-4
-2
0
2
4
niris
dphi [d
eg]
measurement: f=11.421 GHz
HFSS-cells: f=11.424 GHzS3P-quad: f=11.424 GHz
120o rf phase advance per cell frequency: 11.424 GHz
Best match frequency:11.420 GHz
0 5 10 15 20 25-10
-8
-6
-4
-2
0
2
4
niris
dphi [d
eg]
measurement: f=11.418 GHz
HFSS-cells: f=11.42 GHz

Summary table for T24_vg1.8_disk
S12 Pout/Pin
τ=0.5ln (Pout/Pin)
tf=dφ/dω [ns]
tf=W0/Pin [ns]
Q=ωtf/2τQ=ωW/(Pin-Pout)
Q=ωW/Ploss
Pin100 24 cells[MW]
Measurements (Vac)
0.715 0.511 0.336 60.9 - 6600 - -
HFSS ¼ 0.732 0.536 0.312 - 58.4 6720 7010 7010
HFSS InCoupOutCoupCells 24+2
0.7310.998750.998890.733
0.5340.99750.99780.537
0.3130.00130.00110.311
60.7 <- <-59.9
59.80.460.3659.0
696012700118006910
694013000123006880
664013200123006580 42.2
3-cells model
0.569-0.533
0.282-0.315
- 54.8-59.37
6974-6764
6980 41.1
S3P (SLAC)
0.730 0.533 0.315 60.8 6927(σ=57e6)6988(σ=58e6)
42.4

Summary on comparison• Simulation results of HFSS and S3P show very good agreement • Q-factor
• All 3 different ways of calculating Q-factor: S3P, HFSS-S-parameter solver and HFSS-eigenmode solver give very close values of about 7000
• The measurements of the T24_vg1.8_disk structure made at CERN show 6 % lower Q-factor of 6600
• RF phase advance• Both HFSS and S3P simulations and air corrected measurements simulations
show 120o rf phase advance frequency of 11.424 GHz which is the design frequency
• Good agreement (± 0.5 MHz) between simulations and measurements demonstrates extremely high (sub-micron) precision of machining. For example, it is equivalent to ± 0.6 μm tolerance on the outer wall radius RF phase advance
• Structure matching• There is a design error in structure matching of about 4 MHz. The match
frequency is 11.420 GHz . To some extent this is also in agreement with the measurements

HFSS S-par solver: v10.1 versus v11.1

Simulation setup 4 HFSS-cells + couplers
HFSS simulation of ¼ of input coupler + segment of the cells made in HFSS by 5 deg. Sweep (3D geometry created in HFSS)+ ¼ of output coupler :Surface conductivity (Cu): 58e6 S/mSurface approximation: ds=1 μm,
HFSS v11.1 HFSS v10.1versus

Reflection
4 MHz 4 MHz
11.4 11.405 11.41 11.415 11.42 11.425 11.43 11.435 11.44-45
-40
-35
-30
-25
-20
-15
-10
-5
0Input
f [GHz]
Ref
lect
ion
[dB
]
HFSS10
HFSS11S3P
11.4 11.405 11.41 11.415 11.42 11.425 11.43 11.435 11.44-45
-40
-35
-30
-25
-20
-15
-10
-5
0Output
f [GHz]R
efle
ctio
n [d
B]
HFSS10
HFSS11S3P
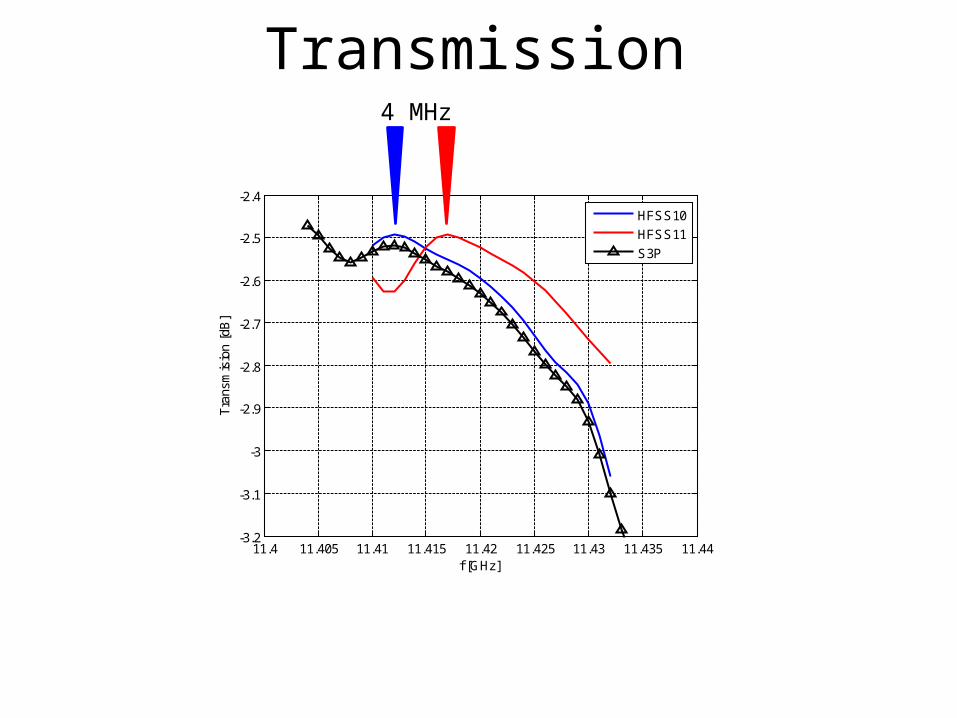
11.4 11.405 11.41 11.415 11.42 11.425 11.43 11.435 11.44-3.2
-3.1
-3
-2.9
-2.8
-2.7
-2.6
-2.5
-2.4
f [GHz]
Tra
nsm
isio
n [d
B]
HFSS10
HFSS11
S3P
Transmission4 MHz

Group delay and Q-factor
11.4 11.405 11.41 11.415 11.42 11.425 11.43 11.435 11.4454
56
58
60
62
64
66
f [GHz]
d/d
[
ns]
HFSS10
HFSS11
S3P
11.4 11.405 11.41 11.415 11.42 11.425 11.43 11.435 11.446400
6500
6600
6700
6800
6900
7000
7100
7200
f [GHz]Q
HFSS10
HFSS11S3P

-50 0 50-50
0
50
ImE
z [k
V/m
]
f=11.42 GHz
-50 0 50-50
0
50f=11.421 GHz
-50 0 50-50
0
50f=11.422 GHz
-50 0 50-50
0
50
ImE
z [k
V/m
]
f=11.423 GHz
-50 0 50-50
0
50f=11.424 GHz
-50 0 50-50
0
50f=11.425 GHz
-50 0 50-50
0
50
ImE
z [k
V/m
]
f=11.426 GHz
-50 0 50-50
0
50f=11.427 GHz
-50 0 50-50
0
50f=11.428 GHz
-50 0 50-50
0
50
ReEz [kV/m]
ImE
z [k
V/m
]
f=11.429 GHz
-50 0 50-50
0
50
ReEz [kV/m]
f=11.43 GHz
-50 0 50-50
0
50
ReEz [kV/m]
f=11.431 GHz
-50 0 50-50
0
50
ImE
z [k
V/m
]
f=11.42 GHz
-50 0 50-50
0
50f=11.421 GHz
-50 0 50-50
0
50f=11.422 GHz
-50 0 50-50
0
50
ImE
z [k
V/m
]
f=11.423 GHz
-50 0 50-50
0
50f=11.424 GHz
-50 0 50-50
0
50f=11.425 GHz
-50 0 50-50
0
50
ImE
z [k
V/m
]
f=11.426 GHz
-50 0 50-50
0
50f=11.427 GHz
-50 0 50-50
0
50f=11.428 GHz
-50 0 50-50
0
50
ReEz [kV/m]
ImE
z [k
V/m
]
f=11.429 GHz
-50 0 50-50
0
50
ReEz [kV/m]
f=11.43 GHz
-50 0 50-50
0
50
ReEz [kV/m]
f=11.431 GHz
RF phase advance per cellHFSS v10.1 HFSS v11.1

Summary on HFSS• It seems that there is a bug in HFSS v11. • The results of the simulations using HFSS v11 are shifted up in frequency by 4 MHz with respect to the results of the simulations using HFSS v10 or S3P • Use HFSS-S-parameter solver VERSION 10 or S3P


