T001 VerB Rail Level Traffic Assessment
25
T001 VerB Rail Level Traffic Assessment.docx Page 1 Technical Note 1 Introduction Cardno has been engaged by Wollongong Recycling and Building Supplies Pty Ltd to prepare a Modelling Traffic Management Plan in relation to traffic impact on the railway level crossing located on West Dapto Road, Kembla Grange NSW. This technical note is in response to Sydney Trains comments regarding the proposed expansion of the Re-cycling Facility located at 50 Wylie Road, Kembla Grange. The railway level crossing is located at West Dapto Road on the northern side of Princes Highway, between Wylie Road and Princes Highway. This railway level crossing is located to the west of the Kembla Grange train station. Figure 1 shows the location of the railway level crossing. Figure 1: Site Location Title Rail Level Crossing Modelling Traffic Management Plan West Dapto Road – Kembla Grange Client Wollongong Recycling & Building Supplies Pty Ltd Project No 82015053 Date 17 December 2014 Status Version B Author David Yu Discipline Traffic and Transport Office Sydney Site & Traffic Count Location
Transcript of T001 VerB Rail Level Traffic Assessment
T001 VerB Rail Level Traffic Assessment.docx Page 1
Technical Note
1 Introduction Cardno has been engaged by Wollongong Recycling and Building Supplies Pty Ltd to prepare a Modelling Traffic Management Plan in relation to traffic impact on the railway level crossing located on West Dapto Road, Kembla Grange NSW. This technical note is in response to Sydney Trains comments regarding the proposed expansion of the Re-cycling Facility located at 50 Wylie Road, Kembla Grange.
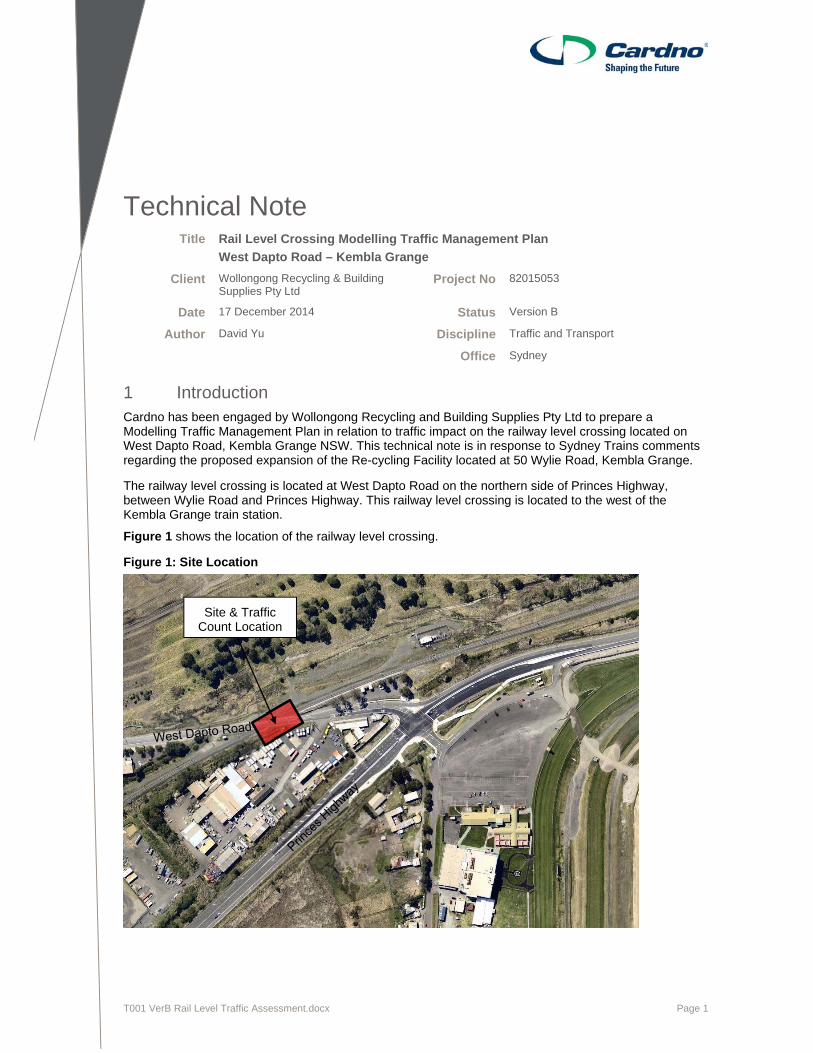
The railway level crossing is located at West Dapto Road on the northern side of Princes Highway, between Wylie Road and Princes Highway. This railway level crossing is located to the west of the Kembla Grange train station.
Figure 1 shows the location of the railway level crossing.
Figure 1: Site Location
Title Rail Level Crossing Modelling Traffic Management Plan
West Dapto Road – Kembla Grange
Client Wollongong Recycling & Building Supplies Pty Ltd
Project No 82015053
Date 17 December 2014 Status Version B
Author David Yu Discipline Traffic and Transport
Office Sydney
Site & Traffic Count Location

Rail Level Crossing Modelling Traffic Management Plan West Dapto Road – Kembla Grange
82015053 Cardno 17 December 2014
Prepared for Wollongong Recycling & Building Supplies Pty Ltd Page 2
2 Scope of Work The following works have been undertaken as part of this study:
> Collate data and review background documents for the study site (railway level crossing and signalised intersection of West Dapto Road/Princes Highway);
> Assess traffic volumes based on existing (including committed developments which includes: Prixcar site, PAC Stage 2, and PAC Stage 3) plus proposed development flows (Wollongong Recycling and Building Supplies). The scenarios to be tested are ‘Existing conditions,’ and ‘Future Baseline with Developments.’
> Undertake assessment of railway level crossing and the West Dapto Road / Princes Highway intersection using SIDRA modelling software;
> Extract anticipated performance indicators from the model such as queue lengths at the boom gate approach when it is closed; and
> To check if the proposed development with the baseline flows (including committed developments) is within the ALCAM rating of the rail crossing for the forecast design year.
Assumptions
> Traffic survey data and forecasted traffic from the Rail Level Modelling Traffic Management Plan report (for the Prixcar site, PAC Stage 2, and PAC Stage 3 developments) undertaken by Cardno (November 2014) used as a basis for baseline and committed development traffic generation.
> The weekday AM and PM peak hour periods shall be the focus of the assessment.
> We shall assume an annualised growth rate based on previous studies data.
> A freight train service assumed to operate during the peak periods.
3 Existing Conditions ALCAM Rating
On the 13 October 2014 a traffic tube count (Appendix A) was undertaken for a seven day period (24 hours per day) adjacent to the railway level crossing on West Dapto Road. The survey results showed the total volume of traffic along West Dapto Road that would travel along the rail level crossing. The peak hour traffic volumes were also obtained for the AM and PM peak periods. The total daily volumes for the 7 days extracted from the traffic tube count survey data are shown below in Table 1.
Table 1: Total Daily Traffic Volumes (vehicles per day)
Daily Total Traffic
Volume
Monday Tuesday Wednesday Thursday Friday Saturday Sunday
Eastbound 1660 1661 1734 1654 1748 1382 955
Westbound 1640 1688 1742 1702 1752 1403 989
Combined 3300 3349 3476 3356 3500 2785 1944
Based on discussions with Railcorp, the ALCAM rating was obtained for this rail level crossing adjacent to Kembla Grange train station, which is 3700 vehicle movements per day. As shown above the survey data reveals that the existing daily traffic volume is close to the ALCAM rating capacity of the rail level crossing.
Peak Hour Traffic Flows
Results from the traffic tube count undertaken from 13 October 2014 showed that the maximum peak hour combined traffic volume for AM was 391 vehicles per hour (Saturday) and 338 vehicles per hour for PM peak hour (Friday). These peak hour volumes are summarised in Table 2 and Table 3.
Rail Level Crossing Modelling Traffic Management Plan West Dapto Road – Kembla Grange
82015053 Cardno 17 December 2014
Prepared for Wollongong Recycling & Building Supplies Pty Ltd Page 3
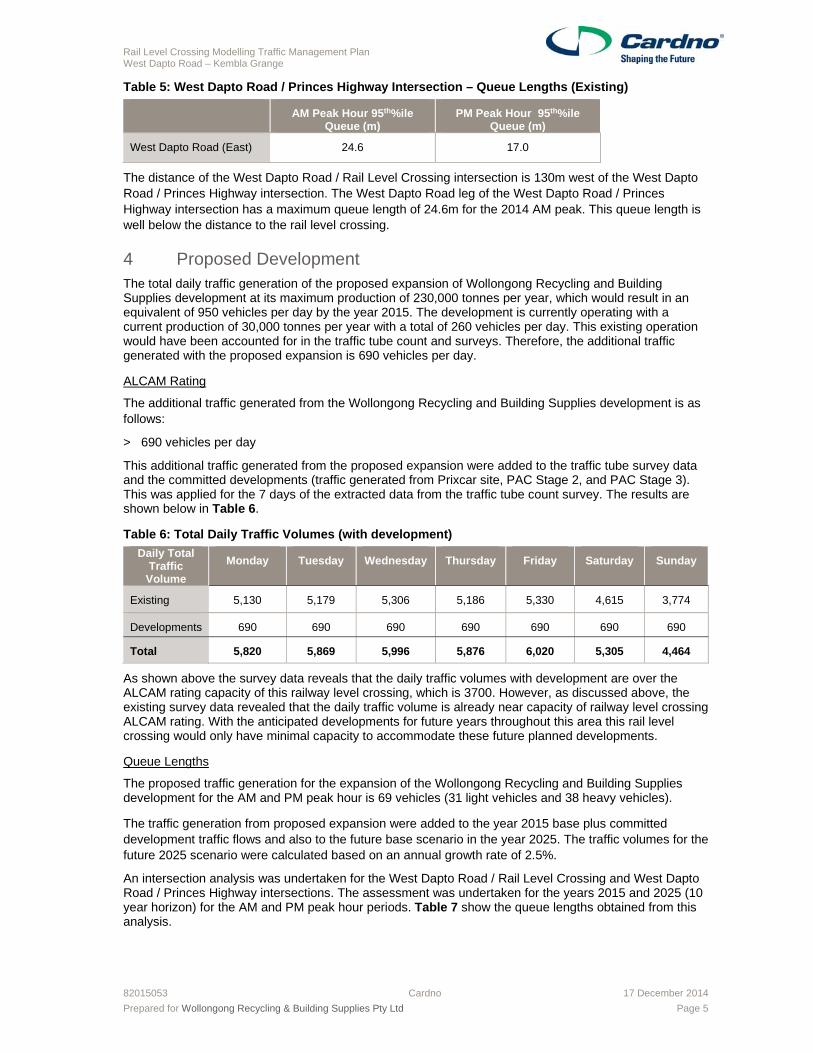
Table 2: AM Peak Hour Traffic Volumes (vehicles per day)
AM Peak Hour
Monday Tuesday Wednesday Thursday Friday Saturday Sunday
Eastbound 154 156 173 149 168 191 121
Westbound 160 156 161 163 161 200 116
Combined 314 312 334 312 329 391 237
Table 3: PM Peak Hour Traffic Volumes (vehicles per day)
PM Peak Hour
Monday Tuesday Wednesday Thursday Friday Saturday Sunday
Eastbound 160 173 160 154 177 161 112
Westbound 137 148 147 146 161 128 107
Combined 297 321 307 300 338 289 219
The baseline traffic flows for the years 2015 and 2025 have been calculated with a 2.5% annual growth factor applied to the traffic volumes obtained for the year 2012 (consistent with other proposed developments traffic reports in the vicinity of the Wollongong Recycling and Building Supplies). These traffic volumes were larger than the volumes obtained from the traffic tube count undertaken in year 2014. Therefore, as a conservative approach was retained for this assessment.
Queue Lengths
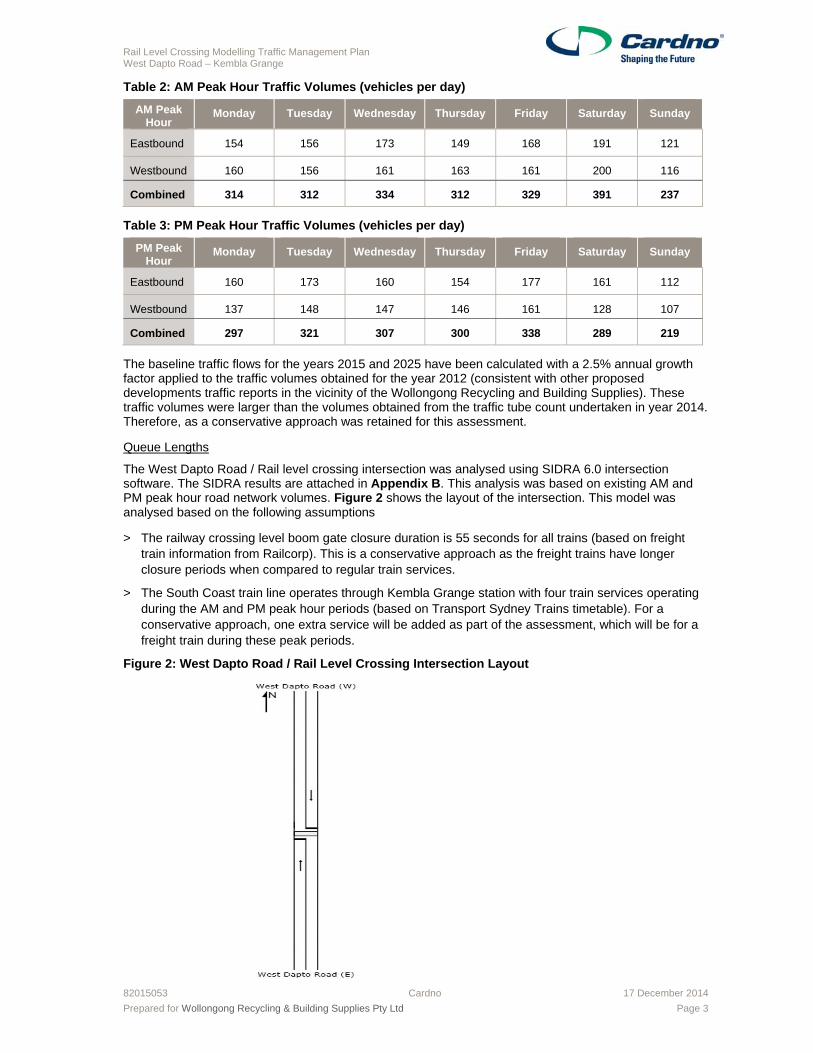
The West Dapto Road / Rail level crossing intersection was analysed using SIDRA 6.0 intersection software. The SIDRA results are attached in Appendix B. This analysis was based on existing AM and PM peak hour road network volumes. Figure 2 shows the layout of the intersection. This model was analysed based on the following assumptions
> The railway crossing level boom gate closure duration is 55 seconds for all trains (based on freight train information from Railcorp). This is a conservative approach as the freight trains have longer closure periods when compared to regular train services.
> The South Coast train line operates through Kembla Grange station with four train services operating during the AM and PM peak hour periods (based on Transport Sydney Trains timetable). For a conservative approach, one extra service will be added as part of the assessment, which will be for a freight train during these peak periods.
Figure 2: West Dapto Road / Rail Level Crossing Intersection Layout
Rail Level Crossing Modelling Traffic Management Plan West Dapto Road – Kembla Grange
82015053 Cardno 17 December 2014
Prepared for Wollongong Recycling & Building Supplies Pty Ltd Page 4
Table 4 shows the modelling queue lengths for the eastern and western approaches to the rail level crossing for the existing scenarios.
Table 4: West Dapto Road / Rail Level Crossing Intersection - Queue Lengths (Existing)
AM Peak Hour 95th%ile Queue (m)
PM Peak Hour 95th%ile Queue (m)
West Dapto Road (East) 48.0m 37.7m
West Dapto Road (West) 45.6m 41.9m
The Wylie Road / West Dapto Road intersection is located 370m to the west of the West Dapto Road / Rail Level Crossing intersection. The western leg of the West Dapto Road / Rail Level Crossing intersection has a maximum queue length of 45.6m, which is well below the distance to the Wylie Road intersection. The West Dapto Road / Princes Highway intersection is located 130m to the east of the West Dapto Road / Rail Level Crossing intersection. The eastern leg of the West Dapto Road / Rail Level Crossing intersection has a maximum queue length of 48.0m, which is below the distance to the Princes Highway intersection.
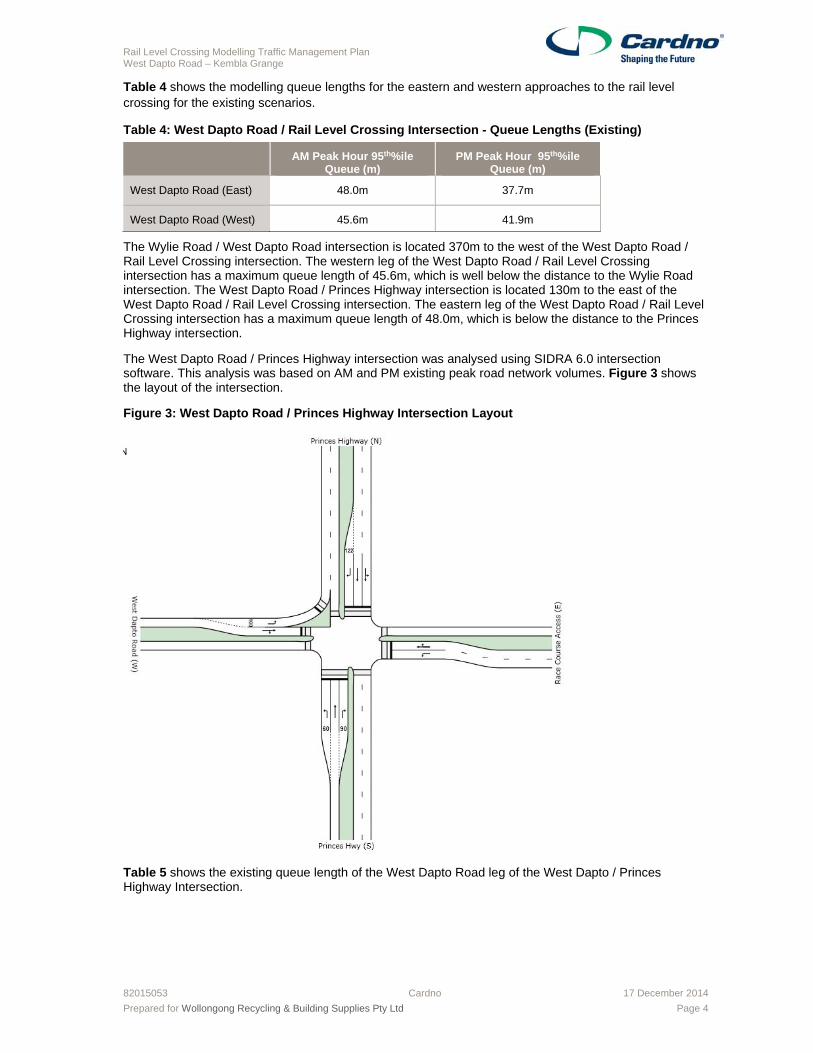
The West Dapto Road / Princes Highway intersection was analysed using SIDRA 6.0 intersection software. This analysis was based on AM and PM existing peak road network volumes. Figure 3 shows the layout of the intersection.
Figure 3: West Dapto Road / Princes Highway Intersection Layout
Table 5 shows the existing queue length of the West Dapto Road leg of the West Dapto / Princes Highway Intersection.
Rail Level Crossing Modelling Traffic Management Plan West Dapto Road – Kembla Grange
82015053 Cardno 17 December 2014
Prepared for Wollongong Recycling & Building Supplies Pty Ltd Page 5
Table 5: West Dapto Road / Princes Highway Intersection – Queue Lengths (Existing)
AM Peak Hour 95th%ile Queue (m)
PM Peak Hour 95th%ile Queue (m)
West Dapto Road (East) 24.6 17.0
The distance of the West Dapto Road / Rail Level Crossing intersection is 130m west of the West Dapto Road / Princes Highway intersection. The West Dapto Road leg of the West Dapto Road / Princes Highway intersection has a maximum queue length of 24.6m for the 2014 AM peak. This queue length is well below the distance to the rail level crossing.
4 Proposed Development The total daily traffic generation of the proposed expansion of Wollongong Recycling and Building Supplies development at its maximum production of 230,000 tonnes per year, which would result in an equivalent of 950 vehicles per day by the year 2015. The development is currently operating with a current production of 30,000 tonnes per year with a total of 260 vehicles per day. This existing operation would have been accounted for in the traffic tube count and surveys. Therefore, the additional traffic generated with the proposed expansion is 690 vehicles per day.
ALCAM Rating
The additional traffic generated from the Wollongong Recycling and Building Supplies development is as follows:
> 690 vehicles per day
This additional traffic generated from the proposed expansion were added to the traffic tube survey data and the committed developments (traffic generated from Prixcar site, PAC Stage 2, and PAC Stage 3). This was applied for the 7 days of the extracted data from the traffic tube count survey. The results are shown below in Table 6.
Table 6: Total Daily Traffic Volumes (with development)
Daily Total Traffic
Volume
Monday Tuesday Wednesday Thursday Friday Saturday Sunday
Existing 5,130 5,179 5,306 5,186 5,330 4,615 3,774
Developments 690 690 690 690 690 690 690
Total 5,820 5,869 5,996 5,876 6,020 5,305 4,464
As shown above the survey data reveals that the daily traffic volumes with development are over the ALCAM rating capacity of this railway level crossing, which is 3700. However, as discussed above, the existing survey data revealed that the daily traffic volume is already near capacity of railway level crossing ALCAM rating. With the anticipated developments for future years throughout this area this rail level crossing would only have minimal capacity to accommodate these future planned developments.
Queue Lengths
The proposed traffic generation for the expansion of the Wollongong Recycling and Building Supplies development for the AM and PM peak hour is 69 vehicles (31 light vehicles and 38 heavy vehicles).
The traffic generation from proposed expansion were added to the year 2015 base plus committed development traffic flows and also to the future base scenario in the year 2025. The traffic volumes for the future 2025 scenario were calculated based on an annual growth rate of 2.5%.
An intersection analysis was undertaken for the West Dapto Road / Rail Level Crossing and West Dapto Road / Princes Highway intersections. The assessment was undertaken for the years 2015 and 2025 (10 year horizon) for the AM and PM peak hour periods. Table 7 show the queue lengths obtained from this analysis.

Rail Level Crossing Modelling Traffic Management Plan West Dapto Road – Kembla Grange
82015053 Cardno 17 December 2014
Prepared for Wollongong Recycling & Building Supplies Pty Ltd Page 6
Table 7: West Dapto Road / Rail Level Crossing Intersection - Queue Lengths (with Development)
2015 AM Peak Hour 95th%ile Queue (m)
PM Peak Hour 95th%ile Queue (m)
West Dapto Road (East) 110.3 51.0
West Dapto Road (West) 59.4 102.3
2025 AM Peak Hour 95th%ile Queue (m)
PM Peak Hour 95th%ile Queue (m)
West Dapto Road (East) 128.7 63.7
West Dapto Road (West) 74.0 119.6
The Wylie Road / West Dapto Road intersection is located 370m to the west of the West Dapto Road / Rail Level Crossing intersection. The western leg of the West Dapto Road / Rail Level Crossing intersection has a maximum queue length of 119.6m (year 2025 PM peak hour), which is well below the distance of the Wylie Road intersection. The West Dapto Road / Princes Highway intersection is located 130m from the east of the West Dapto Road / Rail Level Crossing intersection. The eastern leg of the West Dapto Road / Rail Level Crossing intersection has a queue length of 128.7m (year 2025 AM peak hour), which is below the distance of the Princes Highway intersection.
The West Dapto Road / Princes Highway intersection was analysed using SIDRA intersection software. This analysis was based on AM and PM peak periods during the years 2015 and 2025 with development. Table 8 shows the queue lengths of the West Dapto Road leg of the West Dapto Road / Princes Highway intersection.
Table 8: West Dapto Road / Princes Highway Intersection – Queue Lengths (with Development)
2015 AM Peak Hour 95th%ile Queue (m)
PM Peak Hour 95th%ile Queue (m)
West Dapto Road 38.7 70.2
2025 AM Peak Hour 95th%ile Queue (m)
PM Peak Hour 95th%ile Queue (m)
West Dapto Road 40.4 81.0
The distance of the West Dapto Road / Rail Level Crossing intersection is 130m west of the West Dapto Road / Princes Highway intersection. The West Dapto Road leg of the West Dapto Road / Princes Highway intersection has a maximum queue length of 81m, which is below the distance to the rail level crossing. Therefore, this would not result in queuing across the rail level crossing.
5 Conclusion Cardno has assessed the rail level crossing and the impacts of queuing on the approaches to the rail level crossing and the queue from the West Dapto Road / Princes Highway intersection to the rail level crossing. The outcomes of this assessment are as follows:
> The 13 October 2014 traffic tube count that was undertaken showed that the maximum daily traffic volume that crossed the rail level crossing was 3500 vehicles. This is close to the ALCAM rating capacity of this rail level crossing which has a capacity of 3700 vehicles per day. Therefore, to consider any future proposed developments in the area, further investigations and mitigations should be considered.
> The queue lengths on the approaches to the railway level crossing were sufficiently within the distances to the adjacent intersections to the east and west for the AM and PM peak periods of the years 2015 and 2025 with development.
> The worst case AM and PM peak hour queue length from the West Dapto Road / Princes Highway intersection is 81m (year 2024 PM peak hour), which is below the distance to the rail level crossing, which is 130m away.

Rail Level Crossing Modelling Traffic Management Plan West Dapto Road – Kembla Grange
82015053 Cardno 17 December 2014
Prepared for Wollongong Recycling & Building Supplies Pty Ltd Page 7
Based on the assessment undertaken for the rail level crossing. It is clearly shown that the queue lengths on the West Dapto Road leg of the West Dapto Road / Princes Highway intersection is acceptable for the AM and PM peak periods with the proposed expansion of the Wollongong Recycling and Building Supplies development in the years 2015 and 2025 (future scenarios). This assessment was undertaken with the addition of the traffic generated from the other proposed developments (committed developments) in the vicinity of the subject site.

Gosford Shop Top Housing Development
7 October 2014 Cardno 17
APPENDIX
A SURVEY DATA

Road West Dapto Road Average Weekday 1691
Location adjacent to the rail crossing 7 Day Average 1542
Site No. 1 Weekday Heavy's 26.6%
Start Date Tuesday 7-Oct-14 7 Day Heavy's 22.4%
Direction Eastbound
Mon Tue Wed Thu Fri Sat Sun Ave 7 DayTime 13-Oct 7-Oct 8-Oct 9-Oct 10-Oct 11-Oct 12-Oct W'day Ave
AM Peak 154 156 173 149 168 191 121PM Peak 160 173 160 154 177 161 112
0:00 4 1 4 4 8 1 9 4 41:00 6 0 0 4 4 1 4 3 32:00 13 1 5 2 4 2 2 5 43:00 5 5 12 4 6 11 4 6 74:00 15 9 11 8 11 6 2 11 95:00 28 25 27 33 18 19 11 26 236:00 44 40 42 51 46 27 10 45 377:00 104 91 93 97 99 49 16 97 788:00 150 135 110 139 143 95 53 135 1189:00 136 113 127 120 142 123 81 128 12010:00 153 147 173 140 152 160 107 153 14711:00 154 156 156 149 168 191 121 157 15612:00 133 150 160 153 166 161 112 152 14813:00 130 141 147 144 161 123 99 145 13514:00 160 173 148 154 177 99 65 162 13915:00 141 156 155 148 140 91 76 148 13016:00 109 131 144 138 130 67 43 130 10917:00 71 61 77 64 64 37 41 67 5918:00 51 58 50 41 33 42 25 47 4319:00 20 27 36 21 24 26 23 26 2520:00 21 15 18 21 13 19 12 18 1721:00 4 9 22 10 11 12 23 11 1322:00 4 7 14 3 19 10 8 9 923:00 4 10 3 6 9 10 8 6 7
Total 1660 1661 1734 1654 1748 1382 955 1691 1542% Heavies 26.9% 26.0% 25.1% 27.6% 27.2% 9.9% 3.8% 26.6% 22.4%
Day of Week
0
20
40
60
80
100
120
140
160
180
0:00
1:00
2:00
3:00
4:00
5:00
6:00
7:00
8:00
9:00
10:0
0
11:0
0
12:0
0
13:0
0
14:0
0
15:0
0
16:0
0
17:0
0
18:0
0
19:0
0
20:0
0
21:0
0
22:0
0
23:0
0
Ve
hic
les
Hour Starting
Ave W'day 7 Day Ave
Prepared by : Austraffic

Road West Dapto Road Average Weekday 1705
Location adjacent to the rail crossing 7 Day Average 1559
Site No. 1 Weekday Heavy's 27.2%
Start Date Tuesday 7-Oct-14 7 Day Heavy's 22.8%
Direction Westbound
Mon Tue Wed Thu Fri Sat Sun Ave 7 Day
Time 13-Oct 7-Oct 8-Oct 9-Oct 10-Oct 11-Oct 12-Oct W'day AveAM Peak 160 156 161 163 161 200 116PM Peak 137 148 147 146 161 128 107
0:00 7 0 4 4 5 2 6 4 41:00 3 1 3 4 5 2 5 3 32:00 4 1 6 6 6 5 2 5 43:00 9 6 6 9 6 9 6 7 74:00 18 14 17 12 14 8 1 15 125:00 48 54 50 53 48 26 8 51 416:00 112 76 114 111 114 35 9 105 827:00 108 131 110 120 114 75 31 117 988:00 137 117 117 129 152 97 76 130 1189:00 142 128 138 145 136 134 99 138 13210:00 160 156 158 163 161 176 110 160 15511:00 129 145 161 138 161 200 116 147 15012:00 125 148 141 143 155 128 107 142 13513:00 137 144 147 146 161 115 81 147 13314:00 110 126 133 129 125 103 80 125 11515:00 127 131 127 122 116 75 62 125 10916:00 80 97 81 83 89 41 45 86 7417:00 82 95 78 62 55 39 38 74 6418:00 41 46 56 43 48 43 33 47 4419:00 27 16 50 29 24 23 24 29 2820:00 17 22 16 20 15 22 12 18 1821:00 6 16 13 14 18 14 13 13 1322:00 3 10 9 6 14 17 12 8 1023:00 8 8 7 11 10 14 13 9 10
Total 1640 1688 1742 1702 1752 1403 989 1705 1559% Heavies 28.7% 26.1% 25.7% 28.7% 26.8% 9.7% 3.9% 27.2% 22.8%
Day of Week
0
20
40
60
80
100
120
140
160
180
0:00
1:00
2:00
3:00
4:00
5:00
6:00
7:00
8:00
9:00
10:0
0
11:0
0
12:0
0
13:0
0
14:0
0
15:0
0
16:0
0
17:0
0
18:0
0
19:0
0
20:0
0
21:0
0
22:0
0
23:0
0
Ve
hic
les
Hour Starting
Ave W'day 7 Day Ave
Prepared by : Austraffic

Road West Dapto Road Average Weekday 3396
Location adjacent to the rail crossing 7 Day Average 3101
Site No. 1 Weekday Heavy's 26.9%
Start Date Tuesday 7-Oct-14 7 Day Heavy's 22.6%
Direction Combined
Mon Tue Wed Thu Fri Sat Sun Ave 7 Day
Time 13-Oct 7-Oct 8-Oct 9-Oct 10-Oct 11-Oct 12-Oct W'day AveAM Peak 313 303 331 303 329 391 237PM Peak 270 299 301 296 322 289 219
0:00 11 1 8 8 13 3 15 8 81:00 9 1 3 8 9 3 9 6 62:00 17 2 11 8 10 7 4 10 83:00 14 11 18 13 12 20 10 14 144:00 33 23 28 20 25 14 3 26 215:00 76 79 77 86 66 45 19 77 646:00 156 116 156 162 160 62 19 150 1197:00 212 222 203 217 213 124 47 213 1778:00 287 252 227 268 295 192 129 266 2369:00 278 241 265 265 278 257 180 265 25210:00 313 303 331 303 313 336 217 313 30211:00 283 301 317 287 329 391 237 303 30612:00 258 298 301 296 321 289 219 295 28313:00 267 285 294 290 322 238 180 292 26814:00 270 299 281 283 302 202 145 287 25515:00 268 287 282 270 256 166 138 273 23816:00 189 228 225 221 219 108 88 216 18317:00 153 156 155 126 119 76 79 142 12318:00 92 104 106 84 81 85 58 93 8719:00 47 43 86 50 48 49 47 55 5320:00 38 37 34 41 28 41 24 36 3521:00 10 25 35 24 29 26 36 25 2622:00 7 17 23 9 33 27 20 18 1923:00 12 18 10 17 19 24 21 15 17
Total 3300 3349 3476 3356 3500 2785 1944 3396 3101% Heavies 27.8% 26.1% 25.4% 28.2% 27.0% 9.8% 3.9% 26.9% 22.6%
Day of Week
0
50
100
150
200
250
300
350
0:00
1:00
2:00
3:00
4:00
5:00
6:00
7:00
8:00
9:00
10:0
0
11:0
0
12:0
0
13:0
0
14:0
0
15:0
0
16:0
0
17:0
0
18:0
0
19:0
0
20:0
0
21:0
0
22:0
0
23:0
0
Ve
hic
les
Hour Starting
Ave W'day 7 Day Ave
Prepared by : Austraffic
Traffic Impact Assessment Vehicle Storage and Processing Facility – 132 West Dapto Road
September 2014 Cardno 21
APPENDIX
B SIDRA RESULTS

SITE LAYOUTSite: West Dapto Road & Princes Hwy - 2014 Base AMPH
West Dapto Road & Princes Highway Signals - Fixed Time
Created: Wednesday, 17 December 2014 2:24:00 PMSIDRA INTERSECTION 6.0.22.4722
Copyright © 2000-2014 Akcelik and Associates Pty Ltdwww.sidrasolutions.com
Project: C:\Users\David.Yu\Desktop\David Yu\Projects\Kembla Grange Wollongong Recycling\West Dapto & Princes Hwy - Signalised - Wollongong Recycling.sip68000955, CARDNO, NETWORK / Enterprise

MOVEMENT SUMMARYSite: West Dapto Road & Princes Hwy - 2014 Base AMPH
West Dapto Road & Princes Highway Signals - Fixed Time Cycle Time = 130 seconds (Practical Cycle Time)
Movement Performance - VehiclesDemand Flows 95% Back of QueueMov
ID ODMov
Deg.Satn
AverageDelay
Level ofService
Prop. Queued
Effective Stop Rate
AverageSpeed Total HV Vehicles Distance
veh/h % v/c sec veh m per veh km/hSouth: Princes Hwy (S)
1 L2 21 40.0 0.028 22.9 LOS B 0.6 5.8 0.50 0.69 44.1
2 T1 399 6.6 0.694 41.0 LOS C 21.9 161.9 0.93 0.81 42.1
3 R2 37 3.0 0.122 45.2 LOS D 1.8 12.7 0.78 0.74 36.5
Approach 457 7.8 0.694 40.5 LOS C 21.9 161.9 0.90 0.80 41.7
East: Race Course Access (E)
4 L2 21 3.0 0.084 57.6 LOS E 1.2 8.4 0.90 0.71 31.7
5 T1 5 3.0 0.142 53.9 LOS D 2.3 16.4 0.89 0.74 33.8
6 R2 37 3.0 0.142 55.4 LOS D 2.3 16.4 0.89 0.74 32.6
Approach 63 3.0 0.142 56.0 LOS D 2.3 16.4 0.89 0.73 32.4
North: Princes Highway (N)
7 L2 53 3.0 0.183 22.7 LOS B 5.8 42.2 0.54 0.54 50.2
8 T1 318 5.6 0.183 15.7 LOS B 5.8 42.6 0.54 0.49 58.7
9 R2 314 19.8 0.707 51.0 LOS D 16.6 135.7 0.95 0.94 34.7
Approach 684 11.9 0.707 32.4 LOS C 16.6 135.7 0.73 0.70 44.1
West: West Dapto Road (W)
10 L2 298 14.0 0.216 8.5 LOS A 1.4 12.5 0.16 0.64 60.9
11 T1 26 3.0 0.193 52.8 LOS D 2.8 24.6 0.90 0.74 33.9
12 R2 25 26.0 0.193 58.1 LOS E 2.8 24.6 0.90 0.74 32.7
Approach 349 14.0 0.216 15.4 LOS B 2.8 24.6 0.27 0.65 54.3
All Vehicles 1554 10.8 0.707 31.9 LOS C 21.9 161.9 0.68 0.72 44.6
Level of Service (LOS) Method: Delay (RTA NSW). Vehicle movement LOS values are based on average delay per movementIntersection and Approach LOS values are based on average delay for all vehicle movements.SIDRA Standard Delay Model is used. Control Delay includes Geometric Delay.Gap-Acceptance Capacity: SIDRA Standard (Akçelik M3D).HV (%) values are calculated for All Movement Classes of All Heavy Vehicle Model Designation.
Movement Performance - PedestriansAverage Back of QueueMov
ID DescriptionDemand
Flow Average
Delay Level ofService
Prop. Queued
Effective Stop RatePedestrian Distance
ped/h sec ped m per ped
P1 South Full Crossing 53 59.3 LOS E 0.2 0.2 0.96 0.96
P2 East Full Crossing 53 37.0 LOS D 0.1 0.1 0.76 0.76
P3 North Full Crossing 53 59.3 LOS E 0.2 0.2 0.96 0.96
P4 West Full Crossing 53 34.8 LOS D 0.1 0.1 0.73 0.73
P4S West Slip/Bypass Lane Crossing 53 0.5 LOS A 0.0 0.0 0.12 0.12
All Pedestrians 263 38.2 LOS D 0.70 0.70
Level of Service (LOS) Method: SIDRA Pedestrian LOS Method (Based on Average Delay)Pedestrian movement LOS values are based on average delay per pedestrian movement.Intersection LOS value for Pedestrians is based on average delay for all pedestrian movements.
Processed: Wednesday, 17 December 2014 2:20:23 PMSIDRA INTERSECTION 6.0.22.4722
Copyright © 2000-2014 Akcelik and Associates Pty Ltdwww.sidrasolutions.com
Project: C:\Users\David.Yu\Desktop\David Yu\Projects\Kembla Grange Wollongong Recycling\West Dapto & Princes Hwy - Signalised - Wollongong Recycling.sip68000955, CARDNO, NETWORK / Enterprise

PHASING SUMMARYSite: West Dapto Road & Princes Hwy - 2014 Base AMPH
West Dapto Road & Princes Highway Signals - Fixed Time Cycle Time = 130 seconds (Practical Cycle Time)
Phase times determined by the programSequence: Variable PhasingMovement Class: All Movement ClassesInput Sequence: A, B, D, EOutput Sequence: A, B, D, E
Phase Timing ResultsPhase A B D EReference Phase Yes No No NoPhase Change Time (sec) 0 47 76 103Green Time (sec) 41 23 21 21Yellow Time (sec) 4 4 4 4All-Red Time (sec) 2 2 2 2Phase Time (sec) 47 29 27 27Phase Split 36 % 22 % 21 % 21 %
Normal Movement Permitted/Opposed
Slip/Bypass-Lane Movement Opposed Slip/Bypass-Lane
Stopped Movement Turn On Red
Other Movement Class Running Other Movement Class Stopped
Mixed Running & Stopped Movement Classes
Undetected Movement Phase Transition Applied
Processed: Wednesday, 17 December 2014 2:20:23 PMSIDRA INTERSECTION 6.0.22.4722
Copyright © 2000-2014 Akcelik and Associates Pty Ltdwww.sidrasolutions.com
Project: C:\Users\David.Yu\Desktop\David Yu\Projects\Kembla Grange Wollongong Recycling\West Dapto & Princes Hwy - Signalised - Wollongong Recycling.sip68000955, CARDNO, NETWORK / Enterprise
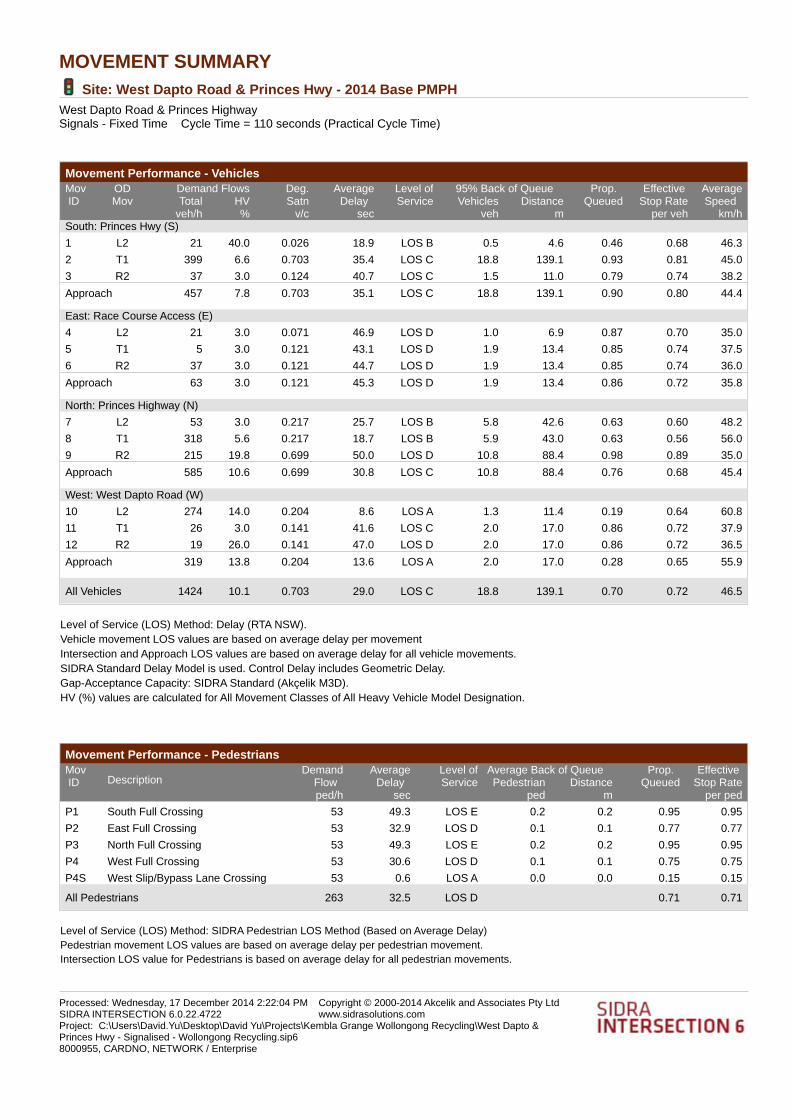
MOVEMENT SUMMARYSite: West Dapto Road & Princes Hwy - 2014 Base PMPH
West Dapto Road & Princes Highway Signals - Fixed Time Cycle Time = 110 seconds (Practical Cycle Time)
Movement Performance - VehiclesDemand Flows 95% Back of QueueMov
ID ODMov
Deg.Satn
AverageDelay
Level ofService
Prop. Queued
Effective Stop Rate
AverageSpeed Total HV Vehicles Distance
veh/h % v/c sec veh m per veh km/hSouth: Princes Hwy (S)
1 L2 21 40.0 0.026 18.9 LOS B 0.5 4.6 0.46 0.68 46.3
2 T1 399 6.6 0.703 35.4 LOS C 18.8 139.1 0.93 0.81 45.0
3 R2 37 3.0 0.124 40.7 LOS C 1.5 11.0 0.79 0.74 38.2
Approach 457 7.8 0.703 35.1 LOS C 18.8 139.1 0.90 0.80 44.4
East: Race Course Access (E)
4 L2 21 3.0 0.071 46.9 LOS D 1.0 6.9 0.87 0.70 35.0
5 T1 5 3.0 0.121 43.1 LOS D 1.9 13.4 0.85 0.74 37.5
6 R2 37 3.0 0.121 44.7 LOS D 1.9 13.4 0.85 0.74 36.0
Approach 63 3.0 0.121 45.3 LOS D 1.9 13.4 0.86 0.72 35.8
North: Princes Highway (N)
7 L2 53 3.0 0.217 25.7 LOS B 5.8 42.6 0.63 0.60 48.2
8 T1 318 5.6 0.217 18.7 LOS B 5.9 43.0 0.63 0.56 56.0
9 R2 215 19.8 0.699 50.0 LOS D 10.8 88.4 0.98 0.89 35.0
Approach 585 10.6 0.699 30.8 LOS C 10.8 88.4 0.76 0.68 45.4
West: West Dapto Road (W)
10 L2 274 14.0 0.204 8.6 LOS A 1.3 11.4 0.19 0.64 60.8
11 T1 26 3.0 0.141 41.6 LOS C 2.0 17.0 0.86 0.72 37.9
12 R2 19 26.0 0.141 47.0 LOS D 2.0 17.0 0.86 0.72 36.5
Approach 319 13.8 0.204 13.6 LOS A 2.0 17.0 0.28 0.65 55.9
All Vehicles 1424 10.1 0.703 29.0 LOS C 18.8 139.1 0.70 0.72 46.5
Level of Service (LOS) Method: Delay (RTA NSW). Vehicle movement LOS values are based on average delay per movementIntersection and Approach LOS values are based on average delay for all vehicle movements.SIDRA Standard Delay Model is used. Control Delay includes Geometric Delay.Gap-Acceptance Capacity: SIDRA Standard (Akçelik M3D).HV (%) values are calculated for All Movement Classes of All Heavy Vehicle Model Designation.
Movement Performance - PedestriansAverage Back of QueueMov
ID DescriptionDemand
Flow Average
Delay Level ofService
Prop. Queued
Effective Stop RatePedestrian Distance
ped/h sec ped m per ped
P1 South Full Crossing 53 49.3 LOS E 0.2 0.2 0.95 0.95
P2 East Full Crossing 53 32.9 LOS D 0.1 0.1 0.77 0.77
P3 North Full Crossing 53 49.3 LOS E 0.2 0.2 0.95 0.95
P4 West Full Crossing 53 30.6 LOS D 0.1 0.1 0.75 0.75
P4S West Slip/Bypass Lane Crossing 53 0.6 LOS A 0.0 0.0 0.15 0.15
All Pedestrians 263 32.5 LOS D 0.71 0.71
Level of Service (LOS) Method: SIDRA Pedestrian LOS Method (Based on Average Delay)Pedestrian movement LOS values are based on average delay per pedestrian movement.Intersection LOS value for Pedestrians is based on average delay for all pedestrian movements.
Processed: Wednesday, 17 December 2014 2:22:04 PMSIDRA INTERSECTION 6.0.22.4722
Copyright © 2000-2014 Akcelik and Associates Pty Ltdwww.sidrasolutions.com
Project: C:\Users\David.Yu\Desktop\David Yu\Projects\Kembla Grange Wollongong Recycling\West Dapto & Princes Hwy - Signalised - Wollongong Recycling.sip68000955, CARDNO, NETWORK / Enterprise

PHASING SUMMARYSite: West Dapto Road & Princes Hwy - 2014 Base PMPH
West Dapto Road & Princes Highway Signals - Fixed Time Cycle Time = 110 seconds (Practical Cycle Time)
Phase times determined by the programSequence: Variable PhasingMovement Class: All Movement ClassesInput Sequence: A, B, D, EOutput Sequence: A, B, D, E
Phase Timing ResultsPhase A B D EReference Phase Yes No No NoPhase Change Time (sec) 0 40 56 83Green Time (sec) 34 10 21 21Yellow Time (sec) 4 4 4 4All-Red Time (sec) 2 2 2 2Phase Time (sec) 40 16 27 27Phase Split 36 % 15 % 25 % 25 %
Normal Movement Permitted/Opposed
Slip/Bypass-Lane Movement Opposed Slip/Bypass-Lane
Stopped Movement Turn On Red
Other Movement Class Running Other Movement Class Stopped
Mixed Running & Stopped Movement Classes
Undetected Movement Phase Transition Applied
Processed: Wednesday, 17 December 2014 2:22:04 PMSIDRA INTERSECTION 6.0.22.4722
Copyright © 2000-2014 Akcelik and Associates Pty Ltdwww.sidrasolutions.com
Project: C:\Users\David.Yu\Desktop\David Yu\Projects\Kembla Grange Wollongong Recycling\West Dapto & Princes Hwy - Signalised - Wollongong Recycling.sip68000955, CARDNO, NETWORK / Enterprise
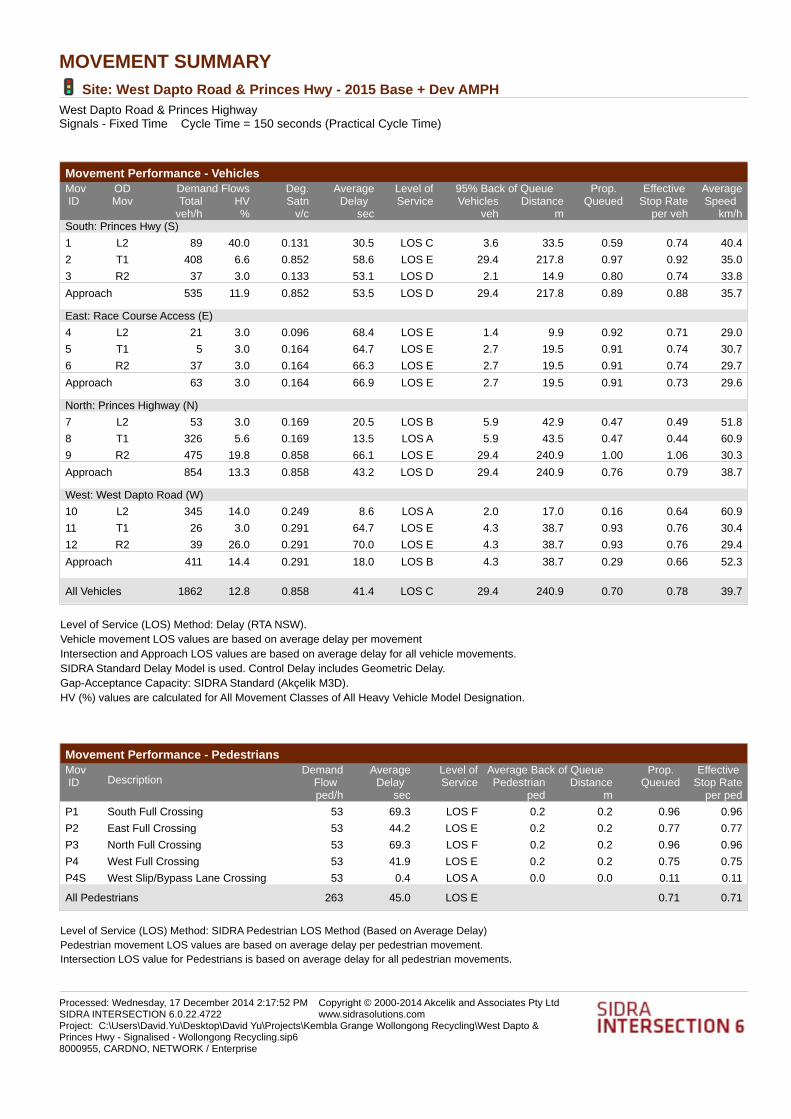
MOVEMENT SUMMARYSite: West Dapto Road & Princes Hwy - 2015 Base + Dev AMPH
West Dapto Road & Princes Highway Signals - Fixed Time Cycle Time = 150 seconds (Practical Cycle Time)
Movement Performance - VehiclesDemand Flows 95% Back of QueueMov
ID ODMov
Deg.Satn
AverageDelay
Level ofService
Prop. Queued
Effective Stop Rate
AverageSpeed Total HV Vehicles Distance
veh/h % v/c sec veh m per veh km/hSouth: Princes Hwy (S)
1 L2 89 40.0 0.131 30.5 LOS C 3.6 33.5 0.59 0.74 40.4
2 T1 408 6.6 0.852 58.6 LOS E 29.4 217.8 0.97 0.92 35.0
3 R2 37 3.0 0.133 53.1 LOS D 2.1 14.9 0.80 0.74 33.8
Approach 535 11.9 0.852 53.5 LOS D 29.4 217.8 0.89 0.88 35.7
East: Race Course Access (E)
4 L2 21 3.0 0.096 68.4 LOS E 1.4 9.9 0.92 0.71 29.0
5 T1 5 3.0 0.164 64.7 LOS E 2.7 19.5 0.91 0.74 30.7
6 R2 37 3.0 0.164 66.3 LOS E 2.7 19.5 0.91 0.74 29.7
Approach 63 3.0 0.164 66.9 LOS E 2.7 19.5 0.91 0.73 29.6
North: Princes Highway (N)
7 L2 53 3.0 0.169 20.5 LOS B 5.9 42.9 0.47 0.49 51.8
8 T1 326 5.6 0.169 13.5 LOS A 5.9 43.5 0.47 0.44 60.9
9 R2 475 19.8 0.858 66.1 LOS E 29.4 240.9 1.00 1.06 30.3
Approach 854 13.3 0.858 43.2 LOS D 29.4 240.9 0.76 0.79 38.7
West: West Dapto Road (W)
10 L2 345 14.0 0.249 8.6 LOS A 2.0 17.0 0.16 0.64 60.9
11 T1 26 3.0 0.291 64.7 LOS E 4.3 38.7 0.93 0.76 30.4
12 R2 39 26.0 0.291 70.0 LOS E 4.3 38.7 0.93 0.76 29.4
Approach 411 14.4 0.291 18.0 LOS B 4.3 38.7 0.29 0.66 52.3
All Vehicles 1862 12.8 0.858 41.4 LOS C 29.4 240.9 0.70 0.78 39.7
Level of Service (LOS) Method: Delay (RTA NSW). Vehicle movement LOS values are based on average delay per movementIntersection and Approach LOS values are based on average delay for all vehicle movements.SIDRA Standard Delay Model is used. Control Delay includes Geometric Delay.Gap-Acceptance Capacity: SIDRA Standard (Akçelik M3D).HV (%) values are calculated for All Movement Classes of All Heavy Vehicle Model Designation.
Movement Performance - PedestriansAverage Back of QueueMov
ID DescriptionDemand
Flow Average
Delay Level ofService
Prop. Queued
Effective Stop RatePedestrian Distance
ped/h sec ped m per ped
P1 South Full Crossing 53 69.3 LOS F 0.2 0.2 0.96 0.96
P2 East Full Crossing 53 44.2 LOS E 0.2 0.2 0.77 0.77
P3 North Full Crossing 53 69.3 LOS F 0.2 0.2 0.96 0.96
P4 West Full Crossing 53 41.9 LOS E 0.2 0.2 0.75 0.75
P4S West Slip/Bypass Lane Crossing 53 0.4 LOS A 0.0 0.0 0.11 0.11
All Pedestrians 263 45.0 LOS E 0.71 0.71
Level of Service (LOS) Method: SIDRA Pedestrian LOS Method (Based on Average Delay)Pedestrian movement LOS values are based on average delay per pedestrian movement.Intersection LOS value for Pedestrians is based on average delay for all pedestrian movements.
Processed: Wednesday, 17 December 2014 2:17:52 PMSIDRA INTERSECTION 6.0.22.4722
Copyright © 2000-2014 Akcelik and Associates Pty Ltdwww.sidrasolutions.com
Project: C:\Users\David.Yu\Desktop\David Yu\Projects\Kembla Grange Wollongong Recycling\West Dapto & Princes Hwy - Signalised - Wollongong Recycling.sip68000955, CARDNO, NETWORK / Enterprise

PHASING SUMMARYSite: West Dapto Road & Princes Hwy - 2015 Base + Dev AMPH
West Dapto Road & Princes Highway Signals - Fixed Time Cycle Time = 150 seconds (Practical Cycle Time)
Phase times determined by the programSequence: Variable PhasingMovement Class: All Movement ClassesInput Sequence: A, B, D, EOutput Sequence: A, B, D, E
Phase Timing ResultsPhase A B D EReference Phase Yes No No NoPhase Change Time (sec) 0 50 96 123Green Time (sec) 44 40 21 21Yellow Time (sec) 4 4 4 4All-Red Time (sec) 2 2 2 2Phase Time (sec) 50 46 27 27Phase Split 33 % 31 % 18 % 18 %
Normal Movement Permitted/Opposed
Slip/Bypass-Lane Movement Opposed Slip/Bypass-Lane
Stopped Movement Turn On Red
Other Movement Class Running Other Movement Class Stopped
Mixed Running & Stopped Movement Classes
Undetected Movement Phase Transition Applied
Processed: Wednesday, 17 December 2014 2:17:52 PMSIDRA INTERSECTION 6.0.22.4722
Copyright © 2000-2014 Akcelik and Associates Pty Ltdwww.sidrasolutions.com
Project: C:\Users\David.Yu\Desktop\David Yu\Projects\Kembla Grange Wollongong Recycling\West Dapto & Princes Hwy - Signalised - Wollongong Recycling.sip68000955, CARDNO, NETWORK / Enterprise

MOVEMENT SUMMARYSite: West Dapto Road & Princes Hwy - 2015 Base + Dev PMPH
West Dapto Road & Princes Highway Signals - Fixed Time Cycle Time = 140 seconds (Practical Cycle Time)
Movement Performance - VehiclesDemand Flows 95% Back of QueueMov
ID ODMov
Deg.Satn
AverageDelay
Level ofService
Prop. Queued
Effective Stop Rate
AverageSpeed Total HV Vehicles Distance
veh/h % v/c sec veh m per veh km/hSouth: Princes Hwy (S)
1 L2 55 40.0 0.082 29.2 LOS C 2.0 19.0 0.58 0.72 41.0
2 T1 355 6.6 0.750 49.8 LOS D 22.1 163.1 0.96 0.84 38.3
3 R2 37 3.0 0.204 58.8 LOS E 2.2 15.5 0.87 0.75 32.1
Approach 446 10.4 0.750 48.0 LOS D 22.1 163.1 0.90 0.82 38.0
East: Race Course Access (E)
4 L2 21 3.0 0.090 63.0 LOS E 1.3 9.1 0.91 0.71 30.3
5 T1 5 3.0 0.153 59.3 LOS E 2.5 18.0 0.90 0.74 32.2
6 R2 37 3.0 0.153 60.8 LOS E 2.5 18.0 0.90 0.74 31.1
Approach 63 3.0 0.153 61.4 LOS E 2.5 18.0 0.90 0.73 30.9
North: Princes Highway (N)
7 L2 53 3.0 0.298 22.8 LOS B 10.8 79.2 0.55 0.53 50.7
8 T1 586 5.6 0.298 15.8 LOS B 10.9 79.9 0.55 0.50 58.9
9 R2 421 19.8 0.764 52.4 LOS D 22.1 180.9 0.95 0.99 34.2
Approach 1060 11.1 0.764 30.7 LOS C 22.1 180.9 0.71 0.70 45.5
West: West Dapto Road (W)
10 L2 429 14.0 0.313 8.7 LOS A 2.6 22.9 0.19 0.65 60.8
11 T1 26 3.0 0.505 61.8 LOS E 7.4 70.2 0.96 0.80 30.9
12 R2 89 26.0 0.505 67.2 LOS E 7.4 70.2 0.96 0.80 29.9
Approach 545 15.4 0.505 20.8 LOS B 7.4 70.2 0.35 0.68 50.1
All Vehicles 2115 11.8 0.764 32.7 LOS C 22.1 180.9 0.66 0.72 44.1
Level of Service (LOS) Method: Delay (RTA NSW). Vehicle movement LOS values are based on average delay per movementIntersection and Approach LOS values are based on average delay for all vehicle movements.SIDRA Standard Delay Model is used. Control Delay includes Geometric Delay.Gap-Acceptance Capacity: SIDRA Standard (Akçelik M3D).HV (%) values are calculated for All Movement Classes of All Heavy Vehicle Model Designation.
Movement Performance - PedestriansAverage Back of QueueMov
ID DescriptionDemand
Flow Average
Delay Level ofService
Prop. Queued
Effective Stop RatePedestrian Distance
ped/h sec ped m per ped
P1 South Full Crossing 53 64.3 LOS F 0.2 0.2 0.96 0.96
P2 East Full Crossing 53 44.1 LOS E 0.2 0.2 0.79 0.79
P3 North Full Crossing 53 64.3 LOS F 0.2 0.2 0.96 0.96
P4 West Full Crossing 53 41.7 LOS E 0.2 0.2 0.77 0.77
P4S West Slip/Bypass Lane Crossing 53 0.5 LOS A 0.0 0.0 0.11 0.11
All Pedestrians 263 43.0 LOS E 0.72 0.72
Level of Service (LOS) Method: SIDRA Pedestrian LOS Method (Based on Average Delay)Pedestrian movement LOS values are based on average delay per pedestrian movement.Intersection LOS value for Pedestrians is based on average delay for all pedestrian movements.
Processed: Wednesday, 17 December 2014 2:17:54 PMSIDRA INTERSECTION 6.0.22.4722
Copyright © 2000-2014 Akcelik and Associates Pty Ltdwww.sidrasolutions.com
Project: C:\Users\David.Yu\Desktop\David Yu\Projects\Kembla Grange Wollongong Recycling\West Dapto & Princes Hwy - Signalised - Wollongong Recycling.sip68000955, CARDNO, NETWORK / Enterprise
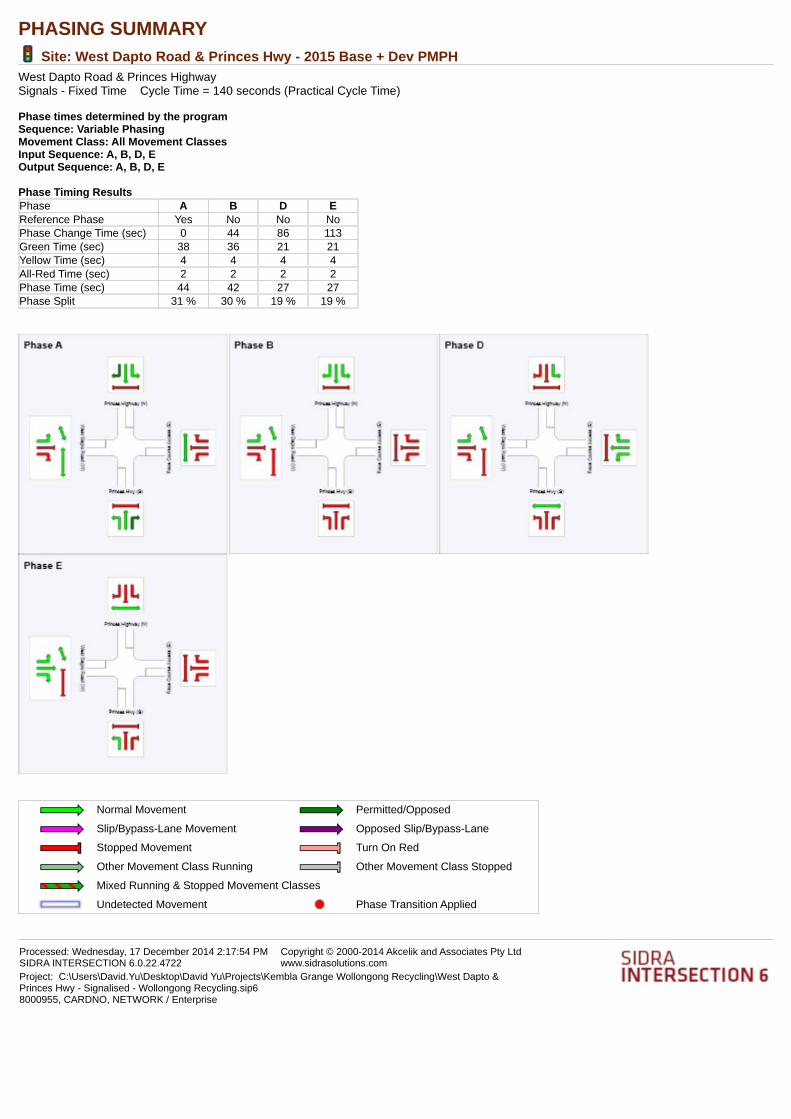
PHASING SUMMARYSite: West Dapto Road & Princes Hwy - 2015 Base + Dev PMPH
West Dapto Road & Princes Highway Signals - Fixed Time Cycle Time = 140 seconds (Practical Cycle Time)
Phase times determined by the programSequence: Variable PhasingMovement Class: All Movement ClassesInput Sequence: A, B, D, EOutput Sequence: A, B, D, E
Phase Timing ResultsPhase A B D EReference Phase Yes No No NoPhase Change Time (sec) 0 44 86 113Green Time (sec) 38 36 21 21Yellow Time (sec) 4 4 4 4All-Red Time (sec) 2 2 2 2Phase Time (sec) 44 42 27 27Phase Split 31 % 30 % 19 % 19 %
Normal Movement Permitted/Opposed
Slip/Bypass-Lane Movement Opposed Slip/Bypass-Lane
Stopped Movement Turn On Red
Other Movement Class Running Other Movement Class Stopped
Mixed Running & Stopped Movement Classes
Undetected Movement Phase Transition Applied
Processed: Wednesday, 17 December 2014 2:17:54 PMSIDRA INTERSECTION 6.0.22.4722
Copyright © 2000-2014 Akcelik and Associates Pty Ltdwww.sidrasolutions.com
Project: C:\Users\David.Yu\Desktop\David Yu\Projects\Kembla Grange Wollongong Recycling\West Dapto & Princes Hwy - Signalised - Wollongong Recycling.sip68000955, CARDNO, NETWORK / Enterprise

MOVEMENT SUMMARYSite: West Dapto Road & Princes Hwy - 2025 Base + Dev AMPH
West Dapto Road & Princes Highway Signals - Fixed Time Cycle Time = 150 seconds (Practical Cycle Time)
Movement Performance - VehiclesDemand Flows 95% Back of QueueMov
ID ODMov
Deg.Satn
AverageDelay
Level ofService
Prop. Queued
Effective Stop Rate
AverageSpeed Total HV Vehicles Distance
veh/h % v/c sec veh m per veh km/hSouth: Princes Hwy (S)
1 L2 91 40.0 0.124 28.2 LOS B 3.4 32.1 0.56 0.73 41.4
2 T1 524 6.6 0.962 84.0 LOS F 46.9 346.6 1.00 1.12 28.1
3 R2 37 3.0 0.143 51.1 LOS D 2.0 14.7 0.78 0.75 34.5
Approach 652 11.0 0.962 74.4 LOS F 46.9 346.6 0.92 1.04 29.8
East: Race Course Access (E)
4 L2 21 3.0 0.079 65.1 LOS E 1.3 9.6 0.89 0.71 29.8
5 T1 5 3.0 0.138 61.4 LOS E 2.6 18.9 0.89 0.74 31.6
6 R2 37 3.0 0.138 63.0 LOS E 2.6 18.9 0.89 0.74 30.5
Approach 63 3.0 0.138 63.6 LOS E 2.6 18.9 0.89 0.73 30.4
North: Princes Highway (N)
7 L2 53 3.0 0.200 19.5 LOS B 7.1 51.8 0.46 0.47 52.8
8 T1 417 5.6 0.200 12.5 LOS A 7.2 52.6 0.46 0.43 62.0
9 R2 515 19.8 0.977 109.8 LOS F 45.8 375.0 1.00 1.20 22.3
Approach 984 12.9 0.977 63.8 LOS E 45.8 375.0 0.74 0.83 31.9
West: West Dapto Road (W)
10 L2 411 14.0 0.279 8.2 LOS A 1.6 14.1 0.12 0.62 61.2
11 T1 26 3.0 0.265 61.5 LOS E 4.5 40.4 0.91 0.76 31.2
12 R2 43 26.0 0.265 66.8 LOS E 4.5 40.4 0.91 0.76 30.2
Approach 480 14.5 0.279 16.4 LOS B 4.5 40.4 0.23 0.64 53.5
All Vehicles 2179 12.4 0.977 56.5 LOS D 46.9 375.0 0.69 0.85 34.2
Level of Service (LOS) Method: Delay (RTA NSW). Vehicle movement LOS values are based on average delay per movementIntersection and Approach LOS values are based on average delay for all vehicle movements.SIDRA Standard Delay Model is used. Control Delay includes Geometric Delay.Gap-Acceptance Capacity: SIDRA Standard (Akçelik M3D).HV (%) values are calculated for All Movement Classes of All Heavy Vehicle Model Designation.
Movement Performance - PedestriansAverage Back of QueueMov
ID DescriptionDemand
Flow Average
Delay Level ofService
Prop. Queued
Effective Stop RatePedestrian Distance
ped/h sec ped m per ped
P1 South Full Crossing 53 69.3 LOS F 0.2 0.2 0.96 0.96
P2 East Full Crossing 53 42.7 LOS E 0.2 0.2 0.75 0.75
P3 North Full Crossing 53 69.3 LOS F 0.2 0.2 0.96 0.96
P4 West Full Crossing 53 40.4 LOS E 0.2 0.2 0.73 0.73
P4S West Slip/Bypass Lane Crossing 53 0.4 LOS A 0.0 0.0 0.11 0.11
All Pedestrians 263 44.4 LOS E 0.70 0.70
Level of Service (LOS) Method: SIDRA Pedestrian LOS Method (Based on Average Delay)Pedestrian movement LOS values are based on average delay per pedestrian movement.Intersection LOS value for Pedestrians is based on average delay for all pedestrian movements.
Processed: Wednesday, 17 December 2014 2:17:55 PMSIDRA INTERSECTION 6.0.22.4722
Copyright © 2000-2014 Akcelik and Associates Pty Ltdwww.sidrasolutions.com
Project: C:\Users\David.Yu\Desktop\David Yu\Projects\Kembla Grange Wollongong Recycling\West Dapto & Princes Hwy - Signalised - Wollongong Recycling.sip68000955, CARDNO, NETWORK / Enterprise
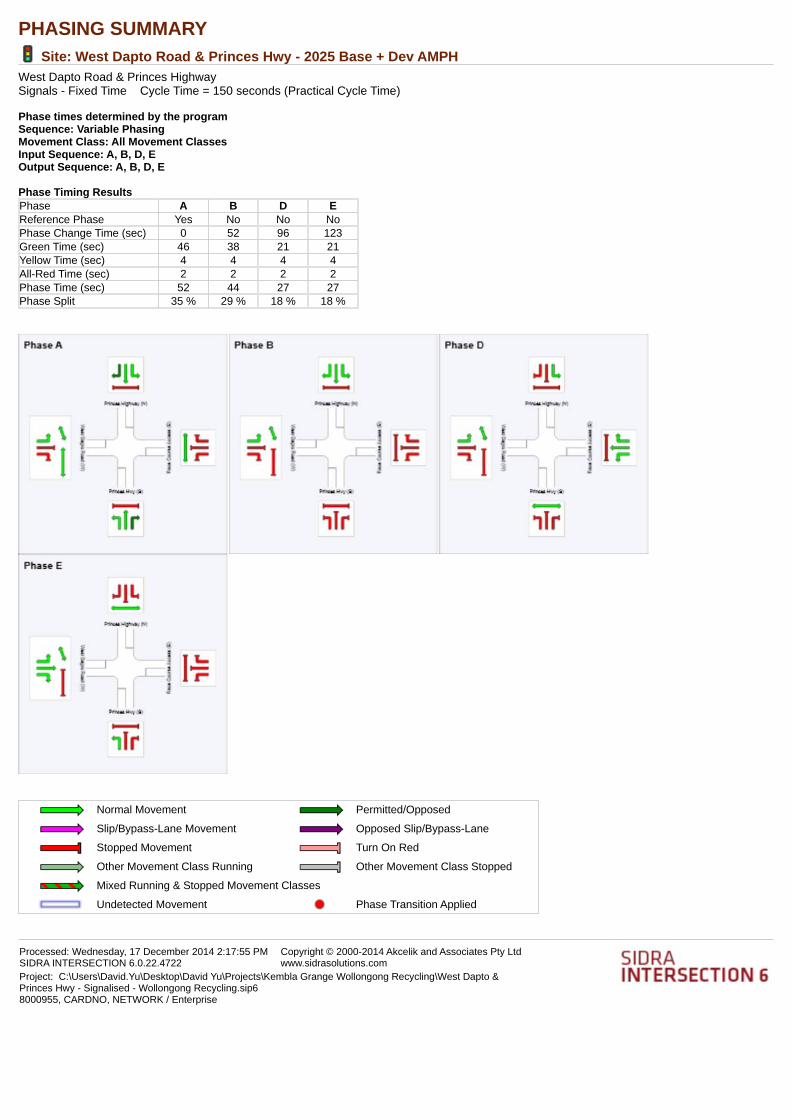
PHASING SUMMARYSite: West Dapto Road & Princes Hwy - 2025 Base + Dev AMPH
West Dapto Road & Princes Highway Signals - Fixed Time Cycle Time = 150 seconds (Practical Cycle Time)
Phase times determined by the programSequence: Variable PhasingMovement Class: All Movement ClassesInput Sequence: A, B, D, EOutput Sequence: A, B, D, E
Phase Timing ResultsPhase A B D EReference Phase Yes No No NoPhase Change Time (sec) 0 52 96 123Green Time (sec) 46 38 21 21Yellow Time (sec) 4 4 4 4All-Red Time (sec) 2 2 2 2Phase Time (sec) 52 44 27 27Phase Split 35 % 29 % 18 % 18 %
Normal Movement Permitted/Opposed
Slip/Bypass-Lane Movement Opposed Slip/Bypass-Lane
Stopped Movement Turn On Red
Other Movement Class Running Other Movement Class Stopped
Mixed Running & Stopped Movement Classes
Undetected Movement Phase Transition Applied
Processed: Wednesday, 17 December 2014 2:17:55 PMSIDRA INTERSECTION 6.0.22.4722
Copyright © 2000-2014 Akcelik and Associates Pty Ltdwww.sidrasolutions.com
Project: C:\Users\David.Yu\Desktop\David Yu\Projects\Kembla Grange Wollongong Recycling\West Dapto & Princes Hwy - Signalised - Wollongong Recycling.sip68000955, CARDNO, NETWORK / Enterprise

MOVEMENT SUMMARYSite: West Dapto Road & Princes Hwy - 2025 Base + Dev PMPH
West Dapto Road & Princes Highway Signals - Fixed Time Cycle Time = 150 seconds (Practical Cycle Time)
Movement Performance - VehiclesDemand Flows 95% Back of QueueMov
ID ODMov
Deg.Satn
AverageDelay
Level ofService
Prop. Queued
Effective Stop Rate
AverageSpeed Total HV Vehicles Distance
veh/h % v/c sec veh m per veh km/hSouth: Princes Hwy (S)
1 L2 58 40.0 0.086 30.5 LOS C 2.3 21.4 0.58 0.72 40.4
2 T1 455 6.6 0.927 75.0 LOS F 38.0 281.2 1.00 1.05 30.2
3 R2 37 3.0 0.247 64.3 LOS E 2.4 17.0 0.89 0.76 30.6
Approach 549 9.9 0.927 69.6 LOS E 38.0 281.2 0.95 1.00 31.1
East: Race Course Access (E)
4 L2 21 3.0 0.096 68.4 LOS E 1.4 9.9 0.92 0.71 29.0
5 T1 5 3.0 0.164 64.7 LOS E 2.7 19.5 0.91 0.74 30.7
6 R2 37 3.0 0.164 66.3 LOS E 2.7 19.5 0.91 0.74 29.7
Approach 63 3.0 0.164 66.9 LOS E 2.7 19.5 0.91 0.73 29.6
North: Princes Highway (N)
7 L2 53 3.0 0.356 22.5 LOS B 14.3 104.9 0.54 0.52 51.1
8 T1 749 5.6 0.356 15.5 LOS B 14.4 105.7 0.54 0.50 59.2
9 R2 491 19.8 0.923 83.3 LOS F 35.8 293.3 1.00 1.13 26.5
Approach 1293 10.9 0.923 41.6 LOS C 35.8 293.3 0.71 0.74 40.2
West: West Dapto Road (W)
10 L2 477 14.0 0.343 8.6 LOS A 3.0 26.4 0.19 0.65 60.8
11 T1 26 3.0 0.572 68.0 LOS E 8.5 81.0 0.98 0.81 29.3
12 R2 96 26.0 0.572 73.4 LOS F 8.5 81.0 0.98 0.81 28.4
Approach 599 15.4 0.572 21.6 LOS B 8.5 81.0 0.35 0.68 49.6
All Vehicles 2504 11.6 0.927 43.6 LOS D 38.0 293.3 0.68 0.78 39.1
Level of Service (LOS) Method: Delay (RTA NSW). Vehicle movement LOS values are based on average delay per movementIntersection and Approach LOS values are based on average delay for all vehicle movements.SIDRA Standard Delay Model is used. Control Delay includes Geometric Delay.Gap-Acceptance Capacity: SIDRA Standard (Akçelik M3D).HV (%) values are calculated for All Movement Classes of All Heavy Vehicle Model Designation.
Movement Performance - PedestriansAverage Back of QueueMov
ID DescriptionDemand
Flow Average
Delay Level ofService
Prop. Queued
Effective Stop RatePedestrian Distance
ped/h sec ped m per ped
P1 South Full Crossing 53 69.3 LOS F 0.2 0.2 0.96 0.96
P2 East Full Crossing 53 45.0 LOS E 0.2 0.2 0.78 0.78
P3 North Full Crossing 53 69.3 LOS F 0.2 0.2 0.96 0.96
P4 West Full Crossing 53 42.7 LOS E 0.2 0.2 0.75 0.75
P4S West Slip/Bypass Lane Crossing 53 0.4 LOS A 0.0 0.0 0.11 0.11
All Pedestrians 263 45.3 LOS E 0.71 0.71
Level of Service (LOS) Method: SIDRA Pedestrian LOS Method (Based on Average Delay)Pedestrian movement LOS values are based on average delay per pedestrian movement.Intersection LOS value for Pedestrians is based on average delay for all pedestrian movements.
Processed: Wednesday, 17 December 2014 2:17:57 PMSIDRA INTERSECTION 6.0.22.4722
Copyright © 2000-2014 Akcelik and Associates Pty Ltdwww.sidrasolutions.com
Project: C:\Users\David.Yu\Desktop\David Yu\Projects\Kembla Grange Wollongong Recycling\West Dapto & Princes Hwy - Signalised - Wollongong Recycling.sip68000955, CARDNO, NETWORK / Enterprise

PHASING SUMMARYSite: West Dapto Road & Princes Hwy - 2025 Base + Dev PMPH
West Dapto Road & Princes Highway Signals - Fixed Time Cycle Time = 150 seconds (Practical Cycle Time)
Phase times determined by the programSequence: Variable PhasingMovement Class: All Movement ClassesInput Sequence: A, B, D, EOutput Sequence: A, B, D, E
Phase Timing ResultsPhase A B D EReference Phase Yes No No NoPhase Change Time (sec) 0 49 96 123Green Time (sec) 43 41 21 21Yellow Time (sec) 4 4 4 4All-Red Time (sec) 2 2 2 2Phase Time (sec) 49 47 27 27Phase Split 33 % 31 % 18 % 18 %
Normal Movement Permitted/Opposed
Slip/Bypass-Lane Movement Opposed Slip/Bypass-Lane
Stopped Movement Turn On Red
Other Movement Class Running Other Movement Class Stopped
Mixed Running & Stopped Movement Classes
Undetected Movement Phase Transition Applied
Processed: Wednesday, 17 December 2014 2:17:57 PMSIDRA INTERSECTION 6.0.22.4722
Copyright © 2000-2014 Akcelik and Associates Pty Ltdwww.sidrasolutions.com
Project: C:\Users\David.Yu\Desktop\David Yu\Projects\Kembla Grange Wollongong Recycling\West Dapto & Princes Hwy - Signalised - Wollongong Recycling.sip68000955, CARDNO, NETWORK / Enterprise