T0 3 1991 - inis.iaea.org
15
? PNL- SA- -I 946 9 DR92 000147 p '/ ,f l-, _,. w...L._ _.r ?, OCT 0 3 1991 SOIL WASHING RESULTS FOR MIXED WASTE POND SOILS AT HANFORD Q _,. M. A. Gerber ._ • September 1991 P= 6_, ='_-_E _-P- :: -. Presented at the ___--__ Environmental RemediationConference _ _-.- ,-,,- _ September 8-ii 1991 ,. _ __ . _ Washington =_ - _ .=: _ Pasco, _ _ -_-_=_-_,_,_- -_.=-_ -_ Work supported by ._._ .=.___= _ the U S Department of Energy . . . ==_,- under Contract DE-ACO6-76RLO 1830 • _.6_E__ -__ _._ . ==.= = .= Pacific Northwest lahora_or- _-_ _ _._:.._ o Richland Washington 99352 DIS'TRIBLI'T_ON OF THiS OOCUKAENT I$ UNUM! I _U
Transcript of T0 3 1991 - inis.iaea.org
?
PNL- SA- -I 946 9
DR92 000147
p '/
,f l-, _,. w...L.__.r ?,
OCT0 3 1991SOIL WASHING RESULTS FOR MIXED WASTEPONDSOILS AT HANFORD
Q _,.
M. A. Gerber
._ • September 1991
P= 6_,
='_ -_E _-P-: : -. Presented at the_ _ _-- _ _ Environmental Remediation Conference
_ _-.- ,-,,- _ September 8-ii 1991,. _ _ _ . _ Washington= _ - _ .=: _ Pasco,
_ _ -_-_=_-_,_,_--_.=-_-_ Work supported by._._ .=.___= _ the U S Department of Energy
. . . = = _ ,- under Contract DE-ACO6-76RLO 1830• _.6_E__
-__ _._ . ==.= = .= Pacific Northwest lahora_or-_-_ _ _._:.._ o Richland Washington 99352
DIS'TRIBLI'T_ON OF THiS OOCUKAENT I$ UNUM! I _U
v
t
SOIL WASHINGRESULTSFORMIXED WASTEPONDSOILS AT HANFORD
ABSTRACT
Soil washing technology was assessed as a means for remediating soilcontaminated with mixed wastes primarily composed of heavy metals and radionu-clides. The soils at the U. S. Department of Energy's Hanford Site are con-sidered suitable for soil washing because of their relatively low quantitiesof silt and clay. However, in a limited number of soil washing experimentsusing soils from di#ferent locations in the north pond of the 300 Area, thedegree of decontamination achieved for the coarse fraction of the soil variedconsiderably. Part of this variation appears to be due to the presence of adiscrete layer of contaminated sediment found in some of the samples.
INTRODUCTION
Soil washing is being considered for remediating soils located at theU.S. Department of Energy's (DOE's) Hanford Site. The Hanford Site encom-passes 560 square miles of semiarid desert in South Central Washington andlies in a structural and topographic basin of eastern Washington within theColumbia Plateau. The site is bordered to the north and east by the ColumbiaRiver and is adjacent to the northern boundary of the city of Richland,Washington. Located on this site are a number of government facilities whichwere operated to produce plutonium for the Department of Defense and conductnuclear research for the DOE. As a result of these operations, over 1000inactive waste disposal and unplanned release sites were generated ranging insize from minor spills to burial grounds of I00 acres. The soils at thesesites are primarily contaminated with both heavy metals and radionuclides. Insupport of cleanup efforts at Hanford, the effectiveness of soil washing intreating contaminated soils was assessed. A limited number of soil washingtests were conducted using soils obtained from a waste disposal pond locatedin the 300 Area of the Hanford Site.
SOIL WASHINGPRINCIPLES
Successful soil washing largely depends on matching the type of contami-nation and soil characteristics with specific operations that can perform wellunder those conditions. In general, there are three main types of soil con-tamination: contaminants dissolved in the water in the soil, contaminantschemically fixed as solid compounds, and contaminants adsorbed onto the sur-faces of the various solids in the soil. The majority of the near-surfacecontamination in the north pond is expected to be in the form of sedimentscomprised of precipitates disposed with the wastes and chemically fixed solidsresulting from interactions between dissolved solids in the waste and certainminerals present in the soil. Principal soil minerals of concern are carbon-ates, sul%_ges, phosphates,and hydrous metal oxides containingmanganese oraluminum.
Soil washing as it is currently practiced for chemically fixed heavymetals and radionuclides is accomplished primarily through attrition scrubbingand separation of soil fractions by size. In some instances, surfactants areadded to facilitate separation of fine and coarse particles by neutralizingthe charge associated with the particles• The soil is separated into twofractions. The coarse fraction of the soil has a much lower surface area perunit weight and a corresponding lower amount of contamination than a compar-able mass of very fine particles. Ideally this fraction of the soil can bereturned to the site. The fine soil fraction is composed of very fine sand,silt, and clay and has a much larger surface area for chemically fixing dis-solved solids and precipitates, lt also includes discrete particles of pre-cipitate. After washing, this fraction of the soil, which is usually in theform of a sludge, is contaminated and requires further treatment or off-sitedisposal. As a general rule, soil containing less than 25% silt and clay canbe washed economically.
In actual practice, the contaminants do not always partition suffi-ciently to the fine fraction of the soil. This is particularly true forradionuclides whose maximum allowable levels are very low. Some of the con-taminants become solubilized or dispersed in the water phase and must even-tually be removed. Also, depending on the method of separation, both thefine and coarse fractions contain a small portion of the other soil fraction.In addition, some of the contaminants remain on the coarse particles. Ineither case, residual contamination may preclude returning the coarse fractionto the site without further treatment, and it may be necessary to solubilizethe contaminants by adjusting the pH or by using chelating or complexingagents.
SITE DESCRIPTION
The surface soil at Hanford is characterized by a layer of light brown,fine, slightly silty, wind-deposited sand typically varying from less than0.3 m to over 4.5 m in depth. Surface soil samples from two separate loca-tions ne_the 300 Area contained 69% to 97% sand, I% to 26% silt, and I% to5% clay.
Underlying the surface soil are poorly sorted, unconsolidated glacio-fluvial sediments informally referred to as the Pasco gravels of the HanfordFormation. These sediments were deposited during catastrophic flooding epi-
sodes associatedhW_1_b__) failures of the Lake Missoula ice dam during the latePleistocen .epoc . The last major flood occurred approximately 13 thousandyears ago. k_) The Pasco gravels of the Hanford Fori_;ation consist of a varia-ble mixture of boulders, cobbles, gravel, sand, and silt; however, most of the
sediments can be classified as a silty sandy gravel consisting of 50% gravel40% sand, and 10% silt. The uppermost aquifer beneath Hanford consists ofan unconfined syste_anging in depth from less than 0.3 m near the ColumbiaRiver to over 90 m._j
The bench-scale treatability tests reported in this paper were conductedusing soil samples from the north process pond in the 300 Area located in the
southeast corner of the Hanford site approximately 5 km north of Richland andapproximately 90 m west of the Columbia River. In the vicinity of the pond,the s;'rface soils are t,_.in and the Pasco gravels are about 15 to 18 m thick.
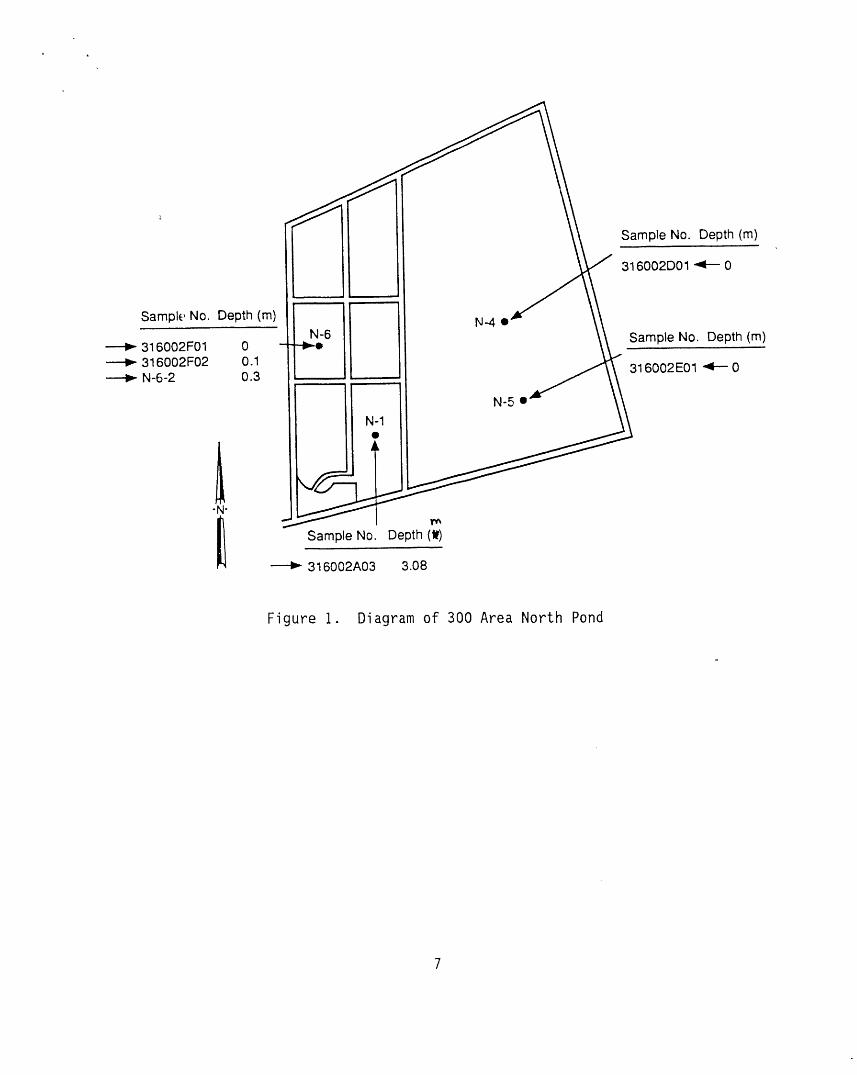
l he north pond area consists of six small settling basins and one largeinfiltration basin, as shown in Fig. I, separated by 3.7-m-wide dikes. Theentire i0 acre area is surrounded by a dike 4.5 m wide and approximately 3 mhigh.
From 1949 to 1974 the pond was one of two unlined surface impoundmentsthat received low-level radionuclide liquid wastes and cool ing water fromfacilities located in the 300 Area. The pond was dredged periodically toincrease infiltration rate. Since closure, several of the dikes betweenbasins were removed and uncontaminated material from the dikes was placed onthe bottom of the basins. The pond has since dried out.
The estimated inventory of nonradiological chemicals _gwn to be dis-posed in the pond is listed in Table I. Previous analyses _'j of soil samplestaken from the site indicate low levels of both the sodium and nitrate ions,suggesting that they were fairly mobile species.
RESULTSOF BENCH-SCALESOIL WASHINGTESTS AT HANFORD
Bench-Scale Experimental System and Procedures
Fig. 2 shows a procedure flow diagram for the bench-scale soil washingsystem. Soil samples ranging in size from about 100 g up to 500 g were usedin each experiment• A portion of each sample was retained for comparison withthe cleaned soil fractions. The soil samples were dried, weighed, and mixedwith water in a 3.8-L polystyrene bottle. The water-to-soil weight ratioranged from 1:1 to I0:I. The bottle was then placed on a reciprocating shakerfor a period ranging from 30 min to 1 h and shaken at a stroke length andfrequency of 4.57 cm and 4 Hz, respectively.
The soil-water slurry was then poured into the top of a Gilson Wet-VacModel WV-3. The Wet-Vac contains three screens and filter paper to collectthe various soil fractions. After the wash solution was separated, rinsewater was added to the Wet-Vac and recirculated. The solids retained on eachscreen were collected, dried, weighed, and submitted for analysis. The washwater and the recycle water were also submitted for analysis. Analysis of theoriginal sample and each washed fraction was performed using U.S. EPA SW846methods•
Samples Tested
The sample numbers shown in Fig. i correspond to the samples used in thetests. Soil samples taken from the ponds show that the soil is quite sandywith a lot of gravel and boulders. The particle size distribution for some ofthe samples is given in Table II. Rocks and gravel that could not pass a1.27-cm screen were not included in the samples.

Experimental Results
Nine soil washing tests were performed to gait experience with the soilwashing apparatus and to explore some of the parameters known to be importantto the process.
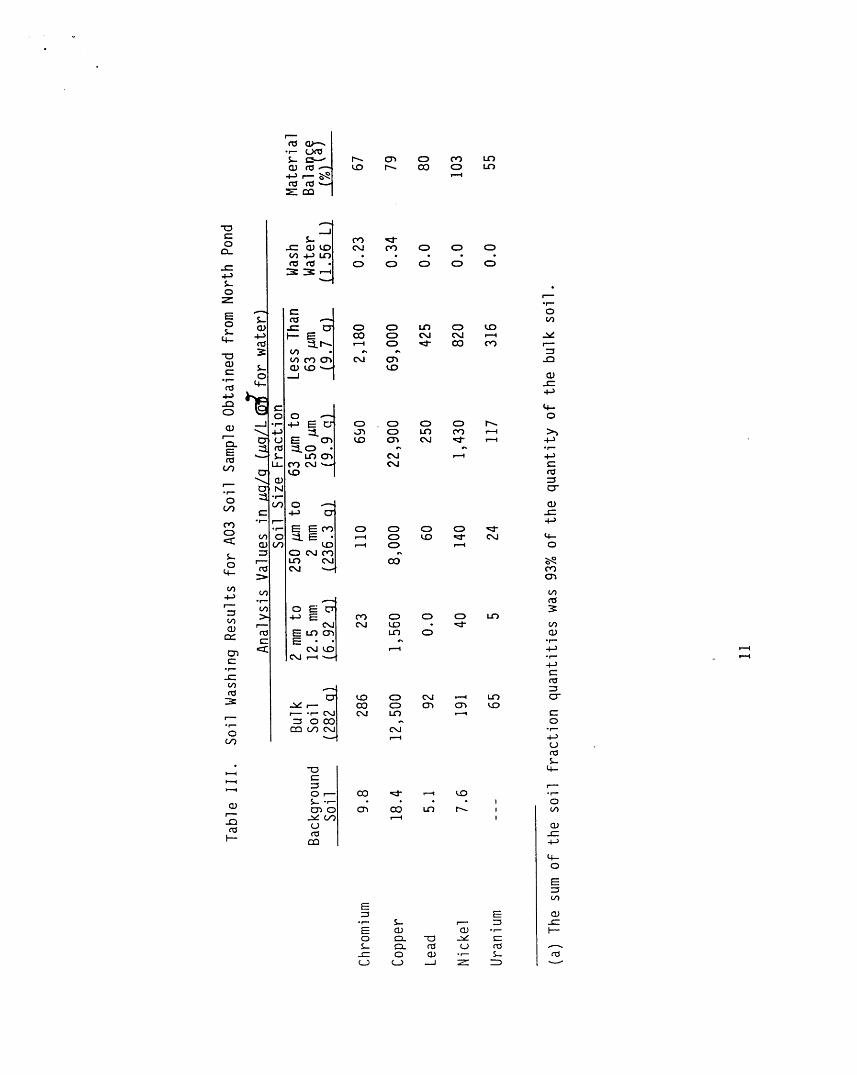
Table III shuws the concentrations of a number of constituents in thewhole Soil before washing and in the different fractions following soil wash-ing for a soil sample obtained from location AO3. This test used a washwater/soil ratio of 5:1 and a total washing time of I h. Also shown inTable III for comparison are the average concentrations of these elements for
soil samples obtained at depths ranging from 0 to 3.3 m from a location _ the300 Area which is believed to be representative of uncontaminated soi..(-- ltcan be seen from the data that there is a definite partitioning of the majorcontaminants to the smaller fractions. In addition, very little of the con-tamination partitioned to the wash water.
Both the elemental and overall material balances between the total soiland the sum of individual fractions and wash water recovered are shown inTable III. These balances are expressed as a percent of the soil samplevalues before washing. The amount of material accounted for in the balance isnot very good for several of the elements. This trend was observed for all ofthe tests performed. The poor elemental balances can be attributed only par-tially to loss of material. The remaining discrepancies are attributed toanalytical error including the method of selecting samples for analysis andthe variability introduced by analyzing small (l-g) quantities of material.This is particularly important where single grains of soil account for asignificant portion of the sample analyzed and individual grains of contami-nants can account for a significant portion of the concentrations measured.
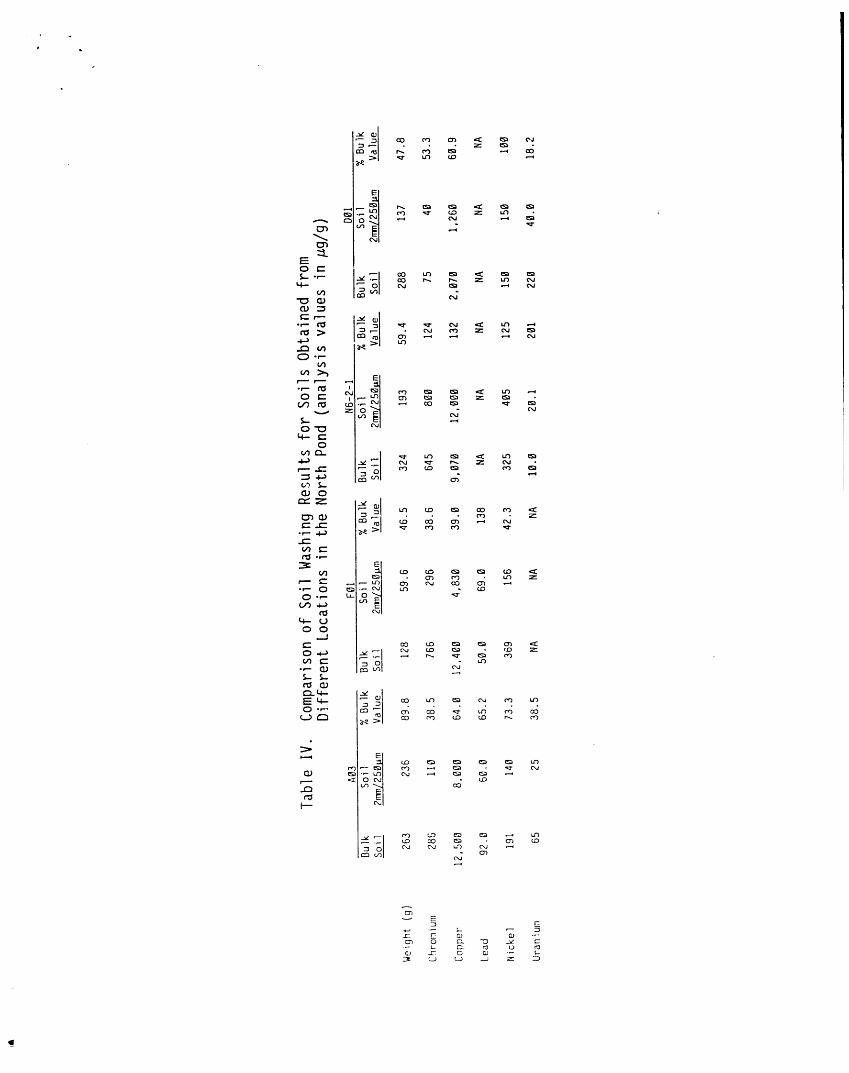
Table IV shows the degree to which contaminants were partitioned to the-2 mm/+250 vm fraction for four soil washing tests performed using a water/soil ratio of 5:1 and 30 min of washing. There is considerable variation inthe partitioning of individual contaminants for soil samples obtained fromdifferent locations. These results are significant because this fractionalone represents anywhere from approximately 50% to as much as 90% of the-soilpassing a 1.27-cm screen. Technical feasibility of soil washing will dependon adequate cleaning of this fraction.
The results obtained for tests using a soil sample collected from theN-6-2 location in the pond are particularly noteworthy. This sample wascollected at a point close to where other samples were collected. However,inspection of the sample as it was washed and observations during collection
at the site indicated that it contained a substantial quantity _ a relativelyhard, light green sediment. Earlier analysis of this sediment ( showed thatthe green material in the sediment consisted mostly of copper. Preliminaryanalysis also indicated gross alpha levels about four times higher in theblue-green sediment than in the whole soil. Soil washing tests showed thatthe sediment was not readily attrited during washing. The poor partitioningresults for this fraction suggest that a significant portion of the

contamination is associated with the blue-green sediment and that simplewashing does not partition the sediments to the smaller size fractions.
Three additional tests were performed with soil samples obtained fromthe N-6-2 site. Two tests were performed with HCI and H_SO_, respectively,added to the wash water to obtain an initialpH of 2. lh b_th cases the acidcaused foamingduring washing and the final pH was increasedto about 5.5,which is the same value obtained for all previous tests. In both casespartitioningimproved only marginally for the -2 mm/+250vm fraction. For
example, HCL and H2SO_ achieved residual copper concentrationsin the -2mm/+250vm fraction tRat were 109% and 69%, respectively,of the bulk soilconcentrations. The third test was performed using a ball mill roller insteadof the shaker in order to impart a tumbling action to the soil. Even thoughthere was no obvious increase in the amount of fines due to attrition,theresults did indicate that the -2 mm/+250 vm fractionwas decontaminatedmoderately. For example, the residual concentrationof copper was about 48%of that in the bulk soil.
CONCLUSIONS
Based on the limited number of experimentsconductedto date, it is notpossible to draw any firm conclusionsregardingthe feasibilityof using soilwashing to remediate contaminatedsoils at the Hanford Site. However, thefollowing conclusionscan be made about the character of the contaminatedsoilin the north pond of the 300 Area and its behavior during soil washing"
• The soil in the 300 Area ponds is, as expected, primarily sand.Typically 80 to 90% of the soil has a particle size greater than 250 vm.
• The primary hazardous contaminantpresent is copper, and the primaryradionuclidepresent is uranium.
° Initially, the contamination is distributed throughout the range ofparticle sizes, but after w_shing, the contamination is partitionedpreferentially to the fine fraction (<250 _m) of the soil.
° After washing, the coarse fraction still contains significant levels ofcontamination, which appears in the form of discrete particles and as acoating on the sand particles. The amount of decontamination achievedfor this fraction also varies significantly between soils from differentlocations in the pond.
° Very little of the contamination is water soluble, indicating that highwater recycle ratios can be used.
° Additional unit operations, such as attritionscrubbing,will be neces-sary to further reduce the contaminationfor the coarse fraction.
While some test results are encouraging,additional tests will be needed tofully assess the applicabilityof the technology and to resolve some of theissues identified in these preliminarytests.
REFERENCES
I. W. D. ELLIS, and T. FOGG, "Interim Report Treatment of SoilsContaminated With Heavy Metals," Science Applications InternationalCorp. (1985).
2. M. L. ROCKHOLD,M. J. FAYER, and G. W. GEE, "Characterization ofUnsaturated Hydraulic Conductivity at the Hanford Site," PNL-6488,Pacific Northwest Laboratory (1988).
3. V. R. BAKER, Editor, "Catastrophic Floodi_g, The Origin of the ChanneledScabland," Benchmark Papers in Geology, Vol. 55, Dowden, Hutchinson &Ross., Inc. (1981).
4. D. R. MULLINEAUX, R. E. WILCOX, W. F. EBAUGH,R. FRYXELL, and M. RUBIN,"Age of the Last Major Scabland Flood of Eastern Washington, as Inferredfrom associated Ash Beds of Mount St. Helens Set S," Geologic Society ofAmerica Abstracts with Programs, Vol. 5., No. 7, p. 1105 (1977).
5. DOE-RL, "Final Status Post-Closure Permit Application: 183-H SolarEvaporation Basins," DOE/RL 88-09, U.S. Department of Energy, RichlandField Office (1988).
6. R. D. Stenner, D. A. LAMAR,K. H. CRAMER,T. J. McLAUGHLIN, K. A.HIGLEY, D. R. SHERWOOD,S. J. JETTE, and N. C. VANHOUTEN, "HazardRanking System Evaluation of CERCLAInactive Waste Sites at Hanford,"PNL-6456 Vol. I., Pacific Northwest Laboratory (1988).
7. D. I. DENNISON, D. R. SHERWOOD,and J. S. YOUNG,"Status Report onRemedial Investigation of the 300 Area Process Ponds," PNL-6442, PacificNorthwest Laboratory (1989).
I
Sample No. Depth (m)
316002D01 _ 0
Sample No. Depth (m) N-4 •N-6 Sample No. Depth (m)
316002F01 0 r-I_-o
316002F02 0.1 316002E01 "4--- 0N-6-2 0.3
N-5 •
I 1-N"
Sample No. Depth (1_)
316002A03 3.08
Figure I. Diagram of 300 Area North Pond

#9 #9Screen "_
_ Screen _ _, # \ / @- #60 #60 - #60 I Scale Sample
Screen _ _ -Screen Screen _ \ /Z"-I_ [_Scale ....... _r
- r , Scale Sample
#250 #250 ._ #250 ._ #250 _._\ 7.[Screen "II"Screen Screen - _Screen _ _ L.._.J
i- I | Scale SampleShaker L_ J
U
Pressure Pressure
//_ Filter ;_ Filter _
Scale Sample
Sample Sample
Figure 2. Schematic of Bench-Scale Soil Washing System

Table I. Estimated Nonradiological Chemical Waste Inventoryfor the North Process Pond
Chemical Quantity (kq)
Beryllium 30
Cadmium 60|
Chromium 3,000
Copper 50,000
Fluoride 5,000
Lead 2,000
Mercury 40
Nickel 8,000
Nitrate 800,000
Nitrite 700,000
Nitric Acid 900,000
Silver 900
Sodium 1,000,000
Sodium Aluminate 2,000,000
Sodium Hydroxide 800,000
Sodium Silicate 90,000
Trichloroethylene I00,000
Uranium 30,000
Zinc 3,000
Total volume of Liquids Disposed:
10,000,000,000 L
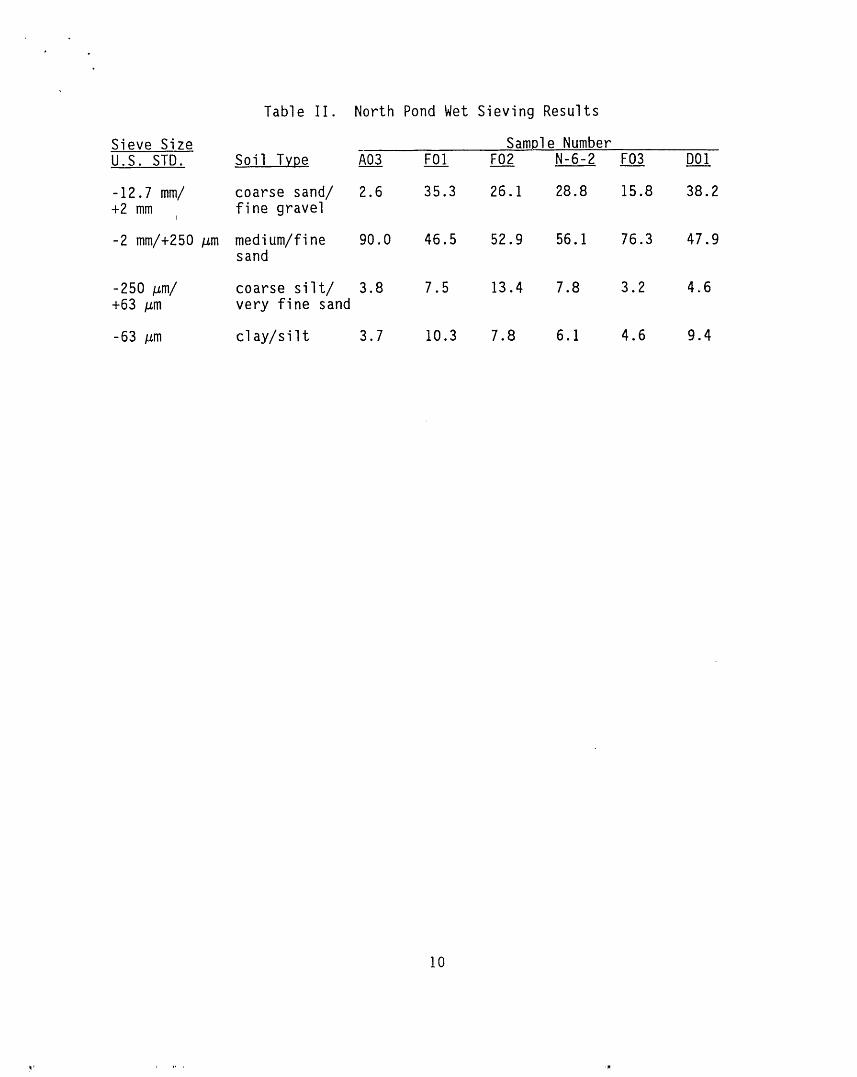
Table II. North Pond Wet Sieving Results
Sieve Size Sample NumberU.S. STD. Soil Type AO3 F01 F02 N-6-2 F03 DO___!
-12.7 mm/ coarse sand/ 2.6 35.3 26.1 28.8 15.8 38.2+2 mm fine gravel
I
-2 mm/+250 /_m medium/fine 90.0 46.5 52.9 56.1 76.3 47.9sand
-250 /_m/ coarse silt/ 3.8 7.5 13.4 7.8 3.2 4_6+63 /_m very fine sand
-63 /_m clay/silt 3.7 10.3 7.8 6.1 4.6 9.4
i0
°_-
aJI
• • z_r Lt") _
EE

IIB ,I'DOpIle Te or/