T ra u m a tic B ra in In ju ry In th e U n ite d S ta te s
28
Traum atic B rain Injury In the U nited States A R e p o rt to C o n g re s s CDC
Transcript of T ra u m a tic B ra in In ju ry In th e U n ite d S ta te s

T r a u m a t i c B r a i n I n j u r y
I n t h e U n i t e d S t a t e s
A R e p o r t t o C o n g r e s s
C D C

T ra u m a t ic B r a in In ju r y
in th e U n ite d S tates:
A R e p o r t t o C o n g r e s s
Prepared by
Division o f Acute Care, Rehabilitation Research, and Disability PreventionNational Center for Injury Prevention and Control
Centers for Disease Control and Prevention U.S. Department o f Health and Human Services
December, 1999

Authors and Contributors
National Center for Injury Prevention and Control
David J. Thurman Clinton Alverson Doug Browne Kathleen A. Dunn Janet Guerrero Renee Johnson Valerie Johnson Jean Langlois Diane Pilkey Joseph E. Sniezek Susan Toal, Contractor
State Brain Injury Surveillance Programs
Pam Gosler, Arizona Department o f HealthBarbara Gabella and Richard Hoffman, Colorado Department o f Public Health and EnvironmentGail Whiteneck, Craig Hospital, Denver, ColoradoMark Kinde and Jon Roesler, Minnesota Department o f HealthGarland Land and Mark van Tuinen, Missouri Department o f HealthLoretta Santilli, Kathleen Thobum, and Gerald Feck, New York State Department o f HealthPam Archer, Michael Crutcher, and Sue Mallonee, Oklahoma State Department o f HealthErnest McCutcheon and Anbesaw Selassie, University o f South Carolina School o f MedicineLeroy Frazier, South Carolina Department o f Health

Contents
Executive S u m m a ry ........................................................................................................................................ 1
Introduction ......................................................................................................................................................4Public Health Significance o f Traumatic Brain Injury..............................................................................4What the Traumatic Brain Injury Act o f 1996 Mandates .......................................................................4
CDC’s Traumatic Brain Injury Surveillance Program, 1989-1998 ..............................................5
Current Data on Traumatic Brain Injury M ortality and M o r b id ity ........................................... 7Deaths Nationwide, 1980-1994 ..................................................................................................................... 7Fatal and Nonfatal Injuries in Seven States, 1994 ................................................................................. 10
CDC Estimates o f Traumatic Brain Injury-Related D isa b ility .....................................................15Prevalence ........................................................................................................................................................ 15Incidence ...........................................................................................................................................................16
Public Health G o a ls ......................................................................................................................................16Primary Prevention ........................................................................................................................................ 16Acute Care and Rehabilitation..................................................................................................................... 17Improved Data S y stem s................................................................................................................................. 18
R eferen ces........................................................................................................................................................ 18
Appendix: M ethods Used to Produce Estimates for This R e p o r t ................................................21CDC Case Definition for Traumatic Brain In jury.................................................................................. 21Surveillance Methods Used by States ....................................................................................................... 23Appendix R eferences..................................................................................................................................... 24

E xecu tive S u m m ary
Public Law 104-166, the Traumatic Brain Injury Act o f 1996, authorizes State surveillance systems to obtain information on the number o f people affected by traumatic brain injury (TBI), the causes o f these injuries, and their severity. As required by this Act, the following Federal report summarizes current knowledge about the incidence, causes, severity, associated disabilities, and prevalence o f TBI
I n c id e n c e a n d P r e v a le n c e o f T ra u m a tic B rain Injury in th e U n ited S t a te s
Traumatic brain injury (TBI) is a leading cause o f death and disability among children and young adults in the United States. Each year an estimated 1.5 million Americans sustain a TBI. As a consequence o f these injuries:
• 230,000 people are hospitalized and survive.
• 50,000 people die.
• 80,000 to 90,000 people experience the onset o f long-term disability.
As the cumulative result o f past traumatic brain injuries, an estimated 5.3 million men, women, and children are living with a permanent TBI-related disability in the United States today.
While the risk o f having a TBI is substantial among all age groups, this risk is highest among adolescents, young adults, and persons older than 75 years. The risk o f TBI among males is twice the risk among females. The major causes o f TBI are:
• Motor vehicle crashes— the leading cause o f TBI resulting in hospitalization.
• Violence, especially suicidal behavior and assaults that involve firearms— the leadingcause o f TBI-related death.
• Falls— the leading cause o f TBI among the elderly.
These injuries have both short-term and long-term effects on individuals, their families, and society and their financial cost is enormous. According to one study, the annual economic burden in the United States was approximately $37.8 billion in 1985.
For the estimated 5.3 million Americans who live with a TBI-related disability, the financial cost is only part o f the burden. The long-term impairments and disabilities associated with TBI are grave and the full human cost is incalculable. Yet because these disabilities are not readily apparent to the public— unlike a broken leg, for example— TBI is referred to as the invisible epidemic. These disabilities, arising from cognitive, emotional, sensory, and motor impairments, often permanently alter a person’s vocational aspirations and have profound effects on social and
TBI in the United States: A Report to Congress Page 1

The human face o f TBI is suggested by this example, which describes experiences shared by many others:
family relationships.
In 1988, Dr. J.M.Z.—a 44 year-old marriage and family counselor—was struck by a powerboat while kayaking and knocked unconscious for a short time. In the hospital emergency department he was briefly examined, told that he had suffered a "concussion," and sent home an hour later without other treatment. Despite symptoms including headache, fatigue, and memory loss, he returned to his counseling practice. His clients noticed his memory and concentration problems and he had to close his practice in six months.
His health insurance company raised his premium rates until he could no longer afford coverage His wife divorced him. His applications for Social Security disability income were denied over two years, and for six months he had to live in a van. Finally, he received some Social Security benefits. Years later, he learned about and enrolled in a new college program designed for people with brain injury. He developed ways of partially compensating for his continuing memory and concentration difficulties and re-opened a part-time counseling practice that provides minimal income. Appropriate follow-up from a State TBI registry might have led him to helpful programs earlier.
M e a su r in g T r e n d s in TBI
Rates o f TBI-related death have declined 20 percent since 1980, reflecting some success in efforts to prevent such injuries. The decline in TBI-related hospitalization rates has been much greater— about 50 percent since 1980— during a period when efforts to contain health care costs may have led to changes in hospital admissions practices restricting inpatient care. This much larger decline in hospitalization rates suggests that an increasing proportion o f persons with less severe TBI may now receive only emergency department outpatient care and are sent home instead o f being admitted to hospitals.
If we are to measure the total impact o f TBI, the needs for TBI services, and the true injury reductions due to successful prevention, we must include emergency department-based surveillance with surveillance based on hospitalization admissions. Knowing more about the outcomes o f TBIs— those treated only in emergency departments as well as those treated in hospitals— is critical in order to assure proper treatment and follow-up.
State follow-up registries, built on surveillance systems, provide more information to help States and communities design, implement, and evaluate targeted, cost-effective programs for people living with TBI and their families, including programs that provide vocational rehabilitation and school and community support. These registries can gather the information needed to:
TBI in the United States: A Report to Congress Page 2

• Identify the types and frequency o f disabilities associated with TBI.
• Assess the need for public health services (e.g., treatment for alcohol abuse or depression) and social services (e.g., job training or marital counseling) for persons with TBI.
• Explain the relationship between the initial severity o f the injury and its long-term outcome, to better identify persons needing ongoing medical, rehabilitation, and other services.
To implement more effective programs to prevent these injuries, we must have reliable data on their causes and risk factors. State surveillance systems can provide such data, identify trends in TBI incidence, enable the development o f cause-specific prevention strategies focused on populations at greatest risk, and monitor the effectiveness o f such programs.
TBI in the United States: A Report to Congress Page 3

In troduc tion
P u b lic H ea lth S ig n if ic a n c e o f T rau m atic B rain Injury
Traumatic brain injury is a leading cause o f death and lifelong disability among children and young adults in the United States. The Centers for Disease Control and Prevention (CDC) has estimated that each year, approximately 1.5 million Americans survive a traumatic brain injury,1 among whom approximately 230,000 are hospitalized.2 Approximately 50,000 Americans die each year following traumatic brain injury, representing one third o f all injury-related deaths.3 Adolescents, young adults, and the elderly are at highest risk o f these injuries; the most common causes are attributed to motor vehicle crashes, falls, and violence.4
One study estimated that the annual economic burden o f TBI in the United States was approximately $37.8 billion in 1985.5 This estimate included $4.5 billion in direct expenditures for hospital care, extended care, and other medical care and services; $20.6 billion in injury- related work loss and disability; and $12.7 billion in lost income from premature death. This study could not account for the intangible costs borne by the families and friends o f individuals who die prematurely from brain injury. For injured persons and their loved ones, the physical and emotional tolls from permanent disability are profound and impossible to quantify.
Thus, traumatic brain injuries have a deep impact on the population and require a response from the public health community to prevent these injuries and reduce consequent disabilities. To achieve this goal, the Division o f Acute Care, Rehabilitation Research, and Disability Prevention in CDC’s National Center for Injury Prevention and Control (NCIPC) has been working since 1989 to develop a traumatic brain injury surveillance system that provides representative data regarding the incidence, risk factors, and causes o f traumatic brain injury in the United States and allows comparisons across jurisdictions. The system supports the development, implementation, and evaluation o f programs for preventing traumatic brain injury. This effort is enabled, in part, by funding under Public Law 104-166, the Traumatic Brain Injury Act o f 1996.
W h at th e T ra u m a tic B rain Injury A c t o f 1 9 9 6 M a n d a te s
Public Law 104-166 charges CDC with implementing projects to reduce the incidence o f traumatic brain injury. Specifically, the legislation mandates that CDC shall:
• Develop a uniform reporting system for traumatic brain injuries.
• Conduct research into the identification o f effective strategies for preventing traumatic brain injury.
• Implement public information and education programs for preventing TBI and for broadening public awareness about the public health consequences o f TBI.
• Provide technical assistance, either directly or through grants and contracts, to public or
TBI in the United States: A Report to Congress Page 4

nonprofit entities for planning, developing, and operating projects to reduce the incidence o f traumatic brain injury.
• Present a report to Congress that describes the incidence and prevalence o f traumatic brain injury.
Funding for all these activities was authorized at S3 million for each o f the fiscal years 1997, 1998, and 1999.
CDC’s T raum atic Brain Injury S u rve illance P rogram , 1989-1998
Ongoing, population-based surveillance systems— and registries to define disability and other outcomes associated with TBI— are essential for planning and evaluating prevention, acute care, and rehabilitation services for people with these injuries. Yet such systems have only recently been established. Before 1990, most TBI data came from either hospital-based clinical case series or epidemiologic studies that were o f limited duration and restricted to particular locales. Despite the limitations o f these data sources, they revealed some useful insights into the epidemiology o f TBI.
During the 1970s and early 1980s, researchers estimated that each year, about 500,000 Americans sustained a brain injury leading to hospitalization or death.6 The reported annual incidence o f TBI in different localities ranged from 132 to 367 injuries per 100,000 population,7-15 with the best estimate o f national incidence at about 200 per 100,000 population.16 Different case definitions for TBI and varied methods o f collecting data made it difficult to compare information from these studies, combine data across studies, and thus estimate the national incidence o f TBI.17 In the case definition, for example, not all studies included skull fractures without other neurologic symptoms, and some excluded immediate deaths that did not involve hospitalization. Most studies focused on limited geographic areas that were not necessarily representative o f the United States as a whole. From these studies it was not possible to evaluate U.S. trends in the occurrence o f TBI-related hospitalizations.
CDC began promoting the development o f a multistate traumatic brain injury surveillance system in 1989 with funding support and technical assistance, after the Federal Interagency Head Injury Task Force Report identified the need for better information on the public health impact o f brain injuries.18 The surveillance system’s function is to characterize the risk factors, incidence, external causes, severity, and outcomes o f traumatic brain injury in the population. Such improved data collection can help achieve two important public health goals:
• Primary prevention. Effective programs should be targeted to address specific causes o f TBI and populations at higher risk.
• Acute care and rehabilitation. Accurate data are needed to improved injured persons’ access to health care and other necessary services.
TBI in the United States: A Report to Congress Page 5
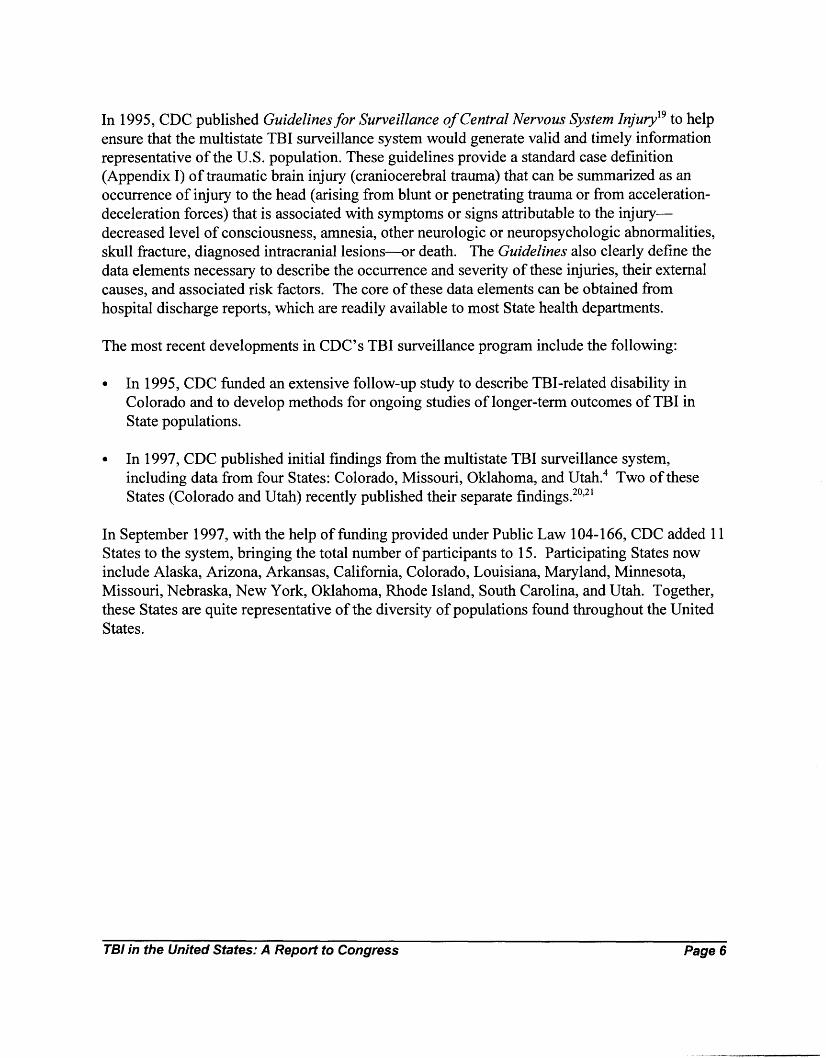
In 1995, CDC published Guidelines for Surveillance o f Central Nervous System Injury19 to help ensure that the multistate TBI surveillance system would generate valid and timely information representative o f the U.S. population. These guidelines provide a standard case definition (Appendix I) o f traumatic brain injury (craniocerebral trauma) that can be summarized as an occurrence o f injury to the head (arising from blunt or penetrating trauma or from acceleration- deceleration forces) that is associated with symptoms or signs attributable to the injury— decreased level o f consciousness, amnesia, other neurologic or neuropsychologic abnormalities, skull fracture, diagnosed intracranial lesions— or death. The Guidelines also clearly define the data elements necessary to describe the occurrence and severity o f these injuries, their external causes, and associated risk factors. The core o f these data elements can be obtained from hospital discharge reports, which are readily available to most State health departments.
The most recent developments in CDC’s TBI surveillance program include the following:
• In 1995, CDC funded an extensive follow-up study to describe TBI-related disability in Colorado and to develop methods for ongoing studies o f longer-term outcomes o f TBI in State populations.
• In 1997, CDC published initial findings from the multistate TBI surveillance system, including data from four States: Colorado, Missouri, Oklahoma, and Utah.4 Two o f these States (Colorado and Utah) recently published their separate findings.20,21
In September 1997, with the help o f funding provided under Public Law 104-166, CDC added 11 States to the system, bringing the total number o f participants to 15. Participating States now include Alaska, Arizona, Arkansas, California, Colorado, Louisiana, Maryland, Minnesota, Missouri, Nebraska, N ew York, Oklahoma, Rhode Island, South Carolina, and Utah. Together, these States are quite representative o f the diversity o f populations found throughout the United States.
TBI in the United States: A Report to Congress Page 6

C u rren t D ata on T raum atic Brain Injury Mortality an d Morbidity
D e a th s N a tio n w id e , 1 9 8 0 -1 9 9 4
Current information on TBI deaths comes from the National Center for Health Statistics for the years 1980-1994.21 In 1994, 51,350 persons died from traumatic brain injury; most o f these deaths were related to firearms, transportation (injuries involving motor vehicle occupants, pedestrians, bicyclists, motorcyclists, and others), or falls.
From 1980 through 1994, the TBI-associated death rate in the United States decreased 20 percent, from 24.7 per 100,000 population to 19.8 per 100,000 population (Figure 1). Most o f the decrease resulted from a 38 percent decline in transportation-related deaths, from 11.1 per100,000 population in 1980 to 6.9 per 100,000 in 1994. Rates o f TBI-associated death due to falls and other causes also decreased during this period. However, firearm-related TBI deaths increased 11 percent during this period, from 7.6 per 100,000 in 1980 to 8.4 per 100,000 in 1994. Because o f this increase, firearms-use surpassed transportation crashes as the leading cause o f death from TBI in 1990.
Figure 1. Traumatic brain injury-related death rates by cause, United States, 1980-1994*
F ire a rm s use has been the le a d in g cause o f dea th f r o m
t ra u m a tic b ra in in ju r y s ince 1990.
* Age-adjusted to 1990 U.S. population
In 1994, death rates among males were 3.3 times higher than among females (30.7 per 100,000 males compared with 9.3 per 100,000 females) (Figure 2). Rates were highest among persons aged 75 years and older (46.3 per 100,000), with a smaller peak among those aged 15-24 years (32.8 per 100,000).
TBI in the United States: A Report to Congress Page 7

Figure 2. Traumatic brain injury-related death ratesby age and gender, United States, 1994
Teens, y o u n g adu lts , a n d p e o p le o v e r 75— e s p e c ia lly m ales— a re f a r m o re lik e ly than o the rs to d ie o f t ra u m a tic b ra in
in ju ry .
Age group
Leading causes o f TBI-associated death among males varied with age in 1994 (Figure 3). Firearm-related injuries were the leading cause o f TBI-associated death among males aged 15-84 years, transportation-related injuries among those under 15 years o f age, and falls among those 85 years o f age and older.
Figure 3. Traumatic brain injury-related death rates by age and cause, U.S. males, 1994*
B ra in in ju r ie s th a t k i l l boys a n d y o u n g m en a re o fte n the re s u lt o f sho o tin g s o r m o to r v e h ic le
Transportation C ra sh es .
Age group
♦Note different scale for Y axis for females
TBI in the United States: A Report to Congress Page 8

For females, the leading causes o f TBI-related deaths also varied with age. Transportation- related injuries were the leading cause o f TBI among females from birth to 74 years o f age, although death rates related to firearms and transportation were almost identical among women aged 30-54 years (Figure 4). As in the older male population, falls were the leading cause o f TBI-associated death among women 75 years o f age and older.
Figure 4. Traumatic brain injury-related death rates by age and cause, U.S. Females, 1994*
Age group
B ra in in ju r ie s th a t k i l l w om en o v e r 85
a re u s u a lly the re s u lt o f fa lls , w hereas b ra in in ju re s th a t c la im the lives o f teenage g ir ls a n d y o u n g w om en m ost o fte n o c c u r in m o to r v e h ic le crashes.
"‘Note different scale for Y axis for males
TBI-associated death rates in 1994 differed by race as well (Figure 5): 25.5 per 100,000 for African Americans; 19.0 per 100,000 for whites; and 15.3 per 100,000 for all other racial groups combined. Among African Americans, firearm-use was the leading cause o f TBI-associated death, with a rate o f 13.6 per 100,000. This rate was more than two times higher than the rate for the next leading cause, transportation. Firearm-related injuries were also the leading cause o f TBI-associated death among whites, with a rate o f 7.9 deaths per 100,000—just slightly higher than the transportation-related rate (7.3 per 100,000). Transportation was the leading cause o f TBI-associated death among all other racial groups (6.1 per 100,000).
TBI in the United States: A Report to Congress Page 9

A fr ic a n A m e ric a n s have a m uch g re a te r r is k o f d y in g f r o m f ir e a r m - re la te d tra u m a tic b ra in in ju r y than do p e o p le o f o th e r
races.
Cause o f injury
■"Age-adjusted to 1990 U.S. population
Figure 5. Traumatic brain injury-related death ratesby cause and race, United States, 1994*
F atal a n d N o n fa ta l In ju ries in S e v e n S t a te s , 1 9 9 4
With financial and technical support from CDC for statewide TBI surveillance systems, seven States (Arizona, Colorado, Minnesota, Missouri, New York [excluding N ew York City], Oklahoma, and South Carolina) compiled data for TBI-related hospitalizations and deaths that occurred in 1994. As a result, these States have been able to provide more complete descriptions o f the incidence, severity, causes, and outcomes o f TBI currently occurring among their residents. During 1994, the seven States had 32,112 reported cases o f TBI collectively; among persons with these injuries, 5,442 (16.9 percent o f all reported TBIs) died without being admitted to a hospital, while 26,670 (83.0 percent) were admitted. Among those who were hospitalized, 1,802 (5.6 percent o f all TBIs) died while receiving acute care. Thus, a total o f 7,244 TBIs (22.6 percent o f all reported TBIs) were fatal.
The annual unadjusted incidence rate o f TBI for all seven States combined was 90.9 per 100,000 population (91.8 per 100,000, age-adjusted to the 1990 U.S. population). The crude rate o f hospitalizations for TBI in the seven States combined was 75.5 per 100,000. The overall TBI- related death rate was 20.7 per 100,000 (Figure 6). In an assessment o f State-specific rates o f TBI, serious nonfatal injuries requiring hospitalization were far more common than injuries resulting in death in all seven States. The median age at the time o f injury was 32 years. The incidence rate o f TBI was highest among persons 75 years o f age and older (191.1 per 100,000) and among persons 15-24 years (145.1 per 100,000) (Figure 7). Most TBIs (21,423 or 66.7 percent) occurred among males, with the rate among males (124.1 per 100,000) being about twice the rate among females (59.1 per 100,000).
TBI in the United States: A Report to Congress Page 10

Figure 6. Traumatic brain injury rates by state - Arizona, Colorado, Minnesota, Missouri, New York, Oklahoma, and South Carolina, 1994
■ All TBI
i Fatal TBI
A Z M O C O O K SC M N N YState
S erious n o n fa ta l t ra u m a tic b ra in in ju r ie s re q u ir in g h o s p ita liz a t io n g re a t ly o u tn u m b e r f a t a l t ra u m a tic b ra in in ju r ie s in seven States.
* Age-adjusted to 1990 U.S. Population **NY data exclude New York City residents
Figure 7. Traumatic brain injury rates by a g e group - Arizona, Colorado, Minnesota, Missouri, New York, Oklahoma, and South Carolina, 1994
ooo
0>a.<oo'
5-14 15-24 25-34 35-44 45-54 Age Group
55-64 65-74 75-Up
Teenagers, y o u n g adu lts , a n d p e o p le o v e r 75 a re f a r m o re lik e ly than o the rs to su s ta in a t ra u m a tic b ra in in ju ry , p r im a r i ly
because o f m o to r ve h ic le crashes a n d v io le n c e a m o n g you ths , a n d f a l ls a m o n g the e ld e rly .
Transportation-related crashes (involving motor vehicles, bicycles, pedestrians, and recreational vehicles) accounted for 49 percent o f all TBIs; falls accounted for an additional 26 percent (Figure 8). Firearm-use accounted for 10 percent o f all TBIs in the seven States, and assaults not
TBI in the United States: A Report to Congress Page 11

involving firearms accounted for 8 percent o f reported injuries. Nearly two-thirds o f firearm- related TBIs (66.5 percent) were classified as suicidal in intent (Figure 9).
Figure 8. Proportions of traumatic brain injury by cau se - Arizona, Colorado, Minnesota, Missouri, New York, Oklahoma, and South Carolina, 1994
M o to r v e h ic le crashes a re by f a r the le a d in g cause o f t ra u m a tic b ra in in ju r y in these seven S tates a n d n a t io n a lly as w e ll. S h oo ting s cause
less th a n 10 p e rc e n t o f a l l t ra u m a tic b ra in injuries, y e t they a re the le a d in g cause o fT B I - re la te d death.
F igu re 9. Proportions o f firearm-related traumatic brain injury by intent - Arizona, Colorado, M innesota, Missouri, N ew York, Oklahom a, and South Carolina, 1994
Legal intervention 0.2%
Unintentional 4 .3 %
Intent unknown 3.3%
The m a jo r ity o f f ir e a rm - re la te d t ra u m a tic b ra in in ju r y re p re se n t su ic ide s o r s u ic id e attem pts, a lth o u g h m o re th a n a fo u r th a re the re s u lt o f assau lts by o thers.
TBI in the United States: A Report to Congress Page 12

The leading causes o f TBI varied by age in the seven States. Falls were by far the leading cause o f TBI among persons aged 75 years and older (at a rate o f 126.6 per 100,000), whereas transportation led the list for persons aged 15-24 years (97.9 per 100,000) (Figure 10). Analysis also revealed that the severity o f injury and the outcome varied depending on the cause. For example, 90.4 percent o f firearm-related TBIs resulted in death, but only 10.2 percent o f fall- related TBI proved fatal (Figure 11).
Figure 10. Traumatic brain injury rates by age group and cause of injury - Arizona, Colorado, Minnesota, Missouri, New York, Oklahoma, and South Carolina, 1994
P e a k in c id e n ce ra te s in y o u th s a re la rg e ly re la te d to m o to r v e h ic le crashes, w hereas p e a k ra te s in the e ld e r ly a re la rg e ly re la te d to fa l ls .
Age Group
TBI in the United States: A Report to Congress Page 13

Figure 11. Traumatic brain injury rates by cause of injury and survival status - Arizona, Colorado, Minnesota, Missouri, New York, Oklahoma, and South Carolina, 1994
50 n
40-
c 30-
oo.(02<00É
20-
8 F atal □ Non-fatal
Transport Falls Firearms Assault Other/Unknown
P e o p le in ju re d in m o to r v e h ic le
crashes, fa l ls , o r assau lts w ith o u t a f i r e a r m have a m uch g re a te r chance o f s u rv iv in g th a n do those in ju re d in a shoo ting .
The consistency o f findings in these seven States, located in different regions o f the United States, suggests that these data may be broadly representative o f the Nation as a whole. The epidemiologic patterns o f TBI described in this report also resemble those from an analysis o f 1994 National Hospital Discharge Survey (NHDS) data, which obtained hospital discharge data from a sample o f 478 participating hospitals located across the United States. The crude TBI- related hospitalization rate estimated in the NHDS was 94 per 100,000 population.2 The combined TBI-related hospitalization rate obtained from Arizona, Colorado, Minnesota, Missouri, N ew York State, Oklahoma, and South Carolina is approximately 20 percent lower than the corresponding rate estimated from the NHDS. Different sampling and other methods that may explain this rate difference have not yet been elucidated.
The rates in this report are substantially lower than rates previously reported in studies conducted from 1974 to 1986 (approximately 200 cases per 100,000 population annually).7'16 In comparison, from 1979 to 1992, the TBI-associated death rate declined 22 percent, largely because o f a decrease in TBI-related deaths associated with motor-vehicle crashes.3 The findings in this report and those from the NHDS suggest a decline o f approximately 50 percent in combined morbidity and death during a corresponding interval, indicating a disproportionately large reduction in rates o f nonfatal TBI resulting in hospitalization. This decrease may reflect successes in injury prevention efforts but may also be the result o f recent changes in hospital admission policies that encourage outpatient care for less severe injuries.
This evident shift away from inpatient care underscores the need for surveillance o f TBI patients treated in emergency departments and other outpatient settings. The National Center for Health Statistics National Health Interview Survey (NHIS) has provided some information on the
TBI in the United States: A Report to Congress Page 14

incidence o f TBI treated on an outpatient basis.1 In 1991, an estimated 1.54 million noninstitutionalized U.S. civilians sustained a brain injury that resulted in loss o f consciousness but was not severe enough to cause death or long-term institutionalization, according to self-reported NHIS data collected with the 1991 Injury Supplement. Of these 1.54 million persons, 25 percent received no medical care for their TBI, 49 percent received care in an emergency department or other outpatient site, 9 percent received overnight hospital care, and 16 percent were admitted to a hospital for two or more days.
CDC E s t im a te s of T raum atic Brain Injury-Related Disability
P r e v a le n c e
The CDC’s National Center for Injury Prevention and Control estimates that 5.3 million U.S. citizens (2 percent o f the population) are living with disability as a result o f a traumatic brain injury. This represents the prevalence o f TBI disability, defined as the proportion o f persons in the population at a given time who have disability resulting from a traumatic brain injury. To estimate the prevalence o f disability from TBI in the United States, CDC developed a model incorporating data on the incidence o f TBI, severity o f injury, and likelihood o f disability given a specific level o f injury severity.22 Data come from several sources:
• CDC estimated the incidence o f TBI by using its case definition and 1970-1995 National Hospital Discharge Survey (NHDS) data, obtained from CDC’s National Center for Health Statistics.1
• CDC estimated the severity o f TBI by using NHDS data, classified according to ICD-9-CM- derived Abbreviated Injury Scale23 (ICD/AIS) scores by means o f a computer algorithm (ICDMAP-90©).24
• Calculating the likelihood o f disability following TBI at each level o f severity required two data sources. For injuries occurring in 1980 or after, CDC obtained preliminary follow-up data from the Colorado TBI Registry and Follow-up System,25,27 which surveyed TBI survivors one year after injury and measured disability by using the Functional Independence Measure.26 For injuries that occurred before 1980, we used historical data reviewed by Kraus.17
The model uses these data to estimate the number o f persons alive in 1996 who had ever had a TBI that required hospitalization and resulted in long-term disability. It incorporates differences in rates across age groups, variations in injury severity, and changing patterns in hospital admissions related to severity. The model does not account for disability among people who visited emergency departments or outpatient clinics with a TBI but were not admitted to the hospital. Because o f this, our estimate o f 5.3 million U.S. citizens living with TBI-related disability may be low. Other restrictions in existing data and methods may also affect the
TBI in the United States: A Report to Congress Page 15

accuracy o f this estimate.23 Given these limitations, some variation in future estimates o f the prevalence o f TBI-related disability is expected.
In c id en ce
According to NHDS data, the annual incidence rate o f TBI hospitalizations has been declining since 1975, when it peaked at 234 per 100,000 population (500,000 cases). During 1990-1995, the mean annual incidence rate for persons hospitalized with TBI and survived was 99 per100.000 population (260,000 cases). Hospitalization incidence patterns mirrored mortality rate patterns — the highest rates were among persons 15-24 years o f age and persons over age 65. Based on preliminary data from the Colorado TBI Registry and Follow-up System,26,27 we can estimate that each year, approximately 35 percent (80,500) o f the 230,000 hospitalized survivors o f TBI experience the onset o f long-term disability. A small but unknown proportion o f the more than 1 million persons with TBI who are not hospitalized may also experience long-term disability. If we assume this proportion is only 1 percent (existing data indicate it is probably greater), an additional 10,000 persons might have long-term disability. Thus, the estimated number o f persons who become disabled each year from TBI is between 80,000 and 90,000.
Public Health Goals
The data in this report clearly demonstrate the importance o f traumatic brain injury as a public health problem. Consequent to these injuries, each year more than 50,000 Americans die, nearly230.000 are hospitalized and survive, and an estimated 80,000 to 90,000 experience the onset o f long-term or lifelong disability. We have much work to do in these areas: primary prevention, acute care and rehabilitation, and improved data systems. This work requires that we better define groups with an increased risk o f injury or adverse outcomes based on population characteristics, e.g., age, sex, and race or ethnicity.
Prim ary P reven tion
Primary prevention o f TBI is an important goal o f public health efforts. Accomplishing this goal requires attention to each o f the major external causes o f these injuries: transportation, violence, and falls.
• Transportation crashes are the leading cause o f TBI-associated death among women andpersons under 15 years o f age. Fortunately, the rate o f TBI-associated death due to transportation crashes has decreased approximately 40 percent since 1980. This drop is likely because o f a combination o f factors: an increase in seat belt and child safety seat use, an increase in the number o f vehicles equipped with air bags, and a decrease in the incidence o f driving while intoxicated. These positive changes should receive continued support. In addition, recent changes in speed limits and in seat belt and helmet use requirements should be evaluated to determine their impact on TBI incidence and death.
TBI in the United States: A Report to Congress Page 16

• Violence is a leading cause o f TBI— especially among males— and violence with firearms is the leading cause o f TBI-associated death. Effective programs designed to decrease the occurrence o f interpersonal and self-directed violence would help address this cause.
• Falls are the third leading cause o f TBI-associated death. Among women over 75 years o f age and men over 85 years o f age, falls are the leading cause o f TBI-associated death. Falls are also a major cause o f nonfatal TBI. Risk factors for falls among older persons may include the use o f sedative, antidepressant, or other psychotropic medications; and impairments o f balance or lower extremity function. Although better data are needed to define the circumstances o f fall injuries among older persons, effective interventions may involve modifying the environment to reduce fall hazards and the impacts o f falls and, where possible, reducing the use o f medications with side effects that increase the risk o f falling.
A cu te C are an d R ehabilitation
An effective public health response to TBI also requires concerted programs to minimize adverse outcomes among persons who do experience injury. We need research activities to improve the acute care and rehabilitation o f persons with TBI, strategies to ensure they have access to appropriate care and services, and interventions to promote their independence and integration into the community for persons living with the effects o f TBI.
Research to date indicates that the disabilities most often associated with TBI include cognitive, emotional, and— to a lesser extent— sensory and motor impairments. A traumatic brain injury may permanently alter a person’s career or vocational aspirations and may also have profound effects on social and family relationships. In part, impairment o f cognitive function may result in the loss o f communication skills and memory, inability to organize tasks and solve problems, and decreased attention to detail. TBI may also cause emotional instability— especially impulsiveness— and changes in the ability to see, smell, and hear.
To help persons living with the effects o f TBI, we need better information on the nature and scope o f these disabilities, including who experiences TBIs, which rehabilitation treatment methods are most effective, and what services are useful and readily available.
In the near future, three important developments may increase our knowledge and promote the development o f secondary and tertiary prevention programs.
• The National Center on Medical Rehabilitation Research o f the National Institutes o f Health convened the “Consensus Development Conference on Rehabilitation o f Persons with Traumatic Brain Injury” in October 1998. During the conference, experts addressed the epidemiology, consequences, mechanisms o f recovery, therapies for cognitive and behavioral impairments, and rehabilitation models for TBI.
• With CDC support, the Colorado Department o f Public Health and Environment, Craig
TBI in the United States: A Report to Congress Page 17

Hospital, and the South Carolina Department o f Disabilities and Special Needs are developing population-based registries o f persons with TBI. Designed as models for other States, these registries will better define the proportion o f persons in entire States with various outcomes associated with TBI, the services to which persons with TBI have been referred, and the services that have actually been delivered.
• Twenty-one States are promoting services for people with TBI via demonstration grants from the Health Resources and Services Administration, funded in 1997 under Public Law 104- 166.
Im proved Data S y s te m s
Finally, more effective, targeted prevention requires better information on the occurrence o f TBI and the circumstances surrounding those injuries (for example, the involvement o f alcohol and other drugs or the use o f personal protective equipment such as helmets). Expanded use o f registries facilitates such data collection while also producing more precise information on the impact o f these injuries. Standard measures for TBI outcomes need to be refined so that they will readily identify those adverse outcomes most amenable to prevention through rehabilitation and social support. A person’s long-term outcome is related to the severity o f the TBI. Better defining the relationship between the initial severity o f an injury and a person’s long-term outcome would help identify those persons who need ongoing medical care, rehabilitation, and other services. Such information also would also help health practitioners and policy makers ensure that these services are available in the community.
TBI in the United States: A Report to Congress Page 18

References
1. Sosin DM, Sniezek JE, Thurman DJ. Incidence o f mild and moderate brain injury in the United States, 1991. Brain Injury 1996;10:47-54.
2. Centers for Disease Control and Prevention, National Center for Injury Prevention and Control. Unpublished analysis o f data from the 1994 National Hospital Discharge Survey, 1998.
3. Sosin DM, Sniezek JE, Waxweiler RJ. Trends in death associated with traumatic brain injury, 1979 through 1992. JAMA 1995;273:1778-80.
4. Centers for Disease Control and Prevention. Traumatic brain injury, Colorado, Missouri, Oklahoma, and U ta h -1 990-1993. MMWR, 1997;46:8-11.
5. Max W, MacKenzie EJ, Rice DP. Head injuries: costs and consequences. J Head trauma Rehabil 1991;6:76-91
6. Kraus JF. Epidemiology o f head injury. In: Cooper PR, editor. Head Injury, 3rd ed. Baltimore: Williams and Wilkins, 1993; 1-25.
7. Annegers JF, Grabow HD, Kurland LT, et al. The incidence, causes and secular trends in head injury in Olmsted County, Minnesota, 1935-1974. Neurology 1980;30:912-9.
8. Klauber MR, Barrett-Connor E, Marshall LF, Bowers SA. The epidemiology o f head injury: a prospective study o f an entire community — San Diego County, California, 1978. Am J Epidemiol 1981;113:500-9.
9. Cooper KD, Tabaddor K, Hauser WA, et al. The epidemiology o f head injury in the Bronx. Neuroepidemiology 1983;2:70-88.
10. Jagger J, Levine JI, Jane JA, Rimel RW. Epidemiologic features o f head injury in a predominantly rural population. J Trauma 1984;24:40-4.
11. Kraus JF, Black MA, Hessol N, et al. The incidence o f acute brain injury and serious impairment in a defined population. Am J Epidemiol 1984; 119:186-201.
12. Whitman S, Coonley-Hoganson R, Desai BT. Comparative head trauma experience in two socioeconomically different Chicago-area communities: a population study. Am J Epidemiol 1984;4:560-80.
13. Fife D, Faich G, Hollinshead W, Wentworth B. Incidence and outcome o f hospital-treated head injury in Rhode Island. Am J Public Health 1986;76:773-8.
14. Fife D. Head injury with and without hospital admission: comparisons o f incidence and short-term disability. Am J Public Health 1987;77:810-12.
TBI in the United States: A Report to Congress Page 19

15. MacKenzie EJ, Edelstein SL, Flynn JP. Hospitalized head-injured patients in Maryland: incidence and severity o f injuries. Maryland Med J 1989;38:725-32.
16. Kalsbeek WD, McLaurin RL, Harris BS, Miller JD. The National Head and Spinal Cord Injury Survey: major findings. J Neurosurg 1980;53:S 19-24.
17. Kraus JF, McArthur DL. Epidemiologic aspects o f brain injury. Neurologic Clinics 1996;14(2):435-50
18. Department o f Health and Human Services. Federal Interagency Head Injury Task Force Report. Washington, D.C.: Department o f Health and Human Services, 1989.
19. Thurman DJ, Sniezek JE, Johnson D, et al. Guidelines for Surveillance o f Central Nervous System Injury. Atlanta: Centers for Disease Control and Prevention, 1995.
20. Gabella B, Hoffman RE, Marine WW, Stallones L. Urban and rural brain injuries in Colorado. Ann Epidemiol 1997;7:207-12.
21. Thurman DJ, Jeppson L, Burnett CL, Beaudoin DE, Rheinberger MM, Sniezek JE. Surveillance o f traumatic brain injuries in Utah. Western J Med 1996;164:192-6.
21. Centers for Disease Control and Prevention, National Center for Injury Prevention and Control. Unpublished analysis o f data from Multiple Cause o f Death Public Use Data, 1997.
22. Guerrero JL, Leadbetter S, Thurman DJ, Whiteneck G, Sniezek JE. A method for estimating the prevalence o f disability from traumatic brain injury. (Submitted for publication, 1999)
23. Association for the Advancement o f Automotive Medicine. The Abbreviated Injury Scale, 1990 Revision. Des Plains (IL): Association for the Advancement o f Automotive Medicine, 1990.
24. Center for Injury Research and Policy o f the Johns Hopkins University School o f Public Health. ICDMAP-90 Software. Baltimore, MD: The Johns Hopkins University and Tri- Analytics, Inc., 1997.
25. Brooks CA, Gabella B, Hoffman R, Sosin D, Whiteneck G. Traumatic brain injury: designing and implementing a population-based follow-up system. Arch Phys Med Rehabil 1997; 78(8):S26-S30.
27. Whiteneck G. Personal communication, 1998.
26. Research Foundation, State University o f N ew York. Guide for use o f the uniform data set for medical rehabilitation including the functional independence measure (FIM) and functional assessment measure (FAM), version 4.0. Buffalo, NY: State University o f N ew York, 1995.
TBI in the United States: A Report to Congress Page 20

Appendix: Methods Used to Produce Estimates for This Report
CDC C a s e D efin ition for T raum atic Brain Injury
CDC issued the following case definition for traumatic brain injury in its 1995 publication, Guidelines for Surveillance o f Central Nervous System Injury}
For the purposes o f public health surveillance, jurisdictions may elect to ascertain cases o f traumatic brain injury from clinical records or from existing uniform data systems. Case definitions are presented for both types o f ascertainment.
Clinical Case Definition. For surveillance systems using data from clinical records, a case o f traumatic brain injury (craniocerebral trauma) is defined either:
• as an occurrence o f injury to the head that is documented in a medical record, with one or more o f the following conditions attributed to head injury:*- observed or self-reported decreased level o f consciousness,f- amnesia,5- skull fracture,- objective neurological or neuropsychological abnormality,§ or- diagnosed intracranial lesion;11
• or as an occurrence o f death resulting from trauma, with head injury listed on the death certificate, autopsy report, or medical examiner’s report in the sequence o f conditions that resulted in death.
‘Injuries to the head may arise from blunt or penetrating trauma or from acceleration-deceleration forces.
+Decreased level of consciousness refers to partial or complete loss of consciousness. This includes states described as obtundation, stupor, or coma.
* Amnesia may include loss of memory for events immediately preceding the injury (retrograde amnesia), for the injury event itself, and for events subsequent to the injury (posttraumatic amnesia).
§Neurological abnormalities are determined from neurological examination. Examples include abnormalities of motor function, sensory function, or reflexes; abnormalities of speech (aphasia or dysphasia); or seizures acutely following head trauma. Neuropsychological abnormalities are determined from mental status and neuropsychological examinations. Examples include disorders of mental status (such as disorientation, agitation, or confusion) and other changes in cognition, behavior, or personality.
^Examples of diagnosed intracranial lesions include traumatic intracranial hematomas or hemorrhage (epidural, subdural, subarachnoid, or intracerebral), cerebral contusions or lacerations, or penetrating cerebral injuries (e.g., gunshot wounds). The diagnosis of such intracranial lesions is usually confirmed with a computed tomography (CT) or magnetic resonance imaging (MRI) brain scan or by other neurodiagnostic procedures.
TBI in the United States: A Report to Congress Page 21
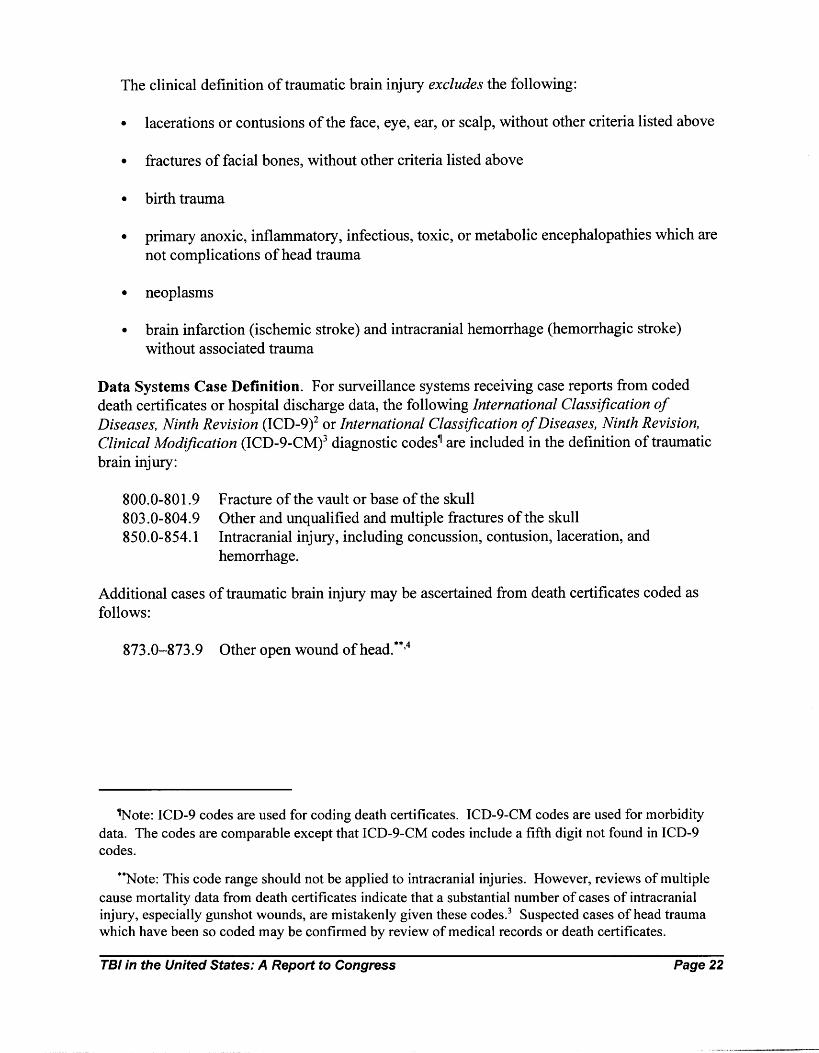
The clinical definition o f traumatic brain injury excludes the following:
• lacerations or contusions o f the face, eye, ear, or scalp, without other criteria listed above
• fractures o f facial bones, without other criteria listed above
• birth trauma
• primary anoxic, inflammatory, infectious, toxic, or metabolic encephalopathies which are not complications o f head trauma
• neoplasms
• brain infarction (ischemic stroke) and intracranial hemorrhage (hemorrhagic stroke) without associated trauma
Data Systems Case Definition. For surveillance systems receiving case reports from coded death certificates or hospital discharge data, the following International Classification o f Diseases, Ninth Revision (ICD-9)2 or International Classification o f Diseases, Ninth Revision, Clinical Modification (ICD-9-CM)3 diagnostic codes1 are included in the definition o f traumatic brain injury:
800.0-801.9 Fracture o f the vault or base o f the skull803.0-804.9 Other and unqualified and multiple fractures o f the skull850.0-854.1 Intracranial injury, including concussion, contusion, laceration, and
hemorrhage.
Additional cases o f traumatic brain injury may be ascertained from death certificates coded as follows:
873.0-873.9 Other open wound o f head.**’4
^ote: ICD-9 codes are used for coding death certificates. ICD-9-CM codes are used for morbidity data. The codes are comparable except that ICD-9-CM codes include a fifth digit not found in ICD-9 codes.
**Note: This code range should not be applied to intracranial injuries. However, reviews of multiple cause mortality data from death certificates indicate that a substantial number of cases of intracranial injury, especially gunshot wounds, are mistakenly given these codes.3 Suspected cases of head trauma which have been so coded may be confirmed by review of medical records or death certificates.
TBI in the United States: A Report to Congress Page 22

State health departments in Arizona, Colorado, Minnesota, Missouri, Oklahoma, New York, and South Carolina reviewed hospital discharge data collected from January 1 to December 31, 1994, using CDC guidelines to identify cases o f TBI. The review identified all cases o f TBI among patients in acute care hospitals who had been discharged with primary or secondary diagnoses consistent with the CDC case definition (i.e., ICD-9-CM code ranges 800.0-801.9, 803.0-804.9, and 850.0-854.1). In addition, the review identified TBI-related deaths and collected information from all death certificates or medical examiner reports that listed TBI or head injury among the conditions associated with death. Records were linked to eliminate duplicate cases reported from more than one source. Surveillance in N ew York excluded residents o f New York City. Surveillance was statewide in all other States. In most States, supplementary information on severity and external cause o f injury was obtained from abstracts o f medical records or healthcare provider report forms for all cases (Missouri and Oklahoma) or from representative samples o f cases (Arizona [31 percent sample], Colorado [47 percent sample], and South Carolina [45 percent sample]). The TBI incidence rate for all seven States combined was calculated by using the sum o f the number o f cases for each State and the sum o f the population o f each State estimated at the midpoint o f 1994 (35.3 million total).
Surveillance Methods Used by States
TBI in the United States: A Report to Congress Page 23

Appendix References
1. Thurman DJ, Sniezek JE, Johnson D, et al. Guidelines for Surveillance o f Central Nervous System Injury. Atlanta: Centers for Disease Control and Prevention, 1995.
2. International Classification o f Diseases, 9th Revision (ICD-9). Geneva, Switzerland: World Health Organization, 1977.
3. International Classification o f Diseases, 9th Revision, Clinical Modification, 3rd ed. (ICD-9- CM). Washington DC: U.S. Department o f Health and Human Services, 1989.
4. Sosin DM, Nelson DE, Sacks JJ. Head injury deaths: the enormity o f firearms. JAMA 1992;268:791.
TBI in the United States: A Report to Congress Page 24