T r a f f i c C r a s h F a c t s · Clark County 144,742 2 5 0 7 2 6 Clermont County 177,977 0 4 0...
220
All Counties for the County(s) 01/01/2015 to 12/31/2015 OHIO T r a f f i c C r a s h F a c t s
Transcript of T r a f f i c C r a s h F a c t s · Clark County 144,742 2 5 0 7 2 6 Clermont County 177,977 0 4 0...

All Countiesfor the County(s)
01/01/2015 to 12/31/2015
OHIOT r a f f i c C r a s h F a c t s

� ,/
OHIO DEPARTMENT John R. Kasich, Governor
.,_.,,, John Born, Director · P'....::-../ OF PUBLIC SAFETY --,B,_u-,e-au-o
7tM'"'o-,to
-,ccVe
-,h
-,-ic-,--le
-s
--------------�====='-
� SAPETY • SERVICE • PROTECTION • Emergency Management Agency
Emergency Medical Services Office of Criminal Justice Services
• Ohio Homeland Security • Ohio Investigative Unit• Ohio State Highway Patrol
1970 West Broad Street P.O. Box 182081
Columbus, Ohio 43218-2081 (614) 466-3383
www.publicsafety.ohio.gov
April 27, 2016
The 2015 Ohio Traffic Crash Facts Book is an in-depth highway safety statistical profile and analysis compiled from data supplied by law enforcement agencies across the state. This annual report provides a comprehensive look at the driving behaviors, facts and circumstances of traffic crashes on Ohio's roads. It is aimed to help the Ohio Department of Public Safety, local law enforcement agencies and other public safety partners determine and allocate resources to improve highway safety in Ohio.
Some of the more alarming statistics remind us why traffic safety continues to deserve our attention. Last year, the state recorded 302,307 total traffic crashes and 1,110 deaths. In 2015, alcohol impaired drivers were involved in approximately 31 percent of all fatalities, and 513 motor vehicle occupants sustained fatal injuries in traffic crashes because they didn't wear their available seatbelt.
The collaborative effort between all public safety agencies has had a significant impact on the amount of persons being killed on our roadways; however, there is still work to be done. The Ohio Department of Public Safety will continue to focus our efforts on the problems impacting our citizens the most - whether that's impaired driving, safety belt usage or speed - because the lives of Ohioans are our top priority.
It is our hope that you will use these statistics to help educate, encourage and promote safe driving in our state.
Sincerely,
f-hn Born, Director
hio Department of Public Safety
Mission Statement "to save lives, reduce injuries and economic loss, to administer Ohio's motor vehicle laws and to preserve the safety
and waif being of all citizens with the most cost-effective and service-oriented methods available."
An Equal Opportunity Employer

Chapter 1 - General StatisticsTable 1.01 - Ohio Motor Vehicle Crash Highlights At a Glance
Table 1.02 - Crashes by Severity
Table 1.03 - Crashes
Ohio Department of Public Safety
Traffic Crash Facts
List of Tables
Chapter 2 - Crash StatisticsTable 2.01 - Crashes by Month
Table 2.02 - Fatalities and Injuries by Month
Table 2.03 - Crashes by Day of Week
Table 2.04 - Injuries by Day of Week
Table 2.05 - Crashes by Light Condition
Table 2.06 - Crashes by Manner of Collision
Table 2.07 - Crashes by Weather Condition
Table 2.08 - Probable Causes of Crashes by Contributing Circumstances
Table 2.09 - Crashes, Deaths and Injuries on Holiday Period
Table 2.10 - Hit / Skip Crashes by Severity
Table 2.11 - Location by Crash Severity
Table 2.12 - Location of First Harmful Event by Crash Severity
Table 2.13 - Road Condition by Crash Severity
Table 2.14 - School Bus Related by Crash Severity
Table 2.15 - Work Zone Related by Crash Severity
Table 2.16 - Deer Crashes by Light Condition and Crash Severity
Table 2.17 - Deer Crashes by Month and Crash Severity
Chapter 3 - Death and Injury StatisticsTable 3.01 - Age Distribution of Persons Killed
Table 3.02 - Age Distribution of Persons Injured
Table 3.03 - Deaths and Injuries by Gender
Table 3.04 - Restraint Use of Occupants by Age
Table 3.05 - Child Restraint Use in Crashes
NOTE – Statistical crash data contained within the 2015 Crash Facts book is based on crash reports received by O.D.P.S. as of 03/31/2016.

Chapter 4 - Driver StatisticsTable 4.01 - Drivers in Crashes by Age Group
Table 4.02 - Male Drivers in Crashes by Age Group
Table 4.03 - Female Drivers in Crashes by Age Group
Table 4.05 - Financial Responsibility of Drivers in Crashes by Gender
Table 4.06 - No Proof of Insurance Shown in Crashes by Age Group
Table 4.07 - Condition of Drivers in Crashes
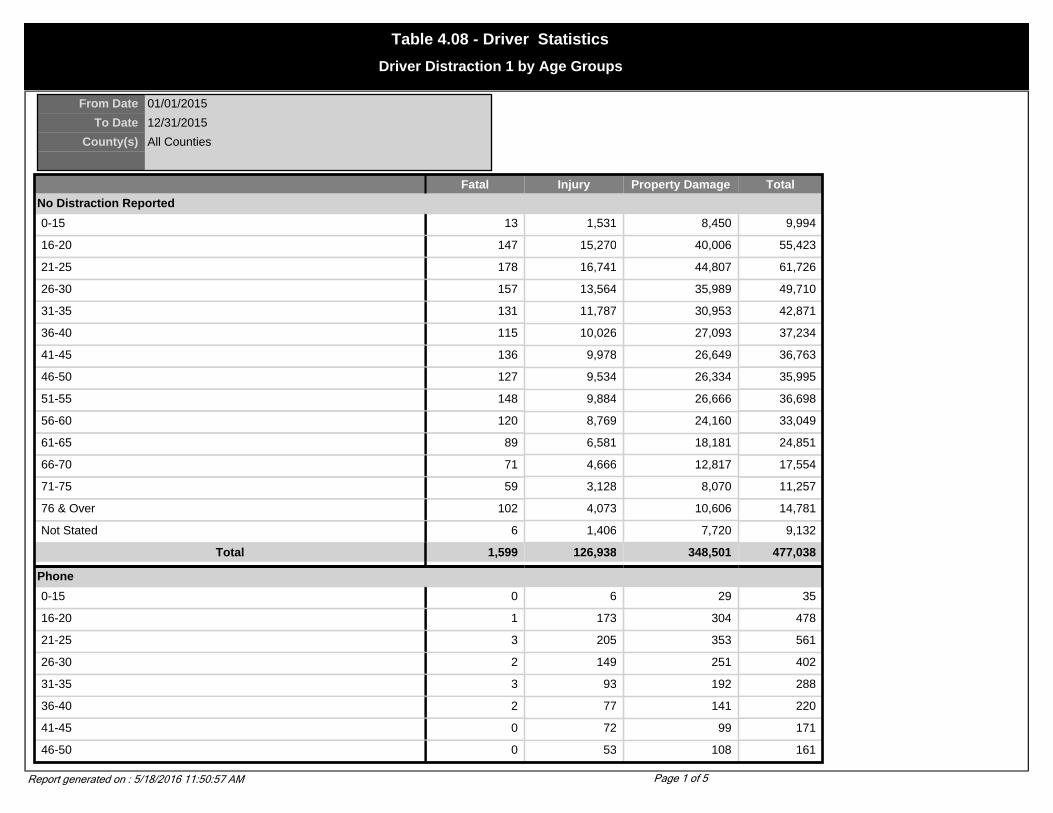
Table 4.08 - Driver Distraction 1 by Age Groups
Table 4.08A - Driver Distraction 2 by Age Groups
Table 4.09 - Driver Distraction by Crash Severity
Chapter 5 - Unit StatisticsTable 5.01 - Types of Units Involved in Crashes
Table 5.01A - Special Function Units Involved in Crashes
Table 5.02 - Deaths and Injuries by Position in Unit
Table 5.03 - Drivers and Pedestrians in All Crashes by Age and Unit Type
Table 5.04 - Drivers and Pedestrians in Fatal Crashes by Age and Unit Type
Table 5.05 - Drivers, Passengers and Pedestrians Killed and Injured
Table 5.06 - Crashes, Deaths and Injuries by Truck Drivers in Error
Table 5.07 - Heavy Truck Crashes
Table 5.08 - Crashes, Deaths and Injuries Involving Motorcycles
Table 5.09 - Age Group of Motorcyclists Killed and Injured
Table 5.10 - Helmet Use of Motorcyclists Killed and Injured
Table 3.07 - Ejection of Occupants by Injury Status
Table 3.08 - Deaths and Injuries by Safety Equipment Usage
Table 3.09 - Deaths and Injuries by Air Bag Usage
Table 3.10 - Trapped Occupants by Injury Status
Table 3.11 - Non-Motorist Location by Injury Status
Table 5.11 - Persons in Error in Motorcycle Crashes
Table 5.12 - Bicycle Deaths and Injuries by Age
Table 5.13 - Bicycle Crashes, Deaths and Injuries by Population Group
Table 5.14 - Bicycle Crashes, Deaths and Injuries by Light Condition
Table 5.16 - School Bus Crashes
Table 5.17 - Crashes, Deaths and Injuries Involving School Buses
Table 5.18 - First Harmful Event in School Bus Crashes Caused by School Bus Drivers
NOTE – Statistical crash data contained within the 2015 Crash Facts book is based on crash reports received by O.D.P.S. as of 03/31/2016.

Chapter 6 - Alcohol StatisticsTable 6.02 - Alcohol Related Crashes, Deaths and Injuries by Month
Table 6.03 - Alcohol Related Crashes of Drivers by Time of Day
Table 6.04 - BAC's of Alcohol Impaired Drivers in Error in Fatal Crashes by Age
Table 6.05 -Death and Injuries in Alcohol related Crashes by Population
Table 6.06 - Alcohol Related Crashes by Crash Severity
Table 6.07 -Alcohol Impaired Drivers by Age and Type of Unit
Table 6.08 - Persons Killed in Crashes by Age of the Alcohol Impaired Driver in Error
Table 6.09 - Persons Injured in Crashes by Age of the Alcohol Impaired Driver in Error
Table 6.10 - Age of Persons Killed and Injured in Alcohol Related Crashes
Table 6.11 - Types of Units Involved in Alcohol Crashes
Table 6.12 - Youthful Drivers in Alcohol Related Crashes
Chapter 7 - County StatisticsTable 7.01 - Total Crashes by County
Table 7.02 - Alcohol Related Crashes by County
Table 7.03 - Deer Crashes by County and Month
Table 7.04 - Alcohol-Related Motorcycle Crashes by County
Chapter 8 - City / Village StatisticsTable 8.01 - Total Crashes by City / Village
Table 8.02 - Alcohol Related Crashes by City / Village
Table 5.19 - Motor Vehicle - Train Crashes by population Area
Table 5.20 - Traffic Controls in Motor Vehicle - Train Crashes
Table 5.21 - Traffic Controls of Unit in Error in All Crashes
Table 5.22 - Crashes Involving Hazardous Materials Released
Table 5.23 - First Harmful Event in Truck Crashes Caused by Truck Drivers
Table 5.24 - First Harmful Event of Unit in Error
Table 5.25 - Units Involved in Crashes by Most Harmful Event
Table 5.26 - Units Involved in Crashes by First Harmful and Most Harmful Event
NOTE – Statistical crash data contained within the 2015 Crash Facts book is based on crash reports received by O.D.P.S. as of 03/31/2016.

From Date 01/01/2015
To Date 12/31/2015
County(s) All Counties
Crashes
Fatal Injury Crashes 1,029
Injury Crashes 75,109
Property Damage Only (PDO) Crashes 226,169
Total Crashes 302,307
InjuryType
Non-Incapacitating InjuryType 42,407
Incapacitating InjuryType 9,079
Possible InjuryType 56,908
Total Non-Fatal InjuryType 108,394
Total Fatalities 1,110
Drivers
Total Drivers In Crashes 501,342
Alcohol Impaired Drivers In Crashes 12,304
Total Drivers 513,646
Total Passengers in Crashes 182,613
Units
Passenger Vehicles 492,890
Other Passenger Vehicles 1,050
Motorcycle 3,914
Med / Heavy Trucks 24,196
Bus / Van / Limo 3,593
Non-Motorist 4,545
Unknown 14,552
Total Units in Crashes 544,740
Alcohol-Related
Injury 5,090
Fatal Injury 316
Property Damage Only (PDO) 7,120
Total Alcohol-Related Crashes 12,526
Deaths 346
InjuryType 7,130
Report generated on : 5/18/2016 11:49:27 AM Page 1 of 2
Table 1.01 - General StatisticsOhio Motor Vehicle Crash Highlights At a Glance
At a Glance
- Approximately 2.8 fatal crashes each day.
- Approximately 3.0 persons were killed each day.
- One person was killed every 7.9 hours.
- There were 297.0 persons injured every day.
- One person was injured every 4.8 minutes.
- Of drivers involved in crashes, 54.8 % are males, 2.8 % are gender not stated. 42.4 % are females, and
- Alcohol impaired drivers were involved in 4.07 % of all crashes.
- Alcohol impaired drivers were involved in 31.17 % of all fatalities.
- 72.2 % of all alcohol impaired drivers involved in crashes were males.
- 65.7 % of all crashes occurred during the daylight.
- Motor vehicle crashes killed 27.0 children and injured 8,572.0 children through age 14.
From Date 01/01/2015
To Date 12/31/2015
County(s) All Counties
Report generated on : 5/18/2016 11:49:27 AM Page 2 of 2
Table 1.01 - General StatisticsOhio Motor Vehicle Crash Highlights At a Glance

Year Fatal Injury Property Damage
Total Deaths
2011 942 73,771 223,118 297,831 1,016
2012 1,024 72,099 213,955 287,078 1,122
2013 918 69,104 199,056 269,078 990
2014 919 69,917 211,532 282,368 1,008
2015 1,029 75,109 226,169 302,307 1,110
4,832 360,000 1,073,830 1,438,662 5,246
From Date 01/01/2011
To Date 12/31/2015
County(s) All Counties
Report generated on : 5/18/2016 11:49:27 AM
Table 1.02 - General Statistics5 Year Comparison - Crashes by Severity

From Date 01/01/2015
To Date 12/31/2015
County(s) All Counties
Crashes
Injury Crashes 75,109
Fatal Injury Crashes 1,029
Property Damage Only (PDO) Crashes 226,169
Total Crashes 302,307
Non-Fatal InjuryType
Non-Incapacitating InjuryType 42,407
Possible InjuryType 56,908
Incapacitating InjuryType 9,079
Total Non-Fatal InjuryType 108,394
Fatal InjuryType 1,110
Drivers
Female Drivers Involved 212,662
Male Drivers Involved 274,832
Gender Not Stated Drivers 13,848
Total Drivers 501,342
All Unit Types
Passenger Vehicles 492,890
Other Passenger Vehicles 1,050
Motorcycle 3,914
Med / Heavy Trucks 24,196
Bus / Van / Limo 3,593
Non-Motorist 4,545
Unknown 14,552
Total All Unit Types 544,740
Report generated on : 5/18/2016 11:49:29 AM
Table 1.03 - General StatisticsCrashes

Month Fatal Injury Property Damage Total
2015 January 80 6,350 22,383 28,813
2015 February 66 6,106 22,095 28,267
2015 March 50 5,432 17,577 23,059
2015 April 60 5,446 15,631 21,137
2015 May 102 6,501 17,570 24,173
2015 June 91 6,224 17,349 23,664
2015 July 95 6,566 17,056 23,717
2015 August 132 6,562 17,020 23,714
2015 September 93 6,683 17,911 24,687
2015 October 100 6,799 20,707 27,606
2015 November 75 6,218 21,269 27,562
2015 December 85 6,222 19,601 25,908
Total 1,029 75,109 226,169 302,307
From Date 01/01/2015
To Date 12/31/2015
County(s) All Counties
Report generated on : 5/18/2016 11:49:30 AM
Table 2.01 - Crash StatisticsCrashes by Month

Month Fatal Injury Incapacitating Injury Non - Incapacitating Injury
Possible Injury Total
2015 January 84 709 3,517 4,660 8,970
2015 February 79 583 3,296 4,822 8,780
2015 March 57 644 2,906 4,317 7,924
2015 April 65 680 2,978 4,111 7,834
2015 May 109 931 3,819 4,818 9,677
2015 June 100 722 3,660 4,744 9,226
2015 July 97 840 3,886 4,959 9,782
2015 August 139 911 3,824 4,802 9,676
2015 September 98 845 3,843 4,886 9,672
2015 October 110 842 3,814 5,196 9,962
2015 November 78 705 3,439 4,863 9,085
2015 December 94 667 3,425 4,730 8,916
Total 1,110 9,079 42,407 56,908 109,504
From Date 01/01/2015
To Date 12/31/2015
County(s) All Counties
Report generated on : 5/18/2016 11:49:31 AM
Fatalities and Injuries by MonthTable 2.02 - Crash Statistics

Day of Week Fatal Injury Property Damage Total
Sunday 153 8,125 22,892 31,170
Monday 125 10,998 33,256 44,379
Tuesday 138 11,144 33,684 44,966
Wednesday 146 11,022 34,316 45,484
Thursday 140 11,027 34,161 45,328
Friday 144 12,110 37,336 49,590
Saturday 183 10,683 30,524 41,390
Total 1,029 75,109 226,169 302,307
From Date 01/01/2015
To Date 12/31/2015
County(s) All Counties
Report generated on : 5/18/2016 11:49:32 AM
Table 2.03 - Crash StatisticsCrashes by Day of Week

Day of Week Fatal Injury Incapacitating Injury
Non - Incapacitating
Injury
Possible Injury No Injury Not Stated / Unknown
Total
Sunday 171 1,184 5,096 5,828 56,018 0 68,297
Monday 131 1,264 6,099 8,226 83,339 0 99,059
Tuesday 146 1,249 6,000 8,566 85,536 0 101,497
Wednesday 149 1,253 6,091 8,388 86,525 0 102,406
Thursday 153 1,169 5,973 8,396 87,444 0 103,135
Friday 160 1,504 6,726 9,371 98,645 0 116,406
Saturday 200 1,456 6,422 8,133 79,789 0 96,000
Total 1,110 9,079 42,407 56,908 577,296 0 686,800
From Date 01/01/2015
To Date 12/31/2015
County(s) All Counties
Report generated on : 5/18/2016 11:49:33 AM
Table 2.04 - Crash StatisticsInjuries by Day of Week
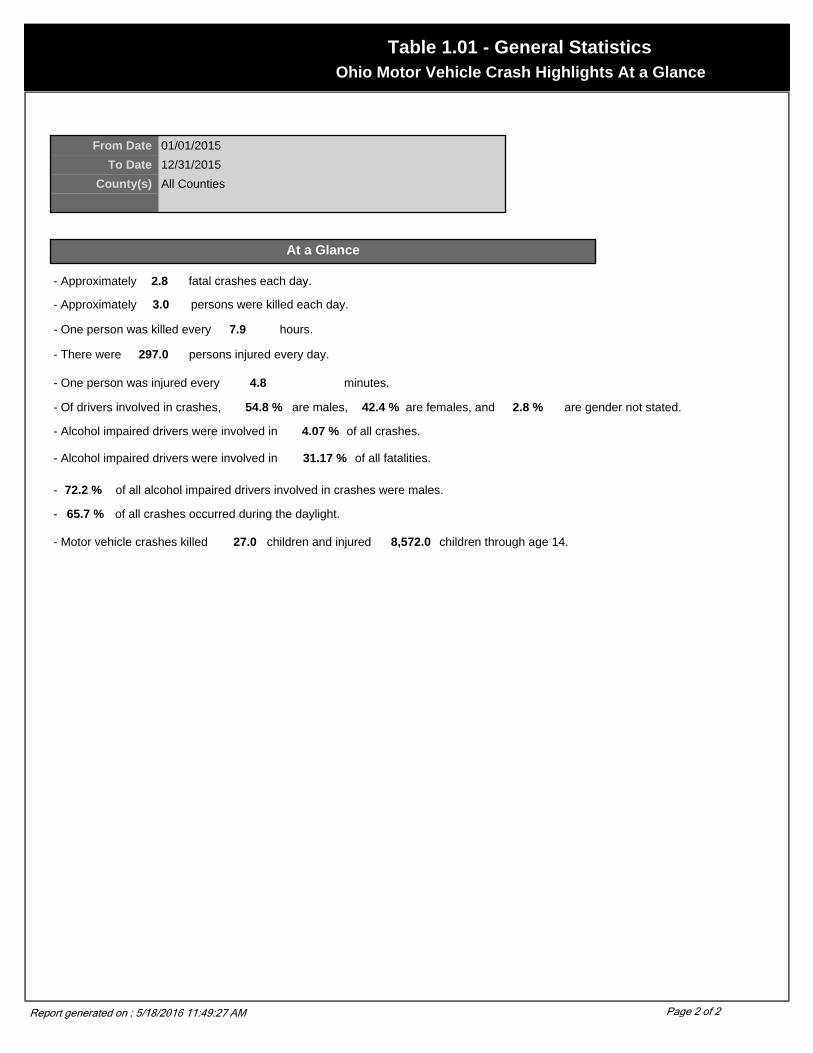
Light Condition Fatal Injury Property Damage Total
Daylight 527 51,950 146,116 198,593
Dawn 15 1,523 5,931 7,469
Dusk 22 1,843 5,491 7,356
Dark - Lighted Roadway 196 10,854 32,644 43,694
Dark - Roadway Not Lighted 255 8,035 30,799 39,089
Dark - Unknown Roadway Lighting 2 225 1,179 1,406
Glare 0 0 0 0
Other 0 19 99 118
Unknown 12 660 3,910 4,582
Total 1,029 75,109 226,169 302,307
From Date 01/01/2015
To Date 12/31/2015
County(s) All Counties
Report generated on : 5/18/2016 11:49:34 AM
Crashes by Light Condition
Table 2.05 - Crash Statistics

Manner of Collision Fatal Injury Property Damage Total
Not Collision Between Two Vehicles in Transport
551 22,698 71,671 94,920
Rear-end 77 23,124 63,542 86,743
Head-on 119 2,688 2,524 5,331
Rear-to-rear 0 145 538 683
Backing 0 416 8,529 8,945
Angle 240 21,151 46,008 67,399
Sideswipe, same direction 15 2,557 23,709 26,281
Sideswipe, opposite direction 9 1,133 4,770 5,912
Unknown 18 1,197 4,878 6,093
Total 1,029 75,109 226,169 302,307
From Date 01/01/2015
To Date 12/31/2015
County(s) All Counties
Report generated on : 5/18/2016 11:49:35 AM
Table 2.06 - Crash StatisticsCrashes by Manner of Collision

Weather Condition Fatal Injury Property Damage Total
Clear 618 42,341 125,732 168,691
Cloudy 284 19,730 57,900 77,914
Fog, Smog, Smoke 16 410 1,356 1,782
Rain 80 8,762 24,629 33,471
Sleet, Hail (Freezing Rain Or Drizzle) 5 345 1,172 1,522
Snow 17 2,809 11,385 14,211
Severe Crosswinds 2 39 175 216
Blowing Sand, Soil, Dirt, Snow 4 163 420 587
Other/Unknown 3 510 3,400 3,913
Total 1,029 75,109 226,169 302,307
From Date 01/01/2015
To Date 12/31/2015
County(s) All Counties
Report generated on : 5/18/2016 11:49:39 AM
Table 2.07 - Crash StatisticsCrashes by Weather Condition

Motorist in Error Fatal % of Total Fatals
Injury Property Damage
Total
None 15 1.5 % 1,559 5,661 7,235
Failure to Yield 136 13.2 % 12,705 24,343 37,184
Ran Red Light 20 1.9 % 3,188 4,507 7,715
Ran Stop Sign 30 2.9 % 1,708 2,488 4,226
Exceeded Speed Limit 19 1.8 % 164 215 398
Unsafe Speed 97 9.4 % 3,621 7,248 10,966
Improper Turn 5 0.5 % 1,528 5,821 7,354
Left of Center 106 10.3 % 1,842 2,845 4,793
Followed Too Closely/ACDA 67 6.5 % 20,702 56,433 77,202
Improper Lane Change/Passing/Off Road/
152 14.7 % 5,818 20,680 26,650
Improper Backing 3 0.3 % 493 9,559 10,055
Improper Start From Parked Position 0 0.0 % 278 1,331 1,609
Stopped or Parked Illegally 2 0.2 % 70 120 192
Operating Vehicle Negligent Manner 20 1.9 % 751 1,530 2,301
Swerving to Avoid (Due To External Conditions)
4 0.4 % 504 1,427 1,935
Wrong Side or Wrong Way 11 1.1 % 186 336 533
Failure to Control 189 18.3 % 11,946 32,296 44,431
Vision Obstruction 1 0.1 % 88 377 466
Operating Defective Equipment 6 0.6 % 404 1,676 2,086
Load Shifting/Falling/Spilling 0 0.0 % 103 1,192 1,295
Other Improper Action 10 1.0 % 786 3,147 3,943
Unknown 20 1.9 % 1,437 9,544 11,001
Subtotal 913 88.6 % 69,881 192,776 263,570
From Date 01/01/2015
To Date 12/31/2015
County(s) All Counties
Non-Motorist in ErrorNone 1 0.1 % 53 31 85
Improper Crossing 29 2.8 % 486 68 583
Darting 6 0.6 % 180 19 205
Lying And/Or Illegally In Roadway 20 1.9 % 64 8 92
Failure To Yield Right Of Way 6 0.6 % 210 179 395
Not Visible (Dark Clothing) 4 0.4 % 30 6 40
Inattentive 0 0.0 % 111 255 366
Failure To Obey Traffic 2 0.2 % 132 61 195
Wrong Side Of The Road 3 0.3 % 84 24 111
Other Non-Motorist 5 0.5 % 148 101 254
Unknown 2 0.2 % 274 26 302
Subtotal 78 7.6 % 1,772 778 2,628
Animal in Error 4 0.4 % 974 20,951 21,929
No Error/Unknown/Not Stated 36 3.5 % 2,751 11,690 14,477
TOTAL 1,031 100.0 % 75,378 226,195 302,604
In Error: The Motorist, Non-Motorist, or Animal, which had the most causative bearing on the crash
Report generated on : 5/18/2016 11:49:41 AM
Probable Causes of Crashes by Contributing Circumstances
Table 2.08 - Crash Statistics

Holiday Weekend No. of Days* Total Crashes Total Deaths Alcohol Related Deaths Total Injuries
New Years 2.00 1,086 6 3 404
Memorial Day 4.00 2,791 16 7 1,150
July 4th 4.00 2,609 10 1 1,089
Labor Day 4.00 2,711 14 4 1,109
Thanksgiving 5.00 4,007 9 4 1,417
Christmas 4.00 2,514 13 4 969
Total 23.00 15,718 68 23 6,138
From Date 01/01/2015
To Date 12/31/2015
County(s) All Counties
*Note: 'Days' Refers to the total number of days included in the holiday reporting period.
Report generated on : 5/18/2016 11:49:45 AM
Crashes, Deaths and Injuries for Holiday Period
Table 2.09 - Crash Statistics

Hit / Skip Fatal Injury Property Damage Total
Not Hit Skip 984 68,698 189,529 259,211
Solved 23 2,084 7,734 9,841
Unsolved 22 4,327 28,906 33,255
Total 1,029 75,109 226,169 302,307
From Date 01/01/2015
To Date 12/31/2015
County(s) All Counties
Report generated on : 5/18/2016 11:49:46 AM
Hit/Skip Crashes by SeverityTable 2.10 - Crash Statistics

Location Fatal Injury Property Damage Total
Not a Intersection 701 41,876 144,923 187,500
Four-way Intersection 162 18,623 40,224 59,009
T-Intersection 85 8,954 23,259 32,298
Y-Intersection 3 503 1,397 1,903
Traffic circle/roundabout 1 122 794 917
Five-point, or more 4 201 599 804
On ramp 17 846 2,641 3,504
Off ramp 20 1,049 3,472 4,541
Crossover 2 159 395 556
Driveway/Alley Access 24 2,413 7,202 9,639
Railway grade crossing 6 63 277 346
Shared-use paths or trails 0 21 64 85
Unknown 4 279 922 1,205
Total 1,029 75,109 226,169 302,307
From Date 01/01/2015
To Date 12/31/2015
County(s) All Counties
Report generated on : 5/18/2016 11:49:48 AM
Location by Crash Severity
Table 2.11 - Crash Statistics

Location First Harmful Event Fatal Injury Property Damage Total
On Roadway 682 61,360 192,478 254,520
On Shoulder 59 2,898 7,885 10,842
In Median 12 557 1,495 2,064
On Roadside 232 7,654 16,310 24,196
On Gore 3 58 128 189
Outside Trafficway 35 2,102 6,203 8,340
Unknown 6 480 1,670 2,156
Total 1,029 75,109 226,169 302,307
From Date 01/01/2015
To Date 12/31/2015
County(s) All Counties
Report generated on : 5/18/2016 11:49:49 AM
Table 2.12 - Crash StatisticsLocation of First Harmful Event by Crash Severity

Road Condition Fatal Injury Property Damage Total
Dry 830 54,863 160,956 216,649
Wet 163 15,035 42,896 58,094
Snow 20 3,149 14,065 17,234
Ice 7 1,482 5,327 6,816
Sand, Mud, Dirt, Oil, Gravel 3 76 190 269
Water (Standing, Moving) 0 43 136 179
Slush 3 190 645 838
Debris 0 6 20 26
Rut, Holes, Bumps, Uneven Pavement 0 0 0 0
Other 0 66 174 240
Unknown 3 199 1,760 1,962
Total 1,029 75,109 226,169 302,307
From Date 01/01/2015
To Date 12/31/2015
County(s) All Counties
Report generated on : 5/18/2016 11:49:51 AM
Table 2.13 - Crash StatisticsRoad Condition by Crash Severity

School Bus Related Fatal Crashes Injury Crashes PDO Crashes Total
No 1,029 74,827 224,860 300,716
Yes, School Bus Directly Involved 0 237 1,216 1,453
Yes, School Bus Indirectly Involved 0 45 93 138
Total 1,029 75,109 226,169 302,307
From Date 01/01/2015
To Date 12/31/2015
County(s) All Counties
Report generated on : 5/18/2016 11:49:52 AM
Table 2.14 - Crash StatisticsSchool Bus Related by Crash Severity

Work Zone Related Fatal Injury Property Damage Total
No 1,001 73,654 221,549 296,204
Yes 28 1,455 4,620 6,103
Total 1,029 75,109 226,169 302,307
From Date 01/01/2015
To Date 12/31/2015
County(s) All Counties
Report generated on : 5/18/2016 11:49:52 AM
Table 2.15 - Crash StatisticsCrash Statistics - Work Zone Related by Crash Severity

Light Condition Fatal Injury Property Damage TotalDaylight 0 250 3,810 4,060
Dawn 0 61 1,468 1,529
Dusk 0 28 453 481
Dark - Lighted Roadway 0 87 1,636 1,723
Dark - Roadway Not Lighted 4 453 12,525 12,982
Dark - Unknown Roadway Lighting 0 9 162 171
Glare 0 0 0 0
Other 0 0 8 8
Unknown 0 3 104 107
Total 4 891 20,166 21,061
From Date 01/01/2015
To Date 12/31/2015
County(s) All Counties
Report generated on : 5/18/2016 11:49:55 AM
Table 2.16 - Crash StatisticsDeer Crashes by Light Condition and Crash Severity

Month Fatal Injury Property Damage Total
January 0 46 1,372 1,418
February 0 20 1,024 1,044
March 0 46 1,362 1,408
April 0 63 1,063 1,126
May 0 103 1,568 1,671
June 0 53 1,249 1,302
July 0 67 1,028 1,095
August 0 47 744 791
September 0 55 992 1,047
October 1 122 2,831 2,954
November 3 205 4,583 4,791
December 0 64 2,350 2,414
Total 4 891 20,166 21,061
From Date 01/01/2015
To Date 12/31/2015
County(s) All Counties
Report generated on : 5/18/2016 11:49:56 AM
Table 2.17 - Crash StatisticsDeer Crashes by Month and Crash Severity

Age Group Drivers* Passengers Pedestrians Total
0-15* 7 19 7 33
16-20 70 41 11 122
21-25 91 26 9 126
26-30 76 13 6 95
31-35 56 14 10 80
36-40 47 10 10 67
41-45 61 7 10 78
46-50 62 4 7 73
51-55 69 7 14 90
56-60 61 6 12 79
61-65 37 7 8 52
66-70 44 11 5 60
71-75 39 7 5 51
76 and Over 76 24 4 104
Not Stated 0 0 0 0
Total 796 196 118 1,110
From Date 01/01/2015
To Date 12/31/2015
County(s) All Counties
*Notes: - Drivers include operators of motorized and non-motorized units
- Age 0 consists of occupants under 12 months
Table Data: Fatal crash severity and fatal injuries involved
Report generated on : 5/18/2016 11:50:01 AM
Table 3.01 - Death & Injury StatisticsAge Distribution of Persons Killed

Age Group Drivers* Passengers Pedestrians Total
0-15* 534 8,491 499 9,524
16-20 9,241 4,368 309 13,918
21-25 10,337 3,182 285 13,804
26-30 8,418 2,288 212 10,918
31-35 7,115 1,717 167 8,999
36-40 5,999 1,290 164 7,453
41-45 5,999 1,298 127 7,424
46-50 5,846 1,235 162 7,243
51-55 6,237 1,282 184 7,703
56-60 5,411 1,121 134 6,666
61-65 3,972 898 99 4,969
66-70 2,848 661 53 3,562
71-75 1,919 507 40 2,466
76 and Over 2,495 921 58 3,474
Not Stated 108 145 18 271
Total 76,479 29,404 2,511 108,394
From Date 01/01/2015
To Date 12/31/2015
County(s) All Counties
*Notes: - Drivers include operators of motorized and non-motorized units - Age 0 consists of occupants under 12 monthsTable Data: Possible, non-incapacitating or incapacitating injuries involved
Report generated on : 5/18/2016 11:50:02 AM
Table 3.02 - Death & Injury StatisticsAge Distribution of Persons Injured

Age Group DEATHS INJURIES
Male Female Not Stated Total Male Female Not Stated Total
0-5* 0 5 0 5 1,559 1,510 26 3,095
06-10 6 0 0 6 1,428 1,526 2 2,956
11-15 12 10 0 22 1,530 1,940 3 3,473
16-20 85 37 0 122 6,342 7,575 1 13,918
21-25 98 28 0 126 6,473 7,327 4 13,804
26-30 76 19 0 95 5,143 5,774 1 10,918
31-35 51 29 0 80 4,303 4,693 3 8,999
36-40 43 24 0 67 3,554 3,898 1 7,453
41-45 56 22 0 78 3,537 3,886 1 7,424
46-50 62 11 0 73 3,430 3,813 0 7,243
51-55 68 22 0 90 3,683 4,018 2 7,703
56-60 65 14 0 79 3,261 3,403 2 6,666
61-65 39 13 0 52 2,379 2,590 0 4,969
66-70 38 22 0 60 1,590 1,970 2 3,562
71-75 35 16 0 51 1,136 1,330 0 2,466
76 and Over 55 49 0 104 1,538 1,936 0 3,474
Not Stated 0 0 0 0 102 84 85 271
Total 789 321 0 1,110 50,988 57,273 133 108,394
From Date 01/01/2015
To Date 12/31/2015
County(s) All Counties
* Note: Age 0 consists of occupants under 12 monthsTable Data: POssible, non-incapacitating, incapacitating or fatal injuries
Report generated on : 5/18/2016 11:50:04 AM
Deaths and Injuries by Gender
Table 3.03 - Death & Injury Statistics

PERSONS KILLED
Age Group Used Percent Used
Not Used Not Available
Total
0-5* 4 80.0 % 1 0 5
06-10 1 50.0 % 1 0 2
11-15 2 20.0 % 8 0 10
16-20 38 38.0 % 55 7 100
21-25 20 20.6 % 68 9 97
26-30 18 26.5 % 44 6 68
31-35 23 38.3 % 33 4 60
36-40 12 26.1 % 31 3 46
41-45 20 40.8 % 22 7 49
46-50 16 41.0 % 21 2 39
51-55 16 33.3 % 26 6 48
56-60 16 41.0 % 18 5 39
61-65 19 55.9 % 9 6 34
66-70 19 46.3 % 18 4 41
71-75 20 50.0 % 15 5 40
76 and Over 58 59.8 % 29 10 97
Not Stated 0 0.0 % 0 0 0
TOTAL 302 39.0 % 399 74 775
From Date 01/01/2015
To Date 12/31/2015
County(s) All Counties
Table Data: Fatal Injuries involved; Drivers and Occupants; Restraint (Safety Equipment) used includes Shoulder Belt, Only, Lap Belt Only, Shoulder/Lap Belt, Child Safety Seat, None Used, Use Unknown, and Unknown; all unit type included, Note: Age 0 consists of occupants under 12 months
PERSONS INJURED
Age Group Used Percent Used
Not Used Not Available
Total
0-5* 2,736 93.1 % 90 112 2,938
06-10 2,319 90.2 % 132 120 2,571
11-15 2,403 87.8 % 198 137 2,738
16-20 11,180 85.4 % 1,286 624 13,090
21-25 10,760 83.4 % 1,327 808 12,895
26-30 8,623 84.7 % 911 642 10,176
31-35 7,207 85.7 % 686 518 8,411
36-40 6,020 87.2 % 508 373 6,901
41-45 6,052 88.9 % 419 337 6,808
46-50 5,856 89.0 % 429 296 6,581
51-55 6,318 91.5 % 305 285 6,908
56-60 5,598 92.3 % 242 223 6,063
61-65 4,205 92.3 % 191 159 4,555
66-70 3,113 93.4 % 120 101 3,334
71-75 2,173 92.5 % 97 79 2,349
76 and Over 3,115 92.8 % 136 105 3,356
Not Stated 108 53.2 % 15 80 203
TOTAL 87,786 87.9 % 7,092 4,999 99,877
Table Data: Possible, Non-incapacitating or Incapacitating Injuries involved; Drivers and Occupants; Restraint (Safety Equipment) used includes Shoulder Belt Only, Lap Belt Only, Shoulder/Lap Belt, Child Safety Seat, None Used, Use Unknown, and Unknown; all unit type included. Note: Age 0 consists of occupants under 12 months.
Report generated on : 5/18/2016 11:50:06 AM
Restraint Use of Occupant by Age
Table 3.04 - Death & Injury Statistics
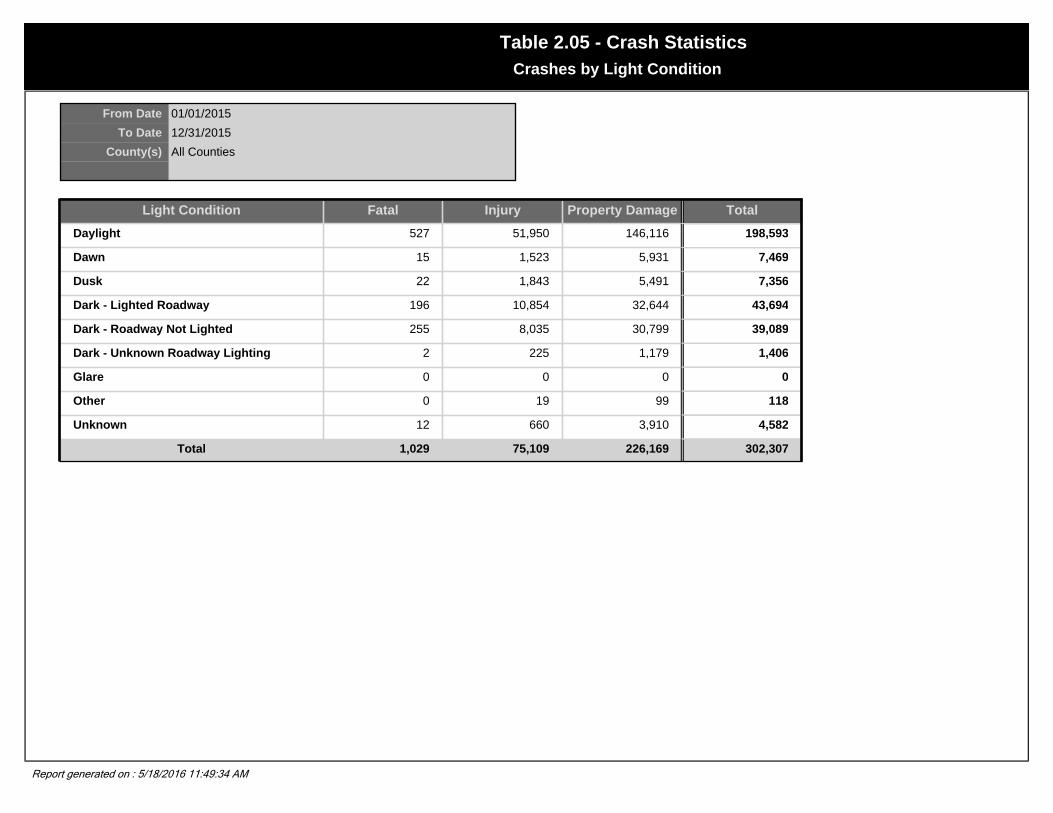
Age Total Children Restraints Used Percent Used
Killed
0 1 1 100.0 %
1 1 1 100.0 %
2 0 0 0.0 %
3 0 0 0.0 %
4 2 2 100.0 %
5 1 0 0.0 %
6 0 0 0.0 %
7 0 0 0.0 %
8 0 0 0.0 %
TOTAL 0-8 5 4 80.0 %
Injured
0 509 117 23.0 %
1 485 320 66.0 %
2 458 381 83.2 %
3 476 370 77.7 %
4 475 315 66.3 %
5 538 299 55.6 %
6 517 320 61.9 %
7 557 350 62.8 %
8 516 399 77.3 %
TOTAL 0-8 4,531 2,871 63.4 %
Not Injured
0 3,867 811 21.0 %
1 3,556 2,302 64.7 %
2 3,461 3,004 86.8 %
3 3,491 2,894 82.9 %
4 3,453 2,393 69.3 %
5 3,699 1,934 52.3 %
6 3,897 1,885 48.4 %
7 3,737 1,996 53.4 %
8 3,813 2,450 64.3 %
TOTAL 0-8 32,974 19,669 59.7 %
Not Stated
0 0 0 0.0 %
1 0 0 0.0 %
2 0 0 0.0 %
3 0 0 0.0 %
4 0 0 0.0 %
5 0 0 0.0 %
6 0 0 0.0 %
7 0 0 0.0 %
8 0 0 0.0 %
TOTAL 0-8 0 0 0.0 %
From Date 01/01/2015
To Date 12/31/2015
County(s) All Counties
Report generated on : 5/18/2016 11:50:08 AM
Child Restraint Use in Crashes
Table 3.05 - Death & Injury Statistics

All Occupants
0 4,377 3,869 88.4 %
1 4,042 3,940 97.5 %
2 3,919 3,796 96.9 %
3 3,967 3,808 96.0 %
4 3,930 3,721 94.7 %
5 4,238 3,573 84.3 %
6 4,414 3,476 78.7 %
7 4,294 3,373 78.6 %
8 4,329 3,309 76.4 %
TOTAL 0-8 37,510 32,865 87.6 %
Table Data: Occupants; Restraint (Safety Equipment) used includes Shoulder Belt Only, Lap Belt Only, Shoulder/Lap Belt, or Child Safety Seat/Booster Seat
Report generated on : 5/18/2016 11:50:08 AM
Child Restraint Use in Crashes
Table 3.05 - Death & Injury Statistics

FATAL CRASHES
Not Ejected Partial Ejection
Total Ejection
Not Applicable
Not Stated Total
No Injury / None Reported Injury
551 0 1 2 0 554
Possible Injury 154 0 2 0 0 156
Non-Incapacitating Injury 298 1 6 0 0 305
Incapacitating Injury 263 2 30 0 0 295
Fatal Injury 607 39 129 1 0 776
Not Stated Injury 0 0 0 0 0 0
TOTAL 1,873 42 168 3 0 2,086
From Date 01/01/2015
To Date 12/31/2015
County(s) All Counties
Table Data: Drivers and Occupants; all unit types included.
ALL CRASHES
Not Ejected Partial Ejection
Total Ejection
Not Applicable
Not Stated Total
No Injury / None Reported Injury
545,940 30 201 1,335 0 547,506
Possible Injury 54,082 11 66 72 0 54,231
Non-Incapacitating Injury 38,106 29 164 61 0 38,360
Incapacitating Injury 6,925 69 285 17 0 7,296
Fatal Injury 607 39 129 1 0 776
Not Stated Injury 0 0 0 0 0 0
TOTAL 645,660 178 845 1,486 0 648,169
Table Data: Drivers and Occupants; all unit types included.
Report generated on : 5/18/2016 11:50:11 AM
Ejection of Occupants by Injury Status
Table 3.07 - Death & Injury Statistics

Safety Equipment Usage Fatal Injury Incapacitating Non-Incapacitating
Possible Injury No Injury Not Stated / Unknown
Total
MOTORIST
None Used - Vehicle Occupant
513 2,198 4,379 2,854 23,005 0 32,949
Shoulder Belt Only Used 1 26 135 312 2,843 0 3,317
Lap Belt Only Used 3 38 243 397 3,546 0 4,227
Shoulder and Lap Belt Used 294 4,920 32,416 46,834 480,418 0 564,882
Child Restraint System - Forward Facing
4 35 363 1,216 12,506 0 14,124
Child Restraint System - Rear Facing
0 5 65 495 4,254 0 4,819
Booster Seat 0 26 250 476 5,109 0 5,861
Helmet Used 61 362 748 281 444 0 1,896
Unknown Safety Equipment 89 737 1,876 2,778 44,532 0 50,012
NON MOTORIST
None Used 113 548 1,447 852 419 0 3,379
Helmet Used 5 33 98 42 17 0 195
Protective Pads Used 0 0 0 1 1 0 2
Reflective Clothing 7 13 21 14 6 0 61
Lighting 3 1 6 2 8 0 20
Other 0 20 46 40 43 0 149
Unknown Safety Equipment 17 117 314 314 145 0 907
TOTAL 1,110 9,079 42,407 56,908 577,296 0 686,800
From Date 01/01/2015
To Date 12/31/2015
County(s) All Counties
Table Data: All people involved in crashes (Drivers, Occupants and Pedestrians).
Report generated on : 5/18/2016 11:50:12 AM
Death and Injuries by Safety Equipment Usage
Table 3.08 - Death & Injury Statistics

Air Bag Usage Fatal Injury Incapacitating Non-Incapacitating
Possible Injury No Injury Not Stated / Unknown
Total
Not-Deployed 206 3,021 20,998 38,907 487,851 0 550,983
Deployed-Front 335 2,776 11,347 9,479 24,240 0 48,177
Deployed-Side 29 206 1,221 1,453 4,522 0 7,431
Deployed Both Front/Side 116 878 3,103 2,426 5,710 0 12,233
Not Applicable 318 1,722 4,497 3,543 37,404 0 47,484
Deployment Unknown 106 476 1,241 1,100 17,569 0 20,492
TOTAL 1,110 9,079 42,407 56,908 577,296 0 686,800
From Date 01/01/2015
To Date 12/31/2015
County(s) All Counties
Table Data: All people involved in crashes (Drivers, Occupants and Pedestrians). This will include Motorcycles, all motorists.
Report generated on : 5/18/2016 11:50:15 AM
Death and Injuries by Air Bag Usage
Table 3.09 - Death & Injury Statistics

Trapped Fatal Injury Incapacitating Non-Incapacitating
Possible Injury No Injury Not Stated / Unknown
Total
Not trapped 665 7,343 40,622 56,026 576,391 0 681,047
Extricated By Mechanical Means
327 1,115 822 303 353 0 2,920
Extricated By Non-Mechanical Means
118 621 963 579 546 0 2,827
Unknown 0 0 0 0 0 0 0
TOTAL 1,110 9,079 42,407 56,908 577,290 0 686,794
From Date 01/01/2015
To Date 12/31/2015
County(s) All Counties
Motorists without Motorcycles. Report generated on : 5/18/2016 11:50:22 AM
Trapped Occupants by Injury Status
Table 3.10 - Death & Injury Statistics

Non-Motorist Location Fatal Injury Incapacitating Non-Incapacitating
Possible Injury No Injury Not Stated / Unknown
Total
Intersection – Marked Crosswalk
14 153 580 640 1,914 0 3,301
Intersection – Unmarked Crosswalk
9 56 203 251 889 0 1,408
Intersection – Other 3 33 107 94 473 0 710
Midblock – Marked Crosswalk
0 7 30 25 137 0 199
Travel Lane – Other Location
75 262 495 311 1,267 0 2,410
Bicycle Lane 0 8 17 19 24 0 68
Shoulder/Roadside 23 87 282 177 465 0 1,034
Sidewalk 7 39 145 117 91 0 399
Median/Crossing Island 0 7 9 4 24 0 44
Driveway Access 2 13 46 74 365 0 500
Shared use paths or trails 1 3 5 10 20 0 39
Non-Trafficway Area 2 14 36 28 132 0 212
Other/Unknown 974 8,397 40,452 55,158 571,495 0 676,476
TOTAL 1,110 9,079 42,407 56,908 577,296 0 686,800
From Date 01/01/2015
To Date 12/31/2015
County(s) All Counties
Report generated on : 5/18/2016 11:50:28 AM
Non-Motorist Location by Injury Status
Table 3.11 - Death & Injury Statistics

Age Group Fatal Injury Property Damage
Total Driver In Error Percent in Error
0-15* 14 1,585 8,590 10,189 9,225 1.8%
16-20 156 16,846 43,246 60,248 40,461 8.1%
21-25 193 18,147 47,612 65,952 38,417 7.7%
26-30 164 14,563 37,972 52,699 27,013 5.4%
31-35 139 12,540 32,372 45,051 21,074 4.2%
36-40 120 10,643 28,221 38,984 16,931 3.4%
41-45 139 10,482 27,683 38,304 15,608 3.1%
46-50 132 10,028 27,284 37,444 14,773 2.9%
51-55 154 10,366 27,604 38,124 14,954 3.0%
56-60 122 9,149 24,988 34,259 13,329 2.7%
61-65 92 6,854 18,765 25,711 10,101 2.0%
66-70 73 4,841 13,277 18,191 7,677 1.5%
71-75 61 3,248 8,312 11,621 5,450 1.1%
76 and Over 103 4,239 10,949 15,291 8,878 1.8%
Not Stated 6 1,443 7,825 9,274 7,918 1.6%
Total 1,668 134,974 364,700 501,342 251,809 50.2%
From Date 01/01/2015
To Date 12/31/2015
County(s) All Counties
*Notes: - Drivers include operators of motorized and non-motorized units
- Age 0 consists of occupants under 12 months
Table Data: Drivers; does not include Parked Units
- Percent in Error = Drivers In Error / Total * 100
Report generated on : 5/18/2016 11:50:31 AM
Table 4.01 - Driver StatisticsDrivers in Crashes by Age Group

Age Group Fatal Injury Property Damage
Total
0-15* 7 636 1,544 2,187
16-20 105 8,802 23,678 32,585
21-25 137 9,404 25,885 35,426
26-30 126 7,641 21,228 28,995
31-35 100 6,652 18,314 25,066
36-40 84 5,794 15,952 21,830
41-45 107 5,680 16,038 21,825
46-50 107 5,592 15,980 21,679
51-55 125 5,902 16,358 22,385
56-60 103 5,206 14,795 20,104
61-65 69 3,932 11,066 15,067
66-70 54 2,730 7,841 10,625
71-75 46 1,841 4,716 6,603
76 and Over 69 2,416 6,180 8,665
Not Stated 1 334 1,455 1,790
Total 1,240 72,562 201,030 274,832
From Date 01/01/2015
To Date 12/31/2015
County(s) All Counties
*Notes: - Drivers include operators of motorized and non-motorized units
- Age 0 consists of occupants under 12 months
Table Data: Male Drivers; does not include Parked Units
Report generated on : 5/18/2016 11:50:32 AM
Table 4.02 - Driver StatisticsMale Drivers in Crashes by Age Group

Age Group Fatal Injury Property Damage
Total
0-15* 2 267 729 998
16-20 51 8,043 19,557 27,651
21-25 56 8,738 21,708 30,502
26-30 38 6,919 16,735 23,692
31-35 39 5,885 14,054 19,978
36-40 36 4,846 12,261 17,143
41-45 32 4,800 11,637 16,469
46-50 25 4,436 11,299 15,760
51-55 29 4,462 11,241 15,732
56-60 19 3,940 10,191 14,150
61-65 23 2,922 7,697 10,642
66-70 19 2,110 5,430 7,559
71-75 15 1,407 3,594 5,016
76 and Over 34 1,821 4,755 6,610
Not Stated 0 126 634 760
Total 418 60,722 151,522 212,662
From Date 01/01/2015
To Date 12/31/2015
County(s) All Counties
*Notes: - Drivers include operators of motorized and non-motorized units
- Age 0 consists of occupants under 12 months
Table Data: Female Drivers; does not include Parked Units
Report generated on : 5/18/2016 11:50:33 AM
Table 4.03 - Driver StatisticsFemale Drivers in Crashes by Age Group

Male Female Not Stated Total
Not Insured 50,976 35,488 8,183 94,647
Insured 221,627 176,405 446 398,478
Total 272,603 211,893 8,629 493,125
From Date 01/01/2015
To Date 12/31/2015
County(s) All Counties
Tabel Data: Drivers; does not include Parked Units; does not include Non-Motorist Unit Types (Animal w/Rider, Animal w/Buggy, Bicycle, Pedestrian, Pedalcyclist, Skater, Other Non-Motorist or Unknown non-Motorist)
Report generated on : 5/18/2016 11:50:35 AM
Table 4.05 - Driver StatisticsFinancial Responsibility of Drivers in Crashes by Gender

Age Group Number of Uninsured Drivers
Percent of Total Uninsured Drivers
Uninsured Drivers in Error
Percent of Uninsured in Error
By Age Grp
Percent of Uninsured Drivers
in Error0-15* 6,113 6.5% 5,658 92.6% 6.0%
16-20 10,197 10.8% 7,727 75.8% 8.2%
21-25 15,252 16.1% 10,717 70.3% 11.3%
26-30 11,734 12.4% 7,807 66.5% 8.2%
31-35 9,174 9.7% 5,838 63.6% 6.2%
36-40 7,157 7.6% 4,398 61.5% 4.6%
41-45 6,206 6.6% 3,561 57.4% 3.8%
46-50 5,730 6.1% 3,223 56.2% 3.4%
51-55 5,389 5.7% 2,940 54.6% 3.1%
56-60 4,412 4.7% 2,327 52.7% 2.5%
61-65 2,844 3.0% 1,461 51.4% 1.5%
66-70 1,746 1.8% 963 55.2% 1.0%
71-75 1,146 1.2% 629 54.9% 0.7%
76 and Over 1,711 1.8% 1,131 66.1% 1.2%
Not Stated 5,836 6.2% 4,995 85.6% 5.3%
Total 94,647 100.0% 63,375 67.0%
Average 64.3%
From Date 01/01/2015
To Date 12/31/2015
County(s) All Counties
Table Data: Uninsured Drivers; does not include Parked Units; does not include Non-Motorist Unit Types (Animal w/Rider, Animal w/Buggy, Bicycle, Pedestrian, Pedalcyclist, Skater, Other Non-Motorist or Unknown Non-Motorist)
-Percent of Total Uninsured Drivers = Uninsured Drivers / Total Number of Uninsured Drivers * 100-Percent of Uninsured In Error by Age Grp = Uninsured Drivers In Error / Number of Uninsured Drivers * 100-Percent of Uninsured Drivers In Error = Uninsured Drivers In Error / Total Number of Uninsured Drivers * 100
Report generated on : 5/18/2016 11:50:42 AM
Table 4.06 - Driver StatisticsNo Proof of Insurance Shown in Crashes by Age Group

Condition Fatal Injury Property Damage
Total
Apparently Normal 1,242 124,870 351,551 477,663
Physical Impairment 11 812 752 1,575
Emotional (E.G., Depressed, Angry, Disturbed) 11 853 715 1,579
Illness 15 727 342 1,084
Fell Asleep, Fainted, Fatigued, Etc 20 1,451 1,550 3,021
Under the Influence of Medications/Drugs/Alcohol 225 4,924 6,099 11,248
Other 144 1,337 3,691 5,172
Unknown 0 0 0 0
Total 1,668 134,974 364,700 501,342
From Date 01/01/2015
To Date 12/31/2015
County(s) All Counties
*Notes: - Drivers include operators of motorized and non-motorized units
Table Data: Drivers
Report generated on : 5/18/2016 11:50:47 AM
Table 4.07 - Driver StatisticsCondition of Drivers in Crashes
Fatal Injury Property Damage Total
No Distraction Reported
0-15 13 1,531 8,450 9,994
16-20 147 15,270 40,006 55,423
21-25 178 16,741 44,807 61,726
26-30 157 13,564 35,989 49,710
31-35 131 11,787 30,953 42,871
36-40 115 10,026 27,093 37,234
41-45 136 9,978 26,649 36,763
46-50 127 9,534 26,334 35,995
51-55 148 9,884 26,666 36,698
56-60 120 8,769 24,160 33,049
61-65 89 6,581 18,181 24,851
66-70 71 4,666 12,817 17,554
71-75 59 3,128 8,070 11,257
76 & Over 102 4,073 10,606 14,781
Not Stated 6 1,406 7,720 9,132
Total 1,599 126,938 348,501 477,038
Phone
0-15 0 6 29 35
16-20 1 173 304 478
21-25 3 205 353 561
26-30 2 149 251 402
31-35 3 93 192 288
36-40 2 77 141 220
41-45 0 72 99 171
46-50 0 53 108 161
From Date 01/01/2015
To Date 12/31/2015
County(s) All Counties
Report generated on : 5/18/2016 11:50:57 AM Page 1 of 5
Driver Distraction 1 by Age Groups
Table 4.08 - Driver Statistics

Fatal Injury Property Damage Total
Phone
51-55 1 49 94 144
56-60 0 36 71 107
61-65 0 24 57 81
66-70 0 20 35 55
71-75 1 8 16 25
76 & Over 0 6 23 29
Not Stated 0 10 16 26
Total 13 981 1,789 2,783
Texting/Emailing
0-15 0 1 3 4
16-20 0 42 55 97
21-25 2 36 55 93
26-30 0 22 50 72
31-35 0 28 33 61
36-40 1 11 17 29
41-45 0 10 16 26
46-50 0 5 11 16
51-55 0 1 16 17
56-60 0 0 5 5
61-65 0 1 1 2
66-70 0 0 3 3
76 & Over 0 0 1 1
Not Stated 0 2 5 7
Total 3 159 271 433
Electronic Communication Device
0-15 0 1 5 6
16-20 0 23 35 58
21-25 0 18 42 60
26-30 0 11 25 36
Report generated on : 5/18/2016 11:50:58 AM Page 2 of 5
Driver Distraction 1 by Age Groups
Table 4.08 - Driver Statistics

Fatal Injury Property Damage Total
Electronic Communication Device
31-35 0 15 22 37
36-40 0 21 14 35
41-45 0 6 23 29
46-50 1 6 17 24
51-55 0 8 8 16
56-60 0 3 8 11
61-65 0 1 0 1
66-70 0 4 5 9
71-75 0 1 0 1
76 & Over 0 2 4 6
Not Stated 0 0 2 2
Total 1 120 210 331
Other Electronic Device (navigation device, DVD player, Radio etc.)
0-15 1 6 2 9
16-20 0 189 390 579
21-25 0 138 293 431
26-30 1 87 151 239
31-35 1 55 94 150
36-40 0 35 84 119
41-45 0 40 60 100
46-50 0 22 49 71
51-55 1 23 51 75
56-60 0 14 43 57
61-65 1 11 22 34
66-70 0 4 16 20
71-75 0 3 9 12
76 & Over 0 5 11 16
Not Stated 0 1 0 1
Total 5 633 1,275 1,913
Report generated on : 5/18/2016 11:50:58 AM Page 3 of 5
Driver Distraction 1 by Age Groups
Table 4.08 - Driver Statistics

Fatal Injury Property Damage Total
Other Inside the Vehicle
0-15 0 6 22 28
16-20 4 504 1,010 1,518
21-25 2 472 856 1,330
26-30 1 362 669 1,032
31-35 1 269 495 765
36-40 1 222 362 585
41-45 1 150 318 469
46-50 3 177 302 482
51-55 1 156 276 433
56-60 0 128 244 372
61-65 0 92 190 282
66-70 2 62 144 208
71-75 1 46 76 123
76 & Over 0 58 117 175
Not Stated 0 3 7 10
Total 17 2,707 5,088 7,812
External Distraction (outside the vehicle)
0-15 0 24 34 58
16-20 3 353 754 1,110
21-25 3 300 662 965
26-30 2 207 477 686
31-35 2 178 333 513
36-40 1 159 321 481
41-45 0 138 321 459
46-50 0 143 298 441
51-55 0 148 297 445
56-60 0 122 299 421
61-65 2 91 235 328
66-70 0 62 205 267
Report generated on : 5/18/2016 11:50:58 AM Page 4 of 5
Driver Distraction 1 by Age Groups
Table 4.08 - Driver Statistics

Fatal Injury Property Damage Total
External Distraction (outside the vehicle)
71-75 0 52 118 170
76 & Over 0 88 173 261
Not Stated 0 2 14 16
Total 13 2,067 4,541 6,621
Report generated on : 5/18/2016 11:50:58 AM Page 5 of 5
Driver Distraction 1 by Age Groups
Table 4.08 - Driver Statistics

Fatal Injury Property Damage Total
No Distraction Reported
0-15 14 1,573 8,541 10,128
16-20 155 16,477 42,395 59,027
21-25 188 17,845 46,933 64,966
26-30 163 14,358 37,518 52,039
31-35 138 12,393 32,065 44,596
36-40 120 10,519 27,964 38,603
41-45 137 10,369 27,419 37,925
46-50 131 9,910 27,073 37,114
51-55 151 10,252 27,359 37,762
56-60 120 9,058 24,789 33,967
61-65 92 6,788 18,650 25,530
66-70 73 4,811 13,202 18,086
71-75 61 3,233 8,272 11,566
76 & Over 102 4,222 10,914 15,238
Not Stated 6 1,420 7,759 9,185
Total 1,651 133,228 360,853 495,732
Phone
0-15 0 0 2 2
16-20 0 6 12 18
21-25 0 6 7 13
26-30 0 4 8 12
31-35 0 4 4 8
36-40 0 2 6 8
41-45 0 2 5 7
46-50 0 4 1 5
From Date 01/01/2015
To Date 12/31/2015
County(s) All Counties
Report generated on : 5/18/2016 11:51:05 AM Page 1 of 4
Driver Distraction 2 by Age Groups
Table 4.08A - Driver Statistics

Fatal Injury Property Damage Total
Phone
51-55 0 2 3 5
56-60 0 2 3 5
61-65 0 1 2 3
66-70 0 0 3 3
71-75 0 0 5 5
76 & Over 0 1 2 3
Not Stated 0 1 1 2
Total 0 35 64 99
Texting/Emailing
16-20 0 8 7 15
21-25 0 9 14 23
26-30 0 2 6 8
31-35 0 1 3 4
36-40 0 4 5 9
41-45 0 0 4 4
46-50 0 1 4 5
51-55 0 1 1 2
56-60 0 0 2 2
61-65 0 1 6 7
66-70 0 1 1 2
71-75 0 0 2 2
Not Stated 0 0 1 1
Total 0 28 56 84
Electronic Communication Device
16-20 0 2 6 8
21-25 0 2 5 7
26-30 0 0 4 4
31-35 0 2 4 6
36-40 0 1 4 5
Report generated on : 5/18/2016 11:51:05 AM Page 2 of 4
Driver Distraction 2 by Age Groups
Table 4.08A - Driver Statistics

Fatal Injury Property Damage Total
Electronic Communication Device
41-45 0 1 2 3
51-55 0 0 2 2
56-60 0 1 0 1
61-65 0 0 2 2
66-70 0 0 1 1
71-75 0 1 0 1
76 & Over 0 1 1 2
Total 0 11 31 42
Other Electronic Device (navigation device, DVD player, Radio etc.)
0-15 0 1 0 1
16-20 0 2 5 7
21-25 0 6 10 16
26-30 0 1 2 3
31-35 0 4 0 4
36-40 0 2 3 5
41-45 0 0 2 2
46-50 0 1 0 1
61-65 0 0 2 2
66-70 0 0 1 1
76 & Over 0 1 0 1
Total 0 18 25 43
Other Inside the Vehicle
0-15 0 1 0 1
16-20 0 10 17 27
21-25 0 7 19 26
26-30 0 6 18 24
31-35 0 7 7 14
36-40 0 4 13 17
41-45 0 2 17 19
Report generated on : 5/18/2016 11:51:05 AM Page 3 of 4
Driver Distraction 2 by Age Groups
Table 4.08A - Driver Statistics

Fatal Injury Property Damage Total
Other Inside the Vehicle
46-50 0 1 7 8
51-55 0 3 8 11
56-60 0 3 4 7
61-65 0 1 5 6
66-70 0 0 4 4
71-75 0 1 2 3
76 & Over 0 1 4 5
Not Stated 0 1 1 2
Total 0 48 126 174
External Distraction (outside the vehicle)
0-15 0 0 2 2
16-20 0 20 54 74
21-25 0 18 44 62
26-30 0 12 28 40
31-35 0 7 20 27
36-40 0 11 26 37
41-45 0 10 25 35
46-50 0 13 21 34
51-55 0 9 25 34
56-60 0 5 22 27
61-65 0 9 14 23
66-70 0 4 12 16
71-75 0 2 5 7
76 & Over 0 4 12 16
Not Stated 0 1 2 3
Total 0 125 312 437
Report generated on : 5/18/2016 11:51:05 AM Page 4 of 4
Driver Distraction 2 by Age Groups
Table 4.08A - Driver Statistics

Driver Distraction 1 Fatal Injury Property Damage
Total
No Distraction Reported 899 75,467 407,888 484,254
Phone 8 574 2,212 2,794
Texting/Emailing 1 108 324 433
Electronic Communication Device 1 77 255 333
Other Electronic Device (navigation device, DVD player, Radio etc.)
1 322 1,595 1,918
Other Inside the Vehicle 3 1,380 6,430 7,813
External Distraction (outside the vehicle) 1 1,062 5,579 6,642
Total 914 78,990 424,283 504,187
From Date 01/01/2015
To Date 12/31/2015
County(s) All Counties
Driver Distraction 2 Fatal Injury Property Damage
Total
No Distraction Reported 914 78,847 423,545 503,306
Phone 0 20 79 99
Texting/Emailing 0 15 69 84
Electronic Communication Device 0 7 36 43
Other Electronic Device (navigation device, DVD player, Radio etc.)
0 13 31 44
Other Inside the Vehicle 0 23 151 174
External Distraction (outside the vehicle) 0 65 372 437
Total 914 78,990 424,283 504,187
Report generated on : 5/18/2016 11:51:09 AM
Table 4.09 - Driver StatisticsDriver Distraction by Crash Severity

Unit Type Fatal Crashes Injury Crashes Property Damage
Total Percent of Total
Sub-Compact 15 1,771 5,384 7,170 1.32 %
Compact 171 17,875 50,997 69,043 12.67 %
Mid Size 357 42,979 119,745 163,081 29.94 %
Full Size 128 12,198 34,022 46,348 8.51 %
Minivan 75 6,911 18,164 25,150 4.62 %
Sport Utility Vehicle 273 28,859 81,913 111,045 20.38 %
Pickup 230 14,743 45,113 60,086 11.03 %
Van 26 2,726 8,215 10,967 2.01 %
Passenger Vehicles - Subtotal 1,275 128,062 363,553 492,890 90.48 %
Motorized Bicycle 1 55 19 75 0.01 %
Snowmobile/ATV 17 154 48 219 0.04 %
Other Passenger Vehicle 4 168 584 756 0.14 %
Other Passenger Vehicles - Subtotal 22 377 651 1,050 0.19 %
Motorcycle 167 2,935 812 3,914 0.72 %
Motorcycle - Subtotal 167 2,935 812 3,914 0.72 %
Single Unit Truck or Van 2 axle, 6 tires 27 1,116 4,543 5,686 1.04 %
Single Unit Truck; 3+ axles 24 546 1,958 2,528 0.46 %
Single Unit Truck / Trailer 12 357 1,573 1,942 0.36 %
Truck/Tractor (Bobtail) 2 100 366 468 0.09 %
Tractor/Semi-Trailer 139 2,314 9,106 11,559 2.12 %
Tractor/Doubles 3 65 183 251 0.05 %
Tractor/Triples 1 4 40 45 0.01 %
Other Med/Heavy Vehicle 14 318 1,385 1,717 0.32 %
Med / Heavy Trucks - Subtotal 222 4,820 19,154 24,196 4.44 %
Bus /Van (9-15 seats inc Driver) 2 252 938 1,192 0.22 %
Bus (16+ Seats, Inc Driver) 2 468 1,931 2,401 0.44 %
Bus / Van / Limo - Subtotal 4 720 2,869 3,593 0.66 %
Animal with Rider 0 2 1 3 0.00 %
Animal with Buggy, Wagon, Surrey 3 68 71 142 0.03 %
Bicycle/Pedacyclist 29 1,273 206 1,508 0.28 %
Pedestrian/Skater 136 2,511 165 2,812 0.52 %
Other Non-Motorist 0 41 39 80 0.01 %
Non-Motorist - Subtotal 168 3,895 482 4,545 0.83 %
Unknown or Hit/Skip 10 1,553 12,989 14,552 2.67 %
Unknown - Subtotal 10 1,553 12,989 14,552 2.67 %
Total - All Unit Types 544,740 100.00 %
From Date 01/01/2015
To Date 12/31/2015
County(s) All Counties
These are the number of units involved in crashes, not total crashes.
Report generated on : 5/18/2016 11:51:10 AM Page 1 of 1
Types of Units Involved* in Crashes
Table 5.01 - Unit Statistics

From Date 01/01/2015
To Date 12/31/2015
County(s) All Counties
These are the number of units involved in crashes, not total crashes.
Unit Type Fatal Crashes
Injury Crashes
Property Damage
Total Percent of Total
Ambulance 3 103 453 559 0.10 %
Fire 0 97 432 529 0.10 %
Police 7 446 1,759 2,212 0.41 %
Public Safety - Subtotal 10 646 2,644 3,300 0.61 %
Taxi 1 324 871 1,196 0.22 %
Bus – Transit 0 244 747 991 0.18 %
Train 6 20 35 61 0.01 %
Public Transportation - Subtotal 7 588 1,653 2,248 0.41 %
Bus – School (public or private) 0 247 1,268 1,515 0.28 %
Bus – Charter 0 22 78 100 0.02 %
Bus – Shuttle 0 50 183 233 0.04 %
Bus – Other 3 45 185 233 0.04 %
Other Transportation - Subtotal 3 364 1,714 2,081 0.38 %
Highway/Maintenance 8 164 753 925 0.17 %
Military 0 4 28 32 0.01 %
Public Utility 3 150 784 937 0.17 %
Other Government 2 256 1,190 1,448 0.27 %
Government / Utility Vehicle - Subtotal 13 574 2,755 3,342 0.61 %
Farm Vehicle 5 101 285 391 0.07 %
Farm Equipment 1 46 149 196 0.04 %
Farm - Subtotal 6 147 434 587 0.11 %
Rental Trucks (over 10,000 lbs) 1 105 531 637 0.12 %
Construction Equip. 7 317 1,317 1,641 0.30 %
Motorhome 1 15 89 105 0.02 %
Golf Cart 0 15 6 21 0.00 %
Other (explain in narrative) 18 727 2,540 3,285 0.60 %
Other - Subtotal 27 1,179 4,483 5,689 1.04 %
None 1,802 138,864 386,827 527,493 96.83 %
None - Subtotal 1,802 138,864 386,827 527,493 96.83 %
Total - All Unit Types 544,740 100.00 %
Report generated on : 5/18/2016 11:51:11 AM Page 1 of 1
Special Function Units Involved* in Crashes
Table 5.01A - Unit Statistics

Seating Position Fatal Injury Incapacitating Injury
Non - Incapacitating
Injury
Possible Injury
No Injury Not Stated / Unknown
Total Occupants
Front Seat – Left Side (Motorcycle Driver)
775 6,466 30,635 39,118 422,954 0 499,948
Front Seat – Middle 3 28 134 170 1,303 0 1,638
Front Seat – Right Side 119 1,229 6,408 9,277 72,629 0 89,662
Second Seat – Left Side (Motorcycle Passenger)
34 337 1,389 2,622 22,780 0 27,162
Second Seat – Middle 9 62 355 719 6,393 0 7,538
Second Seat – Right Side 17 256 1,463 2,891 25,832 0 30,459
Third – Left Side (Motorcycle Side Car)
0 16 95 186 2,110 0 2,407
Third – Middle 2 6 37 88 817 0 950
Third – Right Side 3 10 96 218 1,961 0 2,288
Sleeper Section Of Cab (Truck) 0 5 20 1 286 0 312
Passenger In Other Enclosed Cargo Area (Non Trailing Unit Such As A Bus, Pick-up with Cap)
0 7 126 328 8,898 0 9,359
Passenger In Unenclosed Cargo Area
1 5 14 8 74 0 102
Trailing Unit 0 0 2 2 20 0 24
Riding On Vehicle Exterior (Non-Trailing Unit)
2 8 11 9 44 0 74
Non-Motorist 133 564 1,374 917 674 0 3,662
Other 2 16 85 90 3,126 0 3,319
Unknown 10 30 89 184 4,516 0 4,829
Total 1,110 9,045 42,333 56,828 574,417 0 683,733
From Date 01/01/2015
To Date 12/31/2015
County(s) All Counties
Table Data : All unit-types included
Report generated on : 5/18/2016 11:51:15 AM
Deaths and Injuries by Position in Unit
Table 5.02 - Unit Statistics

Motorist Non-Motorist Unknown
Age Group Passenger Vehicle Other Passenger Vehicle
MotorCycle Med / Heavy Trucks
Bus / Van / Limo Non-Motorist Unknown Total
0-15* 6,287 69 42 358 39 975 2974 10,744
16-20 59,303 93 197 277 25 600 91 60,586
21-25 63,447 101 442 1,471 166 482 160 66,269
26-30 49,877 92 400 1,909 204 351 93 52,926
31-35 42,237 55 314 2,016 236 293 92 45,243
36-40 36,066 70 276 2,198 241 244 73 39,168
41-45 34,616 90 378 2,695 372 220 80 38,451
46-50 33,533 81 427 2,860 402 249 64 37,616
51-55 33,965 73 454 2,973 501 305 62 38,333
56-60 30,502 81 349 2,633 544 249 56 34,414
61-65 23,505 47 244 1,449 390 162 25 25,822
66-70 17,183 35 152 570 202 92 23 18,257
71-75 11,139 25 70 281 82 65 10 11,672
76 and Over 15,025 24 26 137 38 80 28 15,358
Not Stated 5,443 20 39 947 29 62 2788 9,328
Total 462,128 956 3,810 22,774 3,471 4,429 6,619 504,187
From Date 01/01/2015
To Date 12/31/2015
County(s) All Counties
Table Data : All unit-types included; drivers and Pedestrians; Pre-Crash Action of Parked not included.
Note : These are number of units involved in crashes, not total crashes or people.
Report generated on : 5/18/2016 11:51:17 AM
Drivers and Pedestrians in All Crashes by Age and Unit Type
Table 5.03 - Unit Statistics

Motorist Non-Motorist Unknown
Age Group Passenger Vehicle
Other Passenger
Vehicle
MotorCycle Med / Heavy Trucks
Bus / Van / Limo Non-Motorist Unknown Total
0-15* 6 1 0 0 0 14 1 22
16-20 144 2 7 0 0 15 0 168
21-25 159 3 15 13 0 13 0 203
26-30 130 1 20 11 1 7 1 171
31-35 109 0 9 20 0 14 0 152
36-40 90 1 8 18 1 14 0 132
41-45 86 3 15 33 0 15 0 152
46-50 82 2 23 21 0 15 0 143
51-55 98 1 22 28 0 21 0 170
56-60 69 3 25 23 0 14 0 134
61-65 59 2 8 22 1 8 0 100
66-70 56 1 8 4 1 8 0 78
71-75 50 1 5 4 0 6 0 66
76 and Over 96 1 2 4 0 4 0 107
Not Stated 2 0 0 2 0 0 2 6
Total 1,236 22 167 203 4 168 4 1,804
From Date 01/01/2015
To Date 12/31/2015
County(s) All Counties
Table Data : All unit-types included; drivers and Pedestrians; Pre-Crash Action of Parked not included.
Note : These are number of units involved in crashes, not total crashes or people.
Report generated on : 5/18/2016 11:51:21 AM
Drivers and Pedestrians in Fatal Crashes by Age and Unit Type
Table 5.04 - Unit Statistics

Number Killed Percent of Deaths
Number Injured
Percent of Injuries
Motorists / Non-Motorists
DRIVERS
Passenger Vehicles 567 51.1 % 70,555 65.1 %
Med / Heavy Trucks 32 2.9 % 1,295 1.2 %
Bus / Van / Limo 0 0.0 % 194 0.2 %
Non-Motorist 26 2.3 % 1,275 1.2 %
Unknown 1 0.1 % 66 0.1 %
Motorcycle 152 13.7 % 2,824 2.6 %
Other Passenger Vehicles 18 1.6 % 270 0.2 %
Total 796 71.7 % 76,479 70.6 %
PASSENGERS
Passenger Vehicles 177 15.9 % 27,857 25.7 %
Med / Heavy Trucks 1 0.1 % 260 0.2 %
Bus / Van / Limo 2 0.2 % 710 0.7 %
Non-Motorist 1 0.1 % 127 0.1 %
Unknown 0 0.0 % 42 0.0 %
Motorcycle 11 1.0 % 323 0.3 %
Other Passenger Vehicles 4 0.4 % 85 0.1 %
Total 196 17.7 % 29,404 27.1 %
PEDESTRIANS
Non-Motorist 118 10.6 % 2,511 2.3 %
Total 118 10.6 % 2,511 2.3 %
Grand Total 1,110 100.0 % 108,394 100.0 %
From Date 01/01/2015
To Date 12/31/2015
County(s) All Counties
Report generated on : 5/18/2016 11:51:24 AM
Drivers, Passengers and Pedestrians Killed and Injured
Table 5.05 - Unit Statistics

Crashes Involving Trucks Crashes Caused by Truck Drivers
Percent in Error
Fatal Injury 149 54 36.2 %
Injury 3,453 1,825 52.9 %
Property Damage Only (PDO) 13,270 8,048 60.6 %
Total 16,872 9,927 58.8 %
From Date 01/01/2015
To Date 12/31/2015
County(s) All Counties
Table Data : Unit Type: Single Unit Truck; 2 Axles, 6 Tires, Single Unit Truck; 3 or more Axles, truck/Trailer, Truck Tractor (Bobtail), Tractor/Semi-Trailer, Tractor/Double - Short, Tractor/Double - Long, Fifth Wheel or Converter Dolly, Tractor/Triples.
Deaths 161 56 34.8 %
Injuries 4,877 2,487 51.0 %
Report generated on : 5/18/2016 11:51:25 AM
Crashes, Deaths and Injuries by Truck Drivers in Error
Table 5.06 - Unit Statistics

Crashes Crashes Caused by Truck Drivers
Percent in Error
Fatal Injury 181 62 34.3 %
Injury 4,454 2,278 51.1 %
Property Damage Only (PDO) 17,855 10,726 60.1 %
Total Crashes 22,490 13,066 58.1 %
Tractor-Trailer Occupant Deaths 33 30 90.9 %
Other Deaths* 161 34 21.1 %
Total Deaths 194 64 33.0 %
Tractor-Trailer Occupant Injuries 1,555 1,029 66.2 %
Other Injuries* 4,763 2,097 44.0 %
Total Injuries 6,318 3,126 49.5 %
From Date 01/01/2015
To Date 12/31/2015
County(s) All Counties
Note: Other deaths and injuries include occupants in vehicles other than Tractor-Trailer and Pedestrians.
Table Data: Unit Type: truck Tractor (Bobtail), Tractor/Semi-Trailer, Tractor/Double - Short, Tractor/Double - Long, fifth Wheel or Converter Dolly, Tractor/Triples
Report generated on : 5/18/2016 11:51:28 AM
Heavy Truck Crashes
Table 5.07 - Unit Statistics

Crashes Deaths Injuries
Motorcycle 3,800 163 3,147
Total 3,800 163 3,147
From Date 01/01/2015
To Date 12/31/2015
County(s) All Counties
Note : Includes Motorcycles, but not Motorized Bicycles
Report generated on : 5/18/2016 11:51:28 AM
Table 5.08 - Unit StatisticsCrashes, Deaths and Injuries Involving Motorcycles
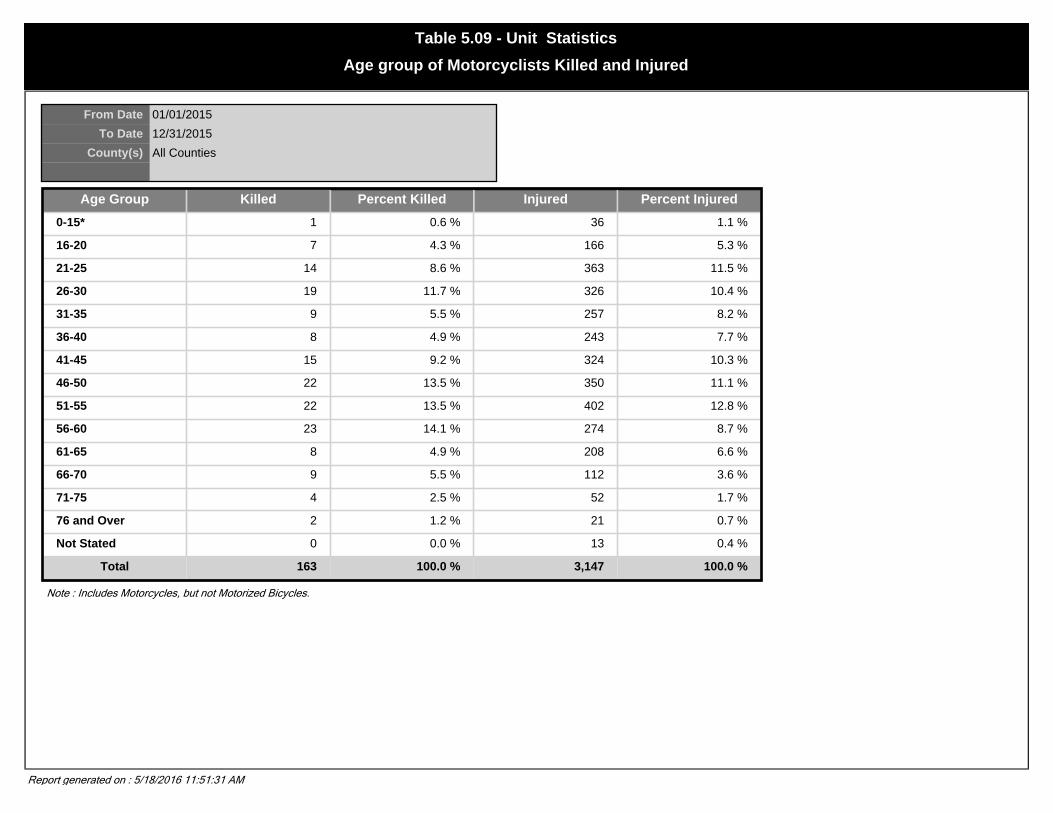
Age Group Killed Percent Killed Injured Percent Injured
0-15* 1 0.6 % 36 1.1 %
16-20 7 4.3 % 166 5.3 %
21-25 14 8.6 % 363 11.5 %
26-30 19 11.7 % 326 10.4 %
31-35 9 5.5 % 257 8.2 %
36-40 8 4.9 % 243 7.7 %
41-45 15 9.2 % 324 10.3 %
46-50 22 13.5 % 350 11.1 %
51-55 22 13.5 % 402 12.8 %
56-60 23 14.1 % 274 8.7 %
61-65 8 4.9 % 208 6.6 %
66-70 9 5.5 % 112 3.6 %
71-75 4 2.5 % 52 1.7 %
76 and Over 2 1.2 % 21 0.7 %
Not Stated 0 0.0 % 13 0.4 %
Total 163 100.0 % 3,147 100.0 %
From Date 01/01/2015
To Date 12/31/2015
County(s) All Counties
Note : Includes Motorcycles, but not Motorized Bicycles.
Report generated on : 5/18/2016 11:51:31 AM
Age group of Motorcyclists Killed and Injured
Table 5.09 - Unit Statistics
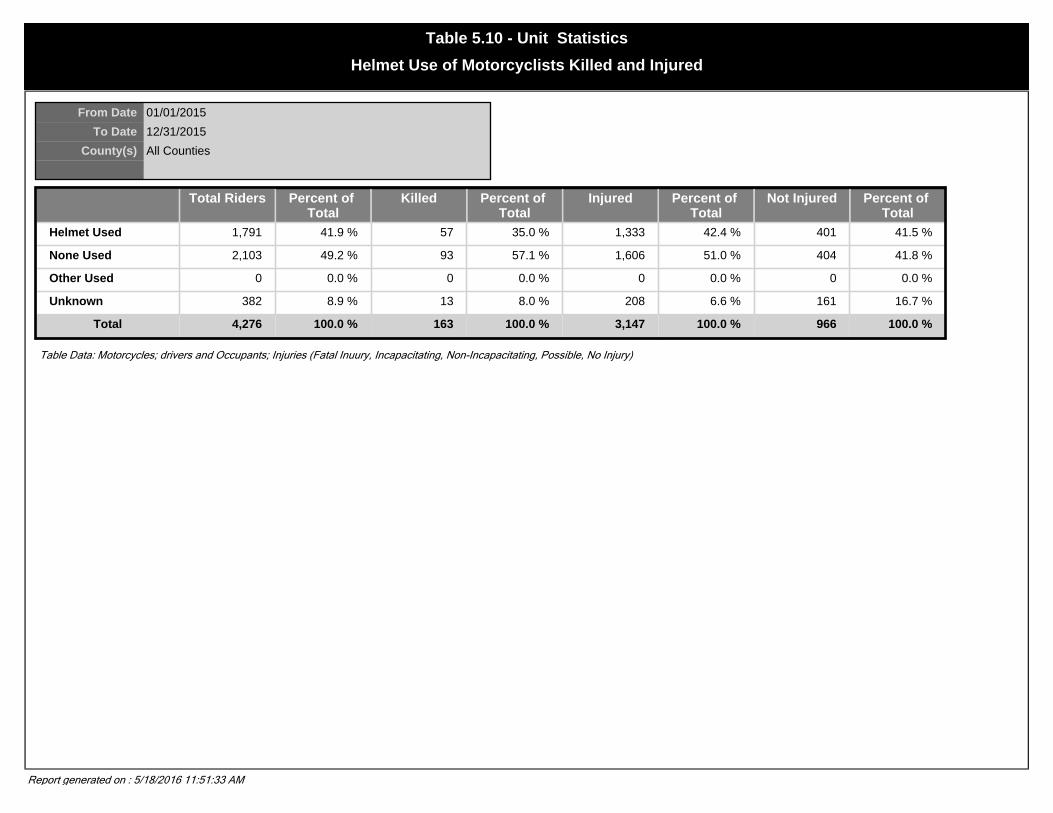
Total Riders Percent of Total
Killed Percent of Total
Injured Percent of Total
Not Injured Percent of Total
Helmet Used 1,791 41.9 % 57 35.0 % 1,333 42.4 % 401 41.5 %
None Used 2,103 49.2 % 93 57.1 % 1,606 51.0 % 404 41.8 %
Other Used 0 0.0 % 0 0.0 % 0 0.0 % 0 0.0 %
Unknown 382 8.9 % 13 8.0 % 208 6.6 % 161 16.7 %
Total 4,276 100.0 % 163 100.0 % 3,147 100.0 % 966 100.0 %
From Date 01/01/2015
To Date 12/31/2015
County(s) All Counties
Table Data: Motorcycles; drivers and Occupants; Injuries (Fatal Inuury, Incapacitating, Non-Incapacitating, Possible, No Injury)
Report generated on : 5/18/2016 11:51:33 AM
Helmet Use of Motorcyclists Killed and Injured
Table 5.10 - Unit Statistics

Person in Error Fatal Injury Property Damage
Total Percent of Total
Motorcycle Drivers 94 1,609 363 2,066 54.4 %
Non-Motorcycle Drivers 55 964 346 1,365 35.9 %
Pedestrian 0 6 0 6 0.2 %
Animal 3 143 40 186 4.9 %
Error Not Determined / Not Stated 6 123 48 177 4.7 %
Total 158 2,845 797 3,800 100.0 %
From Date 01/01/2015
To Date 12/31/2015
County(s) All Counties
Table Data: Crashes Involving Motorcycles
Report generated on : 5/18/2016 11:51:39 AM
Persons in Error in Motorcycle Crashes
Table 5.11 - Unit Statistics

Age Fatal Injury Incapacitating Injury
Non-Incapacitating
Injury
Possible Injury
No Injury Non Reported
Not Stated / Unknown
Total
0-5* 0 2 2 5 11 0 20
06-10 2 13 62 36 17 0 130
11-15 3 29 137 77 42 0 288
16-20 2 24 117 57 31 0 231
21-25 3 15 68 46 21 0 153
26-30 0 13 55 25 18 0 111
31-35 1 6 44 27 9 0 87
36-40 1 8 26 16 4 0 55
41-45 1 8 29 20 6 0 64
46-50 2 17 28 20 9 0 76
51-55 5 11 40 23 9 0 88
56-60 1 10 44 24 6 0 85
61-65 0 8 18 15 5 0 46
66-70 3 5 11 5 0 0 24
71-75 1 2 4 1 1 0 9
76 and Over 0 1 4 3 1 0 9
Not Stated 0 0 0 2 9 0 11
Total 25 172 689 402 199 0 1,487
From Date 01/01/2015
To Date 12/31/2015
County(s) All Counties
This data represents bicycles and pedalcycle deaths and injuries only, and does not include other unit type deaths and injuries involved in bicycle and pedalcycle crashes.
Report generated on : 5/18/2016 11:51:42 AM
Bicycle Deaths and Injuries by Age
Table 5.12 - Unit Statistics

Crashes Involving Bicycles Bicycle*
Population Group Fatal Injury Property Damage
Total Crashes Deaths Injuries
Under 1,000 1 8 1 10 1 8
1,000 to 2,499 4 35 4 43 4 35
2,500 to 4,999 4 62 9 75 4 62
5,000 to 9,999 3 93 6 102 3 93
10,000 to 24,999 3 246 41 290 4 246
25,000 to 49,999 3 201 42 246 3 201
50,000 and Over 6 607 97 710 6 607
Total 24 1,252 200 1,476 25 1,252
From Date 01/01/2015
To Date 12/31/2015
County(s) All Counties
This data represents bicycles and pedalcycle deaths and injuries only, and does not include other unit type deaths and injuries involved in bicycle and pedalcycle crashes.
Report generated on : 5/18/2016 11:51:43 AM
Bicycle Crashes, Deaths and Injuries by Population Group
Table 5.13 - Unit Statistics

Crashes Involving Bicycles Bicycle*
Light Condition Fatal Injury Property Damage
Total Crashes Deaths Injuries
Daylight 12 963 156 1,131 13 963
Dawn 1 16 1 18 1 16
Dusk 0 36 5 41 0 36
Dark - Lighted Roadway
5 166 24 195 5 166
Dark - Roadway Not Lighted
6 42 9 57 6 42
Dark - Unknown Roadway Lighting
0 7 1 8 0 7
Glare 0 0 0 0 0 0
Other 0 0 0 0 0 0
Unknown 0 22 4 26 0 22
Total 24 1,252 200 1,476 25 1,252
From Date 01/01/2015
To Date 12/31/2015
County(s) All Counties
This data represents bicycles and pedalcycle deaths and injuries only, and does not include other unit type deaths and injuries involved in bicycle and pedalcycle crashes.
Report generated on : 5/18/2016 11:51:45 AM
Bicycle Crashes, Deaths and Injuries by Primary Light Condition
Table 5.14 - Unit Statistics

School Bus Related Crashes Total Crashes
Not Involved 32
Directly Involved 1,275
InDirectly Involved 12
Total 1,319
From Date 01/01/2015
To Date 12/31/2015
County(s) All Counties
Report generated on : 5/18/2016 11:51:45 AM
School Bus Crashes
Table 5.16 - Unit Statistics

Type of Crash
Fatal Injury 0
Injury 201
Property Damage Only (PDO) 1,118
Total Crashes 1,319
From Date 01/01/2015
To Date 12/31/2015
County(s) All Counties
Deaths Injuries
Passengers of School Bus 0 289
Other Drivers, Passengers and Pedestrians 0 153
Who was in Error
School Bus Driver 607
Other Driver 588
Animal 13
No Error 108
Not Stated 0
Pedestrian 3
Report generated on : 5/18/2016 11:51:51 AM
Crashes, Deaths and Injuries Involving School Buses
Table 5.17 - Unit Statistics

First Harmful Event Frequency Percent of Total
Overturn/Rollover 0 0.0 %
Fire/Explosion 0 0.0 %
Immersion 0 0.0 %
Jackknife 0 0.0 %
Cargo/Equipment Loss Or Shift 0 0.0 %
Equipment Failure (Blown Tire, Brake Failure, Etc) 0 0.0 %
Separation Of Units 0 0.0 %
Ran Off Road Right 9 1.5 %
Ran Off Road Left 1 0.2 %
Cross Median 0 0.0 %
Cross Centerline Opposite Direction of Travel 5 0.8 %
Downhill Runaway 0 0.0 %
Other Non-Collision 2 0.3 %
Pedestrian 3 0.5 %
Pedalcycle 1 0.2 %
Railway Vehicle (E.G. Train, Engine) 0 0.0 %
Animal – Farm 1 0.2 %
Animal – Deer 1 0.2 %
Animal – Other 0 0.0 %
Motor Vehicle In Transport 307 50.6 %
Parked Motor Vehicle 202 33.3 %
Work Zone Maintenance Equipment 2 0.3 %
Struct by Falling, Shifting Cargo or Anything Set in Motion by a Motor Vehicle
0 0.0 %
Other Movable Object 3 0.5 %
Impact Attenuator/Crash Cushion 1 0.2 %
Bridge Overhead Structure 0 0.0 %
Bridge Pier Or Abutment 0 0.0 %
Bridge Parapet 0 0.0 %
Bridge Rail 0 0.0 %
Guardrail Face 6 1.0 %
Guardrail End 3 0.5 %
Portable Barrier 0 0.0 %
Median Cable Barrier 0 0.0 %
From Date 01/01/2015
To Date 12/31/2015
County(s) All Counties
Report generated on : 5/18/2016 11:51:53 AM Page 1 of 2
First Harmful Event in School Bus Crashes Caused by School Bus Drivers
Table 5.18 - Unit Statistics

First Harmful Event Frequency Percent of Total
Median Guardrail Barrier 0 0.0 %
Median Concrete Barrier 0 0.0 %
Median Other Barrier 0 0.0 %
Traffic Sign Post 4 0.7 %
Overhead Sign Post 0 0.0 %
Light/Luminaries Support 2 0.3 %
Utility Pole 11 1.8 %
Other Post, Pole Or Support 5 0.8 %
Culvert 2 0.3 %
Curb 3 0.5 %
Ditch 9 1.5 %
Embankment 1 0.2 %
Fence 2 0.3 %
Mailbox 3 0.5 %
Tree 5 0.8 %
Wall, Building, Tunnel 6 1.0 %
Work Zone Maintenance Equipment 0 0.0 %
Fire Hydrant 0 0.0 %
Other Fixed Object 5 0.8 %
Not Stated 1 0.2 %
Unknown 1 0.2 %
Total 607 100.0 %
Report generated on : 5/18/2016 11:51:53 AM Page 2 of 2
First Harmful Event in School Bus Crashes Caused by School Bus Drivers
Table 5.18 - Unit Statistics

Population Group Fatal Crashes Injury Crashes Property Damage Crashes
Total Crashes Deaths Injuries
Under 1,000 0 1 2 3 0 1
1,000 to 2,499 2 3 5 10 2 4
2,500 to 4,999 0 3 5 8 0 5
5,000 to 9,999 2 3 7 12 3 3
10,000 to 24,999 0 11 3 14 0 12
25,000 to 49,999 0 5 11 16 0 5
50,000 and Over 0 3 13 16 0 4
Total 4 29 46 79 5 34
From Date 01/01/2015
To Date 12/31/2015
County(s) All Counties
Table Data : Unit Type of Train Involved or Sequence of Events includes Railway Vehicles.
Report generated on : 5/18/2016 11:51:55 AM
Motor Vehicle-Train Crashes by Population Area
Table 5.19 - Unit Statistics

Type of Warnings Fatal Crashes Injury Crashes Property Damage Crashes
Total Crashes Deaths Injuries
No Controls 6 14 22 42 0 4
Stop Sign 1 1 4 6 1 2
Yield Sign 0 1 0 1 0 1
Traffic Signal 0 4 8 12 0 2
Traffic Flashers 0 0 0 0 0 0
School Zone 0 0 0 0 0 0
Railroad Crossbucks 0 12 10 22 0 10
Railroad Flashers 0 3 5 8 0 2
Railroad Gates 3 11 15 29 4 8
Construction Barricade 0 0 2 2 0 0
Police Officer 0 0 3 3 0 0
Pavement Markings 0 5 12 17 0 5
Crosswalk Lines 0 0 0 0 0 0
Walk/Don’t Walk 0 0 0 0 0 0
Other 0 1 5 6 0 0
Not Reported 0 0 0 0 0 0
Total 10 52 86 148 5 34
From Date 01/01/2015
To Date 12/31/2015
County(s) All Counties
Table Data : Unit Type of Train Involved or Sequence of Events includes Railway Vehicles.
Report generated on : 5/18/2016 11:51:58 AM
Traffic Controls in Motor Vehicle - Train Crashes
Table 5.20 - Unit Statistics

Traffic Controls Fatal Crashes Injury Crashes Property Damage Crashes
Total Crashes
Stop Sign 97 7,229 14,946 22,272
Yield Sign 2 249 1,139 1,390
Traffic Signal 65 15,412 38,334 53,811
Traffic Flashers 0 252 451 703
School Zone 0 45 137 182
Railroad Crossbucks 0 32 96 128
Railroad Flashers 0 11 39 50
Railroad Gates 4 46 167 217
Construction Barricade 4 235 711 950
Police Officer 1 134 364 499
Pavement Markings 673 33,561 85,076 119,310
Crosswalk Lines 0 169 111 280
Walk/Don’t Walk 4 83 12 99
Other 5 203 624 832
Not Reported 2 260 720 982
No Controls 132 13,463 50,601 64,196
Sub Total 989 71,384 193,528 265,901
Animal in Error 4 974 20,951 21,929
No Error/Unknown/Not Stated 36 2,751 11,690 14,477
Sub Total 40 3,725 32,641 36,406
Total 1,029 75,109 226,169 302,307
From Date 01/01/2015
To Date 12/31/2015
County(s) All Counties
Report generated on : 5/18/2016 11:52:09 AM
Traffic Controls of Unit in Error in All Crashes
Table 5.21 - Unit Statistics
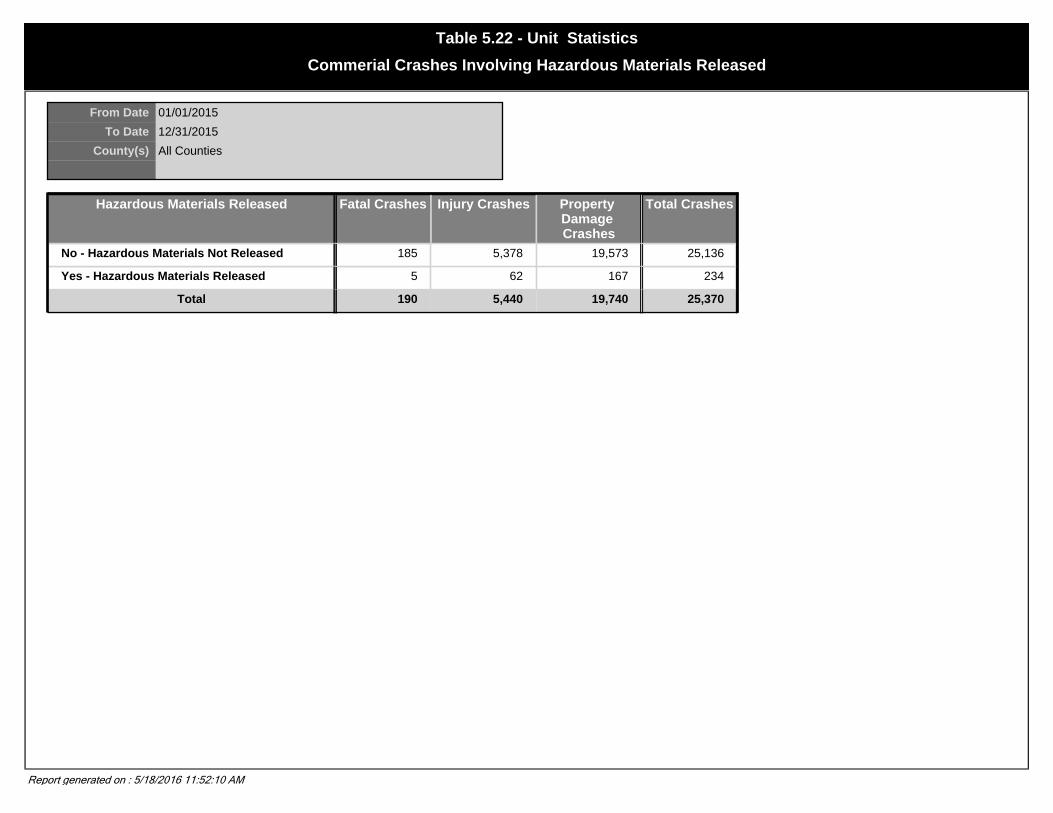
Hazardous Materials Released Fatal Crashes Injury Crashes Property Damage Crashes
Total Crashes
No - Hazardous Materials Not Released 185 5,378 19,573 25,136
Yes - Hazardous Materials Released 5 62 167 234
Total 190 5,440 19,740 25,370
From Date 01/01/2015
To Date 12/31/2015
County(s) All Counties
Report generated on : 5/18/2016 11:52:10 AM
Commerial Crashes Involving Hazardous Materials Released
Table 5.22 - Unit Statistics

First Harmful Event Fatal Injury Property Damage
Total Crashes
Non-Collision
Overturn/Rollover 3 124 160 287
Fire/Explosion 0 3 99 102
Immersion 0 0 1 1
Jackknife 0 9 104 113
Cargo/Equipment Loss Or Shift 0 23 341 364
Equipment Failure (Blown Tire, Brake Failure, Etc) 0 25 245 270
Separation Of Units 0 1 33 34
Ran Off Road Right 2 72 317 391
Ran Off Road Left 0 24 108 132
Cross Median 0 2 8 10
Cross Centerline Opposite Direction of Travel 0 21 70 91
Downhill Runaway 0 1 5 6
Other Non-Collision 0 47 294 341
Collision With Person,Vehicle,Or Object Not Fixed
Pedestrian 2 15 0 17
Pedalcycle 0 13 2 15
Railway Vehicle (E.G. Train, Engine) 0 1 2 3
Animal – Farm 0 0 0 0
Animal – Deer 0 0 7 7
Animal – Other 0 0 0 0
Motor Vehicle In Transport 39 1,478 5,456 6,973
Parked Motor Vehicle 2 25 751 778
Work Zone Maintenance Equipment 0 2 11 13
Struct by Falling, Shifting Cargo or Anything Set in Motion by a Motor Vehicle
0 1 19 20
Other Movable Object 0 6 92 98
Collision With Fixed Object
Impact Attenuator/Crash Cushion 1 4 22 27
Bridge Overhead Structure 0 9 145 154
Bridge Pier Or Abutment 0 4 7 11
Bridge Parapet 0 1 2 3
Bridge Rail 0 5 11 16
Guardrail Face 2 36 173 211
Guardrail End 1 10 69 80
Portable Barrier 0 5 14 19
Median Cable Barrier 0 3 23 26
Median Guardrail Barrier 0 2 5 7
From Date 01/01/2015
To Date 12/31/2015
County(s) All Counties
Report generated on : 5/18/2016 11:52:10 AM Page 1 of 2
First Harmful Event in Truck Crashes Caused by Truck Drivers
Table 5.23 - Unit Statistics

First Harmful Event Fatal Injury Property Damage
Total Crashes
Collision With Fixed Object
Median Concrete Barrier 1 18 41 60
Median Other Barrier 0 4 4 8
Traffic Sign Post 4 30 188 222
Overhead Sign Post 0 0 16 16
Light/Luminaries Support 0 4 76 80
Utility Pole 2 17 246 265
Other Post, Pole Or Support 0 5 121 126
Culvert 0 10 25 35
Curb 0 7 40 47
Ditch 0 60 220 280
Embankment 0 11 29 40
Fence 0 4 27 31
Mailbox 0 9 45 54
Tree 2 15 51 68
Wall, Building, Tunnel 0 0 60 60
Work Zone Maintenance Equipment 0 1 5 6
Fire Hydrant 0 0 25 25
Other Fixed Object 0 9 271 280
Not Stated 0 12 48 60
Unknown
Unknown 0 3 30 33
Total Number of Units Involved 61 2,191 10,164 12,416
Table Data : Unit Type: Single Unit Truck; 2 Axles, 6 Tires, Single Unit Truck; 3 or more Axles, Truck/Trailer, Truck Tractor (Bobtail), Tractor/Semi-Trailer, Tractor/Double - Short, Tractor/Double - Long, Fifth Wheel or Convertor Dolly, Tractor/Triples
Report generated on : 5/18/2016 11:52:10 AM Page 2 of 2
First Harmful Event in Truck Crashes Caused by Truck Drivers
Table 5.23 - Unit Statistics

First Harmful Event Fatal Injury Property Damage
Total Crashes
Non-Collision
Overturn/Rollover 39 1,248 758 2,045
Fire/Explosion 1 19 359 379
Immersion 1 6 53 60
Jackknife 0 18 147 165
Cargo/Equipment Loss Or Shift 0 62 803 865
Equipment Failure (Blown Tire, Brake Failure, Etc) 5 175 890 1,070
Separation Of Units 0 15 84 99
Ran Off Road Right 46 2,443 5,924 8,413
Ran Off Road Left 21 1,270 2,946 4,237
Cross Median 4 114 178 296
Cross Centerline Opposite Direction of Travel 26 925 1,568 2,519
Downhill Runaway 0 9 43 52
Other Non-Collision 6 704 1,632 2,342
Collision With Person,Vehicle,Or Object Not Fixed
Pedestrian 29 1,195 58 1,282
Pedalcycle 6 507 66 579
Railway Vehicle (E.G. Train, Engine) 3 15 17 35
Animal – Farm 0 16 18 34
Animal – Deer 2 40 332 374
Animal – Other 0 16 46 62
Motor Vehicle In Transport 474 48,577 129,692 178,743
Parked Motor Vehicle 11 1,479 17,231 18,721
Work Zone Maintenance Equipment 1 42 136 179
Struct by Falling, Shifting Cargo or Anything Set in Motion by a Motor Vehicle
0 21 151 172
Other Movable Object 9 234 966 1,209
Collision With Fixed Object
Impact Attenuator/Crash Cushion 2 65 125 192
Bridge Overhead Structure 0 20 179 199
Bridge Pier Or Abutment 4 56 67 127
Bridge Parapet 3 40 82 125
Bridge Rail 2 69 169 240
Guardrail Face 27 947 2,709 3,683
Guardrail End 14 352 663 1,029
Portable Barrier 0 35 79 114
Median Cable Barrier 1 108 547 656
Median Guardrail Barrier 1 41 91 133
From Date 01/01/2015
To Date 12/31/2015
County(s) All Counties
Report generated on : 5/18/2016 11:52:15 AM Page 1 of 2
First Harmful Event of Unit in ErrorTable 5.24 - Unit Statistics

First Harmful Event Fatal Injury Property Damage
Total Crashes
Collision With Fixed Object
Median Concrete Barrier 7 800 1,514 2,321
Median Other Barrier 0 86 190 276
Traffic Sign Post 12 495 2,200 2,707
Overhead Sign Post 0 11 44 55
Light/Luminaries Support 3 128 425 556
Utility Pole 26 1,683 2,979 4,688
Other Post, Pole Or Support 6 265 980 1,251
Culvert 14 413 403 830
Curb 24 651 1,599 2,274
Ditch 46 2,002 3,962 6,010
Embankment 23 772 1,085 1,880
Fence 6 273 1,015 1,294
Mailbox 8 442 1,640 2,090
Tree 54 1,327 2,151 3,532
Wall, Building, Tunnel 1 102 561 664
Work Zone Maintenance Equipment 0 14 62 76
Fire Hydrant 3 163 378 544
Other Fixed Object 15 461 1,664 2,140
Not Stated 2 96 397 495
Unknown
Unknown 1 317 1,470 1,788
Sub Total 989 71,384 193,528 265,901
Animal in Error 4 974 20,951 21,929
No Error/Not Stated 36 2,751 11,690 14,477
Sub Total 40 3,725 32,641 36,406
Total 1,029 75,109 226,169 302,307
Report generated on : 5/18/2016 11:52:15 AM Page 2 of 2
First Harmful Event of Unit in ErrorTable 5.24 - Unit Statistics

Most Harmful Event Fatal Injury Property Damage
Total Crashes
Non-Collision
Overturn/Rollover 145 4,648 2,598 7,391
Fire/Explosion 26 145 675 846
Immersion 5 23 88 116
Jackknife 1 28 156 185
Cargo/Equipment Loss Or Shift 0 71 928 999
Equipment Failure (Blown Tire, Brake Failure, Etc) 2 62 693 757
Separation Of Units 1 78 266 345
Ran Off Road Right 15 829 2,105 2,949
Ran Off Road Left 6 489 1,075 1,570
Cross Median 1 66 139 206
Cross Centerline Opposite Direction of Travel 7 407 797 1,211
Downhill Runaway 0 9 25 34
Other Non-Collision 16 840 2,028 2,884
Collision With Person,Vehicle,Or Object Not Fixed
Pedestrian 127 2,440 145 2,712
Pedalcycle 25 1,250 231 1,506
Railway Vehicle (E.G. Train, Engine) 4 19 28 51
Animal – Farm 0 44 220 264
Animal – Deer 2 791 20,039 20,832
Animal – Other 1 66 956 1,023
Motor Vehicle In Transport 1,134 111,855 302,629 415,618
Parked Motor Vehicle 21 2,107 20,206 22,334
Work Zone Maintenance Equipment 0 56 218 274
Struct by Falling, Shifting Cargo or Anything Set in Motion by a Motor Vehicle
13 310 2,185 2,508
Other Movable Object 12 386 2,593 2,991
Collision With Fixed Object
Impact Attenuator/Crash Cushion 0 82 215 297
Bridge Overhead Structure 0 25 197 222
Bridge Pier Or Abutment 6 85 95 186
Bridge Parapet 2 48 98 148
Bridge Rail 0 104 200 304
Guardrail Face 24 1,149 3,507 4,680
Guardrail End 6 383 828 1,217
Portable Barrier 3 35 110 148
Median Cable Barrier 2 148 763 913
Median Guardrail Barrier 3 65 134 202
From Date 01/01/2015
To Date 12/31/2015
County(s) All Counties
Report generated on : 5/18/2016 11:52:16 AM Page 1 of 2
Units Involved* in Crashes by Most Harmful EventTable 5.25 - Unit Statistics

Most Harmful Event Fatal Injury Property Damage
Total Crashes
Collision With Fixed Object
Median Concrete Barrier 10 1,270 2,099 3,379
Median Other Barrier 0 95 220 315
Traffic Sign Post 0 317 2,644 2,961
Overhead Sign Post 1 22 48 71
Light/Luminaries Support 6 223 737 966
Utility Pole 46 3,109 4,981 8,136
Other Post, Pole Or Support 10 384 1,409 1,803
Culvert 7 385 610 1,002
Curb 7 301 1,020 1,328
Ditch 11 1,445 4,206 5,662
Embankment 11 588 1,082 1,681
Fence 7 311 1,479 1,797
Mailbox 3 162 1,697 1,862
Tree 104 2,620 3,916 6,640
Wall, Building, Tunnel 2 161 946 1,109
Work Zone Maintenance Equipment 0 13 77 90
Fire Hydrant 8 439 755 1,202
Other Fixed Object 17 694 2,551 3,262
Not Stated 5 188 534 727
Unknown
Unknown 3 492 2,329 2,824
Total Number of Units Involved 1,868 142,362 400,510 544,740
* These are the number of units involved in crashes, not total crashes.
Report generated on : 5/18/2016 11:52:16 AM Page 2 of 2
Units Involved* in Crashes by Most Harmful EventTable 5.25 - Unit Statistics

Most Harmful Event First Harmful Event Most Harmful EventNon-Collision
Overturn/Rollover 2,310 7,391
Fire/Explosion 652 846
Immersion 65 116
Jackknife 180 185
Cargo/Equipment Loss Or Shift 990 999
Equipment Failure (Blown Tire, Brake Failure, Etc) 1,230 757
Separation Of Units 148 345
Ran Off Road Right 9,094 2,949
Ran Off Road Left 4,545 1,570
Cross Median 344 206
Cross Centerline Opposite Direction of Travel 2,750 1,211
Downhill Runaway 66 34
Other Non-Collision 3,413 2,884
Collision With Person,Vehicle,Or Object Not Fixed
Pedestrian 2,672 2,712
Pedalcycle 1,511 1,506
Railway Vehicle (E.G. Train, Engine) 37 51
Animal – Farm 275 264
Animal – Deer 21,060 20,832
Animal – Other 1,063 1,023
Motor Vehicle In Transport 418,998 415,618
Parked Motor Vehicle 21,640 22,334
Work Zone Maintenance Equipment 282 274
Struct by Falling, Shifting Cargo or Anything Set in Motion by a Motor Vehicle
2,506 2,508
Other Movable Object 2,934 2,991
Collision With Fixed Object
Impact Attenuator/Crash Cushion 278 297
Bridge Overhead Structure 217 222
Bridge Pier Or Abutment 135 186
Bridge Parapet 142 148
Bridge Rail 253 304
Guardrail Face 3,939 4,680
Guardrail End 1,082 1,217
Portable Barrier 131 148
Median Cable Barrier 705 913
Median Guardrail Barrier 145 202
Median Concrete Barrier 2,495 3,379
From Date 01/01/2015
To Date 12/31/2015
County(s) All Counties
Report generated on : 5/18/2016 11:52:26 AM Page 1 of 2
Units Involved* in Crashes by First Harmful Event and Most Harmful Event
Table 5.26 - Unit Statistics
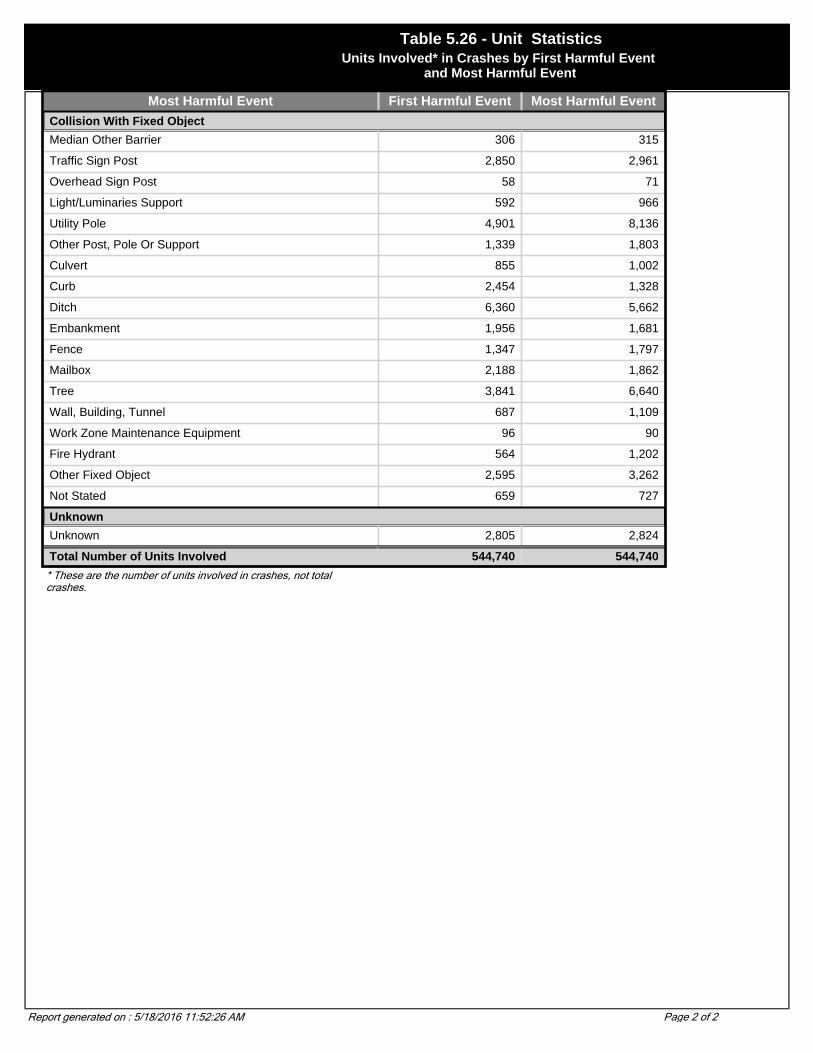
Most Harmful Event First Harmful Event Most Harmful EventCollision With Fixed Object
Median Other Barrier 306 315
Traffic Sign Post 2,850 2,961
Overhead Sign Post 58 71
Light/Luminaries Support 592 966
Utility Pole 4,901 8,136
Other Post, Pole Or Support 1,339 1,803
Culvert 855 1,002
Curb 2,454 1,328
Ditch 6,360 5,662
Embankment 1,956 1,681
Fence 1,347 1,797
Mailbox 2,188 1,862
Tree 3,841 6,640
Wall, Building, Tunnel 687 1,109
Work Zone Maintenance Equipment 96 90
Fire Hydrant 564 1,202
Other Fixed Object 2,595 3,262
Not Stated 659 727
Unknown
Unknown 2,805 2,824
Total Number of Units Involved 544,740 544,740
* These are the number of units involved in crashes, not total crashes.
Report generated on : 5/18/2016 11:52:26 AM Page 2 of 2
Units Involved* in Crashes by First Harmful Event and Most Harmful Event
Table 5.26 - Unit Statistics

Month Fatal Crashes Injury Crashes
Property Damage Crashes
Total Crashes Deaths Injuries
2015 January 23 396 673 1,092 24 535
2015 February 19 360 634 1,013 24 481
2015 March 12 399 665 1,076 15 550
2015 April 19 387 541 947 20 515
2015 May 37 444 548 1,029 38 647
2015 June 38 437 574 1,049 43 619
2015 July 20 482 534 1,036 20 683
2015 August 40 452 598 1,090 42 646
2015 September 23 431 538 992 25 587
2015 October 33 463 587 1,083 39 694
2015 November 23 430 579 1,032 25 591
2015 December 29 409 649 1,087 31 582
Total 316 5,090 7,120 12,526 346 7,130
From Date 01/01/2015
To Date 12/31/2015
County(s) All Counties
Report generated on : 5/18/2016 11:52:26 AM
Alcohol related Crashes, Deaths and Injuries by Month
Table 6.02 - Alcohol Statistics
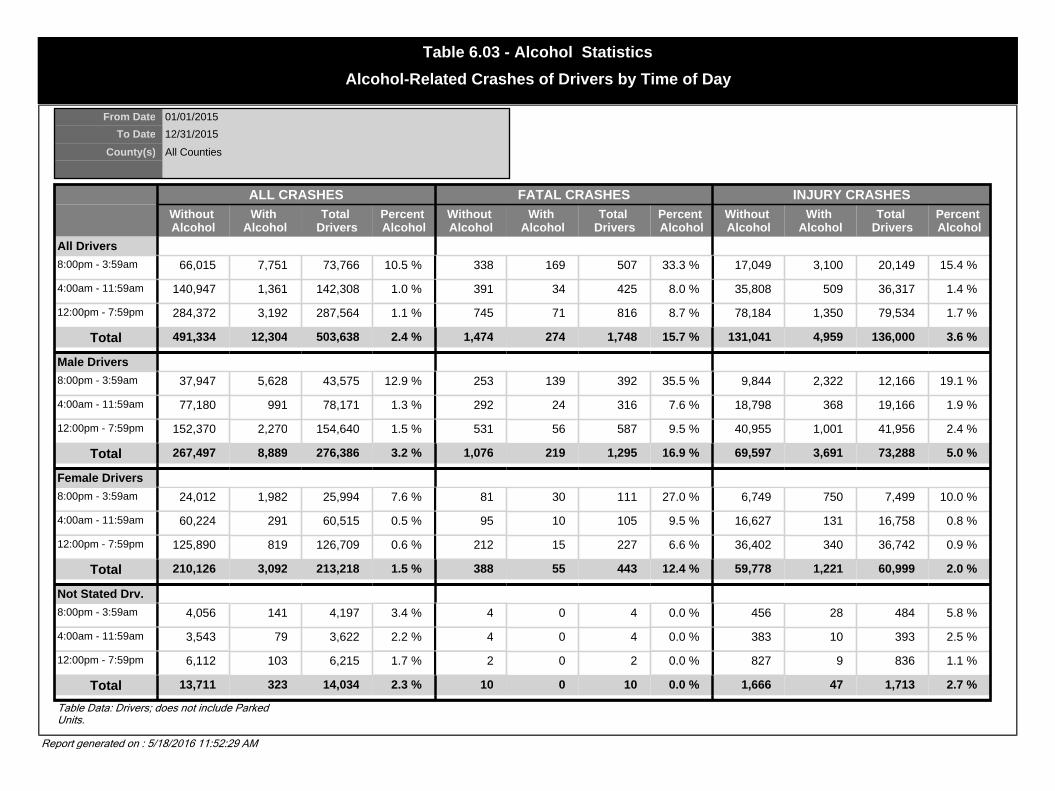
ALL CRASHES FATAL CRASHES INJURY CRASHESWithout Alcohol
With Alcohol
Total Drivers
Percent Alcohol
Without Alcohol
With Alcohol
Total Drivers
Percent Alcohol
Without Alcohol
With Alcohol
Total Drivers
Percent Alcohol
All Drivers
8:00pm - 3:59am 66,015 7,751 73,766 10.5 % 338 169 507 33.3 % 17,049 3,100 20,149 15.4 %
4:00am - 11:59am 140,947 1,361 142,308 1.0 % 391 34 425 8.0 % 35,808 509 36,317 1.4 %
12:00pm - 7:59pm 284,372 3,192 287,564 1.1 % 745 71 816 8.7 % 78,184 1,350 79,534 1.7 %
Total 491,334 12,304 503,638 2.4 % 1,474 274 1,748 15.7 % 131,041 4,959 136,000 3.6 %
Male Drivers
8:00pm - 3:59am 37,947 5,628 43,575 12.9 % 253 139 392 35.5 % 9,844 2,322 12,166 19.1 %
4:00am - 11:59am 77,180 991 78,171 1.3 % 292 24 316 7.6 % 18,798 368 19,166 1.9 %
12:00pm - 7:59pm 152,370 2,270 154,640 1.5 % 531 56 587 9.5 % 40,955 1,001 41,956 2.4 %
Total 267,497 8,889 276,386 3.2 % 1,076 219 1,295 16.9 % 69,597 3,691 73,288 5.0 %
Female Drivers
8:00pm - 3:59am 24,012 1,982 25,994 7.6 % 81 30 111 27.0 % 6,749 750 7,499 10.0 %
4:00am - 11:59am 60,224 291 60,515 0.5 % 95 10 105 9.5 % 16,627 131 16,758 0.8 %
12:00pm - 7:59pm 125,890 819 126,709 0.6 % 212 15 227 6.6 % 36,402 340 36,742 0.9 %
Total 210,126 3,092 213,218 1.5 % 388 55 443 12.4 % 59,778 1,221 60,999 2.0 %
Not Stated Drv.
8:00pm - 3:59am 4,056 141 4,197 3.4 % 4 0 4 0.0 % 456 28 484 5.8 %
4:00am - 11:59am 3,543 79 3,622 2.2 % 4 0 4 0.0 % 383 10 393 2.5 %
12:00pm - 7:59pm 6,112 103 6,215 1.7 % 2 0 2 0.0 % 827 9 836 1.1 %
Total 13,711 323 14,034 2.3 % 10 0 10 0.0 % 1,666 47 1,713 2.7 %
From Date 01/01/2015
To Date 12/31/2015
County(s) All Counties
Table Data: Drivers; does not include Parked Units.
Report generated on : 5/18/2016 11:52:29 AM
Alcohol-Related Crashes of Drivers by Time of Day
Table 6.03 - Alcohol Statistics

Age Group Alcohol Imapired Drivers in
Error
In Error with BACs
BAC TEST RESULTS % with BAC .10 or higher
% with BAC .20 or higher
.01-.04 .05-.07 .08-.09 .10-.19 .20+
0-15* 0 0 0 0 0 0 0 0.0 % 0.0 %
16-20 23 11 0 0 2 3 6 81.8 % 54.5 %
21-25 53 29 1 0 3 15 10 86.2 % 34.5 %
26-30 30 17 0 0 0 9 8 100.0 % 47.1 %
31-35 24 12 0 0 1 2 9 91.7 % 75.0 %
36-40 26 15 2 0 0 3 10 86.7 % 66.7 %
41-45 16 11 1 1 0 3 6 81.8 % 54.5 %
46-50 26 21 0 0 0 11 10 100.0 % 47.6 %
51-55 24 19 1 1 0 6 11 89.5 % 57.9 %
56-60 14 8 0 0 0 6 2 100.0 % 25.0 %
61-65 8 6 2 1 0 1 2 50.0 % 33.3 %
66-70 7 6 0 3 0 3 0 50.0 % 0.0 %
71-75 3 3 0 0 0 2 1 100.0 % 33.3 %
76 and Over 1 1 0 0 1 0 0 0.0 % 0.0 %
Not Stated 1 0 0 0 0 0 0 0.0 % 0.0 %
Total 256 159 7 6 7 64 75 87.4 % 47.2 %
From Date 01/01/2015
To Date 12/31/2015
County(s) All Counties
Table Data : Fatal Crashes; Drivers, Unit in Error; does not include Parked Units; Yes-Alcohol suspected or Yes Alcohol / Drugs suspected, Note: Of those reporting
Report generated on : 5/18/2016 11:52:34 AM
BACs of Alcohol Impaired Drivers in Error in Fatal Crashes by Age
Table 6.04 - Alcohol Statistics

Population DEATHS INJURIES
No Alcohol Alchohol related
Total Deaths Percent Alcohol Related
No Alcohol Alcohol Related
Total Injuries Percent Alcohol Related
Under 1,000 38 14 52 26.9 % 1,942 171 2,113 8.1 %
1,000 to 2,499 166 94 260 36.2 % 8,771 897 9,668 9.3 %
2,500 to 4,999 102 49 151 32.5 % 9,489 795 10,284 7.7 %
5,000 to 9,999 113 33 146 22.6 % 10,542 850 11,392 7.5 %
10,000 to 24,999 127 49 176 27.8 % 20,029 1,369 21,398 6.4 %
25,000 to 49,999 70 35 105 33.3 % 15,331 1,003 16,334 6.1 %
50,000 and Over 148 72 220 32.7 % 35,142 2,045 37,187 5.5 %
Total 764 346 1,110 31.2 % 101,246 7,130 108,376 6.6 %
From Date 01/01/2015
To Date 12/31/2015
County(s) All Counties
Report generated on : 5/18/2016 11:52:35 AM
Deaths and Injuries in Alcohol Related Crashes by Population
Table 6.05 - Alcohol Statistics

Total Alcohol Related % Alcohol Related
Fatal Crashes 1,029 316 30.7 %
Injury Crashes 75,100 5,090 6.8 %
Property Damage 226,150 7,120 3.1 %
Total Crashes 302,279 12,526 4.1 %
Deaths 1,110 346 31.2 %
Injuries 108,376 7,130 6.6 %
From Date 01/01/2015
To Date 12/31/2015
County(s) All Counties
Report generated on : 5/18/2016 11:52:41 AM
Alcohol related Crashes by Crash SeverityTable 6.06 - Alcohol Statistics

ALL CRASHES INJURY CRASHES FATAL CRASHESAlcohol Impaired Drivers
Total Drivers
Percent Alcohol Impaired
Alcohol Impaired Drivers
Total Drivers
Percent Alcohol Impaired
Alcohol Impaired Drivers
Total Drivers
Percent Alcohol Impaired
Passenger Vehicle Drivers
0-15 144 6,287 2.3 % 33 969 3.4 % 0 6 0.0 %
16-20 716 59,303 1.2 % 307 16,339 1.9 % 22 144 15.3 %
21-25 2,218 63,447 3.5 % 903 17,269 5.2 % 53 159 33.3 %
26-30 1,677 49,877 3.4 % 655 13,687 4.8 % 28 130 21.5 %
31-35 1,497 42,237 3.5 % 633 11,754 5.4 % 23 109 21.1 %
36-40 1,235 36,065 3.4 % 508 9,823 5.2 % 24 90 26.7 %
41-45 1,022 34,616 3.0 % 396 9,422 4.2 % 13 86 15.1 %
46-50 940 33,533 2.8 % 364 8,929 4.1 % 18 82 22.0 %
51-55 857 33,964 2.5 % 338 9,148 3.7 % 15 98 15.3 %
56-60 658 30,502 2.2 % 253 8,099 3.1 % 11 69 15.9 %
61-65 300 23,505 1.3 % 118 6,227 1.9 % 6 59 10.2 %
66-70 174 17,183 1.0 % 54 4,538 1.2 % 7 56 12.5 %
71-75 69 11,139 0.6 % 27 3,091 0.9 % 3 50 6.0 %
76 & Over 45 15,025 0.3 % 18 4,161 0.4 % 1 96 1.0 %
Not Stated 149 5,442 2.7 % 22 947 2.3 % 1 2 50.0 %
Total 11,701 462,125 2.5 % 4,629 124,403 3.7 % 225 1,236 18.2 %
Other Passenger Vehicle Drivers
0-15 0 69 0.0 % 0 49 0.0 % 0 1 0.0 %
16-20 7 93 7.5 % 5 58 8.6 % 1 2 50.0 %
21-25 14 101 13.9 % 10 40 25.0 % 1 3 33.3 %
26-30 12 92 13.0 % 8 31 25.8 % 1 1 100.0 %
31-35 4 55 7.3 % 2 19 10.5 % 0 0 0.0 %
36-40 5 70 7.1 % 2 32 6.3 % 1 1 100.0 %
41-45 10 90 11.1 % 8 29 27.6 % 1 3 33.3 %
46-50 5 81 6.2 % 3 25 12.0 % 1 2 50.0 %
51-55 5 73 6.8 % 4 19 21.1 % 1 1 100.0 %
56-60 5 81 6.2 % 3 21 14.3 % 1 3 33.3 %
61-65 4 47 8.5 % 2 13 15.4 % 1 2 50.0 %
66-70 0 35 0.0 % 0 7 0.0 % 0 1 0.0 %
71-75 0 25 0.0 % 0 6 0.0 % 0 1 0.0 %
76 & Over 1 24 4.2 % 1 8 12.5 % 0 1 0.0 %
Not Stated 1 20 5.0 % 1 5 20.0 % 0 0 0.0 %
Total 73 956 7.6 % 49 362 13.5 % 9 22 40.9 %
From Date 01/01/2015
To Date 12/31/2015
County(s) All Counties
Report generated on : 5/18/2016 11:52:47 AM Page 1 of 4
Alcohol Impaired Drivers by Age and Type of Unit
Table 6.07 - Alcohol Statistics

ALL CRASHES INJURY CRASHES FATAL CRASHESAlcohol Impaired Drivers
Total Drivers
Percent Alcohol Impaired
Alcohol Impaired Drivers
Total Drivers
Percent Alcohol Impaired
Alcohol Impaired Drivers
Total Drivers
Percent Alcohol Impaired
Motorcycle Drivers
0-15 1 42 2.4 % 0 22 0.0 % 0 0 0.0 %
16-20 2 197 1.0 % 2 156 1.3 % 0 7 0.0 %
21-25 26 442 5.9 % 21 345 6.1 % 3 15 20.0 %
26-30 33 400 8.3 % 28 312 9.0 % 3 20 15.0 %
31-35 36 314 11.5 % 28 240 11.7 % 5 9 55.6 %
36-40 25 276 9.1 % 20 217 9.2 % 4 8 50.0 %
41-45 32 378 8.5 % 25 294 8.5 % 3 15 20.0 %
46-50 44 427 10.3 % 35 316 11.1 % 8 23 34.8 %
51-55 41 454 9.0 % 31 361 8.6 % 6 22 27.3 %
56-60 22 349 6.3 % 16 259 6.2 % 3 25 12.0 %
61-65 9 244 3.7 % 7 198 3.5 % 1 8 12.5 %
66-70 2 152 1.3 % 2 111 1.8 % 0 8 0.0 %
71-75 0 70 0.0 % 0 51 0.0 % 0 5 0.0 %
76 & Over 0 26 0.0 % 0 22 0.0 % 0 2 0.0 %
Not Stated 1 39 2.6 % 1 16 6.3 % 0 0 0.0 %
Total 274 3,810 7.2 % 216 2,920 7.4 % 36 167 21.6 %
Med / Heavy Truck Drivers
0-15 1 358 0.3 % 0 35 0.0 % 0 0 0.0 %
16-20 1 277 0.4 % 1 59 1.7 % 0 0 0.0 %
21-25 4 1,471 0.3 % 1 286 0.3 % 0 13 0.0 %
26-30 5 1,909 0.3 % 2 366 0.5 % 0 11 0.0 %
31-35 5 2,016 0.2 % 2 373 0.5 % 0 20 0.0 %
36-40 4 2,198 0.2 % 0 451 0.0 % 0 18 0.0 %
41-45 8 2,695 0.3 % 3 565 0.5 % 1 33 3.0 %
46-50 4 2,860 0.1 % 2 606 0.3 % 0 21 0.0 %
51-55 11 2,973 0.4 % 3 631 0.5 % 0 28 0.0 %
56-60 3 2,633 0.1 % 2 578 0.3 % 0 23 0.0 %
61-65 2 1,449 0.1 % 0 283 0.0 % 0 22 0.0 %
66-70 0 570 0.0 % 0 117 0.0 % 0 4 0.0 %
71-75 2 281 0.7 % 1 73 1.4 % 0 4 0.0 %
76 & Over 0 137 0.0 % 0 29 0.0 % 0 4 0.0 %
Not Stated 10 947 1.1 % 0 140 0.0 % 0 2 0.0 %
Total 60 22,774 0.3 % 17 4,592 0.4 % 1 203 0.5 %
Bus / Van / Limo Drivers
0-15 0 37 0.0 % 0 2 0.0 % 0 0 0.0 %
16-20 0 22 0.0 % 0 4 0.0 % 0 0 0.0 %
21-25 0 166 0.0 % 0 31 0.0 % 0 0 0.0 %
26-30 0 203 0.0 % 0 50 0.0 % 0 1 0.0 %
Report generated on : 5/18/2016 11:52:47 AM Page 2 of 4
Alcohol Impaired Drivers by Age and Type of Unit
Table 6.07 - Alcohol Statistics

ALL CRASHES INJURY CRASHES FATAL CRASHESAlcohol Impaired Drivers
Total Drivers
Percent Alcohol Impaired
Alcohol Impaired Drivers
Total Drivers
Percent Alcohol Impaired
Alcohol Impaired Drivers
Total Drivers
Percent Alcohol Impaired
Bus / Van / Limo Drivers
31-35 1 234 0.4 % 0 50 0.0 % 0 0 0.0 %
36-40 0 241 0.0 % 0 47 0.0 % 0 1 0.0 %
41-45 0 372 0.0 % 0 87 0.0 % 0 0 0.0 %
46-50 0 402 0.0 % 0 80 0.0 % 0 0 0.0 %
51-55 1 501 0.2 % 0 113 0.0 % 0 0 0.0 %
56-60 2 544 0.4 % 0 97 0.0 % 0 0 0.0 %
61-65 0 389 0.0 % 0 83 0.0 % 0 1 0.0 %
66-70 0 201 0.0 % 0 38 0.0 % 0 1 0.0 %
71-75 0 82 0.0 % 0 15 0.0 % 0 0 0.0 %
76 & Over 0 38 0.0 % 0 5 0.0 % 0 0 0.0 %
Not Stated 0 28 0.0 % 0 2 0.0 % 0 0 0.0 %
Total 4 3,460 0.1 % 0 704 0.0 % 0 4 0.0 %
Non-Motorist Drivers
0-15 1 422 0.2 % 0 350 0.0 % 0 6 0.0 %
16-20 3 265 1.1 % 0 212 0.0 % 0 3 0.0 %
21-25 5 165 3.0 % 5 133 3.8 % 0 3 0.0 %
26-30 3 125 2.4 % 2 101 2.0 % 0 0 0.0 %
31-35 2 103 1.9 % 1 84 1.2 % 0 1 0.0 %
36-40 3 61 4.9 % 2 49 4.1 % 0 2 0.0 %
41-45 3 73 4.1 % 3 63 4.8 % 0 2 0.0 %
46-50 7 77 9.1 % 5 63 7.9 % 0 4 0.0 %
51-55 15 97 15.5 % 11 78 14.1 % 3 5 60.0 %
56-60 3 95 3.2 % 2 82 2.4 % 0 2 0.0 %
61-65 2 52 3.8 % 1 42 2.4 % 0 0 0.0 %
66-70 0 27 0.0 % 0 23 0.0 % 0 3 0.0 %
71-75 0 14 0.0 % 0 11 0.0 % 0 1 0.0 %
76 & Over 0 13 0.0 % 0 9 0.0 % 0 0 0.0 %
Not Stated 2 13 15.4 % 0 3 0.0 % 0 0 0.0 %
Total 49 1,602 3.1 % 32 1,303 2.5 % 3 32 9.4 %
Unknown Drivers
0-15 25 2,974 0.8 % 0 158 0.0 % 0 1 0.0 %
16-20 0 91 0.0 % 0 18 0.0 % 0 0 0.0 %
21-25 5 160 3.1 % 2 43 4.7 % 0 0 0.0 %
26-30 2 93 2.2 % 0 16 0.0 % 0 1 0.0 %
31-35 4 92 4.3 % 2 20 10.0 % 0 0 0.0 %
36-40 2 73 2.7 % 1 24 4.2 % 0 0 0.0 %
41-45 6 80 7.5 % 2 22 9.1 % 0 0 0.0 %
46-50 4 64 6.3 % 1 9 11.1 % 0 0 0.0 %
Report generated on : 5/18/2016 11:52:49 AM Page 3 of 4
Alcohol Impaired Drivers by Age and Type of Unit
Table 6.07 - Alcohol Statistics

ALL CRASHES INJURY CRASHES FATAL CRASHESAlcohol Impaired Drivers
Total Drivers
Percent Alcohol Impaired
Alcohol Impaired Drivers
Total Drivers
Percent Alcohol Impaired
Alcohol Impaired Drivers
Total Drivers
Percent Alcohol Impaired
Unknown Drivers
51-55 1 62 1.6 % 0 16 0.0 % 0 0 0.0 %
56-60 2 55 3.6 % 1 13 7.7 % 0 0 0.0 %
61-65 0 25 0.0 % 0 8 0.0 % 0 0 0.0 %
66-70 0 23 0.0 % 0 7 0.0 % 0 0 0.0 %
71-75 0 10 0.0 % 0 1 0.0 % 0 0 0.0 %
76 & Over 0 28 0.0 % 0 5 0.0 % 0 0 0.0 %
Not Stated 92 2,785 3.3 % 7 330 2.1 % 0 2 0.0 %
Total 143 6,615 2.2 % 16 690 2.3 % 0 4 0.0 %
All Drivers
0-15 172 10,189 1.7 % 33 1,585 2.1 % 0 14 0.0 %
16-20 729 60,248 1.2 % 315 16,846 1.9 % 23 156 14.7 %
21-25 2,272 65,952 3.4 % 942 18,147 5.2 % 57 193 29.5 %
26-30 1,732 52,699 3.3 % 695 14,563 4.8 % 32 164 19.5 %
31-35 1,549 45,051 3.4 % 668 12,540 5.3 % 28 139 20.1 %
36-40 1,274 38,984 3.3 % 533 10,643 5.0 % 29 120 24.2 %
41-45 1,081 38,304 2.8 % 437 10,482 4.2 % 18 139 12.9 %
46-50 1,004 37,444 2.7 % 410 10,028 4.1 % 27 132 20.5 %
51-55 931 38,124 2.4 % 387 10,366 3.7 % 25 154 16.2 %
56-60 695 34,259 2.0 % 277 9,149 3.0 % 15 122 12.3 %
61-65 317 25,711 1.2 % 128 6,854 1.9 % 8 92 8.7 %
66-70 176 18,191 1.0 % 56 4,841 1.2 % 7 73 9.6 %
71-75 71 11,621 0.6 % 28 3,248 0.9 % 3 61 4.9 %
76 & Over 46 15,291 0.3 % 19 4,239 0.4 % 1 103 1.0 %
Not Stated 255 9,274 2.7 % 31 1,443 2.1 % 1 6 16.7 %
Total 12,304 501,342 2.5 % 4,959 134,974 3.7 % 274 1,668 16.4 %
Report generated on : 5/18/2016 11:52:49 AM Page 4 of 4
Alcohol Impaired Drivers by Age and Type of Unit
Table 6.07 - Alcohol Statistics

WHO THE DRIVERS IN ERROR KILLED
Age Themselves Their Passengers
Others Total Deaths % Alcohol Deaths
17 1 1 0 2 0.7 %
18 2 4 1 7 2.5 %
19 3 2 0 5 1.8 %
20 9 2 0 11 3.9 %
16-20 15 9 1 25 8.9 %
21 6 3 1 10 3.5 %
22 4 5 0 9 3.2 %
23 11 6 2 19 6.7 %
24 7 3 1 11 3.9 %
25 7 6 1 14 5.0 %
21-25 35 23 5 63 22.3 %
26-30 23 2 8 33 11.7 %
31-35 15 5 8 28 9.9 %
36-40 23 1 5 29 10.3 %
41-45 15 1 0 16 5.7 %
46-50 22 2 4 28 9.9 %
51-55 22 0 2 24 8.5 %
56-60 12 1 1 14 5.0 %
61-65 7 2 1 10 3.5 %
66-70 6 0 1 7 2.5 %
71-75 2 0 1 3 1.1 %
76 & Over 0 1 0 1 0.4 %
26 & Over 147 15 31 193 68.4 %
Not Stated 0 1 0 1 0.4 %
Not Stated 0 1 0 1 0.4 %
TOTAL 197 48 37 282 100.0 %
From Date 01/01/2015
To Date 12/31/2015
County(s) All Counties
Note : Total alcohol-related deaths is 346 including deaths where driver error is not known.
Report generated on : 5/18/2016 11:52:53 AM
Persons Killed in Crashes by Age of the Alcohol Impaired Driver in Error
Table 6.08 - Alcohol Statistics

WHO THE DRIVERS IN ERROR INJURED
Age Themselves Their Passengers
Others Total Injured % Alcohol Injuries
0-15 10 3 27 40 0.6 %
0-15 10 3 27 40 0.6 %
16 12 10 5 27 0.4 %
17 18 10 1 29 0.4 %
18 42 11 15 68 1.0 %
19 78 43 23 144 2.2 %
20 102 35 39 176 2.7 %
16-20 252 109 83 444 6.8 %
21 159 44 39 242 3.7 %
22 167 59 57 283 4.4 %
23 163 48 68 279 4.3 %
24 144 39 62 245 3.8 %
25 125 31 64 220 3.4 %
21-25 758 221 290 1,269 19.5 %
26-30 549 144 216 909 14.0 %
31-35 508 152 240 900 13.8 %
36-40 393 86 206 685 10.5 %
41-45 324 41 190 555 8.5 %
46-50 320 48 151 519 8.0 %
51-55 272 40 193 505 7.8 %
56-60 209 21 118 348 5.4 %
61-65 103 2 48 153 2.4 %
66-70 33 3 40 76 1.2 %
71-75 18 3 15 36 0.6 %
76 & Over 12 1 10 23 0.4 %
26 & Over 2,741 541 1,427 4,709 72.5 %
Not Stated 9 11 17 37 0.6 %
Not Stated 9 11 17 37 0.6 %
TOTAL 3,770 885 1,844 6,499 100.0 %
From Date 01/01/2015
To Date 12/31/2015
County(s) All Counties
Note : Total alcohol-related injuries are 7,130 including injuries where driver error is not known.
Report generated on : 5/18/2016 11:53:01 AM
Persons Injured in Crashes by Age of the Alcohol Impaired Driver in Error
Table 6.09 - Alcohol Statistics

Age Group Deaths Incapacitating Injury
Non - Incapacitating
Injury
Possible Injury
Total Injuries No Injury Unknow Injury
Total
0-15* 3 40 103 154 297 1,101 0 1,401
16-20 37 125 302 202 629 1,194 0 1,860
21-25 59 277 672 386 1,335 2,481 0 3,875
26-30 28 186 461 322 969 1,861 0 2,858
31-35 27 192 395 255 842 1,551 0 2,420
36-40 33 100 333 216 649 1,297 0 1,979
41-45 29 111 251 212 574 1,173 0 1,776
46-50 34 126 239 171 536 1,064 0 1,634
51-55 38 94 213 190 497 973 0 1,508
56-60 22 65 162 151 378 793 0 1,193
61-65 12 39 93 77 209 439 0 660
66-70 15 23 32 40 95 271 0 381
71-75 6 8 22 15 45 122 0 173
76 and Over 3 11 23 24 58 127 0 188
Not Stated 0 1 10 6 17 309 0 326
Total 346 1,398 3,311 2,421 7,130 14,756 0 22,232
From Date 01/01/2015
To Date 12/31/2015
County(s) All Counties
Report generated on : 5/18/2016 11:53:02 AM
Age of Persons Killed and Injured in Alcohol-Related Crashes
Table 6.10 - Alcohol Statistics

Unit Type Fatal Injury Property Damage Total Crashes
Passenger Vehicles 225 4,664 6,872 11,761
Other Passenger Vehicles 9 49 15 73
Motorcycle 36 216 22 274
Med / Heavy Trucks 1 17 43 61
Bus / Van / Limo 0 0 4 4
Non-Motorist 27 180 17 224
Unknown 0 16 128 144
Total 298 5,142 7,101 12,541
From Date 01/01/2015
To Date 12/31/2015
County(s) All Counties
Report generated on : 5/18/2016 11:53:02 AM
Types of Units Involved in Alcohol Crashes
Table 6.11 - Alcohol Statistics

Age Drivers in Crashes Number Involved Number in Error Percent in Error
15 Alcohol Impaired Drivers in Crashes 5 5 100.0 %
15 Drivers in Crashes 519 345 66.5 %
15 Drivers in Fatal Crashes 3 2 66.7 %
16 Alcohol Impaired Drivers in Crashes 28 28 100.0 %
16 Drivers in Crashes 7,789 5,602 71.9 %
16 Drivers in Fatal Crashes 8 6 75.0 %
17 Alcohol Impaired Drivers in Crashes 52 51 98.1 %
17 Alcohol Impaired Drivers in Fatal Crashes 2 2 100.0 %
17 Drivers in Crashes 10,863 7,415 68.3 %
17 Drivers in Fatal Crashes 28 17 60.7 %
18 Alcohol Impaired Drivers in Crashes 132 130 98.5 %
18 Alcohol Impaired Drivers in Fatal Crashes 6 6 100.0 %
18 Drivers in Crashes 13,796 9,455 68.5 %
18 Drivers in Fatal Crashes 39 31 79.5 %
19 Alcohol Impaired Drivers in Crashes 225 219 97.3 %
19 Alcohol Impaired Drivers in Fatal Crashes 4 4 100.0 %
19 Drivers in Crashes 13,966 9,192 65.8 %
19 Drivers in Fatal Crashes 33 23 69.7 %
20 Alcohol Impaired Drivers in Crashes 292 288 98.6 %
20 Alcohol Impaired Drivers in Fatal Crashes 11 11 100.0 %
20 Drivers in Crashes 13,834 8,797 63.6 %
20 Drivers in Fatal Crashes 48 30 62.5 %
21 Alcohol Impaired Drivers in Crashes 414 412 99.5 %
21 Alcohol Impaired Drivers in Fatal Crashes 7 7 100.0 %
21 Drivers in Crashes 13,633 8,344 61.2 %
21 Drivers in Fatal Crashes 29 21 72.4 %
22 Alcohol Impaired Drivers in Crashes 489 474 96.9 %
22 Alcohol Impaired Drivers in Fatal Crashes 11 9 81.8 %
22 Drivers in Crashes 13,679 8,162 59.7 %
22 Drivers in Fatal Crashes 46 28 60.9 %
23 Alcohol Impaired Drivers in Crashes 497 480 96.6 %
23 Alcohol Impaired Drivers in Fatal Crashes 17 17 100.0 %
23 Drivers in Crashes 13,233 7,714 58.3 %
23 Drivers in Fatal Crashes 44 32 72.7 %
24 Alcohol Impaired Drivers in Crashes 464 450 97.0 %
24 Alcohol Impaired Drivers in Fatal Crashes 11 10 90.9 %
24 Drivers in Crashes 13,082 7,456 57.0 %
24 Drivers in Fatal Crashes 35 23 65.7 %
Total Alcohol Impaired Drivers in Crashes 2,598 2,537 97.7 %
Alcohol Impaired Drivers in Fatal Crashes 69 66 95.7 %
Drivers in Crashes 114,394 72,482 63.4 %
Drivers in Fatal Crashes 313 213 68.1 %
From Date 01/01/2015
To Date 12/31/2015
County(s) All Counties
Table Data : Drivers; between age 15 and 24; does not include Parked Units
Report generated on : 5/18/2016 11:53:05 AM
Youthful Drivers in Alcohol-Related Crashes
Table 6.12 - Alcohol Statistics

County Population Fatal Crashes
Injury Crashes
PDO Crashes
Total Crashes
Deaths Injuries
Adams County 27,330 4 160 478 642 5 235
Allen County 108,473 8 890 2,604 3,502 8 1,369
Ashland County 52,523 5 348 1,078 1,431 5 497
Ashtabula County 102,728 16 551 1,741 2,308 19 790
Athens County 62,223 5 316 889 1,210 5 427
Auglaize County 46,611 7 207 843 1,057 8 288
Belmont County 70,226 10 388 1,244 1,642 10 549
Brown County 42,285 5 265 722 992 5 391
Butler County 332,807 28 2,526 6,432 8,986 29 3,742
Carroll County 28,836 3 113 353 469 3 159
Champaign County 38,890 5 211 535 751 5 283
Clark County 144,742 23 963 2,388 3,374 24 1,421
Clermont County 177,977 15 1,336 4,145 5,496 16 1,924
Clinton County 40,543 3 306 792 1,101 3 455
Columbiana County 112,075 7 503 1,437 1,947 8 731
Coshocton County 36,655 7 132 380 519 7 176
Crawford County 46,966 5 175 859 1,039 5 247
Cuyahoga County 1,393,978 70 8,627 23,830 32,527 75 12,618
Darke County 53,309 9 278 866 1,153 13 420
Defiance County 39,500 6 222 1,030 1,258 7 318
Delaware County 109,989 10 1,013 2,919 3,942 13 1,476
Erie County 79,551 10 496 1,900 2,406 11 725
Fairfield County 122,759 13 792 2,342 3,147 14 1,186
Fayette County 28,433 8 191 602 801 9 284
Franklin County 1,068,978 79 9,055 26,297 35,431 85 12,999
Fulton County 42,084 9 252 787 1,048 11 402
Gallia County 31,069 6 228 625 859 6 315
Geauga County 90,895 10 539 1,428 1,977 10 787
Greene County 147,886 8 954 3,008 3,970 8 1,398
Guernsey County 40,792 1 287 796 1,084 1 438
Hamilton County 845,303 52 6,608 25,074 31,734 53 9,056
Hancock County 71,295 9 479 1,955 2,443 10 681
From Date 01/01/2015
To Date 12/31/2015
County(s) All Counties
Report generated on : 5/18/2016 11:53:19 AM Page 1 of 3
Total Crashes by County
Table 7.01 - County Statistics

County Population Fatal Crashes
Injury Crashes
PDO Crashes
Total Crashes
Deaths Injuries
Hardin County 31,945 3 126 467 596 6 197
Harrison County 15,856 3 104 243 350 3 150
Henry County 29,210 9 153 576 738 10 225
Highland County 40,875 7 235 617 859 7 351
Hocking County 28,241 3 150 450 603 4 207
Holmes County 38,943 4 199 549 752 4 276
Huron County 59,487 10 253 881 1,144 10 367
Jackson County 32,641 5 205 751 961 5 283
Jefferson County 73,894 11 346 939 1,296 11 487
Knox County 54,500 6 297 872 1,175 6 417
Lake County 227,511 13 1,196 3,764 4,973 14 1,661
Lawrence County 62,319 4 334 642 980 5 483
Licking County 145,491 21 970 2,538 3,529 23 1,329
Logan County 46,005 9 251 903 1,163 9 355
Lorain County 284,664 29 1,660 4,822 6,511 34 2,406
Lucas County 455,054 32 3,952 10,205 14,189 34 5,868
Madison County 40,213 6 263 648 917 6 437
Mahoning County 257,555 20 1,516 4,219 5,755 22 2,221
Marion County 66,217 6 421 1,217 1,644 7 629
Medina County 151,095 10 910 2,665 3,585 11 1,298
Meigs County 23,072 6 117 234 357 6 184
Mercer County 40,924 5 205 654 864 5 303
Miami County 98,868 11 471 2,025 2,507 11 653
Monroe County 15,180 2 66 212 280 2 97
Montgomery County 559,062 52 3,603 8,699 12,354 56 5,330
Morgan County 14,897 4 75 163 242 6 113
Morrow County 31,628 12 232 773 1,017 12 350
Muskingum County 84,585 9 594 2,045 2,648 10 871
Noble County 14,058 4 22 113 139 4 34
Ottawa County 40,985 4 202 712 918 4 287
Paulding County 20,293 4 94 357 455 4 150
Perry County 34,078 4 202 296 502 4 286
Pickaway County 52,727 5 353 884 1,242 5 516
Pike County 27,695 3 199 486 688 3 304
Portage County 152,061 20 996 3,032 4,048 21 1,398
Preble County 42,337 10 238 683 931 10 319
Report generated on : 5/18/2016 11:53:19 AM Page 2 of 3
Total Crashes by County
Table 7.01 - County Statistics

County Population Fatal Crashes
Injury Crashes
PDO Crashes
Total Crashes
Deaths Injuries
Putnam County 34,726 3 97 299 399 3 128
Richland County 128,852 13 881 2,829 3,723 17 1,347
Ross County 73,345 6 571 1,564 2,141 7 851
Sandusky County 61,792 11 338 1,298 1,647 11 495
Scioto County 79,195 12 552 1,368 1,932 13 823
Seneca County 58,683 4 250 1,035 1,289 4 341
Shelby County 47,910 5 289 1,165 1,459 5 388
Stark County 378,098 18 2,220 7,205 9,443 19 3,134
Summit County 542,899 24 3,481 11,949 15,454 25 4,954
Trumbull County 225,116 18 1,132 3,189 4,339 18 1,613
Tuscarawas County 90,914 7 589 1,865 2,461 7 770
Union County 40,909 9 290 974 1,273 9 395
Van Wert County 29,659 3 171 514 688 3 267
Vinton County 12,806 6 104 218 328 7 147
Warren County 158,383 14 1,210 3,669 4,893 15 1,755
Washington County 63,251 6 381 997 1,384 6 509
Wayne County 111,564 13 674 1,773 2,460 14 974
Williams County 39,188 8 223 1,007 1,238 9 350
Wood County 121,065 23 919 3,034 3,976 29 1,360
Wyandot County 22,908 4 116 502 622 4 164
State of Ohio 11,353,140 1,029 75,109 226,169 302,307 1,110 108,394
Report generated on : 5/18/2016 11:53:19 AM Page 3 of 3
Total Crashes by County
Table 7.01 - County Statistics
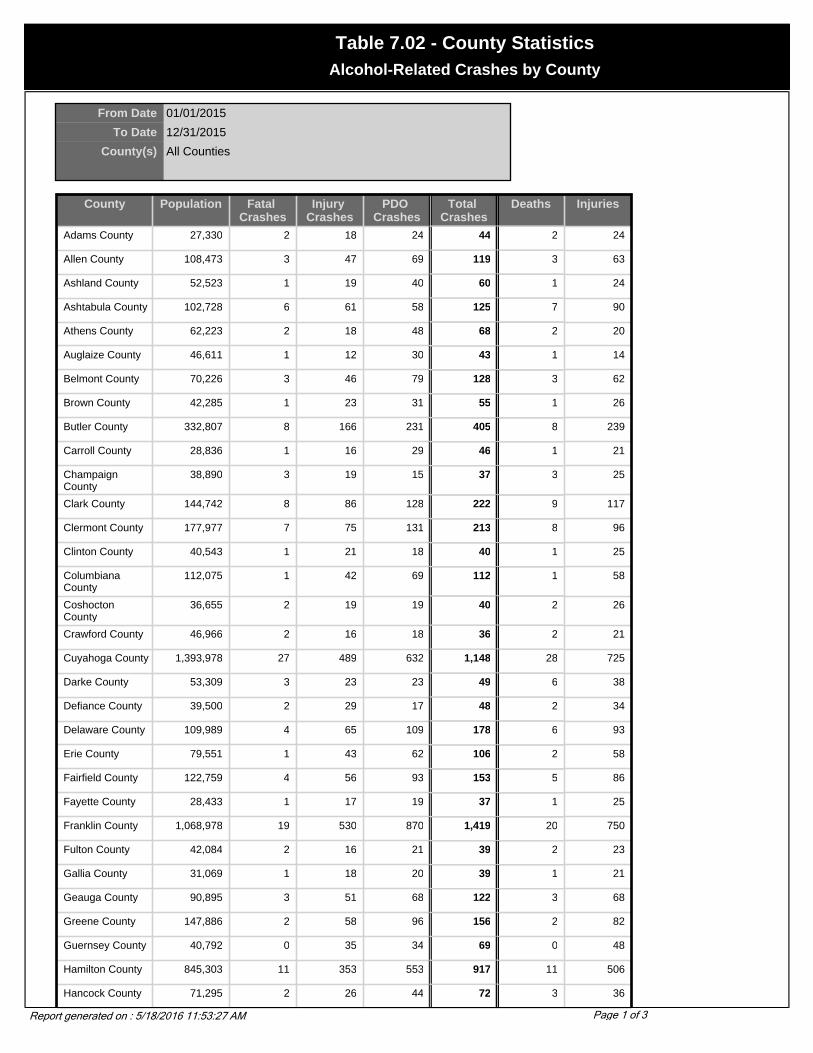
County Population Fatal Crashes
Injury Crashes
PDO Crashes
Total Crashes
Deaths Injuries
Adams County 27,330 2 18 24 44 2 24
Allen County 108,473 3 47 69 119 3 63
Ashland County 52,523 1 19 40 60 1 24
Ashtabula County 102,728 6 61 58 125 7 90
Athens County 62,223 2 18 48 68 2 20
Auglaize County 46,611 1 12 30 43 1 14
Belmont County 70,226 3 46 79 128 3 62
Brown County 42,285 1 23 31 55 1 26
Butler County 332,807 8 166 231 405 8 239
Carroll County 28,836 1 16 29 46 1 21
Champaign County
38,890 3 19 15 37 3 25
Clark County 144,742 8 86 128 222 9 117
Clermont County 177,977 7 75 131 213 8 96
Clinton County 40,543 1 21 18 40 1 25
Columbiana County
112,075 1 42 69 112 1 58
Coshocton County
36,655 2 19 19 40 2 26
Crawford County 46,966 2 16 18 36 2 21
Cuyahoga County 1,393,978 27 489 632 1,148 28 725
Darke County 53,309 3 23 23 49 6 38
Defiance County 39,500 2 29 17 48 2 34
Delaware County 109,989 4 65 109 178 6 93
Erie County 79,551 1 43 62 106 2 58
Fairfield County 122,759 4 56 93 153 5 86
Fayette County 28,433 1 17 19 37 1 25
Franklin County 1,068,978 19 530 870 1,419 20 750
Fulton County 42,084 2 16 21 39 2 23
Gallia County 31,069 1 18 20 39 1 21
Geauga County 90,895 3 51 68 122 3 68
Greene County 147,886 2 58 96 156 2 82
Guernsey County 40,792 0 35 34 69 0 48
Hamilton County 845,303 11 353 553 917 11 506
Hancock County 71,295 2 26 44 72 3 36
From Date 01/01/2015
To Date 12/31/2015
County(s) All Counties
Report generated on : 5/18/2016 11:53:27 AM Page 1 of 3
Alcohol-Related Crashes by County
Table 7.02 - County Statistics

County Population Fatal Crashes
Injury Crashes
PDO Crashes
Total Crashes
Deaths Injuries
Hardin County 31,945 1 11 8 20 1 16
Harrison County 15,856 2 11 18 31 2 16
Henry County 29,210 3 13 18 34 4 16
Highland County 40,875 2 27 27 56 2 35
Hocking County 28,241 2 15 13 30 3 18
Holmes County 38,943 2 16 18 36 2 20
Huron County 59,487 3 21 32 56 3 33
Jackson County 32,641 1 20 16 37 1 29
Jefferson County 73,894 5 38 58 101 5 55
Knox County 54,500 1 20 30 51 1 26
Lake County 227,511 2 89 137 228 2 129
Lawrence County 62,319 2 27 16 45 2 33
Licking County 145,491 5 70 96 171 5 95
Logan County 46,005 1 35 31 67 1 49
Lorain County 284,664 14 122 166 302 17 167
Lucas County 455,054 13 164 238 415 15 256
Madison County 40,213 2 19 29 50 2 35
Mahoning County 257,555 9 98 112 219 10 139
Marion County 66,217 1 23 32 56 2 34
Medina County 151,095 5 62 82 149 5 76
Meigs County 23,072 2 10 13 25 2 16
Mercer County 40,924 2 22 33 57 2 31
Miami County 98,868 4 40 88 132 4 44
Monroe County 15,180 1 9 10 20 1 11
Montgomery County
559,062 20 239 312 571 22 371
Morgan County 14,897 1 6 10 17 1 8
Morrow County 31,628 2 12 21 35 2 14
Muskingum County
84,585 3 55 87 145 3 74
Noble County 14,058 2 3 4 9 2 3
Ottawa County 40,985 3 14 38 55 3 18
Paulding County 20,293 0 11 12 23 0 11
Perry County 34,078 1 26 12 39 1 33
Pickaway County 52,727 0 21 19 40 0 28
Pike County 27,695 0 21 16 37 0 31
Portage County 152,061 5 76 103 184 5 97
Preble County 42,337 4 21 29 54 4 23
Report generated on : 5/18/2016 11:53:27 AM Page 2 of 3
Alcohol-Related Crashes by County
Table 7.02 - County Statistics

County Population Fatal Crashes
Injury Crashes
PDO Crashes
Total Crashes
Deaths Injuries
Putnam County 34,726 2 13 10 25 2 23
Richland County 128,852 4 62 79 145 7 91
Ross County 73,345 3 44 63 110 3 65
Sandusky County 61,792 4 32 35 71 4 43
Scioto County 79,195 2 36 49 87 3 51
Seneca County 58,683 2 31 24 57 2 35
Shelby County 47,910 2 24 26 52 2 32
Stark County 378,098 3 193 252 448 3 255
Summit County 542,899 7 228 316 551 7 309
Trumbull County 225,116 8 114 107 229 8 157
Tuscarawas County
90,914 0 53 94 147 0 71
Union County 40,909 4 27 23 54 4 37
Van Wert County 29,659 0 7 14 21 0 8
Vinton County 12,806 1 5 7 13 1 7
Warren County 158,383 3 84 128 215 3 117
Washington County
63,251 4 18 31 53 4 26
Wayne County 111,564 1 38 44 83 1 50
Williams County 39,188 2 26 34 62 3 47
Wood County 121,065 3 45 96 144 4 61
Wyandot County 22,908 1 10 6 17 1 11
State of Ohio 11,353,140 316 5,090 7,120 12,526 346 7,130
Report generated on : 5/18/2016 11:53:27 AM Page 3 of 3
Alcohol-Related Crashes by County
Table 7.02 - County Statistics

County Jan Feb Mar Apr May Jun Jul Aug Sep Oct Nov Dec Total
Adams County 11 8 11 12 12 15 11 7 10 24 52 35 208
Allen County 19 26 30 12 18 20 11 9 21 53 90 68 377
Ashland County 23 17 20 12 23 22 17 11 14 46 78 36 319
Ashtabula County 21 7 22 22 32 25 17 15 18 54 78 44 355
Athens County 6 7 7 16 19 7 4 10 11 23 43 15 168
Auglaize County 12 10 17 12 22 10 2 3 8 26 45 27 194
Belmont County 4 5 3 3 11 5 5 7 4 11 26 4 88
Brown County 19 16 16 15 16 17 10 14 18 25 55 26 247
Butler County 20 22 17 31 28 23 12 9 18 32 72 28 312
Carroll County 4 1 3 3 1 0 1 1 2 5 7 2 30
Champaign County 5 6 5 5 3 3 8 1 1 12 17 11 77
Clark County 16 16 18 4 23 9 15 11 11 29 52 27 231
Clermont County 40 27 39 30 40 26 26 23 32 61 106 41 491
Clinton County 11 6 17 15 21 16 9 9 12 31 49 17 213
Columbiana County 14 10 30 15 14 9 9 3 16 42 35 18 215
Coshocton County 5 0 5 0 0 1 1 3 1 3 6 4 29
Crawford County 15 18 22 15 19 18 15 11 15 38 55 31 272
Cuyahoga County 20 23 33 27 48 37 15 15 24 54 82 30 408
Darke County 20 6 18 15 13 10 14 12 12 37 53 30 240
Defiance County 36 28 31 19 22 22 29 15 19 46 71 71 409
Delaware County 27 20 26 20 20 18 13 17 25 69 86 43 384
Erie County 12 11 12 13 18 22 10 7 16 50 72 30 273
Fairfield County 12 8 9 10 13 8 7 5 4 21 43 16 156
From Date 01/01/2015
To Date 12/31/2015
County(s) All Counties
Report generated on : 5/18/2016 11:53:32 AM Page 1 of 4
Deer Crashes by County and Month
Table 7.03 - Unit Statistics

County Jan Feb Mar Apr May Jun Jul Aug Sep Oct Nov Dec Total
Fayette County 11 1 2 12 6 5 11 3 7 17 34 25 134
Franklin County 27 15 21 13 34 19 17 10 17 40 83 30 326
Fulton County 12 11 16 12 17 27 15 5 4 30 54 23 226
Gallia County 12 10 13 8 11 7 2 12 6 19 24 27 151
Geauga County 24 10 13 11 21 12 16 14 16 35 63 41 276
Greene County 24 22 13 21 24 15 10 8 13 45 65 35 295
Guernsey County 11 8 10 10 25 14 7 10 8 29 50 16 198
Hamilton County 30 21 27 37 52 35 31 26 24 81 112 51 527
Hancock County 22 19 22 17 30 28 21 10 25 60 89 68 411
Hardin County 11 11 14 7 17 13 15 8 13 23 41 34 207
Harrison County 1 3 2 0 2 2 1 2 3 5 10 5 36
Henry County 9 4 7 8 21 17 8 7 11 24 48 19 183
Highland County 17 5 6 3 5 7 9 9 9 12 18 12 112
Hocking County 2 2 4 4 9 4 2 4 8 13 19 6 77
Holmes County 3 2 2 3 2 4 3 5 1 8 11 10 54
Huron County 32 15 18 8 20 13 20 8 13 28 45 38 258
Jackson County 15 13 12 13 17 18 9 8 17 23 74 26 245
Jefferson County 3 7 4 3 3 4 6 6 5 10 17 4 72
Knox County 25 20 17 20 16 23 13 13 15 41 42 30 275
Lake County 16 1 17 11 33 28 5 6 11 28 33 21 210
Lawrence County 6 5 7 3 7 7 3 6 6 17 17 12 96
Licking County 6 8 11 7 24 15 10 8 9 30 42 12 182
Logan County 13 20 20 12 16 10 15 3 4 27 53 19 212
Lorain County 41 22 40 29 55 43 30 26 40 77 140 53 596
Lucas County 20 25 39 15 30 17 28 20 19 60 77 46 396
Madison County 8 8 7 2 5 6 6 1 1 14 15 12 85
Mahoning County 25 10 24 19 30 19 13 14 12 50 93 39 348
Report generated on : 5/18/2016 11:53:32 AM Page 2 of 4
Deer Crashes by County and Month
Table 7.03 - Unit Statistics

County Jan Feb Mar Apr May Jun Jul Aug Sep Oct Nov Dec Total
Marion County 25 9 15 15 17 23 14 16 13 26 67 29 269
Medina County 32 13 26 25 30 17 19 15 18 60 111 35 401
Meigs County 5 5 3 3 4 5 4 3 2 15 20 8 77
Mercer County 9 4 10 6 11 14 13 4 9 21 42 24 167
Miami County 16 18 15 19 14 13 14 8 8 40 48 19 232
Monroe County 1 1 1 0 0 2 0 1 1 2 0 0 9
Montgomery County 15 13 14 10 30 16 9 11 4 32 46 26 226
Morgan County 3 1 2 1 0 2 3 2 0 2 6 2 24
Morrow County 17 12 14 15 15 15 6 4 9 26 49 27 209
Muskingum County 16 20 24 7 17 6 16 12 14 32 63 31 258
Noble County 4 1 2 5 2 1 1 2 1 0 9 5 33
Ottawa County 6 5 5 5 7 12 9 13 12 36 33 27 170
Paulding County 16 11 23 14 18 15 12 11 11 23 30 17 201
Perry County 4 5 2 2 6 0 1 0 3 5 3 2 33
Pickaway County 17 8 16 10 17 9 8 8 7 21 59 11 191
Pike County 9 5 14 6 12 9 7 6 9 16 34 20 147
Portage County 28 10 30 17 40 27 10 7 18 64 89 46 386
Preble County 18 9 17 10 8 7 11 1 6 14 36 25 162
Putnam County 5 5 10 10 6 5 6 4 5 22 19 15 112
Richland County 34 25 34 16 35 28 22 16 20 74 131 68 503
Ross County 12 23 29 19 24 26 21 10 19 37 78 42 340
Sandusky County 20 13 19 21 21 18 24 8 8 40 56 30 278
Scioto County 10 8 11 11 7 9 10 8 6 23 38 34 175
Seneca County 23 23 25 13 23 19 17 8 22 44 68 39 324
Shelby County 13 9 19 14 20 16 20 7 9 34 57 40 258
Stark County 43 28 27 36 34 27 18 24 18 74 141 57 527
Summit County 28 20 26 17 42 28 20 12 19 69 89 28 398
Report generated on : 5/18/2016 11:53:32 AM Page 3 of 4
Deer Crashes by County and Month
Table 7.03 - Unit Statistics
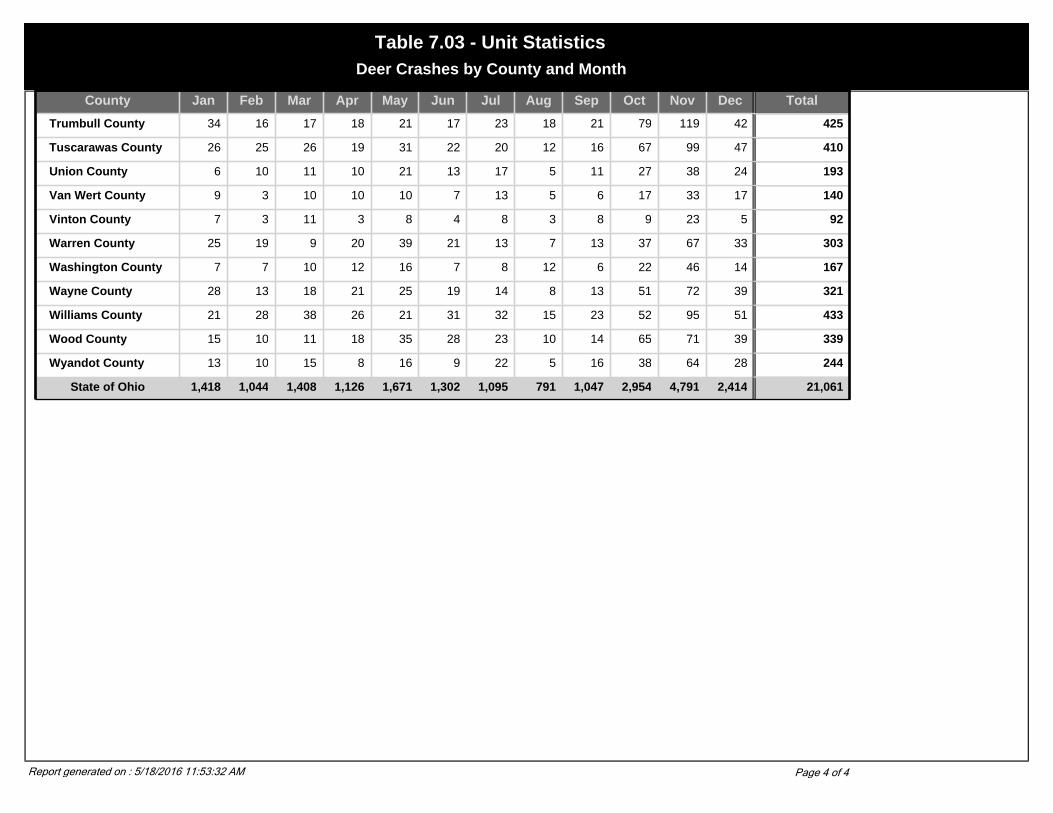
County Jan Feb Mar Apr May Jun Jul Aug Sep Oct Nov Dec Total
Trumbull County 34 16 17 18 21 17 23 18 21 79 119 42 425
Tuscarawas County 26 25 26 19 31 22 20 12 16 67 99 47 410
Union County 6 10 11 10 21 13 17 5 11 27 38 24 193
Van Wert County 9 3 10 10 10 7 13 5 6 17 33 17 140
Vinton County 7 3 11 3 8 4 8 3 8 9 23 5 92
Warren County 25 19 9 20 39 21 13 7 13 37 67 33 303
Washington County 7 7 10 12 16 7 8 12 6 22 46 14 167
Wayne County 28 13 18 21 25 19 14 8 13 51 72 39 321
Williams County 21 28 38 26 21 31 32 15 23 52 95 51 433
Wood County 15 10 11 18 35 28 23 10 14 65 71 39 339
Wyandot County 13 10 15 8 16 9 22 5 16 38 64 28 244
State of Ohio 1,418 1,044 1,408 1,126 1,671 1,302 1,095 791 1,047 2,954 4,791 2,414 21,061
Report generated on : 5/18/2016 11:53:32 AM Page 4 of 4
Deer Crashes by County and Month
Table 7.03 - Unit Statistics

County Population Fatal Crashes
Injury Crashes
PDO Crashes
Total Crashes
Deaths Injuries
Adams County 27,330 1 4 0 5 1 4
Allen County 108,473 3 1 0 4 3 2
Ashland County 52,523 0 2 0 2 0 2
Ashtabula County 102,728 1 4 0 5 2 4
Athens County 62,223 1 1 0 2 1 2
Auglaize County 46,611 0 2 0 2 0 3
Belmont County 70,226 0 3 0 3 0 3
Brown County 42,285 0 0 0 0 0 0
Butler County 332,807 0 4 2 6 0 5
Carroll County 28,836 0 0 0 0 0 0
Champaign County 38,890 0 0 0 0 0 0
Clark County 144,742 2 5 0 7 2 6
Clermont County 177,977 0 4 0 4 0 5
Clinton County 40,543 0 0 1 1 0 0
Columbiana County 112,075 0 5 0 5 0 5
Coshocton County 36,655 0 0 0 0 0 0
Crawford County 46,966 1 2 0 3 1 3
Cuyahoga County 1,393,978 4 12 0 16 4 16
Darke County 53,309 0 0 0 0 0 0
Defiance County 39,500 0 3 0 3 0 3
Delaware County 109,989 1 2 0 3 1 3
Erie County 79,551 0 5 0 5 0 6
Fairfield County 122,759 1 2 1 4 1 3
Fayette County 28,433 0 0 0 0 0 0
Franklin County 1,068,978 1 15 5 21 1 17
Fulton County 42,084 0 1 0 1 0 1
Gallia County 31,069 0 1 0 1 0 1
Geauga County 90,895 0 2 0 2 0 2
Greene County 147,886 1 6 1 8 1 6
Guernsey County 40,792 0 1 0 1 0 1
Hamilton County 845,303 3 7 0 10 3 7
Hancock County 71,295 1 2 0 3 2 2
From Date 01/01/2015
To Date 12/31/2015
County(s) All Counties
Report generated on : 5/18/2016 11:53:36 AM Page 1 of 3
Alcohol-Related Motorcycle Crashes by County
Table 7.04 - County Statistics

County Population Fatal Crashes
Injury Crashes
PDO Crashes
Total Crashes
Deaths Injuries
Hardin County 31,945 0 0 0 0 0 0
Harrison County 15,856 0 0 0 0 0 0
Henry County 29,210 1 0 0 1 1 0
Highland County 40,875 0 1 0 1 0 1
Hocking County 28,241 0 1 0 1 0 1
Holmes County 38,943 0 2 0 2 0 2
Huron County 59,487 0 0 0 0 0 0
Jackson County 32,641 0 0 0 0 0 0
Jefferson County 73,894 0 2 0 2 0 2
Knox County 54,500 0 0 0 0 0 0
Lake County 227,511 0 7 1 8 0 8
Lawrence County 62,319 0 3 0 3 0 3
Licking County 145,491 1 3 0 4 1 3
Logan County 46,005 1 7 0 8 1 5
Lorain County 284,664 0 3 1 4 0 3
Lucas County 455,054 2 7 5 14 2 10
Madison County 40,213 0 1 1 2 0 2
Mahoning County 257,555 0 5 1 6 0 6
Marion County 66,217 0 3 0 3 0 4
Medina County 151,095 1 2 0 3 1 2
Meigs County 23,072 0 2 0 2 0 3
Mercer County 40,924 0 1 0 1 0 1
Miami County 98,868 0 3 2 5 0 3
Monroe County 15,180 1 0 0 1 1 0
Montgomery County
559,062 3 11 1 15 3 17
Morgan County 14,897 1 0 0 1 1 0
Morrow County 31,628 0 2 1 3 0 2
Muskingum County 84,585 1 2 0 3 1 4
Noble County 14,058 0 0 0 0 0 0
Ottawa County 40,985 1 0 1 2 1 0
Paulding County 20,293 0 0 0 0 0 0
Perry County 34,078 0 2 0 2 0 2
Pickaway County 52,727 0 1 0 1 0 1
Pike County 27,695 0 0 0 0 0 0
Portage County 152,061 1 6 0 7 1 6
Preble County 42,337 2 4 0 6 2 4
Report generated on : 5/18/2016 11:53:36 AM Page 2 of 3
Alcohol-Related Motorcycle Crashes by County
Table 7.04 - County Statistics

County Population Fatal Crashes
Injury Crashes
PDO Crashes
Total Crashes
Deaths Injuries
Putnam County 34,726 0 0 0 0 0 0
Richland County 128,852 0 3 0 3 0 3
Ross County 73,345 1 1 0 2 1 2
Sandusky County 61,792 0 7 0 7 0 8
Scioto County 79,195 0 2 0 2 0 2
Seneca County 58,683 0 3 0 3 0 3
Shelby County 47,910 0 0 0 0 0 0
Stark County 378,098 0 12 1 13 0 11
Summit County 542,899 1 13 2 16 1 15
Trumbull County 225,116 2 7 0 9 2 8
Tuscarawas County 90,914 0 3 0 3 0 2
Union County 40,909 1 3 1 5 1 3
Van Wert County 29,659 0 0 0 0 0 0
Vinton County 12,806 0 0 0 0 0 0
Warren County 158,383 0 4 0 4 0 6
Washington County 63,251 0 2 0 2 0 2
Wayne County 111,564 0 0 0 0 0 0
Williams County 39,188 0 2 0 2 0 3
Wood County 121,065 1 1 0 2 1 2
Wyandot County 22,908 0 3 1 4 0 3
State of Ohio 11,353,140 43 243 29 315 45 280
Report generated on : 5/18/2016 11:53:36 AM Page 3 of 3
Alcohol-Related Motorcycle Crashes by County
Table 7.04 - County Statistics

City / Village County Population Fatal Crashes
Injury Crashes
PDO Crashes
Total Crashes
Deaths Injuries
Aberdeen BRO 1,603 0 0 1 1 0 0
Ada HAR 5,582 0 3 10 13 0 4
Adams (County) ADA 27,330 0 0 1 1 0 0
Adams (Township of) CHP 1,100 0 2 10 12 0 2
Adams (Township of) CLI 1,901 0 14 47 61 0 19
Adams (Township of) COS 755 0 1 4 5 0 1
Adams (Township of) DAR 3,508 0 16 44 60 0 24
Adams (Township of) DEF 999 0 5 20 25 0 8
Adams (Township of) GUE 2,019 0 11 31 42 0 16
Adams (Township of) MOE 672 0 5 11 16 0 7
Adams (Township of) MUS 516 0 2 1 3 0 2
Adams (Township of) SEN 1,337 0 16 30 46 0 18
Adams (Township of) WAS 1,830 0 7 20 27 0 7
Addison (Township of) GAL 2,366 0 17 46 63 0 21
Addyston HAM 1,010 0 6 12 18 0 16
Adelphi ROS 371 0 0 2 2 0 0
Adena JEF 815 0 0 1 1 0 0
Aid (Township of) LAW 907 0 8 14 22 0 11
Akron SUM 217,074 11 1,675 5,525 7,211 11 2,472
Albany ATH 808 0 1 6 7 0 1
Alexander (Township of) ATH 2,614 1 16 47 64 1 23
Alexandria LIC 85 0 4 7 11 0 4
Alger HAR 888 0 0 7 7 0 0
Allen (County) ALL 108,473 0 0 1 1 0 0
Allen (Township of) DAR 1,158 0 5 19 24 0 5
Allen (Township of) HAN 2,110 1 43 198 242 1 68
Allen (Township of) OTT 3,591 0 16 27 43 0 24
Allen (Township of) UNI 1,518 1 25 102 128 1 34
Alliance STA 23,253 0 93 387 480 0 135
Amanda FAI 707 0 8 12 20 0 16
Amanda (Township of) ALL 1,913 0 12 41 53 0 17
Amanda (Township of) FAI 2,429 1 10 14 25 1 15
From Date 01/01/2015
To Date 12/31/2015
County(s) All Counties
Report generated on : 5/18/2016 11:53:54 AM Page 1 of 62
Total Crashes by City / Village
Table 8.01 - City / Village Statistics
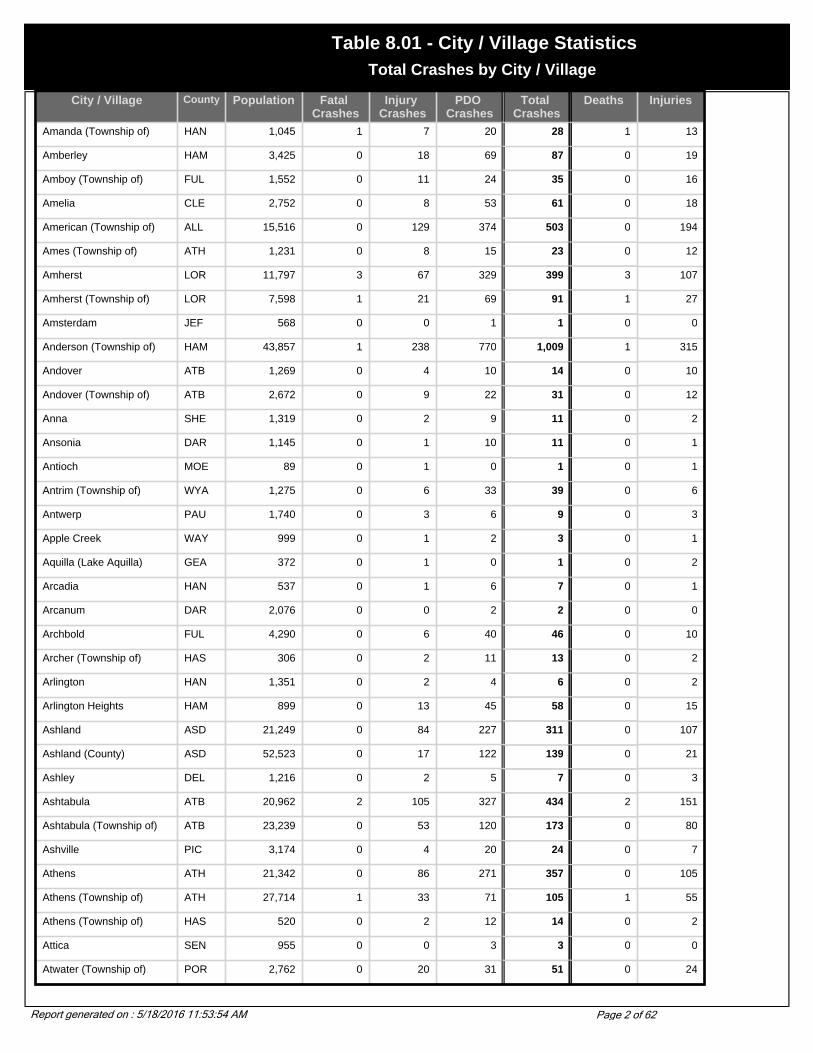
City / Village County Population Fatal Crashes
Injury Crashes
PDO Crashes
Total Crashes
Deaths Injuries
Amanda (Township of) HAN 1,045 1 7 20 28 1 13
Amberley HAM 3,425 0 18 69 87 0 19
Amboy (Township of) FUL 1,552 0 11 24 35 0 16
Amelia CLE 2,752 0 8 53 61 0 18
American (Township of) ALL 15,516 0 129 374 503 0 194
Ames (Township of) ATH 1,231 0 8 15 23 0 12
Amherst LOR 11,797 3 67 329 399 3 107
Amherst (Township of) LOR 7,598 1 21 69 91 1 27
Amsterdam JEF 568 0 0 1 1 0 0
Anderson (Township of) HAM 43,857 1 238 770 1,009 1 315
Andover ATB 1,269 0 4 10 14 0 10
Andover (Township of) ATB 2,672 0 9 22 31 0 12
Anna SHE 1,319 0 2 9 11 0 2
Ansonia DAR 1,145 0 1 10 11 0 1
Antioch MOE 89 0 1 0 1 0 1
Antrim (Township of) WYA 1,275 0 6 33 39 0 6
Antwerp PAU 1,740 0 3 6 9 0 3
Apple Creek WAY 999 0 1 2 3 0 1
Aquilla (Lake Aquilla) GEA 372 0 1 0 1 0 2
Arcadia HAN 537 0 1 6 7 0 1
Arcanum DAR 2,076 0 0 2 2 0 0
Archbold FUL 4,290 0 6 40 46 0 10
Archer (Township of) HAS 306 0 2 11 13 0 2
Arlington HAN 1,351 0 2 4 6 0 2
Arlington Heights HAM 899 0 13 45 58 0 15
Ashland ASD 21,249 0 84 227 311 0 107
Ashland (County) ASD 52,523 0 17 122 139 0 21
Ashley DEL 1,216 0 2 5 7 0 3
Ashtabula ATB 20,962 2 105 327 434 2 151
Ashtabula (Township of) ATB 23,239 0 53 120 173 0 80
Ashville PIC 3,174 0 4 20 24 0 7
Athens ATH 21,342 0 86 271 357 0 105
Athens (Township of) ATH 27,714 1 33 71 105 1 55
Athens (Township of) HAS 520 0 2 12 14 0 2
Attica SEN 955 0 0 3 3 0 0
Atwater (Township of) POR 2,762 0 20 31 51 0 24
Report generated on : 5/18/2016 11:53:54 AM Page 2 of 62
Total Crashes by City / Village
Table 8.01 - City / Village Statistics

City / Village County Population Fatal Crashes
Injury Crashes
PDO Crashes
Total Crashes
Deaths Injuries
Auburn (Township of) CRA 897 0 3 19 22 0 3
Auburn (Township of) GEA 5,158 0 28 85 113 0 42
Auburn (Township of) TUS 1,078 0 4 16 20 0 4
Auglaize (Township of) ALL 2,850 0 16 53 69 0 35
Auglaize (Township of) PAU 1,535 0 6 33 39 0 9
Augusta (Township of) CAR 1,599 2 6 35 43 2 9
Aurelius (Township of) WAS 441 0 9 12 21 0 12
Aurora POR 13,556 0 32 160 192 0 44
Austinburg (Township of) ATB 2,234 1 29 91 121 2 40
Austintown MAH 31,627 1 80 220 301 1 105
Austintown (Township of) MAH 38,001 5 165 526 696 6 241
Avon LOR 11,446 1 144 450 595 1 199
Avon Lake LOR 18,145 0 39 152 191 0 49
Bainbridge GEA 3,417 0 1 4 5 0 2
Bainbridge ROS 1,012 0 0 9 9 0 0
Bainbridge (Township of) GEA 10,916 1 84 207 292 1 121
Bairdstown WOO 130 0 0 1 1 0 0
Ballville SAN 3,255 2 10 28 40 2 21
Ballville (Township of) SAN 6,395 1 13 56 70 1 24
Baltic HOL 743 0 0 1 1 0 0
Baltic TUS 743 0 0 1 1 0 0
Baltimore FAI 2,881 0 0 1 1 0 0
Barberton SUM 27,899 1 156 358 515 1 228
Barlow (Township of) WAS 2,417 0 18 34 52 0 26
Barnesville BEL 4,225 0 13 100 113 0 15
Barnhill TUS 364 0 1 2 3 0 1
Bartlow (Township of) HEN 2,460 0 8 18 26 0 14
Batavia CLE 1,617 0 75 169 244 0 109
Batavia (Township of) CLE 17,503 0 96 279 375 0 136
Bath (Township of) ALL 9,819 1 79 310 390 1 105
Bath (Township of) GRE 40,231 0 80 188 268 0 112
Bath (Township of) SUM 9,635 0 73 208 281 0 90
Baughman (Township of) WAY 4,699 0 21 61 82 0 24
Bay (Township of) OTT 1,294 0 7 37 44 0 10
Bay View ERI 692 0 0 1 1 0 0
Bay Village (corporate name for Bay)
CUY 16,087 0 32 59 91 0 39
Report generated on : 5/18/2016 11:53:54 AM Page 3 of 62
Total Crashes by City / Village
Table 8.01 - City / Village Statistics

City / Village County Population Fatal Crashes
Injury Crashes
PDO Crashes
Total Crashes
Deaths Injuries
Bazetta (Township of) TRU 6,306 0 50 162 212 0 70
Beach City STA 1,137 0 2 4 6 0 2
Beachwood CUY 12,186 2 192 441 635 2 260
Beallsville MOE 423 0 0 1 1 0 0
Bearfield (Township of) PER 1,412 0 11 10 21 0 16
Beaver PIK 464 0 5 7 12 0 5
Beaver (Township of) MAH 6,466 0 67 200 267 0 112
Beaver (Township of) NOB 758 0 1 12 13 0 1
Beaver (Township of) PIK 1,450 0 4 13 17 0 8
Beavercreek GRE 37,984 2 270 1,009 1,281 2 409
Beavercreek (Township of) GRE 41,745 1 94 214 309 1 141
Beaverdam (RR name Beaver Dam)
ALL 356 0 1 3 4 0 1
Bedford CUY 14,214 0 101 246 347 0 143
Bedford (Township of) COS 601 0 2 3 5 0 2
Bedford (Township of) MEG 1,212 0 6 15 21 0 13
Bedford Heights CUY 11,375 1 66 162 229 1 96
Bellaire BEL 4,892 0 0 3 3 0 0
Bellbrook GRE 7,009 0 7 22 29 0 9
Belle Center LOG 807 0 5 3 8 0 6
Bellefontaine LOG 13,069 0 55 287 342 0 74
Bellevue HUR 8,193 0 5 25 30 0 10
Bellevue SAN 8,193 0 0 19 19 0 0
Bellville RIC 1,773 0 5 28 33 0 7
Belmont BEL 532 0 2 2 4 0 2
Beloit MAH 1,024 0 0 2 2 0 0
Belpre WAS 6,660 0 36 95 131 0 54
Belpre (Township of) WAS 4,192 0 25 42 67 0 38
Bennington (Township of) LIC 1,265 0 6 11 17 0 8
Bennington (Township of) MRW 2,663 2 42 122 166 2 78
Bentleyville CUY 947 0 2 8 10 0 2
Benton (Township of) HOC 814 0 4 14 18 0 6
Benton (Township of) MOE 349 0 1 4 5 0 1
Benton (Township of) OTT 2,621 1 12 49 62 1 16
Benton (Township of) PAU 1,035 0 3 18 21 0 5
Benton (Township of) PIK 1,520 0 14 17 31 0 19
Benton Ridge HAN 315 0 1 5 6 0 1
Report generated on : 5/18/2016 11:53:54 AM Page 4 of 62
Total Crashes by City / Village
Table 8.01 - City / Village Statistics

City / Village County Population Fatal Crashes
Injury Crashes
PDO Crashes
Total Crashes
Deaths Injuries
Berea CUY 18,970 0 51 222 273 0 63
Berkey LUC 265 0 0 2 2 0 0
Berkshire (Township of) DEL 2,251 0 84 255 339 0 121
Berlin (Township of) DEL 3,315 1 22 72 95 1 35
Berlin (Township of) ERI 3,702 2 31 133 166 2 50
Berlin (Township of) HOL 3,857 0 29 80 109 0 41
Berlin (Township of) KNO 1,789 0 13 23 36 0 16
Berlin (Township of) MAH 2,240 1 9 31 41 1 14
Berlin Heights ERI 685 0 2 4 6 0 3
Bern (Township of) ATH 519 0 6 5 11 0 11
Berne (Township of) FAI 4,969 0 27 59 86 0 34
Bethel CLE 2,637 0 6 6 12 0 6
Bethel (Township of) CLA 18,962 4 92 197 293 4 121
Bethel (Township of) MIA 4,927 2 22 92 116 2 32
Bethel (Township of) MOE 357 0 2 3 5 0 3
Bethesda BEL 1,413 0 0 3 3 0 0
Bethlehem (Township of) COS 1,191 0 10 14 24 0 13
Bethlehem (Township of) STA 5,650 1 43 98 142 1 62
Bettsville SEN 784 0 0 6 6 0 0
Beverly WAS 1,282 0 1 6 7 0 1
Bexley FRA 13,203 1 55 181 237 1 86
Big Island (Township of) MAR 1,223 0 10 43 53 0 13
Big Spring (Township of) SEN 1,791 0 7 13 20 0 10
Biglick (Township of) HAN 955 0 9 43 52 0 13
Black Creek (Township of) MER 631 0 1 21 22 0 1
Blacklick Estates FRA 9,518 0 0 1 1 0 0
Blakeslee (RR name Blakesley)
WIL 130 0 0 1 1 0 0
Blanchard (Township of) HAN 1,170 0 4 58 62 0 4
Blanchard (Township of) HAR 1,640 1 9 20 30 4 14
Blanchard (Township of) PUT 1,232 0 6 16 22 0 9
Blanchester CLI 4,220 0 14 46 60 0 20
Blanchester WAR 4,220 0 1 0 1 0 1
Blendon (Township of) FRA 9,193 3 120 309 432 3 162
Bloom (Township of) FAI 6,374 1 22 35 58 1 31
Bloom (Township of) MRG 1,015 0 9 12 21 0 15
Bloom (Township of) SCI 3,218 0 19 40 59 0 24
Report generated on : 5/18/2016 11:53:54 AM Page 5 of 62
Total Crashes by City / Village
Table 8.01 - City / Village Statistics

City / Village County Population Fatal Crashes
Injury Crashes
PDO Crashes
Total Crashes
Deaths Injuries
Bloom (Township of) SEN 1,937 1 5 36 42 1 10
Bloom (Township of) WOO 2,535 1 20 79 100 1 21
Bloomdale WOO 724 0 0 2 2 0 0
Bloomfield (Township of) JAC 896 0 13 35 48 0 16
Bloomfield (Township of) LOG 419 0 2 10 12 0 2
Bloomfield (Township of) TRU 1,097 0 3 20 23 0 3
Bloomingburg FAY 874 0 0 3 3 0 0
Bloominggrove (Township of)
RIC 1,157 1 5 11 17 1 10
Blue Ash HAM 12,513 1 124 380 505 1 164
Blue Creek (Township of) PAU 804 1 3 6 10 1 5
Blue Rock (Township of) MUS 641 0 7 14 21 0 7
Bluffton ALL 3,896 0 2 37 39 0 2
Bluffton HAN 3,896 0 4 11 15 0 6
Boardman MAH 37,215 1 126 227 354 1 193
Boardman (Township of) MAH 42,518 0 282 822 1,104 0 415
Bokescreek (Township of) LOG 1,308 0 4 12 16 0 6
Bolivar TUS 894 0 0 6 6 0 0
Boston (Township of) SUM 1,664 0 22 60 82 0 28
Boston Heights SUM 1,186 0 34 131 165 0 37
Botkins SHE 1,205 0 2 5 7 0 3
Bowersville GRE 290 0 0 1 1 0 0
Bowling Green WOO 29,636 3 132 469 604 6 185
Bowling Green (Township of)
LIC 1,668 0 29 59 88 0 41
Bowling Green (Township of)
MAR 569 0 2 12 14 0 3
Braceville (Township of) TRU 2,887 1 30 90 121 1 52
Bradford DAR 1,859 0 0 4 4 0 0
Bradford MIA 1,859 1 2 10 13 1 2
Brady (Township of) WIL 2,822 0 15 67 82 0 22
Brady Lake (PC RR name Bradys Lake)
POR 513 0 2 3 5 0 2
Bratenahl CUY 1,337 2 65 124 191 2 101
Bratton (Township of) ADA 1,412 0 6 14 20 0 10
Brecksville CUY 13,382 1 40 171 212 2 63
Bremen FAI 1,265 0 0 3 3 0 0
Brewster STA 2,324 0 3 12 15 0 3
Brice FRA 70 0 0 1 1 0 0
Bridgeport BEL 2,186 0 9 50 59 0 14
Report generated on : 5/18/2016 11:53:54 AM Page 6 of 62
Total Crashes by City / Village
Table 8.01 - City / Village Statistics

City / Village County Population Fatal Crashes
Injury Crashes
PDO Crashes
Total Crashes
Deaths Injuries
Bridgewater (Township of) WIL 1,401 0 9 44 53 0 20
Brighton (Township of) LOR 942 0 7 20 27 0 9
Brimfield POR 3,248 0 4 17 21 0 6
Brimfield (Township of) POR 7,963 0 74 226 300 0 110
Bristol (Township of) MRG 207 0 3 9 12 0 3
Bristol (Township of) TRU 3,154 1 12 40 53 1 16
Broadview Heights CUY 15,967 1 78 283 362 1 104
Bronson (Township of) HUR 1,780 0 12 27 39 0 21
Brook Park CUY 21,218 0 83 227 310 0 108
Brookfield (Township of) NOB 119 0 1 4 5 0 1
Brookfield (Township of) TRU 10,020 0 34 96 130 0 53
Brooklyn CUY 11,586 0 78 281 359 0 104
Brooklyn Heights CUY 1,558 0 27 81 108 0 39
Brookville MOT 5,289 0 8 33 41 0 8
Brown (Township of) CAR 8,300 1 18 46 65 1 25
Brown (Township of) DAR 2,046 0 5 28 33 0 5
Brown (Township of) DEL 1,297 0 8 41 49 0 8
Brown (Township of) FRA 2,031 0 19 77 96 0 25
Brown (Township of) KNO 1,425 0 5 22 27 0 6
Brown (Township of) MIA 1,554 1 5 15 21 1 12
Brown (Township of) PAU 2,244 0 16 31 47 0 24
Brown (Township of) VIN 281 1 6 4 11 1 10
Brownhelm (Township of) LOR 7,782 0 22 67 89 0 27
Brunswick MED 33,388 0 98 308 406 0 129
Brunswick Hills (Township of)
MED 5,469 2 32 117 151 2 44
Brush Creek (Township of) ADA 1,231 0 4 13 17 0 15
Brush Creek (Township of) JEF 467 1 1 4 6 1 1
Brush Creek (Township of) MUS 1,375 0 11 24 35 0 19
Brush Creek (Township of) SCI 1,149 0 4 12 16 0 7
Brushcreek (Township of) HIG 1,308 0 5 11 16 0 6
Bryan WIL 8,333 1 34 123 158 1 52
Buchtel ATH 574 0 0 1 1 0 0
Buck (Township of) HAR 2,441 0 6 50 56 0 7
Buckeye Lake FAI 3,049 0 0 2 2 0 0
Buckeye Lake LIC 3,049 0 1 3 4 0 1
Bucks (Township of) TUS 1,601 0 7 11 18 0 9
Report generated on : 5/18/2016 11:53:54 AM Page 7 of 62
Total Crashes by City / Village
Table 8.01 - City / Village Statistics

City / Village County Population Fatal Crashes
Injury Crashes
PDO Crashes
Total Crashes
Deaths Injuries
Buckskin (Township of) ROS 1,040 0 13 29 42 0 20
Bucyrus CRA 13,224 0 33 192 225 0 49
Bucyrus (Township of) CRA 828 0 9 17 26 0 10
Buffalo (Township of) NOB 782 0 2 22 24 0 4
Burbank WAY 279 0 1 0 1 0 1
Burkettsville (RR name Gilberts)
DAR 254 0 1 1 2 0 1
Burlington (Township of) LIC 1,073 1 12 16 29 1 18
Burton GEA 1,450 0 16 32 48 0 24
Burton (Township of) GEA 4,358 0 10 34 44 0 17
Butler RIC 921 0 6 11 17 0 6
Butler (Township of) COL 3,444 0 15 33 48 0 25
Butler (Township of) DAR 1,616 0 5 27 32 0 8
Butler (Township of) KNO 798 0 4 13 17 0 9
Butler (Township of) MER 6,459 1 25 42 68 1 44
Butler (Township of) MOT 8,382 2 148 446 596 2 211
Butler (Township of) RIC 1,386 0 1 2 3 0 1
Byesville GUE 2,574 0 2 5 7 0 2
Byrd (Township of) BRO 740 0 3 7 10 0 3
Cadiz HAS 3,308 0 12 41 53 0 21
Cadiz (Township of) HAS 3,639 0 7 15 22 0 8
Caesars Creek (Township of)
GRE 1,225 0 9 29 38 0 17
Cairo ALL 499 0 0 6 6 0 0
Caldwell NOB 1,956 0 0 1 1 0 0
Caledonia MAR 578 0 1 1 2 0 2
Cambridge GUE 11,520 0 35 145 180 0 55
Cambridge (Township of) GUE 15,505 0 30 118 148 0 43
Camden PRE 2,302 0 1 5 6 0 2
Camden (Township of) LOR 1,530 1 21 24 46 1 31
Camp Creek (Township of) PIK 951 0 6 16 22 0 9
Campbell MAH 9,460 0 17 35 52 0 21
Canaan (Township of) ATH 1,780 0 7 39 46 0 11
Canaan (Township of) MAD 2,496 0 27 28 55 0 41
Canaan (Township of) MRW 897 2 7 21 30 2 9
Canaan (Township of) WAY 4,736 2 29 48 79 2 49
Canal Fulton STA 5,061 0 17 54 71 0 21
Canal Winchester FAI 4,478 0 22 69 91 0 27
Report generated on : 5/18/2016 11:53:55 AM Page 8 of 62
Total Crashes by City / Village
Table 8.01 - City / Village Statistics

City / Village County Population Fatal Crashes
Injury Crashes
PDO Crashes
Total Crashes
Deaths Injuries
Canal Winchester FRA 4,478 0 12 57 69 0 12
Canfield MAH 7,374 3 36 144 183 3 57
Canfield (Township of) MAH 14,624 0 42 172 214 0 72
Canton STA 80,806 3 530 1,631 2,164 3 722
Canton (Township of) STA 13,882 0 68 130 198 0 100
Cardington MRW 1,849 1 2 25 28 1 3
Cardington (Township of) MRW 2,790 0 2 2 4 0 3
Carey WYA 3,901 0 1 7 8 0 1
Carlisle WAR 5,121 1 13 37 51 1 16
Carlisle (Township of) LOR 7,339 0 57 155 212 0 70
Carroll FAI 488 0 0 2 2 0 0
Carroll (Township of) OTT 1,931 2 11 59 72 2 17
Carrollton CAR 3,190 0 11 48 59 0 16
Carryall (Township of) PAU 3,046 0 4 42 46 0 5
Carthage (Township of) ATH 1,467 0 8 24 32 0 8
Cass (Township of) HAN 1,098 2 14 40 56 3 28
Cass (Township of) MUS 1,492 1 18 53 72 1 21
Cass (Township of) RIC 1,735 0 7 30 37 0 12
Casstown MIA 322 0 0 4 4 0 0
Castalia ERI 935 0 3 7 10 0 3
Castine DAR 129 0 0 2 2 0 0
Catawba Island (Township of)
OTT 3,157 0 8 19 27 0 12
Cedarville GRE 3,828 0 7 18 25 0 7
Cedarville (Township of) GRE 5,092 0 10 30 40 0 17
Celina MER 10,303 0 58 190 248 0 78
Center (Township of) CAR 4,412 0 6 26 32 0 8
Center (Township of) COL 6,473 0 21 67 88 0 34
Center (Township of) GUE 1,779 0 30 64 94 0 43
Center (Township of) MER 1,082 0 6 23 29 0 9
Center (Township of) MOE 3,797 0 5 22 27 0 8
Center (Township of) MRG 652 0 3 8 11 0 4
Center (Township of) NOB 1,027 0 0 5 5 0 0
Center (Township of) WIL 3,056 0 14 116 130 0 16
Center (Township of) WOO 1,246 2 55 181 238 3 86
Centerburg KNO 1,432 0 2 12 14 0 2
Centerville MOT 23,024 0 123 395 518 0 183
Report generated on : 5/18/2016 11:53:55 AM Page 9 of 62
Total Crashes by City / Village
Table 8.01 - City / Village Statistics
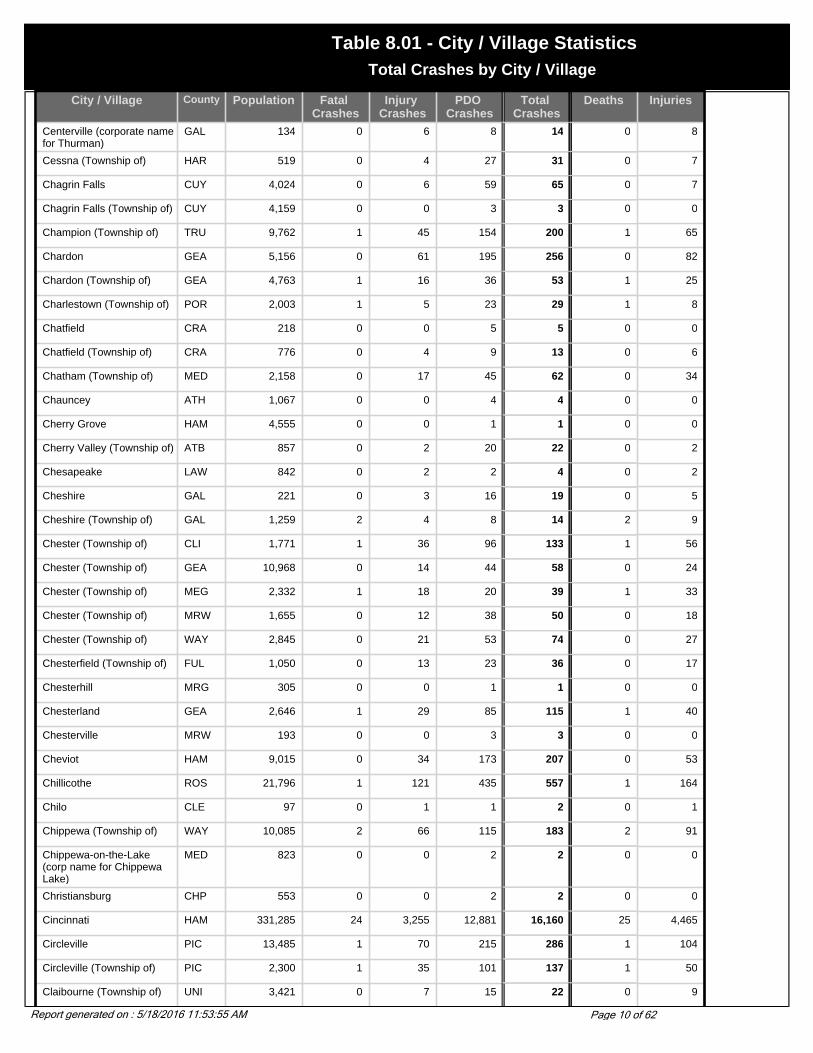
City / Village County Population Fatal Crashes
Injury Crashes
PDO Crashes
Total Crashes
Deaths Injuries
Centerville (corporate name for Thurman)
GAL 134 0 6 8 14 0 8
Cessna (Township of) HAR 519 0 4 27 31 0 7
Chagrin Falls CUY 4,024 0 6 59 65 0 7
Chagrin Falls (Township of) CUY 4,159 0 0 3 3 0 0
Champion (Township of) TRU 9,762 1 45 154 200 1 65
Chardon GEA 5,156 0 61 195 256 0 82
Chardon (Township of) GEA 4,763 1 16 36 53 1 25
Charlestown (Township of) POR 2,003 1 5 23 29 1 8
Chatfield CRA 218 0 0 5 5 0 0
Chatfield (Township of) CRA 776 0 4 9 13 0 6
Chatham (Township of) MED 2,158 0 17 45 62 0 34
Chauncey ATH 1,067 0 0 4 4 0 0
Cherry Grove HAM 4,555 0 0 1 1 0 0
Cherry Valley (Township of) ATB 857 0 2 20 22 0 2
Chesapeake LAW 842 0 2 2 4 0 2
Cheshire GAL 221 0 3 16 19 0 5
Cheshire (Township of) GAL 1,259 2 4 8 14 2 9
Chester (Township of) CLI 1,771 1 36 96 133 1 56
Chester (Township of) GEA 10,968 0 14 44 58 0 24
Chester (Township of) MEG 2,332 1 18 20 39 1 33
Chester (Township of) MRW 1,655 0 12 38 50 0 18
Chester (Township of) WAY 2,845 0 21 53 74 0 27
Chesterfield (Township of) FUL 1,050 0 13 23 36 0 17
Chesterhill MRG 305 0 0 1 1 0 0
Chesterland GEA 2,646 1 29 85 115 1 40
Chesterville MRW 193 0 0 3 3 0 0
Cheviot HAM 9,015 0 34 173 207 0 53
Chillicothe ROS 21,796 1 121 435 557 1 164
Chilo CLE 97 0 1 1 2 0 1
Chippewa (Township of) WAY 10,085 2 66 115 183 2 91
Chippewa-on-the-Lake (corp name for Chippewa Lake)
MED 823 0 0 2 2 0 0
Christiansburg CHP 553 0 0 2 2 0 0
Cincinnati HAM 331,285 24 3,255 12,881 16,160 25 4,465
Circleville PIC 13,485 1 70 215 286 1 104
Circleville (Township of) PIC 2,300 1 35 101 137 1 50
Claibourne (Township of) UNI 3,421 0 7 15 22 0 9
Report generated on : 5/18/2016 11:53:55 AM Page 10 of 62
Total Crashes by City / Village
Table 8.01 - City / Village Statistics
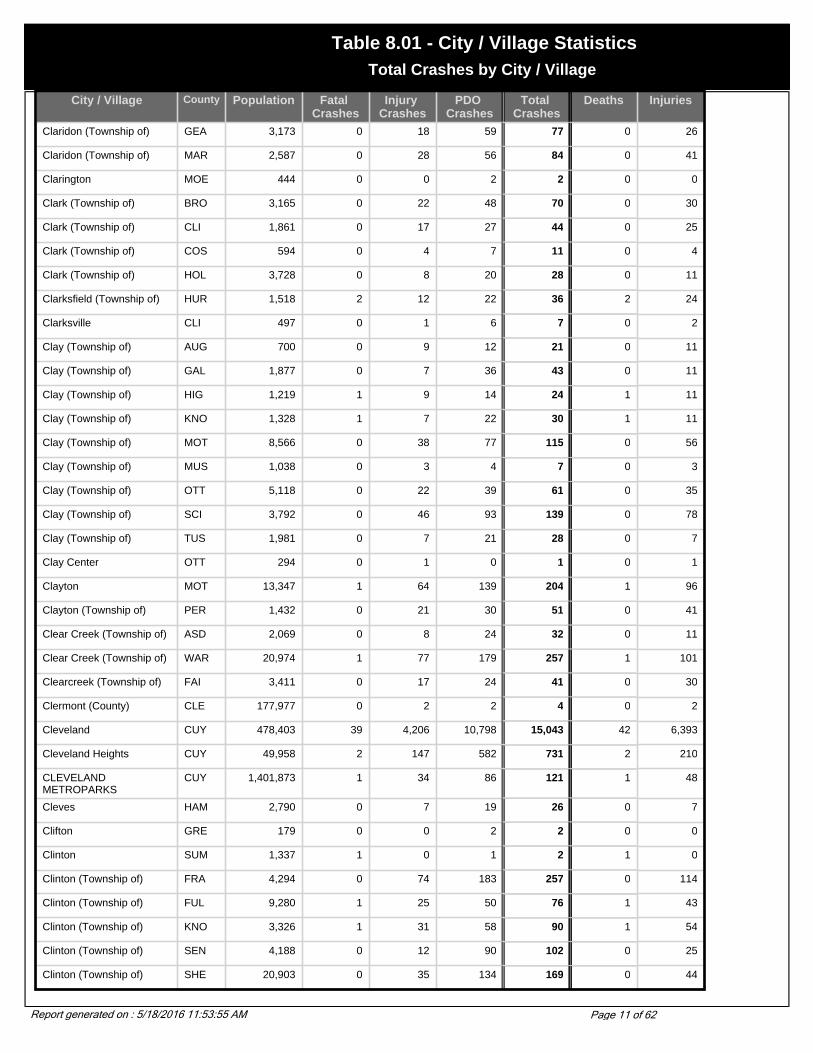
City / Village County Population Fatal Crashes
Injury Crashes
PDO Crashes
Total Crashes
Deaths Injuries
Claridon (Township of) GEA 3,173 0 18 59 77 0 26
Claridon (Township of) MAR 2,587 0 28 56 84 0 41
Clarington MOE 444 0 0 2 2 0 0
Clark (Township of) BRO 3,165 0 22 48 70 0 30
Clark (Township of) CLI 1,861 0 17 27 44 0 25
Clark (Township of) COS 594 0 4 7 11 0 4
Clark (Township of) HOL 3,728 0 8 20 28 0 11
Clarksfield (Township of) HUR 1,518 2 12 22 36 2 24
Clarksville CLI 497 0 1 6 7 0 2
Clay (Township of) AUG 700 0 9 12 21 0 11
Clay (Township of) GAL 1,877 0 7 36 43 0 11
Clay (Township of) HIG 1,219 1 9 14 24 1 11
Clay (Township of) KNO 1,328 1 7 22 30 1 11
Clay (Township of) MOT 8,566 0 38 77 115 0 56
Clay (Township of) MUS 1,038 0 3 4 7 0 3
Clay (Township of) OTT 5,118 0 22 39 61 0 35
Clay (Township of) SCI 3,792 0 46 93 139 0 78
Clay (Township of) TUS 1,981 0 7 21 28 0 7
Clay Center OTT 294 0 1 0 1 0 1
Clayton MOT 13,347 1 64 139 204 1 96
Clayton (Township of) PER 1,432 0 21 30 51 0 41
Clear Creek (Township of) ASD 2,069 0 8 24 32 0 11
Clear Creek (Township of) WAR 20,974 1 77 179 257 1 101
Clearcreek (Township of) FAI 3,411 0 17 24 41 0 30
Clermont (County) CLE 177,977 0 2 2 4 0 2
Cleveland CUY 478,403 39 4,206 10,798 15,043 42 6,393
Cleveland Heights CUY 49,958 2 147 582 731 2 210
CLEVELAND METROPARKS
CUY 1,401,873 1 34 86 121 1 48
Cleves HAM 2,790 0 7 19 26 0 7
Clifton GRE 179 0 0 2 2 0 0
Clinton SUM 1,337 1 0 1 2 1 0
Clinton (Township of) FRA 4,294 0 74 183 257 0 114
Clinton (Township of) FUL 9,280 1 25 50 76 1 43
Clinton (Township of) KNO 3,326 1 31 58 90 1 54
Clinton (Township of) SEN 4,188 0 12 90 102 0 25
Clinton (Township of) SHE 20,903 0 35 134 169 0 44
Report generated on : 5/18/2016 11:53:55 AM Page 11 of 62
Total Crashes by City / Village
Table 8.01 - City / Village Statistics

City / Village County Population Fatal Crashes
Injury Crashes
PDO Crashes
Total Crashes
Deaths Injuries
Clinton (Township of) VIN 2,045 0 16 34 50 0 21
Clinton (Township of) WAY 3,196 0 11 43 54 0 17
Clyde SAN 6,064 0 22 51 73 0 27
Coal (Township of) JAC 2,078 0 15 39 54 0 20
Coal (Township of) PER 1,106 0 4 1 5 0 6
Coal Grove LAW 2,027 0 1 4 5 0 2
Coalton JAC 545 0 2 0 2 0 3
Coitsville (Township of) MAH 1,608 0 10 17 27 0 13
Coldwater MER 4,482 0 7 31 38 0 8
Colebrook (Township of) ATB 887 0 13 26 39 0 16
Colerain (Township of) BEL 4,438 1 19 38 58 1 28
Colerain (Township of) HAM 60,144 0 12 31 43 0 14
Colerain (Township of) ROS 1,943 0 8 26 34 0 13
College (Township of) KNO 2,247 0 6 12 18 0 9
Columbia (Township of) HAM 6,557 1 40 233 274 1 54
Columbia (Township of) LOR 6,912 0 49 92 141 0 67
Columbia (Township of) MEG 1,018 1 6 20 27 1 6
Columbiana COL 5,635 0 61 209 270 0 95
Columbiana MAH 5,635 0 3 5 8 0 5
Columbus DEL 711,470 0 64 307 371 0 93
Columbus FAI 711,470 0 8 21 29 0 13
Columbus FRA 711,470 51 6,318 18,522 24,891 56 9,023
Columbus Grove PUT 2,200 0 6 10 16 0 7
Commercial Point PIC 776 0 3 3 6 0 4
Concord (Township of) CHP 1,408 0 5 13 18 0 6
Concord (Township of) DEL 4,507 1 31 96 128 1 42
Concord (Township of) FAY 1,068 2 1 11 14 2 1
Concord (Township of) HIG 1,167 0 4 14 18 0 10
Concord (Township of) LAK 15,282 0 85 233 318 0 107
Concord (Township of) MIA 27,335 1 41 164 206 1 66
Concord (Township of) ROS 4,107 1 33 77 111 1 52
Conesville COS 364 0 0 1 1 0 0
Congress WAY 192 1 15 42 58 1 24
Congress (Township of) MRW 2,128 0 7 23 30 0 7
Congress (Township of) WAY 4,435 0 11 48 59 0 15
Conneaut ATB 12,485 3 32 164 199 3 55
Report generated on : 5/18/2016 11:53:55 AM Page 12 of 62
Total Crashes by City / Village
Table 8.01 - City / Village Statistics

City / Village County Population Fatal Crashes
Injury Crashes
PDO Crashes
Total Crashes
Deaths Injuries
Continental PUT 1,188 0 1 2 3 0 1
Convoy VAN 1,110 0 0 9 9 0 0
Copley (Township of) SUM 13,641 2 96 346 444 2 121
Corning PER 593 0 1 0 1 0 1
Cortland TRU 6,830 0 16 28 44 0 22
Coshocton COS 11,682 0 34 154 188 0 45
Covedale HAM 6,360 0 0 1 1 0 0
Coventry (Township of) SUM 10,900 0 107 274 381 0 156
Covington MIA 2,559 0 9 46 55 0 14
Craig Beach MAH 1,254 0 2 2 4 0 2
Cranberry (Township of) CRA 1,674 0 3 11 14 0 3
Crane (Township of) PAU 1,530 1 9 36 46 1 16
Crane (Township of) WYA 7,394 1 23 102 126 1 37
Crawford (County) CRA 46,966 0 0 1 1 0 0
Crawford (Township of) COS 1,594 0 1 5 6 0 1
Crawford (Township of) WYA 5,080 1 15 52 68 1 19
Crestline CRA 5,088 0 4 20 24 0 5
Crestline RIC 5,088 0 0 1 1 0 0
Creston WAY 2,161 0 1 8 9 0 2
Crooksville PER 2,483 0 4 4 8 0 6
Crosby (Township of) HAM 2,748 0 13 39 52 0 24
Cross Creek (Township of) JEF 8,761 2 20 47 69 2 26
Crystal Lakes CLA 1,411 1 0 0 1 1 0
Custar WOO 208 0 0 1 1 0 0
Cuyahoga Falls SUM 49,374 1 286 1,132 1,419 1 381
Cuyahoga Heights CUY 599 0 23 82 105 0 34
Cygnet WOO 564 0 0 9 9 0 0
Cynthian (Township of) SHE 1,972 0 8 29 37 0 9
Dallas (Township of) CRA 455 0 5 24 29 0 10
Dalton WAY 1,605 0 4 5 9 0 5
Damascus (Township of) HEN 1,781 0 5 22 27 0 6
Danbury (Township of) OTT 4,631 0 37 60 97 0 53
Danville KNO 1,104 0 1 7 8 0 1
Darby (Township of) MAD 2,872 0 13 19 32 0 16
Darby (Township of) PIC 3,492 0 32 76 108 0 45
Darby (Township of) UNI 1,934 0 11 23 34 0 14
Report generated on : 5/18/2016 11:53:55 AM Page 13 of 62
Total Crashes by City / Village
Table 8.01 - City / Village Statistics

City / Village County Population Fatal Crashes
Injury Crashes
PDO Crashes
Total Crashes
Deaths Injuries
Darbyville PIC 293 0 0 2 2 0 0
Dayton MOT 166,179 21 1,274 2,597 3,892 23 1,874
De Graff (Degraff) LOG 1,212 0 9 10 19 0 10
Decatur (Township of) LAW 839 1 9 9 19 1 12
Decatur (Township of) WAS 1,181 1 6 6 13 1 7
Deer Creek (Township of) MAD 1,030 1 41 81 123 1 82
Deer Creek (Township of) PIC 1,644 0 2 7 9 0 2
Deer Park HAM 5,982 0 13 68 81 0 16
Deerfield (Township of) MRG 802 1 5 5 11 1 8
Deerfield (Township of) POR 3,211 1 22 57 80 1 34
Deerfield (Township of) ROS 1,096 0 4 10 14 0 5
Deerfield (Township of) WAR 25,515 0 230 744 974 0 347
Defiance DEF 16,465 2 95 449 546 3 139
Defiance (Township of) DEF 13,461 1 10 35 46 1 15
Delaware DEL 25,243 2 183 635 820 3 248
Delaware (Township of) DEF 2,128 0 9 39 48 0 12
Delaware (Township of) DEL 26,149 0 7 25 32 0 7
Delaware (Township of) HAN 1,229 1 10 31 42 1 16
Delhi (Township of) HAM 30,104 7 490 1,625 2,122 7 709
Dellroy CAR 294 0 0 1 1 0 0
Delphos ALL 6,944 0 10 45 55 0 10
Delphos VAN 6,944 0 6 22 28 0 10
Delta FUL 2,930 0 6 12 18 0 8
Denmark (Township of) ATB 880 1 9 29 39 1 14
Dennison TUS 2,992 0 0 1 1 0 0
Dent HAM 7,612 0 0 1 1 0 0
Deshler HEN 1,831 0 0 1 1 0 0
Dillonvale JEF 781 0 3 4 7 0 4
Dinsmore (Township of) SHE 3,357 0 19 60 79 0 22
Dixon (Township of) PRE 557 0 5 9 14 0 7
Dodson (Township of) HIG 2,514 1 11 24 36 1 13
Donnelsville CLA 293 0 0 1 1 0 0
Dorset (Township of) ATB 892 1 4 21 26 1 4
Dover TUS 12,210 0 83 252 335 0 112
Dover (Township of) ATH 3,797 0 31 74 105 0 41
Dover (Township of) FUL 1,468 1 23 47 71 1 38
Report generated on : 5/18/2016 11:53:57 AM Page 14 of 62
Total Crashes by City / Village
Table 8.01 - City / Village Statistics

City / Village County Population Fatal Crashes
Injury Crashes
PDO Crashes
Total Crashes
Deaths Injuries
Dover (Township of) TUS 4,726 0 47 118 165 0 62
Dover (Township of) UNI 2,331 1 9 28 38 1 14
Doylestown WAY 2,799 0 1 9 10 0 3
Dresden MUS 1,423 0 0 1 1 0 0
Dublin DEL 31,392 0 2 7 9 0 2
Dublin FRA 31,392 2 246 608 856 2 339
Dublin UNI 31,392 0 4 5 9 0 4
Dublin (Township of) MER 2,254 1 12 44 57 1 22
Duchouquet (Township of) AUG 14,329 2 32 139 173 2 49
Dudley (Township of) HAR 1,257 0 4 26 30 0 13
Dunham (Township of) WAS 2,505 0 8 27 35 0 13
Dunkirk HAR 952 0 3 2 5 0 3
Eagle (Township of) BRO 1,438 0 19 28 47 0 24
Eagle (Township of) HAN 1,195 1 14 67 82 1 19
Eagle (Township of) VIN 412 0 4 4 8 0 5
East (Township of) CAR 859 0 0 4 4 0 0
East Cleveland CUY 27,217 3 72 217 292 3 102
East Liverpool COL 13,089 1 33 163 197 1 47
East Palestine COL 4,917 0 2 34 36 0 2
East Sparta STA 806 0 2 2 4 0 3
East Union (Township of) WAY 6,527 1 45 101 147 2 65
Eastlake LAK 20,255 0 83 186 269 0 120
Eaton PRE 8,133 1 38 141 180 1 48
Eaton (Township of) LOR 9,675 1 61 168 230 2 95
Eden (Township of) LIC 1,243 1 6 19 26 1 9
Eden (Township of) SEN 2,020 0 10 70 80 0 15
Eden (Township of) WYA 1,026 1 6 15 22 1 12
Edgerton WIL 2,117 0 8 12 20 0 16
Edinburg (Township of) POR 2,344 2 34 86 122 2 52
Edison MRW 437 0 0 1 1 0 0
Edon WIL 898 0 1 6 7 0 2
Eldorado PRE 543 0 0 4 4 0 0
Elida ALL 1,917 0 2 20 22 0 3
Elizabeth (Township of) LAW 2,914 0 17 27 44 0 24
Elizabeth (Township of) MIA 1,620 0 4 23 27 0 4
Elk (Township of) NOB 305 0 2 1 3 0 2
Report generated on : 5/18/2016 11:53:57 AM Page 15 of 62
Total Crashes by City / Village
Table 8.01 - City / Village Statistics

City / Village County Population Fatal Crashes
Injury Crashes
PDO Crashes
Total Crashes
Deaths Injuries
Elk (Township of) VIN 3,134 0 10 34 44 0 13
Elkrun (Township of) COL 4,781 1 15 55 71 1 18
Ellsworth (Township of) MAH 2,234 0 9 38 47 0 13
Elmore OTT 1,426 0 1 5 6 0 1
Elmwood Place HAM 2,681 0 1 5 6 0 1
Elyria LOR 55,953 1 386 1,055 1,442 1 551
Elyria (Township of) LOR 3,520 0 59 94 153 0 86
Emerald (Township of) PAU 824 0 14 35 49 0 23
Empire JEF 300 0 0 3 3 0 0
Englewood MOT 12,235 4 78 278 360 4 114
Enoch (Township of) NOB 413 0 1 1 2 0 1
Enon CLA 2,638 0 0 9 9 0 0
Erie (County) ERI 79,551 0 3 7 10 0 6
Erie (Township of) OTT 1,328 0 6 55 61 0 8
Etna (Township of) LIC 5,410 1 64 125 190 1 85
Euclid CUY 52,717 1 265 548 814 1 379
Evendale HAM 3,090 0 107 289 396 0 148
Fairborn GRE 32,052 0 149 528 677 0 215
Fairfax HAM 1,938 1 65 216 282 1 84
Fairfield BUT 42,097 4 349 919 1,272 4 519
Fairfield HAM 42,097 0 0 3 3 0 0
Fairfield (County) FAI 122,759 0 125 352 477 0 201
Fairfield (Township of) BUT 15,571 0 108 274 382 0 172
Fairfield (Township of) COL 9,583 1 41 75 117 1 60
Fairfield (Township of) HIG 3,219 1 16 24 41 1 18
Fairfield (Township of) HUR 1,284 0 7 11 18 0 7
Fairfield (Township of) MAD 1,333 0 6 16 22 0 11
Fairfield (Township of) TUS 1,487 0 17 40 57 0 21
Fairfield (Township of) WAS 1,011 0 5 9 14 0 6
Fairlawn SUM 7,307 0 69 251 320 0 93
Fairport Harbor (Fairport) LAK 3,180 0 2 19 21 0 3
Fairview GUE 81 0 0 1 1 0 0
Fairview Park (Fairview) CUY 17,572 0 67 174 241 0 85
Falls (Township of) HOC 11,409 2 31 69 102 2 43
Falls (Township of) MUS 8,585 1 72 235 308 1 108
Fallsbury (Township of) LIC 865 0 4 7 11 0 5
Report generated on : 5/18/2016 11:53:57 AM Page 16 of 62
Total Crashes by City / Village
Table 8.01 - City / Village Statistics

City / Village County Population Fatal Crashes
Injury Crashes
PDO Crashes
Total Crashes
Deaths Injuries
Farmer (Township of) DEF 932 0 6 24 30 0 6
Farmersville MOT 980 0 0 1 1 0 0
Farmington (Township of) TRU 2,353 0 7 16 23 0 7
Fayette (County) FAY 28,433 0 0 1 1 0 0
Fayette (Township of) LAW 9,169 0 87 139 226 0 134
Fayetteville BRO 372 0 1 3 4 0 2
Fearing (Township of) WAS 910 0 9 16 25 0 12
Felicity CLE 922 0 1 2 3 0 1
Findlay HAN 38,967 1 222 834 1,057 1 308
Fitchville (Township of) HUR 1,012 0 8 31 39 0 12
Flatrock (Township of) HEN 1,254 1 9 32 42 1 13
Fletcher MIA 510 0 0 3 3 0 0
Florence (Township of) ERI 2,500 0 19 67 86 0 29
Florence (Township of) WIL 2,115 0 11 23 34 0 20
Flushing BEL 900 0 4 11 15 0 4
Flushing (Township of) BEL 1,990 0 2 10 12 0 2
Forest HAR 1,488 0 1 6 7 0 1
Forest Park HAM 19,463 1 124 523 648 1 192
Fort Jennings PUT 432 0 0 4 4 0 0
Fort Loramie (Loramie) SHE 1,344 0 0 1 1 0 0
Fort Recovery MER 1,273 0 5 13 18 0 8
Fort Shawnee ALL 3,855 0 0 3 3 0 0
Fostoria HAN 13,931 0 7 34 41 0 9
Fostoria SEN 13,931 0 31 140 171 0 38
Fostoria WOO 13,931 1 8 14 23 1 12
Fowler (Township of) TRU 2,733 1 13 41 55 1 18
Fox (Township of) CAR 1,075 0 2 13 15 0 5
Frankfort ROS 1,011 0 0 8 8 0 0
Franklin WAR 11,396 0 41 96 137 0 59
Franklin (County) FRA 1,068,978 0 0 2 2 0 0
Franklin (Township of) ADA 1,167 0 12 43 55 0 18
Franklin (Township of) BRO 1,596 0 4 15 19 0 5
Franklin (Township of) CLE 4,348 0 16 49 65 0 18
Franklin (Township of) COL 766 0 8 8 16 0 9
Franklin (Township of) COS 1,286 0 7 16 23 0 8
Franklin (Township of) DAR 1,206 1 6 14 21 2 9
Report generated on : 5/18/2016 11:53:57 AM Page 17 of 62
Total Crashes by City / Village
Table 8.01 - City / Village Statistics

City / Village County Population Fatal Crashes
Injury Crashes
PDO Crashes
Total Crashes
Deaths Injuries
Franklin (Township of) FRA 11,798 1 162 264 427 1 259
Franklin (Township of) FUL 739 0 11 74 85 0 18
Franklin (Township of) HAS 641 0 4 11 15 0 10
Franklin (Township of) JAC 1,913 1 18 83 102 1 26
Franklin (Township of) LIC 1,782 1 8 21 30 1 10
Franklin (Township of) MER 2,303 0 6 39 45 0 10
Franklin (Township of) MOE 453 0 4 8 12 0 4
Franklin (Township of) MRW 1,410 1 21 78 100 1 31
Franklin (Township of) POR 5,276 0 42 129 171 0 55
Franklin (Township of) RIC 1,772 1 21 48 70 2 43
Franklin (Township of) ROS 1,671 1 18 30 49 2 34
Franklin (Township of) SHE 2,842 0 16 96 112 0 25
Franklin (Township of) TUS 4,244 0 24 78 102 0 32
Franklin (Township of) WAR 27,794 1 144 476 621 1 195
Franklin (Township of) WAY 3,485 0 21 55 76 0 28
Frazeysburg MUS 1,201 0 0 9 9 0 0
Fredericksburg WAY 487 0 1 2 3 0 1
Fredericktown KNO 2,428 0 2 11 13 0 2
Freedom (Township of) HEN 1,002 2 10 20 32 2 15
Freedom (Township of) POR 2,751 0 26 93 119 0 36
Freedom (Township of) WOO 2,695 2 13 52 67 2 21
Freeport HAS 398 0 4 4 8 0 5
Freeport (Township of) HAS 763 0 4 8 12 0 5
Fremont SAN 17,375 0 58 254 312 0 91
Fulton (County) FUL 42,084 0 1 2 3 0 1
Fulton (Township of) FUL 3,261 0 14 51 65 0 19
Gahanna FRA 32,636 0 139 604 743 0 181
Galena DEL 305 0 0 1 1 0 0
Galion CRA 11,341 0 36 155 191 0 50
Gallipolis GAL 4,180 0 43 142 185 0 56
Gallipolis (Township of) GAL 5,707 1 17 44 62 1 27
Gambier KNO 1,871 0 1 8 9 0 1
Gann (corporate name for Brinkhaven)
KNO 143 0 0 1 1 0 0
Garfield Heights CUY 30,734 1 191 575 767 1 269
Garrettsville (RR name Garrettsville-Hiram)
POR 2,262 0 5 19 24 0 5
Gasper (Township of) PRE 3,229 1 16 33 50 1 23
Report generated on : 5/18/2016 11:53:58 AM Page 18 of 62
Total Crashes by City / Village
Table 8.01 - City / Village Statistics

City / Village County Population Fatal Crashes
Injury Crashes
PDO Crashes
Total Crashes
Deaths Injuries
Gates Mills CUY 2,493 1 15 50 66 2 23
Geneva ATB 6,595 0 17 77 94 0 26
Geneva (Township of) ATB 11,954 0 16 35 51 0 22
Geneva-on-the-Lake ATB 1,545 0 2 3 5 0 2
Genoa OTT 2,230 0 3 12 15 0 4
Genoa (Township of) DEL 11,293 0 49 138 187 0 57
Georgetown BRO 3,691 2 11 42 55 2 17
German (Township of) AUG 3,831 0 6 21 27 0 8
German (Township of) CLA 7,663 1 26 90 117 1 38
German (Township of) FUL 6,458 1 22 67 90 1 46
German (Township of) HAS 767 0 2 8 10 0 2
German (Township of) MOT 7,830 1 26 48 75 1 38
Germantown MOT 4,884 0 12 63 75 0 18
Gettysburg DAR 558 0 0 2 2 0 0
Gibson (Township of) MER 1,869 1 5 20 26 1 9
Gibsonburg SAN 2,506 0 0 17 17 0 0
Gilboa PUT 170 0 0 1 1 0 0
Gilead (Township of) MRW 5,868 1 17 42 60 1 27
Girard TRU 10,902 0 59 157 216 0 72
Glandorf PUT 919 1 1 3 5 1 1
Glendale HAM 2,188 0 27 88 115 0 36
Glenford PER 198 0 0 1 1 0 0
Glenmont HOL 283 0 0 3 3 0 0
Glenwillow (RR name Falls Junction)
CUY 449 0 6 10 16 0 9
Gloria Glens Park MED 538 0 0 2 2 0 0
Glouster ATH 1,972 0 2 15 17 0 2
Gnadenhutten TUS 1,280 0 0 1 1 0 0
Good Hope (Township of) HOC 1,444 0 11 41 52 0 19
Gorham (Township of) FUL 2,372 2 10 32 44 3 21
Goshen (Township of) AUG 523 0 4 18 22 0 4
Goshen (Township of) BEL 3,252 0 9 32 41 0 12
Goshen (Township of) CHP 3,383 0 14 29 43 0 18
Goshen (Township of) CLE 13,663 2 81 193 276 2 118
Goshen (Township of) HAR 585 1 2 13 16 1 10
Goshen (Township of) MAH 3,281 0 23 60 83 0 32
Goshen (Township of) TUS 5,285 0 59 171 230 0 69
Report generated on : 5/18/2016 11:53:58 AM Page 19 of 62
Total Crashes by City / Village
Table 8.01 - City / Village Statistics
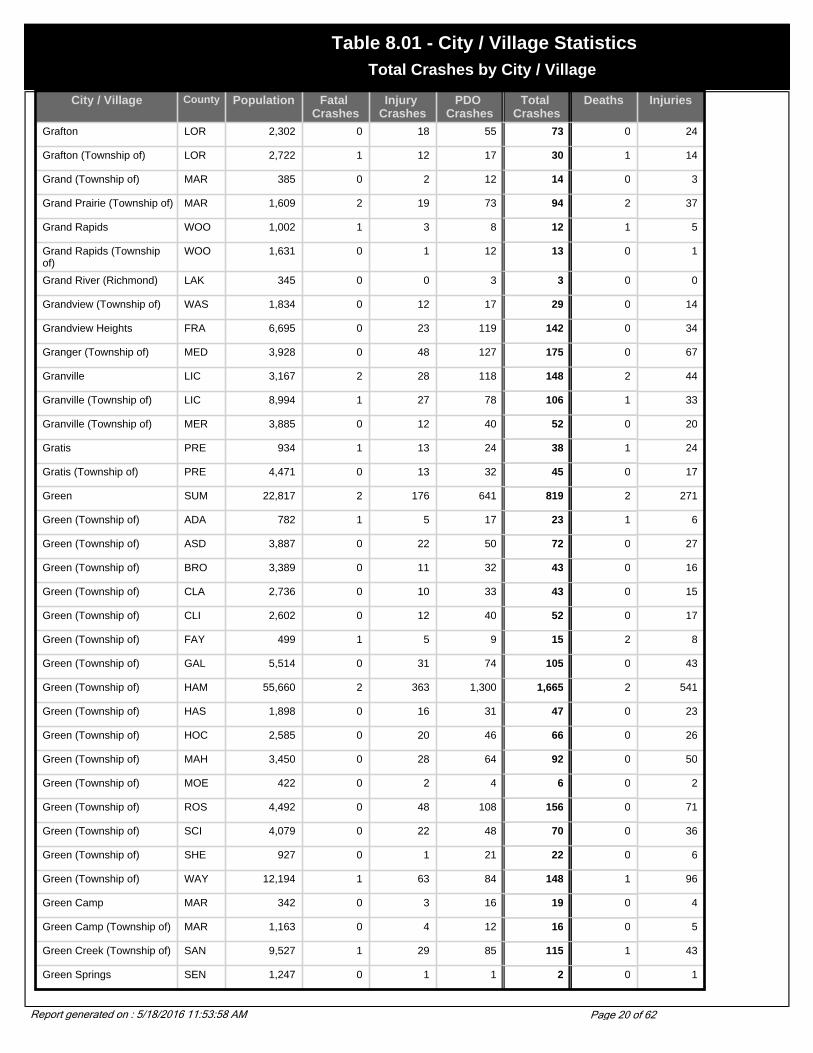
City / Village County Population Fatal Crashes
Injury Crashes
PDO Crashes
Total Crashes
Deaths Injuries
Grafton LOR 2,302 0 18 55 73 0 24
Grafton (Township of) LOR 2,722 1 12 17 30 1 14
Grand (Township of) MAR 385 0 2 12 14 0 3
Grand Prairie (Township of) MAR 1,609 2 19 73 94 2 37
Grand Rapids WOO 1,002 1 3 8 12 1 5
Grand Rapids (Township of)
WOO 1,631 0 1 12 13 0 1
Grand River (Richmond) LAK 345 0 0 3 3 0 0
Grandview (Township of) WAS 1,834 0 12 17 29 0 14
Grandview Heights FRA 6,695 0 23 119 142 0 34
Granger (Township of) MED 3,928 0 48 127 175 0 67
Granville LIC 3,167 2 28 118 148 2 44
Granville (Township of) LIC 8,994 1 27 78 106 1 33
Granville (Township of) MER 3,885 0 12 40 52 0 20
Gratis PRE 934 1 13 24 38 1 24
Gratis (Township of) PRE 4,471 0 13 32 45 0 17
Green SUM 22,817 2 176 641 819 2 271
Green (Township of) ADA 782 1 5 17 23 1 6
Green (Township of) ASD 3,887 0 22 50 72 0 27
Green (Township of) BRO 3,389 0 11 32 43 0 16
Green (Township of) CLA 2,736 0 10 33 43 0 15
Green (Township of) CLI 2,602 0 12 40 52 0 17
Green (Township of) FAY 499 1 5 9 15 2 8
Green (Township of) GAL 5,514 0 31 74 105 0 43
Green (Township of) HAM 55,660 2 363 1,300 1,665 2 541
Green (Township of) HAS 1,898 0 16 31 47 0 23
Green (Township of) HOC 2,585 0 20 46 66 0 26
Green (Township of) MAH 3,450 0 28 64 92 0 50
Green (Township of) MOE 422 0 2 4 6 0 2
Green (Township of) ROS 4,492 0 48 108 156 0 71
Green (Township of) SCI 4,079 0 22 48 70 0 36
Green (Township of) SHE 927 0 1 21 22 0 6
Green (Township of) WAY 12,194 1 63 84 148 1 96
Green Camp MAR 342 0 3 16 19 0 4
Green Camp (Township of) MAR 1,163 0 4 12 16 0 5
Green Creek (Township of) SAN 9,527 1 29 85 115 1 43
Green Springs SEN 1,247 0 1 1 2 0 1
Report generated on : 5/18/2016 11:53:58 AM Page 20 of 62
Total Crashes by City / Village
Table 8.01 - City / Village Statistics

City / Village County Population Fatal Crashes
Injury Crashes
PDO Crashes
Total Crashes
Deaths Injuries
Greene (Township of) TRU 986 0 14 20 34 0 17
Greenfield HIG 4,906 0 9 42 51 0 10
Greenfield (Township of) FAI 4,944 3 38 87 128 3 59
Greenfield (Township of) GAL 498 0 2 8 10 0 2
Greenfield (Township of) HUR 1,442 1 19 46 66 1 27
Greenhills HAM 4,103 0 5 23 28 0 6
Greensburg (Township of) PUT 1,425 0 3 30 33 0 3
Greentown STA 3,154 0 0 1 1 0 0
Greenville DAR 13,294 1 70 203 274 1 101
Greenville (Township of) DAR 18,125 0 44 159 203 0 80
Greenwich HUR 1,525 0 1 10 11 0 3
Greenwich (Township of) HUR 954 1 5 22 28 1 7
Groton (Township of) ERI 1,384 0 27 111 138 0 39
Grove City FRA 27,075 0 182 499 681 0 244
Groveport FRA 3,865 0 59 72 131 0 103
Guernsey (County) GUE 40,792 0 0 1 1 0 0
Guilford (Township of) MED 5,447 0 39 77 116 0 58
Gustavus (Township of) TRU 948 0 2 13 15 0 2
Guyan (Township of) GAL 1,199 1 9 12 22 1 11
Hale (Township of) HAR 1,559 0 7 28 35 0 9
Hambden (Township of) GEA 4,024 0 22 61 83 0 25
Hamden VIN 871 0 0 1 1 0 0
Hamer (Township of) HIG 699 0 5 7 12 0 8
Hamersville BRO 515 0 1 2 3 0 1
Hamilton BUT 60,690 2 651 1,354 2,007 2 1,004
Hamilton (Township of) FRA 7,950 0 60 158 218 0 87
Hamilton (Township of) JAC 513 0 5 14 19 0 6
Hamilton (Township of) LAW 1,817 0 7 13 20 0 7
Hamilton (Township of) WAR 9,630 1 61 304 366 1 80
Hamler HEN 650 0 1 5 6 0 1
Hanging Rock LAW 279 0 1 2 3 0 1
Hanover LIC 885 0 5 9 14 0 6
Hanover (Township of) ASD 2,520 0 7 18 25 0 13
Hanover (Township of) BUT 7,878 0 48 111 159 0 61
Hanover (Township of) COL 3,749 0 19 46 65 0 22
Hanover (Township of) LIC 2,731 0 7 28 35 0 10
Report generated on : 5/18/2016 11:53:58 AM Page 21 of 62
Total Crashes by City / Village
Table 8.01 - City / Village Statistics

City / Village County Population Fatal Crashes
Injury Crashes
PDO Crashes
Total Crashes
Deaths Injuries
Hanoverton COL 387 0 1 1 2 0 1
Harding (Township of) LUC 724 1 5 10 16 1 7
Hardy (Township of) HOL 5,643 0 17 36 53 0 25
Harlan (Township of) WAR 3,627 0 30 55 85 0 43
Harlem (Township of) DEL 3,762 0 20 32 52 0 30
Harmony (Township of) CLA 3,548 2 32 120 154 2 52
Harmony (Township of) MRW 2,040 1 22 92 115 1 29
Harpersfield (Township of) ATB 2,603 1 22 95 118 1 36
Harris (Township of) OTT 3,009 0 21 56 77 0 30
Harrisburg PIC 332 0 0 2 2 0 0
Harrison HAM 7,487 0 47 195 242 0 67
Harrison (Township of) CAR 2,498 0 13 38 51 0 18
Harrison (Township of) CHP 823 0 1 5 6 0 1
Harrison (Township of) DAR 2,145 1 8 28 37 1 14
Harrison (Township of) GAL 1,003 0 7 14 21 0 7
Harrison (Township of) HAM 12,469 0 20 61 81 0 26
Harrison (Township of) HEN 1,232 0 4 43 47 0 4
Harrison (Township of) KNO 747 0 4 20 24 0 8
Harrison (Township of) LIC 6,494 0 33 74 107 0 44
Harrison (Township of) LOG 2,093 1 13 57 71 1 19
Harrison (Township of) MOT 24,303 2 282 392 676 3 415
Harrison (Township of) MUS 1,638 1 9 10 20 1 10
Harrison (Township of) PAU 1,566 2 6 14 22 2 11
Harrison (Township of) PER 5,399 0 22 17 39 0 28
Harrison (Township of) PIC 6,424 0 33 76 109 0 50
Harrison (Township of) PRE 4,601 1 20 57 78 1 26
Harrison (Township of) ROS 1,293 0 10 11 21 0 13
Harrison (Township of) SCI 4,497 2 28 72 102 3 35
Harrison (Township of) VAN 1,085 0 3 22 25 0 6
Harrison (Township of) VIN 1,030 0 11 28 39 0 15
Harrisville (Township of) MED 4,914 0 45 105 150 0 69
Harrod (RR name Harrods) ALL 491 0 0 2 2 0 0
Hartford (corporate name for Croton)
LIC 412 0 0 2 2 0 0
Hartford (Township of) LIC 1,290 1 8 8 17 1 11
Hartford (Township of) TRU 2,104 0 8 36 44 0 10
Hartland (Township of) HUR 979 0 4 13 17 0 4
Report generated on : 5/18/2016 11:53:58 AM Page 22 of 62
Total Crashes by City / Village
Table 8.01 - City / Village Statistics

City / Village County Population Fatal Crashes
Injury Crashes
PDO Crashes
Total Crashes
Deaths Injuries
Hartsgrove (Township of) ATB 1,395 1 6 20 27 2 6
Hartville STA 2,174 0 22 47 69 0 26
Harveysburg WAR 563 0 0 2 2 0 0
Haskins WOO 638 0 2 4 6 0 2
Hayesville ASD 348 0 1 2 3 0 2
Heath (Fourmile Lock) LIC 8,527 2 88 237 327 2 120
Hebron LIC 2,034 0 5 25 30 0 8
Helena SAN 236 0 0 2 2 0 0
Henrietta (Township of) LOR 1,873 2 20 40 62 2 27
Henry (Township of) WOO 4,070 0 36 75 111 0 68
Hicksville DEF 3,649 0 15 63 78 0 19
Hicksville (Township of) DEF 5,003 0 4 27 31 0 8
Highland HIG 283 0 0 4 4 0 0
Highland (County) HIG 40,875 0 5 23 28 0 7
Highland (Township of) DEF 2,658 0 5 41 46 0 8
Highland (Township of) MUS 848 0 5 19 24 0 8
Highland Heights CUY 8,082 1 47 126 174 1 71
Highland Hills CUY 1,618 0 11 15 26 0 18
Hilliar (Township of) KNO 3,080 1 20 35 56 1 32
Hilliard (RR name Hilliards) FRA 24,230 2 192 595 789 2 261
Hills and Dales STA 260 0 1 2 3 0 1
Hillsboro HIG 6,368 0 31 203 234 0 40
Hinckley (Township of) MED 6,753 0 31 71 102 0 43
Hiram POR 1,242 0 8 17 25 0 10
Hiram (Township of) POR 2,296 1 11 23 35 1 16
Hoaglin (Township of) VAN 605 2 6 8 16 2 14
Hocking (Township of) FAI 4,812 1 40 71 112 1 68
Holgate HEN 1,194 1 1 3 5 1 1
Holiday City WIL 49 0 1 1 2 0 3
Holland LUC 1,306 0 8 43 51 0 9
Hollansburg DAR 214 0 0 5 5 0 0
Holmes (County) HOL 38,943 0 7 20 27 0 9
Holmes (Township of) CRA 1,330 0 11 61 72 0 15
Holmesville HOL 386 0 1 7 8 0 1
Homer (Township of) MED 1,461 0 17 20 37 0 24
Homer (Township of) MRG 976 0 7 5 12 0 10
Report generated on : 5/18/2016 11:53:58 AM Page 23 of 62
Total Crashes by City / Village
Table 8.01 - City / Village Statistics

City / Village County Population Fatal Crashes
Injury Crashes
PDO Crashes
Total Crashes
Deaths Injuries
Hopewell (Township of) LIC 1,200 0 6 17 23 0 7
Hopewell (Township of) MER 1,066 1 6 23 30 1 6
Hopewell (Township of) MUS 3,038 1 20 61 82 1 28
Hopewell (Township of) PER 2,163 1 18 18 37 1 22
Hopewell (Township of) SEN 2,874 0 29 71 100 0 41
Howard (Township of) KNO 4,319 0 23 69 92 0 32
Howland (Township of) TRU 19,451 0 151 445 596 0 230
Hoytville WOO 296 0 1 1 2 0 2
Hubbard TRU 8,284 0 36 85 121 0 56
Hubbard (Township of) TRU 14,304 0 22 43 65 0 29
Huber Heights MOT 38,212 3 191 662 856 3 280
Hudson SUM 22,439 1 83 343 427 1 104
Hunting Valley CUY 735 0 6 15 21 0 13
Huntington (Township of) BRO 2,968 0 22 30 52 0 27
Huntington (Township of) GAL 1,511 0 10 18 28 0 14
Huntington (Township of) LOR 1,282 0 12 20 32 0 21
Huntington (Township of) ROS 6,018 1 44 84 129 1 63
Huntsburg (Township of) GEA 3,297 0 11 33 44 0 19
Huntsville LOG 454 0 3 10 13 0 4
Huron ERI 7,958 1 6 20 27 1 6
Huron (County) HUR 59,487 0 2 8 10 0 3
Huron (Township of) ERI 10,530 0 17 87 104 0 27
Independence CUY 7,109 0 144 337 481 0 184
Independence (Township of)
WAS 387 0 4 4 8 0 7
Island Creek (Township of) JEF 12,078 2 55 136 193 2 72
Israel (Township of) PRE 1,273 0 16 27 43 0 27
Ithaca DAR 102 0 0 2 2 0 0
Jackson JAC 6,184 0 37 123 160 0 55
Jackson (Township of) ALL 2,936 0 23 65 88 0 29
Jackson (Township of) ASD 3,554 0 27 57 84 0 44
Jackson (Township of) AUG 3,577 0 9 13 22 0 11
Jackson (Township of) BRO 1,221 0 7 11 18 0 10
Jackson (Township of) CHP 2,535 0 8 11 19 0 9
Jackson (Township of) CLE 2,576 1 22 48 71 1 27
Jackson (Township of) COS 2,045 0 10 19 29 0 13
Jackson (Township of) CRA 5,487 1 7 20 28 1 9
Report generated on : 5/18/2016 11:53:59 AM Page 24 of 62
Total Crashes by City / Village
Table 8.01 - City / Village Statistics

City / Village County Population Fatal Crashes
Injury Crashes
PDO Crashes
Total Crashes
Deaths Injuries
Jackson (Township of) DAR 3,057 1 8 19 28 1 12
Jackson (Township of) FRA 32,625 3 101 281 385 3 139
Jackson (Township of) GUE 5,399 0 38 78 116 0 54
Jackson (Township of) HAN 1,060 1 18 79 98 1 24
Jackson (Township of) HAR 2,139 0 6 22 28 0 7
Jackson (Township of) HIG 1,099 0 7 16 23 0 8
Jackson (Township of) JAC 1,296 1 1 25 27 1 1
Jackson (Township of) KNO 878 0 2 8 10 0 4
Jackson (Township of) MAH 2,167 1 49 158 208 2 67
Jackson (Township of) MOE 473 0 3 8 11 0 4
Jackson (Township of) MOT 6,420 0 4 8 12 0 8
Jackson (Township of) MUS 2,221 0 8 20 28 0 12
Jackson (Township of) NOB 536 0 2 2 4 0 2
Jackson (Township of) PAU 1,886 0 10 44 54 0 21
Jackson (Township of) PER 2,791 0 19 29 48 0 25
Jackson (Township of) PIC 916 0 7 21 28 0 7
Jackson (Township of) PIK 1,346 0 6 23 29 0 6
Jackson (Township of) PRE 1,223 0 11 28 39 0 15
Jackson (Township of) PUT 939 0 4 5 9 0 4
Jackson (Township of) RIC 3,861 0 30 45 75 0 47
Jackson (Township of) SAN 1,609 0 10 30 40 0 12
Jackson (Township of) SEN 1,640 1 14 21 36 1 17
Jackson (Township of) SHE 2,346 0 6 25 31 0 6
Jackson (Township of) STA 37,744 3 337 1,387 1,727 3 492
Jackson (Township of) UNI 914 0 5 17 22 0 6
Jackson (Township of) VAN 481 0 1 3 4 0 1
Jackson (Township of) VIN 714 0 4 8 12 0 5
Jackson (Township of) WOO 751 0 4 12 16 0 4
Jackson (Township of) WYA 643 0 5 8 13 0 8
Jackson Center SHE 1,369 0 1 6 7 0 1
Jacksonville ATH 544 0 3 3 6 0 3
Jamestown GRE 1,917 0 8 9 17 0 9
Jasper (Township of) FAY 857 0 8 24 32 0 11
Jefferson ATB 3,572 0 9 30 39 0 9
Jefferson (Township of) ADA 1,024 0 8 12 20 0 10
Jefferson (Township of) ATB 5,559 0 14 28 42 0 21
Report generated on : 5/18/2016 11:53:59 AM Page 25 of 62
Total Crashes by City / Village
Table 8.01 - City / Village Statistics

City / Village County Population Fatal Crashes
Injury Crashes
PDO Crashes
Total Crashes
Deaths Injuries
Jefferson (Township of) BRO 1,355 0 8 25 33 0 10
Jefferson (Township of) CLI 1,301 0 4 16 20 0 10
Jefferson (Township of) COS 1,549 0 2 11 13 0 3
Jefferson (Township of) CRA 1,677 1 16 65 82 1 22
Jefferson (Township of) FAY 2,766 1 27 110 138 1 39
Jefferson (Township of) FRA 5,322 1 41 138 180 1 80
Jefferson (Township of) GRE 1,109 1 11 27 39 1 12
Jefferson (Township of) GUE 94 0 4 6 10 0 4
Jefferson (Township of) JAC 3,508 0 16 35 51 0 25
Jefferson (Township of) KNO 604 0 1 14 15 0 1
Jefferson (Township of) LOG 2,946 2 23 81 106 2 32
Jefferson (Township of) MAD 6,935 2 34 105 141 2 89
Jefferson (Township of) MER 13,231 0 28 76 104 0 39
Jefferson (Township of) MOT 6,787 1 32 60 93 1 54
Jefferson (Township of) MUS 1,766 0 0 6 6 0 0
Jefferson (Township of) NOB 284 0 2 1 3 0 2
Jefferson (Township of) PRE 3,449 1 19 74 94 1 25
Jefferson (Township of) RIC 4,531 0 30 59 89 0 40
Jefferson (Township of) ROS 967 0 5 33 38 0 6
Jefferson (Township of) SCI 2,751 1 21 43 65 1 30
Jefferson (Township of) TUS 976 0 8 33 41 0 9
Jefferson (Township of) WIL 2,021 2 18 102 122 2 31
Jeffersonville FAY 1,288 0 0 12 12 0 0
Jenera HAN 235 0 0 2 2 0 0
Jennings (Township of) PUT 1,968 0 4 8 12 0 4
Jennings (Township of) VAN 695 0 2 9 11 0 3
Jerome (Township of) UNI 3,950 0 47 169 216 0 65
Jeromesville ASD 478 0 0 2 2 0 0
Jerry City WOO 453 0 1 3 4 0 1
Jersey (Township of) LIC 2,841 1 37 45 83 1 49
Jerusalem MOE 152 0 0 1 1 0 0
Jerusalem (Township of) LUC 3,181 0 13 21 34 0 17
Johnson (Township of) CHP 3,357 0 7 17 24 0 12
Johnston (Township of) TRU 2,040 2 13 42 57 2 17
Johnstown LIC 3,440 0 20 93 113 0 25
Junction City PER 818 0 1 1 2 0 1
Report generated on : 5/18/2016 11:53:59 AM Page 26 of 62
Total Crashes by City / Village
Table 8.01 - City / Village Statistics

City / Village County Population Fatal Crashes
Injury Crashes
PDO Crashes
Total Crashes
Deaths Injuries
Kalida PUT 1,031 0 1 9 10 0 1
Keene (Township of) COS 1,689 0 6 10 16 0 6
Kent POR 27,906 0 128 563 691 0 171
Kenton HAR 8,336 0 21 55 76 0 32
Kettering MOT 57,502 0 226 640 866 0 331
Killbuck HOL 839 0 8 12 20 0 10
Killbuck (Township of) HOL 1,954 0 5 15 20 0 8
Kingston ROS 1,032 0 0 5 5 0 0
Kingston (Township of) DEL 1,603 2 30 83 115 2 53
Kingsville (Township of) ATB 1,847 1 13 57 71 1 14
Kinsman (Township of) TRU 1,943 1 7 9 17 1 8
Kipton LOR 265 0 0 1 1 0 0
Kirkersville LIC 520 0 4 4 8 0 5
Kirkwood (Township of) BEL 353 0 13 57 70 0 21
Kirtland LAK 6,670 0 17 85 102 0 28
Kirtland Hills LAK 597 0 7 33 40 0 8
Knox (Township of) COL 4,828 0 25 48 73 0 36
Knox (Township of) GUE 532 0 2 3 5 0 2
Knox (Township of) HOL 1,095 0 8 10 18 0 8
Knox (Township of) JEF 5,011 0 14 32 46 0 18
Knox (Township of) VIN 599 0 2 8 10 0 2
La Rue MAR 775 0 2 2 4 0 2
Lafayette (corporate and RR name for La Fayette)
ALL 304 0 1 1 2 0 1
Lafayette (Township of) COS 4,285 3 17 28 48 3 25
Lafayette (Township of) MED 5,476 0 32 60 92 0 50
Lagrange LOR 1,815 0 18 35 53 0 24
Lagrange (Township of) LOR 5,972 0 10 12 22 0 15
Lake (Township of) ASD 735 0 5 9 14 0 6
Lake (Township of) LOG 12,492 2 9 39 50 2 15
Lake (Township of) STA 25,892 1 110 227 338 2 156
Lake (Township of) WOO 10,350 3 69 211 283 5 99
Lakeline LAK 165 0 2 3 5 0 2
Lakemore SUM 2,561 0 1 9 10 0 1
Lakeview LOG 1,074 0 4 9 13 0 4
Lakewood CUY 56,646 1 160 592 753 1 204
Lancaster FAI 35,335 0 240 875 1,115 0 325
Report generated on : 5/18/2016 11:54:00 AM Page 27 of 62
Total Crashes by City / Village
Table 8.01 - City / Village Statistics
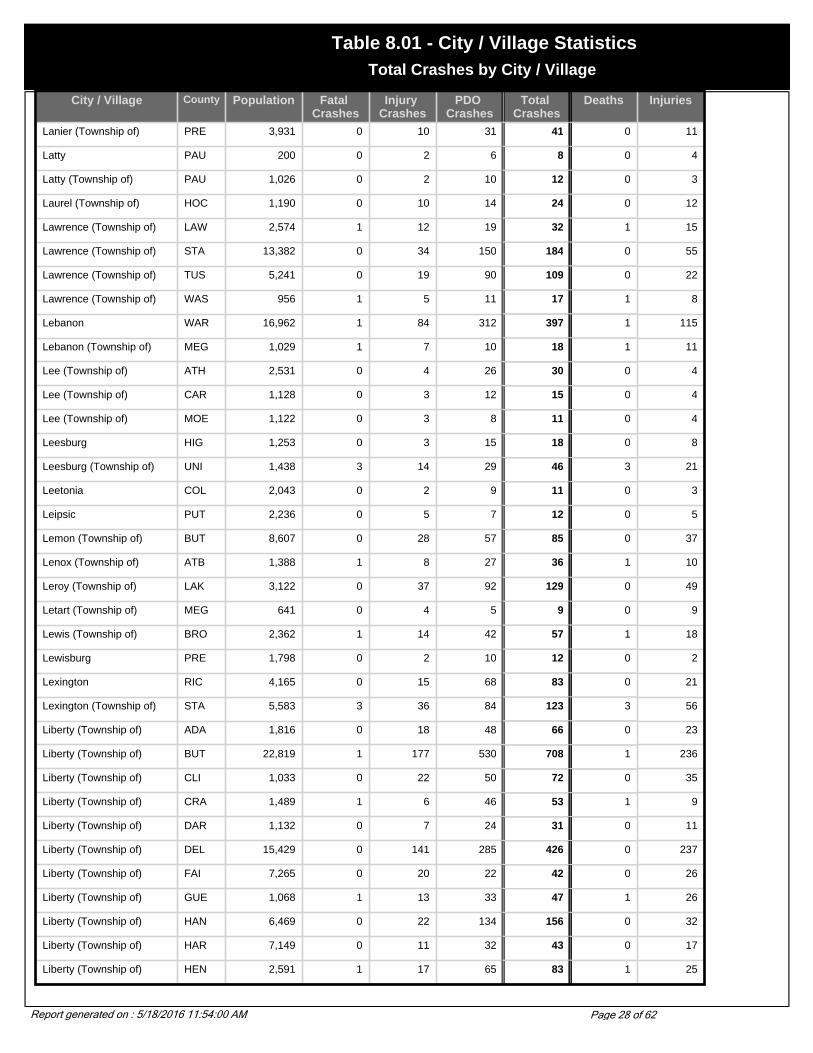
City / Village County Population Fatal Crashes
Injury Crashes
PDO Crashes
Total Crashes
Deaths Injuries
Lanier (Township of) PRE 3,931 0 10 31 41 0 11
Latty PAU 200 0 2 6 8 0 4
Latty (Township of) PAU 1,026 0 2 10 12 0 3
Laurel (Township of) HOC 1,190 0 10 14 24 0 12
Lawrence (Township of) LAW 2,574 1 12 19 32 1 15
Lawrence (Township of) STA 13,382 0 34 150 184 0 55
Lawrence (Township of) TUS 5,241 0 19 90 109 0 22
Lawrence (Township of) WAS 956 1 5 11 17 1 8
Lebanon WAR 16,962 1 84 312 397 1 115
Lebanon (Township of) MEG 1,029 1 7 10 18 1 11
Lee (Township of) ATH 2,531 0 4 26 30 0 4
Lee (Township of) CAR 1,128 0 3 12 15 0 4
Lee (Township of) MOE 1,122 0 3 8 11 0 4
Leesburg HIG 1,253 0 3 15 18 0 8
Leesburg (Township of) UNI 1,438 3 14 29 46 3 21
Leetonia COL 2,043 0 2 9 11 0 3
Leipsic PUT 2,236 0 5 7 12 0 5
Lemon (Township of) BUT 8,607 0 28 57 85 0 37
Lenox (Township of) ATB 1,388 1 8 27 36 1 10
Leroy (Township of) LAK 3,122 0 37 92 129 0 49
Letart (Township of) MEG 641 0 4 5 9 0 9
Lewis (Township of) BRO 2,362 1 14 42 57 1 18
Lewisburg PRE 1,798 0 2 10 12 0 2
Lexington RIC 4,165 0 15 68 83 0 21
Lexington (Township of) STA 5,583 3 36 84 123 3 56
Liberty (Township of) ADA 1,816 0 18 48 66 0 23
Liberty (Township of) BUT 22,819 1 177 530 708 1 236
Liberty (Township of) CLI 1,033 0 22 50 72 0 35
Liberty (Township of) CRA 1,489 1 6 46 53 1 9
Liberty (Township of) DAR 1,132 0 7 24 31 0 11
Liberty (Township of) DEL 15,429 0 141 285 426 0 237
Liberty (Township of) FAI 7,265 0 20 22 42 0 26
Liberty (Township of) GUE 1,068 1 13 33 47 1 26
Liberty (Township of) HAN 6,469 0 22 134 156 0 32
Liberty (Township of) HAR 7,149 0 11 32 43 0 17
Liberty (Township of) HEN 2,591 1 17 65 83 1 25
Report generated on : 5/18/2016 11:54:00 AM Page 28 of 62
Total Crashes by City / Village
Table 8.01 - City / Village Statistics

City / Village County Population Fatal Crashes
Injury Crashes
PDO Crashes
Total Crashes
Deaths Injuries
Liberty (Township of) HIG 9,798 0 36 58 94 0 61
Liberty (Township of) JAC 1,672 2 7 35 44 2 10
Liberty (Township of) KNO 1,422 1 13 43 57 1 19
Liberty (Township of) LIC 1,797 2 12 28 42 2 20
Liberty (Township of) LOG 3,126 0 16 27 43 0 20
Liberty (Township of) MER 917 0 4 9 13 0 6
Liberty (Township of) PUT 1,575 1 5 13 19 1 8
Liberty (Township of) ROS 2,476 0 23 72 95 0 37
Liberty (Township of) SEN 2,340 0 9 25 34 0 10
Liberty (Township of) TRU 23,522 3 117 244 364 3 161
Liberty (Township of) UNI 1,705 1 9 25 35 1 13
Liberty (Township of) VAN 1,696 0 14 23 37 0 28
Liberty (Township of) WAS 621 0 4 4 8 0 4
Liberty (Township of) WOO 1,862 0 9 31 40 0 13
Liberty Center HEN 1,109 0 0 3 3 0 0
Lick (Township of) JAC 2,682 0 34 123 157 0 48
Licking (Township of) LIC 3,870 1 50 96 147 1 75
Licking (Township of) MUS 2,248 1 15 47 63 1 22
Lima ALL 40,081 1 348 814 1,163 1 538
Lincoln (Township of) MRW 1,955 1 13 49 63 1 18
Lincoln Heights HAM 4,113 0 12 42 54 0 14
Lindsey SAN 504 0 2 1 3 0 3
Linndale CUY 117 0 5 7 12 0 7
Linton (Township of) COS 632 0 2 4 6 0 3
Lisbon COL 2,788 0 8 35 43 0 17
Litchfield (Township of) MED 3,250 1 18 39 58 2 22
Lithopolis FAI 600 0 3 14 17 0 4
Liverpool (Township of) COL 4,374 1 5 21 27 2 13
Liverpool (Township of) MED 4,329 3 50 92 145 3 67
Lockbourne FRA 280 0 0 1 1 0 0
Lockland HAM 3,707 1 50 187 238 1 70
Lodi MED 3,061 0 4 15 19 0 4
Lodi (Township of) ATH 1,403 1 12 17 30 1 13
Logan HOC 6,704 0 23 148 171 0 33
Logan (Township of) AUG 1,201 0 5 9 14 0 8
London MAD 8,771 0 28 111 139 0 41
Report generated on : 5/18/2016 11:54:00 AM Page 29 of 62
Total Crashes by City / Village
Table 8.01 - City / Village Statistics

City / Village County Population Fatal Crashes
Injury Crashes
PDO Crashes
Total Crashes
Deaths Injuries
Londonderry (Township of) GUE 738 0 2 12 14 0 2
Lorain LOR 68,652 4 301 797 1,102 4 452
Loramie (Township of) SHE 2,438 0 12 33 45 0 15
Lordstown TRU 3,633 0 25 80 105 0 32
Lostcreek (Township of) MIA 1,633 0 5 23 28 0 9
Loudon (Township of) CAR 1,032 0 4 4 8 0 4
Loudon (Township of) SEN 2,395 0 9 35 44 0 13
Loudonville ASD 2,906 0 7 35 42 0 12
Louisville STA 8,904 0 22 116 138 0 28
Loveland CLE 11,677 0 4 15 19 0 5
Loveland HAM 11,677 0 16 44 60 0 23
Lowell WAS 628 0 0 1 1 0 0
Lowellville MAH 1,281 0 3 3 6 0 3
Lucas RIC 620 0 0 5 5 0 0
Luckey WOO 998 0 0 5 5 0 0
Ludlow (Township of) WAS 330 0 1 7 8 0 1
Ludlow Falls MIA 210 0 0 1 1 0 0
Lykens (Township of) CRA 649 0 1 23 24 0 1
Lyme (Township of) HUR 968 0 20 40 60 0 37
Lynchburg HIG 1,350 1 0 1 2 1 0
Lyndhurst CUY 15,279 0 118 234 352 0 178
Lynn (Township of) HAR 629 0 4 12 16 0 5
Lyons FUL 559 0 1 1 2 0 1
Macedonia SUM 9,224 1 76 432 509 2 108
Macksburg WAS 202 0 1 0 1 0 1
Mad River (Township of) CHP 2,650 0 23 43 66 0 29
Mad River (Township of) CLA 11,828 4 74 227 305 4 110
Madeira HAM 8,923 0 35 128 163 0 48
Madison LAK 2,921 2 29 73 104 2 44
Madison (County) MAD 40,213 0 0 2 2 0 0
Madison (Township of) BUT 8,611 0 62 92 154 0 81
Madison (Township of) CLA 2,796 0 3 7 10 0 6
Madison (Township of) COL 3,406 0 28 71 99 0 35
Madison (Township of) FAI 1,385 0 6 4 10 0 7
Madison (Township of) FAY 946 2 11 31 44 2 19
Madison (Township of) FRA 21,243 0 91 202 293 0 158
Report generated on : 5/18/2016 11:54:00 AM Page 30 of 62
Total Crashes by City / Village
Table 8.01 - City / Village Statistics

City / Village County Population Fatal Crashes
Injury Crashes
PDO Crashes
Total Crashes
Deaths Injuries
Madison (Township of) GUE 855 0 10 15 25 0 13
Madison (Township of) HAN 2,156 0 8 34 42 0 11
Madison (Township of) HIG 6,922 1 10 23 34 1 18
Madison (Township of) JAC 2,171 1 15 47 63 1 20
Madison (Township of) LAK 18,428 3 52 134 189 3 91
Madison (Township of) LIC 3,061 0 20 38 58 0 26
Madison (Township of) MUS 487 0 6 11 17 0 8
Madison (Township of) PER 1,229 0 9 12 21 0 14
Madison (Township of) PIC 1,461 0 3 15 18 0 4
Madison (Township of) RIC 14,680 2 80 231 313 4 116
Madison (Township of) SAN 3,721 0 7 24 31 0 17
Madison (Township of) SCI 3,794 0 23 29 52 0 34
Madison (Township of) VIN 682 0 2 9 11 0 3
Madison (Township of) WIL 2,539 0 15 46 61 0 18
Magnetic Springs UNI 323 1 0 0 1 1 0
Magnolia STA 931 0 1 0 1 0 1
Maineville WAR 885 0 1 9 10 0 1
Malaga (Township of) MOE 979 0 4 12 16 0 6
Malinta HEN 285 0 0 1 1 0 0
Malta MRG 696 1 6 11 18 2 11
Malta (Township of) MRG 1,964 0 5 8 13 0 6
Malvern CAR 1,218 0 3 9 12 0 3
Manchester ADA 2,043 0 2 2 4 0 2
Manchester (Township of) ADA 2,140 0 0 2 2 0 0
Manchester (Township of) MRG 141 0 1 2 3 0 2
Mansfield RIC 49,346 1 361 1,023 1,385 1 568
Mantua POR 1,046 0 10 20 30 0 12
Mantua (Township of) POR 4,661 1 26 59 86 1 49
Maple Heights CUY 26,156 1 115 269 385 1 181
Marble Cliff FRA 646 0 4 10 14 0 7
Marengo MRW 297 0 3 1 4 0 5
Margaretta (Township of) ERI 6,289 2 40 122 164 3 57
Mariemont HAM 3,408 0 0 19 19 0 0
Marietta WAS 14,515 0 85 365 450 0 107
Marietta (Township of) WAS 4,673 0 20 70 90 0 26
Marion MAR 35,318 1 195 559 755 1 267
Report generated on : 5/18/2016 11:54:00 AM Page 31 of 62
Total Crashes by City / Village
Table 8.01 - City / Village Statistics

City / Village County Population Fatal Crashes
Injury Crashes
PDO Crashes
Total Crashes
Deaths Injuries
Marion (Township of) ALL 6,773 1 28 72 101 1 46
Marion (Township of) CLI 5,489 0 11 25 36 0 14
Marion (Township of) FAY 748 0 6 19 25 0 7
Marion (Township of) HAN 2,203 0 23 110 133 0 29
Marion (Township of) HAR 2,449 0 5 24 29 0 7
Marion (Township of) HEN 1,417 0 3 15 18 0 3
Marion (Township of) HOC 2,411 0 11 12 23 0 17
Marion (Township of) MAR 44,908 1 58 150 209 2 98
Marion (Township of) MER 2,969 1 9 23 33 1 13
Marion (Township of) MRG 1,336 0 3 9 12 0 3
Marion (Township of) NOB 730 0 0 2 2 0 0
Marion (Township of) PIK 1,351 1 8 16 25 1 13
Mark (Township of) DEF 968 1 6 16 23 1 9
Marlboro (Township of) DEL 227 1 9 18 28 1 17
Marlboro (Township of) STA 4,227 0 2 4 6 0 4
Marseilles WYA 124 0 0 1 1 0 0
Marseilles (Township of) WYA 446 0 1 6 7 0 1
Marshall (Township of) HIG 1,008 0 6 10 16 0 8
Marshallville WAY 826 0 0 2 2 0 0
Martins Ferry BEL 7,226 0 15 53 68 0 17
Martinsburg KNO 185 0 1 2 3 0 2
Martinsville CLI 440 0 1 0 1 0 1
Mary Ann (Township of) LIC 2,118 0 11 23 34 0 13
Marysville UNI 15,942 2 94 364 460 2 118
Mason WAR 22,016 2 120 403 525 2 184
Mason (Township of) LAW 1,095 0 2 9 11 0 2
Massie (Township of) WAR 1,061 0 11 35 46 0 15
Massillon STA 31,325 0 194 594 788 0 280
Matamoras (corporate name for New Matamoras)
WAS 957 0 0 6 6 0 0
Maumee LUC 15,237 1 151 565 717 2 207
Mayfield CUY 3,435 0 32 114 146 0 40
Mayfield Heights CUY 19,386 0 104 450 554 0 136
McArthur VIN 1,888 0 3 4 7 0 3
McArthur (Township of) LOG 1,949 1 12 46 59 1 16
McClure HEN 761 0 4 2 6 0 5
McComb HAN 1,676 0 5 12 17 0 8
Report generated on : 5/18/2016 11:54:00 AM Page 32 of 62
Total Crashes by City / Village
Table 8.01 - City / Village Statistics

City / Village County Population Fatal Crashes
Injury Crashes
PDO Crashes
Total Crashes
Deaths Injuries
McConnelsville MRG 1,676 0 6 25 31 0 9
McDonald TRU 3,481 0 5 14 19 0 5
McDonald (Township of) HAR 914 0 1 15 16 0 1
McGuffey HAR 522 0 1 4 5 0 2
McKean (Township of) LIC 1,516 0 12 15 27 0 17
McLean (Township of) SHE 3,082 0 7 24 31 0 7
Mead (Township of) BEL 6,023 1 17 45 63 1 20
Mecca (Township of) TRU 2,829 3 6 21 30 3 12
Mechanic (Township of) HOL 2,652 1 6 30 37 1 13
Mechanicsburg CHP 1,744 0 0 2 2 0 0
Medina MED 25,139 2 109 441 552 2 145
Medina (Township of) MED 7,783 1 77 233 311 1 112
Meigs (County) MEG 23,072 0 1 0 1 0 2
Meigs (Township of) ADA 3,753 1 18 46 65 1 27
Meigs (Township of) MUS 173 0 1 6 7 0 3
Meigsville (Township of) MRG 894 0 3 8 11 0 4
Melrose PAU 322 0 1 0 1 0 1
Mendon MER 697 0 0 3 3 0 0
Mentor LAK 50,278 1 335 1,184 1,520 2 454
Mentor-on-the-Lake LAK 8,127 0 9 48 57 0 13
Mesopotamia (Township of) TRU 3,051 0 10 17 27 0 18
Metamora FUL 563 0 0 4 4 0 0
Miami (Township of) CLE 36,632 1 255 833 1,089 1 347
Miami (Township of) GRE 5,106 0 20 42 62 0 29
Miami (Township of) HAM 13,496 1 16 77 94 1 23
Miami (Township of) LOG 2,352 0 3 19 22 0 10
Miami (Township of) MOT 45,593 4 161 592 757 4 248
Miamisburg MOT 19,489 2 129 396 527 2 184
Middle Point (corporate and RR name for Middlepoint)
VAN 593 0 0 3 3 0 0
Middleburg Heights CUY 15,542 1 139 489 629 1 206
Middlebury (Township of) KNO 1,138 1 3 22 26 1 5
Middlefield GEA 2,233 1 34 59 94 1 53
Middlefield (Township of) GEA 4,418 0 13 25 38 0 25
Middleport MEG 2,525 1 0 1 2 1 0
Middleton (Township of) COL 3,741 0 26 51 77 0 30
Middleton (Township of) WOO 2,598 1 55 165 221 1 94
Report generated on : 5/18/2016 11:54:01 AM Page 33 of 62
Total Crashes by City / Village
Table 8.01 - City / Village Statistics

City / Village County Population Fatal Crashes
Injury Crashes
PDO Crashes
Total Crashes
Deaths Injuries
Middletown BUT 51,605 5 304 741 1,050 5 492
Middletown WAR 51,605 0 50 135 185 0 76
Midland (RR name Midland City)
CLI 265 0 1 0 1 0 1
Midvale TUS 547 0 0 2 2 0 0
Midway (corporate name for Sedalia)
MAD 274 0 0 1 1 0 0
Mifflin ASD 144 0 10 16 26 0 17
Mifflin (Township of) ASD 1,083 0 10 31 41 0 16
Mifflin (Township of) FRA 35,787 0 100 267 367 0 169
Mifflin (Township of) PIK 1,194 0 19 18 37 0 31
Mifflin (Township of) RIC 6,218 4 40 155 199 4 71
Mifflin (Township of) WYA 705 0 4 13 17 0 6
Milan ERI 1,445 1 10 50 61 1 14
Milan (Township of) ERI 3,686 0 29 125 154 0 41
Milford CLE 6,284 1 30 165 196 1 36
Milford HAM 6,284 0 0 9 9 0 0
Milford (Township of) BUT 3,254 1 24 63 88 1 32
Milford (Township of) DEF 1,013 0 3 23 26 0 3
Milford (Township of) KNO 1,422 0 7 18 25 0 13
Milford Center UNI 626 0 0 1 1 0 0
Mill (Township of) TUS 10,290 2 37 105 144 2 57
Mill Creek (Township of) COS 747 0 4 4 8 0 4
Mill Creek (Township of) WIL 935 1 3 11 15 1 10
Millbury WOO 1,161 0 0 3 3 0 0
Millcreek (Township of) UNI 1,261 0 7 34 41 0 7
Milledgeville FAY 122 0 0 1 1 0 0
Miller (Township of) KNO 893 0 6 21 27 0 7
Miller City (RR name Millers City)
PUT 136 0 0 2 2 0 0
Millersburg HOL 3,326 1 22 73 96 1 31
Millersport FAI 963 0 1 6 7 0 1
Millville BUT 817 0 6 12 18 0 7
Millwood (Township of) GUE 1,318 0 6 13 19 0 9
Milton (Township of) ASD 2,431 0 25 44 69 0 44
Milton (Township of) JAC 1,119 0 13 58 71 0 18
Milton (Township of) MAH 4,107 1 26 56 83 1 35
Milton (Township of) WAY 9,254 0 32 46 78 0 58
Milton (Township of) WOO 1,159 0 4 16 20 0 6
Report generated on : 5/18/2016 11:54:01 AM Page 34 of 62
Total Crashes by City / Village
Table 8.01 - City / Village Statistics

City / Village County Population Fatal Crashes
Injury Crashes
PDO Crashes
Total Crashes
Deaths Injuries
Mineral City TUS 841 0 1 2 3 0 2
Mineral Ridge MAH 3,900 0 1 0 1 0 2
Mineral Ridge TRU 3,900 0 1 1 2 0 1
Minerva CAR 3,934 0 7 10 17 0 10
Minerva STA 3,934 0 9 31 40 0 13
Minerva Park FRA 1,288 0 1 2 3 0 1
Mingo Junction JEF 3,631 0 2 15 17 0 2
Minster AUG 2,794 0 7 28 35 0 9
Mississinawa (Township of) DAR 779 0 6 12 18 0 6
Mogadore POR 3,893 0 4 4 8 0 5
Mogadore SUM 3,893 0 3 25 28 0 3
Mohican (Township of) ASD 1,857 1 12 31 44 1 22
Monclova (Township of) LUC 6,767 2 73 154 229 2 114
Monday Creek (Township of)
PER 671 0 2 3 5 0 3
Monroe BUT 7,133 0 43 175 218 0 62
Monroe WAR 7,133 0 12 29 41 0 17
Monroe (Township of) ADA 735 0 4 17 21 0 5
Monroe (Township of) ALL 2,219 2 14 42 58 2 33
Monroe (Township of) ATB 2,268 0 8 23 31 0 11
Monroe (Township of) CAR 1,930 0 7 26 33 0 8
Monroe (Township of) CLE 8,236 2 49 123 174 2 77
Monroe (Township of) COS 452 0 1 1 2 0 1
Monroe (Township of) DAR 1,674 0 2 22 24 0 2
Monroe (Township of) GUE 598 0 2 6 8 0 2
Monroe (Township of) HAS 1,241 2 9 20 31 2 14
Monroe (Township of) HEN 1,177 0 8 18 26 0 13
Monroe (Township of) HOL 1,401 0 15 28 43 0 19
Monroe (Township of) KNO 2,427 0 26 73 99 0 36
Monroe (Township of) LIC 5,523 2 31 45 78 2 51
Monroe (Township of) LOG 1,503 0 4 28 32 0 4
Monroe (Township of) MAD 1,769 0 6 11 17 0 9
Monroe (Township of) MIA 15,339 0 27 118 145 0 37
Monroe (Township of) MUS 439 0 1 10 11 0 1
Monroe (Township of) PER 1,565 1 6 6 13 1 9
Monroe (Township of) PIC 1,166 0 3 19 22 0 3
Monroe (Township of) PRE 2,290 2 21 66 89 2 25
Report generated on : 5/18/2016 11:54:01 AM Page 35 of 62
Total Crashes by City / Village
Table 8.01 - City / Village Statistics

City / Village County Population Fatal Crashes
Injury Crashes
PDO Crashes
Total Crashes
Deaths Injuries
Monroe (Township of) PUT 2,234 0 4 28 32 0 5
Monroe (Township of) RIC 2,656 0 14 44 58 0 18
Monroeville HUR 1,433 1 0 3 4 1 0
Monterey (Township of) PUT 2,056 0 0 11 11 0 0
Montgomery HAM 10,163 1 127 407 535 1 175
Montgomery (County) MOT 559,062 0 1 2 3 0 2
Montgomery (Township of) ASD 2,412 3 45 161 209 3 59
Montgomery (Township of) MAR 2,498 0 6 27 33 0 8
Montgomery (Township of) WOO 4,505 0 4 52 56 0 4
Montpelier WIL 4,320 0 8 33 41 0 13
Montville (Township of) GEA 1,984 1 9 38 48 1 17
Montville (Township of) MED 5,410 1 58 186 245 1 85
Moorefield (Township of) CLA 11,402 0 40 127 167 0 53
Moorefield (Township of) HAS 420 0 2 9 11 0 2
Moraine MOT 6,897 1 114 270 385 1 183
Moreland Hills CUY 3,298 0 6 39 45 0 9
Morgan (County) MRG 14,897 0 8 25 33 0 12
Morgan (Township of) ATB 1,954 0 6 23 29 0 7
Morgan (Township of) BUT 5,328 0 13 37 50 0 20
Morgan (Township of) GAL 1,341 0 7 20 27 0 12
Morgan (Township of) KNO 843 0 5 25 30 0 5
Morgan (Township of) MRG 2,617 0 4 10 14 0 8
Morgan (Township of) SCI 2,297 1 13 31 45 1 17
Morral MAR 388 0 0 1 1 0 0
Morris (Township of) KNO 1,998 0 21 43 64 0 25
Morrow WAR 1,286 0 4 6 10 0 6
Moscow CLE 244 0 0 1 1 0 0
Moulton (Township of) AUG 1,704 0 14 46 60 0 18
Mount Blanchard HAN 484 0 0 4 4 0 0
Mount Cory HAN 203 0 0 1 1 0 0
Mount Eaton WAY 246 0 1 9 10 0 1
Mount Gilead MRW 3,290 0 8 69 77 0 12
Mount Healthy HAM 7,149 0 1 1 2 0 1
Mount Orab (RR name Mount Oreb)
BRO 2,307 0 25 84 109 0 34
Mount Pleasant JEF 535 0 6 7 13 0 7
Mount Pleasant (Township of)
JEF 2,588 1 6 11 18 1 8
Report generated on : 5/18/2016 11:54:01 AM Page 36 of 62
Total Crashes by City / Village
Table 8.01 - City / Village Statistics

City / Village County Population Fatal Crashes
Injury Crashes
PDO Crashes
Total Crashes
Deaths Injuries
Mount Sterling MAD 1,865 0 4 24 28 0 5
Mount Vernon KNO 14,375 1 62 191 254 1 79
Mount Victory HAR 600 0 1 7 8 0 3
Muhlenberg (Township of) PIC 905 0 5 7 12 0 8
Munroe Falls SUM 5,314 0 7 36 43 0 12
Munson (Township of) GEA 6,450 1 42 122 165 1 69
Muskingum (County) MUS 84,585 0 1 4 5 0 1
Muskingum (Township of) MUS 3,813 0 17 44 61 0 20
Muskingum (Township of) WAS 4,627 1 25 60 86 1 29
Napoleon HEN 9,318 0 25 189 214 0 35
Napoleon (Township of) HEN 10,331 2 21 41 64 2 34
Nashville HOL 172 0 0 4 4 0 0
Navarre STA 1,440 0 8 28 36 0 12
Neave (Township of) DAR 1,986 1 20 37 58 1 32
Nelson (Township of) POR 2,985 1 15 28 44 1 20
Nelsonville ATH 5,230 0 5 49 54 0 10
Nevada WYA 814 0 0 2 2 0 0
New Albany FRA 3,711 0 37 144 181 0 51
New Albany LIC 3,711 0 9 19 28 0 18
New Athens HAS 342 0 1 0 1 0 1
New Bloomington (Agosta) MAR 548 0 0 3 3 0 0
New Boston SCI 2,340 0 27 104 131 0 43
New Bremen AUG 2,909 0 3 22 25 0 3
New Carlisle CLA 5,735 0 9 41 50 0 13
New Concord MUS 2,651 0 2 11 13 0 2
New Franklin SUM 2,191 0 38 118 156 0 48
New Haven (Township of) HUR 2,860 1 13 58 72 1 18
New Holland PIC 785 0 1 1 2 0 1
New Jasper (Township of) GRE 2,538 0 11 29 40 0 17
New Knoxville AUG 891 0 0 3 3 0 0
New Lexington PER 4,689 0 0 13 13 0 0
New London HUR 2,696 0 3 6 9 0 5
New London (Township of) HUR 3,440 0 4 15 19 0 5
New Lyme (Township of) ATB 1,072 0 11 31 42 0 13
New Madison DAR 817 0 1 2 3 0 1
New Market (Township of) HIG 1,941 1 11 26 38 1 17
Report generated on : 5/18/2016 11:54:01 AM Page 37 of 62
Total Crashes by City / Village
Table 8.01 - City / Village Statistics

City / Village County Population Fatal Crashes
Injury Crashes
PDO Crashes
Total Crashes
Deaths Injuries
New Miami BUT 2,469 0 5 16 21 0 10
New Middletown MAH 1,682 0 1 8 9 0 1
New Paris PRE 1,623 0 0 9 9 0 0
New Philadelphia TUS 17,056 1 91 378 470 1 138
New Richmond CLE 2,219 0 16 24 40 0 21
New Russia (Township of) LOR 2,357 4 24 64 92 4 33
New Straitsville PER 774 0 1 0 1 0 1
New Vienna CLI 1,294 0 0 6 6 0 0
New Washington CRA 987 0 1 2 3 0 1
New Weston DAR 135 0 0 1 1 0 0
Newark LIC 46,279 3 238 755 996 3 302
Newark (Township of) LIC 1,967 0 15 17 32 0 18
Newberry (Township of) MIA 6,490 1 14 78 93 1 20
Newburgh Heights CUY 2,389 0 15 45 60 0 20
Newbury (Township of) GEA 5,805 1 29 83 113 1 41
Newcastle (Township of) COS 441 0 1 5 6 0 1
Newcomerstown TUS 4,008 0 8 44 52 0 10
Newport (Township of) WAS 2,176 0 10 33 43 0 16
Newton (Township of) LIC 3,111 0 18 24 42 0 26
Newton (Township of) MIA 3,354 0 11 38 49 0 14
Newton (Township of) MUS 5,402 1 37 89 127 2 59
Newton (Township of) PIK 2,006 0 20 46 66 0 32
Newton (Township of) TRU 9,524 0 15 51 66 0 25
Newton Falls TRU 5,002 0 5 29 34 0 8
Newtonsville CLE 492 0 0 3 3 0 0
Newtown HAM 2,420 0 13 50 63 0 17
Ney DEF 364 0 1 4 5 0 1
Nile (Township of) SCI 2,024 0 15 32 47 0 17
Niles TRU 20,932 0 85 264 349 0 118
Nimishillen (Township of) STA 9,098 2 44 170 216 2 70
Noble (Township of) AUG 1,439 1 16 53 70 1 19
Noble (Township of) DEF 6,171 0 22 90 112 0 31
Noble (Township of) NOB 2,013 0 4 24 28 0 5
North (Township of) HAS 1,652 0 10 12 22 0 15
North Baltimore WOO 3,361 0 8 44 52 0 10
North Bend HAM 603 0 3 10 13 0 3
Report generated on : 5/18/2016 11:54:01 AM Page 38 of 62
Total Crashes by City / Village
Table 8.01 - City / Village Statistics
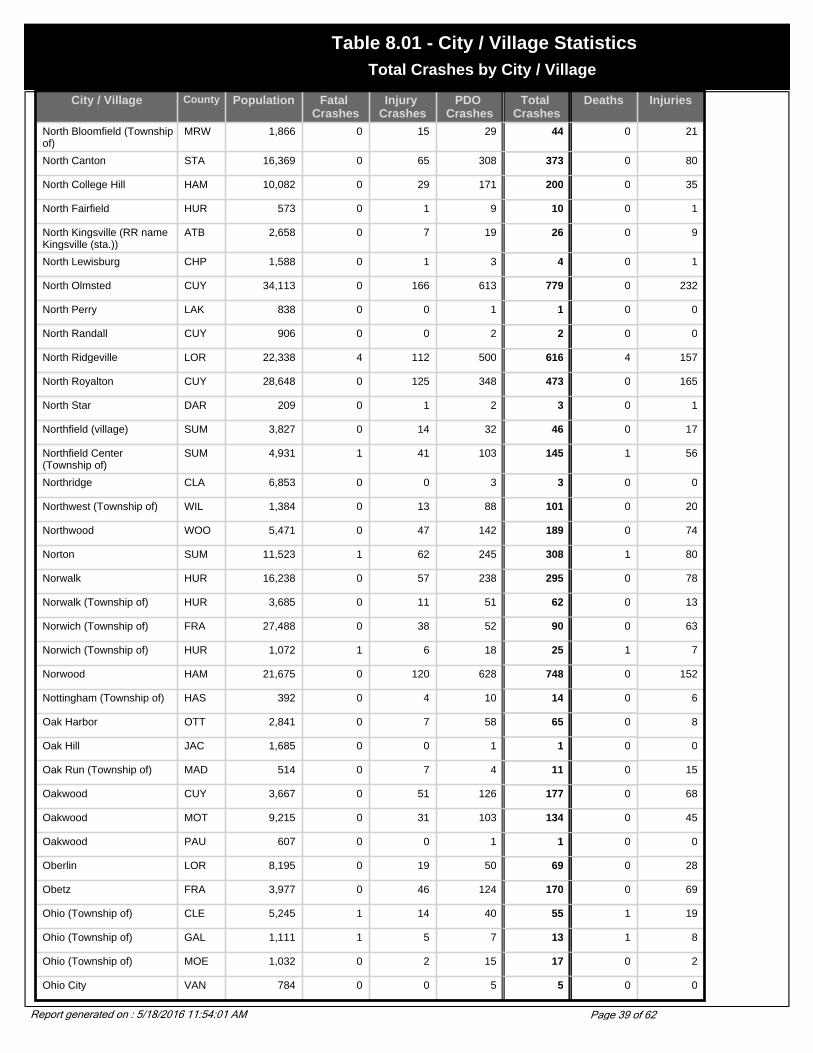
City / Village County Population Fatal Crashes
Injury Crashes
PDO Crashes
Total Crashes
Deaths Injuries
North Bloomfield (Township of)
MRW 1,866 0 15 29 44 0 21
North Canton STA 16,369 0 65 308 373 0 80
North College Hill HAM 10,082 0 29 171 200 0 35
North Fairfield HUR 573 0 1 9 10 0 1
North Kingsville (RR name Kingsville (sta.))
ATB 2,658 0 7 19 26 0 9
North Lewisburg CHP 1,588 0 1 3 4 0 1
North Olmsted CUY 34,113 0 166 613 779 0 232
North Perry LAK 838 0 0 1 1 0 0
North Randall CUY 906 0 0 2 2 0 0
North Ridgeville LOR 22,338 4 112 500 616 4 157
North Royalton CUY 28,648 0 125 348 473 0 165
North Star DAR 209 0 1 2 3 0 1
Northfield (village) SUM 3,827 0 14 32 46 0 17
Northfield Center (Township of)
SUM 4,931 1 41 103 145 1 56
Northridge CLA 6,853 0 0 3 3 0 0
Northwest (Township of) WIL 1,384 0 13 88 101 0 20
Northwood WOO 5,471 0 47 142 189 0 74
Norton SUM 11,523 1 62 245 308 1 80
Norwalk HUR 16,238 0 57 238 295 0 78
Norwalk (Township of) HUR 3,685 0 11 51 62 0 13
Norwich (Township of) FRA 27,488 0 38 52 90 0 63
Norwich (Township of) HUR 1,072 1 6 18 25 1 7
Norwood HAM 21,675 0 120 628 748 0 152
Nottingham (Township of) HAS 392 0 4 10 14 0 6
Oak Harbor OTT 2,841 0 7 58 65 0 8
Oak Hill JAC 1,685 0 0 1 1 0 0
Oak Run (Township of) MAD 514 0 7 4 11 0 15
Oakwood CUY 3,667 0 51 126 177 0 68
Oakwood MOT 9,215 0 31 103 134 0 45
Oakwood PAU 607 0 0 1 1 0 0
Oberlin LOR 8,195 0 19 50 69 0 28
Obetz FRA 3,977 0 46 124 170 0 69
Ohio (Township of) CLE 5,245 1 14 40 55 1 19
Ohio (Township of) GAL 1,111 1 5 7 13 1 8
Ohio (Township of) MOE 1,032 0 2 15 17 0 2
Ohio City VAN 784 0 0 5 5 0 0
Report generated on : 5/18/2016 11:54:01 AM Page 39 of 62
Total Crashes by City / Village
Table 8.01 - City / Village Statistics

City / Village County Population Fatal Crashes
Injury Crashes
PDO Crashes
Total Crashes
Deaths Injuries
Old Washington (corporate name for Washington)
GUE 265 0 1 13 14 0 1
Olive (Township of) MEG 1,874 1 5 10 16 1 9
Olive (Township of) NOB 5,395 2 3 27 32 2 6
Oliver (Township of) ADA 1,246 0 10 38 48 0 14
Olmsted (Township of) CUY 10,575 0 29 115 144 0 38
Olmsted Falls CUY 7,962 0 18 84 102 0 20
Ontario RIC 5,303 0 48 240 288 0 65
Orange CUY 3,236 1 8 39 48 1 10
Orange (Township of) ASD 2,276 0 14 41 55 0 15
Orange (Township of) CAR 1,258 0 4 7 11 0 4
Orange (Township of) DEL 12,464 1 181 443 625 1 269
Orange (Township of) HAN 1,290 1 10 52 63 1 13
Orange (Township of) MEG 934 0 5 13 18 0 6
Orange (Township of) SHE 1,419 2 15 59 76 2 23
Oregon LUC 19,355 3 195 386 584 3 294
Orrville WAY 8,551 0 16 99 115 0 18
Orwell ATB 1,519 0 2 14 16 0 2
Orwell (Township of) ATB 2,830 1 5 13 19 1 7
Osgood DAR 255 0 0 1 1 0 0
Osnaburg (Township of) STA 5,886 2 36 76 114 2 47
Ostrander DEL 405 0 0 3 3 0 0
Ottawa PUT 4,367 0 0 2 2 0 0
Ottawa (Township of) PUT 7,961 0 12 41 53 0 16
Ottawa Hills LUC 4,564 0 17 75 92 0 29
Ottoville PUT 873 0 3 10 13 0 3
Owensville CLE 816 0 2 5 7 0 2
Oxford BUT 21,943 0 56 212 268 0 65
Oxford (Township of) BUT 24,133 1 28 66 95 2 42
Oxford (Township of) COS 1,560 1 8 12 21 1 9
Oxford (Township of) DEL 854 0 2 16 18 0 2
Oxford (Township of) ERI 1,096 0 23 59 82 0 29
Oxford (Township of) GUE 677 0 11 43 54 0 15
Oxford (Township of) TUS 5,133 0 16 66 82 0 22
Painesville LAK 17,503 4 103 345 452 4 148
Painesville (Township of) LAK 18,562 0 66 166 232 0 83
Paint (Township of) FAY 1,905 0 8 42 50 0 9
Report generated on : 5/18/2016 11:54:04 AM Page 40 of 62
Total Crashes by City / Village
Table 8.01 - City / Village Statistics

City / Village County Population Fatal Crashes
Injury Crashes
PDO Crashes
Total Crashes
Deaths Injuries
Paint (Township of) HIG 4,112 1 27 34 62 1 51
Paint (Township of) HOL 3,547 0 11 33 44 0 17
Paint (Township of) MAD 565 0 6 10 16 0 7
Paint (Township of) ROS 1,169 0 9 13 22 0 16
Paint (Township of) WAY 2,823 0 22 34 56 0 34
Palestine DAR 170 0 0 3 3 0 0
Palmer (Township of) PUT 1,143 0 7 13 20 0 13
Palmer (Township of) WAS 625 0 2 3 5 0 2
Palmyra (Township of) POR 2,785 0 17 57 74 0 19
Pandora PUT 1,188 0 1 7 8 0 1
Paris (Township of) POR 1,827 1 13 37 51 1 19
Paris (Township of) STA 5,969 0 43 109 152 0 54
Paris (Township of) UNI 17,549 0 16 79 95 0 28
Park Layne CLA 4,519 0 1 2 3 0 1
Parkman (Township of) GEA 3,546 1 26 64 91 1 38
Parma CUY 85,655 1 316 406 723 1 445
Parma Heights CUY 21,659 0 49 228 277 0 72
Parral TUS 241 0 0 1 1 0 0
Pataskala LIC 10,249 1 59 214 274 3 84
Patterson (Township of) DAR 1,308 0 6 15 21 0 12
Paulding PAU 3,595 0 4 5 9 0 5
Paulding (Township of) PAU 4,008 0 5 38 43 0 5
Paxton (Township of) ROS 2,165 0 11 33 44 0 11
Payne PAU 1,166 0 1 7 8 0 1
Pease (Township of) BEL 14,961 1 31 79 111 1 47
Pebble (Township of) PIK 2,416 0 13 30 43 0 16
Pee Pee (Township of) PIK 7,776 1 23 65 89 1 34
Peebles ADA 1,739 0 1 3 4 0 2
Pemberville WOO 1,365 0 1 1 2 0 1
Penfield (Township of) LOR 1,690 2 9 32 43 4 13
Peninsula SUM 602 0 7 21 28 0 11
Penn (Township of) HIG 1,055 0 8 11 19 0 8
Penn (Township of) MRG 777 0 1 6 7 0 1
Pepper Pike CUY 6,040 0 79 227 306 0 136
Perkins (Township of) ERI 12,578 1 125 409 535 1 190
Perry LAK 1,195 1 20 29 50 1 31
Report generated on : 5/18/2016 11:54:05 AM Page 41 of 62
Total Crashes by City / Village
Table 8.01 - City / Village Statistics

City / Village County Population Fatal Crashes
Injury Crashes
PDO Crashes
Total Crashes
Deaths Injuries
Perry (Township of) ALL 3,620 2 62 186 250 2 99
Perry (Township of) ASD 1,927 1 19 69 89 1 33
Perry (Township of) BRO 4,830 1 20 63 84 1 35
Perry (Township of) CAR 1,022 0 7 10 17 0 13
Perry (Township of) COL 17,049 1 19 71 91 1 25
Perry (Township of) COS 513 0 0 5 5 0 0
Perry (Township of) FAY 945 0 4 33 37 0 4
Perry (Township of) FRA 4,087 1 37 141 179 1 56
Perry (Township of) GAL 1,276 0 2 16 18 0 4
Perry (Township of) HOC 2,554 0 11 16 27 0 15
Perry (Township of) LAK 8,240 0 29 61 90 0 43
Perry (Township of) LAW 6,813 1 46 75 122 1 70
Perry (Township of) LIC 1,492 1 5 11 17 1 8
Perry (Township of) LOG 1,022 1 14 43 58 1 20
Perry (Township of) MOE 455 0 0 4 4 0 0
Perry (Township of) MOT 6,184 1 22 51 74 2 34
Perry (Township of) MRW 1,970 0 13 48 61 0 19
Perry (Township of) MUS 2,420 0 14 88 102 0 18
Perry (Township of) PIC 1,319 0 9 11 20 0 10
Perry (Township of) PIK 913 0 4 6 10 0 7
Perry (Township of) PUT 1,206 1 2 11 14 1 2
Perry (Township of) RIC 1,345 0 17 65 82 0 26
Perry (Township of) SHE 1,128 0 10 24 34 0 18
Perry (Township of) STA 29,167 0 143 561 704 0 212
Perry (Township of) TUS 462 0 3 3 6 0 3
Perry (Township of) WOO 1,934 1 9 22 32 1 10
Perrysburg WOO 16,945 3 185 686 874 3 272
Perrysburg (Township of) WOO 13,613 1 95 198 294 1 130
Perrysville ASD 816 0 1 1 2 0 2
Peru (Township of) HUR 1,043 0 7 24 31 0 10
Peru (Township of) MRW 1,260 1 12 32 45 1 17
Phillipsburg MOT 628 0 1 4 5 0 1
Philo MUS 769 0 0 2 2 0 0
Pickaway (County) PIC 52,727 0 0 1 1 0 0
Pickaway (Township of) PIC 1,851 0 32 80 112 0 47
Pickerington FAI 9,792 0 69 388 457 0 117
Report generated on : 5/18/2016 11:54:05 AM Page 42 of 62
Total Crashes by City / Village
Table 8.01 - City / Village Statistics

City / Village County Population Fatal Crashes
Injury Crashes
PDO Crashes
Total Crashes
Deaths Injuries
Pierce (Township of) CLE 12,226 1 91 195 287 1 137
Pierpont (Township of) ATB 1,197 0 8 14 22 0 9
Pike (Township of) BRO 3,742 0 8 32 40 0 13
Pike (Township of) CLA 3,891 0 11 28 39 0 20
Pike (Township of) COS 550 0 2 2 4 0 3
Pike (Township of) FUL 1,738 1 15 46 62 1 22
Pike (Township of) KNO 1,298 0 5 17 22 0 6
Pike (Township of) MAD 531 0 2 3 5 0 4
Pike (Township of) PER 6,595 0 23 36 59 0 26
Pike (Township of) STA 4,088 1 26 61 88 1 37
Piketon PIK 1,907 0 3 10 13 0 4
Pioneer WIL 1,460 0 1 6 7 0 2
Piqua MIA 20,738 0 107 357 464 0 145
Pitsburg DAR 392 0 1 2 3 0 1
Pitt (Township of) WYA 1,036 0 4 50 54 0 4
Pittsfield (Township of) LOR 1,549 2 24 51 77 3 41
Plain (Township of) FRA 5,926 2 15 54 71 3 25
Plain (Township of) STA 51,997 1 212 627 840 1 308
Plain (Township of) WAY 2,894 0 20 73 93 0 38
Plain (Township of) WOO 1,706 2 14 58 74 2 23
Plain City MAD 2,832 0 4 26 30 0 4
Plain City UNI 2,832 0 1 4 5 0 4
Pleasant (Township of) BRO 5,187 1 12 56 69 1 19
Pleasant (Township of) CLA 3,134 1 9 29 39 1 11
Pleasant (Township of) FAI 5,549 0 18 39 57 0 26
Pleasant (Township of) FRA 7,030 4 38 91 133 4 57
Pleasant (Township of) HAN 2,473 0 11 24 35 0 19
Pleasant (Township of) HAR 8,608 0 13 37 50 0 19
Pleasant (Township of) HEN 2,158 0 7 12 19 0 10
Pleasant (Township of) KNO 2,362 0 11 29 40 0 13
Pleasant (Township of) LOG 1,082 0 7 31 38 0 17
Pleasant (Township of) MAD 3,282 0 20 42 62 0 32
Pleasant (Township of) MAR 4,368 1 37 110 148 1 72
Pleasant (Township of) PER 794 0 8 15 23 0 8
Pleasant (Township of) PUT 3,955 0 13 18 31 0 19
Pleasant (Township of) SEN 1,685 0 12 42 54 0 22
Report generated on : 5/18/2016 11:54:05 AM Page 43 of 62
Total Crashes by City / Village
Table 8.01 - City / Village Statistics

City / Village County Population Fatal Crashes
Injury Crashes
PDO Crashes
Total Crashes
Deaths Injuries
Pleasant (Township of) VAN 11,120 0 18 67 85 0 27
Pleasant City GUE 439 0 1 2 3 0 1
Pleasant Hill MIA 1,134 0 1 5 6 0 2
Pleasantville FAI 877 0 0 1 1 0 0
Plymouth HUR 1,852 0 0 1 1 0 0
Plymouth RIC 1,852 0 7 19 26 0 7
Plymouth (Township of) ATB 2,081 2 27 133 162 3 41
Plymouth (Township of) RIC 2,162 0 0 8 8 0 0
Poland MAH 2,866 1 16 55 72 1 25
Poland (Township of) MAH 14,711 0 27 108 135 0 34
Polk ASD 357 0 0 2 2 0 0
Polk (Township of) CRA 2,334 1 11 57 69 1 15
Pomeroy MEG 1,966 0 2 2 4 0 2
Port Clinton OTT 6,391 0 15 108 123 0 18
Port Jefferson SHE 321 0 0 6 6 0 0
Port Washington TUS 552 0 2 4 6 0 2
Portage WOO 428 0 13 71 84 0 21
Portage (Township of) HAN 604 0 4 33 37 0 5
Portage (Township of) OTT 1,634 0 20 87 107 0 29
Portage (Township of) WOO 1,516 0 15 58 73 0 28
Porter (Township of) DEL 1,696 1 5 25 31 1 9
Porter (Township of) SCI 9,892 1 61 133 195 1 95
Portsmouth SCI 20,909 1 161 510 672 1 223
Potsdam MIA 203 0 0 1 1 0 0
Powell DEL 6,247 0 25 107 132 0 37
Powhatan Point (RR name Powhatan)
BEL 1,744 0 2 3 5 0 2
Prairie (Township of) FRA 17,118 0 128 376 504 0 185
Prairie (Township of) HOL 2,785 1 8 30 39 1 9
Proctorville LAW 620 0 1 4 5 0 3
Prospect MAR 1,191 0 9 11 20 0 10
Prospect (Township of) MAR 2,207 0 11 13 24 0 16
Providence (Township of) LUC 3,454 1 23 55 79 2 34
Pulaski (Township of) WIL 2,628 4 31 127 162 5 53
Pultney (Township of) BEL 9,700 0 53 143 196 0 70
Pusheta (Township of) AUG 1,346 0 13 43 56 0 24
Put-in-Bay OTT 128 0 1 0 1 0 1
Report generated on : 5/18/2016 11:54:05 AM Page 44 of 62
Total Crashes by City / Village
Table 8.01 - City / Village Statistics

City / Village County Population Fatal Crashes
Injury Crashes
PDO Crashes
Total Crashes
Deaths Injuries
Put-in-Bay (Township of) OTT 763 0 1 0 1 0 1
Putnam (County) PUT 34,726 0 0 7 7 0 0
Quaker City GUE 563 0 1 1 2 0 2
Quincy LOG 734 0 2 1 3 0 2
Raccoon (Township of) GAL 2,302 0 22 43 65 0 28
Racine MEG 746 0 1 5 6 0 2
Radnor (Township of) DEL 1,335 1 22 15 38 3 32
Randolph (Township of) POR 5,504 2 32 54 88 2 40
Range (Township of) MAD 983 1 17 29 47 1 17
Rarden SCI 176 1 3 5 9 1 3
Rarden (Township of) SCI 1,122 0 1 3 4 0 1
Ravenna POR 11,771 1 66 254 321 1 89
Ravenna (Township of) POR 9,270 0 72 213 285 0 111
Rawson HAN 465 0 0 1 1 0 0
Rayland JEF 434 0 0 2 2 0 0
Reading HAM 11,292 0 62 251 313 0 79
Reading (Township of) PER 3,956 0 18 34 52 0 23
Recovery (Township of) MER 1,550 0 11 25 36 0 17
Reed (Township of) SEN 949 0 2 22 24 0 2
Reily (Township of) BUT 2,568 0 18 31 49 0 23
Reminderville SUM 2,347 0 1 24 25 0 1
Republic SEN 614 0 3 3 6 0 4
Reynoldsburg FAI 32,069 0 19 61 80 0 26
Reynoldsburg FRA 32,069 3 116 362 481 3 161
Reynoldsburg LIC 32,069 0 17 56 73 0 19
Rice (Township of) SAN 1,437 0 10 48 58 0 13
Rich Hill (Township of) MUS 385 0 3 7 10 0 4
Richfield SUM 3,286 0 39 139 178 0 50
Richfield (Township of) HEN 654 1 4 18 23 1 6
Richfield (Township of) LUC 1,573 0 12 20 32 0 21
Richfield (Township of) SUM 5,424 0 21 30 51 0 33
Richland (Township of) ALL 6,090 1 50 106 157 1 79
Richland (Township of) BEL 13,571 1 82 282 365 1 124
Richland (Township of) CLI 3,758 0 8 17 25 0 13
Richland (Township of) DAR 862 0 10 19 29 0 13
Richland (Township of) DEF 2,941 1 22 80 103 1 32
Report generated on : 5/18/2016 11:54:05 AM Page 45 of 62
Total Crashes by City / Village
Table 8.01 - City / Village Statistics

City / Village County Population Fatal Crashes
Injury Crashes
PDO Crashes
Total Crashes
Deaths Injuries
Richland (Township of) FAI 1,940 2 5 9 16 2 10
Richland (Township of) GUE 2,033 0 4 14 18 0 13
Richland (Township of) HOL 1,165 0 7 21 28 0 8
Richland (Township of) LOG 2,455 1 7 27 35 1 8
Richland (Township of) MAR 1,663 1 18 36 55 1 23
Richland (Township of) VIN 1,667 1 19 31 51 1 34
Richland (Township of) WYA 952 0 3 17 20 0 3
Richmond JEF 471 0 0 5 5 0 0
Richmond (Township of) ATB 937 0 8 13 21 0 16
Richmond (Township of) HUR 1,111 0 7 18 25 0 7
Richmond Heights CUY 10,944 0 49 105 154 0 70
Richwood UNI 2,156 0 0 2 2 0 0
Ridge (Township of) VAN 3,114 1 24 47 72 1 43
Ridge (Township of) WYA 512 0 3 6 9 0 4
Ridgefield (Township of) HUR 2,390 1 6 29 36 1 9
Ridgeville (Township of) HEN 1,132 1 15 31 47 2 22
Ridgeway HAR 354 0 0 1 1 0 0
Riley (Township of) PUT 2,191 0 3 10 13 0 5
Riley (Township of) SAN 1,302 2 25 127 154 2 34
Rio Grande GAL 915 0 1 3 4 0 1
Ripley BRO 1,745 0 9 29 38 0 17
Ripley (Township of) HOL 2,194 0 5 20 25 0 8
Ripley (Township of) HUR 943 0 7 16 23 0 11
Risingsun (corporate name for Rising Sun)
WOO 620 0 0 1 1 0 0
Rittman WAY 6,314 0 8 35 43 0 13
Riverside MOT 23,545 2 168 284 454 2 256
Roaming Shores ATB 1,239 0 1 2 3 0 1
Rochester LOR 190 0 5 8 13 0 5
Rochester (Township of) LOR 752 0 1 3 4 0 2
Rock Creek ATB 584 0 2 7 9 0 4
Rockford MER 1,126 0 0 2 2 0 0
Rocky Ridge OTT 389 1 0 0 1 1 1
Rocky River CUY 20,735 1 44 234 279 1 59
Rogers COL 266 0 3 0 3 0 6
Rome (Township of) ATB 1,568 0 3 13 16 0 4
Rome (Township of) ATH 1,400 1 6 24 31 1 6
Report generated on : 5/18/2016 11:54:05 AM Page 46 of 62
Total Crashes by City / Village
Table 8.01 - City / Village Statistics
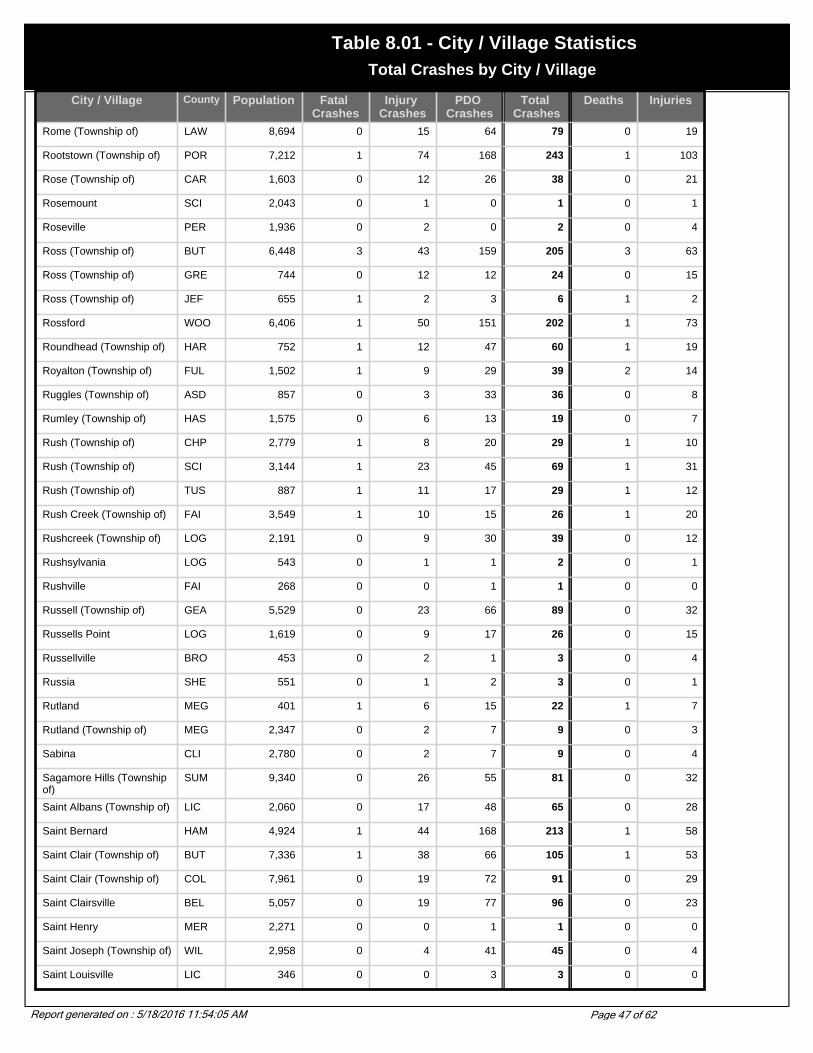
City / Village County Population Fatal Crashes
Injury Crashes
PDO Crashes
Total Crashes
Deaths Injuries
Rome (Township of) LAW 8,694 0 15 64 79 0 19
Rootstown (Township of) POR 7,212 1 74 168 243 1 103
Rose (Township of) CAR 1,603 0 12 26 38 0 21
Rosemount SCI 2,043 0 1 0 1 0 1
Roseville PER 1,936 0 2 0 2 0 4
Ross (Township of) BUT 6,448 3 43 159 205 3 63
Ross (Township of) GRE 744 0 12 12 24 0 15
Ross (Township of) JEF 655 1 2 3 6 1 2
Rossford WOO 6,406 1 50 151 202 1 73
Roundhead (Township of) HAR 752 1 12 47 60 1 19
Royalton (Township of) FUL 1,502 1 9 29 39 2 14
Ruggles (Township of) ASD 857 0 3 33 36 0 8
Rumley (Township of) HAS 1,575 0 6 13 19 0 7
Rush (Township of) CHP 2,779 1 8 20 29 1 10
Rush (Township of) SCI 3,144 1 23 45 69 1 31
Rush (Township of) TUS 887 1 11 17 29 1 12
Rush Creek (Township of) FAI 3,549 1 10 15 26 1 20
Rushcreek (Township of) LOG 2,191 0 9 30 39 0 12
Rushsylvania LOG 543 0 1 1 2 0 1
Rushville FAI 268 0 0 1 1 0 0
Russell (Township of) GEA 5,529 0 23 66 89 0 32
Russells Point LOG 1,619 0 9 17 26 0 15
Russellville BRO 453 0 2 1 3 0 4
Russia SHE 551 0 1 2 3 0 1
Rutland MEG 401 1 6 15 22 1 7
Rutland (Township of) MEG 2,347 0 2 7 9 0 3
Sabina CLI 2,780 0 2 7 9 0 4
Sagamore Hills (Township of)
SUM 9,340 0 26 55 81 0 32
Saint Albans (Township of) LIC 2,060 0 17 48 65 0 28
Saint Bernard HAM 4,924 1 44 168 213 1 58
Saint Clair (Township of) BUT 7,336 1 38 66 105 1 53
Saint Clair (Township of) COL 7,961 0 19 72 91 0 29
Saint Clairsville BEL 5,057 0 19 77 96 0 23
Saint Henry MER 2,271 0 0 1 1 0 0
Saint Joseph (Township of) WIL 2,958 0 4 41 45 0 4
Saint Louisville LIC 346 0 0 3 3 0 0
Report generated on : 5/18/2016 11:54:05 AM Page 47 of 62
Total Crashes by City / Village
Table 8.01 - City / Village Statistics

City / Village County Population Fatal Crashes
Injury Crashes
PDO Crashes
Total Crashes
Deaths Injuries
Saint Marys AUG 8,342 0 39 164 203 0 56
Saint Marys (Township of) AUG 11,600 1 6 13 20 2 8
Saint Paris CHP 1,998 0 3 12 15 0 3
Salem COL 12,197 1 64 170 235 1 90
Salem (Township of) AUG 580 1 3 10 14 1 5
Salem (Township of) CHP 2,307 1 14 33 48 1 24
Salem (Township of) COL 5,703 0 16 43 59 0 23
Salem (Township of) HIG 682 0 5 6 11 0 8
Salem (Township of) JEF 3,162 0 14 34 48 0 18
Salem (Township of) MEG 944 0 5 5 10 0 6
Salem (Township of) MOE 1,046 2 4 24 30 2 5
Salem (Township of) MUS 830 0 3 16 19 0 3
Salem (Township of) OTT 5,517 0 13 41 54 0 18
Salem (Township of) SHE 2,231 0 9 56 65 0 11
Salem (Township of) TUS 1,673 0 22 49 71 0 28
Salem (Township of) WAR 4,133 1 20 51 72 1 39
Salem (Township of) WAS 1,130 0 12 25 37 0 17
Salem (Township of) WYA 1,055 1 13 43 57 1 19
Saline (Township of) JEF 1,454 0 12 17 29 0 18
Salineville COL 1,397 0 0 1 1 0 0
Salisbury (Township of) MEG 6,441 0 29 68 97 0 49
Salt Creek (Township of) HOC 1,260 0 3 17 20 0 4
Salt Creek (Township of) HOL 3,778 0 15 43 58 0 22
Salt Creek (Township of) MUS 1,113 0 11 12 23 0 12
Salt Creek (Township of) PIC 2,655 2 16 52 70 2 20
Salt Creek (Township of) WAY 3,783 0 15 17 32 0 18
Salt Lick (Township of) PER 1,200 1 6 8 15 1 9
Salt Rock (Township of) MAR 699 0 2 17 19 0 2
Sandusky ERI 27,844 1 123 544 668 1 180
Sandusky (County) SAN 61,792 0 0 1 1 0 0
Sandusky (Township of) CRA 475 0 1 13 14 0 1
Sandusky (Township of) RIC 856 0 8 26 34 0 13
Sandusky (Township of) SAN 4,087 0 44 158 202 0 69
Sandy (Township of) STA 3,679 1 12 32 45 1 14
Sandy (Township of) TUS 3,354 0 18 36 54 0 20
Sardinia BRO 862 0 0 1 1 0 0
Report generated on : 5/18/2016 11:54:05 AM Page 48 of 62
Total Crashes by City / Village
Table 8.01 - City / Village Statistics

City / Village County Population Fatal Crashes
Injury Crashes
PDO Crashes
Total Crashes
Deaths Injuries
Savannah ASD 372 0 1 1 2 0 1
Saybrook (Township of) ATB 10,051 0 54 120 174 0 74
Scioto (County) SCI 79,195 0 0 1 1 0 0
Scioto (Township of) DEL 2,527 0 33 56 89 0 52
Scioto (Township of) JAC 1,788 0 11 55 66 0 14
Scioto (Township of) PIC 9,165 0 27 40 67 0 31
Scioto (Township of) PIK 1,232 0 12 22 34 0 20
Scioto (Township of) ROS 27,735 1 99 244 344 1 157
Scipio (Township of) MEG 1,050 0 9 8 17 0 13
Scipio (Township of) SEN 1,831 0 5 35 40 0 5
Scott PAU 322 0 1 0 1 0 2
Scott (Township of) ADA 2,053 0 12 40 52 0 18
Scott (Township of) BRO 1,253 0 8 31 39 0 14
Scott (Township of) MAR 521 0 4 6 10 0 7
Scott (Township of) SAN 1,502 1 12 22 35 1 13
Seal (Township of) PIK 2,983 1 25 52 78 1 44
Seaman ADA 1,039 0 2 3 5 0 3
Sebring MAH 4,912 0 4 33 37 0 5
Seneca (Township of) MOE 508 0 4 11 15 0 6
Seneca (Township of) NOB 453 0 1 5 6 0 2
Seneca (Township of) SEN 1,585 0 11 31 42 0 15
Senecaville GUE 453 0 0 1 1 0 0
Seven Hills CUY 12,080 0 13 24 37 0 19
Seven Mile BUT 678 0 1 3 4 0 2
Seville MED 2,160 0 6 27 33 0 8
Shadyside BEL 3,675 0 0 1 1 0 0
Shaker Heights CUY 29,405 1 87 243 331 1 134
Shalersville (Township of) POR 5,976 1 48 104 153 1 59
Sharon (Township of) FRA 16,455 1 94 302 397 1 145
Sharon (Township of) MED 4,244 0 41 79 120 0 62
Sharon (Township of) NOB 353 0 1 0 1 0 1
Sharon (Township of) RIC 9,720 1 9 21 31 1 12
Sharonville BUT 13,804 0 0 5 5 0 0
Sharonville HAM 13,804 1 211 753 965 1 268
Shawnee PER 608 0 0 1 1 0 0
Shawnee (Township of) ALL 12,220 0 89 358 447 0 140
Report generated on : 5/18/2016 11:54:06 AM Page 49 of 62
Total Crashes by City / Village
Table 8.01 - City / Village Statistics
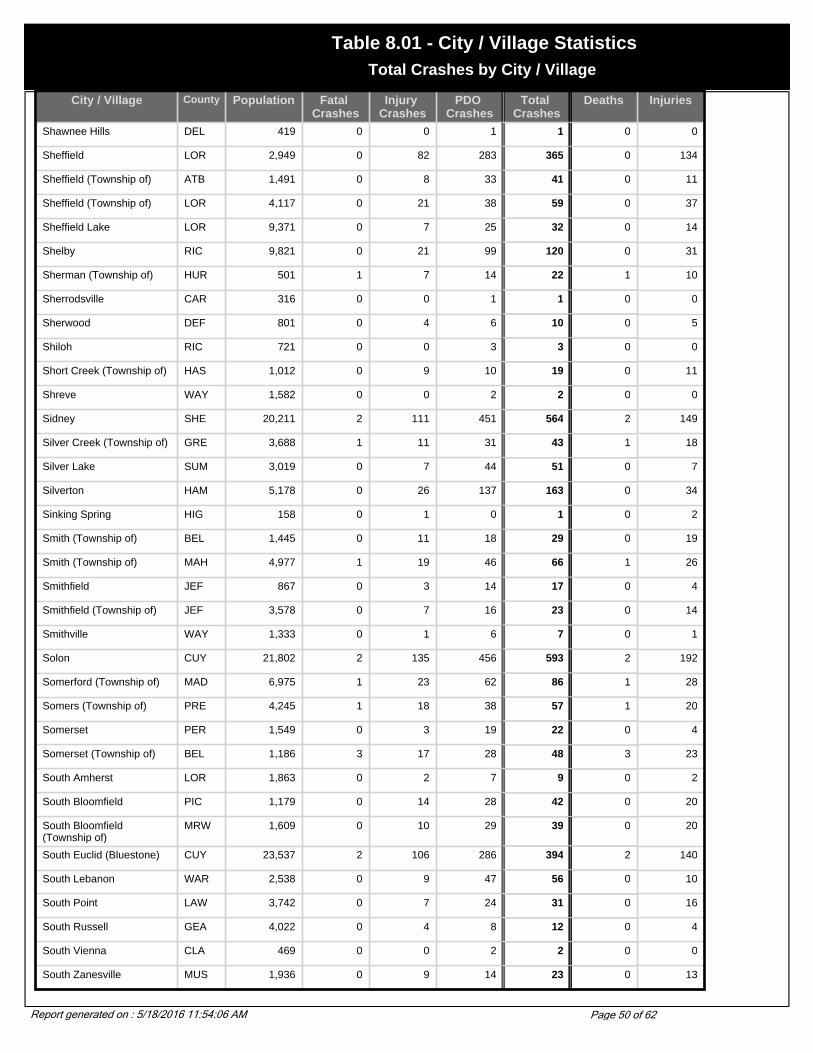
City / Village County Population Fatal Crashes
Injury Crashes
PDO Crashes
Total Crashes
Deaths Injuries
Shawnee Hills DEL 419 0 0 1 1 0 0
Sheffield LOR 2,949 0 82 283 365 0 134
Sheffield (Township of) ATB 1,491 0 8 33 41 0 11
Sheffield (Township of) LOR 4,117 0 21 38 59 0 37
Sheffield Lake LOR 9,371 0 7 25 32 0 14
Shelby RIC 9,821 0 21 99 120 0 31
Sherman (Township of) HUR 501 1 7 14 22 1 10
Sherrodsville CAR 316 0 0 1 1 0 0
Sherwood DEF 801 0 4 6 10 0 5
Shiloh RIC 721 0 0 3 3 0 0
Short Creek (Township of) HAS 1,012 0 9 10 19 0 11
Shreve WAY 1,582 0 0 2 2 0 0
Sidney SHE 20,211 2 111 451 564 2 149
Silver Creek (Township of) GRE 3,688 1 11 31 43 1 18
Silver Lake SUM 3,019 0 7 44 51 0 7
Silverton HAM 5,178 0 26 137 163 0 34
Sinking Spring HIG 158 0 1 0 1 0 2
Smith (Township of) BEL 1,445 0 11 18 29 0 19
Smith (Township of) MAH 4,977 1 19 46 66 1 26
Smithfield JEF 867 0 3 14 17 0 4
Smithfield (Township of) JEF 3,578 0 7 16 23 0 14
Smithville WAY 1,333 0 1 6 7 0 1
Solon CUY 21,802 2 135 456 593 2 192
Somerford (Township of) MAD 6,975 1 23 62 86 1 28
Somers (Township of) PRE 4,245 1 18 38 57 1 20
Somerset PER 1,549 0 3 19 22 0 4
Somerset (Township of) BEL 1,186 3 17 28 48 3 23
South Amherst LOR 1,863 0 2 7 9 0 2
South Bloomfield PIC 1,179 0 14 28 42 0 20
South Bloomfield (Township of)
MRW 1,609 0 10 29 39 0 20
South Euclid (Bluestone) CUY 23,537 2 106 286 394 2 140
South Lebanon WAR 2,538 0 9 47 56 0 10
South Point LAW 3,742 0 7 24 31 0 16
South Russell GEA 4,022 0 4 8 12 0 4
South Vienna CLA 469 0 0 2 2 0 0
South Zanesville MUS 1,936 0 9 14 23 0 13
Report generated on : 5/18/2016 11:54:06 AM Page 50 of 62
Total Crashes by City / Village
Table 8.01 - City / Village Statistics

City / Village County Population Fatal Crashes
Injury Crashes
PDO Crashes
Total Crashes
Deaths Injuries
Southington (Township of) TRU 3,817 1 21 62 84 1 27
Sparta MRW 191 0 0 1 1 0 0
Spencer MED 747 0 10 18 28 0 16
Spencer (Township of) ALL 3,106 0 7 23 30 0 9
Spencer (Township of) GUE 1,058 0 5 19 24 0 12
Spencer (Township of) LUC 1,708 0 9 12 21 0 16
Spencer (Township of) MED 2,429 0 0 4 4 0 0
Spencerville ALL 2,235 0 2 17 19 0 2
Sprigg (Township of) ADA 1,639 0 18 57 75 0 22
Spring Valley GRE 510 0 4 9 13 0 7
Spring Valley (Township of) GRE 2,489 1 13 46 60 1 19
Springboro MOT 12,380 0 2 10 12 0 2
Springboro WAR 12,380 1 63 160 224 1 97
Springcreek (Township of) MIA 1,826 1 25 109 135 1 37
Springdale HAM 10,563 0 140 501 641 0 185
Springfield CLA 65,358 9 593 1,270 1,872 9 892
Springfield (Township of) CLA 13,424 1 63 199 263 2 89
Springfield (Township of) GAL 3,181 1 29 91 121 1 41
Springfield (Township of) HAM 37,587 2 217 638 857 2 286
Springfield (Township of) JEF 2,568 1 7 17 25 1 7
Springfield (Township of) LUC 24,123 1 251 509 761 1 358
Springfield (Township of) MAH 6,054 0 27 123 150 0 34
Springfield (Township of) MUS 5,433 0 35 74 109 0 44
Springfield (Township of) RIC 9,674 1 41 135 177 2 64
Springfield (Township of) ROS 2,277 0 38 62 100 0 62
Springfield (Township of) SUM 15,168 2 79 226 307 2 114
Springfield (Township of) WIL 3,227 0 16 60 76 0 17
Stark (County) STA 378,098 0 6 7 13 0 7
Starr (Township of) HOC 1,477 1 12 26 39 2 16
Staunton (Township of) MIA 1,992 0 13 67 80 0 21
Sterling (Township of) BRO 3,753 0 27 44 71 0 49
Steubenville JEF 19,015 1 109 346 456 1 160
Steubenville (Township of) JEF 4,695 0 9 22 31 0 12
Stock (Township of) HAS 432 1 8 17 26 1 13
Stock (Township of) NOB 383 1 0 0 1 1 1
Stokes (Township of) LOG 5,367 0 16 42 58 0 24
Report generated on : 5/18/2016 11:54:06 AM Page 51 of 62
Total Crashes by City / Village
Table 8.01 - City / Village Statistics

City / Village County Population Fatal Crashes
Injury Crashes
PDO Crashes
Total Crashes
Deaths Injuries
Stokes (Township of) MAD 746 0 2 1 3 0 4
Stone Creek TUS 184 0 1 3 4 0 1
Stonelick (Township of) CLE 5,816 0 44 106 150 0 59
Stony Prairie SAN 836 0 0 1 1 0 0
Stoutsville FAI 581 0 1 1 2 0 1
Stow SUM 32,139 0 144 485 629 0 196
Strasburg TUS 2,310 0 3 27 30 0 3
Streetsboro POR 12,311 3 147 424 574 3 207
Strongsville CUY 43,858 2 212 714 928 2 321
Struthers MAH 11,756 0 25 94 119 0 34
Stryker WIL 1,406 0 1 3 4 0 1
Suffield (Township of) POR 6,383 2 37 88 127 3 64
Sugar Bush Knolls POR 227 0 0 1 1 0 0
Sugar Creek (Township of) ALL 1,330 0 15 25 40 0 26
Sugar Creek (Township of) GRE 6,629 0 59 192 251 0 84
Sugar Creek (Township of) PUT 1,156 0 3 12 15 0 3
Sugar Creek (Township of) STA 6,740 0 19 48 67 0 27
Sugar Creek (Township of) TUS 3,894 0 10 25 35 0 14
Sugar Creek (Township of) WAY 6,502 1 38 62 101 1 51
Sugar Grove FAI 448 0 0 1 1 0 0
Sugarcreek TUS 2,174 0 10 32 42 0 12
Sullivan (Township of) ASD 2,076 0 10 17 27 0 12
Summit (Township of) MOE 714 0 4 16 20 0 4
Sunbury DEL 2,630 0 13 47 60 0 21
Sunfish (Township of) PIK 1,317 0 3 26 29 0 6
Sunsbury (Township of) MOE 1,424 0 4 14 18 0 7
Superior (Township of) WIL 5,769 0 14 77 91 0 21
Sutton (Township of) MEG 3,250 0 10 27 37 0 12
Swan (Township of) VIN 796 4 11 11 26 5 18
Swan Creek (Township of) FUL 8,461 2 29 90 121 2 43
Swanton FUL 3,307 0 14 44 58 0 22
Swanton LUC 3,307 0 10 42 52 0 14
Swanton (Township of) LUC 3,354 1 22 90 113 1 40
Switzerland (Township of) MOE 509 0 8 14 22 0 10
Sycamore WYA 914 0 0 8 8 0 0
Sycamore (Township of) HAM 19,675 0 177 775 952 0 227
Report generated on : 5/18/2016 11:54:06 AM Page 52 of 62
Total Crashes by City / Village
Table 8.01 - City / Village Statistics

City / Village County Population Fatal Crashes
Injury Crashes
PDO Crashes
Total Crashes
Deaths Injuries
Sycamore (Township of) WYA 1,598 0 2 16 18 0 5
Sylvania LUC 18,670 0 100 307 407 0 132
Sylvania (Township of) LUC 44,253 4 256 660 920 4 362
Symmes (Township of) HAM 14,771 1 128 521 650 1 174
Symmes (Township of) LAW 470 0 2 1 3 0 3
Syracuse MEG 879 0 1 3 4 0 1
Tallmadge POR 16,390 0 0 1 1 0 0
Tallmadge SUM 16,390 0 59 319 378 0 92
Tarlton PIC 298 0 0 2 2 0 0
Tate (Township of) CLE 8,935 0 59 133 192 0 72
Taylor (Township of) UNI 1,444 0 9 21 30 0 15
Taylor Creek (Township of) HAR 517 0 4 9 13 0 8
Terrace Park HAM 2,273 0 1 5 6 0 1
Texas (Township of) CRA 409 0 2 19 21 0 2
The Plains ATH 2,931 0 0 1 1 0 0
The Village of Indian Hill HAM 5,907 0 25 82 107 0 28
Thompson (Township of) DEL 558 0 11 9 20 0 11
Thompson (Township of) GEA 2,383 0 17 43 60 0 20
Thompson (Township of) SEN 1,422 0 6 16 22 0 7
Thorn (Township of) PER 3,765 1 22 29 52 1 36
Thornville PER 731 0 1 9 10 0 3
Thurston FAI 555 0 1 2 3 0 1
Tiffin SEN 18,135 1 58 313 372 1 73
Tiffin (Township of) ADA 5,075 1 27 60 88 2 40
Tiffin (Township of) DEF 1,705 0 7 58 65 0 13
Tipp City MIA 9,221 0 42 167 209 0 62
Tiro CRA 281 0 0 1 1 0 0
Tiverton (Township of) COS 348 0 0 3 3 0 0
Tod (Township of) CRA 739 0 4 24 28 0 7
Toledo LUC 313,619 18 2,755 7,122 9,895 18 4,137
Tontogany WOO 364 0 0 1 1 0 0
Toronto JEF 5,676 0 9 30 39 0 22
Townsend (Township of) HUR 1,567 0 8 17 25 0 11
Townsend (Township of) SAN 1,670 0 23 111 134 0 31
Tremont City CLA 349 0 0 3 3 0 0
Trenton BUT 8,746 0 21 101 122 0 32
Report generated on : 5/18/2016 11:54:06 AM Page 53 of 62
Total Crashes by City / Village
Table 8.01 - City / Village Statistics

City / Village County Population Fatal Crashes
Injury Crashes
PDO Crashes
Total Crashes
Deaths Injuries
Trenton (Township of) DEL 2,137 0 16 47 63 0 22
Trimble ATH 466 0 10 20 30 0 15
Trimble (Township of) ATH 4,710 0 13 23 36 0 17
Trotwood MOT 27,420 3 124 321 448 3 170
Troy MIA 21,999 0 90 529 619 0 107
Troy (Township of) ASD 1,051 0 2 18 20 0 2
Troy (Township of) ATH 2,712 0 26 49 75 0 34
Troy (Township of) DEL 2,665 0 24 49 73 0 30
Troy (Township of) GEA 2,567 2 31 45 78 2 39
Troy (Township of) MRW 1,190 0 10 25 35 0 12
Troy (Township of) RIC 6,449 1 26 92 119 1 36
Troy (Township of) WOO 4,355 0 31 81 112 0 47
Trumbull (County) TRU 225,116 0 0 5 5 0 0
Trumbull (Township of) ATB 1,461 0 8 26 34 0 10
Truro (Township of) FRA 27,151 0 10 32 42 0 15
Tully (Township of) MAR 738 0 4 19 23 0 5
Tully (Township of) VAN 2,119 0 12 26 38 0 13
Turtle Creek (Township of) SHE 1,583 0 8 34 42 0 10
Turtle Creek (Township of) WAR 12,617 1 132 303 436 1 210
Tuscarawas TUS 934 0 0 5 5 0 0
Tuscarawas (Township of) COS 1,798 3 11 47 61 3 21
Tuscarawas (Township of) STA 6,093 0 43 104 147 0 58
Twin (Township of) DAR 3,946 0 9 24 33 0 13
Twin (Township of) PRE 2,831 2 20 33 55 2 30
Twin (Township of) ROS 3,146 1 25 98 124 1 41
Twinsburg SUM 17,006 0 67 287 354 0 96
Twinsburg (Township of) SUM 2,153 0 12 49 61 0 16
Tymochtee (Township of) WYA 1,186 0 9 16 25 0 11
Uhrichsville TUS 5,662 0 15 64 79 0 15
Union MOT 5,574 0 9 33 42 0 11
Union (County) UNI 40,909 0 0 1 1 0 0
Union (Township of) AUG 1,870 0 5 32 37 0 10
Union (Township of) BEL 2,151 1 30 94 125 1 54
Union (Township of) BRO 3,015 0 13 33 46 0 14
Union (Township of) CAR 1,059 0 6 22 28 0 7
Union (Township of) CHP 1,920 0 9 26 35 0 10
Report generated on : 5/18/2016 11:54:06 AM Page 54 of 62
Total Crashes by City / Village
Table 8.01 - City / Village Statistics
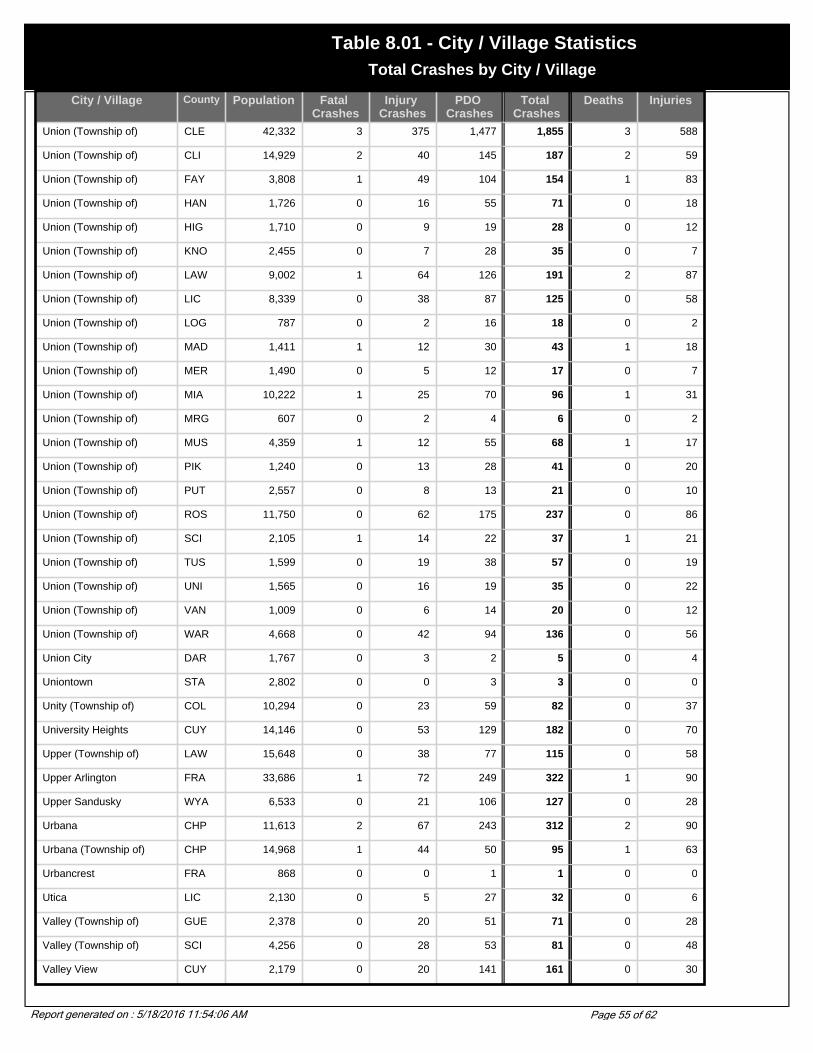
City / Village County Population Fatal Crashes
Injury Crashes
PDO Crashes
Total Crashes
Deaths Injuries
Union (Township of) CLE 42,332 3 375 1,477 1,855 3 588
Union (Township of) CLI 14,929 2 40 145 187 2 59
Union (Township of) FAY 3,808 1 49 104 154 1 83
Union (Township of) HAN 1,726 0 16 55 71 0 18
Union (Township of) HIG 1,710 0 9 19 28 0 12
Union (Township of) KNO 2,455 0 7 28 35 0 7
Union (Township of) LAW 9,002 1 64 126 191 2 87
Union (Township of) LIC 8,339 0 38 87 125 0 58
Union (Township of) LOG 787 0 2 16 18 0 2
Union (Township of) MAD 1,411 1 12 30 43 1 18
Union (Township of) MER 1,490 0 5 12 17 0 7
Union (Township of) MIA 10,222 1 25 70 96 1 31
Union (Township of) MRG 607 0 2 4 6 0 2
Union (Township of) MUS 4,359 1 12 55 68 1 17
Union (Township of) PIK 1,240 0 13 28 41 0 20
Union (Township of) PUT 2,557 0 8 13 21 0 10
Union (Township of) ROS 11,750 0 62 175 237 0 86
Union (Township of) SCI 2,105 1 14 22 37 1 21
Union (Township of) TUS 1,599 0 19 38 57 0 19
Union (Township of) UNI 1,565 0 16 19 35 0 22
Union (Township of) VAN 1,009 0 6 14 20 0 12
Union (Township of) WAR 4,668 0 42 94 136 0 56
Union City DAR 1,767 0 3 2 5 0 4
Uniontown STA 2,802 0 0 3 3 0 0
Unity (Township of) COL 10,294 0 23 59 82 0 37
University Heights CUY 14,146 0 53 129 182 0 70
Upper (Township of) LAW 15,648 0 38 77 115 0 58
Upper Arlington FRA 33,686 1 72 249 322 1 90
Upper Sandusky WYA 6,533 0 21 106 127 0 28
Urbana CHP 11,613 2 67 243 312 2 90
Urbana (Township of) CHP 14,968 1 44 50 95 1 63
Urbancrest FRA 868 0 0 1 1 0 0
Utica LIC 2,130 0 5 27 32 0 6
Valley (Township of) GUE 2,378 0 20 51 71 0 28
Valley (Township of) SCI 4,256 0 28 53 81 0 48
Valley View CUY 2,179 0 20 141 161 0 30
Report generated on : 5/18/2016 11:54:06 AM Page 55 of 62
Total Crashes by City / Village
Table 8.01 - City / Village Statistics

City / Village County Population Fatal Crashes
Injury Crashes
PDO Crashes
Total Crashes
Deaths Injuries
Valleyview FRA 601 0 1 1 2 0 2
Van Buren HAN 313 0 0 6 6 0 0
Van Buren (Township of) DAR 1,573 1 16 28 45 3 24
Van Buren (Township of) HAN 943 0 3 12 15 0 5
Van Buren (Township of) PUT 3,128 0 5 5 10 0 8
Van Buren (Township of) SHE 1,599 0 9 31 40 0 14
Van Wert VAN 10,690 0 3 11 14 0 4
Van Wert (County) VAN 29,659 0 52 171 223 0 76
Vandalia MOT 14,603 2 97 279 378 2 139
Vanlue HAN 371 0 1 3 4 0 1
Venice (Township of) SEN 1,871 1 10 32 43 1 15
Vermilion ERI 10,927 0 15 79 94 0 18
Vermilion LOR 10,927 1 12 57 70 2 16
Vermilion (Township of) ERI 9,575 2 23 75 100 2 33
Vermillion (Township of) ASD 2,539 0 18 67 85 0 23
Vernon (Township of) CLI 2,685 0 23 37 60 0 41
Vernon (Township of) CRA 817 1 7 18 26 1 18
Vernon (Township of) SCI 1,855 1 7 17 25 1 18
Vernon (Township of) TRU 1,765 0 8 21 29 0 13
Verona PRE 430 0 0 2 2 0 0
Versailles DAR 2,589 1 5 23 29 1 9
Vienna (Township of) TRU 4,021 0 24 82 106 0 31
Vinton GAL 324 0 0 5 5 0 0
Vinton (County) VIN 12,806 0 0 2 2 0 0
Vinton (Township of) VIN 558 0 9 27 36 0 10
Violet (Township of) FAI 26,914 4 54 123 181 5 91
Virginia (Township Of) COS 636 0 2 2 4 0 2
Wabash (Township Of) DAR 934 1 4 12 17 1 6
Wadsworth MED 18,437 0 100 394 494 0 147
Wadsworth (Township of) MED 3,996 0 7 27 34 0 10
Waite Hill LAK 446 0 2 15 17 0 2
Wakeman HUR 951 1 3 13 17 1 4
Wakeman (Township of) HUR 2,528 0 4 17 21 0 5
Walbridge WOO 2,546 0 0 5 5 0 0
Waldo MAR 332 0 4 21 25 0 8
Waldo (Township of) MAR 1,079 0 2 17 19 0 3
Report generated on : 5/18/2016 11:54:06 AM Page 56 of 62
Total Crashes by City / Village
Table 8.01 - City / Village Statistics
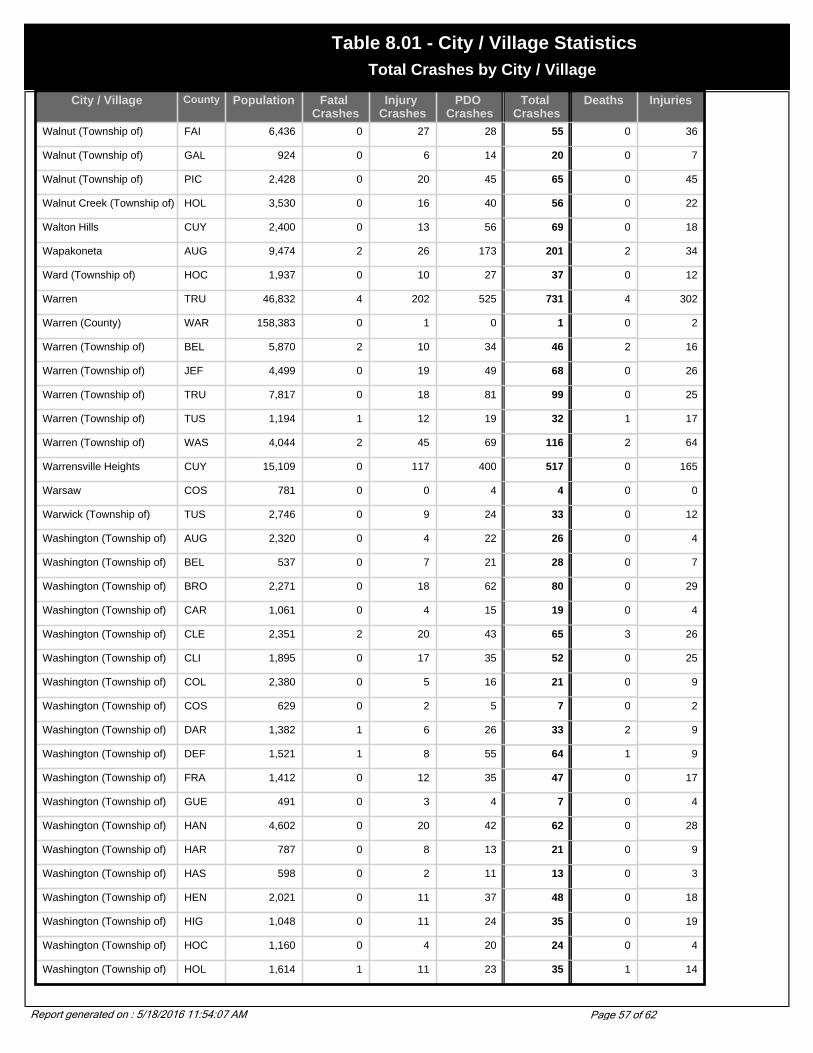
City / Village County Population Fatal Crashes
Injury Crashes
PDO Crashes
Total Crashes
Deaths Injuries
Walnut (Township of) FAI 6,436 0 27 28 55 0 36
Walnut (Township of) GAL 924 0 6 14 20 0 7
Walnut (Township of) PIC 2,428 0 20 45 65 0 45
Walnut Creek (Township of) HOL 3,530 0 16 40 56 0 22
Walton Hills CUY 2,400 0 13 56 69 0 18
Wapakoneta AUG 9,474 2 26 173 201 2 34
Ward (Township of) HOC 1,937 0 10 27 37 0 12
Warren TRU 46,832 4 202 525 731 4 302
Warren (County) WAR 158,383 0 1 0 1 0 2
Warren (Township of) BEL 5,870 2 10 34 46 2 16
Warren (Township of) JEF 4,499 0 19 49 68 0 26
Warren (Township of) TRU 7,817 0 18 81 99 0 25
Warren (Township of) TUS 1,194 1 12 19 32 1 17
Warren (Township of) WAS 4,044 2 45 69 116 2 64
Warrensville Heights CUY 15,109 0 117 400 517 0 165
Warsaw COS 781 0 0 4 4 0 0
Warwick (Township of) TUS 2,746 0 9 24 33 0 12
Washington (Township of) AUG 2,320 0 4 22 26 0 4
Washington (Township of) BEL 537 0 7 21 28 0 7
Washington (Township of) BRO 2,271 0 18 62 80 0 29
Washington (Township of) CAR 1,061 0 4 15 19 0 4
Washington (Township of) CLE 2,351 2 20 43 65 3 26
Washington (Township of) CLI 1,895 0 17 35 52 0 25
Washington (Township of) COL 2,380 0 5 16 21 0 9
Washington (Township of) COS 629 0 2 5 7 0 2
Washington (Township of) DAR 1,382 1 6 26 33 2 9
Washington (Township of) DEF 1,521 1 8 55 64 1 9
Washington (Township of) FRA 1,412 0 12 35 47 0 17
Washington (Township of) GUE 491 0 3 4 7 0 4
Washington (Township of) HAN 4,602 0 20 42 62 0 28
Washington (Township of) HAR 787 0 8 13 21 0 9
Washington (Township of) HAS 598 0 2 11 13 0 3
Washington (Township of) HEN 2,021 0 11 37 48 0 18
Washington (Township of) HIG 1,048 0 11 24 35 0 19
Washington (Township of) HOC 1,160 0 4 20 24 0 4
Washington (Township of) HOL 1,614 1 11 23 35 1 14
Report generated on : 5/18/2016 11:54:07 AM Page 57 of 62
Total Crashes by City / Village
Table 8.01 - City / Village Statistics

City / Village County Population Fatal Crashes
Injury Crashes
PDO Crashes
Total Crashes
Deaths Injuries
Washington (Township of) JAC 743 0 10 15 25 0 10
Washington (Township of) LAW 250 0 3 10 13 0 5
Washington (Township of) LIC 3,045 0 11 26 37 0 17
Washington (Township of) LOG 3,945 1 8 22 31 1 14
Washington (Township of) LUC 3,574 0 11 12 23 0 20
Washington (Township of) MER 1,218 0 5 17 22 0 6
Washington (Township of) MIA 1,803 3 18 62 83 3 24
Washington (Township of) MOE 520 0 1 2 3 0 2
Washington (Township of) MOT 52,991 1 176 272 449 1 277
Washington (Township of) MRW 1,227 2 11 31 44 2 16
Washington (Township of) MUS 4,284 1 33 108 142 1 55
Washington (Township of) PAU 789 0 4 25 29 0 7
Washington (Township of) PIC 2,951 1 22 38 61 1 34
Washington (Township of) PRE 2,104 0 12 50 62 0 13
Washington (Township of) RIC 6,777 0 62 285 347 0 92
Washington (Township of) SAN 2,396 3 36 104 143 3 49
Washington (Township of) SCI 5,971 2 35 75 112 2 61
Washington (Township of) SHE 2,083 1 17 59 77 1 22
Washington (Township of) STA 4,791 0 35 93 128 0 46
Washington (Township of) TUS 762 0 4 9 13 0 4
Washington (Township of) UNI 705 0 5 13 18 0 7
Washington (Township of) VAN 5,228 0 18 36 54 0 22
Washington (Township of) WAR 1,855 3 31 82 116 4 44
Washington (Township of) WOO 1,688 1 8 37 46 1 10
Washington Court House FAY 13,524 1 61 169 231 1 82
Washingtonville COL 789 0 0 1 1 0 0
Washingtonville MAH 789 0 1 0 1 0 2
Waterford (Township of) WAS 3,708 0 17 39 56 0 22
Waterloo (Township of) ATH 2,605 0 16 41 57 0 22
Watertown (Township of) WAS 1,563 1 6 7 14 1 6
Waterville LUC 4,828 0 15 41 56 0 23
Waterville (Township of) LUC 9,469 0 17 54 71 0 22
Wauseon FUL 7,091 0 24 93 117 0 33
Waverly PIK 4,433 0 21 91 112 0 30
Wayne WOO 842 0 0 1 1 0 0
Wayne (County) WAY 111,564 0 4 4 8 0 7
Report generated on : 5/18/2016 11:54:08 AM Page 58 of 62
Total Crashes by City / Village
Table 8.01 - City / Village Statistics

City / Village County Population Fatal Crashes
Injury Crashes
PDO Crashes
Total Crashes
Deaths Injuries
Wayne (Township of) ADA 1,273 1 8 28 37 1 11
Wayne (Township of) ATB 653 0 3 7 10 0 5
Wayne (Township of) AUG 1,591 0 6 22 28 0 7
Wayne (Township of) BEL 624 0 2 9 11 0 3
Wayne (Township of) BUT 4,252 4 36 54 94 4 64
Wayne (Township of) CHP 1,660 0 5 16 21 0 5
Wayne (Township of) CLE 5,025 1 29 45 75 1 34
Wayne (Township of) CLI 737 0 9 7 16 0 13
Wayne (Township of) COL 785 0 6 17 23 0 11
Wayne (Township of) DAR 4,349 0 9 32 41 0 12
Wayne (Township of) FAY 1,367 0 11 33 44 0 21
Wayne (Township of) JEF 2,233 1 14 38 53 1 17
Wayne (Township of) KNO 898 0 8 25 33 0 12
Wayne (Township of) MOE 348 0 2 5 7 0 2
Wayne (Township of) MUS 4,455 1 34 63 98 1 57
Wayne (Township of) NOB 507 1 2 6 9 1 6
Wayne (Township of) PIC 565 0 13 20 33 0 22
Wayne (Township of) TUS 1,743 0 10 32 42 0 11
Wayne (Township of) WAR 7,250 1 26 89 116 1 31
Wayne (Township of) WAY 4,034 0 38 91 129 0 51
Waynesburg STA 1,003 0 1 13 14 0 1
Waynesville WAR 2,558 0 7 21 28 0 10
Weathersfield (Township of)
TRU 27,717 0 66 187 253 0 84
Webster (Township of) WOO 1,277 0 15 32 47 0 18
Weller (Township of) RIC 1,736 1 10 31 42 1 20
Wellington LOR 4,511 1 10 42 53 1 15
Wellington (Township of) LOR 5,904 0 8 10 18 0 14
Wells (Township of) JEF 3,130 1 14 35 50 1 18
Wellston JAC 6,078 0 8 63 71 0 11
Wellsville COL 4,133 1 2 11 14 1 3
Wesley (Township of) WAS 915 0 8 9 17 0 9
West (Township of) COL 3,351 0 21 26 47 0 30
West Alexandria PRE 1,395 0 3 7 10 0 4
West Carrollton MOT 13,818 1 62 243 306 1 92
West Chester (Township of) AKA Union Township
BUT 54,895 6 467 1,354 1,827 6 665
West Elkton PRE 194 0 0 2 2 0 0
Report generated on : 5/18/2016 11:54:08 AM Page 59 of 62
Total Crashes by City / Village
Table 8.01 - City / Village Statistics

City / Village County Population Fatal Crashes
Injury Crashes
PDO Crashes
Total Crashes
Deaths Injuries
West Farmington TRU 519 0 2 5 7 0 4
West Jefferson (corporate name Jefferson)
MAD 4,331 0 11 43 54 0 14
West Lafayette COS 2,313 0 4 12 16 0 8
West Leipsic PUT 271 0 0 1 1 0 0
West Liberty LOG 1,813 0 5 14 19 0 6
West Manchester PRE 433 0 0 1 1 0 0
West Mansfield LOG 700 0 0 1 1 0 0
West Millgrove WOO 78 0 0 1 1 0 0
West Milton MIA 4,645 0 10 43 53 0 14
West Rushville FAI 132 0 1 0 1 0 1
West Salem WAY 1,501 0 1 3 4 0 1
West Union ADA 2,903 0 0 2 2 0 0
West Unity WIL 1,790 0 6 20 26 0 9
Westerville DEL 35,318 0 29 101 130 0 38
Westerville FRA 35,318 1 159 488 648 1 214
Westfield (Township of) MED 4,172 0 33 117 150 0 46
Westfield (Township of) MRW 1,100 0 5 12 17 0 5
Westfield Center MED 1,054 0 1 0 1 0 1
Westlake CUY 31,719 1 170 568 739 1 241
Westland (Township of) GUE 1,931 0 20 56 76 0 37
Weston WOO 1,659 0 3 11 14 0 6
Weston (Township of) WOO 2,274 0 7 19 26 0 11
Wharton WYA 409 0 0 1 1 0 0
Wheeling (Township of) BEL 1,477 0 9 28 37 0 9
Wheeling (Township of) GUE 752 0 13 17 30 0 17
Whetstone (Township of) CRA 2,365 0 11 57 68 0 11
White Eyes (Township of) COS 1,078 0 1 2 3 0 1
Whitehall FRA 19,201 1 165 415 581 1 249
Whitehouse LUC 2,733 0 9 25 34 0 12
Whiteoak (Township of) HIG 1,374 0 6 8 14 0 8
Whitewater (Township of) HAM 5,564 5 84 264 353 5 117
Wickliffe LAK 13,484 1 61 231 293 1 76
Wilkesville VIN 151 0 3 7 10 0 3
Wilkesville (Township of) VIN 888 0 4 4 8 0 5
Willard HUR 6,806 0 14 79 93 0 18
Williamsburg CLE 2,358 0 23 63 86 0 38
Report generated on : 5/18/2016 11:54:08 AM Page 60 of 62
Total Crashes by City / Village
Table 8.01 - City / Village Statistics

City / Village County Population Fatal Crashes
Injury Crashes
PDO Crashes
Total Crashes
Deaths Injuries
Williamsburg (Township of) CLE 5,005 0 17 72 89 0 27
Williamsfield (Township of) ATB 1,683 1 9 14 24 1 18
Williamsport PIC 1,002 0 2 2 4 0 2
Willoughby LAK 22,621 0 158 505 663 0 229
Willoughby Hills LAK 8,595 0 61 185 246 0 81
Willowick LAK 14,361 1 38 133 172 1 49
Wills (Township of) GUE 1,567 0 23 44 67 0 37
Willshire VAN 463 0 3 14 17 0 3
Willshire (Township of) VAN 1,719 0 2 9 11 0 4
Wilmington CLI 11,921 0 69 175 244 0 91
Wilmot STA 335 0 1 4 5 0 1
Wilson BEL 118 0 0 1 1 0 0
Wilson (Township of) CLI 581 0 5 10 15 0 9
Winchester ADA 1,025 0 2 20 22 0 6
Winchester (Township of) ADA 1,984 0 3 12 15 0 3
Windham POR 2,806 0 13 52 65 0 14
Windham (Township of) POR 2,060 2 9 21 32 2 14
Windsor (Township of) ATB 1,932 0 14 34 48 0 18
Windsor (Township of) LAW 2,127 0 12 23 35 0 12
Windsor (Township of) MRG 1,951 1 6 8 15 1 8
Wintersville JEF 4,067 0 19 50 69 0 30
Wood (County) WOO 121,065 0 1 8 9 0 2
Woodlawn HAM 2,816 1 31 92 124 1 40
Woodmere CUY 828 0 18 65 83 0 25
Woodsfield MOE 2,598 0 7 23 30 0 19
Woodville SAN 1,977 0 11 54 65 0 15
Woodville (Township of) SAN 3,304 0 11 61 72 0 14
Wooster WAY 24,811 4 148 552 704 4 205
Wooster (Township of) WAY 5,250 1 18 62 81 1 29
Worthington FRA 14,125 1 88 277 366 1 116
Worthington (Township of) RIC 2,791 0 17 44 61 0 21
Wren VAN 199 0 0 1 1 0 0
Wyoming HAM 8,261 0 18 63 81 0 26
Xenia GRE 24,164 0 112 364 476 0 158
Xenia (Township of) GRE 6,117 2 61 157 220 2 93
Yankee Lake TRU 99 0 0 2 2 0 0
Report generated on : 5/18/2016 11:54:08 AM Page 61 of 62
Total Crashes by City / Village
Table 8.01 - City / Village Statistics

City / Village County Population Fatal Crashes
Injury Crashes
PDO Crashes
Total Crashes
Deaths Injuries
Yellow Creek (Township of) COL 2,185 0 15 24 39 0 21
Yellow Springs GRE 3,761 0 6 49 55 0 10
York (Township of) ATH 7,740 1 23 64 88 1 34
York (Township of) BEL 2,648 0 12 22 34 0 17
York (Township of) DAR 523 0 3 10 13 0 4
York (Township of) FUL 4,203 0 18 58 76 0 30
York (Township of) MED 2,912 0 37 59 96 0 55
York (Township of) MRG 958 1 3 7 11 2 7
York (Township of) SAN 2,512 1 15 44 60 1 19
York (Township of) TUS 1,292 2 9 36 47 2 17
York (Township of) UNI 1,174 0 11 23 34 0 14
York (Township of) VAN 788 0 1 14 15 0 1
Yorkville JEF 1,230 0 1 0 1 0 1
Youngstown MAH 82,026 5 418 970 1,393 5 608
Youngstown TRU 82,026 0 0 1 1 0 0
Zaleski VIN 375 0 0 2 2 0 0
Zane (Township of) LOG 968 0 9 18 27 0 12
Zanesfield LOG 220 0 0 2 2 0 0
Zanesville MUS 25,586 0 205 927 1,132 0 314
Zoar TUS 193 0 2 3 5 0 3
Report generated on : 5/18/2016 11:54:08 AM Page 62 of 62
Total Crashes by City / Village
Table 8.01 - City / Village Statistics

City / Village County Population Fatal Crashes
Injury Crashes
PDO Crashes
Total Crashes
Deaths Injuries
Adams (Township of) CHP 1,100 0 1 0 1 0 1
Adams (Township of) CLI 1,901 0 0 1 1 0 0
Adams (Township of) COS 755 0 0 1 1 0 0
Adams (Township of) DEF 999 0 1 0 1 0 1
Adams (Township of) GUE 2,019 0 3 3 6 0 4
Adams (Township of) MOE 672 0 1 0 1 0 1
Adams (Township of) SEN 1,337 0 1 1 2 0 1
Adams (Township of) WAS 1,830 0 0 3 3 0 0
Addison (Township of) GAL 2,366 0 4 3 7 0 4
Addyston HAM 1,010 0 0 1 1 0 0
Aid (Township of) LAW 907 0 0 1 1 0 0
Akron SUM 217,074 5 107 124 236 5 152
Alexander (Township of)
ATH 2,614 0 1 4 5 0 1
Alexandria LIC 85 0 0 1 1 0 0
Allen (County) ALL 108,473 0 0 1 1 0 0
Allen (Township of) DAR 1,158 0 1 0 1 0 1
Allen (Township of) HAN 2,110 0 4 1 5 0 8
Allen (Township of) OTT 3,591 0 2 3 5 0 2
Allen (Township of) UNI 1,518 0 1 0 1 0 2
Alliance STA 23,253 0 5 16 21 0 7
Amanda FAI 707 0 1 0 1 0 3
Amanda (Township of) FAI 2,429 1 0 0 1 1 0
Amberley HAM 3,425 0 0 4 4 0 0
Amboy (Township of) FUL 1,552 0 1 0 1 0 1
Amelia CLE 2,752 0 0 2 2 0 0
American (Township of) ALL 15,516 0 3 5 8 0 5
Ames (Township of) ATH 1,231 0 0 1 1 0 0
Amherst LOR 11,797 1 2 8 11 1 3
Amherst (Township of) LOR 7,598 0 1 3 4 0 1
Anderson (Township of)
HAM 43,857 0 19 15 34 0 24
Andover ATB 1,269 0 0 2 2 0 0
Andover (Township of) ATB 2,672 0 0 3 3 0 0
From Date 01/01/2015
To Date 12/31/2015
County(s) All Counties
Report generated on : 5/18/2016 11:54:17 AM Page 1 of 46
Alcohol Related Crashes by City / Village
Table 8.02 - City / Village Statistics

City / Village County Population Fatal Crashes
Injury Crashes
PDO Crashes
Total Crashes
Deaths Injuries
Aquilla (Lake Aquilla) GEA 372 0 1 0 1 0 2
Archer (Township of) HAS 306 0 1 0 1 0 1
Arlington HAN 1,351 0 0 1 1 0 0
Ashland ASD 21,249 0 5 5 10 0 6
Ashland (County) ASD 52,523 0 4 10 14 0 4
Ashtabula ATB 20,962 0 13 10 23 0 22
Ashtabula (Township of)
ATB 23,239 0 1 1 2 0 1
Ashville PIC 3,174 0 0 2 2 0 0
Athens ATH 21,342 0 3 18 21 0 3
Athens (Township of) ATH 27,714 1 0 2 3 1 0
Athens (Township of) HAS 520 0 0 1 1 0 0
Atwater (Township of) POR 2,762 0 2 3 5 0 2
Auburn (Township of) CRA 897 0 1 0 1 0 1
Auburn (Township of) GEA 5,158 0 5 3 8 0 8
Auburn (Township of) TUS 1,078 0 2 2 4 0 2
Auglaize (Township of) ALL 2,850 0 1 1 2 0 1
Auglaize (Township of) PAU 1,535 0 1 2 3 0 1
Augusta (Township of) CAR 1,599 1 2 3 6 1 4
Aurora POR 13,556 0 6 5 11 0 7
Austinburg (Township of)
ATB 2,234 0 6 2 8 0 7
Austintown MAH 31,627 0 2 5 7 0 3
Austintown (Township of)
MAH 38,001 3 10 17 30 3 12
Avon LOR 11,446 1 3 11 15 1 5
Avon Lake LOR 18,145 0 1 12 13 0 2
Bainbridge (Township of)
GEA 10,916 1 7 7 15 1 10
Ballville SAN 3,255 0 1 3 4 0 1
Ballville (Township of) SAN 6,395 1 1 1 3 1 2
Barberton SUM 27,899 1 11 9 21 1 16
Barlow (Township of) WAS 2,417 0 1 0 1 0 2
Barnesville BEL 4,225 0 3 0 3 0 3
Barnhill TUS 364 0 1 0 1 0 1
Bartlow (Township of) HEN 2,460 0 1 2 3 0 1
Batavia CLE 1,617 0 3 2 5 0 3
Batavia (Township of) CLE 17,503 0 4 13 17 0 4
Bath (Township of) ALL 9,819 1 1 4 6 1 2
Bath (Township of) GRE 40,231 0 7 5 12 0 9
Report generated on : 5/18/2016 11:54:18 AM Page 2 of 46
Alcohol Related Crashes by City / Village
Table 8.02 - City / Village Statistics

City / Village County Population Fatal Crashes
Injury Crashes
PDO Crashes
Total Crashes
Deaths Injuries
Bath (Township of) SUM 9,635 0 2 6 8 0 2
Baughman (Township of)
WAY 4,699 0 2 3 5 0 2
Bay (Township of) OTT 1,294 0 1 1 2 0 1
Bay Village (corporate name for Bay)
CUY 16,087 0 0 5 5 0 0
Bazetta (Township of) TRU 6,306 0 5 3 8 0 6
Beachwood CUY 12,186 2 5 3 10 2 6
Bearfield (Township of) PER 1,412 0 1 0 1 0 1
Beaver PIK 464 0 1 0 1 0 1
Beaver (Township of) MAH 6,466 0 4 5 9 0 11
Beaver (Township of) PIK 1,450 0 1 0 1 0 1
Beavercreek GRE 37,984 1 13 16 30 1 19
Beavercreek (Township of)
GRE 41,745 1 4 7 12 1 6
Bedford CUY 14,214 0 7 13 20 0 11
Bedford (Township of) COS 601 0 0 1 1 0 0
Bedford (Township of) MEG 1,212 0 0 3 3 0 0
Bedford Heights CUY 11,375 0 2 7 9 0 3
Bellbrook GRE 7,009 0 0 1 1 0 0
Belle Center LOG 807 0 3 0 3 0 3
Bellefontaine LOG 13,069 0 3 10 13 0 3
Bellevue HUR 8,193 0 0 2 2 0 0
Belpre WAS 6,660 0 0 4 4 0 0
Belpre (Township of) WAS 4,192 0 1 2 3 0 1
Bennington (Township of)
MRW 2,663 0 1 2 3 0 1
Benton (Township of) HOC 814 0 0 1 1 0 0
Benton (Township of) MOE 349 0 1 0 1 0 1
Benton (Township of) OTT 2,621 1 3 0 4 1 3
Benton (Township of) PIK 1,520 0 3 0 3 0 4
Benton Ridge HAN 315 0 0 1 1 0 0
Berea CUY 18,970 0 4 1 5 0 4
Berkshire (Township of) DEL 2,251 0 7 6 13 0 11
Berlin (Township of) DEL 3,315 0 0 2 2 0 0
Berlin (Township of) ERI 3,702 0 5 0 5 0 6
Berlin (Township of) HOL 3,857 0 2 1 3 0 2
Berlin (Township of) KNO 1,789 0 2 0 2 0 2
Berlin (Township of) MAH 2,240 1 1 1 3 1 3
Bern (Township of) ATH 519 0 1 1 2 0 2
Report generated on : 5/18/2016 11:54:18 AM Page 3 of 46
Alcohol Related Crashes by City / Village
Table 8.02 - City / Village Statistics

City / Village County Population Fatal Crashes
Injury Crashes
PDO Crashes
Total Crashes
Deaths Injuries
Berne (Township of) FAI 4,969 0 3 3 6 0 6
Bethel (Township of) CLA 18,962 1 13 22 36 1 13
Bethel (Township of) MIA 4,927 1 1 3 5 1 1
Bethlehem (Township of)
COS 1,191 0 3 0 3 0 4
Bethlehem (Township of)
STA 5,650 1 9 6 16 1 13
Bexley FRA 13,203 0 0 2 2 0 0
Big Island (Township of)
MAR 1,223 0 2 2 4 0 2
Big Spring (Township of)
SEN 1,791 0 0 1 1 0 0
Black Creek (Township of)
MER 631 0 0 1 1 0 0
Blanchard (Township of)
HAN 1,170 0 0 1 1 0 0
Blanchard (Township of)
HAR 1,640 0 0 1 1 0 0
Blanchard (Township of)
PUT 1,232 0 1 0 1 0 1
Blanchester CLI 4,220 0 1 0 1 0 1
Blendon (Township of) FRA 9,193 0 6 14 20 0 8
Bloom (Township of) FAI 6,374 0 2 2 4 0 2
Bloom (Township of) MRG 1,015 0 0 1 1 0 0
Bloom (Township of) SCI 3,218 0 2 2 4 0 2
Bloom (Township of) SEN 1,937 0 1 0 1 0 1
Bloom (Township of) WOO 2,535 0 0 5 5 0 0
Bloomfield (Township of)
JAC 896 0 0 2 2 0 0
Bloomfield (Township of)
LOG 419 0 1 0 1 0 1
Bloomfield (Township of)
TRU 1,097 0 0 1 1 0 0
Blue Ash HAM 12,513 0 3 6 9 0 6
Boardman MAH 37,215 1 11 1 13 1 16
Boardman (Township of)
MAH 42,518 0 13 19 32 0 15
Bokescreek (Township of)
LOG 1,308 0 1 0 1 0 1
Boston (Township of) SUM 1,664 0 2 0 2 0 2
Boston Heights SUM 1,186 0 2 8 10 0 2
Botkins SHE 1,205 0 0 1 1 0 0
Bowling Green WOO 29,636 1 4 11 16 1 5
Bowling Green (Township of)
LIC 1,668 0 2 1 3 0 5
Braceville (Township of)
TRU 2,887 1 5 3 9 1 13
Bradford MIA 1,859 0 0 1 1 0 0
Report generated on : 5/18/2016 11:54:20 AM Page 4 of 46
Alcohol Related Crashes by City / Village
Table 8.02 - City / Village Statistics

City / Village County Population Fatal Crashes
Injury Crashes
PDO Crashes
Total Crashes
Deaths Injuries
Brady (Township of) WIL 2,822 0 1 0 1 0 4
Bratenahl CUY 1,337 2 14 11 27 2 18
Bratton (Township of) ADA 1,412 0 0 2 2 0 0
Brecksville CUY 13,382 0 1 8 9 0 1
Bridgeport BEL 2,186 0 0 3 3 0 0
Bridgewater (Township of)
WIL 1,401 0 3 3 6 0 11
Brimfield POR 3,248 0 1 2 3 0 1
Brimfield (Township of) POR 7,963 0 6 9 15 0 9
Bristol (Township of) TRU 3,154 1 2 2 5 1 3
Broadview Heights CUY 15,967 0 0 10 10 0 0
Bronson (Township of) HUR 1,780 0 3 4 7 0 4
Brook Park CUY 21,218 0 6 12 18 0 9
Brookfield (Township of)
NOB 119 0 1 0 1 0 1
Brookfield (Township of)
TRU 10,020 0 6 6 12 0 7
Brooklyn CUY 11,586 0 7 12 19 0 9
Brooklyn Heights CUY 1,558 0 5 4 9 0 11
Brookville MOT 5,289 0 0 1 1 0 0
Brown (Township of) CAR 8,300 0 2 7 9 0 3
Brown (Township of) DAR 2,046 0 2 0 2 0 2
Brown (Township of) DEL 1,297 0 1 5 6 0 1
Brown (Township of) FRA 2,031 0 1 2 3 0 1
Brown (Township of) KNO 1,425 0 0 3 3 0 0
Brown (Township of) PAU 2,244 0 2 1 3 0 2
Brown (Township of) VIN 281 1 1 1 3 1 1
Brownhelm (Township of)
LOR 7,782 0 2 0 2 0 2
Brunswick MED 33,388 0 6 13 19 0 9
Brunswick Hills (Township of)
MED 5,469 2 1 3 6 2 4
Brush Creek (Township of)
ADA 1,231 0 1 1 2 0 3
Brush Creek (Township of)
MUS 1,375 0 1 2 3 0 1
Brush Creek (Township of)
SCI 1,149 0 1 1 2 0 1
Brushcreek (Township of)
HIG 1,308 0 1 1 2 0 1
Bryan WIL 8,333 0 5 8 13 0 5
Buck (Township of) HAR 2,441 0 1 1 2 0 1
Buckeye Lake LIC 3,049 0 1 0 1 0 1
Report generated on : 5/18/2016 11:54:21 AM Page 5 of 46
Alcohol Related Crashes by City / Village
Table 8.02 - City / Village Statistics

City / Village County Population Fatal Crashes
Injury Crashes
PDO Crashes
Total Crashes
Deaths Injuries
Buckskin (Township of) ROS 1,040 0 2 0 2 0 5
Bucyrus CRA 13,224 0 2 2 4 0 3
Buffalo (Township of) NOB 782 0 0 3 3 0 0
Burlington (Township of)
LIC 1,073 0 3 0 3 0 3
Burton GEA 1,450 0 4 2 6 0 5
Burton (Township of) GEA 4,358 0 1 1 2 0 1
Butler (Township of) COL 3,444 0 0 1 1 0 0
Butler (Township of) MER 6,459 0 4 4 8 0 7
Butler (Township of) MOT 8,382 1 9 11 21 1 10
Byrd (Township of) BRO 740 0 1 0 1 0 1
Cadiz HAS 3,308 0 2 4 6 0 3
Cadiz (Township of) HAS 3,639 0 0 1 1 0 0
Caesars Creek (Township of)
GRE 1,225 0 0 3 3 0 0
Cairo ALL 499 0 0 1 1 0 0
Cambridge GUE 11,520 0 3 5 8 0 4
Cambridge (Township of)
GUE 15,505 0 3 5 8 0 4
Camp Creek (Township of)
PIK 951 0 0 1 1 0 0
Campbell MAH 9,460 0 4 0 4 0 4
Canaan (Township of) ATH 1,780 0 2 1 3 0 2
Canaan (Township of) MAD 2,496 0 2 3 5 0 5
Canaan (Township of) WAY 4,736 1 0 1 2 1 0
Canal Fulton STA 5,061 0 2 3 5 0 3
Canal Winchester FAI 4,478 0 2 4 6 0 2
Canal Winchester FRA 4,478 0 1 0 1 0 1
Canfield MAH 7,374 1 3 9 13 1 5
Canfield (Township of) MAH 14,624 0 2 7 9 0 2
Canton STA 80,806 0 43 45 88 0 53
Canton (Township of) STA 13,882 0 9 10 19 0 10
Cardington MRW 1,849 1 0 2 3 1 0
Cardington (Township of)
MRW 2,790 0 1 0 1 0 2
Carlisle WAR 5,121 0 0 1 1 0 0
Carlisle (Township of) LOR 7,339 0 5 5 10 0 6
Carroll (Township of) OTT 1,931 1 4 1 6 1 6
Carrollton CAR 3,190 0 0 1 1 0 0
Carryall (Township of) PAU 3,046 0 0 2 2 0 0
Report generated on : 5/18/2016 11:54:21 AM Page 6 of 46
Alcohol Related Crashes by City / Village
Table 8.02 - City / Village Statistics

City / Village County Population Fatal Crashes
Injury Crashes
PDO Crashes
Total Crashes
Deaths Injuries
Carthage (Township of) ATH 1,467 0 1 1 2 0 1
Cass (Township of) HAN 1,098 1 0 1 2 2 1
Cass (Township of) MUS 1,492 1 3 0 4 1 4
Cass (Township of) RIC 1,735 0 1 2 3 0 1
Castalia ERI 935 0 1 0 1 0 1
Cedarville GRE 3,828 0 0 1 1 0 0
Cedarville (Township of)
GRE 5,092 0 1 0 1 0 1
Celina MER 10,303 0 1 8 9 0 2
Center (Township of) COL 6,473 0 1 5 6 0 1
Center (Township of) GUE 1,779 0 0 3 3 0 0
Center (Township of) MOE 3,797 0 1 1 2 0 1
Center (Township of) WIL 3,056 0 0 1 1 0 0
Center (Township of) WOO 1,246 1 2 10 13 2 4
Centerville MOT 23,024 0 3 14 17 0 5
Chagrin Falls CUY 4,024 0 1 6 7 0 2
Champion (Township of)
TRU 9,762 0 4 2 6 0 4
Chardon GEA 5,156 0 4 5 9 0 6
Chardon (Township of) GEA 4,763 0 2 3 5 0 4
Charlestown (Township of)
POR 2,003 1 0 0 1 1 0
Chatham (Township of) MED 2,158 0 4 2 6 0 7
Cherry Valley (Township of)
ATB 857 0 1 1 2 0 1
Cheshire (Township of) GAL 1,259 0 0 1 1 0 0
Chester (Township of) CLI 1,771 0 1 3 4 0 1
Chester (Township of) GEA 10,968 0 0 1 1 0 0
Chester (Township of) MEG 2,332 0 1 0 1 0 1
Chesterfield (Township of)
FUL 1,050 0 1 2 3 0 1
Chesterland GEA 2,646 0 2 5 7 0 2
Cheviot HAM 9,015 0 4 5 9 0 7
Chillicothe ROS 21,796 0 5 16 21 0 5
Chippewa (Township of)
WAY 10,085 0 7 3 10 0 7
Cincinnati HAM 331,285 4 162 286 452 4 255
Circleville PIC 13,485 0 4 4 8 0 5
Circleville (Township of)
PIC 2,300 0 2 2 4 0 2
Claibourne (Township of)
UNI 3,421 0 2 0 2 0 2
Claridon (Township of) GEA 3,173 0 1 4 5 0 1
Report generated on : 5/18/2016 11:54:21 AM Page 7 of 46
Alcohol Related Crashes by City / Village
Table 8.02 - City / Village Statistics

City / Village County Population Fatal Crashes
Injury Crashes
PDO Crashes
Total Crashes
Deaths Injuries
Claridon (Township of) MAR 2,587 0 1 2 3 0 2
Clark (Township of) BRO 3,165 0 3 4 7 0 3
Clark (Township of) CLI 1,861 0 1 0 1 0 1
Clark (Township of) COS 594 0 0 1 1 0 0
Clark (Township of) HOL 3,728 0 0 1 1 0 0
Clarksfield (Township of)
HUR 1,518 1 1 2 4 1 1
Clay (Township of) GAL 1,877 0 0 3 3 0 0
Clay (Township of) MOT 8,566 0 5 3 8 0 5
Clay (Township of) OTT 5,118 0 1 2 3 0 1
Clay (Township of) SCI 3,792 0 3 1 4 0 3
Clayton MOT 13,347 0 9 5 14 0 13
Clayton (Township of) PER 1,432 0 0 1 1 0 0
Clear Creek (Township of)
ASD 2,069 0 0 1 1 0 0
Clear Creek (Township of)
WAR 20,974 0 5 12 17 0 8
Clearcreek (Township of)
FAI 3,411 0 1 1 2 0 1
Cleveland CUY 478,403 16 181 173 370 17 288
Cleveland Heights CUY 49,958 0 23 28 51 0 39
CLEVELAND METROPARKS
CUY 1,401,873 0 6 8 14 0 9
Clinton (Township of) FRA 4,294 0 2 3 5 0 3
Clinton (Township of) FUL 9,280 0 1 4 5 0 3
Clinton (Township of) KNO 3,326 0 2 3 5 0 3
Clinton (Township of) SEN 4,188 0 0 2 2 0 0
Clinton (Township of) SHE 20,903 0 5 4 9 0 11
Clinton (Township of) VIN 2,045 0 1 1 2 0 1
Clyde SAN 6,064 0 4 2 6 0 4
Coal (Township of) JAC 2,078 0 2 2 4 0 3
Coal (Township of) PER 1,106 0 1 0 1 0 1
Coitsville (Township of) MAH 1,608 0 2 2 4 0 3
Coldwater MER 4,482 0 1 1 2 0 1
Colebrook (Township of)
ATB 887 0 4 2 6 0 4
Colerain (Township of) BEL 4,438 1 3 2 6 1 5
Colerain (Township of) HAM 60,144 0 3 1 4 0 4
Colerain (Township of) ROS 1,943 0 1 2 3 0 1
College (Township of) KNO 2,247 0 1 0 1 0 2
Columbia (Township of) HAM 6,557 0 1 3 4 0 1
Report generated on : 5/18/2016 11:54:21 AM Page 8 of 46
Alcohol Related Crashes by City / Village
Table 8.02 - City / Village Statistics

City / Village County Population Fatal Crashes
Injury Crashes
PDO Crashes
Total Crashes
Deaths Injuries
Columbia (Township of) LOR 6,912 0 4 6 10 0 6
Columbia (Township of) MEG 1,018 1 0 0 1 1 0
Columbiana COL 5,635 0 3 1 4 0 6
Columbus DEL 711,470 0 0 5 5 0 0
Columbus FRA 711,470 12 364 594 970 13 520
Concord (Township of) DEL 4,507 1 1 1 3 1 2
Concord (Township of) LAK 15,282 0 3 9 12 0 4
Concord (Township of) MIA 27,335 0 3 8 11 0 3
Concord (Township of) ROS 4,107 1 3 5 9 1 6
Congress WAY 192 0 1 0 1 0 3
Congress (Township of)
MRW 2,128 0 0 3 3 0 0
Congress (Township of)
WAY 4,435 0 2 2 4 0 3
Conneaut ATB 12,485 1 3 6 10 1 4
Copley (Township of) SUM 13,641 0 8 7 15 0 10
Cortland TRU 6,830 0 1 0 1 0 1
Coshocton COS 11,682 0 4 3 7 0 6
Coventry (Township of) SUM 10,900 0 4 10 14 0 5
Covington MIA 2,559 0 1 0 1 0 1
Cranberry (Township of)
CRA 1,674 0 1 0 1 0 1
Crane (Township of) WYA 7,394 0 1 2 3 0 1
Crawford (Township of) WYA 5,080 0 2 0 2 0 3
Creston WAY 2,161 0 0 1 1 0 0
Crooksville PER 2,483 0 1 0 1 0 1
Crosby (Township of) HAM 2,748 0 1 0 1 0 2
Cross Creek (Township of)
JEF 8,761 1 6 3 10 1 7
Cuyahoga Falls SUM 49,374 1 15 40 56 1 18
Cuyahoga Heights CUY 599 0 0 1 1 0 0
Cynthian (Township of) SHE 1,972 0 1 0 1 0 1
Dallas (Township of) CRA 455 0 1 0 1 0 1
Damascus (Township of)
HEN 1,781 0 1 1 2 0 1
Danbury (Township of) OTT 4,631 0 1 4 5 0 2
Darby (Township of) MAD 2,872 0 3 0 3 0 3
Darby (Township of) PIC 3,492 0 1 1 2 0 2
Darby (Township of) UNI 1,934 0 1 1 2 0 1
Dayton MOT 166,179 11 71 66 148 13 130
Report generated on : 5/18/2016 11:54:21 AM Page 9 of 46
Alcohol Related Crashes by City / Village
Table 8.02 - City / Village Statistics

City / Village County Population Fatal Crashes
Injury Crashes
PDO Crashes
Total Crashes
Deaths Injuries
De Graff (Degraff) LOG 1,212 0 1 0 1 0 2
Decatur (Township of) LAW 839 0 1 0 1 0 1
Decatur (Township of) WAS 1,181 1 1 0 2 1 1
Deer Creek (Township of)
MAD 1,030 0 3 3 6 0 6
Deer Park HAM 5,982 0 0 2 2 0 0
Deerfield (Township of) MRG 802 1 0 0 1 1 0
Deerfield (Township of) POR 3,211 0 1 3 4 0 1
Deerfield (Township of) ROS 1,096 0 1 0 1 0 1
Deerfield (Township of) WAR 25,515 0 19 17 36 0 30
Defiance DEF 16,465 1 8 11 20 1 8
Defiance (Township of) DEF 13,461 0 3 0 3 0 4
Delaware DEL 25,243 0 12 29 41 0 17
Delaware (Township of) DEF 2,128 0 2 1 3 0 2
Delaware (Township of) DEL 26,149 0 1 1 2 0 1
Delaware (Township of) HAN 1,229 0 1 1 2 0 1
Delhi (Township of) HAM 30,104 2 28 44 74 2 33
Delphos ALL 6,944 0 0 2 2 0 0
Delta FUL 2,930 0 0 1 1 0 0
Denmark (Township of) ATB 880 1 0 2 3 1 1
Dillonvale JEF 781 0 0 2 2 0 0
Dodson (Township of) HIG 2,514 1 1 2 4 1 1
Dorset (Township of) ATB 892 0 1 0 1 0 1
Dover TUS 12,210 0 10 23 33 0 17
Dover (Township of) ATH 3,797 0 1 5 6 0 1
Dover (Township of) TUS 4,726 0 4 2 6 0 5
Dover (Township of) UNI 2,331 0 4 2 6 0 6
Doylestown WAY 2,799 0 0 1 1 0 0
Dresden MUS 1,423 0 0 1 1 0 0
Dublin FRA 31,392 0 7 4 11 0 10
Dublin (Township of) MER 2,254 1 1 1 3 1 2
Duchouquet (Township of)
AUG 14,329 0 0 3 3 0 0
Dunham (Township of) WAS 2,505 0 1 1 2 0 1
Dunkirk HAR 952 0 1 0 1 0 1
Eagle (Township of) BRO 1,438 0 2 2 4 0 2
Eagle (Township of) HAN 1,195 1 0 3 4 1 1
East (Township of) CAR 859 0 0 1 1 0 0
Report generated on : 5/18/2016 11:54:21 AM Page 10 of 46
Alcohol Related Crashes by City / Village
Table 8.02 - City / Village Statistics

City / Village County Population Fatal Crashes
Injury Crashes
PDO Crashes
Total Crashes
Deaths Injuries
East Cleveland CUY 27,217 0 5 5 10 0 9
East Liverpool COL 13,089 0 2 10 12 0 5
East Palestine COL 4,917 0 0 2 2 0 0
East Sparta STA 806 0 1 0 1 0 1
East Union (Township of)
WAY 6,527 0 4 1 5 0 5
Eastlake LAK 20,255 0 9 10 19 0 11
Eaton PRE 8,133 0 2 5 7 0 2
Eaton (Township of) LOR 9,675 0 4 7 11 0 8
Eden (Township of) LIC 1,243 1 0 1 2 1 0
Eden (Township of) SEN 2,020 0 1 1 2 0 1
Edgerton WIL 2,117 0 1 2 3 0 1
Edinburg (Township of) POR 2,344 0 1 2 3 0 1
Eldorado PRE 543 0 0 1 1 0 0
Elizabeth (Township of) LAW 2,914 0 2 2 4 0 5
Elizabeth (Township of) MIA 1,620 0 1 1 2 0 1
Elk (Township of) VIN 3,134 0 1 2 3 0 2
Elkrun (Township of) COL 4,781 1 0 4 5 1 0
Ellsworth (Township of) MAH 2,234 0 0 2 2 0 0
Elyria LOR 55,953 0 22 34 56 0 26
Elyria (Township of) LOR 3,520 0 4 5 9 0 6
Emerald (Township of) PAU 824 0 1 0 1 0 1
Englewood MOT 12,235 2 3 7 12 2 4
Enoch (Township of) NOB 413 0 1 0 1 0 1
Enon CLA 2,638 0 0 2 2 0 0
Erie (Township of) OTT 1,328 0 0 2 2 0 0
Etna (Township of) LIC 5,410 0 4 3 7 0 5
Euclid CUY 52,717 1 28 29 58 1 44
Evendale HAM 3,090 0 5 1 6 0 8
Fairborn GRE 32,052 0 6 18 24 0 9
Fairfax HAM 1,938 0 5 5 10 0 6
Fairfield BUT 42,097 1 30 31 62 1 47
Fairfield (County) FAI 122,759 0 5 13 18 0 5
Fairfield (Township of) BUT 15,571 0 10 7 17 0 14
Fairfield (Township of) COL 9,583 0 3 3 6 0 9
Fairfield (Township of) HIG 3,219 0 5 1 6 0 5
Fairfield (Township of) HUR 1,284 0 2 0 2 0 2
Report generated on : 5/18/2016 11:54:21 AM Page 11 of 46
Alcohol Related Crashes by City / Village
Table 8.02 - City / Village Statistics

City / Village County Population Fatal Crashes
Injury Crashes
PDO Crashes
Total Crashes
Deaths Injuries
Fairfield (Township of) TUS 1,487 0 1 3 4 0 1
Fairlawn SUM 7,307 0 2 3 5 0 2
Fairport Harbor (Fairport)
LAK 3,180 0 1 3 4 0 2
Fairview Park (Fairview)
CUY 17,572 0 2 5 7 0 3
Falls (Township of) HOC 11,409 1 5 2 8 1 6
Falls (Township of) MUS 8,585 0 5 12 17 0 6
Farmer (Township of) DEF 932 0 2 0 2 0 2
Farmington (Township of)
TRU 2,353 0 0 2 2 0 0
Fayette (Township of) LAW 9,169 0 5 1 6 0 6
Fearing (Township of) WAS 910 0 2 0 2 0 3
Findlay HAN 38,967 0 8 21 29 0 9
Fitchville (Township of) HUR 1,012 0 0 3 3 0 0
Flatrock (Township of) HEN 1,254 0 2 0 2 0 3
Fletcher MIA 510 0 0 1 1 0 0
Florence (Township of) ERI 2,500 0 3 3 6 0 3
Flushing BEL 900 0 1 3 4 0 1
Flushing (Township of) BEL 1,990 0 0 2 2 0 0
Forest Park HAM 19,463 0 11 9 20 0 20
Fort Recovery MER 1,273 0 0 2 2 0 0
Fostoria HAN 13,931 0 0 1 1 0 0
Fostoria SEN 13,931 0 3 3 6 0 3
Fostoria WOO 13,931 0 0 1 1 0 0
Fowler (Township of) TRU 2,733 1 4 2 7 1 5
Fox (Township of) CAR 1,075 0 0 2 2 0 0
Franklin WAR 11,396 0 6 7 13 0 8
Franklin (Township of) ADA 1,167 0 1 0 1 0 3
Franklin (Township of) BRO 1,596 0 0 1 1 0 0
Franklin (Township of) CLE 4,348 0 0 5 5 0 0
Franklin (Township of) COL 766 0 1 0 1 0 1
Franklin (Township of) COS 1,286 0 0 1 1 0 0
Franklin (Township of) DAR 1,206 0 1 0 1 0 1
Franklin (Township of) FRA 11,798 0 13 11 24 0 17
Franklin (Township of) FUL 739 0 1 0 1 0 1
Franklin (Township of) JAC 1,913 0 0 1 1 0 0
Franklin (Township of) LIC 1,782 0 2 0 2 0 2
Franklin (Township of) MER 2,303 0 1 3 4 0 2
Report generated on : 5/18/2016 11:54:21 AM Page 12 of 46
Alcohol Related Crashes by City / Village
Table 8.02 - City / Village Statistics

City / Village County Population Fatal Crashes
Injury Crashes
PDO Crashes
Total Crashes
Deaths Injuries
Franklin (Township of) MOE 453 0 0 1 1 0 0
Franklin (Township of) MRW 1,410 0 1 1 2 0 1
Franklin (Township of) POR 5,276 0 1 5 6 0 1
Franklin (Township of) RIC 1,772 1 2 1 4 2 4
Franklin (Township of) ROS 1,671 0 3 2 5 0 6
Franklin (Township of) SHE 2,842 0 0 2 2 0 0
Franklin (Township of) TUS 4,244 0 3 2 5 0 3
Franklin (Township of) WAR 27,794 0 8 23 31 0 10
Franklin (Township of) WAY 3,485 0 2 0 2 0 2
Fredericktown KNO 2,428 0 0 1 1 0 0
Freedom (Township of) HEN 1,002 1 0 0 1 1 0
Freedom (Township of) POR 2,751 0 3 4 7 0 3
Freedom (Township of) WOO 2,695 1 1 2 4 1 2
Freeport HAS 398 0 1 0 1 0 1
Fremont SAN 17,375 0 7 5 12 0 10
Fulton (Township of) FUL 3,261 0 2 2 4 0 2
Gahanna FRA 32,636 0 13 28 41 0 17
Galion CRA 11,341 0 4 9 13 0 7
Gallipolis GAL 4,180 0 3 3 6 0 3
Garfield Heights CUY 30,734 0 14 17 31 0 16
Gasper (Township of) PRE 3,229 1 2 2 5 1 4
Gates Mills CUY 2,493 0 2 0 2 0 3
Geneva ATB 6,595 0 2 1 3 0 3
Geneva (Township of) ATB 11,954 0 1 2 3 0 1
Geneva-on-the-Lake ATB 1,545 0 1 1 2 0 1
Genoa OTT 2,230 0 1 1 2 0 1
Genoa (Township of) DEL 11,293 0 3 6 9 0 3
Georgetown BRO 3,691 0 0 3 3 0 0
German (Township of) AUG 3,831 0 1 0 1 0 1
German (Township of) CLA 7,663 0 4 3 7 0 6
German (Township of) FUL 6,458 0 1 2 3 0 1
German (Township of) HAS 767 0 0 1 1 0 0
German (Township of) MOT 7,830 0 2 2 4 0 3
Germantown MOT 4,884 0 0 3 3 0 0
Gibson (Township of) MER 1,869 0 1 0 1 0 1
Gilead (Township of) MRW 5,868 0 1 3 4 0 1
Report generated on : 5/18/2016 11:54:22 AM Page 13 of 46
Alcohol Related Crashes by City / Village
Table 8.02 - City / Village Statistics

City / Village County Population Fatal Crashes
Injury Crashes
PDO Crashes
Total Crashes
Deaths Injuries
Girard TRU 10,902 0 4 4 8 0 4
Glendale HAM 2,188 0 1 7 8 0 1
Glouster ATH 1,972 0 0 1 1 0 0
Good Hope (Township of)
HOC 1,444 0 0 1 1 0 0
Gorham (Township of) FUL 2,372 0 1 1 2 0 1
Goshen (Township of) AUG 523 0 1 0 1 0 1
Goshen (Township of) BEL 3,252 0 0 2 2 0 0
Goshen (Township of) CHP 3,383 0 3 1 4 0 4
Goshen (Township of) CLE 13,663 1 7 12 20 1 13
Goshen (Township of) HAR 585 1 0 0 1 1 1
Goshen (Township of) MAH 3,281 0 3 1 4 0 5
Goshen (Township of) TUS 5,285 0 2 9 11 0 2
Grafton LOR 2,302 0 2 0 2 0 2
Grafton (Township of) LOR 2,722 0 3 0 3 0 3
Grand Prairie (Township of)
MAR 1,609 0 3 1 4 0 5
Grand Rapids WOO 1,002 0 0 1 1 0 0
Grandview (Township of)
WAS 1,834 0 1 1 2 0 1
Grandview Heights FRA 6,695 0 2 9 11 0 3
Granger (Township of) MED 3,928 0 0 4 4 0 0
Granville LIC 3,167 1 2 3 6 1 3
Granville (Township of) LIC 8,994 0 2 1 3 0 2
Granville (Township of) MER 3,885 0 2 5 7 0 3
Gratis PRE 934 0 1 0 1 0 1
Gratis (Township of) PRE 4,471 0 0 1 1 0 0
Green SUM 22,817 0 13 14 27 0 19
Green (Township of) ADA 782 1 1 0 2 1 2
Green (Township of) ASD 3,887 0 0 2 2 0 0
Green (Township of) BRO 3,389 0 1 1 2 0 1
Green (Township of) CLA 2,736 0 3 3 6 0 5
Green (Township of) CLI 2,602 0 0 2 2 0 0
Green (Township of) FAY 499 0 0 1 1 0 0
Green (Township of) GAL 5,514 0 1 3 4 0 1
Green (Township of) HAM 55,660 0 19 30 49 0 25
Green (Township of) HAS 1,898 0 3 3 6 0 3
Green (Township of) HOC 2,585 0 3 0 3 0 3
Green (Township of) MAH 3,450 0 3 0 3 0 4
Report generated on : 5/18/2016 11:54:22 AM Page 14 of 46
Alcohol Related Crashes by City / Village
Table 8.02 - City / Village Statistics

City / Village County Population Fatal Crashes
Injury Crashes
PDO Crashes
Total Crashes
Deaths Injuries
Green (Township of) ROS 4,492 0 6 2 8 0 6
Green (Township of) SCI 4,079 0 3 3 6 0 6
Green (Township of) WAY 12,194 0 6 2 8 0 7
Green Camp MAR 342 0 0 1 1 0 0
Green Camp (Township of)
MAR 1,163 0 1 3 4 0 1
Green Creek (Township of)
SAN 9,527 0 1 3 4 0 1
Greenfield HIG 4,906 0 1 0 1 0 1
Greenfield (Township of)
FAI 4,944 1 1 1 3 1 4
Greenfield (Township of)
GAL 498 0 0 1 1 0 0
Greenfield (Township of)
HUR 1,442 0 1 0 1 0 2
Greenhills HAM 4,103 0 0 4 4 0 0
Greenville DAR 13,294 0 1 4 5 0 2
Greenville (Township of)
DAR 18,125 0 4 7 11 0 6
Greenwich HUR 1,525 0 0 1 1 0 0
Groton (Township of) ERI 1,384 0 1 0 1 0 1
Grove City FRA 27,075 0 5 21 26 0 7
Groveport FRA 3,865 0 5 2 7 0 8
Guilford (Township of) MED 5,447 0 2 0 2 0 2
Guyan (Township of) GAL 1,199 1 3 0 4 1 3
Hambden (Township of)
GEA 4,024 0 5 4 9 0 6
Hamer (Township of) HIG 699 0 0 1 1 0 0
Hamilton BUT 60,690 1 30 42 73 1 40
Hamilton (Township of) FRA 7,950 0 2 7 9 0 2
Hamilton (Township of) JAC 513 0 2 0 2 0 2
Hamilton (Township of) LAW 1,817 0 1 0 1 0 1
Hamilton (Township of) WAR 9,630 0 5 5 10 0 5
Hamler HEN 650 0 1 0 1 0 1
Hanover LIC 885 0 0 1 1 0 0
Hanover (Township of) ASD 2,520 0 0 1 1 0 0
Hanover (Township of) BUT 7,878 0 3 3 6 0 3
Hanover (Township of) COL 3,749 0 2 3 5 0 3
Hanover (Township of) LIC 2,731 0 0 3 3 0 0
Hanoverton COL 387 0 1 0 1 0 1
Harlan (Township of) WAR 3,627 0 2 4 6 0 3
Harlem (Township of) DEL 3,762 0 4 3 7 0 7
Report generated on : 5/18/2016 11:54:22 AM Page 15 of 46
Alcohol Related Crashes by City / Village
Table 8.02 - City / Village Statistics

City / Village County Population Fatal Crashes
Injury Crashes
PDO Crashes
Total Crashes
Deaths Injuries
Harmony (Township of) CLA 3,548 0 1 4 5 0 1
Harmony (Township of) MRW 2,040 0 2 1 3 0 3
Harpersfield (Township of)
ATB 2,603 1 2 3 6 1 4
Harris (Township of) OTT 3,009 0 0 2 2 0 0
Harrison HAM 7,487 0 1 3 4 0 1
Harrison (Township of) CAR 2,498 0 2 4 6 0 2
Harrison (Township of) CHP 823 0 1 0 1 0 1
Harrison (Township of) DAR 2,145 1 0 3 4 1 1
Harrison (Township of) GAL 1,003 0 1 1 2 0 1
Harrison (Township of) HAM 12,469 0 3 1 4 0 4
Harrison (Township of) HEN 1,232 0 2 0 2 0 2
Harrison (Township of) LIC 6,494 0 3 4 7 0 4
Harrison (Township of) LOG 2,093 0 1 2 3 0 1
Harrison (Township of) MOT 24,303 0 27 14 41 0 39
Harrison (Township of) MUS 1,638 1 2 3 6 1 2
Harrison (Township of) PAU 1,566 0 2 1 3 0 2
Harrison (Township of) PER 5,399 0 3 0 3 0 3
Harrison (Township of) PIC 6,424 0 3 0 3 0 3
Harrison (Township of) PRE 4,601 0 4 1 5 0 4
Harrison (Township of) SCI 4,497 1 4 3 8 2 8
Harrison (Township of) VIN 1,030 0 1 1 2 0 1
Harrisville (Township of)
MED 4,914 0 2 0 2 0 2
Hartford (Township of) LIC 1,290 0 1 0 1 0 2
Hartford (Township of) TRU 2,104 0 1 5 6 0 1
Hartsgrove (Township of)
ATB 1,395 0 1 0 1 0 1
Hartville STA 2,174 0 0 1 1 0 0
Heath (Fourmile Lock) LIC 8,527 0 4 7 11 0 5
Hebron LIC 2,034 0 0 2 2 0 0
Henrietta (Township of) LOR 1,873 1 1 2 4 1 2
Henry (Township of) WOO 4,070 0 4 4 8 0 5
Hicksville DEF 3,649 0 1 0 1 0 1
Hicksville (Township of) DEF 5,003 0 1 1 2 0 1
Highland (County) HIG 40,875 0 0 1 1 0 0
Highland (Township of) DEF 2,658 0 0 1 1 0 0
Highland (Township of) MUS 848 0 0 1 1 0 0
Highland Heights CUY 8,082 0 6 3 9 0 8
Report generated on : 5/18/2016 11:54:22 AM Page 16 of 46
Alcohol Related Crashes by City / Village
Table 8.02 - City / Village Statistics

City / Village County Population Fatal Crashes
Injury Crashes
PDO Crashes
Total Crashes
Deaths Injuries
Highland Hills CUY 1,618 0 1 0 1 0 1
Hilliar (Township of) KNO 3,080 0 1 2 3 0 1
Hilliard (RR name Hilliards)
FRA 24,230 0 12 20 32 0 19
Hillsboro HIG 6,368 0 1 10 11 0 1
Hinckley (Township of) MED 6,753 0 2 5 7 0 2
Hiram POR 1,242 0 0 2 2 0 0
Hiram (Township of) POR 2,296 1 0 0 1 1 0
Hoaglin (Township of) VAN 605 0 1 0 1 0 1
Hocking (Township of) FAI 4,812 0 2 4 6 0 3
Holland LUC 1,306 0 1 1 2 0 1
Holmes (County) HOL 38,943 0 3 1 4 0 4
Holmes (Township of) CRA 1,330 0 1 0 1 0 1
Homer (Township of) MED 1,461 0 1 0 1 0 2
Hopewell (Township of) LIC 1,200 0 1 0 1 0 1
Hopewell (Township of) MER 1,066 0 1 0 1 0 1
Hopewell (Township of) MUS 3,038 0 1 3 4 0 3
Hopewell (Township of) PER 2,163 1 3 1 5 1 3
Hopewell (Township of) SEN 2,874 0 2 1 3 0 3
Howard (Township of) KNO 4,319 0 6 6 12 0 7
Howland (Township of) TRU 19,451 0 10 14 24 0 16
Hubbard TRU 8,284 0 3 6 9 0 3
Hubbard (Township of) TRU 14,304 0 2 1 3 0 4
Huber Heights MOT 38,212 2 13 23 38 2 23
Hudson SUM 22,439 0 4 14 18 0 5
Huntington (Township of)
BRO 2,968 0 1 2 3 0 1
Huntington (Township of)
GAL 1,511 0 1 1 2 0 2
Huntington (Township of)
LOR 1,282 0 1 0 1 0 2
Huntington (Township of)
ROS 6,018 1 10 11 22 1 12
Huntsburg (Township of)
GEA 3,297 0 0 2 2 0 0
Huron ERI 7,958 0 1 0 1 0 1
Huron (Township of) ERI 10,530 0 1 3 4 0 1
Independence CUY 7,109 0 13 11 24 0 20
Island Creek (Township of)
JEF 12,078 2 5 10 17 2 6
Israel (Township of) PRE 1,273 0 1 0 1 0 1
Jackson JAC 6,184 0 4 2 6 0 8
Report generated on : 5/18/2016 11:54:22 AM Page 17 of 46
Alcohol Related Crashes by City / Village
Table 8.02 - City / Village Statistics
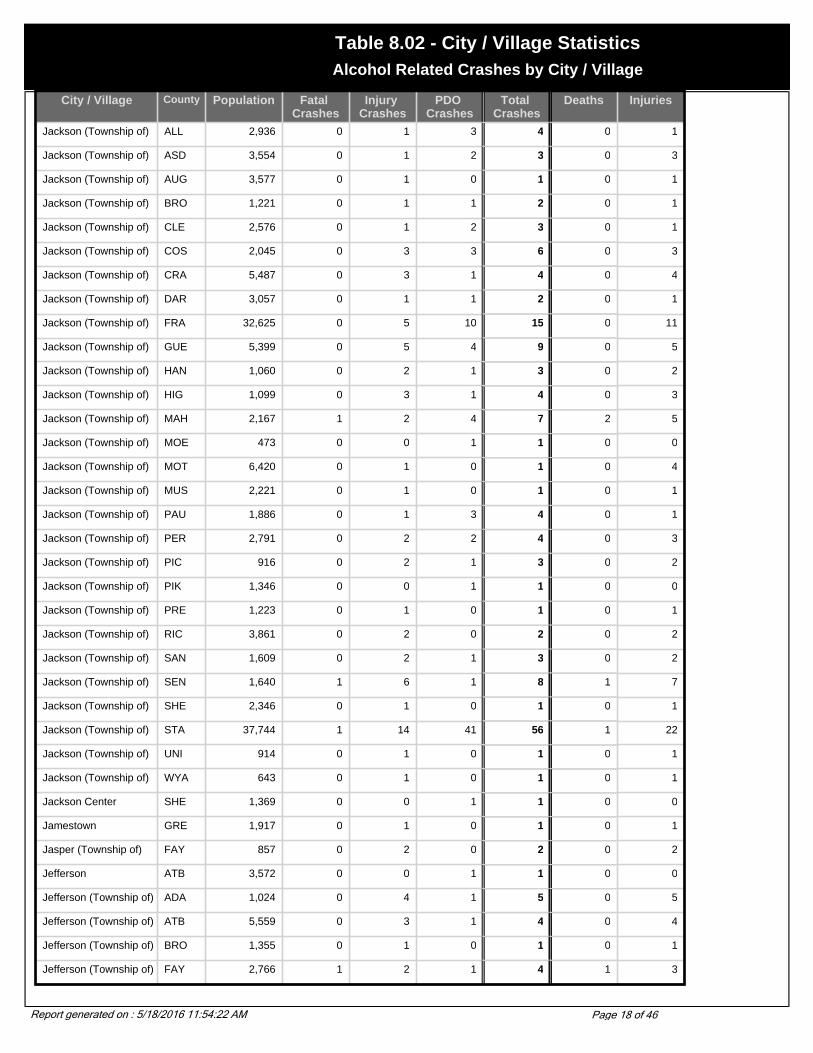
City / Village County Population Fatal Crashes
Injury Crashes
PDO Crashes
Total Crashes
Deaths Injuries
Jackson (Township of) ALL 2,936 0 1 3 4 0 1
Jackson (Township of) ASD 3,554 0 1 2 3 0 3
Jackson (Township of) AUG 3,577 0 1 0 1 0 1
Jackson (Township of) BRO 1,221 0 1 1 2 0 1
Jackson (Township of) CLE 2,576 0 1 2 3 0 1
Jackson (Township of) COS 2,045 0 3 3 6 0 3
Jackson (Township of) CRA 5,487 0 3 1 4 0 4
Jackson (Township of) DAR 3,057 0 1 1 2 0 1
Jackson (Township of) FRA 32,625 0 5 10 15 0 11
Jackson (Township of) GUE 5,399 0 5 4 9 0 5
Jackson (Township of) HAN 1,060 0 2 1 3 0 2
Jackson (Township of) HIG 1,099 0 3 1 4 0 3
Jackson (Township of) MAH 2,167 1 2 4 7 2 5
Jackson (Township of) MOE 473 0 0 1 1 0 0
Jackson (Township of) MOT 6,420 0 1 0 1 0 4
Jackson (Township of) MUS 2,221 0 1 0 1 0 1
Jackson (Township of) PAU 1,886 0 1 3 4 0 1
Jackson (Township of) PER 2,791 0 2 2 4 0 3
Jackson (Township of) PIC 916 0 2 1 3 0 2
Jackson (Township of) PIK 1,346 0 0 1 1 0 0
Jackson (Township of) PRE 1,223 0 1 0 1 0 1
Jackson (Township of) RIC 3,861 0 2 0 2 0 2
Jackson (Township of) SAN 1,609 0 2 1 3 0 2
Jackson (Township of) SEN 1,640 1 6 1 8 1 7
Jackson (Township of) SHE 2,346 0 1 0 1 0 1
Jackson (Township of) STA 37,744 1 14 41 56 1 22
Jackson (Township of) UNI 914 0 1 0 1 0 1
Jackson (Township of) WYA 643 0 1 0 1 0 1
Jackson Center SHE 1,369 0 0 1 1 0 0
Jamestown GRE 1,917 0 1 0 1 0 1
Jasper (Township of) FAY 857 0 2 0 2 0 2
Jefferson ATB 3,572 0 0 1 1 0 0
Jefferson (Township of) ADA 1,024 0 4 1 5 0 5
Jefferson (Township of) ATB 5,559 0 3 1 4 0 4
Jefferson (Township of) BRO 1,355 0 1 0 1 0 1
Jefferson (Township of) FAY 2,766 1 2 1 4 1 3
Report generated on : 5/18/2016 11:54:22 AM Page 18 of 46
Alcohol Related Crashes by City / Village
Table 8.02 - City / Village Statistics

City / Village County Population Fatal Crashes
Injury Crashes
PDO Crashes
Total Crashes
Deaths Injuries
Jefferson (Township of) FRA 5,322 1 3 5 9 1 5
Jefferson (Township of) JAC 3,508 0 4 1 5 0 7
Jefferson (Township of) KNO 604 0 0 1 1 0 0
Jefferson (Township of) LOG 2,946 0 4 3 7 0 5
Jefferson (Township of) MAD 6,935 1 5 5 11 1 13
Jefferson (Township of) MER 13,231 0 4 2 6 0 4
Jefferson (Township of) MOT 6,787 0 3 4 7 0 6
Jefferson (Township of) PRE 3,449 1 0 6 7 1 0
Jefferson (Township of) RIC 4,531 0 2 2 4 0 2
Jefferson (Township of) ROS 967 0 1 0 1 0 1
Jefferson (Township of) SCI 2,751 0 2 2 4 0 5
Jefferson (Township of) TUS 976 0 0 1 1 0 0
Jefferson (Township of) WIL 2,021 0 2 5 7 0 4
Jeffersonville FAY 1,288 0 0 1 1 0 0
Jennings (Township of) PUT 1,968 0 1 2 3 0 1
Jerome (Township of) UNI 3,950 0 3 3 6 0 3
Jeromesville ASD 478 0 0 1 1 0 0
Jerry City WOO 453 0 1 1 2 0 1
Jersey (Township of) LIC 2,841 0 5 5 10 0 5
Jerusalem (Township of)
LUC 3,181 0 3 2 5 0 6
Johnson (Township of) CHP 3,357 0 0 1 1 0 0
Johnston (Township of) TRU 2,040 0 1 2 3 0 1
Johnstown LIC 3,440 0 1 5 6 0 2
Kent POR 27,906 0 5 12 17 0 8
Kenton HAR 8,336 0 2 1 3 0 3
Kettering MOT 57,502 0 14 28 42 0 19
Killbuck HOL 839 0 1 1 2 0 1
Killbuck (Township of) HOL 1,954 0 0 2 2 0 0
Kingston (Township of) DEL 1,603 1 2 4 7 1 4
Kingsville (Township of) ATB 1,847 0 1 2 3 0 1
Kinsman (Township of) TRU 1,943 0 2 1 3 0 2
Kipton LOR 265 0 0 1 1 0 0
Kirkersville LIC 520 0 1 0 1 0 1
Kirkwood (Township of) BEL 353 0 0 7 7 0 0
Kirtland LAK 6,670 0 1 6 7 0 1
Kirtland Hills LAK 597 0 1 2 3 0 1
Report generated on : 5/18/2016 11:54:22 AM Page 19 of 46
Alcohol Related Crashes by City / Village
Table 8.02 - City / Village Statistics
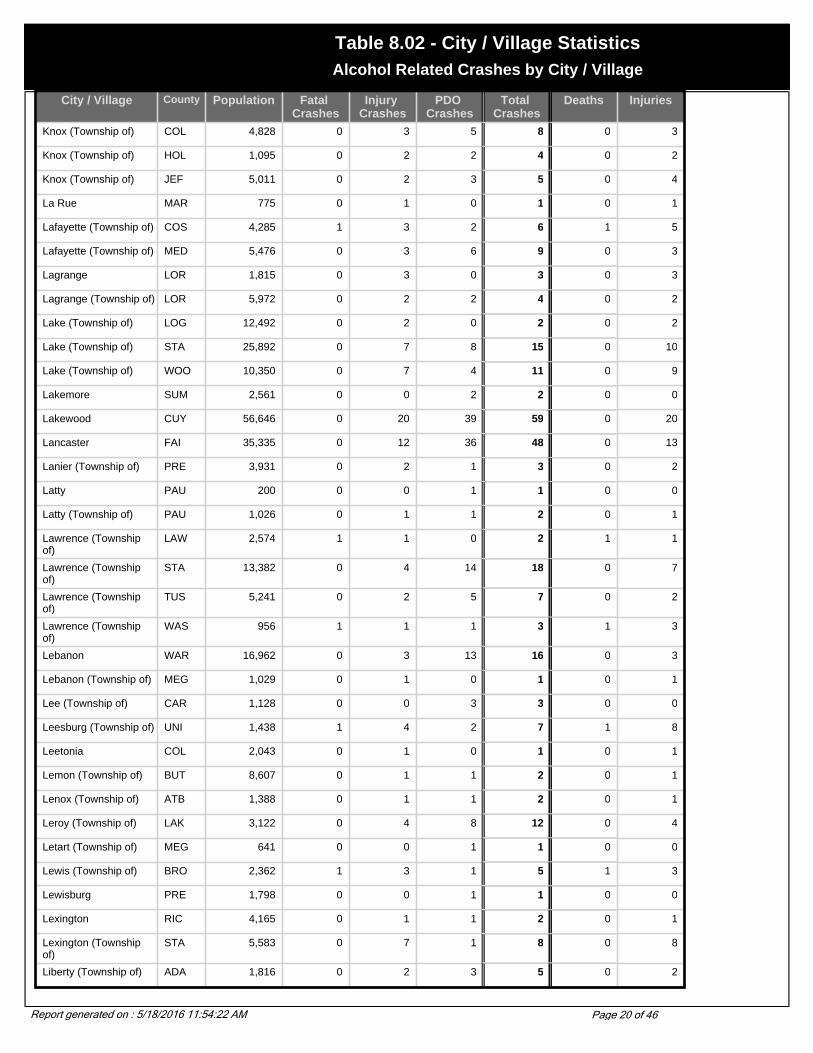
City / Village County Population Fatal Crashes
Injury Crashes
PDO Crashes
Total Crashes
Deaths Injuries
Knox (Township of) COL 4,828 0 3 5 8 0 3
Knox (Township of) HOL 1,095 0 2 2 4 0 2
Knox (Township of) JEF 5,011 0 2 3 5 0 4
La Rue MAR 775 0 1 0 1 0 1
Lafayette (Township of) COS 4,285 1 3 2 6 1 5
Lafayette (Township of) MED 5,476 0 3 6 9 0 3
Lagrange LOR 1,815 0 3 0 3 0 3
Lagrange (Township of) LOR 5,972 0 2 2 4 0 2
Lake (Township of) LOG 12,492 0 2 0 2 0 2
Lake (Township of) STA 25,892 0 7 8 15 0 10
Lake (Township of) WOO 10,350 0 7 4 11 0 9
Lakemore SUM 2,561 0 0 2 2 0 0
Lakewood CUY 56,646 0 20 39 59 0 20
Lancaster FAI 35,335 0 12 36 48 0 13
Lanier (Township of) PRE 3,931 0 2 1 3 0 2
Latty PAU 200 0 0 1 1 0 0
Latty (Township of) PAU 1,026 0 1 1 2 0 1
Lawrence (Township of)
LAW 2,574 1 1 0 2 1 1
Lawrence (Township of)
STA 13,382 0 4 14 18 0 7
Lawrence (Township of)
TUS 5,241 0 2 5 7 0 2
Lawrence (Township of)
WAS 956 1 1 1 3 1 3
Lebanon WAR 16,962 0 3 13 16 0 3
Lebanon (Township of) MEG 1,029 0 1 0 1 0 1
Lee (Township of) CAR 1,128 0 0 3 3 0 0
Leesburg (Township of) UNI 1,438 1 4 2 7 1 8
Leetonia COL 2,043 0 1 0 1 0 1
Lemon (Township of) BUT 8,607 0 1 1 2 0 1
Lenox (Township of) ATB 1,388 0 1 1 2 0 1
Leroy (Township of) LAK 3,122 0 4 8 12 0 4
Letart (Township of) MEG 641 0 0 1 1 0 0
Lewis (Township of) BRO 2,362 1 3 1 5 1 3
Lewisburg PRE 1,798 0 0 1 1 0 0
Lexington RIC 4,165 0 1 1 2 0 1
Lexington (Township of)
STA 5,583 0 7 1 8 0 8
Liberty (Township of) ADA 1,816 0 2 3 5 0 2
Report generated on : 5/18/2016 11:54:22 AM Page 20 of 46
Alcohol Related Crashes by City / Village
Table 8.02 - City / Village Statistics

City / Village County Population Fatal Crashes
Injury Crashes
PDO Crashes
Total Crashes
Deaths Injuries
Liberty (Township of) BUT 22,819 0 14 23 37 0 22
Liberty (Township of) CLI 1,033 0 4 0 4 0 5
Liberty (Township of) DAR 1,132 0 2 0 2 0 6
Liberty (Township of) DEL 15,429 0 8 13 21 0 15
Liberty (Township of) FAI 7,265 0 3 0 3 0 3
Liberty (Township of) GUE 1,068 0 1 0 1 0 2
Liberty (Township of) HAN 6,469 0 1 2 3 0 1
Liberty (Township of) HAR 7,149 0 0 1 1 0 0
Liberty (Township of) HEN 2,591 0 1 0 1 0 1
Liberty (Township of) HIG 9,798 0 3 1 4 0 4
Liberty (Township of) JAC 1,672 1 1 0 2 1 1
Liberty (Township of) KNO 1,422 0 0 1 1 0 0
Liberty (Township of) LIC 1,797 0 0 2 2 0 0
Liberty (Township of) LOG 3,126 0 2 1 3 0 2
Liberty (Township of) PUT 1,575 1 2 1 4 1 4
Liberty (Township of) ROS 2,476 0 2 1 3 0 2
Liberty (Township of) SEN 2,340 0 2 1 3 0 2
Liberty (Township of) TRU 23,522 3 16 6 25 3 24
Liberty (Township of) UNI 1,705 1 2 1 4 1 2
Liberty (Township of) VAN 1,696 0 2 0 2 0 3
Liberty (Township of) WAS 621 0 1 0 1 0 1
Liberty (Township of) WOO 1,862 0 2 0 2 0 3
Lick (Township of) JAC 2,682 0 3 4 7 0 4
Licking (Township of) LIC 3,870 1 3 6 10 1 4
Licking (Township of) MUS 2,248 0 1 3 4 0 1
Lima ALL 40,081 1 28 31 60 1 39
Lincoln (Township of) MRW 1,955 0 3 1 4 0 3
Lincoln Heights HAM 4,113 0 2 0 2 0 2
Linndale CUY 117 0 0 1 1 0 0
Linton (Township of) COS 632 0 1 0 1 0 1
Lisbon COL 2,788 0 1 3 4 0 1
Litchfield (Township of) MED 3,250 0 1 3 4 0 1
Liverpool (Township of) COL 4,374 0 0 1 1 0 0
Liverpool (Township of) MED 4,329 2 7 7 16 2 7
Lockland HAM 3,707 1 3 4 8 1 3
Lodi (Township of) ATH 1,403 0 3 2 5 0 4
Report generated on : 5/18/2016 11:54:22 AM Page 21 of 46
Alcohol Related Crashes by City / Village
Table 8.02 - City / Village Statistics

City / Village County Population Fatal Crashes
Injury Crashes
PDO Crashes
Total Crashes
Deaths Injuries
Logan HOC 6,704 0 1 4 5 0 1
Logan (Township of) AUG 1,201 0 0 1 1 0 0
London MAD 8,771 0 1 6 7 0 1
Londonderry (Township of)
GUE 738 0 1 1 2 0 1
Lorain LOR 68,652 2 30 25 57 2 39
Loramie (Township of) SHE 2,438 0 1 2 3 0 1
Lordstown TRU 3,633 0 0 4 4 0 0
Lostcreek (Township of)
MIA 1,633 0 0 1 1 0 0
Loudon (Township of) SEN 2,395 0 1 0 1 0 1
Loudonville ASD 2,906 0 1 1 2 0 2
Louisville STA 8,904 0 1 7 8 0 2
Loveland CLE 11,677 0 1 2 3 0 2
Loveland HAM 11,677 0 2 2 4 0 2
Lowellville MAH 1,281 0 2 1 3 0 2
Ludlow Falls MIA 210 0 0 1 1 0 0
Lyme (Township of) HUR 968 0 3 0 3 0 4
Lynchburg HIG 1,350 1 0 0 1 1 0
Lyndhurst CUY 15,279 0 7 7 14 0 8
Lyons FUL 559 0 0 1 1 0 0
Macedonia SUM 9,224 0 8 13 21 0 11
Mad River (Township of)
CHP 2,650 0 2 1 3 0 2
Mad River (Township of)
CLA 11,828 3 8 17 28 3 14
Madeira HAM 8,923 0 0 1 1 0 0
Madison LAK 2,921 0 2 5 7 0 2
Madison (Township of) BUT 8,611 0 8 5 13 0 12
Madison (Township of) CLA 2,796 0 1 1 2 0 1
Madison (Township of) COL 3,406 0 3 3 6 0 4
Madison (Township of) FAI 1,385 0 0 2 2 0 0
Madison (Township of) FAY 946 0 0 1 1 0 0
Madison (Township of) FRA 21,243 0 6 9 15 0 8
Madison (Township of) GUE 855 0 2 2 4 0 2
Madison (Township of) HIG 6,922 0 3 2 5 0 4
Madison (Township of) JAC 2,171 0 1 1 2 0 1
Madison (Township of) LAK 18,428 1 2 3 6 1 4
Madison (Township of) LIC 3,061 0 1 4 5 0 1
Madison (Township of) MUS 487 0 1 2 3 0 1
Report generated on : 5/18/2016 11:54:23 AM Page 22 of 46
Alcohol Related Crashes by City / Village
Table 8.02 - City / Village Statistics
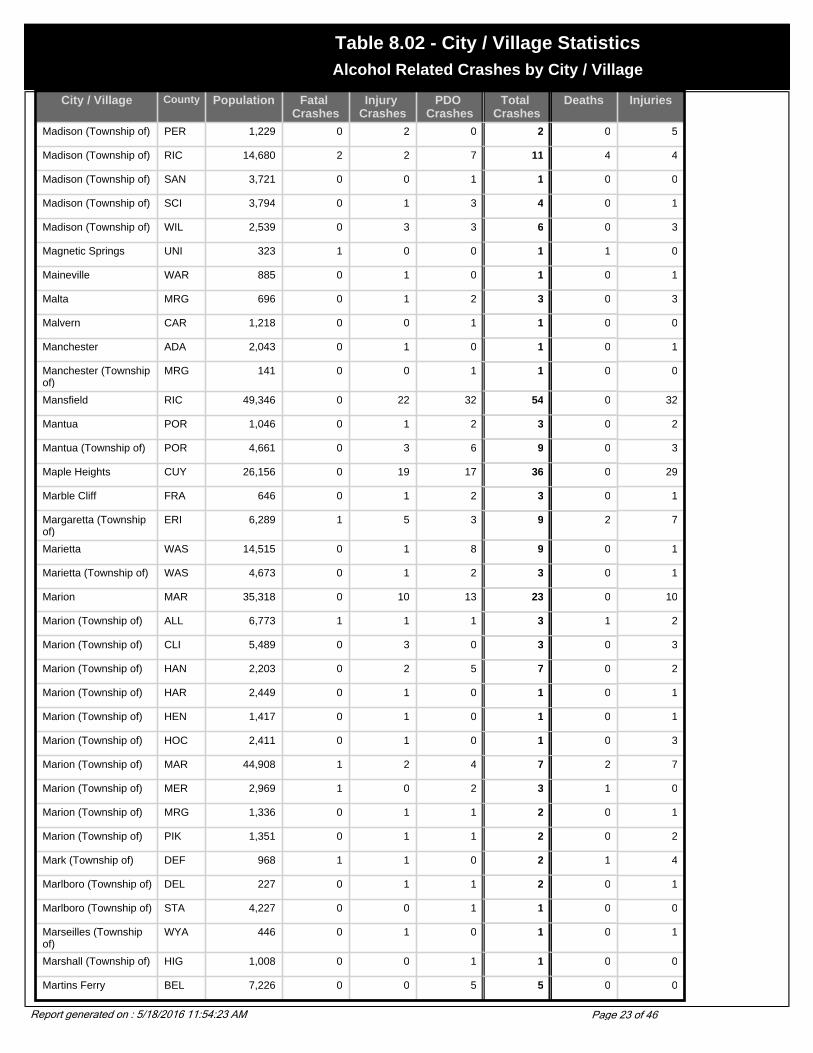
City / Village County Population Fatal Crashes
Injury Crashes
PDO Crashes
Total Crashes
Deaths Injuries
Madison (Township of) PER 1,229 0 2 0 2 0 5
Madison (Township of) RIC 14,680 2 2 7 11 4 4
Madison (Township of) SAN 3,721 0 0 1 1 0 0
Madison (Township of) SCI 3,794 0 1 3 4 0 1
Madison (Township of) WIL 2,539 0 3 3 6 0 3
Magnetic Springs UNI 323 1 0 0 1 1 0
Maineville WAR 885 0 1 0 1 0 1
Malta MRG 696 0 1 2 3 0 3
Malvern CAR 1,218 0 0 1 1 0 0
Manchester ADA 2,043 0 1 0 1 0 1
Manchester (Township of)
MRG 141 0 0 1 1 0 0
Mansfield RIC 49,346 0 22 32 54 0 32
Mantua POR 1,046 0 1 2 3 0 2
Mantua (Township of) POR 4,661 0 3 6 9 0 3
Maple Heights CUY 26,156 0 19 17 36 0 29
Marble Cliff FRA 646 0 1 2 3 0 1
Margaretta (Township of)
ERI 6,289 1 5 3 9 2 7
Marietta WAS 14,515 0 1 8 9 0 1
Marietta (Township of) WAS 4,673 0 1 2 3 0 1
Marion MAR 35,318 0 10 13 23 0 10
Marion (Township of) ALL 6,773 1 1 1 3 1 2
Marion (Township of) CLI 5,489 0 3 0 3 0 3
Marion (Township of) HAN 2,203 0 2 5 7 0 2
Marion (Township of) HAR 2,449 0 1 0 1 0 1
Marion (Township of) HEN 1,417 0 1 0 1 0 1
Marion (Township of) HOC 2,411 0 1 0 1 0 3
Marion (Township of) MAR 44,908 1 2 4 7 2 7
Marion (Township of) MER 2,969 1 0 2 3 1 0
Marion (Township of) MRG 1,336 0 1 1 2 0 1
Marion (Township of) PIK 1,351 0 1 1 2 0 2
Mark (Township of) DEF 968 1 1 0 2 1 4
Marlboro (Township of) DEL 227 0 1 1 2 0 1
Marlboro (Township of) STA 4,227 0 0 1 1 0 0
Marseilles (Township of)
WYA 446 0 1 0 1 0 1
Marshall (Township of) HIG 1,008 0 0 1 1 0 0
Martins Ferry BEL 7,226 0 0 5 5 0 0
Report generated on : 5/18/2016 11:54:23 AM Page 23 of 46
Alcohol Related Crashes by City / Village
Table 8.02 - City / Village Statistics

City / Village County Population Fatal Crashes
Injury Crashes
PDO Crashes
Total Crashes
Deaths Injuries
Mary Ann (Township of)
LIC 2,118 0 2 1 3 0 4
Marysville UNI 15,942 1 6 8 15 1 9
Mason WAR 22,016 0 6 10 16 0 6
Mason (Township of) LAW 1,095 0 0 2 2 0 0
Massie (Township of) WAR 1,061 0 0 1 1 0 0
Massillon STA 31,325 0 21 23 44 0 30
Maumee LUC 15,237 1 3 14 18 2 4
Mayfield CUY 3,435 0 0 4 4 0 0
Mayfield Heights CUY 19,386 0 1 8 9 0 1
McArthur (Township of) LOG 1,949 0 2 1 3 0 4
McClure HEN 761 0 0 1 1 0 0
McConnelsville MRG 1,676 0 1 1 2 0 1
McDonald TRU 3,481 0 1 1 2 0 1
McDonald (Township of)
HAR 914 0 1 0 1 0 1
McGuffey HAR 522 0 0 1 1 0 0
Mead (Township of) BEL 6,023 0 7 6 13 0 7
Mecca (Township of) TRU 2,829 1 1 0 2 1 2
Mechanic (Township of)
HOL 2,652 1 0 1 2 1 1
Medina MED 25,139 1 4 7 12 1 6
Medina (Township of) MED 7,783 0 4 4 8 0 4
Meigs (Township of) ADA 3,753 1 1 3 5 1 1
Mentor LAK 50,278 0 17 29 46 0 28
Mentor-on-the-Lake LAK 8,127 0 0 4 4 0 0
Metamora FUL 563 0 0 1 1 0 0
Miami (Township of) CLE 36,632 1 14 24 39 1 16
Miami (Township of) GRE 5,106 0 2 1 3 0 2
Miami (Township of) HAM 13,496 0 3 3 6 0 6
Miami (Township of) LOG 2,352 0 1 0 1 0 2
Miami (Township of) MOT 45,593 3 9 19 31 3 13
Miamisburg MOT 19,489 0 6 17 23 0 8
Middleburg Heights CUY 15,542 0 9 12 21 0 11
Middlebury (Township of)
KNO 1,138 1 0 0 1 1 1
Middlefield GEA 2,233 0 2 2 4 0 2
Middlefield (Township of)
GEA 4,418 0 0 3 3 0 0
Middleton (Township of)
COL 3,741 0 5 4 9 0 5
Report generated on : 5/18/2016 11:54:23 AM Page 24 of 46
Alcohol Related Crashes by City / Village
Table 8.02 - City / Village Statistics

City / Village County Population Fatal Crashes
Injury Crashes
PDO Crashes
Total Crashes
Deaths Injuries
Middleton (Township of)
WOO 2,598 0 2 5 7 0 2
Middletown BUT 51,605 1 20 38 59 1 28
Middletown WAR 51,605 0 3 1 4 0 5
Mifflin ASD 144 0 0 1 1 0 0
Mifflin (Township of) ASD 1,083 0 0 2 2 0 0
Mifflin (Township of) FRA 35,787 0 5 8 13 0 8
Mifflin (Township of) PIK 1,194 0 5 1 6 0 8
Mifflin (Township of) RIC 6,218 1 3 5 9 1 10
Mifflin (Township of) WYA 705 0 1 0 1 0 1
Milan ERI 1,445 0 0 1 1 0 0
Milan (Township of) ERI 3,686 0 1 1 2 0 1
Milford CLE 6,284 1 1 5 7 1 1
Milford (Township of) BUT 3,254 0 4 2 6 0 5
Milford (Township of) KNO 1,422 0 0 2 2 0 0
Mill (Township of) TUS 10,290 0 5 3 8 0 7
Mill Creek (Township of)
WIL 935 1 1 0 2 1 3
Millbury WOO 1,161 0 0 1 1 0 0
Millcreek (Township of) UNI 1,261 0 0 1 1 0 0
Milledgeville FAY 122 0 0 1 1 0 0
Millersburg HOL 3,326 0 1 3 4 0 1
Millersport FAI 963 0 0 2 2 0 0
Millville BUT 817 0 1 1 2 0 1
Millwood (Township of) GUE 1,318 0 1 0 1 0 3
Milton (Township of) ASD 2,431 0 1 0 1 0 2
Milton (Township of) JAC 1,119 0 1 1 2 0 1
Milton (Township of) MAH 4,107 0 5 5 10 0 6
Milton (Township of) WAY 9,254 0 1 2 3 0 1
Milton (Township of) WOO 1,159 0 0 1 1 0 0
Mineral City TUS 841 0 0 1 1 0 0
Minerva CAR 3,934 0 1 2 3 0 1
Minster AUG 2,794 0 1 0 1 0 1
Mississinawa (Township of)
DAR 779 0 0 2 2 0 0
Mogadore POR 3,893 0 1 0 1 0 1
Mogadore SUM 3,893 0 0 2 2 0 0
Mohican (Township of) ASD 1,857 0 2 0 2 0 2
Monclova (Township of)
LUC 6,767 0 5 7 12 0 5
Report generated on : 5/18/2016 11:54:23 AM Page 25 of 46
Alcohol Related Crashes by City / Village
Table 8.02 - City / Village Statistics

City / Village County Population Fatal Crashes
Injury Crashes
PDO Crashes
Total Crashes
Deaths Injuries
Monday Creek (Township of)
PER 671 0 1 0 1 0 1
Monroe BUT 7,133 0 5 5 10 0 7
Monroe WAR 7,133 0 0 1 1 0 0
Monroe (Township of) ADA 735 0 1 2 3 0 1
Monroe (Township of) ALL 2,219 0 0 1 1 0 0
Monroe (Township of) ATB 2,268 0 1 0 1 0 2
Monroe (Township of) CLE 8,236 0 1 7 8 0 1
Monroe (Township of) COS 452 0 1 0 1 0 1
Monroe (Township of) GUE 598 0 1 1 2 0 1
Monroe (Township of) HAS 1,241 2 0 2 4 2 2
Monroe (Township of) HOL 1,401 0 1 0 1 0 1
Monroe (Township of) KNO 2,427 0 0 4 4 0 0
Monroe (Township of) LIC 5,523 0 3 3 6 0 6
Monroe (Township of) LOG 1,503 0 1 1 2 0 1
Monroe (Township of) MIA 15,339 0 3 4 7 0 3
Monroe (Township of) PER 1,565 0 4 0 4 0 6
Monroe (Township of) PRE 2,290 1 1 1 3 1 1
Monroe (Township of) PUT 2,234 0 1 1 2 0 1
Monroe (Township of) RIC 2,656 0 5 1 6 0 6
Montgomery HAM 10,163 1 3 9 13 1 3
Montgomery (Township of)
ASD 2,412 1 2 4 7 1 2
Montgomery (Township of)
MAR 2,498 0 1 1 2 0 2
Montgomery (Township of)
WOO 4,505 0 0 1 1 0 0
Montpelier WIL 4,320 0 1 0 1 0 1
Montville (Township of) GEA 1,984 0 0 2 2 0 0
Montville (Township of) MED 5,410 0 4 8 12 0 5
Moorefield (Township of)
CLA 11,402 0 4 10 14 0 7
Moraine MOT 6,897 0 11 4 15 0 15
Moreland Hills CUY 3,298 0 1 1 2 0 1
Morgan (County) MRG 14,897 0 2 2 4 0 2
Morgan (Township of) ATB 1,954 0 1 0 1 0 2
Morgan (Township of) BUT 5,328 0 0 4 4 0 0
Morgan (Township of) GAL 1,341 0 1 1 2 0 1
Morgan (Township of) SCI 2,297 0 0 2 2 0 0
Morris (Township of) KNO 1,998 0 2 1 3 0 3
Report generated on : 5/18/2016 11:54:23 AM Page 26 of 46
Alcohol Related Crashes by City / Village
Table 8.02 - City / Village Statistics

City / Village County Population Fatal Crashes
Injury Crashes
PDO Crashes
Total Crashes
Deaths Injuries
Morrow WAR 1,286 0 2 0 2 0 3
Mount Blanchard HAN 484 0 0 1 1 0 0
Mount Gilead MRW 3,290 0 0 6 6 0 0
Mount Healthy HAM 7,149 0 1 0 1 0 1
Mount Orab (RR name Mount Oreb)
BRO 2,307 0 1 2 3 0 1
Mount Pleasant JEF 535 0 1 1 2 0 1
Mount Pleasant (Township of)
JEF 2,588 1 1 2 4 1 2
Mount Sterling MAD 1,865 0 0 1 1 0 0
Mount Vernon KNO 14,375 0 4 3 7 0 5
Muhlenberg (Township of)
PIC 905 0 1 0 1 0 1
Munroe Falls SUM 5,314 0 0 1 1 0 0
Munson (Township of) GEA 6,450 1 3 7 11 1 4
Muskingum (Township of)
MUS 3,813 0 1 0 1 0 1
Muskingum (Township of)
WAS 4,627 1 0 2 3 1 0
Napoleon HEN 9,318 0 0 9 9 0 0
Napoleon (Township of)
HEN 10,331 1 2 1 4 1 3
Navarre STA 1,440 0 1 1 2 0 2
Neave (Township of) DAR 1,986 0 3 1 4 0 3
Nelson (Township of) POR 2,985 0 1 1 2 0 1
Nelsonville ATH 5,230 0 0 7 7 0 0
Nevada WYA 814 0 0 1 1 0 0
New Albany FRA 3,711 0 2 1 3 0 2
New Boston SCI 2,340 0 1 1 2 0 1
New Bremen AUG 2,909 0 0 1 1 0 0
New Carlisle CLA 5,735 0 2 2 4 0 2
New Concord MUS 2,651 0 0 1 1 0 0
New Franklin SUM 2,191 0 5 5 10 0 7
New Haven (Township of)
HUR 2,860 1 0 0 1 1 1
New Jasper (Township of)
GRE 2,538 0 1 4 5 0 1
New Lexington PER 4,689 0 0 1 1 0 0
New Lyme (Township of)
ATB 1,072 0 1 0 1 0 1
New Market (Township of)
HIG 1,941 0 1 0 1 0 1
New Miami BUT 2,469 0 0 2 2 0 0
New Middletown MAH 1,682 0 0 2 2 0 0
Report generated on : 5/18/2016 11:54:23 AM Page 27 of 46
Alcohol Related Crashes by City / Village
Table 8.02 - City / Village Statistics
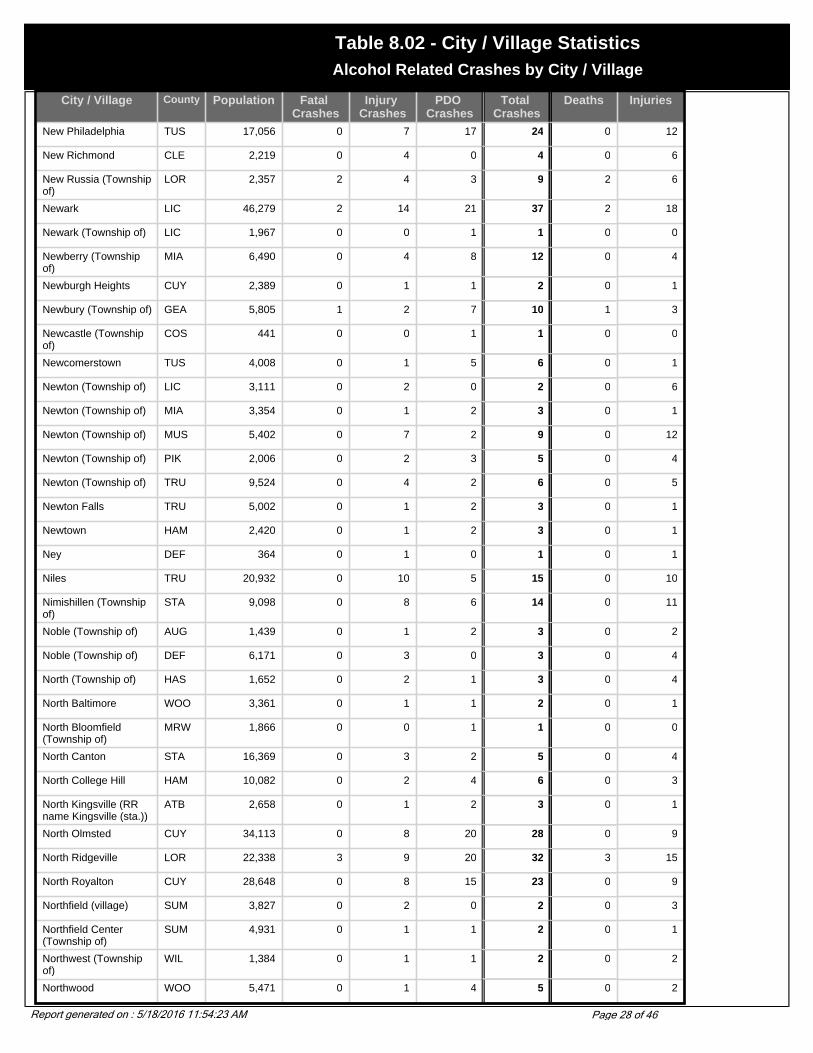
City / Village County Population Fatal Crashes
Injury Crashes
PDO Crashes
Total Crashes
Deaths Injuries
New Philadelphia TUS 17,056 0 7 17 24 0 12
New Richmond CLE 2,219 0 4 0 4 0 6
New Russia (Township of)
LOR 2,357 2 4 3 9 2 6
Newark LIC 46,279 2 14 21 37 2 18
Newark (Township of) LIC 1,967 0 0 1 1 0 0
Newberry (Township of)
MIA 6,490 0 4 8 12 0 4
Newburgh Heights CUY 2,389 0 1 1 2 0 1
Newbury (Township of) GEA 5,805 1 2 7 10 1 3
Newcastle (Township of)
COS 441 0 0 1 1 0 0
Newcomerstown TUS 4,008 0 1 5 6 0 1
Newton (Township of) LIC 3,111 0 2 0 2 0 6
Newton (Township of) MIA 3,354 0 1 2 3 0 1
Newton (Township of) MUS 5,402 0 7 2 9 0 12
Newton (Township of) PIK 2,006 0 2 3 5 0 4
Newton (Township of) TRU 9,524 0 4 2 6 0 5
Newton Falls TRU 5,002 0 1 2 3 0 1
Newtown HAM 2,420 0 1 2 3 0 1
Ney DEF 364 0 1 0 1 0 1
Niles TRU 20,932 0 10 5 15 0 10
Nimishillen (Township of)
STA 9,098 0 8 6 14 0 11
Noble (Township of) AUG 1,439 0 1 2 3 0 2
Noble (Township of) DEF 6,171 0 3 0 3 0 4
North (Township of) HAS 1,652 0 2 1 3 0 4
North Baltimore WOO 3,361 0 1 1 2 0 1
North Bloomfield (Township of)
MRW 1,866 0 0 1 1 0 0
North Canton STA 16,369 0 3 2 5 0 4
North College Hill HAM 10,082 0 2 4 6 0 3
North Kingsville (RR name Kingsville (sta.))
ATB 2,658 0 1 2 3 0 1
North Olmsted CUY 34,113 0 8 20 28 0 9
North Ridgeville LOR 22,338 3 9 20 32 3 15
North Royalton CUY 28,648 0 8 15 23 0 9
Northfield (village) SUM 3,827 0 2 0 2 0 3
Northfield Center (Township of)
SUM 4,931 0 1 1 2 0 1
Northwest (Township of)
WIL 1,384 0 1 1 2 0 2
Northwood WOO 5,471 0 1 4 5 0 2
Report generated on : 5/18/2016 11:54:23 AM Page 28 of 46
Alcohol Related Crashes by City / Village
Table 8.02 - City / Village Statistics

City / Village County Population Fatal Crashes
Injury Crashes
PDO Crashes
Total Crashes
Deaths Injuries
Norton SUM 11,523 0 4 4 8 0 5
Norwalk HUR 16,238 0 3 8 11 0 9
Norwalk (Township of) HUR 3,685 0 0 2 2 0 0
Norwich (Township of) FRA 27,488 0 3 1 4 0 3
Norwich (Township of) HUR 1,072 0 1 0 1 0 1
Norwood HAM 21,675 0 9 21 30 0 10
Oak Harbor OTT 2,841 0 1 1 2 0 1
Oak Run (Township of) MAD 514 0 0 1 1 0 0
Oakwood CUY 3,667 0 1 1 2 0 4
Oakwood MOT 9,215 0 4 3 7 0 4
Oberlin LOR 8,195 0 2 0 2 0 2
Obetz FRA 3,977 0 6 6 12 0 6
Ohio (Township of) CLE 5,245 0 2 3 5 0 4
Ohio (Township of) MOE 1,032 0 0 1 1 0 0
Ohio City VAN 784 0 0 1 1 0 0
Olive (Township of) MEG 1,874 1 1 1 3 1 4
Olive (Township of) NOB 5,395 1 1 1 3 1 1
Oliver (Township of) ADA 1,246 0 1 1 2 0 1
Olmsted (Township of) CUY 10,575 0 3 5 8 0 3
Olmsted Falls CUY 7,962 0 0 7 7 0 0
Ontario RIC 5,303 0 1 1 2 0 1
Orange CUY 3,236 1 1 0 2 1 1
Orange (Township of) ASD 2,276 0 2 4 6 0 2
Orange (Township of) CAR 1,258 0 2 0 2 0 2
Orange (Township of) DEL 12,464 0 13 15 28 0 17
Orange (Township of) HAN 1,290 0 1 1 2 0 1
Orange (Township of) MEG 934 0 0 1 1 0 0
Orange (Township of) SHE 1,419 0 3 0 3 0 3
Oregon LUC 19,355 1 8 12 21 1 14
Orrville WAY 8,551 0 1 3 4 0 1
Orwell (Township of) ATB 2,830 0 0 1 1 0 0
Osgood DAR 255 0 0 1 1 0 0
Osnaburg (Township of)
STA 5,886 0 4 4 8 0 4
Ottawa (Township of) PUT 7,961 0 1 3 4 0 1
Ottawa Hills LUC 4,564 0 0 2 2 0 0
Oxford BUT 21,943 0 5 7 12 0 5
Report generated on : 5/18/2016 11:54:23 AM Page 29 of 46
Alcohol Related Crashes by City / Village
Table 8.02 - City / Village Statistics

City / Village County Population Fatal Crashes
Injury Crashes
PDO Crashes
Total Crashes
Deaths Injuries
Oxford (Township of) BUT 24,133 0 6 3 9 0 8
Oxford (Township of) COS 1,560 0 2 0 2 0 3
Oxford (Township of) DEL 854 0 0 1 1 0 0
Oxford (Township of) ERI 1,096 0 1 1 2 0 1
Oxford (Township of) TUS 5,133 0 1 1 2 0 1
Painesville LAK 17,503 0 13 9 22 0 23
Painesville (Township of)
LAK 18,562 0 4 8 12 0 6
Paint (Township of) FAY 1,905 0 3 0 3 0 4
Paint (Township of) HIG 4,112 0 2 2 4 0 3
Paint (Township of) HOL 3,547 0 1 0 1 0 1
Paint (Township of) WAY 2,823 0 2 1 3 0 5
Palmer (Township of) PUT 1,143 0 2 0 2 0 7
Palmyra (Township of) POR 2,785 0 1 2 3 0 1
Paris (Township of) POR 1,827 1 2 1 4 1 3
Paris (Township of) STA 5,969 0 4 4 8 0 5
Park Layne CLA 4,519 0 0 1 1 0 0
Parkman (Township of) GEA 3,546 0 2 1 3 0 2
Parma CUY 85,655 1 21 30 52 1 33
Parma Heights CUY 21,659 0 4 8 12 0 7
Pataskala LIC 10,249 0 6 10 16 0 6
Paulding PAU 3,595 0 1 0 1 0 1
Paulding (Township of) PAU 4,008 0 1 0 1 0 1
Paxton (Township of) ROS 2,165 0 0 2 2 0 0
Payne PAU 1,166 0 1 1 2 0 1
Pease (Township of) BEL 14,961 0 2 4 6 0 3
Pebble (Township of) PIK 2,416 0 1 0 1 0 1
Pee Pee (Township of) PIK 7,776 0 1 0 1 0 1
Penfield (Township of) LOR 1,690 2 3 1 6 4 4
Peninsula SUM 602 0 0 1 1 0 0
Penn (Township of) HIG 1,055 0 2 1 3 0 2
Perkins (Township of) ERI 12,578 0 3 14 17 0 6
Perry LAK 1,195 0 3 1 4 0 3
Perry (Township of) ALL 3,620 0 6 1 7 0 7
Perry (Township of) ASD 1,927 0 0 3 3 0 0
Perry (Township of) BRO 4,830 0 1 3 4 0 2
Perry (Township of) CAR 1,022 0 1 0 1 0 1
Report generated on : 5/18/2016 11:54:23 AM Page 30 of 46
Alcohol Related Crashes by City / Village
Table 8.02 - City / Village Statistics

City / Village County Population Fatal Crashes
Injury Crashes
PDO Crashes
Total Crashes
Deaths Injuries
Perry (Township of) COL 17,049 0 1 2 3 0 2
Perry (Township of) FAY 945 0 0 2 2 0 0
Perry (Township of) FRA 4,087 0 7 10 17 0 7
Perry (Township of) GAL 1,276 0 1 0 1 0 1
Perry (Township of) LAK 8,240 0 2 1 3 0 2
Perry (Township of) LAW 6,813 1 4 2 7 1 5
Perry (Township of) LOG 1,022 1 0 1 2 1 0
Perry (Township of) MOT 6,184 0 1 4 5 0 1
Perry (Township of) MUS 2,420 0 1 3 4 0 1
Perry (Township of) PIK 913 0 2 2 4 0 3
Perry (Township of) PUT 1,206 1 0 0 1 1 0
Perry (Township of) RIC 1,345 0 0 1 1 0 0
Perry (Township of) SHE 1,128 0 1 0 1 0 1
Perry (Township of) STA 29,167 0 14 27 41 0 19
Perry (Township of) WOO 1,934 0 0 2 2 0 0
Perrysburg WOO 16,945 0 6 14 20 0 9
Perrysburg (Township of)
WOO 13,613 0 2 8 10 0 2
Peru (Township of) HUR 1,043 0 2 0 2 0 2
Pickaway (Township of) PIC 1,851 0 2 1 3 0 3
Pickerington FAI 9,792 0 3 13 16 0 4
Pierce (Township of) CLE 12,226 0 6 9 15 0 7
Pierpont (Township of) ATB 1,197 0 3 0 3 0 4
Pike (Township of) BRO 3,742 0 1 1 2 0 2
Pike (Township of) CLA 3,891 0 0 2 2 0 0
Pike (Township of) FUL 1,738 0 1 1 2 0 2
Pike (Township of) KNO 1,298 0 1 0 1 0 1
Pike (Township of) PER 6,595 0 4 2 6 0 4
Pike (Township of) STA 4,088 0 3 2 5 0 5
Piqua MIA 20,738 0 9 14 23 0 10
Pittsfield (Township of) LOR 1,549 0 2 1 3 0 3
Plain (Township of) FRA 5,926 1 1 1 3 1 2
Plain (Township of) STA 51,997 0 17 19 36 0 20
Plain (Township of) WAY 2,894 0 4 0 4 0 8
Plain (Township of) WOO 1,706 0 0 1 1 0 0
Plain City MAD 2,832 0 0 1 1 0 0
Pleasant (Township of) BRO 5,187 0 2 3 5 0 2
Report generated on : 5/18/2016 11:54:24 AM Page 31 of 46
Alcohol Related Crashes by City / Village
Table 8.02 - City / Village Statistics
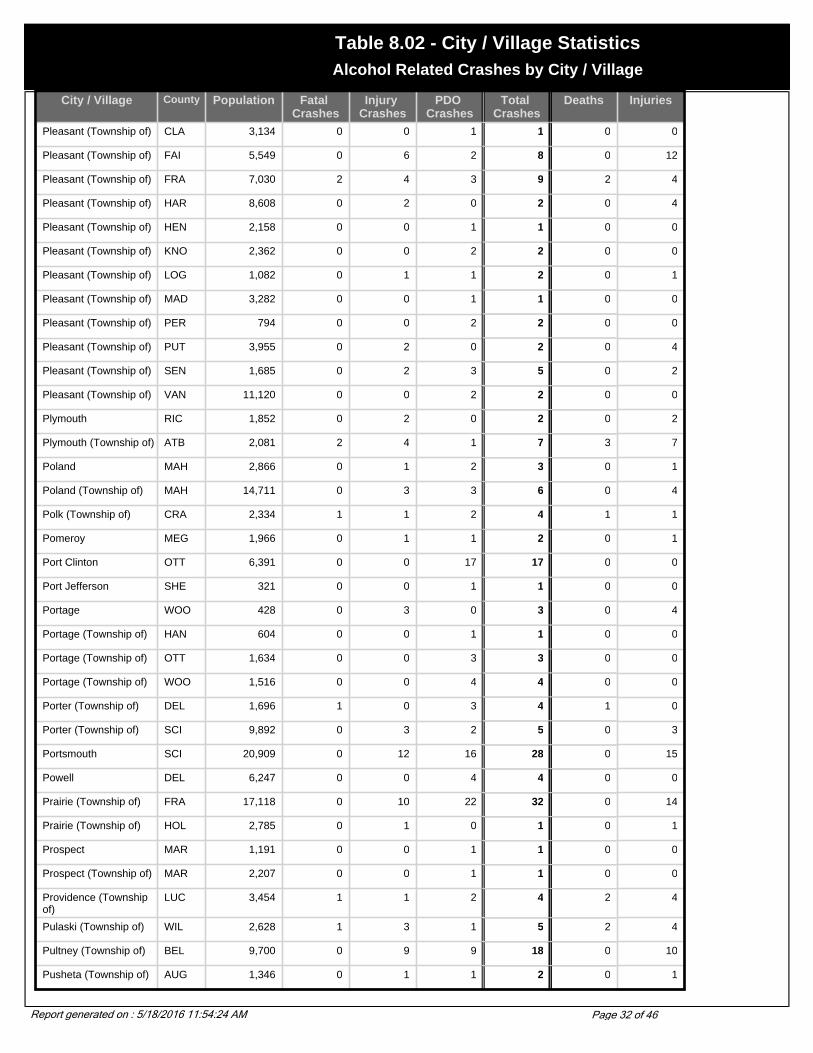
City / Village County Population Fatal Crashes
Injury Crashes
PDO Crashes
Total Crashes
Deaths Injuries
Pleasant (Township of) CLA 3,134 0 0 1 1 0 0
Pleasant (Township of) FAI 5,549 0 6 2 8 0 12
Pleasant (Township of) FRA 7,030 2 4 3 9 2 4
Pleasant (Township of) HAR 8,608 0 2 0 2 0 4
Pleasant (Township of) HEN 2,158 0 0 1 1 0 0
Pleasant (Township of) KNO 2,362 0 0 2 2 0 0
Pleasant (Township of) LOG 1,082 0 1 1 2 0 1
Pleasant (Township of) MAD 3,282 0 0 1 1 0 0
Pleasant (Township of) PER 794 0 0 2 2 0 0
Pleasant (Township of) PUT 3,955 0 2 0 2 0 4
Pleasant (Township of) SEN 1,685 0 2 3 5 0 2
Pleasant (Township of) VAN 11,120 0 0 2 2 0 0
Plymouth RIC 1,852 0 2 0 2 0 2
Plymouth (Township of) ATB 2,081 2 4 1 7 3 7
Poland MAH 2,866 0 1 2 3 0 1
Poland (Township of) MAH 14,711 0 3 3 6 0 4
Polk (Township of) CRA 2,334 1 1 2 4 1 1
Pomeroy MEG 1,966 0 1 1 2 0 1
Port Clinton OTT 6,391 0 0 17 17 0 0
Port Jefferson SHE 321 0 0 1 1 0 0
Portage WOO 428 0 3 0 3 0 4
Portage (Township of) HAN 604 0 0 1 1 0 0
Portage (Township of) OTT 1,634 0 0 3 3 0 0
Portage (Township of) WOO 1,516 0 0 4 4 0 0
Porter (Township of) DEL 1,696 1 0 3 4 1 0
Porter (Township of) SCI 9,892 0 3 2 5 0 3
Portsmouth SCI 20,909 0 12 16 28 0 15
Powell DEL 6,247 0 0 4 4 0 0
Prairie (Township of) FRA 17,118 0 10 22 32 0 14
Prairie (Township of) HOL 2,785 0 1 0 1 0 1
Prospect MAR 1,191 0 0 1 1 0 0
Prospect (Township of) MAR 2,207 0 0 1 1 0 0
Providence (Township of)
LUC 3,454 1 1 2 4 2 4
Pulaski (Township of) WIL 2,628 1 3 1 5 2 4
Pultney (Township of) BEL 9,700 0 9 9 18 0 10
Pusheta (Township of) AUG 1,346 0 1 1 2 0 1
Report generated on : 5/18/2016 11:54:24 AM Page 32 of 46
Alcohol Related Crashes by City / Village
Table 8.02 - City / Village Statistics

City / Village County Population Fatal Crashes
Injury Crashes
PDO Crashes
Total Crashes
Deaths Injuries
Quincy LOG 734 0 0 1 1 0 0
Raccoon (Township of) GAL 2,302 0 0 1 1 0 0
Radnor (Township of) DEL 1,335 1 3 0 4 3 4
Randolph (Township of)
POR 5,504 0 5 1 6 0 5
Range (Township of) MAD 983 0 0 3 3 0 0
Rarden SCI 176 1 0 0 1 1 0
Ravenna POR 11,771 0 6 11 17 0 9
Ravenna (Township of) POR 9,270 0 3 7 10 0 3
Rayland JEF 434 0 0 1 1 0 0
Reading HAM 11,292 0 0 9 9 0 0
Reading (Township of) PER 3,956 0 1 0 1 0 1
Recovery (Township of) MER 1,550 0 2 2 4 0 2
Reily (Township of) BUT 2,568 0 1 3 4 0 1
Reminderville SUM 2,347 0 0 5 5 0 0
Reynoldsburg FAI 32,069 0 0 3 3 0 0
Reynoldsburg FRA 32,069 1 7 15 23 1 15
Reynoldsburg LIC 32,069 0 1 0 1 0 1
Rice (Township of) SAN 1,437 0 1 4 5 0 2
Richfield SUM 3,286 0 0 7 7 0 0
Richfield (Township of) HEN 654 0 0 1 1 0 0
Richfield (Township of) LUC 1,573 0 0 2 2 0 0
Richfield (Township of) SUM 5,424 0 1 2 3 0 1
Richland (Township of) ALL 6,090 0 2 3 5 0 2
Richland (Township of) BEL 13,571 0 5 16 21 0 8
Richland (Township of) CLI 3,758 0 1 0 1 0 2
Richland (Township of) DAR 862 0 2 0 2 0 4
Richland (Township of) DEF 2,941 0 3 0 3 0 3
Richland (Township of) FAI 1,940 0 2 0 2 0 6
Richland (Township of) HOL 1,165 0 1 3 4 0 1
Richland (Township of) LOG 2,455 0 0 2 2 0 0
Richland (Township of) MAR 1,663 0 0 2 2 0 0
Richland (Township of) VIN 1,667 0 0 1 1 0 0
Richmond (Township of)
ATB 937 0 0 1 1 0 0
Richmond (Township of)
HUR 1,111 0 0 1 1 0 0
Richmond Heights CUY 10,944 0 2 3 5 0 2
Ridgefield (Township of)
HUR 2,390 0 0 1 1 0 0
Report generated on : 5/18/2016 11:54:24 AM Page 33 of 46
Alcohol Related Crashes by City / Village
Table 8.02 - City / Village Statistics

City / Village County Population Fatal Crashes
Injury Crashes
PDO Crashes
Total Crashes
Deaths Injuries
Ridgeville (Township of)
HEN 1,132 1 1 0 2 2 2
Riley (Township of) PUT 2,191 0 0 1 1 0 0
Riley (Township of) SAN 1,302 2 3 1 6 2 7
Ripley (Township of) HOL 2,194 0 0 1 1 0 0
Ripley (Township of) HUR 943 0 0 1 1 0 0
Rittman WAY 6,314 0 1 3 4 0 1
Riverside MOT 23,545 1 10 18 29 1 17
Roaming Shores ATB 1,239 0 1 1 2 0 1
Rochester LOR 190 0 0 1 1 0 0
Rock Creek ATB 584 0 0 1 1 0 0
Rocky Ridge OTT 389 1 0 0 1 1 1
Rocky River CUY 20,735 1 3 5 9 1 5
Rome (Township of) ATB 1,568 0 0 2 2 0 0
Rome (Township of) ATH 1,400 1 1 0 2 1 1
Rome (Township of) LAW 8,694 0 0 1 1 0 0
Rootstown (Township of)
POR 7,212 0 3 5 8 0 3
Rose (Township of) CAR 1,603 0 3 1 4 0 5
Ross (Township of) BUT 6,448 2 1 5 8 2 1
Ross (Township of) GRE 744 0 1 0 1 0 1
Rossford WOO 6,406 0 2 5 7 0 4
Roundhead (Township of)
HAR 752 0 2 3 5 0 3
Rumley (Township of) HAS 1,575 0 0 3 3 0 0
Rush (Township of) CHP 2,779 1 1 1 3 1 1
Rush (Township of) SCI 3,144 0 1 3 4 0 1
Rush Creek (Township of)
FAI 3,549 0 2 0 2 0 4
Rushcreek (Township of)
LOG 2,191 0 2 1 3 0 5
Russell (Township of) GEA 5,529 0 2 1 3 0 2
Russells Point LOG 1,619 0 1 0 1 0 1
Rutland MEG 401 0 0 3 3 0 0
Rutland (Township of) MEG 2,347 0 1 0 1 0 2
Sagamore Hills (Township of)
SUM 9,340 0 4 1 5 0 4
Saint Albans (Township of)
LIC 2,060 0 1 4 5 0 2
Saint Bernard HAM 4,924 0 3 4 7 0 5
Saint Clair (Township of)
BUT 7,336 0 2 5 7 0 3
Report generated on : 5/18/2016 11:54:25 AM Page 34 of 46
Alcohol Related Crashes by City / Village
Table 8.02 - City / Village Statistics

City / Village County Population Fatal Crashes
Injury Crashes
PDO Crashes
Total Crashes
Deaths Injuries
Saint Clair (Township of)
COL 7,961 0 1 3 4 0 1
Saint Clairsville BEL 5,057 0 1 1 2 0 2
Saint Joseph (Township of)
WIL 2,958 0 0 2 2 0 0
Saint Marys AUG 8,342 0 0 13 13 0 0
Salem COL 12,197 0 6 7 13 0 6
Salem (Township of) CHP 2,307 1 1 1 3 1 3
Salem (Township of) COL 5,703 0 2 4 6 0 2
Salem (Township of) HIG 682 0 0 1 1 0 0
Salem (Township of) JEF 3,162 0 3 2 5 0 4
Salem (Township of) MEG 944 0 0 1 1 0 0
Salem (Township of) MOE 1,046 1 1 0 2 1 1
Salem (Township of) MUS 830 0 1 0 1 0 1
Salem (Township of) OTT 5,517 0 0 1 1 0 0
Salem (Township of) SHE 2,231 0 2 1 3 0 3
Salem (Township of) TUS 1,673 0 0 2 2 0 0
Salem (Township of) WAR 4,133 1 0 4 5 1 1
Salem (Township of) WAS 1,130 0 3 2 5 0 5
Salem (Township of) WYA 1,055 1 2 0 3 1 2
Saline (Township of) JEF 1,454 0 2 2 4 0 2
Salisbury (Township of) MEG 6,441 0 3 1 4 0 5
Salt Creek (Township of)
HOC 1,260 0 0 1 1 0 0
Salt Creek (Township of)
HOL 3,778 0 0 1 1 0 0
Salt Creek (Township of)
MUS 1,113 0 5 2 7 0 6
Salt Creek (Township of)
PIC 2,655 0 1 2 3 0 2
Salt Creek (Township of)
WAY 3,783 0 0 2 2 0 0
Salt Lick (Township of) PER 1,200 0 1 0 1 0 1
Salt Rock (Township of)
MAR 699 0 0 1 1 0 0
Sandusky ERI 27,844 0 16 24 40 0 24
Sandusky (Township of)
RIC 856 0 1 1 2 0 1
Sandusky (Township of)
SAN 4,087 0 3 2 5 0 4
Sandy (Township of) STA 3,679 1 1 0 2 1 1
Sandy (Township of) TUS 3,354 0 4 1 5 0 4
Saybrook (Township of) ATB 10,051 0 3 2 5 0 6
Scioto (Township of) DEL 2,527 0 2 2 4 0 2
Report generated on : 5/18/2016 11:54:25 AM Page 35 of 46
Alcohol Related Crashes by City / Village
Table 8.02 - City / Village Statistics

City / Village County Population Fatal Crashes
Injury Crashes
PDO Crashes
Total Crashes
Deaths Injuries
Scioto (Township of) JAC 1,788 0 1 1 2 0 1
Scioto (Township of) PIC 9,165 0 1 1 2 0 1
Scioto (Township of) ROS 27,735 0 4 8 12 0 10
Scipio (Township of) MEG 1,050 0 1 0 1 0 1
Scipio (Township of) SEN 1,831 0 1 0 1 0 1
Scott (Township of) BRO 1,253 0 1 0 1 0 2
Scott (Township of) MAR 521 0 2 0 2 0 4
Scott (Township of) SAN 1,502 0 1 1 2 0 1
Seal (Township of) PIK 2,983 0 2 3 5 0 4
Sebring MAH 4,912 0 0 1 1 0 0
Seneca (Township of) MOE 508 0 3 2 5 0 5
Seneca (Township of) SEN 1,585 0 4 1 5 0 4
Seven Hills CUY 12,080 0 1 1 2 0 1
Seville MED 2,160 0 1 2 3 0 1
Shaker Heights CUY 29,405 0 1 7 8 0 1
Shalersville (Township of)
POR 5,976 0 6 8 14 0 7
Sharon (Township of) FRA 16,455 1 3 5 9 1 3
Sharon (Township of) MED 4,244 0 2 3 5 0 3
Sharon (Township of) RIC 9,720 0 0 1 1 0 0
Sharonville HAM 13,804 0 13 12 25 0 13
Shawnee (Township of) ALL 12,220 0 3 10 13 0 3
Sheffield LOR 2,949 0 5 8 13 0 6
Sheffield (Township of) ATB 1,491 0 1 1 2 0 1
Sheffield (Township of) LOR 4,117 0 1 2 3 0 4
Sheffield Lake LOR 9,371 0 1 5 6 0 1
Shelby RIC 9,821 0 4 3 7 0 7
Sherman (Township of) HUR 501 0 1 1 2 0 1
Short Creek (Township of)
HAS 1,012 0 0 1 1 0 0
Sidney SHE 20,211 1 6 10 17 1 7
Silver Creek (Township of)
GRE 3,688 0 2 0 2 0 2
Silver Lake SUM 3,019 0 0 1 1 0 0
Silverton HAM 5,178 0 0 3 3 0 0
Sinking Spring HIG 158 0 1 0 1 0 2
Smith (Township of) BEL 1,445 0 4 0 4 0 8
Smith (Township of) MAH 4,977 0 2 1 3 0 2
Smithfield JEF 867 0 0 2 2 0 0
Report generated on : 5/18/2016 11:54:25 AM Page 36 of 46
Alcohol Related Crashes by City / Village
Table 8.02 - City / Village Statistics
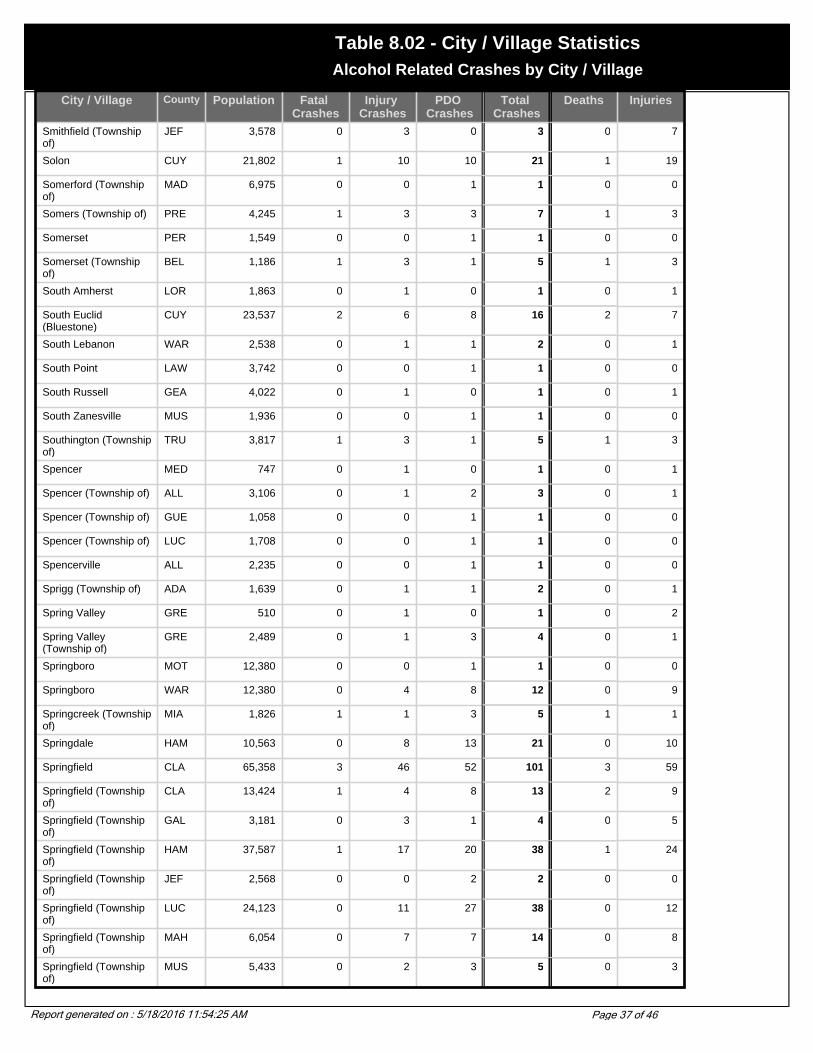
City / Village County Population Fatal Crashes
Injury Crashes
PDO Crashes
Total Crashes
Deaths Injuries
Smithfield (Township of)
JEF 3,578 0 3 0 3 0 7
Solon CUY 21,802 1 10 10 21 1 19
Somerford (Township of)
MAD 6,975 0 0 1 1 0 0
Somers (Township of) PRE 4,245 1 3 3 7 1 3
Somerset PER 1,549 0 0 1 1 0 0
Somerset (Township of)
BEL 1,186 1 3 1 5 1 3
South Amherst LOR 1,863 0 1 0 1 0 1
South Euclid (Bluestone)
CUY 23,537 2 6 8 16 2 7
South Lebanon WAR 2,538 0 1 1 2 0 1
South Point LAW 3,742 0 0 1 1 0 0
South Russell GEA 4,022 0 1 0 1 0 1
South Zanesville MUS 1,936 0 0 1 1 0 0
Southington (Township of)
TRU 3,817 1 3 1 5 1 3
Spencer MED 747 0 1 0 1 0 1
Spencer (Township of) ALL 3,106 0 1 2 3 0 1
Spencer (Township of) GUE 1,058 0 0 1 1 0 0
Spencer (Township of) LUC 1,708 0 0 1 1 0 0
Spencerville ALL 2,235 0 0 1 1 0 0
Sprigg (Township of) ADA 1,639 0 1 1 2 0 1
Spring Valley GRE 510 0 1 0 1 0 2
Spring Valley (Township of)
GRE 2,489 0 1 3 4 0 1
Springboro MOT 12,380 0 0 1 1 0 0
Springboro WAR 12,380 0 4 8 12 0 9
Springcreek (Township of)
MIA 1,826 1 1 3 5 1 1
Springdale HAM 10,563 0 8 13 21 0 10
Springfield CLA 65,358 3 46 52 101 3 59
Springfield (Township of)
CLA 13,424 1 4 8 13 2 9
Springfield (Township of)
GAL 3,181 0 3 1 4 0 5
Springfield (Township of)
HAM 37,587 1 17 20 38 1 24
Springfield (Township of)
JEF 2,568 0 0 2 2 0 0
Springfield (Township of)
LUC 24,123 0 11 27 38 0 12
Springfield (Township of)
MAH 6,054 0 7 7 14 0 8
Springfield (Township of)
MUS 5,433 0 2 3 5 0 3
Report generated on : 5/18/2016 11:54:25 AM Page 37 of 46
Alcohol Related Crashes by City / Village
Table 8.02 - City / Village Statistics

City / Village County Population Fatal Crashes
Injury Crashes
PDO Crashes
Total Crashes
Deaths Injuries
Springfield (Township of)
RIC 9,674 0 4 6 10 0 6
Springfield (Township of)
ROS 2,277 0 3 2 5 0 6
Springfield (Township of)
SUM 15,168 0 6 13 19 0 10
Springfield (Township of)
WIL 3,227 0 2 2 4 0 2
Stark (County) STA 378,098 0 1 1 2 0 2
Starr (Township of) HOC 1,477 1 2 2 5 2 2
Staunton (Township of) MIA 1,992 0 1 3 4 0 1
Sterling (Township of) BRO 3,753 0 2 2 4 0 2
Steubenville JEF 19,015 1 9 11 21 1 13
Steubenville (Township of)
JEF 4,695 0 1 3 4 0 1
Stock (Township of) HAS 432 0 2 0 2 0 2
Stokes (Township of) LOG 5,367 0 4 4 8 0 6
Stonelick (Township of) CLE 5,816 0 6 3 9 0 7
Stoutsville FAI 581 0 1 0 1 0 1
Stow SUM 32,139 0 13 11 24 0 15
Strasburg TUS 2,310 0 1 4 5 0 1
Streetsboro POR 12,311 0 10 8 18 0 14
Strongsville CUY 43,858 0 9 21 30 0 9
Struthers MAH 11,756 0 2 6 8 0 2
Suffield (Township of) POR 6,383 0 4 3 7 0 7
Sugar Creek (Township of)
ALL 1,330 0 0 2 2 0 0
Sugar Creek (Township of)
GRE 6,629 0 6 14 20 0 8
Sugar Creek (Township of)
PUT 1,156 0 1 1 2 0 1
Sugar Creek (Township of)
STA 6,740 0 3 2 5 0 3
Sugar Creek (Township of)
WAY 6,502 0 0 2 2 0 0
Summit (Township of) MOE 714 0 1 1 2 0 1
Sunbury DEL 2,630 0 1 1 2 0 2
Sunfish (Township of) PIK 1,317 0 0 1 1 0 0
Sunsbury (Township of) MOE 1,424 0 0 2 2 0 0
Superior (Township of) WIL 5,769 0 3 5 8 0 7
Sutton (Township of) MEG 3,250 0 1 1 2 0 1
Swan (Township of) VIN 796 0 1 0 1 0 2
Swan Creek (Township of)
FUL 8,461 2 4 3 9 2 7
Swanton FUL 3,307 0 1 1 2 0 1
Report generated on : 5/18/2016 11:54:25 AM Page 38 of 46
Alcohol Related Crashes by City / Village
Table 8.02 - City / Village Statistics

City / Village County Population Fatal Crashes
Injury Crashes
PDO Crashes
Total Crashes
Deaths Injuries
Swanton LUC 3,307 0 1 1 2 0 1
Swanton (Township of) LUC 3,354 0 2 2 4 0 4
Switzerland (Township of)
MOE 509 0 1 0 1 0 1
Sycamore WYA 914 0 0 1 1 0 0
Sycamore (Township of)
HAM 19,675 0 7 3 10 0 7
Sylvania LUC 18,670 0 4 12 16 0 5
Sylvania (Township of) LUC 44,253 2 13 23 38 2 22
Symmes (Township of) HAM 14,771 0 6 6 12 0 7
Tallmadge SUM 16,390 0 5 5 10 0 8
Tate (Township of) CLE 8,935 0 9 7 16 0 10
Taylor (Township of) UNI 1,444 0 1 2 3 0 1
Taylor Creek (Township of)
HAR 517 0 1 0 1 0 1
The Village of Indian Hill
HAM 5,907 0 0 1 1 0 0
Thompson (Township of)
DEL 558 0 1 0 1 0 1
Thompson (Township of)
GEA 2,383 0 6 4 10 0 6
Thompson (Township of)
SEN 1,422 0 1 1 2 0 1
Thorn (Township of) PER 3,765 0 2 2 4 0 3
Thurston FAI 555 0 1 0 1 0 1
Tiffin SEN 18,135 0 5 8 13 0 6
Tiffin (Township of) ADA 5,075 0 4 4 8 0 4
Tiffin (Township of) DEF 1,705 0 1 1 2 0 1
Tipp City MIA 9,221 0 3 4 7 0 5
Tiverton (Township of) COS 348 0 0 1 1 0 0
Toledo LUC 313,619 8 105 127 240 8 164
Toronto JEF 5,676 0 1 3 4 0 3
Townsend (Township of)
HUR 1,567 0 1 2 3 0 2
Townsend (Township of)
SAN 1,670 0 1 1 2 0 1
Trenton BUT 8,746 0 2 10 12 0 3
Trenton (Township of) DEL 2,137 0 1 1 2 0 1
Trimble ATH 466 0 1 0 1 0 1
Trimble (Township of) ATH 4,710 0 0 2 2 0 0
Trotwood MOT 27,420 0 11 16 27 0 17
Troy MIA 21,999 0 6 20 26 0 7
Troy (Township of) ASD 1,051 0 0 1 1 0 0
Report generated on : 5/18/2016 11:54:25 AM Page 39 of 46
Alcohol Related Crashes by City / Village
Table 8.02 - City / Village Statistics

City / Village County Population Fatal Crashes
Injury Crashes
PDO Crashes
Total Crashes
Deaths Injuries
Troy (Township of) ATH 2,712 0 1 1 2 0 1
Troy (Township of) DEL 2,665 0 3 2 5 0 3
Troy (Township of) GEA 2,567 0 1 4 5 0 3
Troy (Township of) MRW 1,190 0 1 0 1 0 1
Troy (Township of) RIC 6,449 0 3 4 7 0 5
Troy (Township of) WOO 4,355 0 2 3 5 0 2
Trumbull (County) TRU 225,116 0 0 1 1 0 0
Trumbull (Township of) ATB 1,461 0 0 4 4 0 0
Truro (Township of) FRA 27,151 0 0 1 1 0 0
Tully (Township of) VAN 2,119 0 0 1 1 0 0
Turtle Creek (Township of)
SHE 1,583 0 1 1 2 0 1
Turtle Creek (Township of)
WAR 12,617 0 7 11 18 0 7
Tuscarawas (Township of)
COS 1,798 1 1 4 6 1 2
Tuscarawas (Township of)
STA 6,093 0 4 3 7 0 5
Twin (Township of) DAR 3,946 0 3 0 3 0 4
Twin (Township of) PRE 2,831 0 3 2 5 0 3
Twin (Township of) ROS 3,146 1 2 4 7 1 3
Twinsburg SUM 17,006 0 9 7 16 0 11
Tymochtee (Township of)
WYA 1,186 0 1 0 1 0 1
Uhrichsville TUS 5,662 0 1 5 6 0 1
Union MOT 5,574 0 2 2 4 0 3
Union (Township of) AUG 1,870 0 1 2 3 0 1
Union (Township of) BEL 2,151 0 1 7 8 0 5
Union (Township of) BRO 3,015 0 1 2 3 0 1
Union (Township of) CAR 1,059 0 1 1 2 0 1
Union (Township of) CHP 1,920 0 1 0 1 0 1
Union (Township of) CLE 42,332 1 11 29 41 1 14
Union (Township of) CLI 14,929 1 3 2 6 1 5
Union (Township of) FAY 3,808 0 2 5 7 0 4
Union (Township of) HAN 1,726 0 3 1 4 0 3
Union (Township of) HIG 1,710 0 2 2 4 0 2
Union (Township of) KNO 2,455 0 1 1 2 0 1
Union (Township of) LAW 9,002 0 3 1 4 0 4
Union (Township of) LIC 8,339 0 2 3 5 0 3
Union (Township of) MAD 1,411 1 2 1 4 1 3
Report generated on : 5/18/2016 11:54:25 AM Page 40 of 46
Alcohol Related Crashes by City / Village
Table 8.02 - City / Village Statistics

City / Village County Population Fatal Crashes
Injury Crashes
PDO Crashes
Total Crashes
Deaths Injuries
Union (Township of) MER 1,490 0 2 0 2 0 3
Union (Township of) MIA 10,222 0 4 3 7 0 4
Union (Township of) MUS 4,359 0 1 0 1 0 1
Union (Township of) PIK 1,240 0 0 1 1 0 0
Union (Township of) PUT 2,557 0 2 1 3 0 3
Union (Township of) ROS 11,750 0 1 8 9 0 1
Union (Township of) SCI 2,105 0 1 1 2 0 1
Union (Township of) TUS 1,599 0 1 2 3 0 1
Union (Township of) VAN 1,009 0 1 1 2 0 1
Union (Township of) WAR 4,668 0 4 4 8 0 6
Unity (Township of) COL 10,294 0 3 4 7 0 4
University Heights CUY 14,146 0 2 0 2 0 5
Upper (Township of) LAW 15,648 0 5 3 8 0 5
Upper Arlington FRA 33,686 1 10 15 26 1 12
Upper Sandusky WYA 6,533 0 1 2 3 0 1
Urbana CHP 11,613 1 4 8 13 1 6
Urbana (Township of) CHP 14,968 0 5 1 6 0 6
Utica LIC 2,130 0 1 3 4 0 1
Valley (Township of) GUE 2,378 0 5 3 8 0 6
Valley (Township of) SCI 4,256 0 1 0 1 0 3
Valleyview FRA 601 0 1 0 1 0 2
Van Buren HAN 313 0 0 1 1 0 0
Van Buren (Township of)
DAR 1,573 1 1 1 3 3 4
Van Wert VAN 10,690 0 0 1 1 0 0
Van Wert (County) VAN 29,659 0 2 7 9 0 2
Vandalia MOT 14,603 0 5 17 22 0 8
Venice (Township of) SEN 1,871 1 1 0 2 1 2
Vermilion ERI 10,927 0 2 8 10 0 3
Vermilion LOR 10,927 1 1 2 4 2 2
Vermilion (Township of) ERI 9,575 0 3 4 7 0 3
Vermillion (Township of)
ASD 2,539 0 1 2 3 0 1
Vernon (Township of) CLI 2,685 0 2 3 5 0 2
Vernon (Township of) CRA 817 1 1 2 4 1 1
Vernon (Township of) SCI 1,855 0 0 1 1 0 0
Vernon (Township of) TRU 1,765 0 0 1 1 0 0
Verona PRE 430 0 0 1 1 0 0
Report generated on : 5/18/2016 11:54:25 AM Page 41 of 46
Alcohol Related Crashes by City / Village
Table 8.02 - City / Village Statistics

City / Village County Population Fatal Crashes
Injury Crashes
PDO Crashes
Total Crashes
Deaths Injuries
Versailles DAR 2,589 0 0 1 1 0 0
Vienna (Township of) TRU 4,021 0 4 3 7 0 7
Vinton (Township of) VIN 558 0 0 1 1 0 0
Violet (Township of) FAI 26,914 2 6 5 13 3 12
Wabash (Township Of) DAR 934 0 1 0 1 0 1
Wadsworth MED 18,437 0 5 8 13 0 5
Wadsworth (Township of)
MED 3,996 0 1 1 2 0 1
Wakeman HUR 951 1 1 0 2 1 1
Wakeman (Township of)
HUR 2,528 0 2 0 2 0 3
Walbridge WOO 2,546 0 0 2 2 0 0
Walnut (Township of) FAI 6,436 0 3 2 5 0 4
Walnut (Township of) GAL 924 0 0 1 1 0 0
Walnut (Township of) PIC 2,428 0 2 3 5 0 5
Walnut Creek (Township of)
HOL 3,530 0 1 1 2 0 2
Walton Hills CUY 2,400 0 2 1 3 0 2
Wapakoneta AUG 9,474 1 4 7 12 1 5
Ward (Township of) HOC 1,937 0 3 2 5 0 3
Warren TRU 46,832 0 11 15 26 0 19
Warren (Township of) BEL 5,870 1 2 1 4 1 2
Warren (Township of) JEF 4,499 0 1 3 4 0 1
Warren (Township of) TRU 7,817 0 1 7 8 0 1
Warren (Township of) TUS 1,194 0 2 3 5 0 2
Warren (Township of) WAS 4,044 0 3 4 7 0 5
Warrensville Heights CUY 15,109 0 5 6 11 0 7
Warwick (Township of) TUS 2,746 0 3 2 5 0 6
Washington (Township of)
BEL 537 0 1 0 1 0 1
Washington (Township of)
BRO 2,271 0 1 3 4 0 1
Washington (Township of)
CAR 1,061 0 2 3 5 0 2
Washington (Township of)
CLE 2,351 2 0 0 2 3 1
Washington (Township of)
CLI 1,895 0 3 1 4 0 3
Washington (Township of)
COL 2,380 0 0 1 1 0 0
Washington (Township of)
COS 629 0 1 0 1 0 1
Washington (Township of)
DAR 1,382 1 1 1 3 2 2
Washington (Township of)
DEF 1,521 0 2 2 4 0 2
Report generated on : 5/18/2016 11:54:25 AM Page 42 of 46
Alcohol Related Crashes by City / Village
Table 8.02 - City / Village Statistics

City / Village County Population Fatal Crashes
Injury Crashes
PDO Crashes
Total Crashes
Deaths Injuries
Washington (Township of)
FRA 1,412 0 1 2 3 0 1
Washington (Township of)
GUE 491 0 1 0 1 0 2
Washington (Township of)
HAN 4,602 0 4 0 4 0 7
Washington (Township of)
HAS 598 0 0 1 1 0 0
Washington (Township of)
HEN 2,021 0 1 2 3 0 1
Washington (Township of)
HIG 1,048 0 1 0 1 0 5
Washington (Township of)
HOL 1,614 1 2 0 3 1 3
Washington (Township of)
JAC 743 0 1 0 1 0 1
Washington (Township of)
LIC 3,045 0 2 1 3 0 2
Washington (Township of)
LOG 3,945 0 3 1 4 0 7
Washington (Township of)
LUC 3,574 0 1 0 1 0 5
Washington (Township of)
MER 1,218 0 2 2 4 0 3
Washington (Township of)
MIA 1,803 2 1 9 12 2 1
Washington (Township of)
MOT 52,991 0 10 18 28 0 12
Washington (Township of)
MRW 1,227 1 1 1 3 1 1
Washington (Township of)
MUS 4,284 1 5 3 9 1 7
Washington (Township of)
PIC 2,951 0 2 2 4 0 2
Washington (Township of)
PRE 2,104 0 1 3 4 0 1
Washington (Township of)
RIC 6,777 0 4 6 10 0 4
Washington (Township of)
SAN 2,396 0 3 4 7 0 3
Washington (Township of)
SCI 5,971 0 1 8 9 0 1
Washington (Township of)
SHE 2,083 1 3 3 7 1 3
Washington (Township of)
STA 4,791 0 6 4 10 0 7
Washington (Township of)
WAR 1,855 1 4 2 7 1 7
Washington (Township of)
WOO 1,688 0 1 1 2 0 1
Washington Court House
FAY 13,524 0 6 6 12 0 8
Waterford (Township of)
WAS 3,708 0 1 0 1 0 1
Waterloo (Township of) ATH 2,605 0 1 0 1 0 1
Watertown (Township of)
WAS 1,563 1 0 1 2 1 0
Waterville LUC 4,828 0 2 0 2 0 4
Report generated on : 5/18/2016 11:54:25 AM Page 43 of 46
Alcohol Related Crashes by City / Village
Table 8.02 - City / Village Statistics

City / Village County Population Fatal Crashes
Injury Crashes
PDO Crashes
Total Crashes
Deaths Injuries
Waterville (Township of)
LUC 9,469 0 1 2 3 0 1
Wauseon FUL 7,091 0 1 1 2 0 1
Waverly PIK 4,433 0 2 2 4 0 2
Wayne (Township of) ADA 1,273 0 0 4 4 0 0
Wayne (Township of) AUG 1,591 0 1 0 1 0 1
Wayne (Township of) BEL 624 0 0 3 3 0 0
Wayne (Township of) BUT 4,252 2 2 4 8 2 3
Wayne (Township of) CHP 1,660 0 0 1 1 0 0
Wayne (Township of) CLE 5,025 1 2 1 4 1 2
Wayne (Township of) CLI 737 0 0 1 1 0 0
Wayne (Township of) COL 785 0 1 0 1 0 1
Wayne (Township of) FAY 1,367 0 2 1 3 0 4
Wayne (Township of) JEF 2,233 0 1 3 4 0 2
Wayne (Township of) MUS 4,455 0 3 4 7 0 4
Wayne (Township of) NOB 507 1 0 0 1 1 0
Wayne (Township of) WAR 7,250 1 4 3 8 1 4
Wayne (Township of) WAY 4,034 0 1 5 6 0 1
Waynesburg STA 1,003 0 1 1 2 0 1
Weathersfield (Township of)
TRU 27,717 0 12 5 17 0 14
Webster (Township of) WOO 1,277 0 2 2 4 0 2
Wellington LOR 4,511 1 0 2 3 1 1
Wellington (Township of)
LOR 5,904 0 3 0 3 0 4
Wells (Township of) JEF 3,130 0 1 1 2 0 1
Wellston JAC 6,078 0 0 1 1 0 0
West (Township of) COL 3,351 0 1 2 3 0 1
West Alexandria PRE 1,395 0 0 1 1 0 0
West Carrollton MOT 13,818 0 10 12 22 0 12
West Chester (Township of) AKA Union Township
BUT 54,895 1 21 30 52 1 35
West Jefferson (corporate name Jefferson)
MAD 4,331 0 3 3 6 0 4
West Liberty LOG 1,813 0 2 1 3 0 2
West Milton MIA 4,645 0 1 2 3 0 1
West Unity WIL 1,790 0 0 1 1 0 0
Westerville DEL 35,318 0 1 4 5 0 1
Westerville FRA 35,318 0 5 8 13 0 8
Report generated on : 5/18/2016 11:54:26 AM Page 44 of 46
Alcohol Related Crashes by City / Village
Table 8.02 - City / Village Statistics

City / Village County Population Fatal Crashes
Injury Crashes
PDO Crashes
Total Crashes
Deaths Injuries
Westfield (Township of) MED 4,172 0 5 4 9 0 5
Westfield (Township of) MRW 1,100 0 1 0 1 0 1
Westlake CUY 31,719 0 11 21 32 0 16
Westland (Township of) GUE 1,931 0 1 1 2 0 1
Weston WOO 1,659 0 1 1 2 0 1
Weston (Township of) WOO 2,274 0 1 1 2 0 2
Wheeling (Township of) BEL 1,477 0 4 6 10 0 4
Wheeling (Township of) GUE 752 0 5 0 5 0 6
Whetstone (Township of)
CRA 2,365 0 1 2 3 0 1
White Eyes (Township of)
COS 1,078 0 0 1 1 0 0
Whitehall FRA 19,201 0 16 15 31 0 21
Whitehouse LUC 2,733 0 3 1 4 0 4
Whitewater (Township of)
HAM 5,564 2 3 6 11 2 5
Wickliffe LAK 13,484 1 7 5 13 1 8
Willard HUR 6,806 0 0 4 4 0 0
Williamsburg CLE 2,358 0 2 2 4 0 3
Williamsburg (Township of)
CLE 5,005 0 1 3 4 0 1
Williamsfield (Township of)
ATB 1,683 1 2 1 4 1 6
Willoughby LAK 22,621 0 9 17 26 0 12
Willoughby Hills LAK 8,595 0 5 7 12 0 10
Willowick LAK 14,361 0 6 10 16 0 8
Wills (Township of) GUE 1,567 0 3 5 8 0 7
Willshire VAN 463 0 1 0 1 0 1
Willshire (Township of) VAN 1,719 0 0 1 1 0 0
Wilmington CLI 11,921 0 1 5 6 0 1
Wilson (Township of) CLI 581 0 1 0 1 0 1
Winchester ADA 1,025 0 0 2 2 0 0
Windham POR 2,806 0 4 0 4 0 4
Windham (Township of) POR 2,060 2 0 1 3 2 1
Windsor (Township of) ATB 1,932 0 2 0 2 0 2
Windsor (Township of) LAW 2,127 0 5 2 7 0 5
Windsor (Township of) MRG 1,951 0 1 2 3 0 1
Wintersville JEF 4,067 0 0 4 4 0 0
Woodlawn HAM 2,816 0 2 2 4 0 3
Woodmere CUY 828 0 0 1 1 0 0
Report generated on : 5/18/2016 11:54:26 AM Page 45 of 46
Alcohol Related Crashes by City / Village
Table 8.02 - City / Village Statistics

City / Village County Population Fatal Crashes
Injury Crashes
PDO Crashes
Total Crashes
Deaths Injuries
Woodsfield MOE 2,598 0 0 1 1 0 0
Woodville SAN 1,977 0 1 3 4 0 1
Woodville (Township of)
SAN 3,304 0 1 0 1 0 2
Wooster WAY 24,811 0 3 10 13 0 3
Wooster (Township of) WAY 5,250 0 1 2 3 0 1
Worthington FRA 14,125 0 1 14 15 0 1
Worthington (Township of)
RIC 2,791 0 3 5 8 0 3
Wyoming HAM 8,261 0 2 1 3 0 4
Xenia GRE 24,164 0 9 20 29 0 17
Xenia (Township of) GRE 6,117 0 3 3 6 0 3
Yellow Creek (Township of)
COL 2,185 0 1 1 2 0 1
York (Township of) ATH 7,740 0 2 2 4 0 2
York (Township of) BEL 2,648 0 0 1 1 0 0
York (Township of) DAR 523 0 0 1 1 0 0
York (Township of) FUL 4,203 0 1 1 2 0 2
York (Township of) MED 2,912 0 6 2 8 0 6
York (Township of) SAN 2,512 1 2 3 6 1 2
York (Township of) TUS 1,292 0 1 1 2 0 1
York (Township of) UNI 1,174 0 2 3 5 0 2
Yorkville JEF 1,230 0 1 0 1 0 1
Youngstown MAH 82,026 2 16 11 29 2 26
Zane (Township of) LOG 968 0 0 1 1 0 0
Zanesville MUS 25,586 0 14 41 55 0 19
Zoar TUS 193 0 1 0 1 0 1
Report generated on : 5/18/2016 11:54:26 AM Page 46 of 46
Alcohol Related Crashes by City / Village
Table 8.02 - City / Village Statistics