T. N. Krishnamurti - nhc.noaa.gov · T. N. Krishnamurti Department of Earth ,Ocean and Atmospheric...
55
Authors: T.N.Krishnamurti and Amit Bhardwaj T. N. Krishnamurti Department of Earth ,Ocean and Atmospheric Science FLORIDA STATE UNIVERSITY 67 th IHC/Tropical Cyclone Research Mar 7 2013 1
Transcript of T. N. Krishnamurti - nhc.noaa.gov · T. N. Krishnamurti Department of Earth ,Ocean and Atmospheric...
Authors: T.N.Krishnamurti and Amit Bhardwaj
T. N. Krishnamurti Department of Earth ,Ocean and Atmospheric Science
FLORIDA STATE UNIVERSITY
67th IHC/Tropical Cyclone Research Mar 7 2013
1
ABSTRACT This work entails an improvement of the SHIPS algorithm by bringing into the predictors some dynamical parameters (derived from HWRF forecast of hurricanes) from the output in addition to the statistical state variables of SHIPS. We include all of the named storms of the 2012 hurricane season for the Atlantic basin. We have explored various post processing methods to examine the impacts of the post processed dynamical variables. In this context we have included the intensity forecasts from SPICE (SPC3). The dynamical variables are shown to add to the skills of SHIPS and SPICE (SPC3).
2
SHIPS
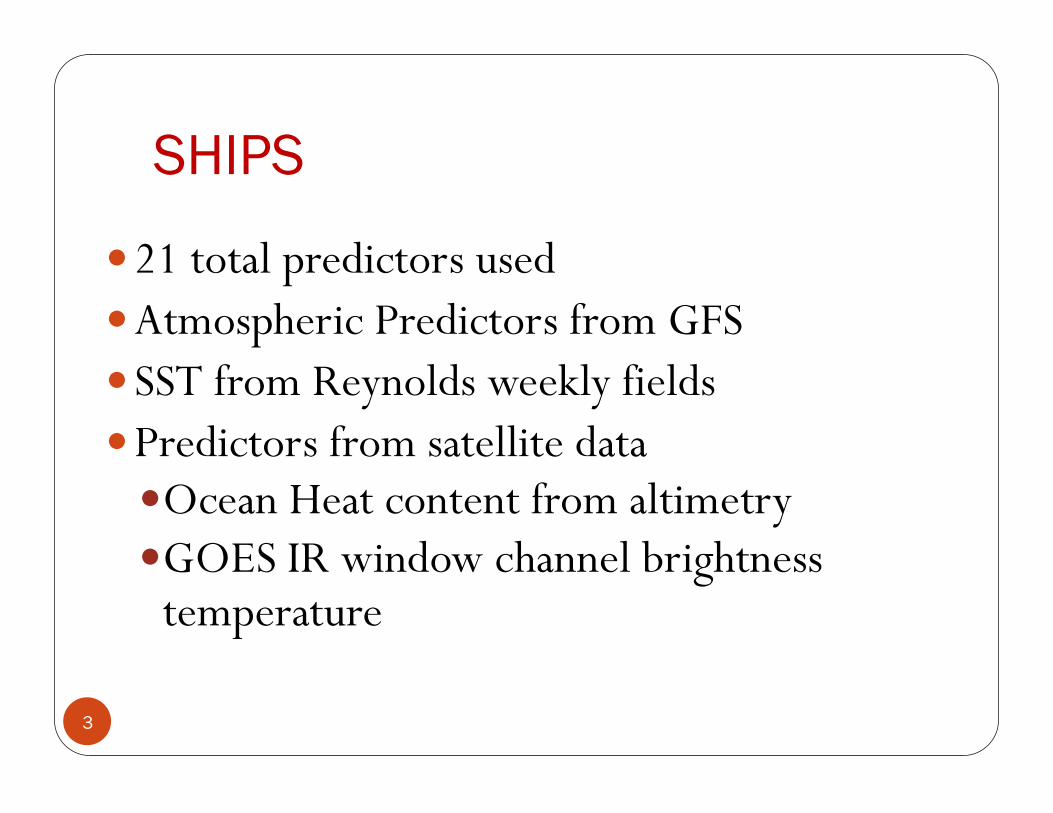
21 total predictors used Atmospheric Predictors from GFS SST from Reynolds weekly fields Predictors from satellite data Ocean Heat content from altimetry GOES IR window channel brightness
temperature
3
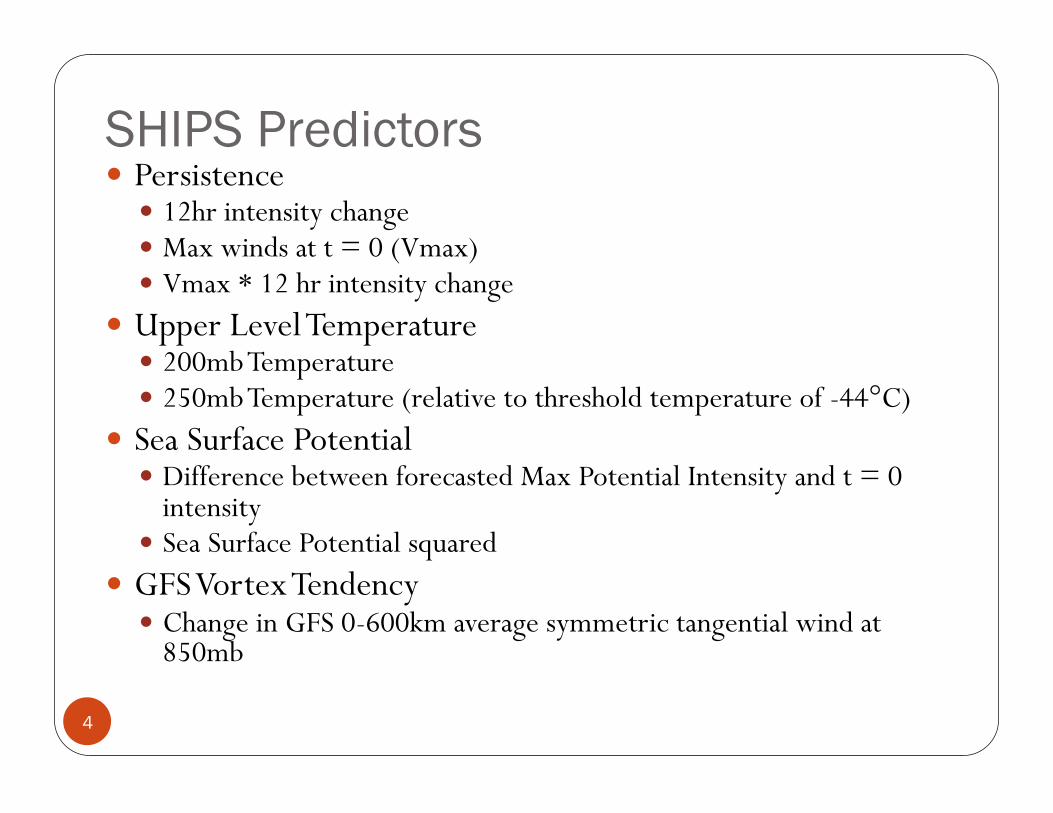
SHIPS Predictors Persistence
12hr intensity change Max winds at t = 0 (Vmax) Vmax * 12 hr intensity change
Upper Level Temperature 200mb Temperature 250mb Temperature (relative to threshold temperature of -44°C)
Sea Surface Potential Difference between forecasted Max Potential Intensity and t = 0
intensity Sea Surface Potential squared
GFS Vortex Tendency Change in GFS 0-600km average symmetric tangential wind at
850mb
4
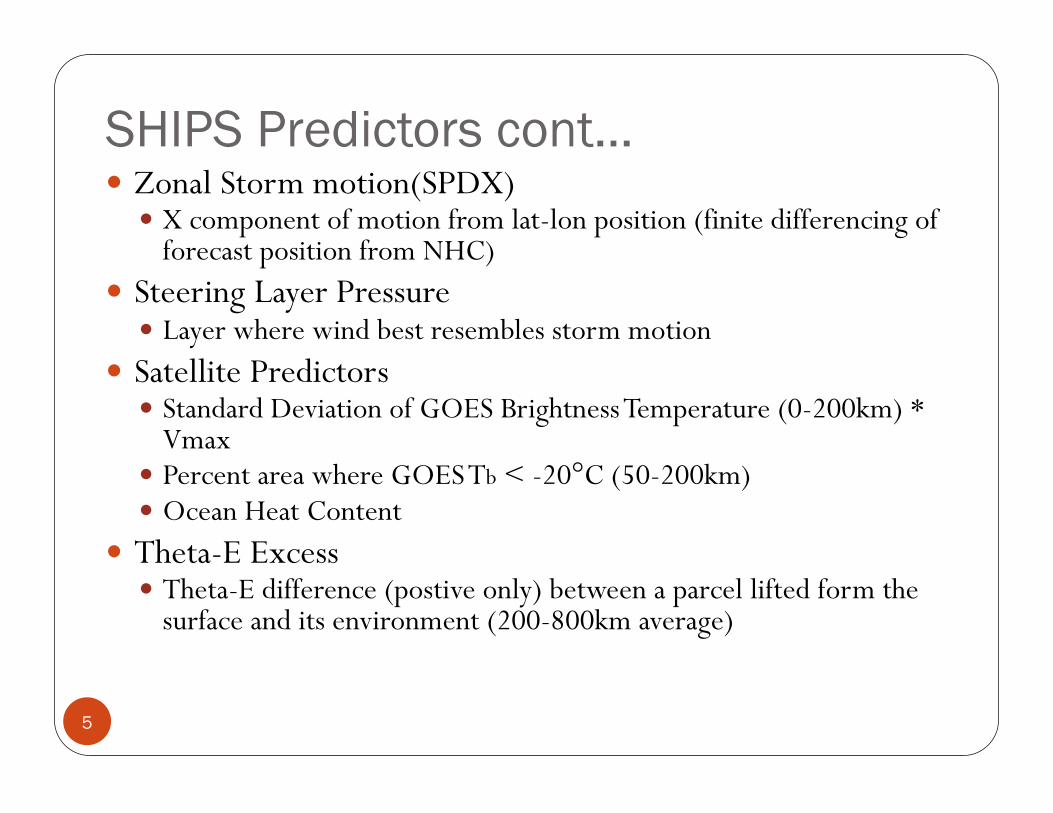
SHIPS Predictors cont… Zonal Storm motion(SPDX)
X component of motion from lat-lon position (finite differencing of forecast position from NHC)
Steering Layer Pressure Layer where wind best resembles storm motion
Satellite Predictors Standard Deviation of GOES Brightness Temperature (0-200km) *
Vmax Percent area where GOES Tb < -20°C (50-200km) Ocean Heat Content
Theta-E Excess Theta-E difference (postive only) between a parcel lifted form the
surface and its environment (200-800km average)
5
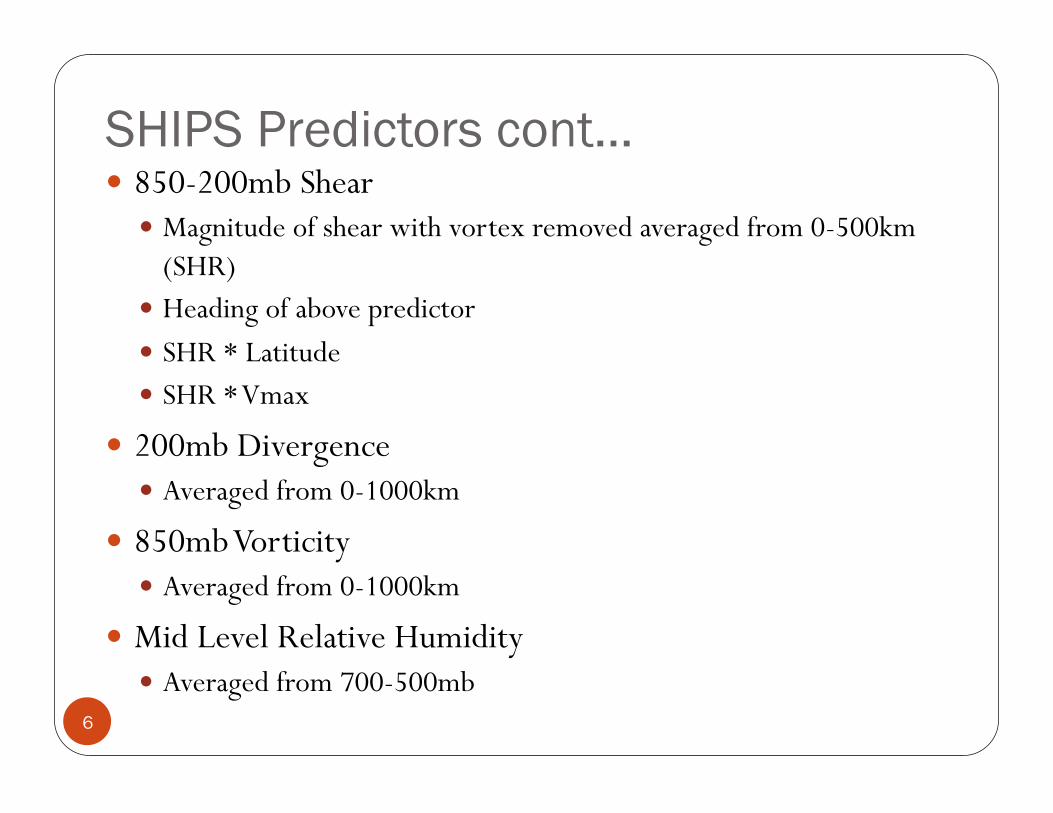
SHIPS Predictors cont… 850-200mb Shear
Magnitude of shear with vortex removed averaged from 0-500km (SHR)
Heading of above predictor SHR * Latitude SHR * Vmax
200mb Divergence Averaged from 0-1000km
850mb Vorticity Averaged from 0-1000km
Mid Level Relative Humidity Averaged from 700-500mb
6
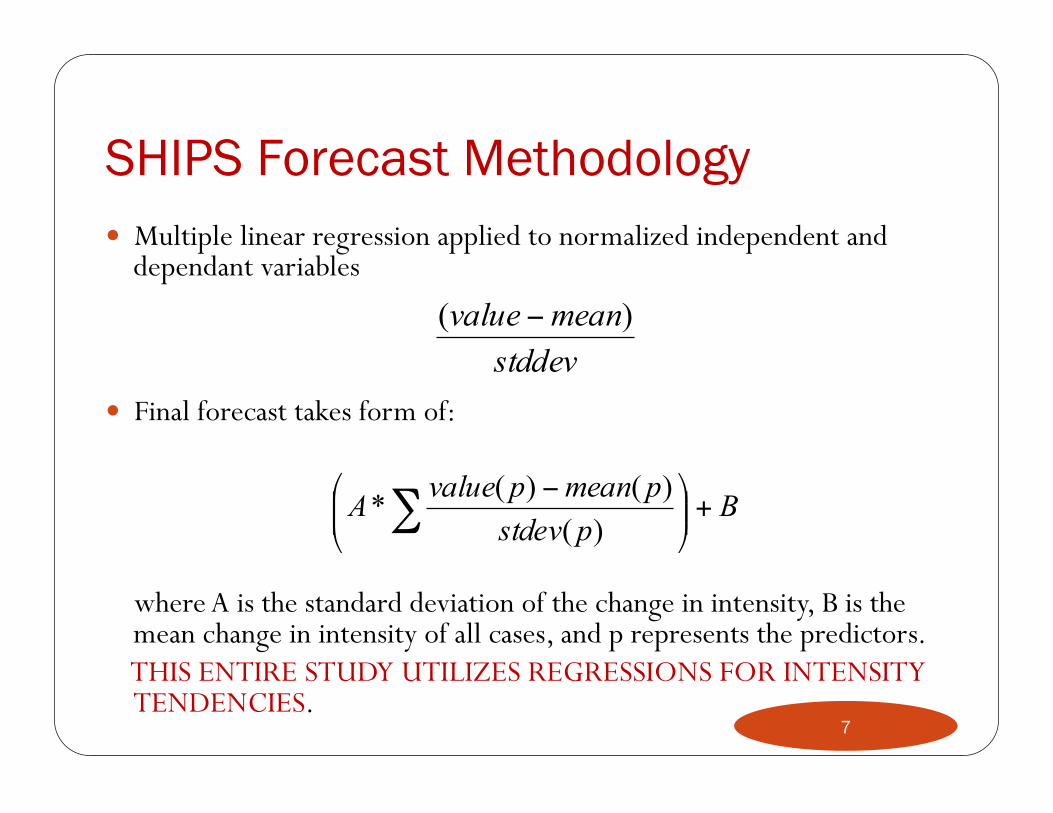
SHIPS Forecast Methodology Multiple linear regression applied to normalized independent and
dependant variables
Final forecast takes form of: where A is the standard deviation of the change in intensity, B is the
mean change in intensity of all cases, and p represents the predictors. THIS ENTIRE STUDY UTILIZES REGRESSIONS FOR INTENSITY
TENDENCIES.
stddevmeanvalue )( −
Bpstdev
pmeanpvalueA +⎟⎟⎠
⎞⎜⎜⎝
⎛ −∑ )(
)()(*
7
SPICE (Statistical Prediction of Intensity from a Consensus Ensemble) has been developed as a combination of the official SHIPS and LGEM (logistic growth equation model) intensity guidance, as well as SHIPS and LGEM runs based of the large-scale environments in the GFDL and HWRF regional models. The six total forecasts are combined into two unweighted consensuses: one from the three SHIPS forecasts and one from the three LGEM forecasts. The two unweighted consensuses are then combined into one weighted consensus, with the weights determined empirically from the 2010-2011 official SHIPS and LGEM sample. These weights favored the SHIPS consensus in the early time periods, shifting to the LGEM consensus being weighted more heavily after about 36 hours. Retrospective tests of SPICE over the 2010-2011 Atlantic hurricane seasons indicated that SPICE outperformed both SHIPS and LGEM at all lead times, and the improvements were statistically significant at almost all times.
8
DATA SETS USED FOR FSU DIAGNOSTICS:
The data sets we used for the extended SHIPS were based on a reanalysis that was provided to us by the HWRF group. It carried the following steps: 1. Start with GFS analysis at T382L64 , transform grid separation roughly 35 km
2. Remove vortex from GFS using GFDL method, Kurihara et al
3. Use HWRF's 12 hour forecast as a first guess to redefine a new initial vortex
4. Use above within GFS to re-assimilate that vortex along with the dropwindsonde data sets.
9
10
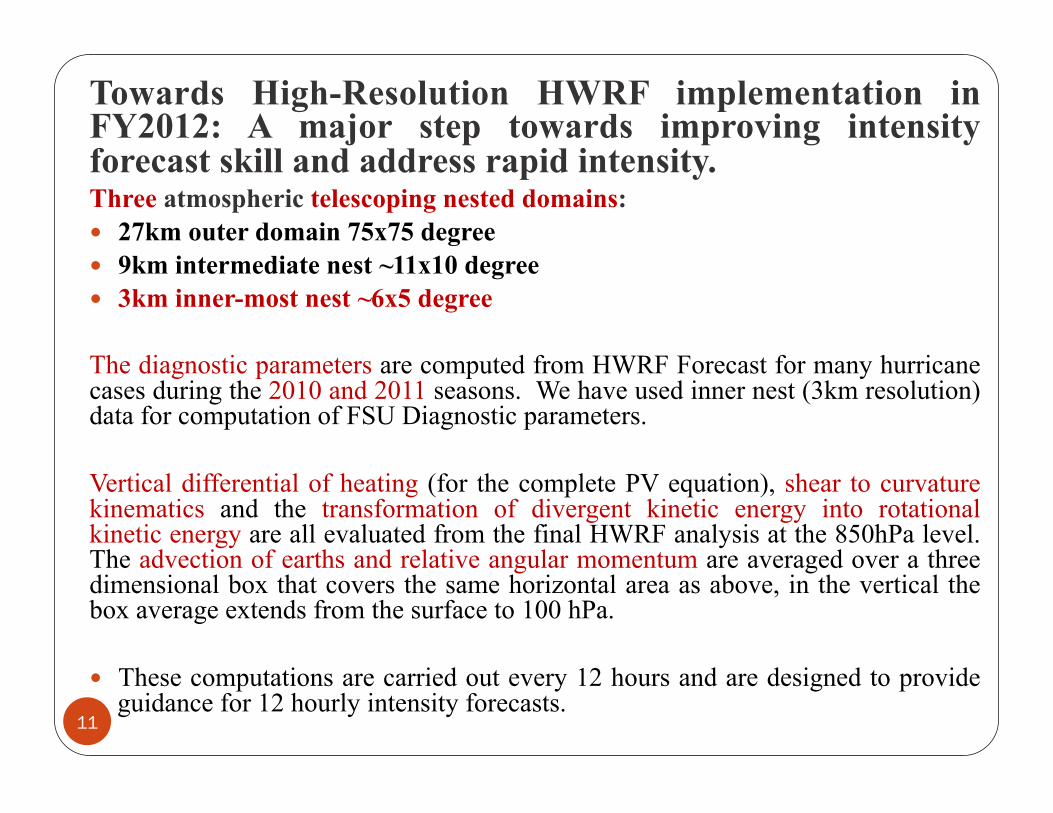
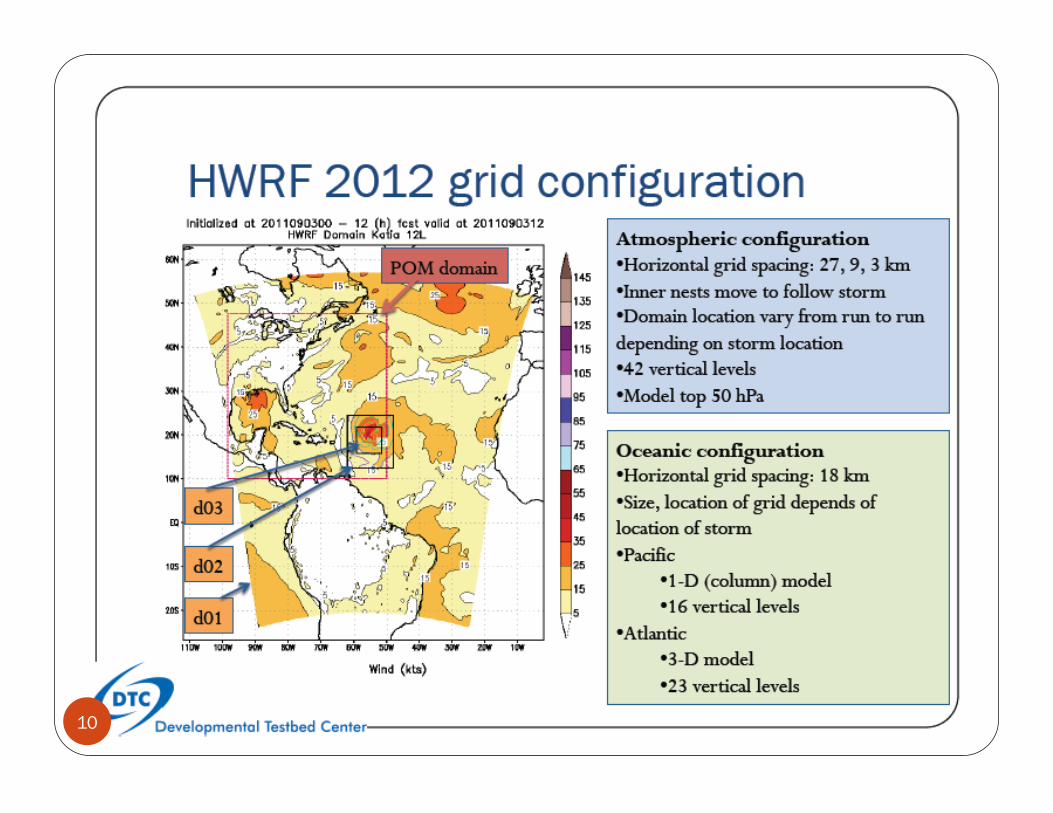
Towards High-Resolution HWRF implementation in FY2012: A major step towards improving intensity forecast skill and address rapid intensity. Three atmospheric telescoping nested domains: 27km outer domain 75x75 degree 9km intermediate nest ~11x10 degree 3km inner-most nest ~6x5 degree The diagnostic parameters are computed from HWRF Forecast for many hurricane cases during the 2010 and 2011 seasons. We have used inner nest (3km resolution) data for computation of FSU Diagnostic parameters. Vertical differential of heating (for the complete PV equation), shear to curvature kinematics and the transformation of divergent kinetic energy into rotational kinetic energy are all evaluated from the final HWRF analysis at the 850hPa level. The advection of earths and relative angular momentum are averaged over a three dimensional box that covers the same horizontal area as above, in the vertical the box average extends from the surface to 100 hPa. These computations are carried out every 12 hours and are designed to provide
guidance for 12 hourly intensity forecasts.
11

List of FSU Diagnostic Parameters
1. Vertical Differential of Heating
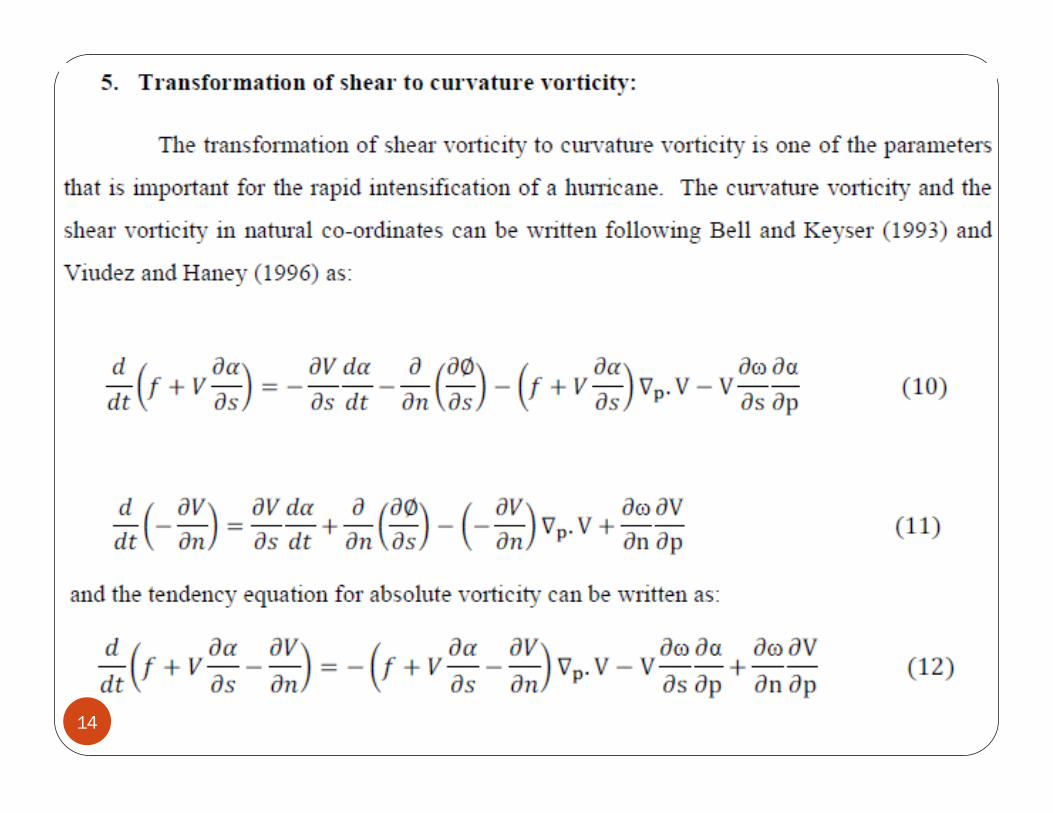
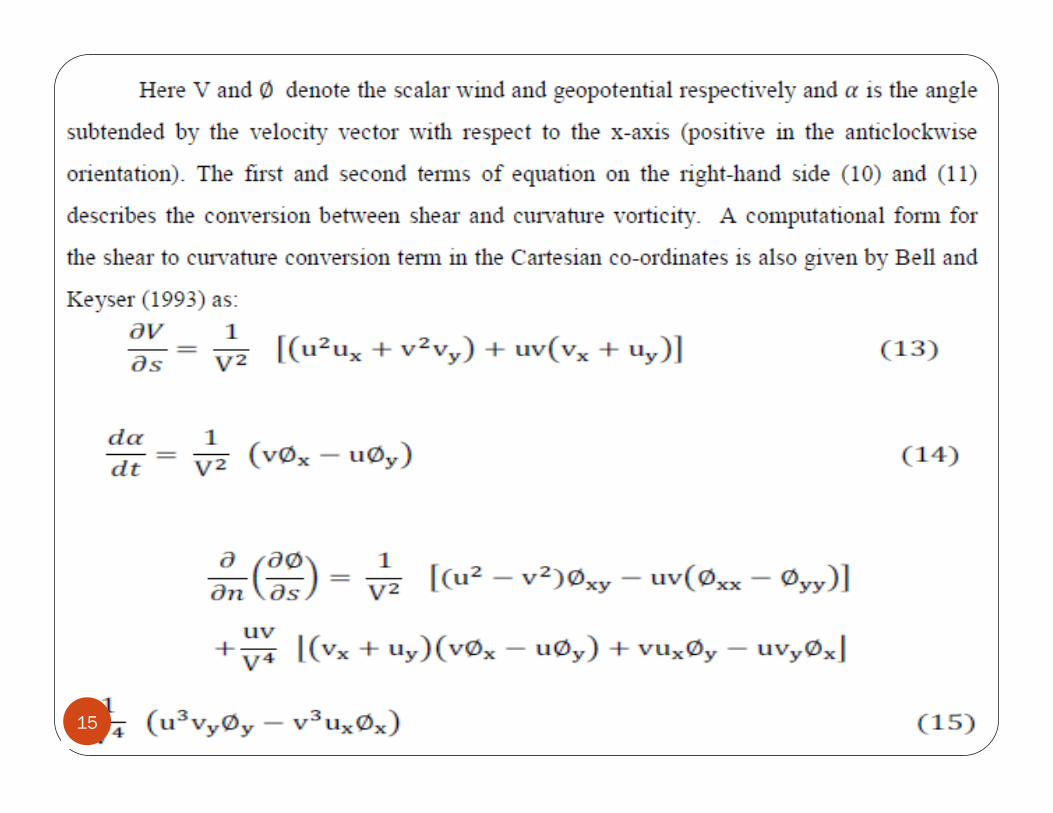
2. Transformation of Shear to Curvature Vorticity
3. Energy Exchange from the Divergent to the Rotational Kinetic Energy in the Inner Core
4. Angular Momentum
12

Shear to curvature
13
14
15
16
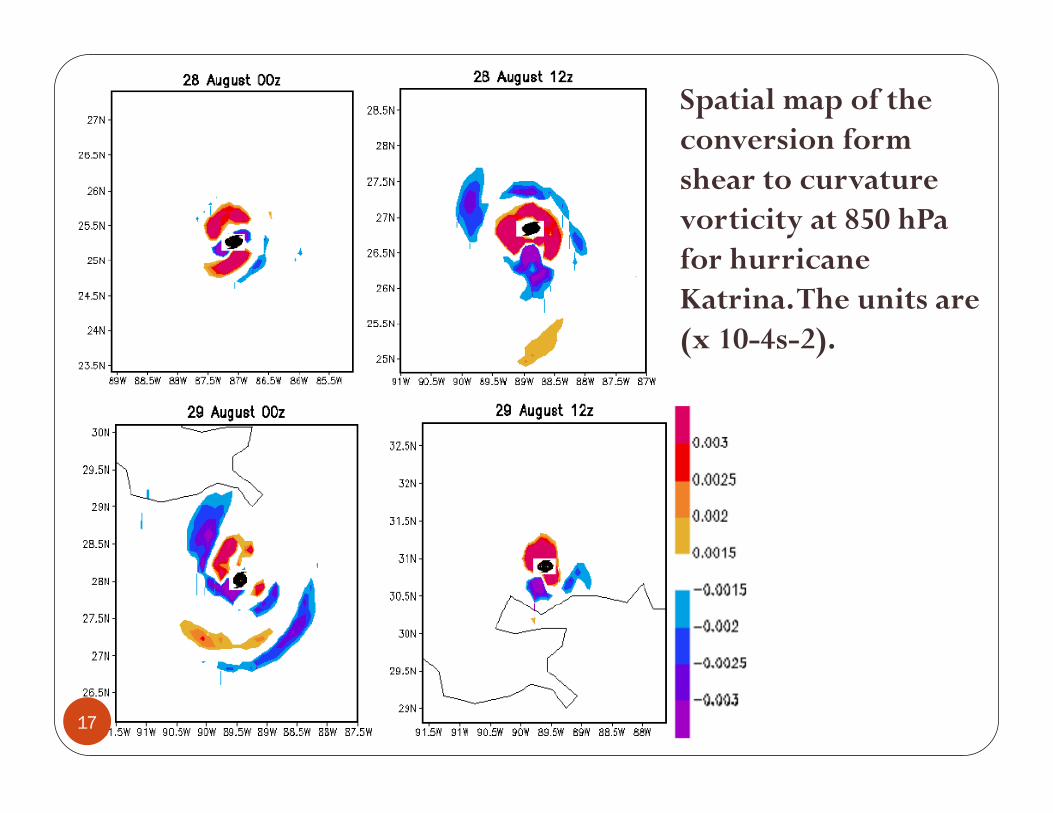
Spatial map of the conversion form shear to curvature vorticity at 850 hPa for hurricane Katrina. The units are (x 10-4s-2).
17
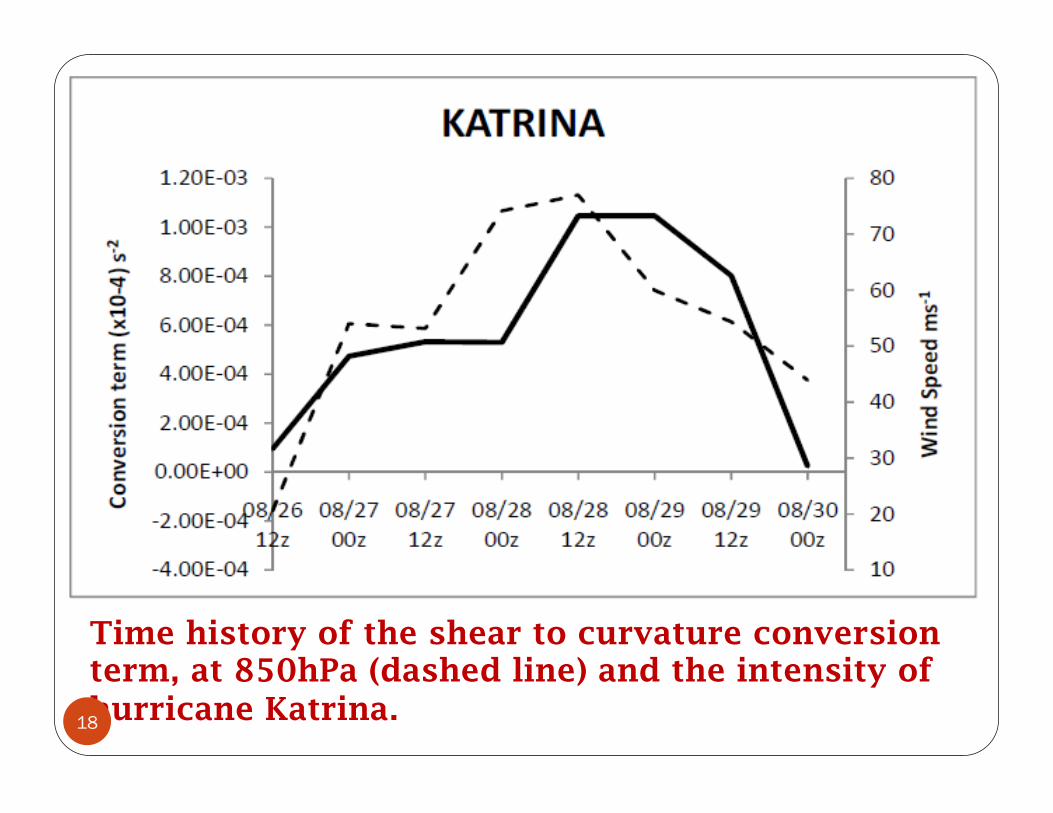
Time history of the shear to curvature conversion term, at 850hPa (dashed line) and the intensity of hurricane Katrina. 18
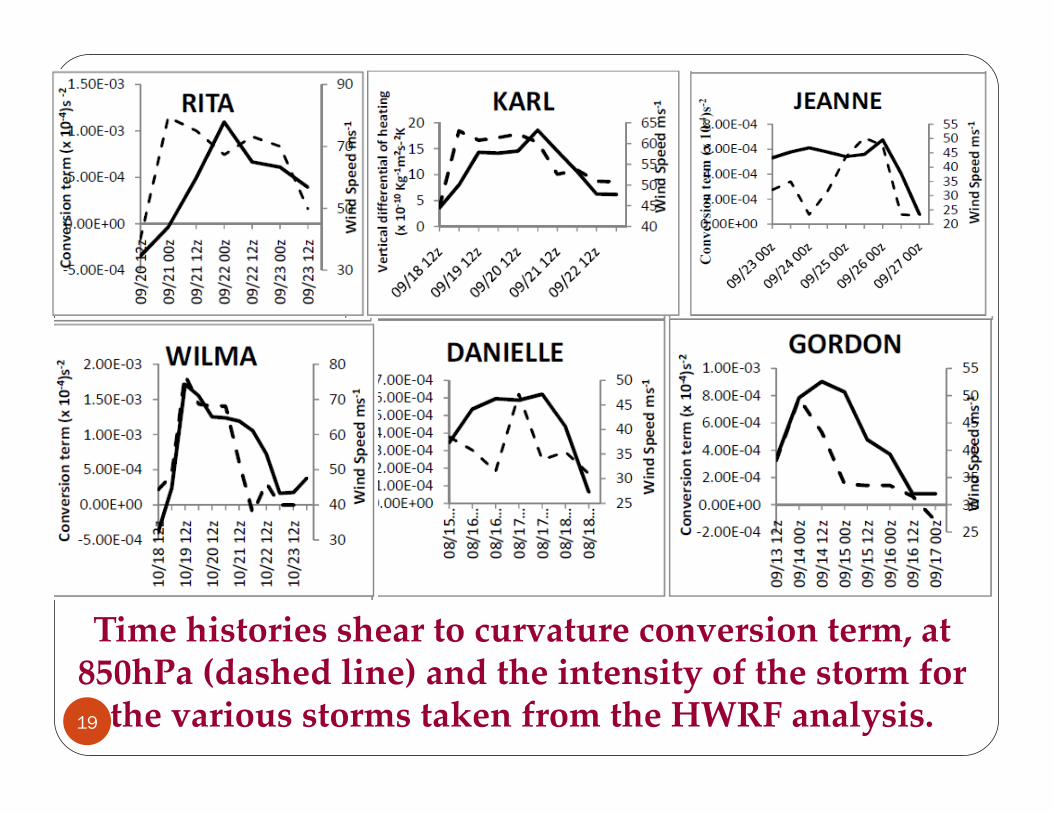
Time histories shear to curvature conversion term, at 850hPa (dashed line) and the intensity of the storm for
the various storms taken from the HWRF analysis.!19

Diabatic Potential Vorticity over the Global Tropics
20
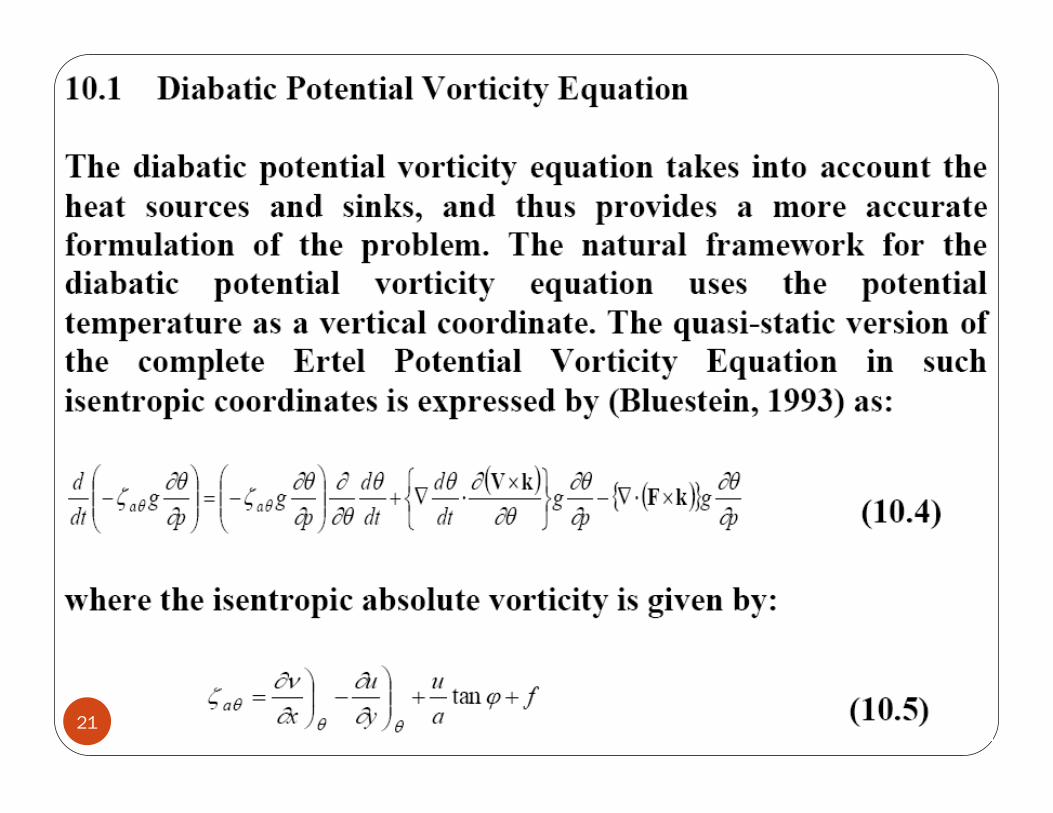
21
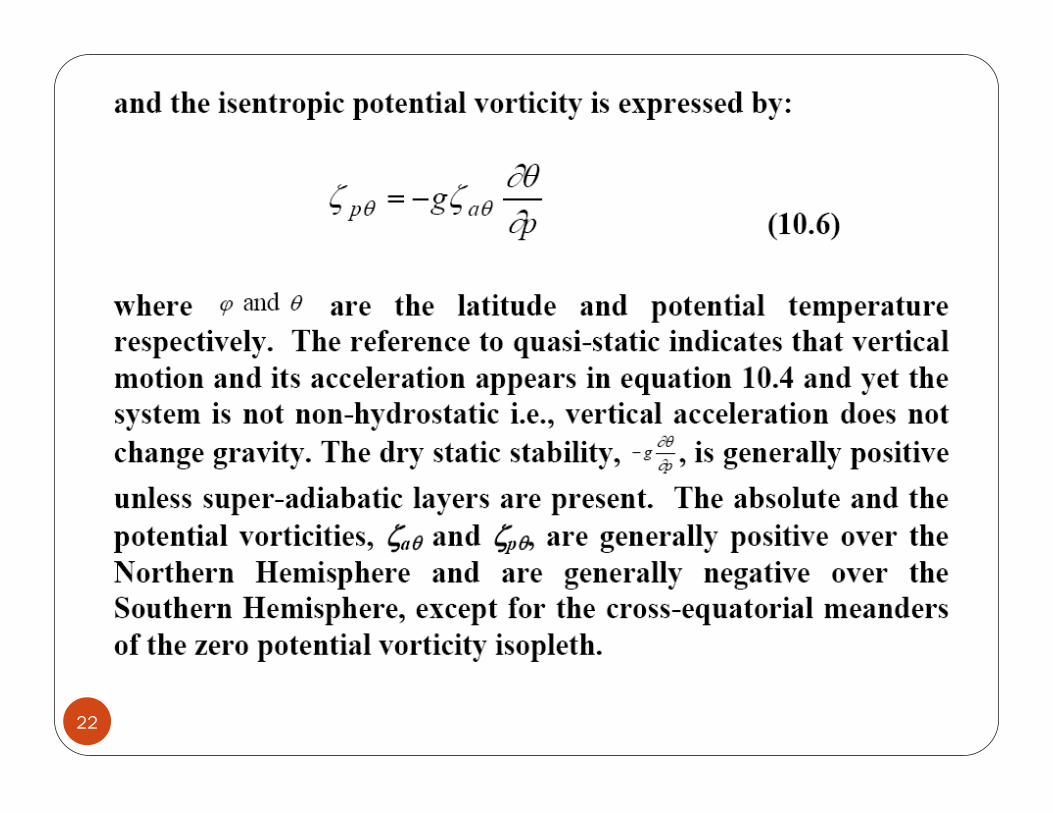
22
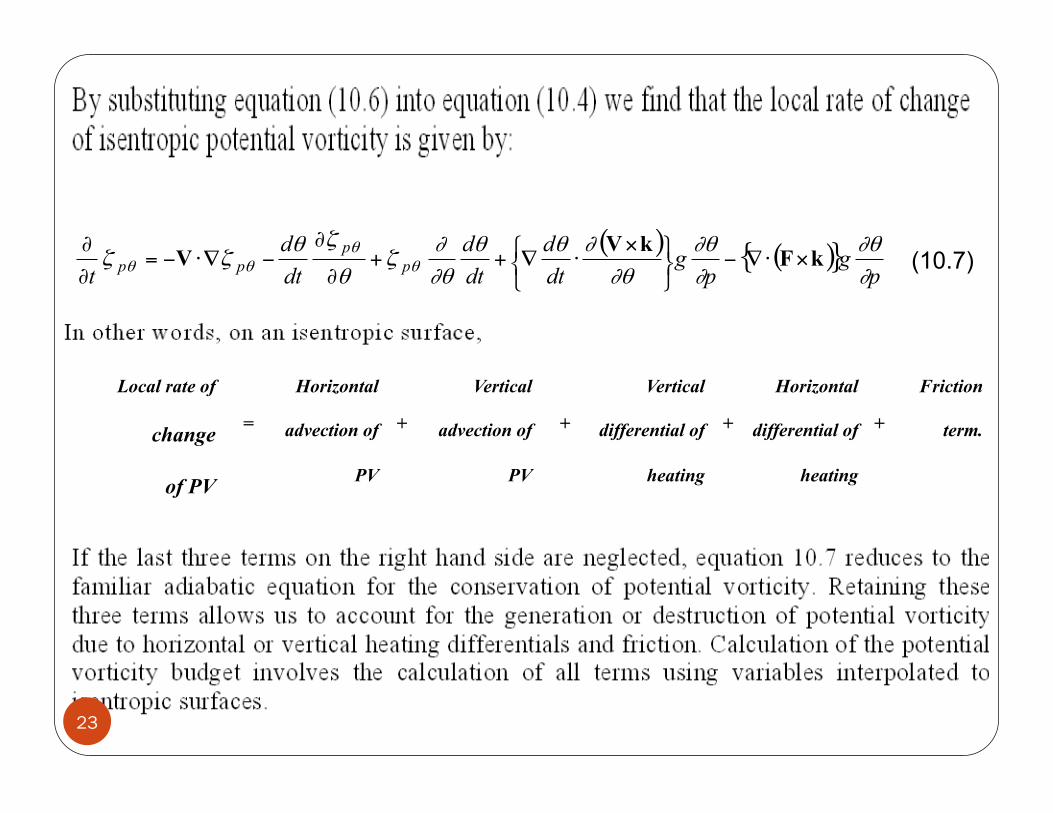
( ) ( ){ }p
gp
gdtd
dtd
dtd
t pp
pp ∂∂θ
∂∂θ
∂θ∂θθ
∂θ∂
ζθ
ζθζζ θ
θθθ kFkVV ×⋅∇−
⎭⎬⎫
⎩⎨⎧ ×
⋅∇++∂
∂−∇⋅−=
∂
∂(10.7)
Local rate of
change
of PV
=
Horizontal
advection of
PV
+
Vertical
advection of
PV
+
Vertical
differential of
heating
+
Horizontal
differential of
heating
+
Friction
term.
23
24
25
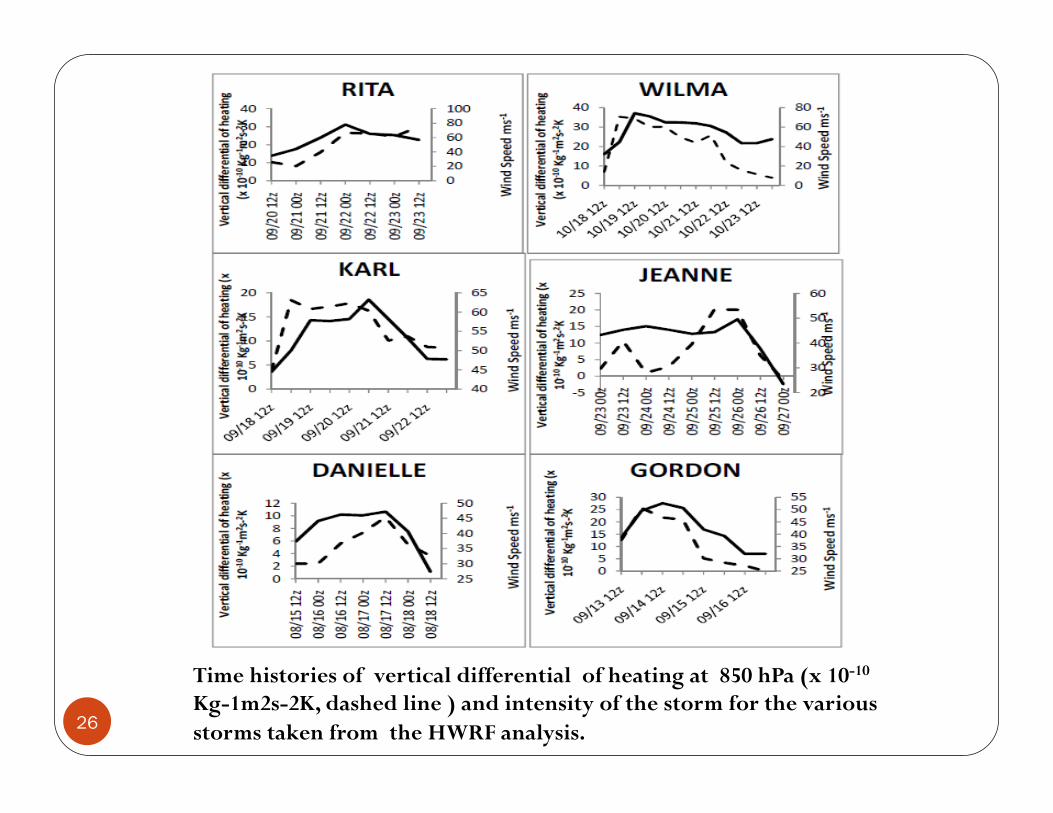
Time histories of vertical differential of heating at 850 hPa (x 10-10 Kg-1m2s-2K, dashed line ) and intensity of the storm for the various storms taken from the HWRF analysis. 26
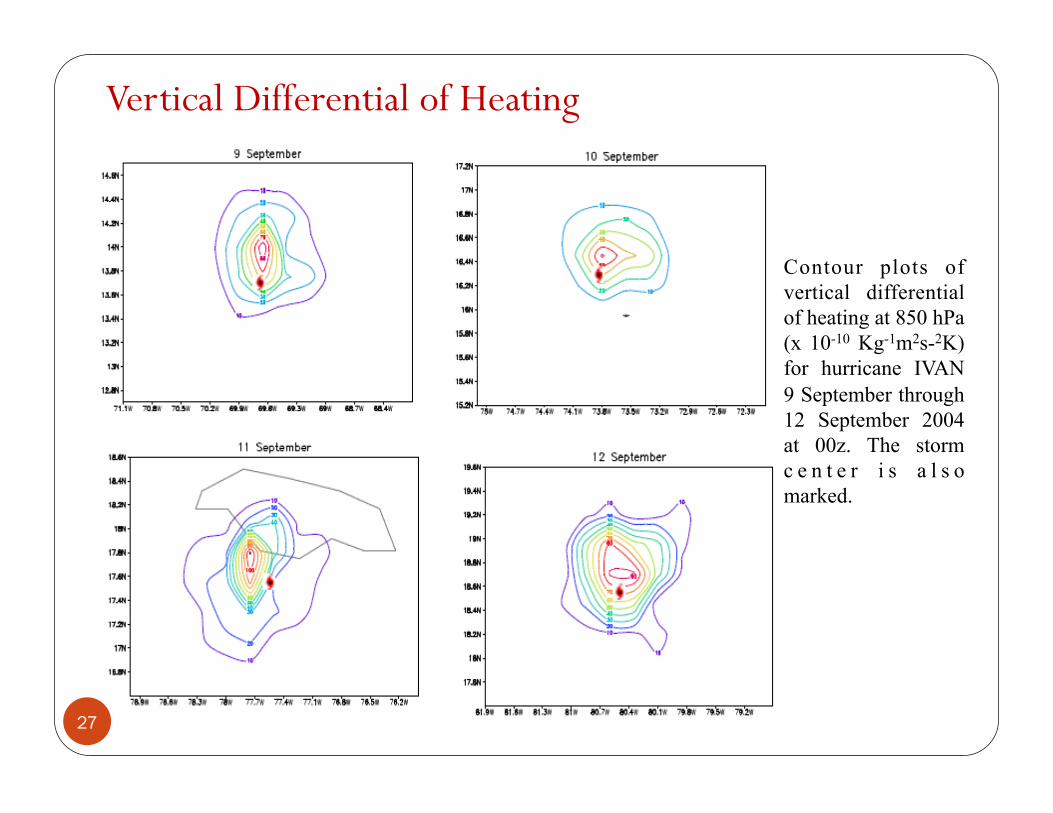
Vertical Differential of Heating
Contour plots of vertical differential of heating at 850 hPa (x 10-10 Kg-1m2s-2K) for hurricane IVAN 9 September through 12 September 2004 at 00z. The storm c e n t e r i s a l s o marked.
27
Psi –Chi interaction
28
29
30
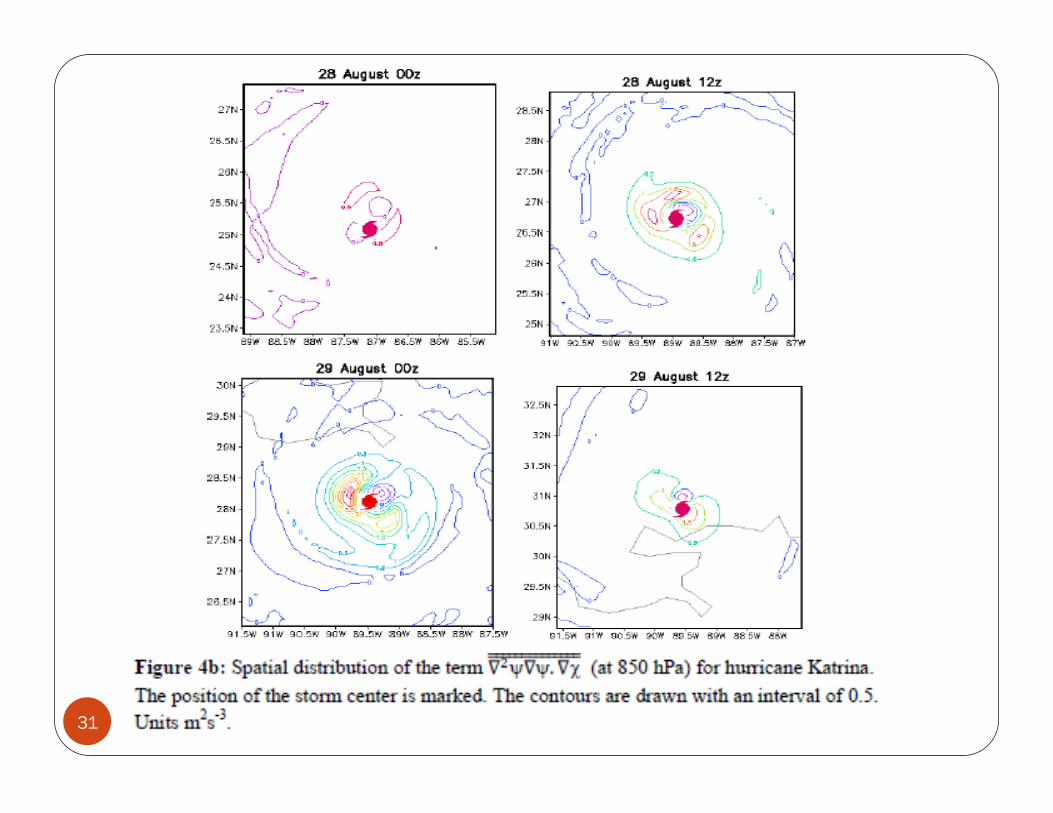
31
30
35
40
45
50
55
60
08/22 12Z
08/23 00Z
08/23 12Z
08/24 00Z
08/24 12Z
08/25 00Z
08/25 12Z
08/26 00Z
08/26 12Z
08/27 00Z
08/27 12Z
Inte
nsit
y (K
NO
TS)
Dates
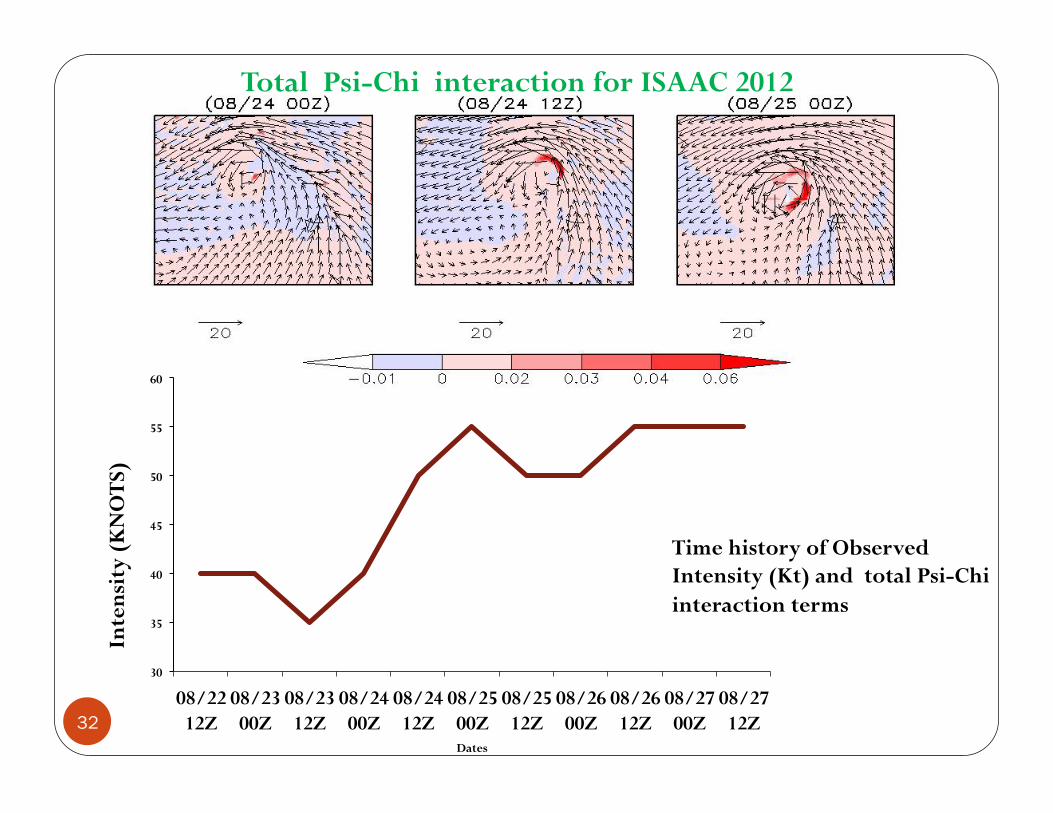
Time history of Observed Intensity (Kt) and total Psi-Chi interaction terms
Total Psi-Chi interaction for ISAAC 2012
32

Angular Momentum
33
34
35
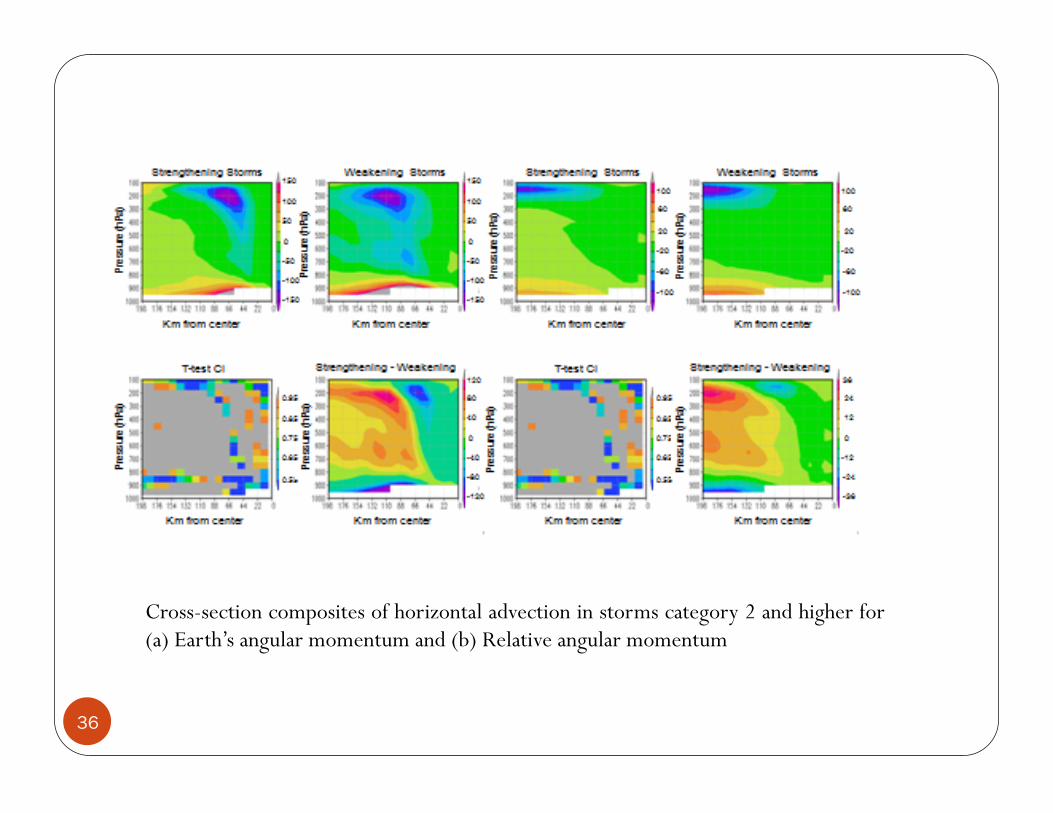
Cross-section composites of horizontal advection in storms category 2 and higher for (a) Earth’s angular momentum and (b) Relative angular momentum
36
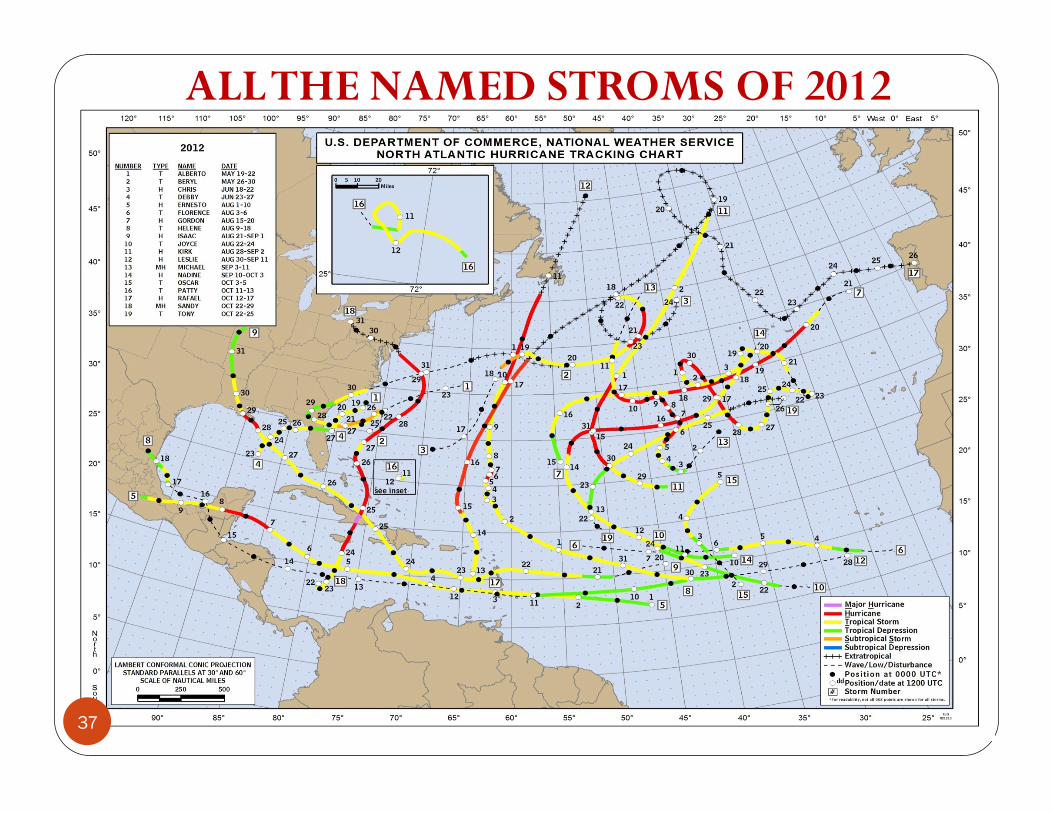
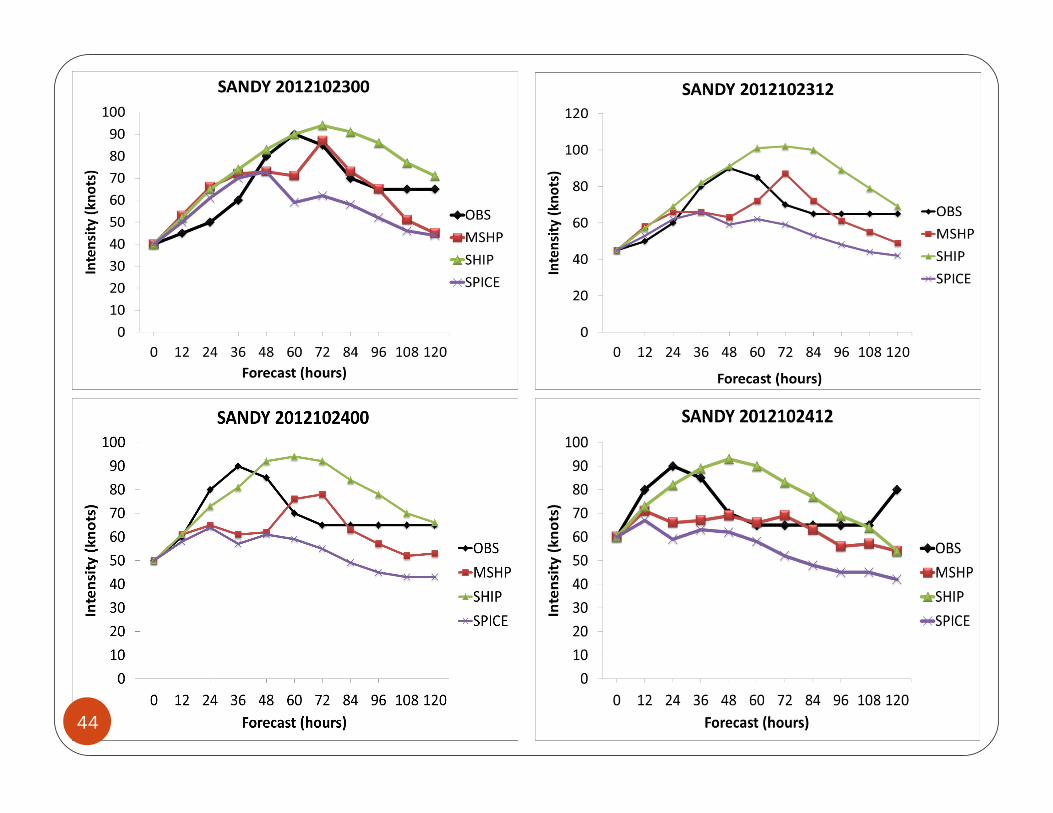
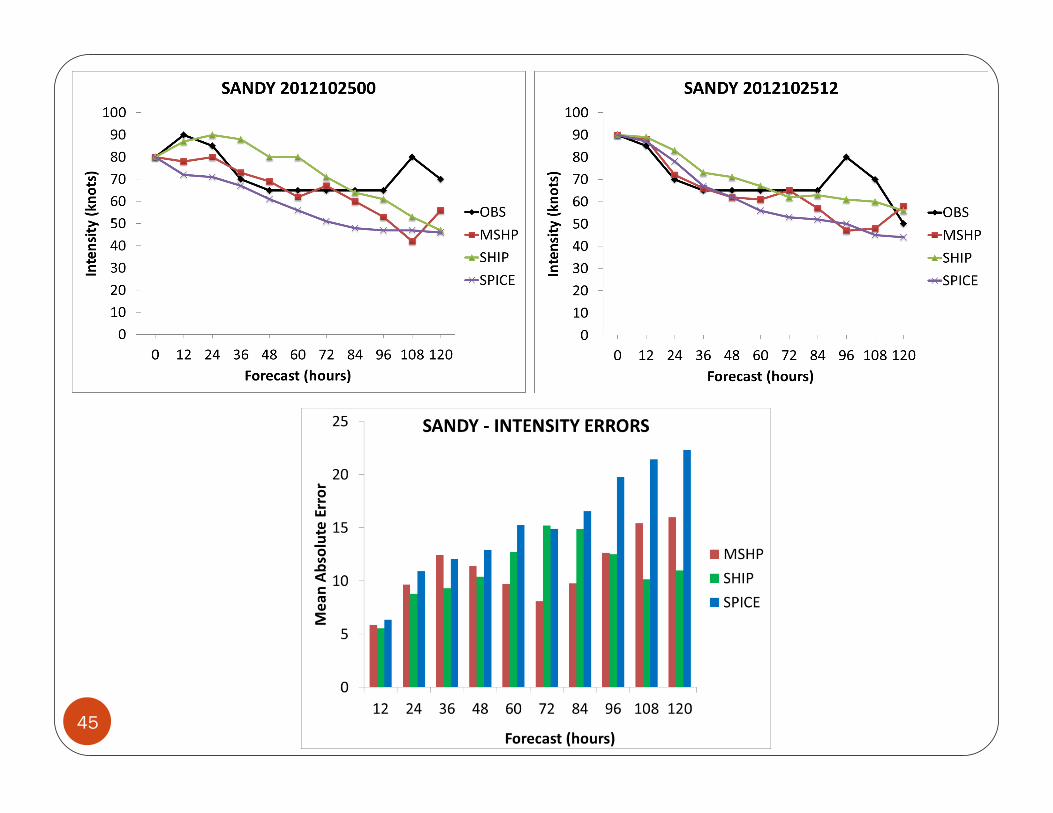
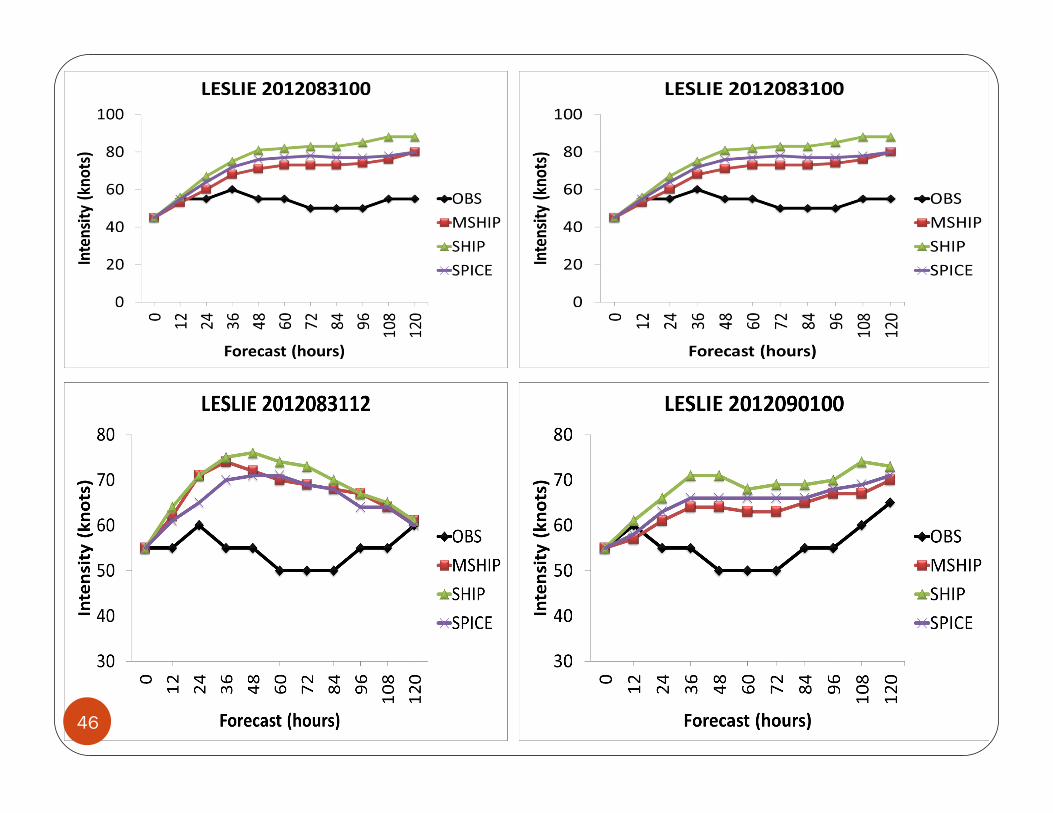
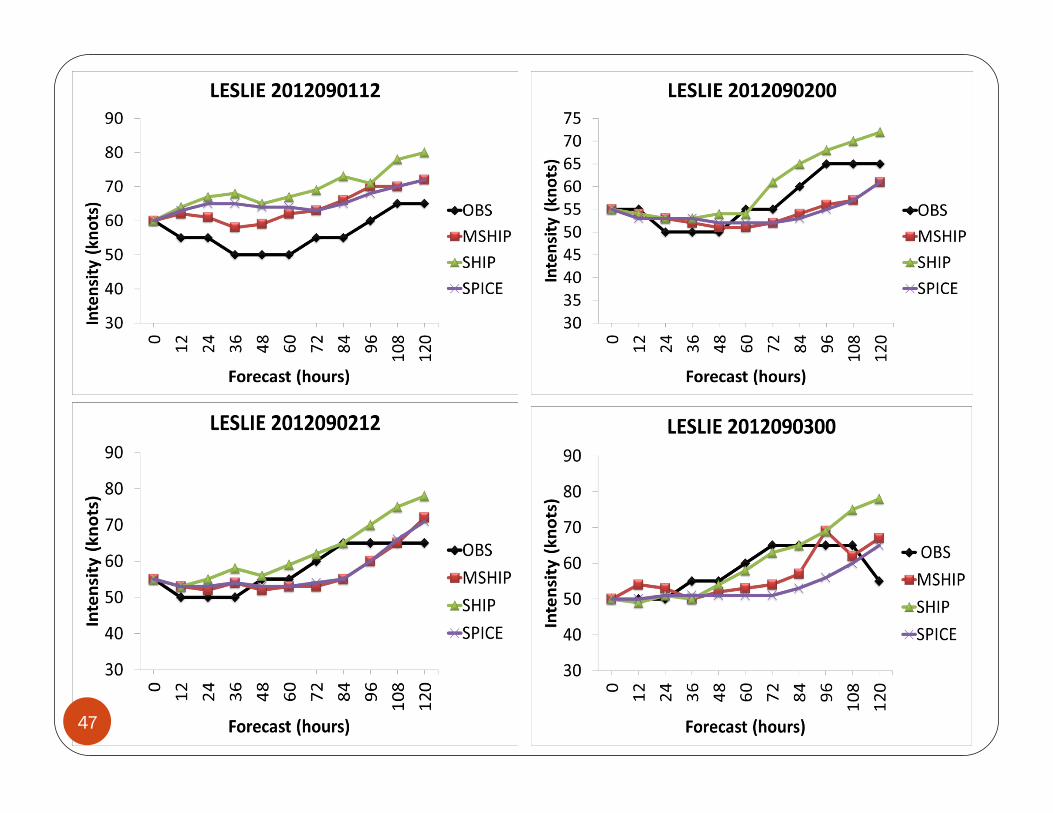
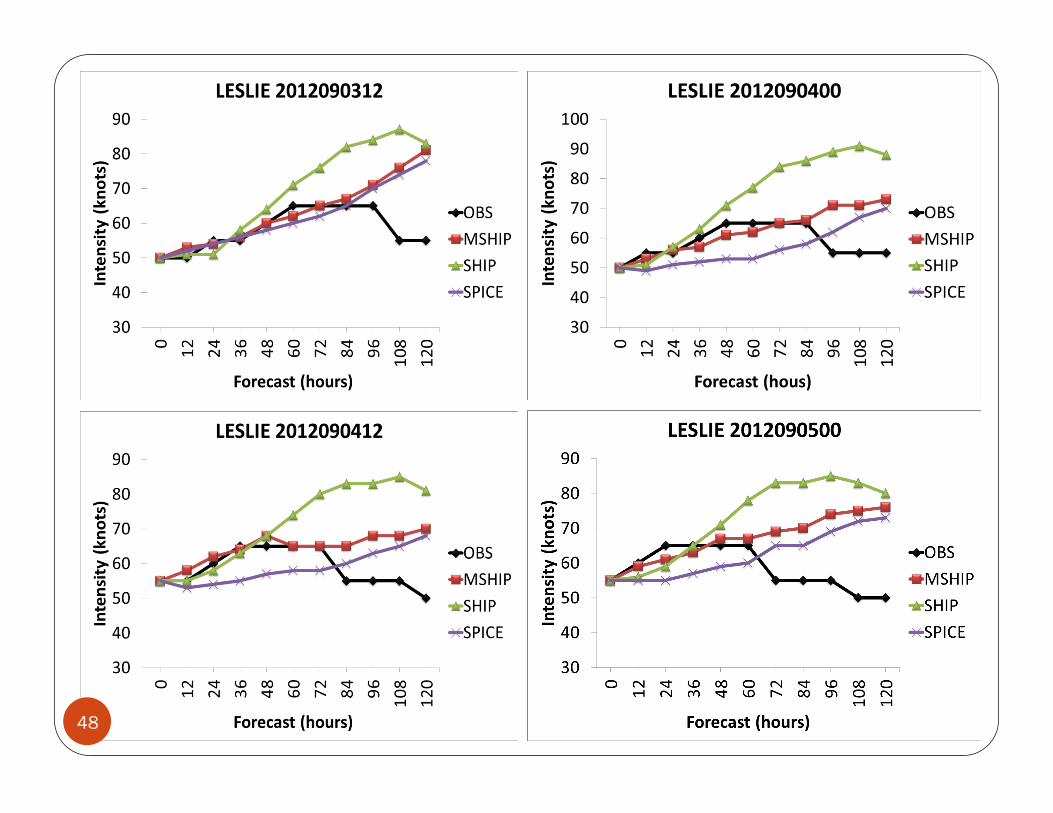
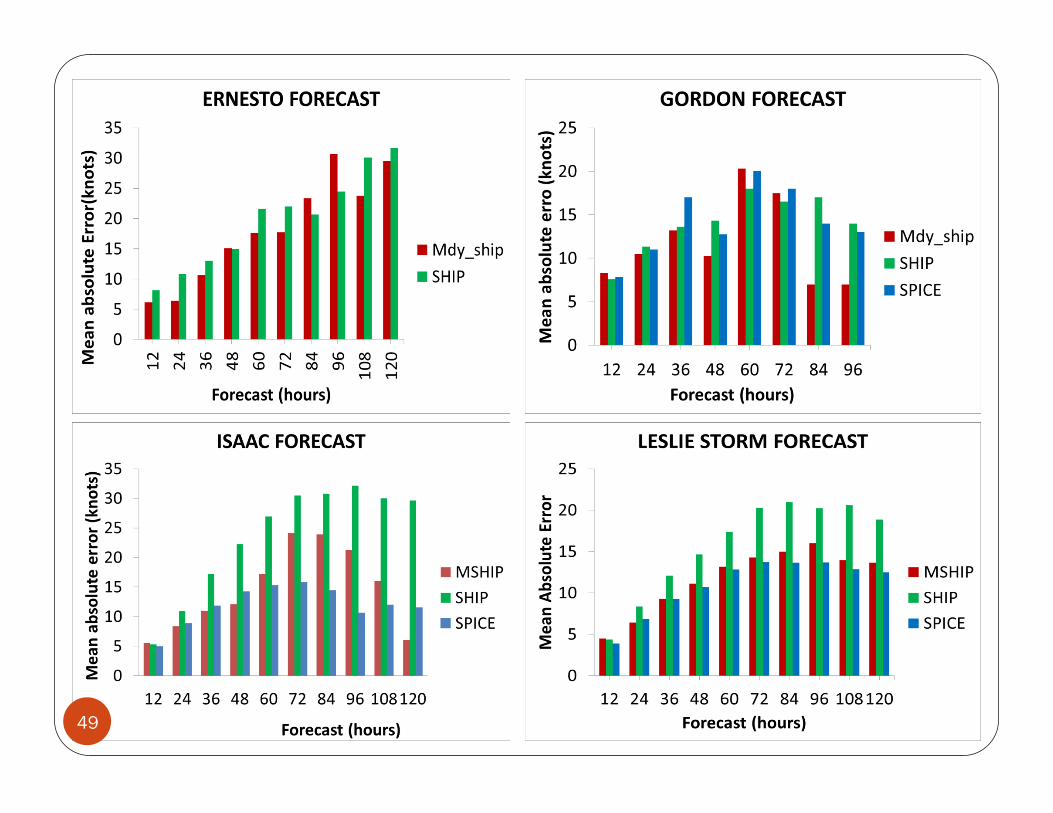
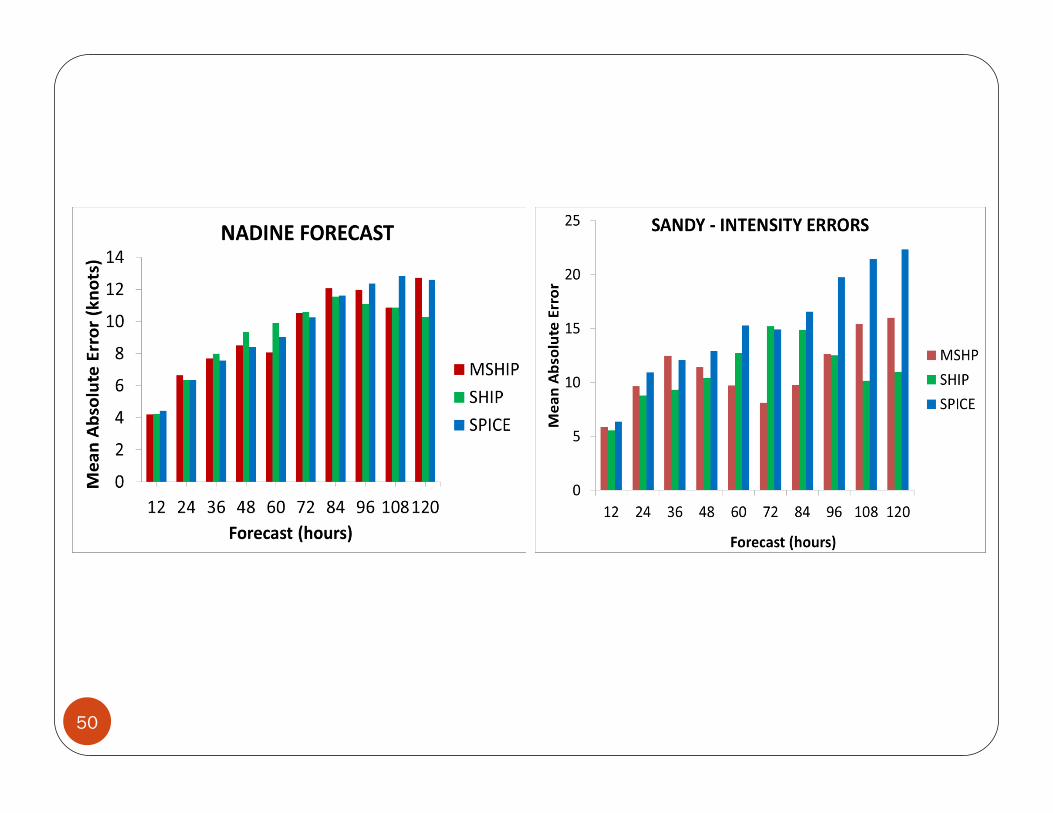
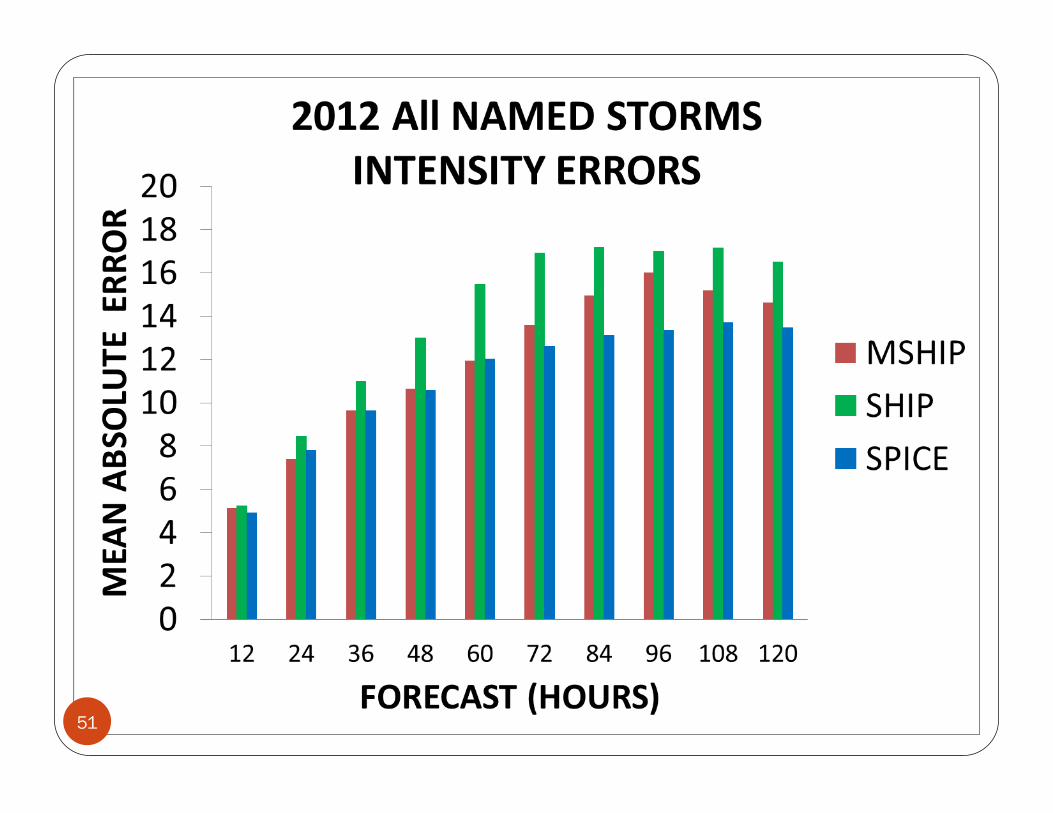
ALL THE NAMED STROMS OF 2012
37
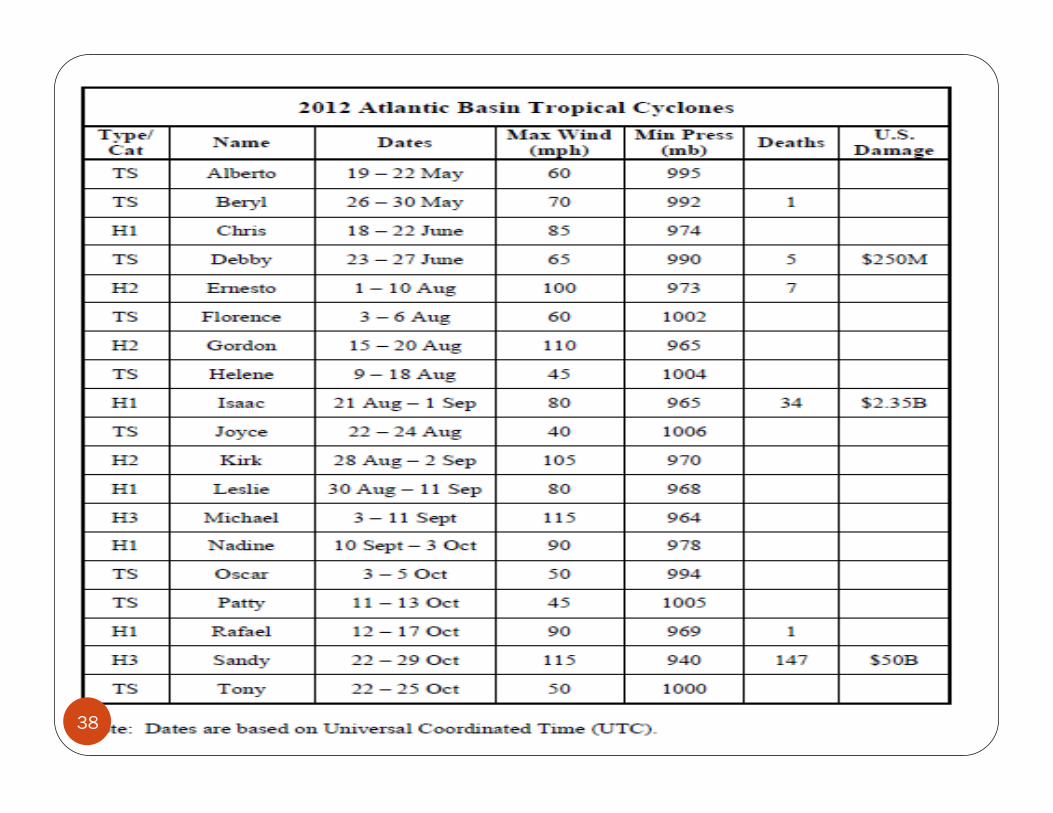
38
RESULTS FOR THE HURRICANE SEASON 2012
FROM REAL TIME FORECASTS
39
40
41
42
43
44
45
46
47
48
49
50
51
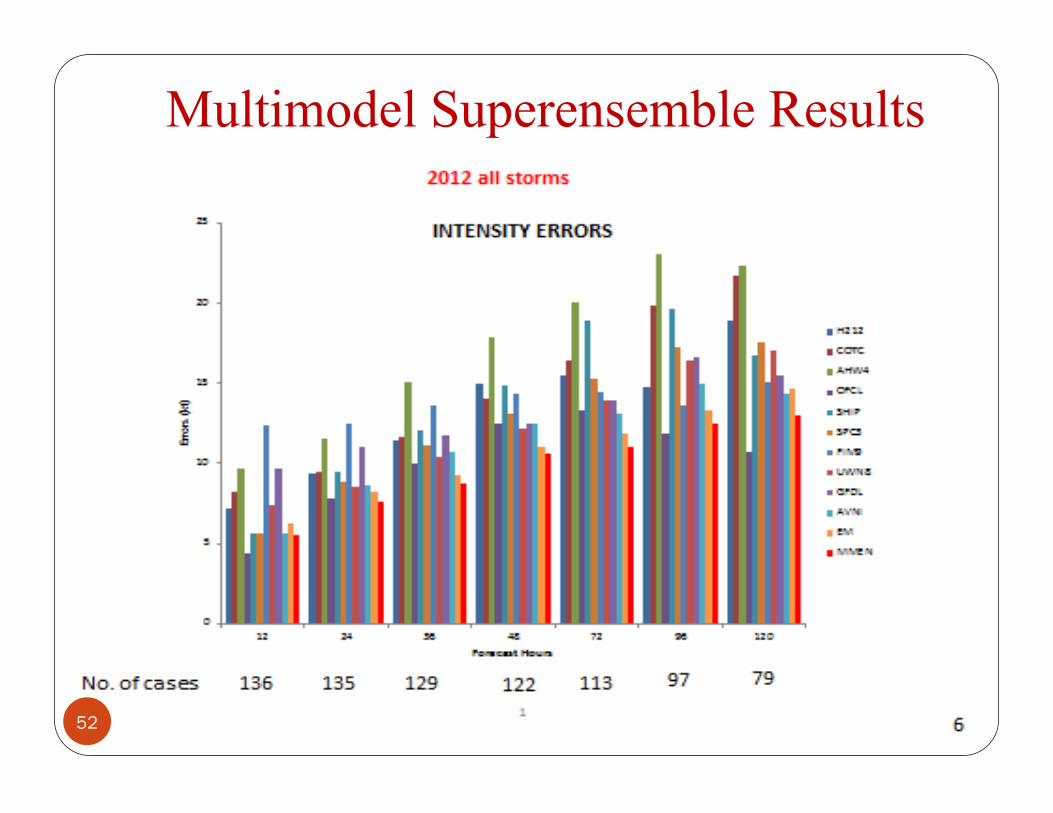
Multimodel Superensemble Results
52
CONCLUSIONS
FSU EXTENDED SHIPS/SPICE ALGORITHM FOR HURRICANE INTENSITY FORECAST IMPROVEMENTS IS ALMOST READY FOR OPERATIONS.
THE FSU DIAGNOSTIC VARIABLES BASED ON DIABATIC PV, ANGULAR
MOMENTUM TRANSPORTS INTO HURRICANE CORE, ENERGY PROVIDED BY DIVERGENT WINDS AND THE SHEAR TO CURVATURE KINEMATICS PROVIDE GREAT STRENGTHS TO THE CURRENT SHIPS AND THE SPICE FORECAST PARAMETERS.
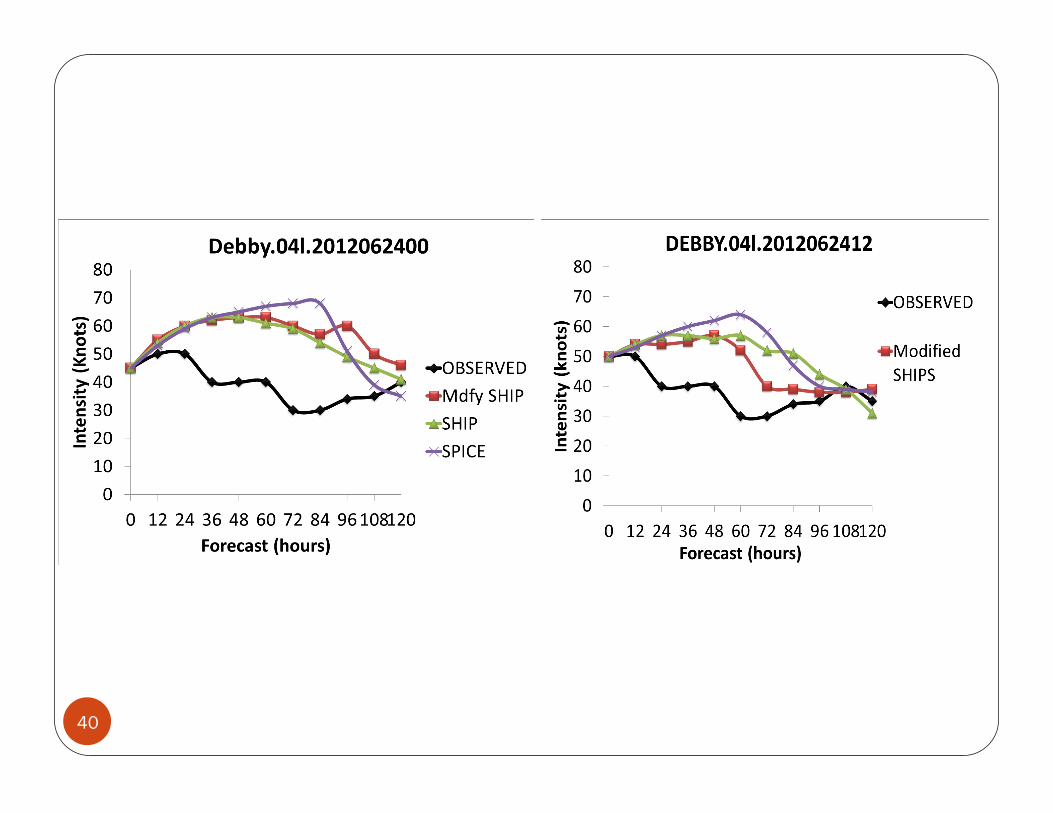
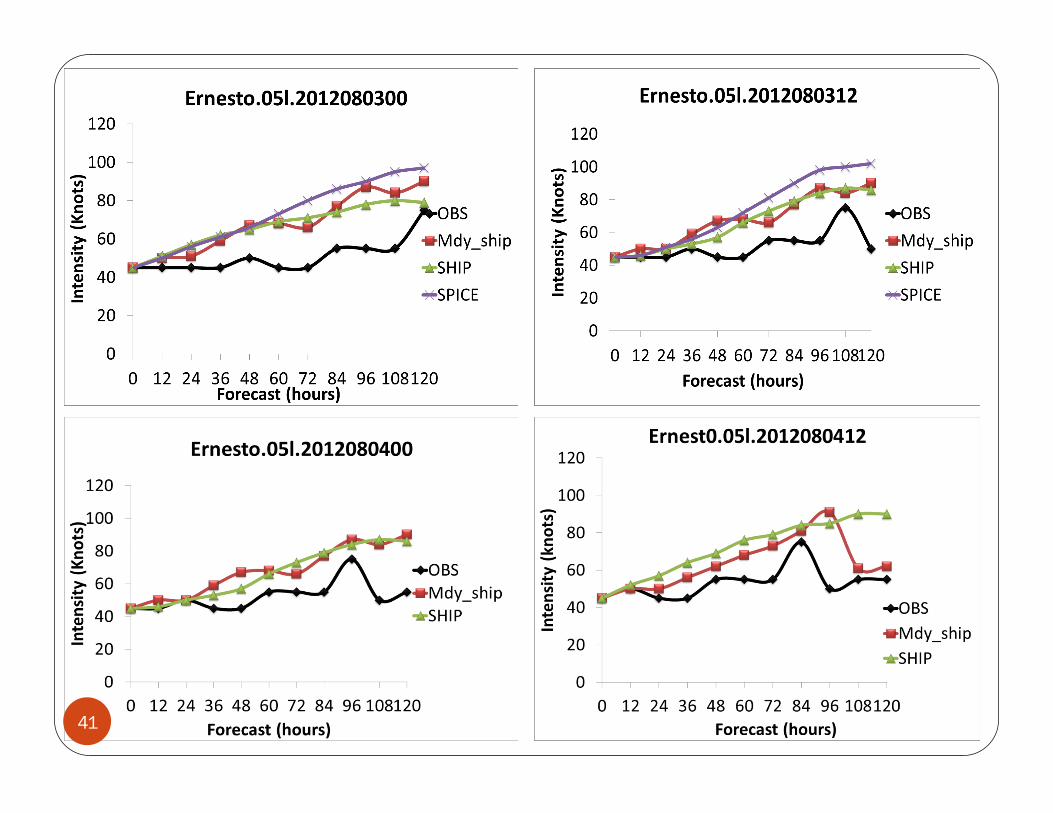
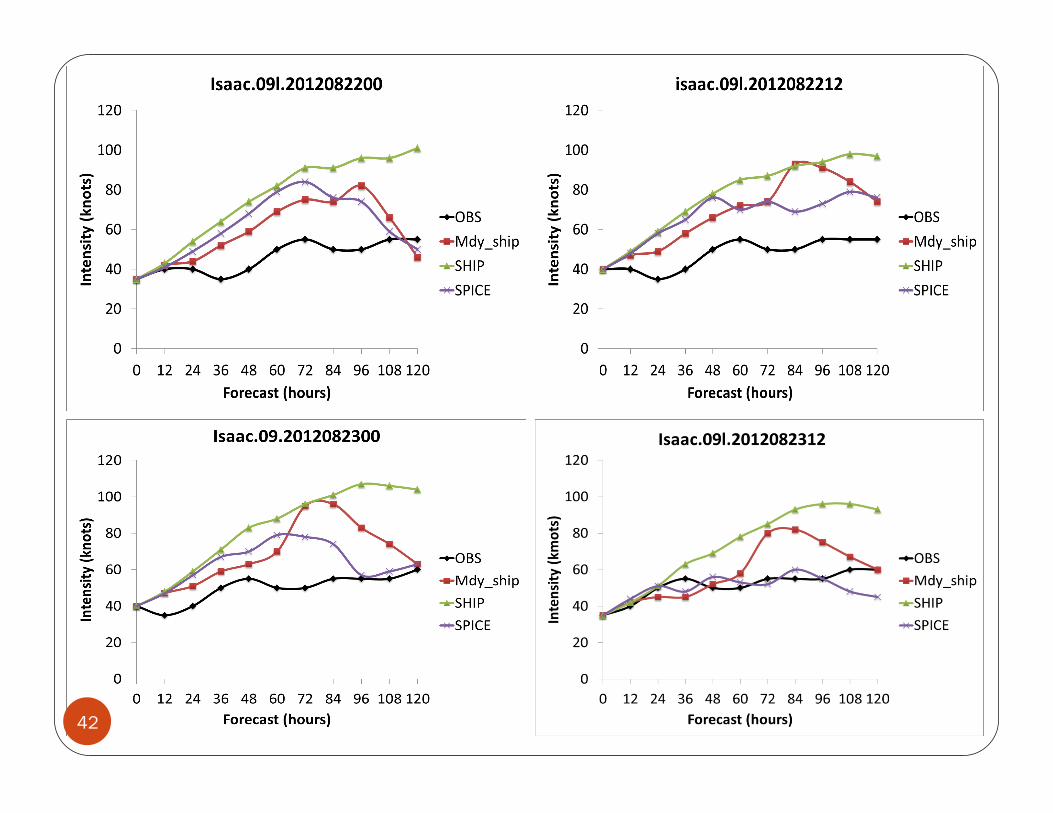
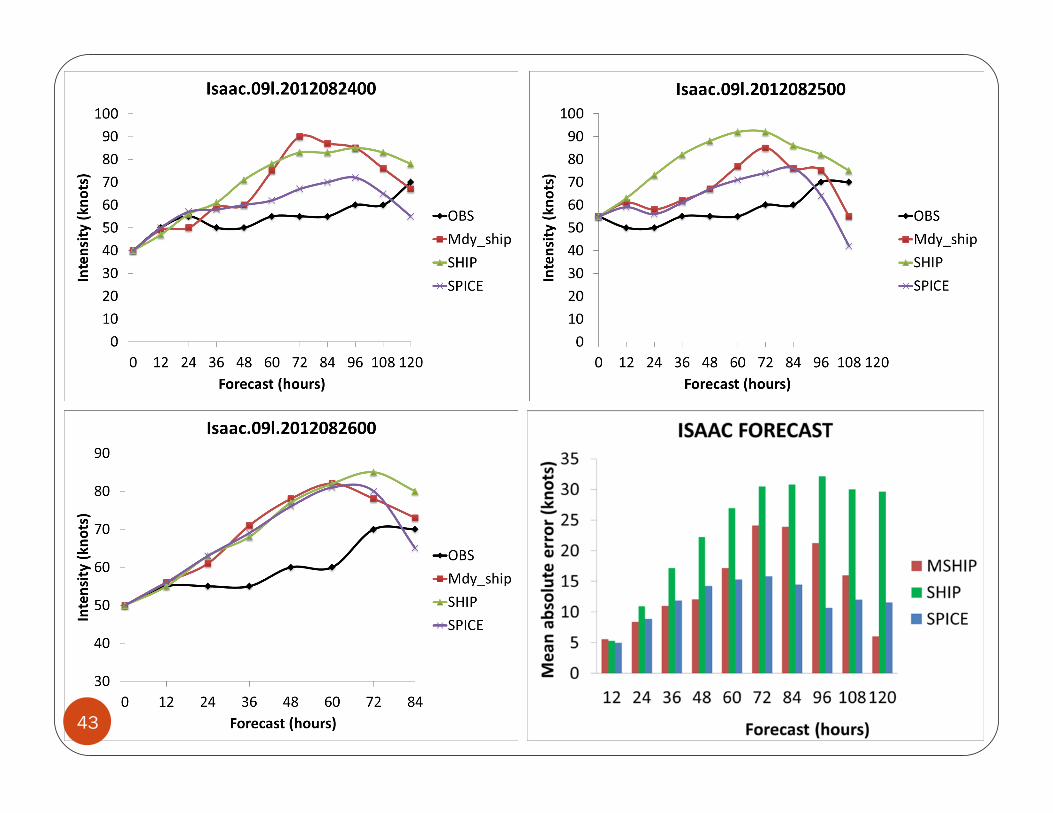
THE FORECASTS, FOR THE NAMED STORMS OF 2012, FROM THE FSU
MODIFIED SHIPS DO CONSISTENTLY PERFORM BETTER IN REDUCING THE INTENSITY ERRORS COMPARED TO THE SHIPS. FOR THE FIRST 72 HOURS THE SKILL OF THE MODIFIED SHIPS ARE COMPARABLE OR SLIGHTLY BETTER THAN THOSE OF SPICE. THEREAFTER SPICE HOLDS A SLIGHT EDGE IN ITS PERFORMANCE FOR THE REDUCTION OF INTENSITY ERRORS.
53
THE FOLLOWING COMMENT IS WORTH MENTIONING HERE : THE FSU MULTIMODEL SUPERENSEMBLE, THAT INCLUDES LARGELY A SUITE OF MESOSCALE MODELS PROVIDED THE LEAST ERRORS FOR THE HURRICANE INTENSITY FORECASTS , OUT TO 120 HOURS. THAT SUITE OF MODEL DOES INCLUDE THE SPICE AND SHIPS. THAT SUGGESTS THAT THE INCLUSION OF A LARGE SUITE OF MODELS WITHIN THE FRAMEWORK OF THE MULTIMODEL SUPERENSEMBLE CAN PROVIDE MUCH HIGHER SKILLS COMPARED TO SHIPS AND SPICE. FURTHER WORK IS STILL NEEDED TO BEST REPRESENT , USING SINGLE PARAMETERS, THE FOUR FSU DIAGNOSTIC VARIABLES. THIS IS OUR PRESENT ONGOING RESEARCH.
54
55