)T[• LI AY,;' AD-A218 435
131
)T[• LI AY,;' AD-A218 435 USAAVSCOM TR 89-D-22B "AIRCRAFT US ARMY AVIATIONI (ý SYSTEMS COMMAND T I VOLUME II- AIRCRAFT DESIGN CRASH GUIDE IMPACT CONDITIONS AND HUMAN TOLERANCE SIMULA INC. 10016 SOUTH 51st STREET PHOENIX, ARIZONA 85044 DECEMBER 1989 FINAL REPORT Approved for public release; distribution is unlimite. Prepared for AVIATION APPLIED TECHNOLOGY DIRECTORATE US ARMY AVIATION RESEARCH AND TECHNOLOGY ACTIVITY (AVSCOM) FORT EUSTIS, VA 23604-5577 90 02 21 .112 Downloaded from http://www.everyspec.com
Transcript of )T[• LI AY,;' AD-A218 435

)T[• LI AY,;' AD-A218 435
USAAVSCOM TR 89-D-22B
"AIRCRAFT US ARMYAVIATIONI (ýSYSTEMS COMMAND
T I
VOLUME II- AIRCRAFT DESIGN CRASH GUIDE
IMPACT CONDITIONS ANDHUMAN TOLERANCE
SIMULA INC.10016 SOUTH 51st STREETPHOENIX, ARIZONA 85044
DECEMBER 1989
FINAL REPORT
Approved for public release; distribution is unlimite.
Prepared for
AVIATION APPLIED TECHNOLOGY DIRECTORATEUS ARMY AVIATION RESEARCH AND TECHNOLOGY ACTIVITY (AVSCOM)FORT EUSTIS, VA 23604-5577
90 02 21 .112
Downloaded from http://www.everyspec.com

AVIATION APPLIED TECHNOLOGY DIRECTORATE POSITION STATEMENT
This revised-edition of the Aircraft Crash Survival Design Guide (ACSDG)was prepared to assist those design engineers responsible for the incor-poration of crashworthiness into the design of helicopters, light fixed-wingaircraft, and tilt rotor aircraft. Also, this guide may be used in theevaluation of the level of crashworthiness design available in the varioustypes of aircraft.
This report documents the components and principles of crashworthinessand suggests specific design criteria. In general, a systems approachis presented for providing a reasonable level of aircrew and aircraft protec-tion in a crash, which is considered the preferred approach. The originalCrash Survival Design Guide was published in 1967 as USAAVLABS TR 67-22and subsequent revisions published as USAAVLABS TR 70-22, USAAMRDL TR 71-22,and USARTL-TR-79-22A thru E. This edition consists of a consolidationof up-to-date design criteria, concepts, and analytical techniques developedthrough research programs sponsored by this Directorate and others overthe past 27 years.
This document has been coordinated with other Government agencies and heli-copter airframe manufacturers active in aircraft crashworthiness researchand development, and is considered to offer sound design criteria and approachesto design for crashworthiness.
The technical monitors for this program were Messrs. LeRoy Burrows, HaroldHolland, and Kent Smith of the Safety and Survivability Technical Area,Aeronautical Systems Division, Aviation Applied Technology Directorate.
NOTE: All previous editions of the Aircraft Crash Survival Design Guideare obsolete and should be destroyed.
DISCLAIMERS
The findings in this report are not to be construed as an official Department of the Army position unless sodesignated by other authorized documents.
When Covernment drawings, specifications, or other data are used for any purpose other than in connection with adefinitely related Government procurement operation, the United States Government thereby incurs no responsibilitynor any obligation whatsoever; and the fact that the Government may have formulated, furnished, or in any waysupplied the said drawings, specifications, or other data is not to be regarded by implication or otherwise as in anymanner licensing the holder or any other person or corporation, or conveying any rights or permission, to manu-fecture, use, or sell any patented invention that may in any way be related thereto.
Trade names cited in this report do not constitute an official endorsement or approval of the use of suchcommercial hardware or software.
DISPOSITION INSTRUCTIONS
Destroy this report by any method which precludes reconstruction of the document. Do not return it to theoriginator.
Downloaded from http://www.everyspec.com

(I) I Form ApprovedREPORT DOCUMENTATION PAGE 1M No~. 0704-0788
Pubiic reporting burdern for this collection of iniformation is estimnated to average hu iC SQnencluding the time for reviewing insttructions,. searching existing data Source,.7gallheing and nanrtaining the date needed. nd completing and r"evweorg tin coil-ccor of infornmation Send comments regarding this burden estimate ')r any other ispc~t of this')ction of information. including~ suggestions for reducing this burden, to waihnqinon Headquarters Seru ces, Directorate for information Operations and FtepCrts. 1215 letffrsonOann' Highwvayv. suite 1204. A. Ington. V A 22 20 2-4302. and to the Oflice of Managemert and Sudget. Paperwork FledUCt ion Project [0'704 0 1 88). Wailington. DC 20503
1. AGENCY USE ONLY (Leave blank) 2. REPORT DATE 3. REPORT TYPE AND DATES COVERED
IDecember 1989 Final FROM 9/86 TO 8/894. TITLE AND SUBTITLE S. FUNDING NUMBERS
Aircraft Crash Survival Design GuideVolume II - Aircraft Design Crash Impact Conditions and fluman Tolerance DAAJO2-86-C0028
6. AUT14OR(S,'
J. W. Coltman, C. Van 19gen, N.B. Johnson, R.E. Zimmnermann
7. PERFORMING ORGANIZATION NAME(S) AND ADDRESS(ES) B. PERFORMING ORGANIZATIONREPORT NUMBER
Simula Inc.*Phoenix, Arizona 85044-5299
g. SPONSORING /MONITORING AGENCY NAME(S) AND ADDRESS(ES) 10. SPONSORING / MONITORIN~GAGENCY REPORT NUMBS-
Aviation Applied Technology DirectorateU.S. Army Aviation Research & Technology Activity (AVSCOM) USAAVSCOM TR 89-D-22BFort Eustis, VA 23604-5577
11. SUPPLEMENTARY NOTES
Volume 11 of five-volume report
12C. DISTRIBUTION/I AVAILABILITY STATEMENT 12b. DISTRIBUTION CODE
Approved for public release; distribution unlimitcd
913. ABSTRACT (Maximnum 200 words)This five-volume publication has been compiled to assi ~t design engineers in understanding the designconsiderations associated with the development of crash~ resistant U.S. Army aircraft. A collection ofavailable information and data pertinent to air(iraft rrA sh resistance is presented, along with suggesteddesign conditions and criteria. The five volumes of the\Aircraft Crash Survival Design Guide cover thefollowing topics: Volume I - Design Criteria arid Checklists; Volume II - Aircraft Design Crash ImpactConditions and Human Tolerance; Volume III - Aircraft Structural Crash Resistance; Volume IV - Air-craftSeats, Restraints, Litters and Cockpit/Cabin Delethalization; and Volume V - Aircraft Postcrash Survival.This Volume (Volume II) contains information on the aircraft crash environment, human tolerance to impact,occupant motion during a crash, human anthropometry, and crash test dunun s all of which serves asbackground for thle design information presented in the other volumes.
14. SUBJECT TERMS 15. NUMBER Of PAGESAircraft Design Gui Crash Environmn Crashes ((o .z L tmi.aane~) 120
CrahwrtinssHuman Body Accidents 16lo~nmc . PRICE CODEDesign Data )Crashworthy ` ICrash Landing(- )Human Tolerance Im ac Anthropometr.--
17. SECURITY CLASSIFICATION 18. SECURITY CLASSIFICATION 19. SECURITY CLASSIFICATION 20. LIMITATION OF ABSTRACTOF REPORT OF THIS PAGE OF ABSTRACT ;U14CLASSIFIED UNCLASSIFIED UNCL.ASSIFIED
NSN 7540.01 -280-5500 Standard Form 298 (Rev 2-89)Pfti: becl by 4NSi Stu Z39.iS
Downloaded from http://www.everyspec.com

PREFACE
This report was prepared for the Safety and Survivability Technical Area ofthe Aviation Applied Technology Directorate, U. S. Army Aviation Research andTechnology Activity (AVSCOM), Fort Eustis, Virginia, by Simula Inc. underContract DAAJ02-86-C-0028, initiated in September 1986. This guide is a revi-sion of USARTL Technical Report 79-22, Aircraft Crash Survival Design Guide,published in October 1980.
A major portion of the data contained herein was taken from U. S. Army-sponsored research in aircraft crashworthiness conducted from 1960 to 1987.Acknowledgment is extended to the U. S. Air Force, Federal Aviation Admini-stration, NASA, and U. S. Navy for their research in crash survival. Appre-ciation is extended to the following organizations for providing accidentcase histories leading to the establishment of the impact conditions in air-craft accidents:
0 U. S. Army Safety Center, Fort Rucker, Alabama.
I Civil Aeronautics Board, Washington, D. C.
I U. S. Naval Safety Center, Norfolk, Virginia.
I U. S. Air Force Inspection and Safety Center, Norton Air Force Base,California.
Additional credit is due the many authors, individual companies, and organi-zations listed in the bibliographies for their contributions to the field.The contributions of the following authors to previous editions of theAircraft Crash Survival Design Guide are most noteworthy:
D. F. Carroll, R. L. Cook, S. P. Desjardins, J. K. Drummond, J. H. Haley,Jr., A. D. Harper, H. G. C. Henneberger, N. B. Johnson, G. Kourouklis, D.H. Laananen, W. H. Reed, S. H. Robertson, L. M. Shaw, G. T. Singley, III,A. E. Tanner, J. W. Turnbow, and L. W. T. Weinberg.
LTC. D. F. Shanahan, M.C., of the United States Army furnished assistance byproviding the occupant exposure data discussed in Section 4.0.
This volume has been prepared by J. W. Coltman, C. Van Ingen, N. B. Johnson,and R. E. Zimmermann. Data from the investigations of recent Army aircraftaccidents were provided by the U. S. Army Safety Center. R.F. Chandler ofthe FAA Civil Institute assisted in locating information on human tolerance,anthropometry, and crash test dummies. Accsion For-
NPS CR~AM
DTIC A B
By ....
iii 1 'Disi li ,., .
-(l :i
Downloaded from http://www.everyspec.com

TABLE OF CONTENTS
Page
PREFACE ............... ............................... ..... iii
LIST OF ILLUSTRATIONS ............ ........................ .... viii
LIST OF TABLES .................... ............................ xi
INTRODUCTION ..................... ............................. 1
1. BACKGROUND DISCUSSION ................ ...................... 4
2. DEFINITIONS .................. ............................ 6
2.1 GENERAL TERMS ................. ....................... 62.2 AIRCRAFT PARAMETERS ............... .................... 72.3 HUMAN BODY PARAMETERS ........ ................... .l.O.. 10
3. AIRCRAFT DESIGN CRASH IMPACT CONDITIONS ........ ............. 13
3.1 INTRODUCTION ............ ........................ .... 133.2 HISTORICAL DEVELOPMENT OF CRITERIA ........ ............. 133.3 IMP AT ONDITlIONS. 14
3.3.1 Longitudinal (Mix) Impacts .................. ..... 153.3.2 Vertical (AVz) Impact ...................... . .. 153.3.3 Lateral (AVz) Impacts ...... ................ .... 153.3.4 Combined Impacts ............. ................... 173.3.5 Rollover Impacts ............. ................... 17
4. OCCUPANT EXPOSURE DATA ......... ...................... ..... 19
4.1 INTRODUCTION ............ ........................ .... 194.2 ACCIDENT STATISTICS ....... ..................... ..... 19
4.2.1 Number of Aircraft ...... .................. ..... 194.2.2 Number of Accidents ............................ 204.2.3 Accident Rates ....... .................... .... 20
4.3 IMPACTED TERRAIN .......... ...................... .... 214.4 IMPACT INJURY FREQUENCY ........................ 22
4.4.1 Number of Occupants and Injuries .............. .... 224.4.2 Injury by Body Region ...... ................ .... 234.4.3 Injury by Aircraft ............. .................. 24
4.5 MECHANISMS OF INJURY ........ .................... .... 28
5. HUMAN TOLERANCE TO IMPACT ........ .................... .... 29
5.1 INTRODUCTION .... ........................ 295.2 FACTORS AFFECTING HUMAN TOLERANCE. .............. 29
5.2.1 Body Characteristics ...... ................. .... 295.2.2 Restraint System ...... ................... ..... 305.2.3 Crash Conditions ............. ................... 32
V
Downloaded from http://www.everyspec.com

TABLE OF CONTENTS (CONTD)
5.3 WHOLE-BODY ACCELERATION TOLERANCE .... ............. .... 325.3.1 Spineward (-Gx) Acceleration .... ............ .... 325.3.2 Sternumward (+Gx) Acceleration .............. .... 345.3.3 Headward (+Gz) Acceleration ...... . ............ 355.3.4 Tailward (-Gz) Acceleration ....... ............. 355.3.5 Lateral (G ) Acceleration .................. .... 35
5.4 HEAD IMPACT TOLERANCE ........... ................... 385.4.1 Weighted Impulse Criterion (Severity Index) ........ 395.4.2 Head Injury Criteria (HIC) ........ ............. 415.4.3 J-Tolerance ...... ..................... .... 435.4.4 Effective Displacement Index ....... ............ 445.4.5 Strain Energy Considerations .... ............ .... 445.4.6 Mean Strain Criterion (MSC). . ............. 445.4.7 Comparison of Head Injury Predictors. ........ 45
5.5 FACIAL IMPACT TOLERANCE ...... .................. .... 465.6 NECK IMPACT TOLERANCE ........... ................... 475.7 CHEST IMPACT TOLERANCE ....... ................... 465.8 ABDOMINAL IMPACT TOLERANCE ..... ................. .... 535.9 SPINAL INJURY TOLERANCE ...... .................. .... 54
5.9.1 Experimental Test Data ..... ............... .... 555.9.2 Mathematical Model Predictions ................ 575.9.3 Vertebral Prnperties ........ ................ . .
5.10 LEG INJURY TOLERANCE ...... .................... .... 655.11 ABBREVIATED INJURY SCALE ..... .................. .... 67
6. OCCUPANT MOTION ENVELOPES ...... .................... .... 69
6.1 INTRODUCTION ....... ........................ .... 696.2 FULL RESTRAINT ....... ....................... .... 696.3 LAP-BELT-ONLY RESTRAINT ...... .................. .... 71
7. HUMAN BODY DIMENSIONS AND MASS DISTRIBUTION .............. .... 75
7.1 INTRODUCTION ....... ........................ .... 757.2 ANWHROPOMETRY .............. ...................... 75
7.2.1 Conventional Anthropometric Measurements .... ...... 757.2.2 Equipment Weights ..... ................. ..... 787.2.3 Body Joints and Ranges of Motion ............. ... 78
7.3 INERTIAL PROPL,ýFIES. ..... ................... ..... 827.4 SCALING OF MEASUREMENTS ...... .................. .... 847.5 ANTHROPOMETRIC DATA FOR USE IN SIMULATIONS ..... ......... 85
vi
Downloaded from http://www.everyspec.com

TABLE OF CONTENTS (CONTD)
Page
8. CRASH TEST DUMMIES ......... ... ....................... 88
8.1 INTRODUCTION ........ ........................ ... 888.2 DUMMY TECHNOLOGY ....... ...................... .... 88
8.2.1 History of Dummy Development ....... ............ 888.2.2 Part 572 Dummy ........... ................... 898.2.3 Hybrid III Dummy ...... .................. .... 929.2.4 Side ImpacL Dummies ...... ................. .... 93
8.3 COMPARISON OF DUMMY AND HUMAN RESPONSE .............. ... 948.4 SUITABILITY OF DUMMIES FOR AIRCRAFT SYSTEM EVALUATION . . 988.5 EJECTION SYSTEM MANIKINS ..... .................. .... 98
8.5.1 GARD and LRE Manikins ...... ................ 988.5.2 Advanced Dynamic Anthropomorphic Manikin (ADAM). . 99
8.6 INSTRUMENTATION IN MANIKINS ......... ................ 1038.7 IMPROVED MANIKIN NECK ........... ................... 106
REFERENCES ............ .............................. ... 107
BIBLIOGRAPHY .......... ..... ............................. 118
vii
Downloaded from http://www.everyspec.com

LIST OF ILLUSTRATIONS
Fcigure -g
1 Aircraft coordinate and attitude directions ..... ......... 7
2 Typical aircraft floe. deceleration pulse ...... .......... 8
3 Schematic of flight path, terrain, and impact angles . . .. 10
4 Terminology for directions of forces on the body .... ...... 11
5 Aircraft impact attitudes envelopes ................ ..... 16
6 Low angle impact design conditions ........ ............. 17
7 Distribution of injuries to body parts in survivable U.S.Army aircraft accidents, 198U-1986 ........ ............. 27
8 Pelvic rotation and submarining caused by high longitudinalforces combined with moderate vertical forces ..... ........ 31
9 Duration and magnitude of spineward acceleration endured byvarious subjects ........ ...................... .... 33
10 Initial rate of change 3f spineward acceleration endured byvarious subjects ........ ...................... .... 34
11 Duration and magnitude of headward acceleration endured byvarious subjects ........ ...................... .... 36
12 Initial rate of change of headward acceleration endured byvarious subjects ........ ...................... .... 37
13 Wayne State tolerance curve for the human brain in foreheadimpacts against plane, unyielding surfaces ..... ......... 40
14 Sample calculation of a severity index .............. .... 42
15 Damped, spring-mass system used in computing J-tolerance . . 43
16 Comparison of SI, EDI, and kinematics of six frontal impactsproducing linear fracture ...... .................. .... 45
17 Summary of maximum tolerable impact forces on a paddeddeformable surface ...... ..................... ..... 46
18 Moment at the occipital condyles and relative change inhead/torso angle and head/neck angle dur'ng NBDL human runno. LX 4651, 12-Gz impact ...... .................. .... 49
viii
Downloaded from http://www.everyspec.com

lIST OF ILLUSTRATIONS (CONTDQf
Figure PMg
19 Moment at the occipital condyles and relative change inhead/torso angle and head/neck angle during human runno. LX 3983, -15 Gx impact .... ................. ..... 50
20 AIS injury rating versus normalized chest deflection . . . . 51
21 Range of validity for the viscous criterion and thecompression criterion ..... .................... .... 52
22 Comparison of AIS > 4 probability for left-side and right-side impacts ....... ........................ .... 53
23 Anatomy of the spine (vertebral column) ....... ......... 55
24 Spinal injury rate as a function of spinal load/strengthratio (SLSR) ........ ..... ........................ 56
25 Correlation between the energy absorber limit-load factorand spinal injury rate ...... ................... .... 57
26 Spinal injury model ..... ..................... ..... 58
27 Probability of spinal injury estimated from laboratory datacompared to operational experience. .. .. ... . .... ......... 59
28 Comparison of model output and experimental data for 10-Gruns with the spine in the (a) erect and (b) hyperextendedmodes ........ ............................ .... 62
29 Three-dimensional head-spine model ....... ............. 63
30 Identification of joints, links, and head/neck relativeangle in head/neck trajectory plots ...... ............. 64
31 Vertebral ultimate compressive strength for variouspopulations ....... ......................... .... 66
32 Femur injury criterion ...... ................... .... 67
33 Full-restraint extremity strike envelope side view . . . . 70
34 Full-restraint extremity strike envelope - top view ........ 70
ix
Downloaded from http://www.everyspec.com

LSLT OF ILLUSTRATIONS (CONTD)
35 Full-restraint extremity strike envelope - front view. . .. 71
36 Lap-belt-only extremity strike envelope - side view. ..... 72
37 Lap-belt-only extremity strike envelope - top view ..... 72
38 Lap-belt-only extremity strike envelope - front view . . .. 73
39 head displacement for IBAHRS and MIL-S-58095 restrainttests, 15-G pulse, 95th-percentile dummy ............. ... 74
40 Conventional seated anthropometric dimensions ..... ........ 76
41 Normal distribution curve ..... .................. .... 78
42 Path of instantaneous center of rotation during shoulderabduction .......... ..... .......................... 79
43 Sitting skeletal joint locations based on a 50th-percentile
male army aviator ............ ...................... 80
44 Joint ranges of motion .. ..... ... ................... 81
45 Mass distribution of seated torso referenced to the skeletalstructure for a 50th-percentile male Army aviator .......... 83
46 Program SOM-LA body segment dimensions ...... ........... 86
47 Dummy external dimensions ..... .................. .... 89
48 Hybrid III neck ....... ....................... .... 92
49 Comparison of mean head resultant acceleration responsesfor three different dummy designs .................. .... 96
50 Comparison of mean head resultant acceleration responsesfor HSRI dummy conducted at two laboratories .......... ... 97
51 Elbow resistive force versus rotation angle ..... ......... 103
52 Acceleration data filtered at 500 Hz and 15 Hz .... ....... 105
x
Downloaded from http://www.everyspec.com

LIST QETABLES
I Crash impact design conditions, with landing gear extended,MIL-STD-1290. .............. ........................ 14
2 U.S. Army aircraft in accident study for FY 1980 -
FY 1985 ......... ........................... ...... 19
3 Aircraft comparison data ...... .................. .... 20
4 Mishap rates by aircraft type for FY 1980 - FY 1985(mishaps per 100,00 flying hours) ....... .............. 20
5 Distribution of the general terrain impacted by Army air-craft during the period FY 1980 - FY 1985 ............. .... 21
6 Distribution of the surface impacted by Army aircraft duringthe period FY 1980 - FY 1985 ...... ... ................ 21
7 Number of occupants and injuries FY 1980 - FY 1985 ........ 22
8 Distribution of injury by body region (percent) ........... 23
9 Degree of injury for noccunpnac nf clase A anid B mcshs ... 24
10 Vertical velocity change in survivable crashes(feet per second) ....... ...................... .... 25
11 Distribution of injury by body region (percent) - comparisonbetween UH-60 and other helicopters ................ .... 26
12 Mechanisms of injury identified in survivable class A and Bmishaps ....... ... ........................... .... 28
13 Abbreviated Injury Scale severity codes ...... ........... 68
14 Summary of anthropometric data for U.S. Army maleaviators ...... ..... .......................... .... 76
15 Summary of anthropometric data for male soldiers .... ...... 77
16 Summary of anthropometric data for U.S. Army women ..... 77
17 Personnel equipment weights ......... ................. 79
18 Range of joint rotation ...... ................... .... 81
19 Center-of-mass distribution of seated torso -50th-percentile male Army aviator ...... .............. 82
xi
Downloaded from http://www.everyspec.com

LIST OF TABLES (CONTD)
20 Segment moments of inertia about the center of mass. ..... 84
21 Body segment lengths ...... ..... ... .................... 87
22 Dummy external dimensions (Part 572) .... ............ .... 90
23 Dummy component weights (Part 572) .... ............. .... 90
24 Center-of-gravity locations (Part 572) ...... ........... 91
25 Hybrid II mass moments of inertia ....... .............. 91
26 Manikin design requirements ......... ................. 99
27 Comparison of manikin mechanical characteristics .... ...... 101
28 Characteristics of instrumentation systems ........... . ... 100
29 Joint degrees of freedom and rotation limits ........... ... 102
xii
Downloaded from http://www.everyspec.com

INTRODUCTION
For many years, emphasis in aircraft accident investigation was placed onfinding the cause of the accident. Very little effort was expended in thecrash survival aspects of aviation safety. However, it became apparentthrough detailed studies of accident investigation reports that large improve-ments in crash survival could be made if consideration were given in theinitial aircraft design to the following general survivability factors:
1. Crash Resistance of Aircraft Structure - The ability of the aircraftstructure to maintain living space for occupants throughout a crash.
2. Tiedown Strength - The strength of the linkage preventing occupant,cargo, or equipment from becoming missiles during a crash sequence.
3. Occupant Acceleration During Crash Impact - The intensity andduration of accelerations experienced by occupants (with tiedownassumed intact) during a crash.
4. Occupant Crash Impact Hazards - Barriers, projections, and looseequipment in the immediate vicinity of the occupant that may causecontact injuries.
5. Postcrash Hazards - The threat to occupant survival posed by fire,drowning, exposure, etc., following the impact sequence.
Early in 1960, the U.S. Army Transportation Research Command* initiated along-range program to study all aspects of aircraft safety and survivabil-ity. Through a series of contracts with the Aviation Safety Engineering andResearch Division (AvSER) of the Flight Safety Foundation, the problemsassociated with occupant survival in aircraft crashes were studied to deter-mine specific relationships between crash forces, structural failures, crashfires, and injuries. A series of reports covering this effort was preparedand distributed by the U. S. Army, beginning in 1959.
In October 1965, a special project initiated by the U. S. Army consolidatedthe design criteria presented in these reports into one technical documentsuitable for use as a designer's guide by aircraft design engineers and otherinterested personnel. The document was to be a summary of the current stateof the art in crash survival design, using not only aata generated under Armycont",'.cts but also information collected from other agencies and organi-zations. The Crash Survival Design Guide, first published in 1967, realizedthis goal.
Since its initial publication, the Design Guide has been revised severaltimes to incorporate the results of continuing research in crashworthinesstechnology. The second revision, published in 1971, was the basis for the
*Now the Aviation Applied Technology Directorate, Aviation Research andTechnology Activity of the U. S. Army Aviation Systems Command (AVSCOM).
1
Downloaded from http://www.everyspec.com

criteria contained in the Army's military standard MIL-STD-1290, "LightFixed- and Rotary-Wing Aircraft Crash Resistance" (Reference 1). The thirdrevision, published in 1980, entitled Aircraft Crash Survival Design Guide,expanded the document to five volumes, which have been updated by the currentedition to include information and changes developed from 1980 to 1987. Thiscurrent revision, the fourth, contains the most comprehensive treatment ofall aspects of aircraft crash survival now documented. It can be used as ageneral text to establish a basic understanding of the crash environment andthe techniques that can be employed to improve chances for survival. It alsocontains design criteria and checklists on many aspects of crash survival andthus can be used as a source of design requirements.
The current edition of the Aircraft Crash Survival Design Guide is publishedin five volumes. Volume titles and general subjects included in each volumeare as follows:
Volume I - Desiqn Criteria and Checklists
Pertinent criteria extracted from Volumes 2 through 5, presented in thesame order in which they appear in those volumes.
Volume II - Aircraft Design Crash Impact Conditions and Human Tolerance
Crash impact conditions, human tolerance to impact, military anthropo-metric data, occupant environment, test dummies, accident informationretrieval.
Volume III - Aircraft Structural Crash Resistance
Crash load estimation, structural response, fuselage and landing gearrequirements, rotor requirements, ancillary equipment, cargo restraints,structural modeling.
Volume IV - Aircraft Seats, Restraints, Litters, and Cockpit/•ibinDel ethal izati on
Operational and crash environment, energy attenuation, seat design,litter requirements, restraint system design, occupant/restraintsystem/seat modeling.
Volume V - Aircraft Postcrash Survival
Postcrash fire, ditching, emergency escape, crash locator beacons.
This volume (Volume II) contains information on aircraft design impact con-ditions and the response of the human body to impact. Following a generaldiscussion of aircraft crash resistance in Chapter 1, a number of wordscommonly referred to in discussing crash impact conditions are defined inChapter 2. Chapter 3 describes the aircraft design crash impact conditions.Chapter 4 presents occupant exposure data and includes accident statistics,terrain impact, injury frequency and injury mechanisms. Chapter 5 discussesthe tolerance of the human body and various body parts to impact loading.Chapter 6 presents data on occupant motion during a crash. Chapter 7provides data on human anthropometry that may be useful directly, as incockpit design, or indirectly, as in preparing input for computer simulation
2
Downloaded from http://www.everyspec.com

models such as those discussed in Volume IV. Chapter 8 describes the crashtest dummies used in evaluating protective systems such as seats and re-straints.
The units of measurement shown in the Design Guide vary depending upon theunits used in the referenced sources of information, but are mostly USAunits. In some cases the corresponding metric units are shown in parenthesesfollowing the USA units. For the convenience of the reader a conversiontable of some commonly used units follows.
USA Unit Abbr. or Symbcl Metric Equivalent Abbr. or Symbol
Weight
Ounce oz. 28.35 grams g
Pound lb or # 0.454 kilogram kg
Capacity
(U.S. liquid)
Fluidounce fil oz 29.57 milliliters mlPint pt 0.473 liter
Quart qt 0.946 liter 1
Gallon gal 3.785 liters
Length
Inch in. 2.54 centimeters cm
Foot ft 30.48 centimeters cm
Yard yd 0.9144 meter m
Mile mi 1.609 kilometers km
Area
Square Inch sq in. or in. 2 6.452 square sq cm or cm2
centimeters
Square Foot 3q ft or ft 2 0.093 square meter sq m or m2
Volume
.3 3Cubic Inch cu in. or in. 16.39 cubic cu cm or cm
centimetersCubic Foot cu ft or ft 3 0.028 cubic meter cu m or m3
Force
Pound lb 4.448 newtons N4.448 x 105 dynes
3
Downloaded from http://www.everyspec.com

1.0 BACKGROUND DISCUSSION
This volume deals with the variables involved in Army aircraft design impactconditions and the effects of resulting impact forces on the human body. Anunderstanding of the impact conditions and of the ability of the human bodyto survive them is necessary for the effective design of more crash-resistantaircraft. The following background discussion presents general considera-tions that are of importance in undeastanding and applying the includedinformation.
The overall objective of designing for crash resistance is to eliminateunnecessary injuries and fatalities in relatively mild imDacts. Results fromanalyses and research have shown that the relatively small cost in dollarsand weight of including crash-resistant features is an extremely wiseinvestment. Consequently, new generation aircraft are being procured torather stringent crash-resistant requirements.
To maximize aircraft crash resistance or, in the sense being discussed, toprovide as much occupant protection as possible, all aspects of the completesystem must be considered. In other words, every available subsystem must beemployed to the fullest extreme in order to maximize the protection affordedto vehicle occupants. When an aircraft impacts the ground, deformation ofthe ground absorbs some energy. This is an uncontrolled variable since thequality of the impacted surface usually cannot be selected by the pilot. Ifthe aircraft lands in the proper attitude and on an appropriate surface, thelanding gear can be used to absorb a significant amount of the impactenergy. After stroking of the gear, crushing of the fuselage provides tienext level of energy absorption. Of course, one of the functions of thefuselage is to provide a protective shell around the occupant while energy-absorbing stroke is occurring outside the shell. The functions of the seatand restraint system are to restrain the occupant within the protective shellduring the crash sequence and to provide additional energy-absorbing stroketo further reduce the loads. The structure and components immediately sur-rounding the occupant also must be considered. Structures such as cycliccontrols, glare shields, instrument panels, and sidewalls, must be delethal-ized in some manner if they lie within the strike envelope of the occupant.
The original edition of the Design Guide dealt primarily with modificationsthat cnuld be made to existing aircraft to increase their crash resistance;now, two approaches to improving aircraft crash resistance are open. Thefirst approach is to influence the design of new aircraft, and the second isto improve the crash resistance of existing aircraft. Obviously, much higherlevels of crash resistance can be achieved in the design and development ofnew aircraft if crash resistance is considered from the beginning. This isbeing accomplished at the present time through the use of procurement pack-ages that include pertinent specifications that require certain levels ofcrash resistance of various subsystems as well as for the entire aircraft.However, some of the available potential is still being lost due to the his-torical approach used in designing aircraft. The basic aircraft is designedleaving space and providing attachment provisions for subsystems. Later thesubsystems are designed arid then are limited by the previously established,somewhat arbitrary, boundary conditions. The boundary conditions may unneces-sarily limit the performance of the subsystems. The better approach is that
4
Downloaded from http://www.everyspec.com

in which all systems and subsystems are, at least preliminarily, designed atthe same time. This approach enables subsystem considerations to affect thelarger systems and will produce a more nearly optimum vehicle.
The same principles for improving crash resistance can be applied to theretrofit of existing aircraft; however, the "cast-in-concrete" status ofexisting production structure is a more costly arid difficult obstacle toovercome. When crash resistance features must be included through retrofit,the level that can be achieved is usually reduced. However, even in r~trofitsituations, the overall objective can be met; i.e., occupant protection canbe maximized to eliminate unnecessary injuries.
As mentioned above, the entire system should be considered in any analysisresulting in apportionment of the crash energy to be absorbed by the variouscomponents. However, any valid systems approach will consider probablealternate crash impact conditions wherein all subsystems cannot perform theirdesired functions; for example, an impact situation in which tre landing gearcannot absorb its share of the impact crash energy because of the angle ofimpact, loss of gear, or terrain properties. To achieve the overall goal,therefore, minimum levels of crash protection have been required of thevarious individual subsystems, such as the seat.
In earlier editions of the Design Guide, requirements were given for provid-ing occupant protection in crashes up to and including the severity of the95th-percentile survivable crash. With the deployment of aircraft designedfor crash safety, the link to the 95th-percentile survivable crash pulse hasbeen dropped. and the recommended design environment is simply presented asthe design impact pulses. The severity of a survivable crash pulse may bemuch greater for the new aircraft than for aircraft having no crash-resistantrequirements placed upon them during their development. The extent of thecrash protection provided to the occupant cannot indefinitely continue to belinked to the survivability of the crash, as improved crash resistanceincreases the severity of the survivable crash producing a never-ending in-crease in the level of crash resistance at the expense of aircraft perform-ance. The crash resistance levels recommended herein are felt to be a nearoptimum mix of requirements including consideration of life cycle cost,weight, and performance.
Also in earlier editions of the Design Guide, information was provided ondesign of fixed-wing aircraft. Considering the volume of new information oncrash-resistant design and in an effort to ensure that the size of this docu-ment remains within reasonable limits, only the primary aircraft in the Armyinventory are considered. Therefore, information given herein is intended toapply primarily to rotary-wing aircraft.
5
Downloaded from http://www.everyspec.com

2. DEFINITIONS
2.1 GENERAL TERMS
The following text defines words commonly used in discussions of aircraftdesign crash impact conditions:
0 The Term "G"
The ratio of a particular acceleration (a) (a negative accelerationmay be referred to as a deceleration) to the accel ration (g) due togravitational attraction at sea level (32.2 ft/secL), G = a/g.With respect to the crash impact conditions, unless otherwise speci-fied, all acceleration values (G) are those at a point approximatelyat the center of the fuselage floor. In accordance with common prac-tice, this report will refer to accelerations measured in G. Toillustrate, it is customarily understoog that 5 G represents anacceleration of 5 x 32.2, or 161 ft/sec . As a result, crashforces can be thought of in terms of multiples of the weight ofobjects being accelerated. Therefore, also in keeping with commonpractice, the term G is used in this docurment to define accelera-tions or forces.
* Survivable Accident
An accident in which the forces transmitted to the occupant throughhis seat and restraint system do not exceed the limits of humantolerance to abrupt accelerations and in which the structure in theoccupant's immediate environment remains substantially intact to theextent that a livable volume is provided for the occupants through-out the crash sequence.
• Survival Envelope
The range of impact conditions--including magnitude and direction ofpulses and the duration of forces occurring in an aircraft acci-dent--wherein the occupiable area of the aircraft remains substan-tially intact, both during and following the impact, and the forcestransmitted to the occupants do not exceed the limits of human toler-ance when current state-of-the-art restraint systens are used.
It should be noted that, where the occupiable volume is altered ap-preciably through elastic deformation during the impact phase, sur-vivable conditions may not have existed in an accident that, frompostcrash inspection, outwardly appeared to be survivable.
* Strike Envelogp_
The extent of space surrounding a restrained occupant defined by theflailing of extended body parts during a crash impact of theaircraft. Parts of the body may strike objects located within thisenvelope,
6
Downloaded from http://www.everyspec.com

2.2 AIRCRAFT PARAMETERS
a Aircraft Coordinates
Positive directions for velocity, acceleration, and force componentsand for pitch, roll, and yaw are illustrated in Figure 1.
YAW
+XROLL x
NOTE: RIGHT-HAND RULE DOES NOT APPLY.
FIGURE 1. AIRCRAFT COORDINATE AND ATTITUDE DIRECTIONS.
* VelocitL Change in Major Impact (AV)
The decrease in velocity of the airframe during the majior impact,expressed in feet per second, The major impact is the one in whichhighest forces are incurred, ornt necessarily the initial impact.For the acceleration pulse shown in Figure 2, the major impactshould be considered ended at time t2. Elastic recovery in thestructure will tend to reverse the direction of aircraft velocitybefore t2.
7
Downloaded from http://www.everyspec.com

A
PEAK
o0
I- AVERAGE- T
0 1-J
t t3 TIM
o2- I
FIGURE 2. TYPICAL AIRCRAFT FLOOR DECELERATION PULSE.
Should the velocity actually reverse, its direction must be consid-ered in computing the velocity change. For example, an aircraftimpacting downward with a vertical velocity component of 30 ft/secand rebounding with an upward component of 5 ft/sec should be con-sidered to experience a velocity change
AV w 30 - (-5) = 35 ft/sec
during the major, impact. After the aircraft rebounds upward, grav-ity will accelerate it downward again, as illustratea oy the nega-tive acceleration between t 2 and '3 in Figure 2.
Longitudinal Velocity Change
The decrease in velocity during the major impact measured along thelongitudinal (roll) axis of the aircraft. The velocity may or maynot reach zero during the major impact. For example, an aircraft im-pacting the ground at a forward velocity of 100 ft/sec and slowingto 35 ft/sec would experience a longitudinal velocity change of65 ft/sec during this impact.
8
Downloaded from http://www.everyspec.com

* Vertical Velocity Change
The decrease in velocity during the major impact measured along thevertical (yaw) axis of the aircraft. The vertical velocity gener-ally reaches zero during the major impact. (Where vertical reboundis present in a crash impact, the rebounding (negative) velocity isadditive in calculating the total vertical velocity change.)
* Abrupt Accelerations
Accelerations of short duration primarily associated with crash im-pacts, ejection seat shocks, capsule impacts, etc. One second isgenerally accepted as the dividing point between abrupt and pro-longed accelerations. In abrupt accelerations the effects on thehuman body are limited to mechanical overloading (skeletal and softtissue stresses), there being insufficient time for functional dis-turbances due to fluid shifts.
a Rate of Onset
Rate of application of G's, expressed in G's per second (rate ofchange of acceleration).
Rate of Onset (G's per second)
* Flight Path AnQle
The angle between the aircraft flight path and the horizontal at themoment of impact (see Figure 3).
a Terrain Angle
The angle between the impact surface and the horizontal, measured ina vertical plane (see Figure 3).
* Impact Angle
The angle between the flight path and the terrain, measured in avertical plane. The impact angle is the algebraic sum of the flightpath angle plus the terrain angle (see Figure 3).
* Attitude at Impact
The aircraft attitude in degrees at the moment of initial impact.The attitude at impact is stated in degrees of pitch, yaw, and roll(see Figure 1).
9
Downloaded from http://www.everyspec.com

%AL
S• •. PTM' IMPACT ANGLE
UPHILL FLIGHT
FLIGHT PATH
••-- IMPACT
ANGLE,, O I OA NG LE
+ATT TERRAINANGLE"
____maBHOdRIZONTALte
T~TERRAIN
UOWHILL FLIGHT
FIGURE 3. SCHEMATIC OF ~~FLIGHT PATH, ERIADIPC NLS
2.3~ PVALP ATHRTERTEIS
In order to minimize the confusion sometimes created by the termi-nology used to describe the directions of forces appil 1ed to tihebody, a group of NATO scientists compiled the accelerativeterminology table of equivalents shown in Figure 4 (Reference 2).
Terminology used throughout this guide is compatible with tne NATOterms as illustrated.
10
Downloaded from http://www.everyspec.com

Headward(+G) Direction of
accelerative force
Vertical
Back to ch(st Headward - Eyeballs-down(sternumward) Lateral right Tailward Eyeballs-up
(+Gy) TransverseLateral right - Eyeballs-
leftLateral left - Eyeballs-
rightBack to chest - Eyeballs-
inf Chest Chest to back - Eyeballs-Lateral leftou
(-Gy to back out
(spineward) Note:
Tailward (-Gx The accelerative force on(-G Z) the body acts in the samedirection as the arrows.
FIGURE 4. TERMINOLOGY FOR DIRECTIONS OF FORCES ON THE BODY.
Human Tolerance to Crash Impact Conditions
Obviously, the tolerance of the human body to crash impact condi-tions is a function of many variables, including the unique charac-teristics of each person as well as the loading variables. Theloads applied to the body include decelerative loads imposed byseats and restraint systems as well as localized forces due toimpact with surrounding structure. Tolerable levels of the deceler-ative loads depend on the direction of the load, the orientation ofthe body, and the means of applying the load. For example, thecritical nature of the loads parallel to the occupant spine mani-fests itself in any of a number of spinal fractures. Forces per-pendicular to the occupant spine can produce spinal fracture throughflexure that results from jackknife bending over a lap-belt-onlyrestraint. The lap belt might inflict injuries to the internalorgans if it is not retained on the pelvic girdle but is allowed toexert its force above the iliac crests in the soft stomach region.Excessive rotational or translational acceleration of the head canproduce concussion. Further, skull fracture can result from local-ized impact with surrounding structure. Therefore, tolerance is afunction of the method of occupant restraint as well as the variableof specific occupant makeup.
11
Downloaded from http://www.everyspec.com

For the purpose of this document, human tolerance is defined as aselected array of parameters that describe a condition of deceler-ative loading for which it is believed there is a reasonable prob-ability for survival without major injury. As used in this volume,designing for the limits of human tolerance refers to providingdesign features that will maintain these conditions at or belowtheir tolerable levels to enable the occupant to survive the givencrash impact conditions.
* Submarininc
A rotation of the hips under and about the lap belt as a result of aforward inertial load exerted by deceleration of the thighs andlower legs accompanied by lap belt slippage up and over the iliaccrests. Lap belt slippage up and over the iliac crests can be a di-rect result of the upward loading of the shoulder harness straps atthe center of the lap belt.
* Dynamic Overshoot
The amplification of decelerative force on cargo or personnel abovethe floor input decelerative force (ratio of output to input). Thisamplification is a result of the dynamic reponse of the system.
Rebound
Rapid reLurrn toward the original position upon release or rapidreduction of the deforming load, usually associated with elasticdeformation.
* Anthropomorphic Dummy
A device designed and fabricated to represent not only the appear-ance of humans but also the mass distribution, joint locations,motions, geometrical similarities such as flesh thickness and load/deflection properties, and relevant skeletal configurations such asiliac crests, ischial tuberosities, rib cages, etc. Attempts arealso made to simulate human response of major structural assemblagessuch as thorax, spinal column, neck, etc. The dummy is strappedinto seats or litters and used to simulate a humarn occupant indynamic tests.
12
Downloaded from http://www.everyspec.com

3. AIRCRAFT DESIGN CRAME IPACT CONDITIONS
3.1 INTRODUCTION
Design crash impact conditions for Army aircraft are specified by MIL-STD-1290, "Light Fixed- and Rotary-Wing Aircraft Crash Resistance" (Reference 1).This standard contains complete information on impact velocities, angles, andattitudes to be used by aircraft designers to assure that structures willsatisfy crash-resistance requirements. These criteria for new aircraftdevelopment were initially substantiated through the use of actual crash andengineering test data.
3.2 HISTORICAL DEVELOPMENT OF CRITERIA
The major source of data for initial development of impact conditions wasactual crash data for U.S. Army aircraft. Data were accumulated through astuoy of U.S. Army accidents for the periods 1 July 1960 through 30 June 1965and I January 1971 through 31 December 1976. Data from before 1977 consideredpertinent were also obtained from FAA (then Civil Aeronautics Board), U.S.Navy, and U.S. Air Force accident reports.
Rotary-wing and light fixed-wing aircraft of mission gross weight no greaterthan 12,500 lb were included. The accident cases selected were limited tothose in which one or more of the following factors applied: (1) Substantialstructural damaqe, (2) postcrash fire, (3) personnel injuries, and (4) atleast one person survived the crash. Mid-air collisions and other accidentsresulting in catastrophic uncontrolled free falls from altitudes of 100 ft ormore were not considered. Such accidents almost invariably result in random,unpredictable crash kinematics and nonsurvivable impact forces, and are oflittle value in establishing realistic crash survival envelopes that would beuseful to the aircraft designer. Analysis of impact forces in many of theaccidents involving fire was impossible due to extensive burn damage to theaircraft.
Altogether, 563 rotary-wing accidents and 92 fixed wing accidents were re-viewed in the preparation of earlier editions of the Design Guide. Impactattitude data from an additional 108 attack and 10 cargo helicopters (nissiongross weight greater than 12,500 lb) collected during 1971-1976 were alsoutilized in the preparation of later editions.
Analysis of the data from Army accident records showed a similarity in impactconditions between rotary- and light fixed-wing STOL aircraft (0-1, U-6,U-I). Except for the lateral direction, the similarities between rotary-wing
and light STOL aircraft impact conditions were sufficient to allow treatingthem as being the same.
The major velocity change was estimated for each of the cases used. This wasdone for all three coordinate axes. Design impact conditions were thenselected such that 95 percent of the cases used were within the selectedvalues. These impact conditions were thought to include all crash conditionsfor which it would be economically and technically feasible to provide crashprotection. The initial criteria were assumed to be applicable, sincesurvivors had experienced crashes of equivalent severity.
13
Downloaded from http://www.everyspec.com

Subsequent examination of the crash data supported the criteria in general.However, all data from such studies were nut directl, comparable, becauselater data involved newer, more crash-resistant aircraft and survival in moresevere crashes could be expecced. Economic and operational constraints dideventually necessitate that the criteria be relaxed in several areas. Speci-fically, longitudinal velocity changes and attitude angles were reduced as aresult of trade-offs of crash-resistance factors with operational factors.However, lateral and vertical velocity change criteria remain unchanged fromthe original recommendations (I-G lift was added to the vertical impactcriteria).
3.3 IMPACT CONDITIONS
MIL-STD-1290 specifies seven impact conditions which must be considered in thedesign of the aircraft. These criteria were developed as an optimized designcriteria based on crash statistics (described in the previous section), humantolerance, system cost, weight, and performance. The criteria are shown inTable 1.
TABLE 1. CRASH IMPACT DESIGN CONDITIONS, WITH LANDING
GEAR EXTENDED, MIL-STO-1290
Condition Impact Direction Object Velocity Chango
No. ( t Axes) Impact AV (ft/sec)
I Longitudinal 20(cockpit) Rigid
2 Longitudinal vertical 40(cabin) barriers
e Vertical* Rigid 424 Lateral, Type I** horizontal 25
5 Lateral, Tyle II*** surfoce 30
6 Combined high
angle* Rigid
Vertical horizontal 42
Longitudinal surface 27
7 Combined low
angle PlowedVertical Soil 14
Longitudiial 100
*For the case of retracted landing gear the seat and airframe com-
bination shall have a vertical crash impact design velocity changecapability of at least 26 ft/sec.
**Type I - Light fixed-wing aircraft.
***Type II - Rotary-wing, including tilt-prop/rotor aircraft.
14
Downloaded from http://www.everyspec.com

3.3.1 Longitudinal (AVx) Impact
In MIL-STD-1290 the designer is required to demonstrate analytically that thebasic airframe is capable of impacting longitudinally into a rigid verticalbarrier at a contact velocity of 20 ft/sec without crushing the pilot andcopilot stations to an extent which would either preclude pilot and copilotevacuation of the aircraft or preclude a livable volume for the aircraft occu-pants. For this impact, the engine(s), transmission, and rotor system arerequired to remain intact and in place in the aircraft. The basic airframe'scapability to impact longitudinally into a rigid barrier or wall at a contactvelocity of 40 ft/sec without reducing the length of the passenger/troop com-partment by more than 15 percent should be demonstrated analytically. Anyconsequent inward buckling of walls, floor, and/or roof is not to be hazard-ous to the occupants and/or restrict their evacuation.
3.3.2 Vertical (AVz) Impacts
MIL-STD-1290 requires the designer to analytically demonstrate the capabilityof the aircraft system, with rotor/wing lift equal to design gross weight(DGW) and with landing gear extended, to withstand vertical impacts of42 ft/sec on a rigid horizontal surface without (1) reducing the height ofthe cockpit and passenger/troop compartments by more than 15 percent and (2)allowing the occupants to experience injurious accelerative loading. Forvertical impacts higher than 42 ft/sec, the crew and troop compartmentsshould preclude catastrophic collapse of overhead structure and maintain asurviv~ble volume for occupants. It is desired that in a 50 ft/sec impactthe height of occupiable areas not be reduced by ,ore than "D percent aridthat surrounding structures not fracture. For the case of retracted landinggear the designer is required to analytically demonstrate the capability ofthe aircraft to withstand impacts of at least 26 ft,/sec on a rigid horizontalsurface without (1) reduction in height of the cockpit and passenger/troopcompartments of more than 15 percent or (2) causing the occupants to experi-ence injurious accelerative loading. The above capab lities, with gear up ordown, are required for all aircraft orientation (attitudes) upon impact in+150 to -50 pitch and +100 roll as defined in Figure 5A (taken fromMIL-STD-1290).
3.3.3 Lateral (AVz) Impacts
Lateral accelerations are found to be present particularly in accidents wherea rotary-wing aircraft autorotated into trees or where rotor blades strucktrees or other obstacles during normal operation (Reference 3). Impact withtrees often causes the fuselage to rotate and finally impact the ground onits side. Two out of three helicopters that hit the ground with a yaw aresubjected to enough lateral forces to cause them to roll over (Reference 4).Roll over impacts are discussed in Section 3.2.5.
The designer should demonstrate the capability of the aircraft to withstandlateral impacts of 30 ft/sec without reducing the width of occupied areas bymore than 15 percent. To design for this impact, the enginr(s), trans-mission, and rotor system need not be considered intact or retained on theaircraft.
15
Downloaded from http://www.everyspec.com

PITCH ANGLE(DEGREES)
-15
_____ 10 ___
(A) ROLL AND PITCH .5(VER (ICAL)
ROLL
-10-5 0 5 +10 ANGLE(DEGREES)
-5
PITCH ANGLE(DEGREES)
(a) PITCH AND YAW ..5
(LONGITUDINAL)
_-20 -15 -10 -,5 0 10 -o 5 ý20 YAW/ANGLE
(DEGREES)
ROLL ANGLE(DEGREES)
+10
(C) ROLL AND YAW -IS -10 -5 0 ÷ 0 ' 1N YAW(LATERAL) 0 . 1 ANGL
-DEGREES)
-5
FIGURE 5. AIRCRAFT IMPACT ATTITUDES ENVELOPES.
16
Downloaded from http://www.everyspec.com

3.3.4 Combined Impacts
The designer should analytically demonstrate the capability of the aircraft,with IG DGW rotor/wing lift and with landing gear extended, to withstand thefollowing combined impacts without a reduction of the cockpit or cabin compart-ments that would seriously injure the occupants: (1) a combined impact on arigid horizontal surface with vertical and longitudinal velocity changes of 42and 27 ft/sec respectively, and (2) a combined impact on plowed soil for theconditions described in Figure 6.
IMPACT CONDITIONS
1. SOIL OF CALIFORNIA BEARING RATIO=2.52. AIRCRAFT PITCH (f)=5° NOSE DOWN
3. AIRCRAFT ROLL (6)=±10O4. AIRCRAFT YAW (Y)=±20'5. FLIGHT PATH ANGLE (a)=-8S DOWN6. GROUND IMPACT SPEED = 100 FT/SEC7. IMPACT SINK SPEED =14 FT/SEC
\11
X GROUND LEVEL I
FIGURE 6. LOW ANGLE IMPACT DESIGN CONDITIONS.
3.3.5 Rollover Impacts
The aircraft should be designed to resist an earth impact loading as occurswhen the aircraft strikes the ground and rolls to either a 900 (sideward) or1800 (inverted) attitude. If the forward fuselage roof or side can impactthe ground, assume it is buried to a depth of 2.0 in. in soil and the load isuniformly distributed over the forward 25% of the occupiable iuselage length.The fuselage should sustain a 4 G (i.e., 4x aircraft DGW) load applied over thearea(s) described for either inverted or sideward attitudes without permittingdeformation sufficient to cause injury to seated, restrained occupants. Forboth cases, the 4 G distributed load shall be analyzed for any angle of loadapplication ranging from perpendicular to the fuselage skin (i.e., compressiveloading) to parallel to the fuselage skin (i.e., shear loading). When design-ing for this condition, assume that emergency exit doors and windows cannotcarry any loading.
17
Downloaded from http://www.everyspec.com

Where the aircraft configuration precludes the occurrence of the above, an al-ternate design criterion should be applied. The aircraft should be assumedto be resting inverted on the ground in the most likely attitude which iscritical for the safety of the occupants. Loads should then be individuallyapplied locally and consist of the following multiplication factors times theDGW:
1. Perpendicular to the ground: 4
2. Parallel to the ground, along the longitudinal axis: 4
3. Parallel to the ground, along the lateral axis: 2
MIL-STD-1290 does specify a complete range of pitch and roll angles to be con-sidered by the designer. As stated above, for vertical impacts Figure 5Ashows that pitch may range from +150 to -50 and roll from +100 to -100. How-ever, when pitch and roll are combined, the extremes are limited, as shown bythe figure; for example, the designer need not consider +150 pitch combinedwith +100 roll. The criteria were modified in this way because of thelesser probability of these combined conditions and because of severe fuse-lage weight penalties associated with combined extremes of pitch and roll.
MIL-STD-1290 does not prescribe off-axis attitudes for longitudinal and lat-eral impacts. However, to assure survivability in such impacts with pitch,yaw, or roll, it is recommended that envelopes of impact attitude also beconsidered in the design phase for longitudinal and lateral impacts. Recom-mended envelopes are shown in Figures 5B and 5C, respectively.
18
Downloaded from http://www.everyspec.com

4. OCCUPANT EXPOSURE DATA
4.1 INTRODUCTION
The conditions to which an aircraft occupant is exposed during a crash play amajor role in occupant survivability. This chapter summarizes a study on in-jury in U.S. Army helicopter crashes (Reference 5) during a six-year period,1980-1985. The type and number of aircraft are listed in Section 4.2. Typi-cal impacted terrain is discussed in Section 4.3, and frequency and mechan-isms of injury are addressed in Sections 4.4 and 4.5, respectively.
4.2 ACCIDENT STATISTICS
A study reporting the injury patterns and mechanisms in U.S. Army helicoptercrashes was conducted over a six-year period, 1 October 1979 to 30 September1985 (Reference 5). All U.S. Army Class A and B mishaps involving AH-I(Cobra), OH-58 (Kiowa), UH-I (Iroquois), and UH-60 (Black Hawk) "elicopterswere analyzed for this study. Class A mishaps are defined as ; shaps thatresult in a total cost of property damage, occupational illness, or injurythat is $500,000 or greater or an aircraft is destroyed, or permanent totaldisability or a fatality occurs. Class B mishaps are defined as mishaps inwhich the total cost of property damage and personnel injuries is greaterthan $100,000 but less than $500,000,or permanent partial disbility or hos-pitalization of five or more personnel in a single occurrence occurs (Refer-ence 6). Mishaps of lesser degree were not included in the study since theyusually do not involve significant ground impact or injury. The data wasobtained from computer data tapes supplied by the U.S. Army Safety Center.
4.2.1 Number of Aircraft
Included in the study were 303 aircraft involved in 298 separate mishapsduring the six-year analysis period. More than one aircraft was involved infive of the mishaps. Table 2 lists the total number of aircraft, by type,used in this study. In comparison, each aircraft varies in size, capacity,performance, and mission requirements, as seen in Table 3. It should also berecognized that the Black Hawk is the only one of the study aircraft forwhich crash resistance was a major design objective.
TABLE 2. U.S. ARMY AIRCRAFT IN ACCIDENTSTUDY FOR FY 1980 - FY 1985
Class Class!yke A B Number
AH-1 37 17 54OH-58 69 16 85
UH-1 99 35 134UH-60 23 7 30
Total 228 75 303
19
Downloaded from http://www.everyspec.com

TABLE 3. AIRCRAFT COMPARISON DATA
Gross MaximumSeating Weight Speed
Designation Name Mission Capacity (ib) (kt)
AH.-1S Cobra Attack 2 10,000 190
OH-58C Kiowa Observation 4 3,200 120
UH-1H Huey Utility 13 9,500 124
UH-60A Black Utility 16 20,250 193
Hawk
4.2.2 Number of Accidents
During the six-year study period, there were 223 Class A mishaps and 75Class B mishaps. This represents 84 percent of all Army Class A and Bhelicopter mishaps occurring over the six-year period.
The Class A, B, and combined accident rates for the four study aircraftduring the six-year period are summarized in Table 4. The relative risk ofhaving a Class A or B mishap for the UH-60 and AH-1 series aircraft wasapproximately three times that of the UH-1, whereas the OH-58 has a mishaprate only slightly higher than that of the UH-1.
TABLE 4. MISHAP RATES BY AIRCRAFT TYPE FOR FY 1980 -
FY 1985 (MISHAPS PER 100.000 FLYING HOURS)
Type Relative
Aircraft Cla A ULasst Totl R....isk..
AH-i 5.6 2.6 8.2 2.7
OH-58 4.0 0.9 A.9 1.6
UH-I 2.2 0.8 3.0 1.0
UH-60 6.9 2.5 9.4 3.1
20
Downloaded from http://www.everyspec.com

4.3 IMPACTED TERRAIN
The probability of impacting a given type of terrain may influence an air-craft design in several ways. For example, the types of landing gear and theescape systems installed may be based on the terrain most likely to be encoun-tered in operation. An analysis of terrain characteristics was made usingthe data from the previously mentioned study of the 298 reported mishaps.Table 5 lists the distribution of the general terrain characteristics intowhich the aircraft impacted. Of the 303 aircraft involved, 13 accidentreports listed two types of the terrain, 216 listed one, arnd 74 had no com-ments. This resulted in a total of 242 responses. Table 6 lists the typesof surface impacted by the 303 aircraft; 13 reports had two types, 228 re-ports listed one type, and 62 had no comments, resulting in a total of 254responses.
TABLE 5. DISTRIBUTION OF THE GENERAL TERRAIN
IMPACTED BY ARMY AIRCRAFT DURING THE
PERIOD FY 1980 - FY 1985
Number of
Terrain Aircraft Percent
Flat 84 34.7
Water 14 5.8
Rolling 78 32.2Desert 18 7.4
Mountains 48 19.8
Total 242 99.9
TABLE 6. DISTRIBUTION OF THE SURFACE IMPACTED
BY ARMY AIRCRAFT DURIVG THE PERIOD
FY 1980 - FY 1985
Number of
Surface Aircraft Percent
Prepared 33 13.0
Surface
Sod 160 63.0Soggy 38 15.0
Ice 3 1.2
Snow 16 6.3Water 4 1.6
Tota 1 254 100.1
21
Downloaded from http://www.everyspec.com

These data show that 87 percent of impacted surfaces were unprepared. Thus,energy-absorbing landing gear cannot be expected to function with full effi-ciency in many accidents. Therefore, as much energy absorption as possibleshould be achieved by the seats, as they are not terrain sensitive. Thelower fuselage structure should also be designed to minimize the effects ofplowing or earth scooping during a longitudinal impact (Volume 111). For aprimarily vertical impact, loose soil would prove beneficial through addi-tional energy being absorbed by soil compaction. On the other hand, in aprimarily horizontal (longitudinal and/or lateral) impact, loose soil mayincrease deceleration due to earth scooping.
4.4 IMPACT INJURY FREQUENCY
The Army classifies all mishaps according to survivability: survivable, par-tially survivable, or nonsurvivable (Reference 7). A survivable mishap isone in which the forces at impact were considered to be within the limits ofhuman tolerance. The occupied volume in a survivable mishap must also be suf-ficiently maintained throughout the crash sequence to permit occupant sur-vival in all potentially occupied areas. A nonsurvivable mishap is one inwhich either of these two conditions is not met in all potentially occupiedpositions. Partially survivable mishaps have some survivable and some nonsur-vivable positions. These judgments are made by the investigation board basedsolely on the condition of the aircraft after impact without consideration ofactual occupancy or injury sustained by the occupants. This classificationmethod was used to categorize the data discussed in the following sections.
4.4.1 Number of Occupants and injuries
During the six-year study period, FY 1980 through 1985, there were 1,060 occu-pants aboard the mishap aircraft. The injured occupants numbered 611, ofwhich 136 were fatally injured. Table 7 lists the number and kind ofinjuries. Distinction between disabling and nondisabling injury was madebased on the criteria established in DA PAM 385-95 (Reference 7).
TABLE 7. NUMBER OF OCCUPANTS AND INJURIES
FY 1980 - FY 1985
Number
Injury Of Occupants
Fatalities 136
Disabling Injury 372
Nondisabling Injury 103
No Injury 449
Total Number of AircraftOccupants 1060
22
Downloaded from http://www.everyspec.com

4.4.2 Injury by Body Reqion
When considering crash-resistance improvements to an airframe, it is impor-tant to know what regions of the body are at risk for injury, particularly insurvivable crashes. Table 8 shows the distribution by body region of all2,090 injuries reported over the 1980-1985 study period for all mishaps andfor survivable mishaps. This injury total represents all reported injuries(an occupant may have had more than one injury). Note that the severity ofeach injury has been encoded in the Army Safety Center data base only since1983. As a result, the majority of injuries considered were not classifiedaccording to severity. In Table 8, therefore, "All Injury" includes allreported injuries and all unclassified injuries, and "major"Fatal" injuriesrepresents all fatal and major injuries reported since 1983.
The most frequent form of fatal injury identified in survivable helicoptercrashes was head injury (62.5 percent). This occurred despite mandatory useof flight helmets by helicopter crewmembers. The second most common locationof fatal injury was the thorax (18.8 percent).
TABLE 8. DISTRIBUTION OF INJURY BY BODY REGION (PERCENT)
All Mishaps Survivahle Mishaps
All Major/ All Major/
Injury Fatal Fatal Injury Fatal Fatal
Body Region N--2.)0 (N545) (N214) (Nn1484) (N=260) (N=32)
General 3.8 4.6 6.1 1.8 1.9 6.3
Head 23.8 27.0 41.1 22.9 26.2 62.5
Neck 3.7 0.9 0.5 4.9 1.5 0
Cervical Spine 2.3 2.8 3.7 1.6 3.9 12.5
Thorax 19.1 28.6 42.5 14.3 18.5 18.8
Abdomen 6.7 6.2 4.7 5.3 5.0 0
Vertebrae (thoracic 6.5 9.2 1.4 6.5 12.3 0
and lumbar)
Upper Extremities 12.3 7.3 0 15.5 9.6 0
Lower Extremities 21.7 13,8 0 27.4 21.2 0
Note: There were 8 injuries for which a body region was not assigned.
23
Downloaded from http://www.everyspec.com

Although extremity injuries generally do not result in fatalities, theyconstituted an excessively high percentage of the total injuries. Extremityinjuries are of considerable concern in the military because they hinderegress from a damaged, and possibly burning, aircraft.
Abdominal injury was relatively rare in Army helicopter crashes constitutingonly 5.3 percent of injuries in survivable mishaps. The majority ofabdominal injuries were superficial, consisting of contusions, abrasions, andlacerations. No fatal abdominal injuries were reported.
4.4.3 injury by Aircraft
Table 9 summarizes the degree of occupant injury for crashes involving theAH-1, OH-58. UH-1, and UH-60 during the six-year study period. For allmishaps, the UH-60 had a higher percentage of fatalities relative to theother aircraft because of higher impact velocities. For survivable crashes,the table shows that the degree of injury is similar to that of the otheraircraft.
TABLE 9. DEGREE OF INJURY FOR OCCUPANTS OF CLASS A AND B MISHAPS
All Mishaps
NoFatal Disabling Nondisabling _.nUrv Total
AH-i 23(19.8) 31(26.5) 14(11.8) 49(41.9) 117OH-S8 24(10.8) 88(39.8) 20 (9.1) 89(40.3) 221UH-1 55 (9.3) 214(36.2) 60(10.1) 263(44.4) 592UH-60 34(26.11 39(309.01•. -9) 48(36.9) 130
136(12.8) 372(35.1) 103(9.7) 449(42.4) 1,060
Survivable Mishaps
NoFatal Disabling Npndisablinq Inuury Total
AH-1 7(7.1) 31(31.3) 14(14.1) 47(47.5) 990H-58 12(6.1) 86(43.4) 20(10.1) 80(40.4) 198UH-1 17(3.2) 208(38.5) 59(10.9) 256(47.4) 540UH-60 7(8.1) 31(36.1) _i O._-1 39(45.4) 86
43(4.7) 356(38.6) 102(11.1) 422(45.7) 923
Indicates row percent.
24
Downloaded from http://www.everyspec.com

Table 10 shows that the vertical velocity change in the survivable crasheswas much greater for the UH-60 than for the other three aircraft. The meanvelocity change was twice that experienced by the other aircraft, and thevelocity change experienced in the most severe 5 percent of the survivableaccidents exceeded the desiqn criteria of 42 ft/sec identified in Section 3.
TABLE 10. VERTICAL VELOCITY CHANGE IN SURVIVABLECRASHES (FEET PER SECOND)
AirCraft Mean 95th-Percentile
AH-1 13.5 39.3
OH-58 12.5 29.5
UH-1 11.5 33.5
UH-60 28.9 47.2
This clearly demonstrates the benefits of a crash-resistant aircraft design.The same degree of injury is being experienced, but in more severe crashes.The higher impact velocities for the UH-60 are probably due to different per-formance characteristics and a higher percentage of severe crashes associatedwith a new aircraft as well as the fact that greater crash resistance placesmcre severe crashes in the survivable category.
When the distribution of injury by body -egion was compared among the fourstudy aircraft using chi-square analysis, it was determined that the AH-1,OH-58, and UH-i1 had similar distributions which differed from the distribu-tion seen in the UH-60. Table 11 compares the injury distribution by bodyregion of the UH-60 versus the other three aircraft combined for all surviv-able mishaps, and Figure 7 graphically illustrates this comparison. Whensurvivable mishaps were considered, there was a significantly greater propor-tion of thoracic injury in the UH-60 for both the all-injury category andthe major/fatal category.
A reciprocally lower incidence of spinal and lower extremity injuries in theUH-60 is shown. The reduced number of spinal injuries is attributed to thecrash-resistant crewseats used in the UH-60, which are designed to reduce theG loads on the occupant's spine. Similarly, the veduced incidence of lowerextremity injuries may be related to the crash-resistant seating structure.
25
Downloaded from http://www.everyspec.com

TABLE 11. DISTRIBUTION OF INJURY BY BODY REGION (PERCENT) -
COMPARISON BETWEEN UH-60 AND OTHER HELICOPTERS
Survivable Mishaps.All Major/Fatal
Injuries InjuriesN - 1484 N -260
Body Region UH-60 Other UH-60 Other
General 3.5 1.5 1.4 2.2
Head 26.9 22.3 23.0 27.4
Neck 2.9 5.1 0 2.2
Cervical Spine 0.6 1.7 1.4 4.8
Thorax 25.2 12.8 35.1 11.8
Abdomen 5.3 5.2 8.1 3.8
Vertebrae (thoracic 4.7 6.8 6.8 14.5
and lumbar)
Upper Extremities 11.7 16.0 8.1 10.2
Lower Extremities 19.3* 28.3* 16.2 23,1
26
Downloaded from http://www.everyspec.com

a. Frequency et all injuries, c. Frequency of all Injuries,
UH-60. UH-1, AH-t, OH-58.
E H .% < 1 =17 E D5.1
( 25.2% I~Iii
E719i7% __ K_=8.3I~ 3.%
b. Frequency of major and fatal d. Frequency of major and fatal
Injuries, UH-60 .Injuries, UH-1 , AH-1, OH -58.
7<=2
FIGURE 7. DISTRIBUTION OF INJURIES TO BODY PARTS IN SURVIVABLEU.S. ARMY AIRCRAFT ACCIDENTS, 1980-1986.
27
Downloaded from http://www.everyspec.com

4.5 MECHARISMS OF INJURY
Mechanisms of injury have been required to be reported for each injuryoccurring in Army aviation mishaps since 1983. Table 12 summarizes thereported mechanisms for these injuries.
TABLE 12. MECHANISMS OF INJURY IDENTIFIED IN SURVIVABLE CLASS A AND B MISHAPS
Struck/By/Aqain3t 345 (60.1) Caught In Or Vnder 33 ( 5.7)
Int. Obj./Structure 128 Aircraft 15Seat/Seat Armor 35 Instrument Panel 4
Cyclic 17 Restraint System, 7External Object/ Other 7
Intruding Object 31
Console 10 Experienced/Exposea To 11 (20.4)Instrument Panel 9 Excess Decel. Forces 71Ceiling 4 Mult. Mechanisms 24
Door 9 Fire 4Windshield 8 Other 18Litter 4Collcctivc 6 Thrown Fin•n kIrrAft 21 ( 3.7)
Floor 6
Restraint 26 Unknown 58 (10.1)Unknown 37Other 8
Helmet 7 Total 574 (100.0)
Indicates percent.
28
Downloaded from http://www.everyspec.com
A HUMAN TOLERANCE TO IMPACT
5.1 INTRODUCTION
The objective of this chapter is to provide the designer of aircraft systemswith a summary of available information on tolerance of the human body toforces of the type experienced in crash situations. Knowledge of human toler-ance is vital to understanding and effectively applying the principles of crashresistance design that are defined elsewhere in this guide.
A great deal of research has been conducted in the field of biodynamics, andgeneral guidelines and approximate end points have been determined. However,there still remain many areas of uncertainty and disagreement, and much moreresearch is needed to provide accurate, proven figures. An obvious difficultyis that the usual test method of stressing a specimen beyond the point offailure in order to establish tolerance limits is not possible when one isdealing with injurious and fatal ranges of forces acting on the human body.Experiments using human volunteers have necessarily been conducted, for themost part, at subcritical levels. The few instances that have inadvertentlyapproached the critical range of forces have provided valuable, but often un-verifiable, data. Test animals such as chimpanzees, monkeys, bears, pigs, andmice have been used in attempts to establish a better definition of theinjurious and fatal ranges of forces. Human cadavers also have been utilizedas test specimens. While these approaches have provided valuable data in manyareas of investigation, a means of reliably extrapolating these results to thetolerance of a live human is not yet available.
As discussed in Volume IV, mathematical models of the human body have been usedsuccessfully in studying the overall kinematic response of the body to crashforces and in evaluating the crash resistance of vehicle interiors. Mathe-matical models directly related to injury prediction are discussed in thischapter. Anthropomorphic dummies, as mechanical models, have been refined toremarkable levels of physical resemblance to the human body. However, inter-preting the results from mathematical and mechanical simulators remains a pro-blem, as tolerable levels of the predicted variables are neither well definednor widely agreed upon.
The following sections discuss the factors that affect human tolerance to im-pact and summarize the existing data on tolerable levels for various bodyparts. An in-depth review of research in human tolerance before 1970 can befound in Reference 9.
5.2 FACTORS AFFECTING HUMAN TOLERANCE
5.2.1 Body Characteristics
The tolerance of the human body to impact forces depends on a number of varia-bles, including characteristics of the individual such as age, sex, and generalstate of health. Military systems can be expected to be used by personnel whoare generally younger and in better physical condition than the general popula-tion for which much tolerance data has been obtained. Thus, in some cases, adegree of conservatism may be built into the application of tolerance criteriain designing Army aircraft. However, whole-body tolerance criteria have beenbased on experiments involving subjects seated with "correct" upright posture.
29
Downloaded from http://www.everyspec.com

Because a helicopter pilot is unlikely to maintain such posture in flight, par-ticularly when near the ground, tolerable levels of such variables as +Gz maybe significantly reduced under actual crash conditions.
5.2.2 Restraint System
The overall probability of survival in a crash depends to a large extent onthe manner of restraint. It would be extremely difficult to prevent the armsand legs from contacting the cabin interior during a severe impact, but theuse of upper and lower torso restraints to prevent such critical body partsas the head and chest from striking surrounding structure can significantlyreduce the probability of serious or fatal injury under given crash condi-tions.
The method of body restraint, of all the factors affecting human tolerance,offers the designer the greatest opportunity for effective application ofcrashworthy design. The effectiveness of the restraint system is dependentupon the area over which the total force is distributed, the location on thebody at which the restraint is applied, and the degree to which it limitsresidual freedom of movement (Reference 10).
The greater the contact area between the body and the restraint system, thegreater the human tolerance. The restraint system should be located on thebody at those points that are best able to withstand the loads exerted by thedecelerative force and that are best able to distribute further the force tothe remainder of the body. These points are primarily the pelvic girdle andthe shoulder structure. An additional restraint around the rib cage has beenshown to increase tolerance to spineward, eyeballs out (-Gx) accelerations.Restraint systems located over soft tissue tend to be much less effective,often resulting in crushing of the viscera between the restraint system andbody structures. Residual freedom of movement should be limited to an abso-lute minimum consistent with the necessary comfort and movements required bythe duties of the occupant.
5.2.2.1 Lap Belt. When restrained only by a lap belt, the occupant'stolerance to abrupt acceleration is relatively low. A complete analysis ofthe effect of lap-belt-only restraint on human tolerance is presented inReference 11. The author reviewed all available existing data from dynamictests of volunteer human subjects applicable to transport aircraft crashconditions and established minimum human tolerance levels for transportaircraft seat design. Since the data were acquired in human subject testing,the tolerance levels are minimum levels and survivable tolerance levels maybe substantially higher.
In forward-facing seats, a longitudinal impact will cause a rotation of theupper torso over the belt, a whipping action of the head, and often impact ofthe upper torso on the legs, resulting in chest, head, and neck injuries.Head injuries due to impacts with the surrounding environment are very commonfor occupants restrained only with lap belts. When longitudinal forces arecombined with a vertical component, there is a tendency for the occupant toslip under the belt to some degree. This motion, often referred to as subma-rining, can shift the belt up over the abdomen. The longitudinal componentof the pulse then causes the upper torso to flex over the belt, with the re-straining force concentrated at some point on the spine and not on the pelvicgirdle. In this configuration, tolerance is extremely low.
30
Downloaded from http://www.everyspec.com

5.2.2.2 Shoulder Harness and Lap Belt Tiedown Strap. The addition of ashoulder harness greatly reduces injuries from head impacts and helps tomaintain proper spinal alignment for strictly vertical impact forces.However, this standard configuration may be unsatisfactory for impacts withboth vertical and longitudinal components. Pressure by t he upper torsoagainst the shoulder straps causes these straps to pull he lap belt up intothe abdomen and against the lower margin of the rib cagc This movement ofthe lap belt allows the pelvis to move forward under thc '.p belt, causingsevere flexing of the spinal column, as shown in Figure 8. In this flexedposition, the vertebrae are very susceptible to anterior compression fractureand, if the lap belt slips off the top of the pelvic bone structure (over thetap of the iliac crests), severe injury can occur as a result of visceracrushing. A lap belt tiedown strap prevents raising of the lap belt by theshoulder harness and may nearly double the tolerance to impact forces.
! i SHOULDER HARNESS PULL
(/
PELVIC JOINT
EXPECTED TORSO DISPLACEMENT
FIGURE 8. PELVIC ROTATION AND SUBMARINING CAUSED BY HIGHLONGITUDINAL FORCES COMBINED WITH MODERATEVERTICAL FORCES.
The restraint system used in new Army aircraft crewseats, as defined byMIL-S-58095 (Reference 12) consists of a lap belt, lap belt tiedown strap,and two shoulder straps connected by a single-point release buckle. Thissingle lap belt tiedown and the two side-mounted lap belt tiedowns in use insome helicopters have given excellent performance in crashes.
The amount of slack in the restraint system can affect tolerance to a givenacceleration pulse. In general, the lower the elongation properties of thelink between the occupant and the seat, the greater the occupant's toleranceto an abrupt acceleration. A loose restraint system also will result in theoccupant's receiving a significantly greater magnification of the accelerative
31
Downloaded from http://www.everyspec.com

force applied to the seat than would occur with a snug system. The inertiaof the occupant will cause him to maintain a near constant velocity, inde-pendent of the decreasing velocity of the seat, until the slack in the re-straint system is taken up. As this point is reached, the velocity of theoccupant is abruptly reduced to that of the seat, resulting in high G levels.This is often referred to as dynamic overshoot. Dynamic overshoot is a com-plex phenomenon involving the elasticity, geometry, mass distribution, andthus the natural frequency of the occupant, and the restraint and seatsystems. An example is discussed in detail in Volume IV.
5.2.3 Crash Conditions
The known human tolerance levels are based on single input forces, which isnot the usual case in a crash. Crashes usually involve multiple impacts, andoften those impacts following the first are more severe. Human tolerance tothe multiple impacts of a crash may not be as high as indicated by the knownhuman tolerance levels to single impacts.
5.3 WHOLE-BODY ACCELERATION TOLERANCE
This section describes experimental results applicable to well-restrained(including full-torso restraint) seated occupants.
5.3.1 Spineward (-Gx) Accelk.ration
The magnitude and duration of the applied accelerative force have definite ef-fects on human tolerance, as shown in Figure 9 (Reference 13). As indicatedby this curve, a spineward chest-to-back accelerative force of 45 G has beentolerated voluntarily by some subjects when the pulse duration is less than0.044 sec. Under similar conditions, when the duration is increased to0.2 sec, the tolerable magnitude is reduced to about 25 G. Accordingly, Fig-ure 9 shows that the tolerable limits on acceleration loading are a functionof duration.
The whole-body tolerance data displayed in Figure 9 were collected for a va-riety of full-torso restraint and, in some cases, head restraint. With lessoptimum restraint, the tolerable level will be significantly reduced, andsome debilitation and injury will occur.
With respect to whole-body deceleration, the rate of onset of the appliedforce also has a definite, although not yet well understood, effect on humantolerance. Under some impact conditions, the rate of onset appears to be adetermining factor, as indicated by the diagram in Figure 10 (Reference 13).Lower rates of onset were more tolerable than higher rates under the testconditions present. Under other impact conditions, such as extremely shortdurations that occur in impacts from free falls, rates of onset as high as28,000 G/sec were survivable and appeared to have little effect on humantolerance (Reference 16). It appears that in certain ranges the effects Gfthe rate of onset are related to the natural frequencies of the body and ofthe various body organs (Reference 15).
32
Downloaded from http://www.everyspec.com
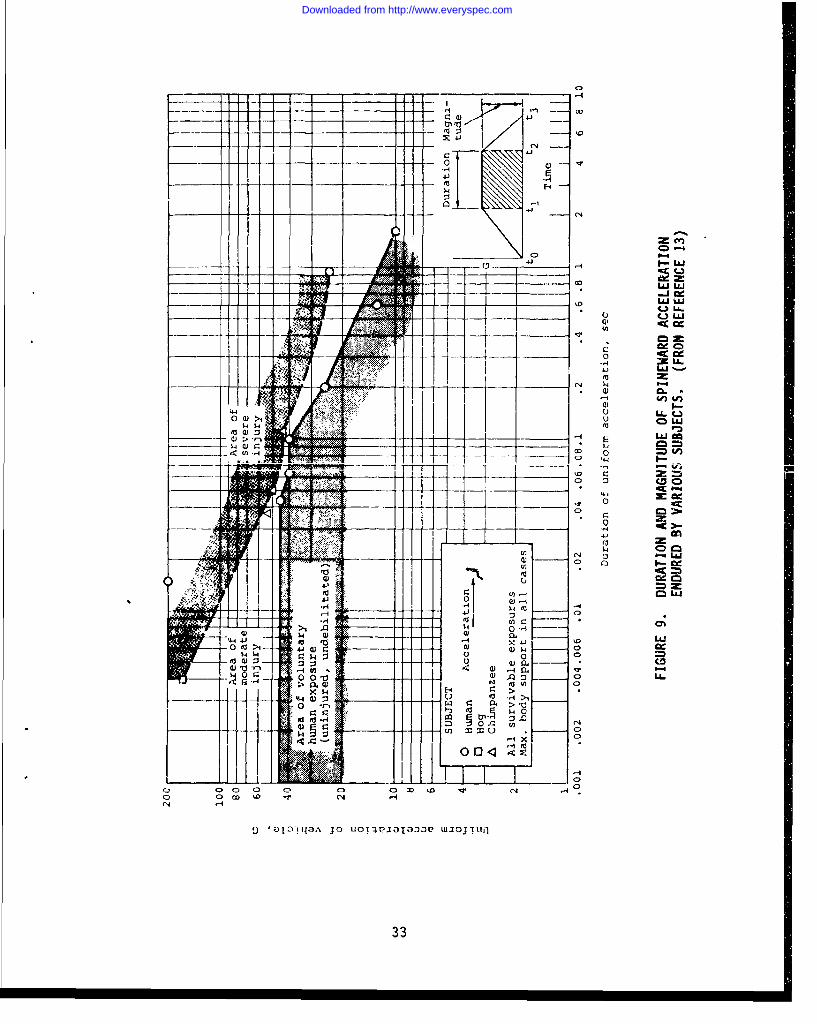
r4J
~~4J
00-1-
4JJU
w-4I-- L
_____'flu'
00 (1 1Zý4 ýN
_ _ -4
4-J 0
414
>1 0-10
0 0 0 0 Q0 4W J
o 0 o Q) 'Dl - yN
0 S4 4~ - O UOU) ~I J P W2 J tf
33- L
Downloaded from http://www.everyspec.com
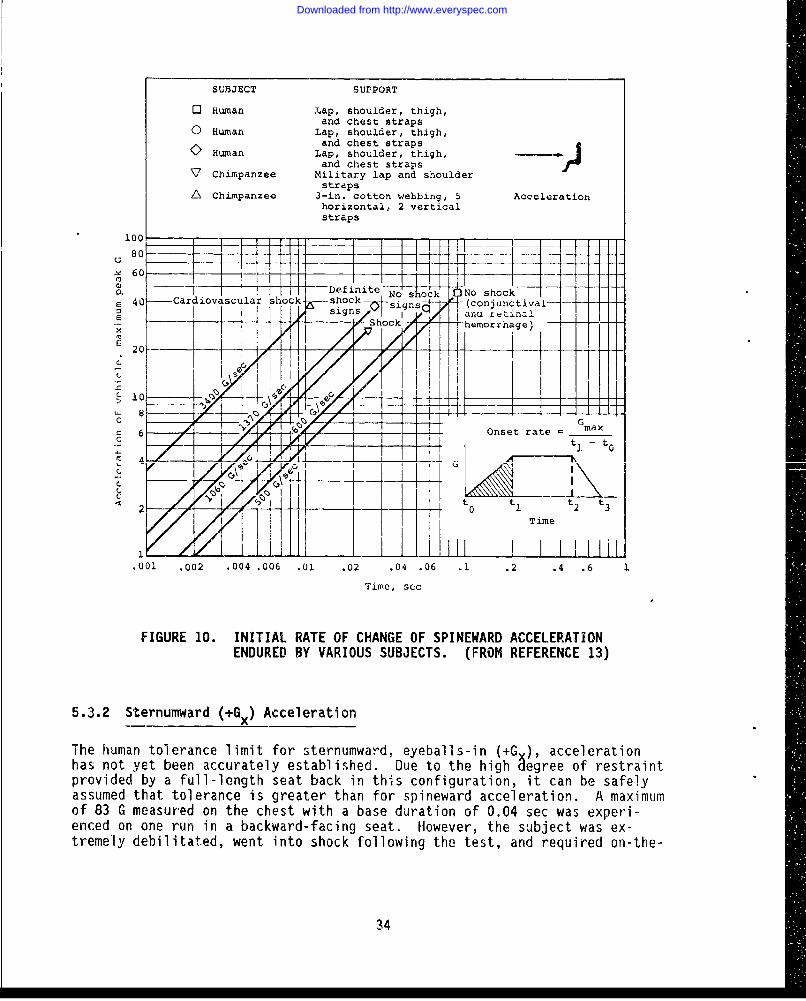
SUBJECT SUPPORT
o3 Human Lap, shoulder, thigh,and chest straps
O Human Lap, shoulder, thigh,and chest straps
0 Human Lap, shoulder, thigh,and chest strapsSChimpanzee Military lap and shoulderstraps
AChimpanzee 3-in. cotton webbing, 5 Accelerationhorizontal, 2 verticalstraps
8 0 - _-- _ _ _
-60-__ --- i.--1
- -q--T -1 -Deinite- -o • •-S40 - Cardiovascular shock -shock • -signs (conunctval-signs anu nctinal
--- , ock hemorrhagel,
2C o---J-) 'i'• o __ --
>C,
o GS - 0 .Onset rate = max
"<2 .;"5>?!141 I to tI t• t2 0 1 2 3
Time
.001 .002 .004 .006 .01 .02 .04 .06 .1 .2 .4 .6
Time, sec
FIGURE 10. INITIAL RATE OF CHANGE OF SPINEWARD ACCELERATIONENDURED BY VARIOUS SUBJECTS. (FROM REFERENCE 13)
5.3.2 Sternumward (+Gx) Acceleration
The human tolerance limit for sternumward, eyeballs-in (+G ), accelerationhas not yet been accurately established. Due to the high 6egree of restraintprovided by a full-length seat back in this configuration, it can be safelyassumed that tolerance is greater than for spineward acceleration. A maximumof 83 G measured on the chest with a base duration of 0.04 sec was experi-enced on one run in a backward-facing seat. However, the subject was ex-tremely debilitated, went into shock following the test, and required on-the-
34
Downloaded from http://www.everyspec.com

scene-medical treatment (Reference 16). Human tolerance to sternumward accel-eration, therefore, probably falls somewhere between this figure of 83 G for0.04 sec and 45 G for 0.1 sec, which is the accepted end point for the -Gx(eyeballs-out) case.
5.3.3 Headward (+Gz) Acceleration
The human body is able to withstand a much greater force when the force isapplied perpendicular to the long axis of the body in a forward or backwarddirection (Gx) than when applied parallel to the long axis (Gz). This isshown by a comparison of the curves in Figures 9 and 11. A primary reasonfor the significantly lower tolerance to headward (+Gz) loading is the sus-ceptibility of the lumbar vertebrae, which must support most of the uppertorso load, to compression fracture. Spinal alignment is necessary to carrythe maximum upper torso loads.
The skeletal configuration and mass distribution of the body are such thatvertical loads cannot be distributed over as large an area as can loads ap-
plied forward or aft (Gx). These vertical loads, therefore, result ingreater stress per unit area than do sternumward or spineward loads. Fi-nally, along the direction of the long axis, the body configuration allowsfor greater displacement of the viscera within the body cavity. Forcesapplied parallel to the long axis of the body, headward or tailward (G.),place a greater strain on the suspension system of the viscera than do forcesapplied sternumward or spineward (Gx), thereby increasing the suscept-ibility of the viscera to injuries.
As in the case of the longitudinal direction (Figure 10), rate of onset alsoaffects tolerance to vertical accelerative loads; however, insufficient datawere available to establish the limits. (Figure 12 presents one set ofavailable data.)
5.3.4 Tailward (-Gz) Acceleration
The human tolerance limit for tailward, eyeballs-up (-G ), acceleration, isapproximately 15 G for a duration of 0.1 sec. The shoufder/hardness/lap beltrestraint has been used in all human testing with tailward accelerations.Most experiments also have included a lap belt tiedown strap, and the 15 Gtolerance limit is based on this latter configuration.
5.3.5 Lateral (G ) Acceleration
Very little research has been conducted on human tolerance to lateral (Gy)accelerations. Two studies, one involving restraint by a lap belt alone (Ref-erence 17) and another involving restraint by the lap belt/shoulder harnessconfiguration (Reference 18), provide the principal available data. In bothcases, a side panel provided additional restraint. With restraint by the lapbelt alone, volunteers were able to withstand a pulse with an average peak ofapproximately 9 G for a duration of approximately 0.1 sec. At this level,the tests were discontinued due to increasing concern about lateral spinalflexion. In the experiments with restraint by lap belt and shoulder harness,
35
Downloaded from http://www.everyspec.com

4j -
-- I-
- .43
4 J 2
-j L)
-~ C)
~ U-
Li-
cc-
1.CD
2 2a
9 'J3IHA JONO~V~]19JVW~iOIco
36D
Downloaded from http://www.everyspec.com

Subject Support
SHuman Lap and shoulder strapsHuman Face curtain, lap and shoulder straps,
soft leather seat cushion. Human Armrest (elbow only), lap and
shoulder straps, parachute, 2-in.sponge-rubber cushion
7 Human Armrest (elbow only), lap and(.D shoulder straps, wooDd block and
sponge-rubber air cushi on Acce lerat; on
< A Chimpanzee Supine; parachute-type restraint,
w,1 including lap and chest straps
S60 - -- -- - -
_ i" 4- I _ - - -
2--o 20
0n t r t t " to
20 t'"t2
O lr---- ~ .
.001 .002 .004 .006 .01 .02 .04 .06 .1 .2
TIME, SEC
FIGURE 12. INITIAL RATE OF CHANGE OF HEADWARD ACCELERATIONENDURED BY VARIOUS SUBJECTS. (FROM REFERENCE 13)
volunteers were able to withstand a pulse with an average acceleration ofapproximately 11.5 G for a duration of approximately 0.1 sec with no permanentphysiological changes. Tests were discontinued at this level due to possiblecariovascular involvement experienced by one of the two subjects tested. Noend points for human tolerance to lateral impacts were proposed in the reportsof these experiments. The only reasonable conclusions from these data at thistime are that a pulse of 11.5 G with a duration of ..1 sec is readily sustained
by subjects restrained by a lap belt and shoulder harness and that the humansurvival limit is at some point beyond this level, probably at least 20 G for0. 1 sec.
The above values are supported by a series of human volunteer experiments con-ducted to measure the inertial response of the head and neck to +Gy whole-body acceleration (Reference 19). Acceleration inputs ranged from long-duration pulses with magnitudes of 2 to 7.5 G to short duration pulses of 5 to
11 G.
37
Downloaded from http://www.everyspec.com

5.4 HEAD IMPACT TOLERANCE
As indicated by the accident data discussed in Chapter 4, over 60 percent ofthe Army aircraft crash fatalities in survivable mishaps result from headinjuries. The injuries may result either from impact of the head on someaircraft structure or equipment, or from head acceleration without impact. Inthe case of mechanical impact, tolerance conditions often are based on thepresence or absence of skull fracture. However, concussion can result fromnonimpact motion of the head, whether in flexion or hyperextension (References20 and 21). Concussion that may be nonfatal in itself can temporarilyimmobilize an individual and reduce his chances of survival by subjecting himto postcrash hazards such as fire or drowning.
Human tolerance to head impact was assessed by determining the force levelsrequired to duplicate damage seen in SPH-4 aviator helmets retrieved from U.S.Army helicopter, crashes with resulting head injury (Reference 22). Droptesting of undamaged helmets on humanoid head forms was utilized to match thedamage seen from the helmets in the actual crashes. Accelerations and peakforces were measured on the head forms during the tests. This study showedthat head injury occurred at peak acceleration levels far below 400 G, whichis the value currently used by the U.S. Army as the pass/fail criterion inevaluating the performance of prospective aircrew helmets. The investigatorsalso found that the peak transmitted force was a much better predictor ofinjury severity than was the peak acceleration. Thus, the peak transmittedforce may be a more effective criterion to use in the evaluation of helmetimpact attenuation performance than is peak G. The study also found that thepeak transinitted force was a much better estimator of injury Severity t haieither the severity index or the head injury criteria (HIC), which are dis-cussed in Sections 5.4.1 and 5.4.2.
Fatal head injury has been shown to result from such severe brain damage aslaceration of brain tissue or shear of the brain stem (Reference 23). Headimpact studies with anesthetized monkeys and dogs have been conducted torelate the severity and duration of concussion to intracranial pressure change(Reference 24). Moderatý to severe concussion effects were observed in therange of 30 to 90 lb/in, intracranial pressure change concurrent with headimpact.
According to a hypothesis developed by Holburn, shear stresses induced by headrotation also can produce concussion (Reference 25). Kornhauser, in Refer-ence 26, indicated a relationship between damaging velocity and damagingaccelerations as follows:
8=(1)
where 8 - damaging rotational velocity, rad/sec
o = damaging rotational acceleration, rad/sec
S= natural frequency of rotation of brain, rad/sec
38
Downloaded from http://www.everyspec.com

Ommaya, et al., developed scaling factors needed to predict concussionthresholds for humans from data taken on subhuman primates (Reference 27).This study showed that 0 can be represented by the equation:
0=m/3 (2)
where m = mass of the brain, gm
c = an experimentally derived constant, gm2/b rad/sec 2
The investigators found c = 21,600 gm2/ 3 rad/sec 2 , and further showedthat the relationship of Equation (1) produced reasonable agreement betweenpredictions and empirical data. Limiting values thus predicted to produce a50-percent probability of concussion in a man having a brain mass uf 1,300 gmare as follows (Reference 28):
o= 1,800 rad/sec2
o= 50 rad/sec
In general, assessing the probability of injury by observation of oversimpli-fied parameters, such as peak acceleration of the imposed acceleration timeenvironment, usually is not constructive. The problem has been to definesome form of parameter that is indicative of the degree of severity of a par-ticular input excitation. Various indicators have been developed, based onexperiments, and several of these for the head are presented and discussed inSections 5.3.1 through 5.3.7.
5.4.1 Weighted Impulse Criterion (Severity Index)
It can be seen from human tolerance data presented previously that highforces or accelerations can be tolerated for only very short periods of time,while lower values of these quantities can be tolerated for longer periods oftime. This same relationship for head injury in forehead impacts, which wasestablished on the basis of impact tests performed at Wayne State Universityon animals and human cadavers, is illustrated in Figure 13 (Reference 29).In these tests, longitudinal impacts of the subject's forehead against un-yielding flat surfaces were conducted, and the acceleration-time history ofthe specimen head was measured at a point on the skull diametrically oppositethe point of impact. The curve shown in Figure 13, the Wayne State ToleranceCurve, was based on the observation of linear skull fracture.
39
Downloaded from http://www.everyspec.com

600 - - - -
-500 -- -z I0,( 400 . . ..
DANGEROUS TO LIFEUJ
w 3000
> 200
ULU
t.. 100I~w NOT DANGEROUSTO LIFE
0 - 1 , ! 1 .___ I
0 2 4 6 8 10 1230100
TIME DURATION OF EFFECTIVEACCELERATION (MSEC)
FIGURE 13. WAYNE STATE TOLERANCE CURVE FOR THE HUMAN BRAIN INFOREHEAD IMPACTS AGAINST PLANE, UNYIELDING SURFACES.(FROM REFERENCE 29)
Based on such data as that collected at Wayne State, Gadd suggested a weight-ed impulse criterion as an evaluator of injury potential (Reference 30). Theseverity index is defined as
SI =f andt (3)
to0
where SI = severity index
a = acceleration as function of time
n = weighting factor greater than 1
t = time
40
Downloaded from http://www.everyspec.com

Based on data in References 13 and 29, the exponent n has been determined tobe 2.5 for head and facial impacts. A severity index of 1,000 was proposed byGadd (Reference 30) for the danger-to-life threshold from head injury infrontal impacts. Severity index values exceeding 600 produced concussion inhead impacts sustained by U.S. Army aircrewmembers in aircraft accidents(Reference 29). A lower value of n has also been suggested for regions ofsofter tissue, which behave viscoelastically.
The severity index can be calculated by dividing the time base of the acceler-ation time curve into sufficient segments to define the acceleration curve.The G value then read from the curve for the center of the increment is raisedto the 2.5 power, and the result is multiplied by the time increment. The sumof all the values obtained gives the severity index. A severity index samplecalculation is shown in Figure 14, which is taken from Reference 31.
5.4.2 Head Injury Criteria (HIUj
An alternative interpretation of the Wayne State University Tolerance Curvewas developed by Versace. That analysis led to the [lead Injury Criteria(HIC). The HIC was later included in Federal Motor Vehicle Safety Standard208 (FMVSS 208) as a head impact tolerance specification. The HIC iscalculated by
f 2 -IHIC = (t 2 - t1 ) L2 a(t) dt (4)
L -2 t 1 J max
where tI and t 2 are the initial and final times during which HIC attainsa maximum value and a(t) is the resultant acceleration (G) measured at thehead center of gravity (Reference 32).
FMVSS 208 sets a maximum value of 1000 for the HIC. It also specifies thatthe time interval between tI and t 2 shall not exceed 36 milliseconds (Ref-erence 33). The time interval limitation effectively eliminates lower levelaccelerations that are not injurious and focuses on the short-duration, high-level impact peaks.
There has been some question as to the appropriateness of using the HIC todetermine severe head impact tolerance because of significant skull deforma-tion which occurs, even without fracture. These deformations prevent skull-mounted accelerometers from accurately measuring the acceleration of the c.g.of the head (Reference 34). Therefore, the HIC may not be well defined orrepeatable for severe head impacts. Other critical limitations of head in-jury research and of the HIC also may be found in Reference 34. For example,a study by Hoskins and Thomas concluded that the critical HIC interval mustbe less than 15 milliseconds in duration in order to pose a concussion hazardeven if the HIC value exceeds 1000 (Reference 32). However, Slobodnik foundduring the SPH-4 helmet study (Reference 22) that concussive head injuriesoccurred at HIC values below 1000.
41
Downloaded from http://www.everyspec.com

80-
wm
60---
0I2 2 3 -4 1 1 81 9110 11121132, t13 .4• -1- --- 17 - ]
0 2 4 6 8 10 12 14 16 18 20 22 24 26 28 30 32 34
TIME, MSEC
CALCULATIONS
IncrementalT ime SIIncrement Increment Midpoint G2.5Number (sec) GMValue G ITime x "-
1 0.001 7 130 0.132 0.001 18 1,400 1.403 0.001 23 2,500 2.504 0.002 27 3,800 7.605 0.001 33 6,300 6.306 0.001 40 10,000 10.007 0.001 38 8,800 8.808 0.001 47 15,000 15.009 0.001 75 48,000 48.00
10 0.001 80 57,000 57.0011 0.001 73 46,000 46.0012 0.001 56 23,000 23.0013 0.001 43 12,000 12.0014 0.002 37 8,300 16.6015 0.002 33 6,200 12.4016 0.001 27 3,800 3.8017 0.001 24 2,800 2.8018 0.007 20 1,800 12.6019 0.001 17 1,200 1.2020 0.002 10 330 0.66
Severity Index 287.79
FIGURE 14. SAMPLE CALCULATION OF A SEVERITY INDEX.
(FROM REFERENCE 31)
42
Downloaded from http://www.everyspec.com

Although correlations of the HIC with actual injuries might not be af success-ful as desired, it is still one of the most widely used criteria for testingin relation to head injury protection, and a HIC of 1000 is still used as thecriterion for head injury tolerance. Lockett has pointed out that the HICand Gadd Severity Index are plausible and fundamentally correct forms of cri-teria (Reference 35). The reasons for the lack of correlation might includethe inadequacy of the human surrogates, whether they be cadavers or anthropo-morphic dummies, to model the living human system and the coarseness of theobserved injury scales against which the HIC is often compared. It should benoted that the HIC is not related to all possible injury mechanisms. Forexample, it does not consider a pressure-induced localized crushing or pene-tration of the brain (Reference 36).
The HIC equation can be manipulated into a form with integer power that isconvenient for computation and can be computed efficiently by special algo-rithm. One such algorithm was developed by Rodden, et al., and is presentedin Reference 37.
5.4.3 J-Tolerance
Slattenschek, after noting different head deceleration curves when differenttypes of windshield glass were used, developed a method of assessing multipleimpact tolerance by a "J-tolerance" value (Reference 38). A second-ordervibrational model, based on the Wayne State Tolerance Curve, is used todetermine the tolerable amplitude of brain motion. The response of thesimple, damped, spring-mass system shown in Figure 15 is given by
+ 2Dw + w2x = -b(t) (5)
where x = relative displacement
x= relative velocity of mass
= relative acceleration of mass
b = acceleration of system al point N (driving acceleration)
D = damping coefficient
S= angular frequency
k
FIGURE 15. DAMPED, SPRING-MASS SYSTEM USED IN COMPUTINGJ-TOLERANCE. (FROM REFERENCE 38)
43
Downloaded from http://www.everyspec.com

Two accelerations from the Wayne State Tolerance Curve were used to determinethe frequency and the tolerable amplitude of the displacement. The value ofthe damping factor was selected as 1 to achieve a best fit to the Wayne Statedata. The resulting model fit the Wayne State Curve within better thanone-half percent.
For assessment of an impact, the maximum displacement is calculated for thegiven acceleration pulse, and the ratio of this maximum amplitude to thetolerable amplitude is evaluated. The tolerance value, J, is defined as
Xmax (6)
Xtolr
Values of J less than 1 are assumed to correspond to survivable impacts.
5.4.4 Effective Displacement Index
The Effective Displacement Index (EDI), reported by Brinn and Staffeld, isderived from a mathematical spring-mass model based on the work described inSection 5.4.3 (Reference 39). The peak deflection of the model, in inches,is taken as the index of damage. Using a natural frequency of 77 Hz and adamping value of 70.7 percent, a tolerable EDI of 0.15 in. was obtained byfitting the Wayne State Tolerance Curve.
It should be noted here that, as in the case of the Gadd Severity Index, atolerable EDI is based on anterior-posterior impact only, due to the unavail-ability of data for other directions.
5.4.5 Strain Energy Considerations
Melvin and Evans considered the basic types of skull fracture and investi-gated the effects of impactor size and shape, skull geometry, and soft tissue(Reference 40).
5.4.6 Mean Strain Criterion (MSC)
In a study conducted by Enouen to simulate pedestrian head injury, the MeanStrain Criterion (MSC) is considered as a means of evaluating head injury.This method is relatively new and at the time of this publication was stillin the final stages of development (Reference 41).
MSC is a computer simulation of head impact response. The program translatesan acceleration input into a mean strain produced in the brain. It thenrelates the strain to concussive head injury by computing the AbbreviatedInjury Scale (AIS) value for head injury. Four versions of the program allowimpact simulation from four different directions on the head, which signifi-cantly improves head injury correlation (Reference 41).
44
Downloaded from http://www.everyspec.com

5.4.7 Comparison of Head Injury Predictors
Hodgson and Thomas investigated skull fractures in 40 cadavers that were drop-ped with their heads striking rigid, flat, hemispherical, and cylindrical sur-faces on the front, side, and rear (Reference 42). The Severity Index and theEffective Displacement Index (EDI) were compared at fracture level for allfrontal impacts, and their average values at fracture were found to agreeclosely with the critical values predicted by the authors of the methods.Results for the frontal flat-plate impacts are shown in Figure 16, where ACýrefers to calculation of the indices from resultant acceleration at the headcenter of gravity. AAP refers to calculation from anterior-posterioracceleration measured at the point on the skull most distant from the impactsite, the condition used in the derivation of the Wayne State Tolerance Curve.
250- SI EDI-in.
Test no. ACG AA-P ACG AA-P
S200 -2 749 400 .14 .113 2020 1800 .18 .124 1280 792 .17 .13
W 1.50 6 565 390 .13 .1129 1020 724 .16 .1330 1250 561 .19 .11
100 4I 29 (J-S-30
50 6
0 .005 .010 .015 .02 .025 .03 .035 .04 .045
TIME, SEC
FIGURE 16. COMPARISON OF SI, EDI, AND KINEMATICS OF SIX FRONTALIMPACTS PRODUCING LINEAR FRACTURE. (FROM REFERENCE 37)
For the drop height range that produced linear fracture in the cadaver's skulldue to frontal impact against a rigid, flat plate, the SI for the Alderson50th-percentile dummy head acceleration response was significantly higher thanfor the cadaver. The higher acceleration measured for the dummy head would,of course, be expected in such an impact because of the greater rigidity ofits metal skull. The EDI, on the other hand, was essentially the same forboth cadaver and dummy.
Fan analyzed predictions of the Gadd Severity Index and the Vienna Instituteof Technology Brain Model (J-tolerance) and concluded that improvements inboth techniques could be made (Reference 43). He concluded that the SI putstoo much weight on the acceleration but ignores the time factors of an im-pulse. Fan's reviLed approach to SI calculation involves a successive
45
Downloaded from http://www.everyspec.com

approximation method where variable weighting factors are applied to bothacceleration and time, A revised brain model also is presented, based on theVienna model, with additional information included on dynamic properties ofthe human skull-brain system. The revised brain model utilized an equivalentviscous damping of 40 percent of critical damping and, on comparison with theWayne State Tolerance Curve, yielded tolerable values of brain deformation,velocity, and angular velocity of 1.25 in., 135.5 in./sec, and 175 rad/sec,respectively. The maximum deviation from the Wayne State Curve was reportedto be within 5 percent.
5.5 FACIAL IMPACT TOLERANCE
Impact tolerance of the face is lower than that of the head, with a recom-mended facial injury threshold of SI equals 500 (Reference 30). Fractureforces for the major facial bones--the zygoma (cheekbone), the maxilla (upperjaw), and the mandible (lower jaw)--are listed in Reference 32. When thesebones are impacted directly by a small circular impacter, the fracture forcesrange from 258 lb for the maxilla to 697 lb for the mandible.
The nasal bone tends to be the most fragile of all the facial bones and has ahigher frequency of injury. The remaining bones of the face have a muchhigher level of fracture tolerance than the nasal bones. Impact studieswherein a 1-inch-diameter aluminum bar is impacted into the face at thebottom of the eye sockets showed that a force of about 675 lb was necessaryto produce fracture patterns more extensive than nasal bones only(Reference 44).
Studies of the full face indicate that the facial skeleton is remarkablystrong when the face contacts a padded, deformable surface. Figure 17 fromReference 45 reproduces summary data showing the tolerances of the human faceand head to resisting fractures during impact against deformable, paddedsurfaces. @8 G
FIGURE 17. SUMMARY OF MAXIMUM TOLERABLE IMPACT
FORCES ON A PADDED DEFORMABLE SURFACE.
46
Downloaded from http://www.everyspec.com

5.6 NECK IMPACT TOLERANCE
Tolerance of the human neck to rotation, as experienced in whiplash, and tolocalized impact loading has been investigated. Mertz and Patrick determinedthe moment about the occipital condyles (protruberances near the back of theskull that articulate with the cervical spine and are considered to be thecenter for rotation of the head with respect to the neck) at the threshold ofpain for volunteer subjects. On the basis of their investigations, tolerablelevels for neck flexion (forward rotation) and neck extension (backward rota-tion) of a 50th-percentile adult male are proposed in Reference 46. The neckappears to be at least three times stronger in resisting flexion than exten-sion (Reference 47).
Gadd, Culver, and Nahum, using unembalmed, elderly cadavers, investigated therelationship between rotation and resisting moment in hyperextension andlateral flexion (Reference 48).
Hodgson presents a comparison of peak neck load data for inertia and directimpact loading of the heads of volunteers, cadavers, and the Hybrid III dummy(Reference 47). Hodgson, in another study, emphasizes that the consciousnessof the occupant may be dependent on relative motion at the head and neck junc-tion (Reference 49). Relative motion between head and neck should beminimized when abrupt -Gx can be anticipated.
A helmet adds mass and a higher center of gravity to the head, which tends toaggravate the head/,nec motion during impact. The relat.ive mn•,u,, Of the Headand neck during acceleration loads has been extensively researched throughhuman and manikin sled runs for various directions and magnitudes at the NavalBiodynamics Research Laboratory (NBDL) in New Orleans (Reference 50). Thesetests were conducted to support the development of greater fidelity manikinsfor testing purposes and were all conducted below the human tolerance level.A number of these tests were done with helmets and with additional headweights added. It was found that the maximum resultant force at the occipitalcondyles was proportional to the product of the nominal impact accelerationand the sum of the head and added mass. The effect of the mass additions wasto increase, in a consistent manner, head angular travel as well as torquesand forces. References 51, 52, and 53 present head acceleration and displace-ment profiles for various impact loads in the -Gx direction. Wismans,et al. (Reference 53) also analyzed the displacement profiles in oblique andlateral directions of the NBDL tests and found that maximum head excursions infrontal impacts are slightly larger than in oblique impacts and much largerthan in lateral impacts.
Neck injuries in U.S. Navy aircrew personnel who ejected from their aircraft
were examined for a 10-year period by Guill (Reference 54). The study foundthat ballistic haul-back inertia reels can reduce the incidence of sprain/strain type ejection-associated neck injuries.
A preliminary analysis of the head/neck response to impact loads has beeninitiated by the U.S. Air Force, Aerospace Medical Division, Wright-PattersonAir Force Base in an effort to improve manikin neck response to more closelysimulate human neck response in high accelerations. Navy data with livevolunteers was used. In comparing the human responses of -15 Gx and 12 Gzimpacts, it could be seen that the neck angular responses were similar, butthe head responses were different. For the -Gx impact, the head began to
47
Downloaded from http://www.everyspec.com

rotate forward after the neck rotated approximately 5 degrees, but for the Gzimpacts, the head did not rotate significantly until the neck rotated approxi-mately 35 degress and the head/neck joint bottomed out. Another phenomenonshown by the test films was that there were two types of human responses to+Gz impacts. In the Type 1 response, the [lead initially rotates slightly for-ward until the head/neck joint bottoms out and then the head violently rotatesforward. In the Type 2 response, the head initially rotates backward as theneck is rotating forward and then, similar to the Type I response, the head vio-lently rotates forward when the head/neck joint bottoms out. The determiningfactor as to which response will result depends upon the position of the headsystem center of gravity (c.g.), with a Type 2 response resulting when the c.g.is located further toward the rear of the head as compared to the Type Iresponse.
To better understand the kinetics of the head/neck system, plots were made ofthe calculated moment, head/torso angle and head/neck angle with respect to theNBDL runs in 12 G and -15 Gz impacts. Figure 18 shows that, for the Gzimpact, the moment at the occipital condyles increases as the head/torso angleincreases and that the head moment is related to the head/neck angle, with theneck imparting a high positive moment on the head when the head/neck angle ex-ceeds approximately 15 degrees. For the -Gx impact, Figure 19 shows that themoment at the occipital condyles increases as the head/torso angle increases,but that the head/neck angle is not directly related to the moment at the occi-pital condyles. This is consistent with the biomechanics of the neck, sincethe neck structure would be expected to apply little moment on the head unlessthe joints bottom out.
The tolerance of the human neck to external vertical (z-direction) loads hasbeen determined from dynamic impacts on cadavers performed with a moving massimpactor. Fracture of the cervical vertebrae occurred for peak forces over1280 ib, peak impactor velocity over 24.6 ft/sec, and initial impact pulseenergy values of 280 ft-lb (Reference 55).
5.7 CHEST IMPACT TOLERANCE
An extensive research program on impact response of the human thorax has beenreported by Kroell, Schneider, and Nahum (Reference 56). A 6-in.-diameter ri-gid impactor of varying mass and moving at a range of speeds was used to strikeunembalmed, seated cadavers. Deflection and force were measured as functionsof time. Figure 19 (from Reference 56) shows the Abbreviated Injury Scale(AIS) (Reference 57) plotted against normalized chest deflection (deflectiondivided by chest anterior-posterior diameter). The least-squares fit shown hasan associated correlation coefficient of 0.772. However, as seen in Figure 20,the restrained back data appear to follow a different trend. Scaling of therelationships between force and penetration has been reported in Reference 58.
The Effective Displacement Index (EDI), which was discussed in Section 5.3.4 inreference to head injury, also has been applied to chest injury by Brinn andStaffeld (Reference 39). They point out that there is evidence that rib cagedeflection may be the governing criterion for chest injury and that the measure-ment of this deflection might be the basis for a chest survivability index.However, the acute distress experienced by human volunteers subjected to whole-body deceleration has been considered a justification for an independent hazardindex based on acceleration. Using a natural frequency of 15 Hz and a
48
Downloaded from http://www.everyspec.com

o- -300
CHANGE IN HEADITORSO ANGLE ----60 (LEFT SCALE) "J
2f
40/, -200=z ~j
30 / -
/ -0
20 II -100
10-
Lu I j7
0-.050 .17
- 0 r - i - 1 1 I a0 , !
i.025 7.5,.160 125 1.150 0 TIME (SEC)
z z
-1100
CHANGE IN HEAD/NECK
-30 ANGLE (LEFT SCALE)
- oI I -I I 0
-40 200
a Z
wMOMENTI
0-. 00I (RIGHT SCALE) 300
- 0
FIGURE 18. MOMENT AT THE OCCIPITAL CONDYLES AND RELATXVE CHANGEIN HEAD/TORSO ANGLE AND HEAD/NECK ANGLE DURING NBDLHUMAN RUN NO. LX 4651, I 2 -GZ IMPACT.
49
Downloaded from http://www.everyspec.com

100 , , , , , • , , , -600
90
MOMENT AT THE70 OCCIPITAL CONDYLES
(RIGHT SCALE) #
S60 -- oo -3o zC 50 1 -CHANGE IN HEAD/TORSO
ANGL (LFCLE) Z
< 40 - -200
I030 /
20 -100
10
0.01 .05 .06 .07 .08 .09 .10 .11 ATIME
-10 -
-20 CA4 14r2DNCANGLE (LEFT SCALE•)
FIGURE 19. MOMENT AT THE OCCIPITAL CONDYLES AND RELATIVE CHANGE INHEAD/TORSO ANGLE AND HEAD/NECK ANGLE DURING HUMAN RUNNO. LX 3983, -15 GX IMPACT.
damping value of 25 percent of critical, a maximum EDI of 2.2 in. was obtainedfor voluntary human exposure. Based on experience with energy-absorbing steer-ing columns, EDI of 2.8 in. was suggested as a test limit for current-designanthropomorphic dummies.
On the basis of 16 dives performed by an instrumented professional high diveronto a mattress, combined with the results of earlier studies, a long-durationacceleration tolerance level of 60 G with a pulse duration of 100 msec has beenrecommended for the thorax in the anterior-posterior direction (Reference 59).Federal Motor Vehicle Safety Standard (FMVSS) 208 specifies an acceptable levelof 60 G for chest acceleration (Reference 33). The acceleration is theresultant measured at the center of gravity of the dummy chest.
After investigation of blunt thoracic impact to anesthetized swine, Kroell,et al. (ReFerence 60), concluded that both compression and velocity are signi-ficant parameters of impact exposure severity. Qualitatively, exacerbation of
50
Downloaded from http://www.everyspec.com

Fatal 6- 0 0 o- 0
Critical(survival
uncertain) 5 0
Severe (lifethreatening,
survival 0 Unrestrained back dataSprobable) 4 A Restrained back data 000 000 0
SevereS(non-life
s threatening) 3 o 0 Restrained•D back data
e Moderate 2 O o 0 0
Minor 4]
No injury 1--3.1 .2 .3 .4 .5
Total chest deflectionChest A-P diameter
FIGURE 20. AIS INJURY RATING VERSUS NORMALIZED CHESTDEFLECTION. (FROM REFERENCE 56)
injury was seen when either variable was increased with the other held con-stant. Quantitatively, better logistic regression models were found relatingthe probability of heart rupture and of Abbreviated Injury Scale (AIS) 4 orgreater injury to products of velocity and compression, including the viscousresponse, than to normalized compression or peak spinal acceleration alone.(See Section 5.11 for a description of the Abbreviated Injury Scale.) Atstriking velocities of 30 msec, gross cardiac rupture occurred at appliednormalized compression levels as low as 0.15. No such injury was observed at15 m/sec and comparable compression levels.
Lau and Viano summarized several different criteria for chest injury (Refer-
ence 61). They point out that the usefulness of the acceleration criterion is
restricted to predicting the severity of skeletal injury and it is not usefulin predicting soft tissue injury. Maximum chest compression is a superior in-dicator of chest injury severity. Research showed that human volunteers couldsustain 20 percent chest compression in quasi-static loading with no injury.As compression increased above 20 percent in human cadavers at impact velocitybetween 5 and 7 m/sec, rib fractures occurred regularly. Maximum compressionof 40 percent induced multiple rib fractures. The latest analysis of dataindicates that 40 percent of maximum chest compression corresponds to a 50/50chance of the occupant sustaining AIS 4 or greater chest injury. However,this criterion was derived with impact velocities between 5 and 7 m/sec, andit is known that even moderate impact velocity injury can occur well beforemaximum compression.
51
Downloaded from http://www.everyspec.com

In their research, Lau and Viano found that rate sensitivity of soft tissuemust be accounted for in understanding soft tissue injuries. Severity oflung injuries in rabbits was found to increase as chest compression or impactvelocity was increased. Studies done on swine showed that the velocity ofimpact on the sternum or the myocardium was the primary determinate of riskof developing ventricular fibrillation.
Lau and Viano's studies showed a Viscous Criterion, based on the rate sensi-tivity of soft tissue, is the best indicator for soft tissue injury in manybody regions for velocities of deformation between 3 to 30 m/sec, as shown inFigure 21. When velocity of deformation is below 3 m/sec, the influence ofimpact velocity on soft tissue injury gradually diminishes. At very lowvelocity, the compression criterion becomes the best indicator. At veloc-ities less than I m/sec, injury is essentially induced by crushing of thetissue. When the velocity of deformation approaches 30 m/sec, impact veloc-ity becomes such a predominate factor in determining injury cutcome that theinfluence of compression becomes secondary. At these very high velocities,blast injury begins to occur first in the lung and then in other holloworgans. The authors showed that an impact producing a peak Viscous response(the product of the velocity of deformation times the instantaneous compres-sion) of 1.3 m/sec had a 50/50 chance of inducing thoracic injury of AIS 4 orgreater. An impact producing a peak Viscous response of 2 m/sec had a 50/50chance of inducing cardiac rupture.
CRUSH-IINGINJURY
40-
30- VISCOUS2 �INJURY
0.
co EDSU) 20-5W
0 BLASTo 10- . INJURY
1 2 5 10 20 50 100
VELOCITY OF DEFORMATION (m/s)
FIGURE 21. RANGE OF VALIDITY FOR THE VISCOUS CRITERIONAND THE COMPRESSION CRITERION.
All of the above tolerance data have been for thoracic impacts in ananterior-posterior orientation only. A great deal of effort is currentlybeing expended in defining human tolerance to lateral impacts in associationwith the Department of Transportation's efforts toward developing a testmethod and standard requiring side impact protection of motor vehicle occu-pants. The thoracic trauma index (TTI) has been proposed as the human toler-ance criterion. Investigations by Morgan, et al. (Reference 62), have shown
52
Downloaded from http://www.everyspec.com

that the TTI is an accurate and usable predictor of thoracic injury levelresulting from a lateral impact. The TTI is based on the age of the testsubject, the maximum absolute lateral accelerations of either the fourth oreighth rib and the 12th thoracic vertebra, and the subject's mass. Data fromcadaver studies were used in calculating the TTI, and injury probabilitycurves were generated for determining injury probability functions. Thecurves for AIS 4 or greater injury for left side and right side impacts areshown in Figure 22. The increased risk of injury in right side impacts ascompared to left side seems to stem from increased injury severity to theliver because of the asymmetry of the abdomen.
100
80
- 60U.0
40LETSRC
0
M RIGHT STRUCK./
0 L -- L. .0 50 100 150 200 250
TTI (MAX RIB)
FIGURE 22. COMPARISON OF AIS > 4 PROBABILITY FOR LEFT-SIDE AND RIGHT-SIDE IMPACTS.
The ITI should be used with caution in aircraft applications since it, alongwith the side impact dummy, was developed specifically for automobile side im-pacts in which the occupant loading is of - intrusive and impulsive nature.The accuracy of the TTI over nonimpulsiv., unger term G loads, as most fre-quently occurs in aircraft crashes, has not been investigated.
5.8 ABDOMINAL IMPACT TOLERANCE
Before 1980, the abdomen received very limited attention in biomechanics re-search, and little information was available concerning abdominal toleranceto blunt impact trauma. This was partly due to the difficulty in describingthe mechanical behavior of the highly deformable mobile organs in the abdomen
53
Downloaded from http://www.everyspec.com

and partly due to greater concern for the prevention of injury to more criticalorgans of the body (Reference 63). Experiments found that the nature of theloading surface had a great influence on the reaction of the abdomen to load.They also found the organs to be strain rate sensitive, especially the liver,which was found to fail due to dynamic pressures generated in the tissue duringimpact. Summaries of research in abdominal impact prior to 1980 may be foundin References 63 and 64.
More recent research has shown that the liver is the most commonly injuredorgan (Reference 65). It was found that the spleen can also be lacerated, butthis smaller organ is protected by the rib cage and is more freely movable, andthus, less likely to be damaged. The kidneys, pancreas and adrenals are rarelyinjured.
Cavanaugh, et al., tested 12 unembalmed human cadavers for lower abdominal in-jury tolerance and mechanical response (Reference 66). The impacts were in ananterior to posterior direction, and the level of impact was primarily in thelower abdomen at the L3 level of the lumbar spine. See Figure 23 in Section5.9 for an illustration of the spine anatomy. This is in a direct line withlower portions of the head of the pancreas, lower portions of the kidney andduodenum, the inferior vena cava, and the abdominal aorta. Impacts concen-trated at the L3 level involve little or no rib contact. Thus, the responseattained is involved with primarily the solid and hollow visceral elasticstructures. These researchers found that the loading portion of the force-deflection curve of the lower abdomen of the human cadaver could be charac-terized by an almost linear rise from zero force to peak force and the hyster-cSis on unloading was approximatdely a vertiLIa lirne, They fuund that a strongrelationship existed between abdomen stiffness and impactor velocity, momentum,and kinetic energy. In comparing their results with those obtained on liveanimal surrogates, they found that the force-deflection responses of thecadavers were much less stiff than those of animal tests involving impacts intothe tipper and middle abdomen. They postulated that the lower abdomen is lessstiff than the upper abdomen, which is less stiff than the chest. They alsofound that the lower abdomen shows a viscous elastic rate dependence.
A study conducted by Rouhana, et al. (Reference 67), utilized white rabbits asthe test surrogates to determine the injury mitigating effects from a force-limiting or energy-absorbing material. They found that the probability ofserious abdominal injury was well correlated to the product of the preimpactvelocity and the maximum abdominal compression.
In studies on swine, Lau and Viano (Reference 61) found that a viscous responseof 1.4 m/sec had a 50/50 chance of causing severe laceration of the liver (AISequal to or greater than 5) in the fore/aft direction. These two numbers arenot directly correlative, because the AIC is a less rigorous and more specificform of the Viscous Criterion. The AIC is the product of the preimpact ormaximum velocity and the maximum compression (VmaxCmax). In contrast, theViscous Response (VC) is the maximum of the product of the instantaneous rateof compression and the compression, as discussed in Section 5.7.
5.9 SPINAL INJURY TOLERANCE
To understand spinal injury tolerance, it is necessary to briefly describe theanatomy of the human spine. The spine consists of a curved column of 33 verte-brae, typically, together with ligaments and intervertebral discs. At the
54
Downloaded from http://www.everyspec.com

CERVICAL ATLAS .
_3
VERTEBRAE- A ..- 4
THORACIC eVERTEBRAE
LUMBAR 9VERTEBRAE-i
SACRUM (COCCYX
VERTEBRAL COLUMN IN RELATION TO BODY OUTLINE
FIGURE 23. ANATOMY OF THE SPINE (VERTEBRAL COLUMN).
lower end four vertebrae are fused to form the coccyx, and immediately abovethis five vertebrae are fused to form the sacrum. The flexible portion of thespine is customarily divided into three sections: seven vertebrae of thecervical spine (neck), Cl-C7; 12 vertebrae of the thoracic spine (articulatedwith ribs), TI-T12; and five vertebrae of the lumbar spine in the lower back,Ll-L5 (see Figure 23).
5.9.1 Experimental Test Data
Damage to the vertebral column, particularly the upper lumbar and lower thora-cic regions, occurs frequently in +Gz impact, where the force is directedparallel to the spine. A summary of research on +Gz impact exposure limitsbefore 1975 is contained in Reference 68. Age has a negative effect on thestrength of the vertebral column and is discussed in Reference 69.
In a study of clinical and operational data, Kazarian found that, in ejectionor light aircraft/helicopter crashes, the thoracolumbar spine is the regionmost susceptible to injury (Reference 70). The cervico-thoracic junction (C5to C7) was the second most susceptible region.
Anterior wedge fracture represented the most common, nonfatal injury. Theanterior portion of the vertebral body of one vertebra tends to collapse underthe load exerted by the next vertebra. It is considered a relatively benigninjury and recovery is often complete. Pain and discomfort may result intemporary disability for several weeks.
55
Downloaded from http://www.everyspec.com

Fracture dislocations are the most serious injuries. Any region of the spinalcolumn can be involved, but in the majority of aircraft crashes the lesionoccurs in the thoracic-lumbar and cervico-thoracic regions. Spinal cordlesions with paralysis below the fracture level are not uncommon. The frac-ture pattern usually consists of a crushed vertebral centrunl of one or morevertebral bodies with partial or incomplete forward or sideward dislocation ofthe upper vertebra on the lower one.
The threshold of spinal injuries for seated humans subjected to +Gz loadingwas investigated by Coltman, et al. (Reference 71). Fifteen tests were con-ducted with unembalmed cadavers. It was found that the threshold for spinalinjury in the cadavers aged 44 to 63 years was significantly below that foryounger, healthier U.S. Army aviators. Thus, bone compression strength testswere conducted to provide a baseline for relating the population of thecadavers used to the U.S. Army aviator population. The parameter used toassess the potential for spinal injury was the spinal load/strength ratio(SLSR). The SLSR was defined as:
= __AQlied Axial Spinal Load (SLSR = Ultimate Compressive Strength (7)
The data from the cadaver tests are shown in Figure 24, which plots the SLSRversus the spinal injury rate. This figure indicates that to maintain a 10-percent injury rate the SLSR should be kept at or below 0.26.
100
90
80go-•
lu 70W
' 60-
600
40-J 4
CL 30
20
10%10-------
0.1 0.2 '0.3 0.6 0.9
SPINAL LOAD/STRENGTH RA-IQ
FIGURE 24. SPINAL INJURY RATE AS A FUNCTION OF SPINAL
LOAD/STRENGTH RATIO (SLSR).
56
Downloaded from http://www.everyspec.com

Correlation of the data for the compressive strengths, the spinal injuryrates, and the correlation between peak spinal load and energy-absorber limitload factor (obtained from tests with a UH-60 energy-absorbing crewseat),yielded the estimated spinal injury rate as a function of the energy absorberlimit load factor (Figure 25).
100
90.
4,.
70
so-
60040-
z A0- 40 •
30S2 0--•
20
10 -- " 14.5 G
6 10 15 20
EFFECTIVE E/A LIMIT LOAD (0) FOR VERTICAL MODE
FIGURE 25. CORRELATION BETWEEN THE ENERGY ABSORBER LIMIT-LOADFACTOR AND SPINAL INJURY RATE.
The spine can also be injured by impact to the head. Hodgson and Thomas alsomeasured loads and strains in the cervical spine of embaimed cadavers whichwere restrained in a vertical seated position under a hydraulic cylinder.The head was mounted in a loading fixture and strain was measured in C2, C4,and C6 (Reference 72).
5.9.2 Mathematical Model Predictions
Various mathematical models have been developed for prediction of spinal re-sponse to +G, loading. An obvious injury mechanism is the inertial loadingsustained by the vertebrae, resulting in compression fractures. Therefore,the earliest models have been one-dimensional spring-mass systems that assumeall the load to be borne by the vertebral body. One such model that has beenused extensively in ejection seat evaluation is discussed in Section 5.9.2.1.
However, this simplified approach cannot predict all types of spinal injuryand cannot assess the significance of spinal curvature. More comprehensiveapproaches have included the flexural beam model of Soechting (Reference 73)and the discrete parameter model of Orne and Liu (Reference 74) that accountsfor the effects of eccentric loading as well as spinal curvature. Sec-tions 5.9.2.2, 5.9.2.3, and 5.9.2.4 describe other models that appear promis-ing for use in assessment of spinal injury potential in aircraft crashes.
57
Downloaded from http://www.everyspec.com

5.9.2.1 Dynamic Response Index. The human response to short-durationaccelerations applied in the upward vertical direction parallel to the spine(+Gz) has been modeled by a single lumped-mass, damped-spring system asshown in Figure 26 (Reference 75). In this model, it has been assumed thatthe total body mass that acts upon the vertebrae to cause deformation can berepresented by the single mass. In use, the relationship
d2 6 + 2 dn L6 + W26 z (8)
dt2 n
is solved through the use of a computer. The third term, which includes thedeformation of the spine, 6, divided by the gravitational acceleration, g,is referred to as the Dynamic Response Index (DRI). The model is used topredict the maximum deformation of the spine and associated force within thevertebral column for various short-duration acceleration inputs. The springstiffness for the model was determined from tests of human cadaver vertebralsegments; damping ratios were determined from measurements of mechanicalimpedance of human subjects during vibration and impact.
m = mass (lb-sec 2 /in.)
6 = deflection (in.)
4 = damping ratiom k = stiffness (lb/in.)
z = acceleration input(in./sec2 )
6 k 2 6*DRI - n max
W = natural frequency of
Z the analog = F/m(rad/sec)
g = 386 in./sec 2
*Dynamic Response Index
FIGURE 26. SPINAL INJURY MODEL. (FROM REFERENCE 75)
An analytical effort was conducted to determine the degree of correlationbetween the spinal injury (DRI) model and injuries experienced in operationalaircraft ejection seats (Reference 76). Figure 27 shows the relationshipbetween operational acceleration environments and actual spinal injury rates.ihe response of the model is expressed in DRI values. It can be seen that theinjury probability does vary with the DRI but that the cadaver data show ahigher probability of injury than do the operational data. It would be ex-pected that the intact, living vertebral coluin imbedded in the torso would bestronger than cadaver segments; consequently, this result might be predicted.
58
Downloaded from http://www.everyspec.com

50- Operational data
40 - Cadaver data /I- 30-/
W/o 20-
LEO/10-
/oA
S .5-D O
2-
1-
S0.5-/
S0.2-
10 12 14 16 18 20 22 24
DYNAMIC RESPONSE INDEX
Aircraft type Nonfatal ejections
A* 64B* 62C 65D* 89E 33F 48
*Denotes rocket catapult
FIGURE 27. PROBABILITY OF SPINAL INJURY ESTIMATED FROMLABORATORY DATA COMPARED TO OPERATIONALEXPERIENCE. (FROM REFERENCE 76)
59
Downloaded from http://www.everyspec.com

To establish acceptable ejection seat acceleration environments, the Air Forcehas adopted a system using a combination of acceleration components and theDRI.
In Specification MIL-S-9479 (Reference 77), the acceleration levels to beimposed on the seat occupant are controlled by acceleration, time, and DRI asshown in the following relationship:
( RI ) 2 + ( G \2 + /G\ <1.DRIL G < 1.0
Here GC and G are measured acceleration magnitudes in the x and y direc-tions, and GxL and G,, are the limit acceleration parameters as read fromacceleration versus time curves included in the specification. DRI is the DRIvalue computed from Equation (9) for the positive z direction. DRIL is thelimit value of the DRI. The value of DRIL is 18 unless the resultant acceler-ation vector is more than 5 conical degrees off the z axis and aft of the planeof the seat back, in which case, the value of DRIL is sixteen. The computedvalue for the left-hand term of Equation (10) may not exceed one.
The DRI is calculated from Equation (9) with model coefficients for thepositive spinal case (eyeballs down) defined for the mean age of the Air Forceflying population (age 27.9 years). The model coefficients are as follows:
Wn = 52.9 rad/sec
S= 0.224
The DRI has been shown to be effective in predicting spinal injury potentialfor +Gz acceleration environments in ejection seats. However, it should beremembered that it is a simple model of a complex dynamic system and that thecorrelations made are for ejection seat acceleration-time pulses that can varywidely from crash pulses. In particular, the crash rate of onseL can be anorder of magnitude greater than for ejection seat pulses. Also, the positionof the spine at the time of impact can have a significant influence on thesusceptibility to vertebral damage. Therefore, a helicopter pilot leaningforward in his seat might be expected to respond differently from an upright,well-restrained ejection seat occupant, and thus have lower tolerance toimpact.
5.9.2.2 Wayne State University Two-Dimensional Model. A two-dimensionalspinal model that considers the details of load transmission among individualvertebrae has been developed by King and Prasad (Reference 78). The modelconsiders the natural spinal curvatures and the effects of flexion and eccen-tric inertial loading on the spine. Head and neck motions are simulated, andtheir effects on the forces and moments in the thoracic and lumbar spine can bestudied for off-axis impacts in the midsagittai plane. The input accelerationpulse can be an arbitrary function of time. The restraint and support systemshave been included to properly simulate a seated vehicle occupant. The experi-mental data for validation of the model were obtained from cadaveric runs withthe spine in the erect and hyperextended mode so that the model incorporatesthe ability to simulate both spinal configurations.
60
Downloaded from http://www.everyspec.com

The following assumptions were made in the mathematical development:
0 The 24 vertebral bodies, the head, and the pelvis are rigid bodiesconstrained to move in the midsagittal plane.
a Each rigid body has three degrees of freedom in the midsagittalplane--two translational and one rotational.
* Tl'e intervertebral discs are massless, and deformation of the spinetakes place at the discs.
a The discs are replaced by a system of springs and dampers--one springand damper for axial forces and another spring and damper arrangementfor restoring torques due to relative angular motion between adjacentvertebral bodies.
* The facets and laminae are springs connected to the vertebral body bya massless rigid rod.
* Each rigid body is assumed to carry a portion of the torso weight thatis eccentric with respect to the center line of the spine.
a The rigid bodies are arranged to simulate the spinal curvatures asclosely as possible.
Equations of motion are derived for each vertebra, resulting in a set of 78second-order differential equations that are solved numerically on a digitalcomputer.
Experiments involving the use of human cadavers were carried out for model vali-dation. An acceleration input was applied at the pelvis while the top of thehead was allowed to remain stress free. The parameter used for validation wasthe force between two adjacent vertebrae, and an intervertebral load cell wasdeveloped to provide the magnitude and line of action of the force. Compari-sons of model predictions and experimental data are shown in Figure 28 for two10 G runs with the spine in different positions, where the loads were measuredbetween the second and third lumbar vertebrae. Shown are both the loads be-tween vertebral bodies (IVL) and those in the facets, which limit relativerotation of the vertebrae. The significance of the initial curvature of tiespine is evidenced by the difference in response between the erect and hyper-extended (backward rotation of the torso) modes.
This model appears to be potentially useful in spinal injury prediction, pro-vided that dynamic fracture loads for vertebrae are known, as discussed inReference 79.
5.9.2.3 Air Force Head-Spine Model. Under the sponsorship of the U.S. AirForce Aeromedical Research Laboratory, a three-dimensional, discrete model ofthe human spine, torso, and head was developed for the purpose of evaluatingmechanical response in pilot ejection. It was developed in sufficient general-ity to be applicable to other body response problems, such as occupant responsein aircraft crash and head-spinal system response to arbitrary loads. Thereare no restrictions on the distribution of direction of applied loads; there-fore, a wide variety of situations can be treaited. The model has beendescribed in Reference 80.
61
Downloaded from http://www.everyspec.com

TIME, MSEC
50 100 150 200 .250
N IVL VIVI, (experimental)-500 (Model)-_
I -'T
S--1000 IVL = Intervertebral load
o 500- ---
-25025 0 1 0.- - -0 0 250
-250 Facet load
-500- Facet load-% (experimental)
(model)(a) ERECT
TIME, MSEC0o 50 100 15 200 250
-500. V (experimental)
S-10001
IVL = Intervertebral load
o 500[250, 50 100 150 200 250
-250. "•-500 Y Facet load (experimental)
-Facet load (model)
(b) HYPEREXTENDED
FIGURE 28. COMPARISON OF MODEL OUTPUT AND EXPERIMENTAL DATA FOR iO-GRUNS WITH THE SPINE IN THE (a) ERECT AND (b) HYPEREXTENDEDMODES. (FROM REFERENCE 78)
62
Downloaded from http://www.everyspec.com

The anatomy is modeled by a collection of rigid bodies that represent skeletalsegments, such as the vertebrae, pelvis, head, and ribs, interconnected bydeformable elements that represent ligaments, cartilaginous joints, viscera,and connective tissues. Techniques for representing other aspects of the ejec-tion environment, such as harnesses and the seat geometry, are included also.The model is valid for large displacements of the spine and treats materiilnonlinearities. The elements of the model are illustrated in Figure 29.
FIGURE 29. THREE-DIMENSIONAL HEAD-SPINE MODEL. (FROM REFERENCE 80)
The basic model is modular in format so that various components can be omittedor replaced by simplified representations. Thus, while the complete model israther complex and involves substantial computational effort, various simpli-fied models, which are quite effective in duplicating the response of thecomplete model within a range of conditions, are available. Three methods ofsolution are available for the analysis: direct integration in time either byan explicit, central difference method or by an implicit, trapezoidal method,and a frequency analysis method.
63
Downloaded from http://www.everyspec.com

A variety of conditions have been simulated, including different rates of on-set, ejection at angles, effects of lumbar curvature, and eccentric head load-ings. It has been shown that large initial curvatures and perfectly verticalacceleration loadings, which cause large bending moments, result in substantialflexural response of the spine. It has been further shown that the combinationof the spine's low flexural stiffness, initial curvature, and mass eccentricityare such that stability cannot be maintained in a 10 G ejection withoutrestraints or spine-torso-musculature interaction.
The complete models were used mainly to study the effects of the rib cage andviscera on spinal response. The flexural stiffness of the torso is ircreasedsubstantially by a visceral model, even though it has no inherent flexuralstiffness. In addition, the viscera provide significant reductions in the axialloads.
5.9.2.4 Head/Neck Joint Analog. Studies conducted by several groups ofresearchers have shown that the results of the Naval Biodynamics Laboratory'sextensive research program to determine the head/neck response of volunteersubjects to impact acceleration could be described by means of a relativelysimple two-pivot analog system (References 51, 52, and 53). The analog, shownin Figure 30, defines the two ends of the neck. The base (TI) and the occipi-tal condyles are defined as the two joints. TI is the neck/torso joint and theoccipital condyles form the head/neck joint. The location and angle of thehead anatomical origin (located at the midpoint of a line drawn between thecenters of the external ears) can be used to determine the location of theoccipital condyles at the top of the neck, The two joints are connected by astraight line. Although the line may not represent the actual length and angleof the neck, it can be used to represent the relative motion of the neck.
HEAD/NECK + (FLEXION)RELATIVE ANGLE - HEAD ANAT. ORIGIN
oCC. CONDYLESHEAD/NECK JOINT)
4,
(NECK/TORSO JOINT)
FIGURE 30. IDENTIFICATION OF JOINTS, LINKS. AND HEAD/NECKRELATIVE ANGLE IN HEAD/NECK TRAJECTORY PLOTS.
64
Downloaded from http://www.everyspec.com
Wismans, et al., proposed a separate analog system for each impact direction(Reference 53). Geometrical parameters of the analog would be identical foreach impact direction as far as the neck link length and the upper pivot loca-tion are concerned. The location of the lower pivot in the torso appears to beslightly different for each impact direction. Also, the initial position ofthis linkage system varies per impact direction. The initial neck link rota-tion is almost 18 degrees in frontal impacts, 11 degrees in oblique impacts,and close to zero in lateral ones.
Seeman, et al. (Reference 51), used the linkage model to simulate the responseof the beam-like Hybrid III dummy neck to -GX sled acceleration. They foundthat it was possible to obtain quite human-like simulations by either relocat-ing the neck/torso joint rearward and below the Ti anatomical origin or bymoving the head/neck joint up to the head anatomical origin and the neck/torsojoint rearward of the TI anatomical origin.
It should be pointed out that the majority of the work on this model has beenin the -Gx impact direction. Also, currently the proposed analog system canonly be considered valid for low severity impacts, i.e., the NBDL human volun-teer test conditions. Additional information must still be obtained for higherexposure levels from human cadaver tests. If such data become available,adjustment of the proposed analog system might be necessary.
5.9.3 Vertebral Properties
Accurate strength and deflection nrnnorties of the seated human tnrsn when ex-posed to inertial loads are urgently needed. Reference 81 includes a consoli-dation of the data from King, Kazarian, and Hodgson (References 78, 82, and 83)for the head and spinal column exposed to +G, loading.
[he vertebral ultimate compression strengths for Army aviators and the U.S.adult civil flying population are shown in Figure 31 (from Reference 71). TheU.S. Army aviator data is based on cadavers with a mean age of 31 years and theU.S. adult civil flying population is based on cadavers with a mean age of56 years.
5.10 LEG INJURY TOLERANCE
Femoral fracture due to longitudinal impact on the knee has been studied exten-sively, probably because of the frequency of this type oF injury in automobileaccidents.Based on cadaver data obtained by Patrick, et al. (Reference 84), King, et al.,
recommended a peak fracture load of 1700 lb as a realistic criterion (Refer-
ence 85). Experiments reported by Powell, et al., point to this value as beingconservative for impacts of less than 20 m/sec (Reference 86). Federal MotorVehicle Safety Standard 208 specified a maximum axial load of 2250 lb.
65
Downloaded from http://www.everyspec.com

3000
2800
2000o
2400.
2230 -
1800- *,%\ ,,4" --
-Jm
- 1800- I
0 1400- 0 40oi 0
1200.I-
14 O -" Sooo
800
800
400
200 I
0 T1 T2 T3 T4 T5 TO T7 T8 TO T10Tl T12 L1 L? L3 L4 L5
VERTEBRAL LEVEL
FIGURE 31. VERTEBRAL ULTIMATE COMPRESSIVE STRENGTH FORVARIOUS POPULATIONS.
Viano has presented a criterion that assesses the dependence of the permissiblehuman knee load on the duration of the primary force exposure (Reference 87).Based on the knee impact data from previous experiments with both fresh andembalmed cadavers, Viano suggests the following femur injury criterion (FIC) todefine a permissible peak knee load:
F(kN) = 23.14 - 0.71 T(msec), T < 20 m/sec
F(kN) = 8.90, T > 20 m, sec (10)
or, in English units,
F(lb) = 5200 - 160 T(msec), T < 20 m/sec(lOa)
F(lb) = 2000, T > 20 msec
66
Downloaded from http://www.everyspec.com

The relationship of Equation (10) is illustrated in Figure 32.
24.0
22.0 - Axial knee impact: peak force
20.0 - femur tolerance as dependentupon pulse duration
z 18.0 F=23.14-0.71 T, T<20 msecL" F=8,90, T > 20 msec
u. 16.0i
< 14.0-CS12.0
10. -
U- 8.0 Knee forceprofile
6.0 r T
4.0
20- T
0 10 20 30 40 50 60
PULSE DURATION, T, MSEC
FIGURE 32. FEMUR INJURY CRITERION. (FROM REFERENCE 87)
5.11 ABBREVIATED INJURY SCALE
The Abbreviated Injury Scale (AIS), first published in 1971, was developed as acomprehensive system for rating injuries by types and severity that would beacceptable to physicians, engineers, and researchers working in automotivecrash investigation. (Its development is summarized in Reference 88). Overthe last decade, the AIS has evolved as the universal system of choice forassessing impact injury severity. It has been revised several times since itsinitial publication as the sophistication of injury assessment, particularlyamong emergency room traumatologists, has increased. The latest revision waspublished in 1985 (Reference 89). The AIS rates seven regions of the humanbody in terms of seven Severity Codes, shown in Table 13.
67
Downloaded from http://www.everyspec.com

TABLE 13. ABBREVIATED INJURY SCALE SEVERITY CODES
AIS_.N.. Severity Code
I Minor
2 Moderate
3 Serious
4 Severe
S Critical
6 Maximum Injury, Virtually Unsurvivable
9 Unknown
The Injury Severity Score (ISS) is being used by many researchers. It is amathematically derived code number determined from the highest AIS codes ineach of the three most severely injured body regions. An engineer concernedwith interpretation or use of the AIS or the ISS is referred to Reference 89,which contains a complete description of the Injury Scalp and how to use it.
68
Downloaded from http://www.everyspec.com

6. OCCUPANT MOTION ENVELOPES
6.1 INTRODUCTION
The purpose of this chapter is to present the extent of an aircraft occupant'smotion in a crash. This knowledge is vital in designinq for occupant protec-tion from injury due to impact with the aircraft interior, a topic discussedin Volume IV.
The body kinematics associated with 7n aircraft crash are quite violent, evenin accidents of moderate severity. The flailing of body parts is very pro-nounced when the occupant is restrained with a lap belt only. However, evenwith a lap belt and a shoulder harness that are drawn up tightly, multidirec-tional flailing of the head, arms, and legs, and to a lesser extent, the lat-eral displacement of the upper torso within its restraint harnessing, is exten-sive. If it were possible to provide adequate sDace around the occupant, thisflailing action would not be a particular problem. Since space for occupantsis usually at a premium in aircraft, especially in cockpit areas, it is notfeasible to locate structural parts of the aircraft sufficiently remote tokeep the occupant from striking them. The only alternative is to design theoccupant's immediate environment so that, when the body parts do flail andcontact rigid and semirigid structures, injury potential is minimized.
An occupant who is even momentarily debilitated by having his head strike asharp, unyielding structural object or by a leg injury can easily be preventedfrom rapidly evacuating the aircraft and may not survive a postcrash fire or awater landing.
Several approaches are available to alleviate secondary impact problems. Themost direct approach, which snould be taken if practical, is to relocate thehazardous structure or object out of the occupant's reach. Such action is nor-mally subject to trade-offs between safety and operation or human engineeringconsiderations. If relocation is not a viable alternative, the hazard mightbe reduced by mounting the offending structure on frangible or energy-absorbing supports and applying a padding material to distribute the contactforce over a larger area. Application of protection padding for both energyabsorption and load distribution is discussed in Volume IV.
The following sections describe head and body excursions during forward impactsled tests with various restraint system configurations. It should be notedthat these strike envelopes represent the effectiveness of various restraintsystems under -Gx loads. They cannot be used to identify the extent of thehead and body excursions under vertical impact. In this case, the headtravels until it hits an object such as the cyclic stick or knee, even with arestraint system that includes a shoulder harness.
6.2 FULL RESTRAINT
Body extremity strike envelopes are represented in Figures 33 through 35 for a95th-percentile Army aviator wearing a restraint system that nieets the require-ments of MIL-S-58095 (Reference 12). The restraint system consists of a lapbelt, lap belt tiedown strap, and two shoulder straps. The forward motionshown in Figures 33 through 35 was obtained from a test utilizing a 95th-percentile anthropomorphic dummy subjected to a spineward (-Gx) accelerationof 30 G. The lateral motion is based on expected restraint system deflectionsin a 30-G lateral crash impact.
69
Downloaded from http://www.everyspec.com

__ -: ~- i---.
-I -~ I Lin:.: . ,I1
IHEEL REST tINE FOR COCKPIT
AIRCRAFT FL.OOR LINE FOR TROOP COMPARTMEHT
FIGURE 33. FULL-RESTRAINT EXTREMITY STRIKEENVELOPE - SIDE VIEW.
10 in.
EVLP -- TO IW707
"" _ i 72-__4__{_. r L
FIGURE 34. FULL-RESTRAINT EXTREMITY STRIKE--ENVELOPE - TOP VIEW. •
70
Downloaded from http://www.everyspec.com

FIGURE_35 FUL RETAN-XREIYSRK
f /
I -
___ ___ *.Hel rest line for coc~1t.
•Tcraft floor line for
tr'oop con~partmnent.
FIGURE 35. FULL RESTRAINT EXTREMITY STRIKErulri. ,inr - RONT WTE
6.3 LAP-BELT-ONLY RESTRAIT
Although upper torso restrairt is required in new Army aircraft, strikeenvelopes for a 95th-percantile aviator wearing lap-belt-only restraint areprcserited for possible use in Figures 36 through 38. They are based on 4-Gaccelerations and 4 in. of torso movement away from the seat laterally andforward.
6.4 INFLATABLE BODY AND HEAD RESTRA,*FT SYSTEP
An experimental prototype inflatable body and head restraint systen (IBAHRS)reduces occupant upper torso, head, and neck motion in comparison to a fullrestraint (MIL-S-58095) and a lap-belt-orly restraint (Reference 90). A majoradvantage of the IBAHRS is that it is crash sensor activated. However, sincethe airbags deflate immediately after inflation, they are effective fora single crash pulie only, although the system provides the added benefit ofprotection with the basic restraint systen to which the airbags are attached.It was also found that incorporating the IBAHRS enhanced the existing MIL-S-58095 restraint system and did not reduce the function of the basic restraint.A comparison of head displacements using the IBAHRS and the host MIL-S-58095restraint is shown in Figure 39 (from Reference 91). This comparison demon-strates how the inflated airbags pick up the slack between the restraintwebbing and the compressed body under impact.
71
Downloaded from http://www.everyspec.com

NN4
hcolrestlin for cockpit.
Aircaftflor line fortroop compartment.
FIGURE 36. LAP-BELT-ONLY EXTREMITY STRIKE
FIGURE 37. LAP-BELT-ONLY EXTREMITY STRIKE
ENVELOPE - TOP VIEW.
72
Downloaded from http://www.everyspec.com

I7_
j1.s ln for cockpit.Aircr~aft floor line fortroop compartment.
FIGURE 38. UAP-BELT-ONLY EXTREMITY STRIKEENVELOPE - FRONT VIEW.
In an extensive series of sled tests sponsored by the U.S. Army, several typesof restraint systems were compared by dynamic impact crash testing to determinethe strike envelopes associated with each restraint system (Reference 90). Therestraints included the IBAfIRS, the standard MIL-S-58095 system, the MIL-S-58095 system with a power haul-back reel instead of an inertia reel, and areflected strap shoulder harness restraint with and without a power haul-backreel. The results of this study demonstrated that the IBMIRS reduced occupantuipper torso, head, and neck motion compared to the other restraint systems.
73
Downloaded from http://www.everyspec.com
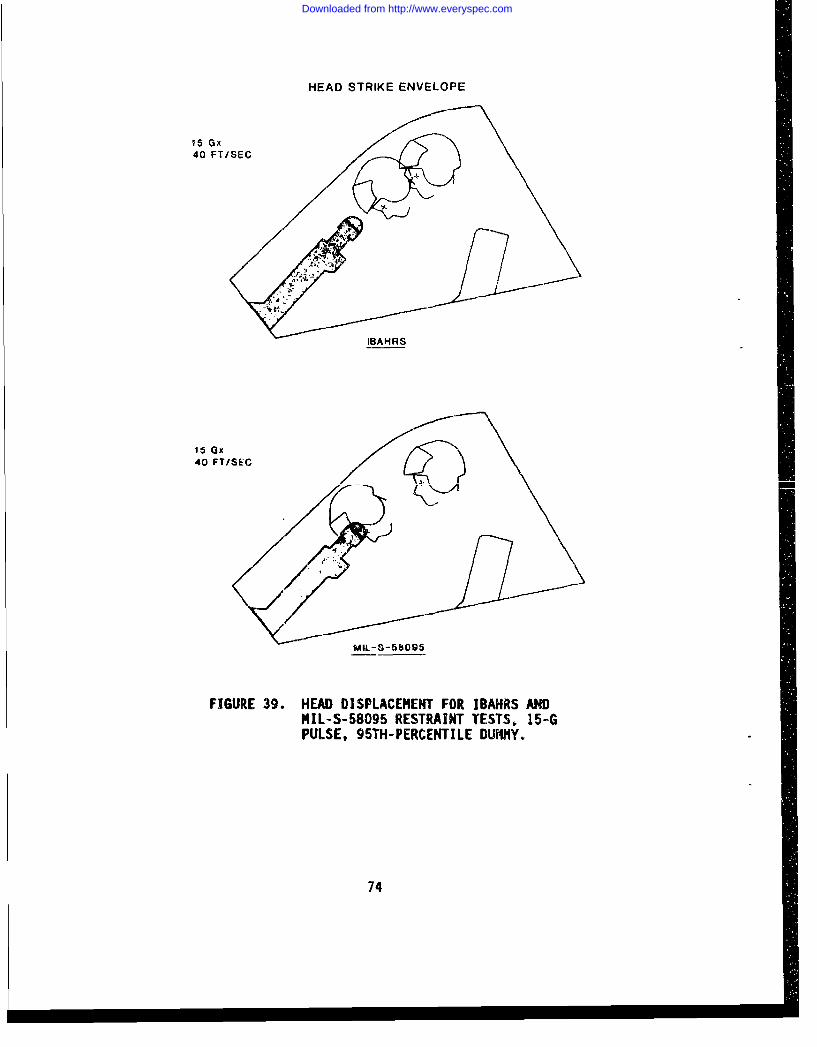
HEAD STRIKE ENVELOPE
15 ox40 FT/SEC
IBAHRS
15 Gx40 FT/SEC
M IL - -S 8095
FIGURE 39. HEAD DISPLACEMENT FOR IBAHRS ANDNIL-S-58095 RESTRAINT TESTS. 15-GPULSE, 95TH-PERCENTILE DUMMY.
74
Downloaded from http://www.everyspec.com

7. HUMAN BODY DIMENSIONS AND MASS DISTRIBUTION
7.1 INTRODUCTION
This chapter presents information on the dimensions and properties of thehuman body. Anthropometric measurements are external dimensions of the humanbody that can be used to define aircraft requirements such as seat height andwidth, eye height, or cabin height. A specialized type of anthropometricmeasurement is the "link length," or distance between joint centers, whichcan be used in locating control positions and is essential for the design ofmathematical or physical simulators of the human body. Finally, the inertialproperties of the body and parts of the body also are required in the designof human simulators.
7.1 ANThROPOMETRY
Anthropometry is a specialized area of physical anthropology that is con-cerned with the measurement of the human body and its parts. Two types ofanthropometric measurements have been recorded, and the use of both types invehicle design has been summarized in Reference 92. Conventional dimensionsof the body obtained with subjects in rigid, standardized positions are eas-ily obtained. Extensive collections of such data are used in clothing designand may determine certain vehicle design parameters including seat height andeye height. A second class of data, which may be referred to as workspacedimensions, is more difficult to obtain and can be applied only to the speci-fic workspace studied. However, these workspace dimensions are essential indesigning aircraft interiors for maximum occupant protecLiun.
7.1.1 Conventional Anthropometric Measurements
Conventional anthropometric measurements of greatest interest in Jircraft in-terior design include those dimensions illustrated in Figure 40, as well asstanding height and body weight. The most recent anthropometric survey ofU.S. Army male aviators is contained in Reference 93, and the dimensions ofgreatest potential usefulness are presented in Table 14. Corresoonding dimen-sions for male nonaviators, taken from Reference 94, are listed in Table 15.Similarly, corresponding dimensions for U.S. Army women, taken from Refer-ence 95, are listed in Table 16. There are no data for women aviators asyet, so the data in Table 16 must be used by the aircraft designers untilmore specific data are available. These dimensions are nude measurements;the dimensions of bulky clothing and helmets must be considered for specificapplications.
Because anthropometric surveys involve a large population sample, they gen-erally follow a normal (bell-shaped) distribution. A normal distribution, asshown in Figure 41, can be described in terms of its mean or average valueand its dispersion about the mean, often expressed as standard deviation.
The percentile value, which corresponds to a rank order, is a useful statis-tic for designers. If a group of subjects were ordered from least to great-est for any given measurement, such as standing height, the first percentilewould be that part exceeded by 99 percent of the group; the 5th-percentilewould be that exceeded by 95 percent of the group. The 50th-percentile, ormedian, would be that half of the group exceeded by the other half. For anormally distributed sample, the median value is the same as the mean, oraverage. I75
Downloaded from http://www.everyspec.com

SITTING HEIGHT_ EYE HEIGHT
FUNCTIONAL REACH L SHOULDER BREADTH
SHOULDER-ELBOW LENGTH
ELBOW-FINGERTIP LENGTH
BUTTOCK-KNEE LENGTH KNEE HEIGHT
POPLITEAL HEIGHT HIP BREADTHAELBOWV
BUTTOCK-POPLITEAL LENGTH HEIGHT
FIGURE 40. CONVENTIONAL SEATED ANTHROPOMETRIC DIMENSIONS.
TABLE 14. SUMMARY OF ANTHROPOMETRIC DATA FOR
U.S. ARMY HALE AVIATORS (REFERENCE 93)
Percentiles (in. IMeasurement 5th 50th 95th
Weight (Ib) 133.0 171.0 212.0
Stature 64.6 68.7 72.8
Seated height 33.7 35.8 37.9
Shoulder breadth 17.0 18.7 20.3Functional reach 28.8 31.1 34,2
Hip breadth, sitting 13.2 14.8 16.7
Eye height, sitting 29.0 31.0 33.1Knee height, sitting 19.3 20.8 22.6
Elbow rest height, sitting 7.4 9.1 10.8Popliteal height 15.1 16.6 18.3
Shoulder-elbow length 13.3 14.4 15.6
Elbow-fingertip length 17.6 19.0 20.3
Buttock-popliteal lenqth 17.7 19.3 21.0
Buttock-knee length 22.0 23.7 25.4
76
Downloaded from http://www.everyspec.com

TABLE 15. SUMMARY OF ANTHROPOMETRIC DATAFOR MALE SOLDIERS (REFERENCE 94)
Percentiles (in.)
Measurement 5th 50th 95th
Weight (Ib) 126.0 156.0 202.0
Stature 64.5 68.7 73.1
Seated height 33.3 35.7 38.1
Shoulder breadth 16.3 17.8 19.6Hip breadth, sitting 11.9 13.0 14.5
Eye height, sitting 28.6 31.0 33.3Knee height, sitting 19.6 21.3 23.1
Popliteal height 16.0 17.5 19.2
Shoulder-elbow length 13.3 14.5 15.7
Elbow-fingertip length 17.4 18.8 20.4Buttock-popliteal length 18.0 9.6 21.3Buttock-knee length 21.6 23.4 25.3
TABLE 16. SUMMARY OF ANTHROPOMETRIC DATA FOR
U.S. ARMY WOMEN (REFERENCE 95)
Percentiles (in.)Measurement 5th 50th 95th
Weight (Ib) 102.8 131.4 164.3
Stature 60.1 64.1 68.5
Seated height 31.1 33.5 35.8
Shoulder breadth 15.1 16.5 18.0Functional reach 25.2 28.0 31.1
Hip breadth, sitting 12.4 13.9 15.6
Eye height, sitting 26.7 29.1 31.2
Knee height, sitting 18.5 20.0 21.8
Elbow rest height, sitting 6.4 8.2 9.9
Popliteal height 15.0 16.4 18.0
Shoulder-elbow length 12.1 13.2 14.4Elbow-fingertip length 15.7 17.1 18.7
Buttock-popliteal length - - -
Buttock-knee length 20.9 22.7 24.9
77
Downloaded from http://www.everyspec.com

=STANDARD0 DEVIATION
o --Dz0o wtLL0
z62.
2.5 16 50 84 97.5
PERCENTILE
FIGURE 41. NORMAL DISTRIBUTION CURVE.
For a normal distribution, 68 percent of the sample is included within plusor minus one standard deviation of the mean, and 95 percent within plus orminus two standard deviations.
An example of the use of the statistics of anthropometric data in setting de-sign limits for a vehicle dimension (seat height adjustment range) is pre-sented in Reference 92.
7.2.2 Equipment Weights
Personnel equipment weights to be considered in the design of aircraft sys-tems are shown in Table 17. The effective weight of a seated occupant in thevertical direction is the sum of the following quantities: 80 percent of theoccupant's body weight, 80 percent of the weight of the occupant's clothingless boots, and 100 percent of the weight of any equipment carried totally onthe occupant's body above knee level.
7.2.3 Body Joints and Ranges of Motion
Few body joints involve rotation about fixed axes or pivot points. Rather,the instantaneous center of rotation may depend on position, as illustratedin Figure 42 for the shoulder joint. Dempster reported on an extensive studyof workspace requirements for seated operators, in which he determined "linklengths" between effective joint centers for major body parts (References 96and 97), rather than standard anthropometric dimensions based on external mea-surements. These link lengths have a number of crash-resistance-related ap--plications: (1) in developing or expanding the strike envelopes shown inChapter 5, (2) in designing crash test dummies, and (3) in nroviding numbersfor mathematical simulators. From the data of several investigations, Singleyand Haley developed the skeletal joint locations for a 50th-percentile maleArmy aviator that are illustrated in Figure 43 (Reference 81).
78
Downloaded from http://www.everyspec.com

TABLE 17. PERSONNEL EQUIPMENT WEIGHTS (LB)
Percentiles
Item 5th-Female 50th-Male 95th-Male
SPH-4, Flying Helmet 3.38 3.38 3.44Nomex Flight Clothing 3.10 3.10 3.10
Combat Boots, Leather Uppers 4.12 4.12 4.12
Leather Flying Gloves .28 .28 .28Pen Light .10 .10 .10
Survival Vest w/Gear 7.50 7.50 7.50Armor Plate - 12.20 14.50
Flotation Gear 2.70 2.70 2.70
Weapon w/Belt, Holster, and Anmio 3.90 3.90 3.90Winter Jacket and Trousers 5.25 5.25 5.25
MOPP* Gear for Pilot 9.0 9.0 9.0MOPP* Gear for Troop 11.5 11.5 11.5
*Mission orientation protective posture
MOPP - MISSION ORENTATIONPROTECTIVE POSTURE
FIGURE 42. PATH OF INSTANTANEOUS CENTER OF ROTATION DURINGSHOULDER ABDUCTION. (FROM REFERENCE 96)
Joint ranges of motion are required in the same areas of application listedabove the link lengths. These movements, illustrated in Figure 44, are mea-sured from a standard anatomical position defined as an erect standing pos-ture with the palm surfaces of the hands positioned anteriorly. Variousstudies have determined the ranges of motion that may be attained voluntarilyand under external force; Table 18 lists angles obtained by Glanville andKreezer (Reference 98) for the movements defined in Figure 44.
79
Downloaded from http://www.everyspec.com

Top of head(C rown)
90 oRwI, 174.6*
80 skull base and• C1 intersection RL 160. 3
C2-C3 hinge R1, 157.170 70C7-T1 hinye RL RL 148.7
60 _L 141.6 RL 142.4
FRL 135.1
u- RL 127.5
S40 •
F- 'RL i1l.7
• 30 RL 112.8 RL 111.8
.420 - RL 104.4
R-, 11.. RL 100.9!'• ~ R / 96.5--•10 RRL 91.2w
0 ..... T/ i0 20•, RL_83.6 40..-
0 10 20 30 40 50 60
HORIZON-AL SCALE, CM
*-Horizontal reference linein centimeters
RL 50.2--
RL 42.5*__
FIGURE 43. SITTING SKELETAL JOINT LOCATIONS BASED ON A 50TH-PERC VTILE MALE ARMY AVIATOR. (FROM REFERENCE 81)
80
Downloaded from http://www.everyspec.com

FF
//
Pi.
FIGURE 44. JOINT RANGES OF MOTION.
TABLE 18. RANGE OF JOINT ROTATION (REFERENCE 98)
Body Measured
Component Rotation (degree...
Motion Symbol Motion Description Voluntary Forced
Head - with A Dorsiflexion 61 77respect to B Ventriflexion 60 76torso C Lateral flexion 41 63
0 Rotation 78 83
Upper arm - E Abduction (coronal 130 137
at shoulder plane)F Flexion 180 185G Hyperextension 58 69
Forearm - at H Flexion 141 146
elbow
Thigh - at I Flexion 102 112
hip J Hyperextension 45 54K Medial rotation - -
L Lateral rotation - -M Adduction - -
N Abduction 71 79
Lower leg - P Flexion 125 138
at knee
81
Downloaded from http://www.everyspec.com

7.3 INERTIAL PROPERTIE;
Inertial properties of the human body have been used in design of escape sys-tems, and moments of inertia of live subjects in a seated position were deter-mined by Santschi, Debois, and Omoto (Reference 99). However, anthropomor-phic dummies and mathematical simulations require inertial properties of bodysegments, specifically moments of -inertia, mass, and center-of-mass locationsand moments of inertia with respect to transverse (y) axes were measured onsegmented cadavers (References 96 and 97).
Clauser, McConville, and Young determined center-of-mass locations and devel-oped regression equations for cadaver segments (Reference 100). From data ofvarious sources, Singley and Haley (Reference 81) determined the segmentmasses and center-of-mass locations presented in Table 19 and Figure 45 for a50th-pei •ntile male Army aviator. Chandler, et al., measured moments ofinertia with respect to six axes for fourteen segments of six cadavers and,from them, calculated the principal moments of inertia for the segments(Reference 101). Their results are presenteu in Table 20.
TABLE 19. CENTER-OF-MASS DISTRIBUTION OF SEATED TORSO -50TH-PERCENTILE MALE ARMY AVIATOR (REFERENCE 81)
Segment Z-Axis X-Axis
Mass Location LocationBody Segment Identify l ) (cm)*_ (c _)**
Head 4.74 77.6 10.1
Neck (CI-Cl) 1.63 71.3 9.7Upper thoracic (Tl-T3) 4.07 62.4 10.0Upper mid thoracic (T4-T6) 4.07 55.6 9.7
Lower mid thoracic (T7-T9) 4.66 48.1 11.2
Upper arm 4.44 43.5 12.2
Lower thoracic (T1O-T12) 5.29 40.2 13.0
Lumbar (LI and L2) 4.48 31.8 13.2Lumbar (L3 and L4) 4.87 24 5 13.1
Forearm 2.62 24.6 23.7
Lumbar (L5) 2.52 19.0 12.2Hand 0.92 15.3 45 1Pelvis 8.89 13.0 11.2Thigh (hip) 15.83 7.6 27.2
Lower leg 6.38 -8.6 55.0Foot 1.99 -37.1 59.0
TOTAL 77.40
*Location is based on floor level of zero with 50th-percentile male
head crown equal to reference line of 174.6 cm."**Location is based on seat back with reference line equal to zero.
Seat back is perpendicular to seat bottom, and torso touches seatback at head, shoulders, and buttocks.
82
Downloaded from http://www.everyspec.com

90(4 .74 kg)
Heuad
80
(1.63 kg)70 - -c
CG
.(4.07 kg)60 t
Ql*(4 .07 kg)
50C.~5Q--(4.66 q
CD Upr. arm cc, (4.44 kg),attached to Tl-T6
( 4.89 kg)
20 2.(6.38 kg)
Tian C(7(0.99 kq)Approx. cut thouhuoo
(owe9 calf CG
SKL HALSRUCOTURE FORALE 50HPECNTL MALE8 ARMY
FIGUR 4 AVIATOR (FSRIYOM FSAE OS REFERENCED 81)TH
83
Downloaded from http://www.everyspec.com

TABLE 20. SEGMENT MOMENTS OF INERTIA ABOUT THE
CENTER OF MASS (REFERENCE 101)
Body Moment of Inertia (10 3_m-cm
I I ISegment xx I zz
Head 174.00 164.40 202.90
Torso 16,194.00 10,876.00 3,785.00Upper arm 143.60 135.20 22.00
Forearm 65.80 63.80 8.70Hand 7.19 5.86 1.97
Thigh 1,144.00 1,190.00 218.70Calf 393-10 391.20 28.90Foot 32.62 30.76 7.29
*Mean values of stature and weight reported to be
172.2 cm and 69.6 kg, respectively, for sample of
six cadavers.
7.4 SCALING OF MEASUREMENTS
References 93 and 94 contain a significant volume of anthropometric data,whose statistics have been completely analyzed. In other words, the mean,standard deviation, and percentiles are listed for all measurements. How-ever, the link lengths presented in Section 7.2.3 and the inertial propertiespresented in Section 7.3 are based on rather small samples. If the user ofthis guide wishes to scale the dimensions of Figures 43 or 45 to an occupantsize other than the 50th-percentile male Army aviator, it is recommended thatthe scaling be based on the most similar anthropometric dimension. Forexample, the lower leg length shown in Figure 43 is 41.0 cm. In order to con-vert this dimension to a 95th-percentile value, it would be multiplied by theratio of popliteal heights from Table 14. The 95th-percentile lower leglength is then calculated as
L95 ( L-50 ) PH95ý
= (41 -0)()= 45.2 cm
84
Downloaded from http://www.everyspec.com

e3--
CENTER OF MASS 130 JOINT M_3
(::--o BEAM-COLUMN ELEMENT LS_.
"02P4
L4 e
e2
m9 m1 .
M222
866
mZIP ,
L8 -
RI
FIGURE 46. PROGRAM SOM-LA BODY SEGMENT DIMENSIONS.
86
Downloaded from http://www.everyspec.com

(ABLE 21. BODY SEGMENT LENGTHS (IN.)
50th-Percentile Part 572
Segment Male Aircrewmember Jummy.
Lower Torso, L, 9.44 10.5Upper Torso. L2 13.1 11.5i(2)
Neck, N 5.10 4.88(2)
Head, L3 8 . 50 (l) 8.35(2)
Upper Arm, L4 11.6 11.3
Lower Arm, L5 14.8( 13.3(3
Upper Leg, L8 17.1 16.5
Lower Leg, L9 18 .4(3) 18.0(3)Spine, S 12.4 10.85(3)
Seated Height 37.0(3) 36.0(3)
(1) Scaled from manikin drawing.
(2) Scaled from Part 572 drawing.
(3) Calculated.
87
Downloaded from http://www.everyspec.com

8. CRASH TEST DUMMIES
8.1 INTRODUCTION
The technology of crash test dummies has advanced significantly since 1968,when the first standard dummy was defined. Several designs currently areavailable, and many one-of-a--kind systems have been developed by various lab-oratories for their own use. However, for use in aircraft system evaluation,special consideration must be given to the effects of the vertical componentof impact force, which make the aircraft crash environment quite differentfrom that of an automobile, for which most dummies have been developed.
This chapter briefly outlines the evolution of current dummy technology, indi-cates the design features that are desirable for aircraft system testing, andsummarizes research and comparative performance of dummies and humans.
8.2 DUMMY TECHNOLOGY
8.2.1 History of Dummy Development
One of the earliest dummy designs was a rugged ejection seat dummy built bySierra Engineering Company for the Air Force in 1949. According to Refer-ence 104 this dummy had limited articulation and poor biomechanical fidelity,but it filled an important need, not only for aircraft system manufacturersbut for the automobile industry as well.
A significant step toward the present anthropomorphic dummies was made bySwearingen, who, in 1949, needed a dummy better than the rigid test articlesthen available in order to evaluate explosive decompression for an aircraftcabin as a result of window failure. He designed a 120-lb dummy with arti-culated principal joints, realistic distribution of body weight, and centersof gravity approximating the human body. More than 500 blast tests were madewith this dummy to determine the hazard of explosive decompression.
In 1951, Swearingen completed an improved dummy, capable of withstanding 35to 50 G, which was used in evaluating a new safety harness for generalaviation (Reference 105).
In 1954, Alderson Research Laboratories, Inc., created the first mass produc-tion dummy, unique for its modular design. The design permitted new parts tobe added as needs changed and as knowledge grew over the subsequent decade.In 1967, both of the major dummy manufacturers marketed new devices that fea-tured increased articulation in the vertebral column and shoulders, as wellas increased chest compliance. These changes effected some improvement inbiomechanical response but still fell far short of what is available today.
In 1968, SAE Recommended Practice J963 was published as a partial definitionof a standard 50th-percentile male anthropomorphic test device (Refer-ence 106). J963 recommended weights, center-of-gravity locations, dimensionsfor body segments, and the ranges of motion for body joints. Although mo-ments of inertia and many design details were left unspecified, this was afirst step toward a standard test device. Plderson upgraded its design tomeet J963 in 1968 and 1971, while the Sierra counterpart appeared in 1970.
88
Downloaded from http://www.everyspec.com
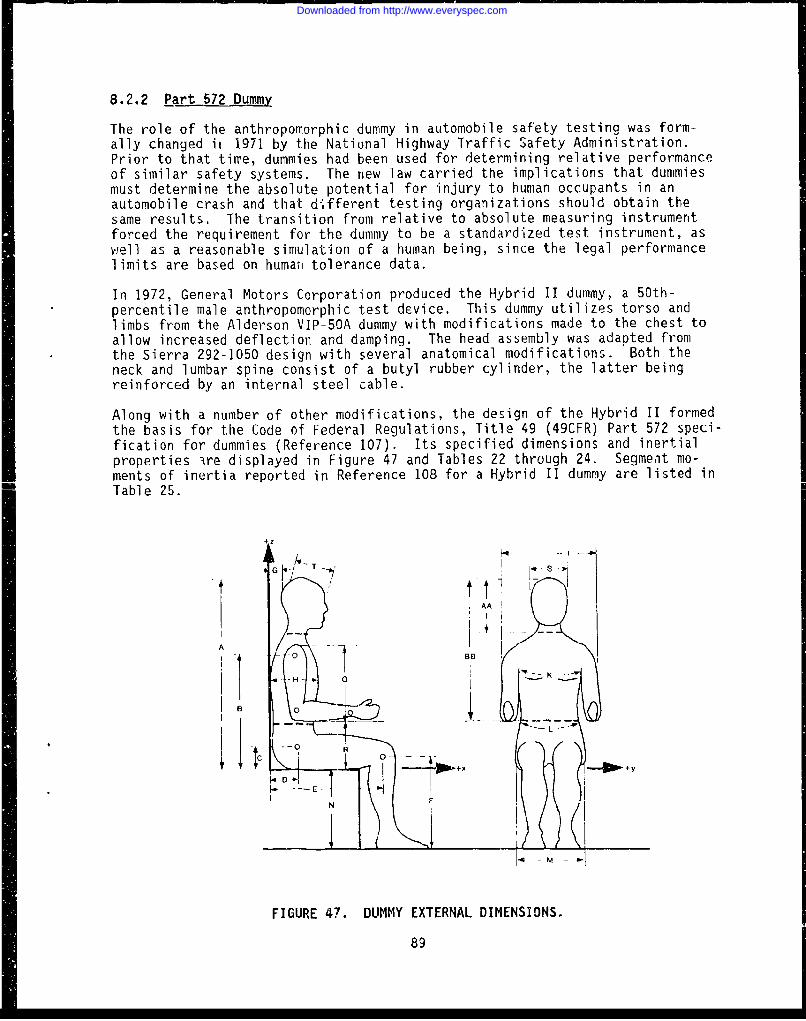
8.2.2 Part 572 Duimfy
The role of the anthropomorphic dummy in automobile safety testing was form-ally changed it, 1971 by the National Highway Traffic Safety Administration.Prior to that time, dummies had been used for determining relative performanceof similar safety systems. The new law carried the implications that dummiesmust determine the absolute potential for injury to human occupants in anautomobile crash and that different testing organizations should obtain thesame results. The transition from relative to absolute measuring instrumentforced the requirement for the dummy to be a standardized test instrument, aswell as a reasonable simulation of a human being, since the legal performancelimits are based on human tolerance data.
In 1972, General Motors Corporation produced the Hybrid II dummy, a 50th-percentile male anthropomorphic test device. This dummy utilizes torso andlimbs from the Alderson VIP-50A dummy with modifications made to the chest toallow increased deflection and damping. The head assembly was adapted fromthe Sierra 292-1050 design with several anatomical modifications. Both theneck and lumbar spine consist of a butyl rubber cylinder, the latter beingreinforced by an internal steel cable.
Along with a number of other modifications, the design of the Hybrid II formedthe basis for the Code of Federal Regulations, Title 49 (49CFR) Part 572 speci-fication for dummies (Reference 107). Its specified dimensions and inertialproperties ire displayed in Figure 47 and Tables 22 through 24. Segment mo-ments of inertia reported in Reference 108 for a Hybrid II dummy are listed inTable 25.
.4 M -•
FIGURE 47. DUMMY EXTERNAL DIMENSIONS.
-98G
Downloaded from http://www.everyspec.com

TABLE 22. DUMMY EXTERNAL DIMENSIONS (PART 572)
PaTt 572Figure 37 Specification
Desionation Code (in.)Seated height A 35.7 ± 0.1
Shoulder pivot height B 22.1 + 0.3
Hip pivot height C 3.9Hip pivot from bark line D 4.8
Knee pivot from back line E 20.4 ± 0.3
Knee pivot from floor F 19.6 + 0.3Head back from back line G 1.7
Chest depth H 9.3 + 0.2Shoulder width 1 18.1 0.3Chest circumference over
nipples K 37.4 + 0.6Waist circumference at
minimum girth L 32.0 + 0.6Hip width M 14.7 + 0.7Popliteal height N* (17.3 + 0.2)
Shoulder-elbow length Q* (14.1 ± 0.3)Elbow rest height R* (9.5 ± 0.5)Head width S* (6.1 + 0.2)
Head length T1 (7.7 + 0.2)Head segment line AA 9.3Shoulder-thorax segment line n 25.. I
*Added to Part 572 data, SAE specification value in parentheses.
TABLE 23. DUMMY COMPONENT WEIGHTS (PART 572)
Part 572
SpecificationSegment _(b)
Head 11.2 + 0.1
Upper torso (including lumbar spine) 41.5 + 1.6Lower to[so (including visceral sac.
and upper thighs) 37.5 1- 1.5
Upper arm 4.8 + 0.2
Lower arm 3.4 + 0.1Hand 1.4 + 0.1
Upper leg 17.6 + 0.7Lower leg 6.9 + 0.3Foot 2.8 + 0.1
lotal dummy (including instrumenta-
tion in head, torso, and femurs) 164.0 + 3.0
90
Downloaded from http://www.everyspec.com

TABLE 24. CENTER-OF-GRAVITY LOCATIONS (PART 572)
Part 572 Specification
x z
Segment x and z Reference Origin (in.) (in.)
Head Back and top of head +4.0 + 0.2 -4.7 + 0.1
Upper torso Backline and top of head +4.1 + 0.3 -17.2 + 0.3
Lower torso Backline and top of head +4.9 + 0.5 -31.0 + 0.5
and upperthigh
Upper arm Shoulder pivot 0.0 + 0.3 -5.0 + 0.3
Lower arm Elbow pivot 44.2 + 0.3 0.0 + 0.3
Hand Wrist pivot +2 2 + 0.3 0,0 + 0.3
Upper leg Knee pivot to upper leg -6.7 + 0.3 0.0 ± 0.3
rotation centerLower leg Knee pivot to ankle pivot 0.0 + 0.3 -8.0 ± 0.3Foot Ankle pivot +2.2 + 0.3 -1.7 + 0.3
NOTE: Axis system is shown in Figure 37 (drawing of external dummy dimen-
sions), using +x forward and +z up.
TABLE 25. HYBRID II MASS MOMENTS OF INERTIA
(REFERENCE 108)
Moment of Inertia
(in.-lb-sec2
I I IBody Segment x y z
Head 0.226 0.275 -
Head/neck 0.310 0.367 0.233
Upper torso (includeslumbar spine) 2.18 1.79 -
Lower abdomen, pelvis,
and visceral sac 2.32* 1.73* -
Right upper arm 0.134 0.132 0.022
Right forearm (no hand) 0.012 0.068 0.071
Right upper leg 0.127 0.873 0.890
Right lower leg (no foot) 0.599 0.575 0.359
*Included lumbar section.
NOTES:
1. Instrumentation was installed in the head, chest, andfemurs during the measurements.
2. Estimated accuracy of measurements: ± 3 percent.
91
Downloaded from http://www.everyspec.com

8.2.3 Hybrid III Dummy
General Motors continued development of anthropomorphic dummies and in 1975produced the Hybrid III dummy (Reference 109). This dummy has markedly im-proved component biofidelity, particularly in the head and neck system,thorax, and redistributed lower torso weight. In addition, the Hybrid IIIincludes transducers for measurement of neck loads and chest deflections.
The Hybrid III head consists of an aluminum 411 covered by constant-thickness vinyl skin. The neck, shown in Figdre 48, consists of three rigidaluminum vertebral elements molded in a butyl elastomer which provides thehigh damping characteristics. Aluminum end plates attach the nieck segment tothe head and thorax, with a steel cable running through the center of theneck.
FIGURE 48. HYBRID III NECK.
92
Downloaded from http://www.everyspec.com

The thorax of the Hybrid III consists of six metal ribs connected to a weldedsteel spine. The whole assembly is ballasted for correct weight and center ofgravity location. This spine provides attachment points for the neck, clavi-cles, ribs, and lumbar spine.
The lumbar spine of the Hybrid III is made of curved polyacrylate elastomerwith molded end plates for attachment to the thorax and pelvis. Two steelcables run through the central section. The lower body has correct weightdistribution and is ordinarily cast in a seated position. The Hybrid III mayalso be obtained with freely articulating hips and a straight rubber spine ele-ment as opposed to the curved spinal element in the seated Hybrid III. Thisdummy, denoted as the standing Hybrid III, is most commonly used in pedestrianimpact and aircraft ejection testing where full leg extension is important.
The Hybrid III test dummy was incorporated into the Department of Transpor-tation's specifications for crash test dummies in 1986 (Reference 110). SinceOctober 23, 1986, manufacturers have had the option of using either the Part572 dummy or the Hybrid III for compliance testing until August 31, 1991. Asof September 1, 1991, the Hybrid III will replace the original Part 572 testdummy and will be used as the exclusive means of determining a vehicle's con-formance with the performance requirements of Federal Motor Vehicle SafetyStandard No. 208.
The drawings and specifications for the Hybrid III dummy are available fromthe National Highway Traffic Safety Administration (NHTSA) (Reference 110).The Hybrid III's geometrical and inertial properties have been determined forboth the standard and the standing Hybrid II, dummies. These data may befound in Reference 111.
8.2.4 Side Impact Dummies
NHTSA has proposed adoption of a new side impact test dummy (SID) for use intheir upgraded side impact standard (Reference 112). The proposed SID isidentical to the Part 572 dummy described in Section 8.2.2 with several excep-tions. The thorax ind knees have been redesigned to produce more human-likeacceleration responses in the lateral directions. Modifications include accel-erometers for ribs, spine and pelvis, a shock absorber between the rib cageand spine, and a rubber hinge where the ribs attach to the spine. In addi-tion, to keep the design of the SID as simple as possible, the dummy does nothave articulating arms or shoulders. Instead, the mass of the arms has beenincorporated into the mass of the thorax, and urethane foam stump arms havebeen added for appropriate biofidelity characteristics.
Impact test results of the SID dummy have been compared with those of cadaversin actual vehicle-to-vehicle crash tests (Reference 62), and the responses ofthe SID corresponded well with the response of the cadavers. However, inrigid-wall impacts, the SID experiences higher accelerations than a cadaver.Thus, the SID responses will have adequate biofidelity with padded structurestypical of the interior of a vehicle, but not with rigid structures. Itshould be noted that the SID has been developed specifically for impulsive,intrusive loading and not for longer-term lateral accelerations typical ofaircraft crashes.
93
Downloaded from http://www.everyspec.com

At the same time that thE SID was being developed in this country, effortsalso were under way in Europe to develop a side impact dummy. As in the USA,the Part 572 dummy was modified with the intention of using it for bothlateral and frontal impacts (Reference 113). Since the response of the Part572 dummy's thorax and shoulder was much too stiff compared to cadaver tests,the arm was modified by reducing the size of the structural members and in-creasing the padding. The mobility of the shoulder was increased in bothforward and upward directions and the rib cage was redesigned to give morerealistic lateral chest deflection.
Since that time, a unified European side impact dummy (EUROSID) has been de-signed and developed by a group of European research laboratories workingtogether under the auspices of the European Experimental Vehicles Committee(Reference 114). The head is a standard Hybrid III head, but the neck, chest,shoulder, abdomen, pelvis, and legs have been modified to allow evaluation ofinjuries seen in cadavers. The EUROSID was designed to measure thoracic in-jury on the basis of chest deflection, but NHTSA found that the chest deflec-tion measjrement was not able to distinguish differences in impact intensitiessuch as between rigid and padded surfaces. However, the EUROSID thorax peakacceleration responses compared reasonably well with the SID. Again, as withthe SID, the EUROSID has been developed specifically for evaluating automobileside impacts involving intrusive and impulsive loads on the occupant.
8.3 COMPARISON OF DUMMY AND HUMAN RESPONSE
There are two basic questions regarding the use of a mechanical system such asa dummy to evaluate the degree of protection a vehicle system would afford itshuman occupants. First, how closely does the dummy response simulate humanresponse? Second, how does performance vary from one dummy to another andfrom one test laboratory to another?
The first question presents a problem. The response of live human subjectscan, of course, be determined only at safe acceleration levels, substantiallybelow crash-resistance design conditions. The response of human cadavers athigher acceleration levels has been used in dummy design, but questions doexist as to the quality of simulation provided by cadavers. Walsh and Romeoreported on a series of sled tests and full-scale car crash tests whereinfresh, unembalmed cadavers and dummies were exposed to identical crash condi-tions (Reference 115). Both belt restraints and airbags were used. Althoughthe overall kinematic response between cadaver and dummy agreed fairly well,some injuries that could not have been detected with the dummy were observedin the cadaver.
Although the Pert 572 and Hybrid III dummies are vast improvements over ear-lier dummies, there are still some significant differences in the response ofthe dummies and humans. For instance, current dummy heads (vinyl flesh overaluminum skull) will not provide proper acceleration data in facial impactenvironments because the face is too stiff. Since crushing of the facialbones can provide shock absorption and attenuate the accelerations experiencedby the brain, severe blows to the face of a dummy will result in unrealis-tically high head accelerations (Reference 43).
94
Downloaded from http://www.everyspec.com

Problems also arise in the comparison of human and Hlybrid III head and neckdynamic responses. Data from human volunteer head aiid neck dynamic responsesand those of a Hybrid III head and neck were compared and analyzed in detailby Seemann, et al. (Reference 51). The authors found that there were signifi-cant differences in the human volunteer and dummy responses for -x and +zacceleration tests. for instance, when the body is subjected to a 4z acceler-ation profile, human heads often initially go into significant extension fol-lowed by flexion. The Hybrid III head/neck system does not. Instead, itfirst goes into flexion in response to a +z acceleration profile, indicatingthat the Hybrid III neck is much too stiff to respond in a human-like mannerin the sagittal plane. In the -x acceleration profile, the downward travel ofthe human head far exceeded that of the dummy head. The timing of the re-sponse was also considerably different, with the dummy head rebounding whilethe human head continued its downward travel.
Several test programs have been conducted to compare the dynamic response ofdifferent dummy designs. Chandler and Christian demonstrated that, as dummiesbecome more complex, the number of test variables may exceed those that theexperimenter can control (Reference 116). The requirement for standard testpractices also was noted. Massing, Naab, and Yates compared several dummiesin tests with either belt restraints, airbags, or energy-absorbing steeringcolumns (Reference 108). Some of the sled tests were repeated at two differ-ent laboratories. As an example of the results, mean head resultant accelera-tions for ten repeated tests or each of five dummies with belt restraints areshown in Figure 49. Figure 50 shows the mean head accelerations for ten re-peated tests with the same dummy conducted at two different facilities, theFAA Civil Aeromedical institute (CAMT) and Calspan Corporation. Because onlyone dummy was tested at the two different facilities, data are insufficient topermit generalization with respect to comparative performance. However, Fig-ure 50 indicates that differences in performance did exist. Detailed analysesof the data are presented in Reference 74.
A series of front barrier crash tests utilizing various vehicles and unre-strained dummies compared the responses of the Part 572 and Hybrid III dummies(Reference 117). The results of the testing and analysis indicate that thetwo dummies' measurements were generally comparable and reasonable. Responsedifferences which did occur were found to be the result of either dummy anthro-pomorphic differences or vehicle response differences. For instance, the Hy-brid III driver HIC values were higher than the Part 572 because the Part 572dummy's higher seated height more frequently caused the Part 572 to graze thesun visor, whereas the Hybrid III more often struck its face on the steeringwheel rim.
Computer simulations conducted by Kaleps and Whitestone (Reference 111) showedthat Hybrid III crash responses were quite similar to those of the Part 572dummy, with primary differences being phase shifts, slightly smoother responsecurves for the Hybrid Ill, and also somewhat faster responses for the HybridIII. These effects were interpreted to be due to slightly different initialpositions, a numerically more stable data set for the Hybrid III, and a gener-ally stiffer structure for the Hybrid Ill. They also found that there wasvery little difference in the response between the seated and the standingHybrid III. The only readily observable difference was that the seated dummypenetrated deeper into the seat pan than the standing dummy during the crashsimulation.
95
Downloaded from http://www.everyspec.com

I-0 -0 - G-O (
2I ....2.... .1.. .. .. 1 -"HY13RID'U 136 -~-0- -- 0--
*mr -----L[ SRI.'A
1- 7
,UI
25 -.-
0 -0 50 o00 so 200 250 300 350 400 4:o0 500
FIGURE 49. COMPARISON OF MEAN HEAD RESULTANT ACCELERATION RESPONSES FORTHREE DIFFERENT DUMMY DESIGNS. (FROM REFERENCE 108)
Backaitis and St-Laurent studied the chest deflection characteristics ofvolunteers and Hybrid III dummies under various loading conditions (Refer-ence 118). The test results revealed that the thorax of the Hybrid IiIdummy, when dynamically loaded by a diagonal shoulder belt, was somewhatstiffer than that of volunteers for both tensed and relaxed conditions. Theyalso found that dummy thorax deflection readings are highly affected by thesurface area of a loading probe and the location and direction of the appliedload. The Hybrid III dummy's thorax deflection gauge underestimated com-pressions administered externally to the thorz:x by small-area loading probesbut overestimated externally produced rib cage compressions when loadingoccurred by large-area probes. The tests also showed that the deflectionpattern of the Hybrid III dummy's thorax had a parabolic shape, with theleast amount of deflection occurring at mid-sternum. In humans, however,surface deflection shows a linear increase toward the bottom of the rib cage.
96
Downloaded from http://www.everyspec.com

I ~~~FAA CAMI -___
- - ~CALSPAN- -
S125 . . . .
< too -
I A--
I'
U I • I . .... ...
50 -0 J0 150 20-5-00 30 40 5 o
HSR DUM CODUTE AT TWO LAOAOIS FOMRFRNE18
26S --- ---
D/ 11i7 -__
i -.
50 100 150 200 250 300 350 400 -450 500
TIME (MsCc)
FIGURE 50. COMPARISON OF MEAN HEAD RESULTANT ACCELERATION RESPONSES FORHSRI DUMMY CONDUCTED AT TWO LABORATORIES. (FROM REFERENCE 108)
Leung, et al., conducted a series of analytical studies and sled tests to de-termine the submarining tendencies of the Part 572 dummy. They found that thePart 572 dummy submarines more easily than human cadavers because of its dif-ferent pelvic shape (Reference 119). When they changed the dummy by modifyingthe abdominal tissue and pelvis shape, the submarining tendency more nearlysimulated that of the K-man cadaver than the standard Part 572 dummy.
The Hybrid III dummy has a pelvis similar to the standard Part 572 dummy, butit can be augmented with a submarining-indicating pelvis. This submarining in-dicator has load gages attached at the iliac crests, under the flesh, to mea-sure the lap belt loads on the pelvis. This device is incorporated to optimizelap belt placement. One way that the Hybrid III differs from the Part 572 isin the way that it simulates a driver's slouched seating position. Thissimulation is possible with a smaller abdomen than the Part 572 and with a45-degree segment in the lumbar spine.
97
Downloaded from http://www.everyspec.com

8.4 SUITABILITY OF DUMMIES FOR AIRCRAFT SYSTEM EVALUATION
All of the recently developed dummies described in Section 8.2 were designedfor automotive testing. In dynamic testing of an energy-absorbing seat, designfor aircraft occupant weight can play a critical role. It would be desirable,although generally not practical, to evaluate a seat for a range of occupantsizes. A 95th-percentile dummy would verify the strength of the seat structureand restraint system as well as the adequacy of the energy-absorbing stroke.Testing with a 50th-percentile dummy would demonstrate the performance of thesystem for an occupant of average height and weight. A 5th-percentile dummywould probably experience accelerations of higher magnitude and would establishthe severity of a given set of impact conditions for the smaller occupant.However, both the expense of dummy purchase and the cost of conducting dynamictests may make such a test program impractical. An alternative procedure mightbe to establish the occupant protection capability of a seat design by analysisand to conduct a dynamic test with a 95th-percentile dummy to verify systemstrength.
The design of different anthropomorphic dummies for military testing must bebased on the military aviator population. Body dimensions, joint locations,and mass distribution properties for small-, mid-, and large-size male aviatorshas been generated as a tri-service database for three-dimensional, mathema-tical models and test dummies (Reference 103). These dimensions are availablefor the dummy designer's guidance.
Another factor that must be considered in dummy selection for aircraft seattesting is that none of the dummies described for automotive testing has beendesigned for accurate response to vertical impact. The spinal column, which isa critical region of human tolerance to aircraft crash loading, has been de-signed to simulate response to -Gx loading rather than the more critical+Gz direction.
At present, it seems that use of the Hybrid III dummy, sized to 5th-, 50th-,and 95th-percentile versions of the U.S. Army aviator, provides the bestapproach.
8.5 EJECTION SYSTEM MANIKINS
There are ongoing activities within both the Air Force and the Navy to developadvanced anthropomorphic manikins for ejection system testing. Tieber presentsa summary of the ongoing Air Force efforts as well as an evaluation of therequirements for an ejection system manikin in Reference 120. These ejectionmanikin design requirements are summarized in Table 26.
8.5.1 GARD and LRE Manikins
The grandfather of ejection manikins is the GARD manikin, jointly developed byGrumman Aircraft and Alderson Research Laboratories in the 1950's. While theGARD manikin duplicated the location of the human center of gravity in the ejec-tion seat, the body articulations were very limited. Therefore, a new attemptwas taken in the 1970's to develop a more complete replica of the human forejection seat testing. The Limb Restraint Evaluator (LRE) was constructed totest the effectiveness of limb restraint systems being incorporated into cur-rent operation ejection Eeats. However, the need for increased biofidelity in
98
Downloaded from http://www.everyspec.com

TABLE 26. MANIKIN DESIGN REQUIREMENTS
Requirement
Cateqories Requirement Areas Requirement Drivers
Anthropmetry Dimensinns, mass and inertia Population to beproperties, shape modeled
Data Channels, sample rate, acqui- System to be tested
Acquisition sition and storage, size,heat and power requirements
Usability Durability, setup, call- Test conditions
bration and pretest checkout,maintenance, data extraction
Structural Strength and load bearing Anticipated loads and
capability, packaging, test conditions
placement and mounting of
components
Biofidelity Response to impact and Test objectivesinertia loads, articulation,
realism of tissue
Aerodynamics Realistic motion in flight Test conditions
the duplication of the dynamic characteristics of the human dictated the de-
velopment of an Advanced Dynamic Anthropomorphic Manikin (ADAM).
8.5.2 Advanced Dynamic Anthropomorphic Manikin (ADAM)
The current Crew Escape Technologies (CREST) program, sponsored by the AirForce at Wright Patterson Air Force Base, includes the development of theADAM. The design goals and concepts of the ADAM are to closely represent thestatic and dynamic characteristics of the human body to test the capabilitiesof the CREST ejection seat during emergency egress from an aircraft. Themajor goals in the design of ADAM were the following:
. High degree of biofidelic representation of the human regarding:
- Anthropometric dimensions- Mass characteristics- Dynamic response
99
Downloaded from http://www.everyspec.com

a Measurement of the dynamic response characteristics during ejectionsuch as:
- Head loads- Pelvic loads- Accelerations within the manikin- Joint rotations
* Development of an onboard computer controlled instrumentationsystem for 128 data channels that would:
- Provide signal conditioning andstorage for 4+ seconds
- Telemeter the data to a ground station
* Survive the environmental conditions associated with ejectiontesting (i.e., windblast, high G loading, temperature, etc.).
Some of the basic features of the ADAM that set it apart from the Hybrid I1l,GARD, and LRE are discussed in References 121 and 122. A comparison of mani-kin mechanical characteristics and instrumentation system characteristics areshown in Tables 27 and 28.
TABLE 27. COMPARISON OF MANIKIN MECHANICAL CHARACTERISTICS
GARD LRE ADAM HYBRID III
Characteristics(percentile) 5 50 95 95 Small Med. 'arge 5 50 95
Height (in.) 65.2 69.1 73.1 72.2 66.2 70.2 74.3 64.8 66.2 73.6Weight Total (Ib) 132.5 161.9 200.8 214.0 139.5 179.5 215.4 147. 155.5 207.9
Number ofArticulations 18 39 43 26
Number of
InstrumentedArticulations 0 33 39 0
Range of Motions Limite Near Human Limits Human Limits Limited
Elastomer Stops No No Yes, In All Joints Yes, In Some JointsFlexible Neck No Yes Yes YesFlexible Spine No No Yes YesArticulated
Lumbar Spine No Yes Yes NoTorque Adj.
Joints Yes No Yes YesPelvis Design Seated/Standing Seated Seated/Standing Seated
100
Downloaded from http://www.everyspec.com

TABLE 28. CHARACTERISTICS OF INSTRUMENTATION SYSTEMS
Onboard Number ofManikin Type Telemet.r Reordino Umbilical Data Channels
GARD Passive Yes No No 22
Digital
LRE Computer Yes Yes Yes 96Controlled
(Partial)
ADAM Computer Yes Yes Yes 128Controlled(Complete)
HYBRID III Passive No No* Yes VariableAnalog (<30)
*The Naval Research and Development Center (NADC) developed an onboard data
acquisition system for the Hybrid I1l.
The anthropometry and mass characteristics to which the small- and large-sizeADAM were designed are based on the tri-services data base (Reference 103).While the majority of the ADAM components were specially designed to meet thedesign specifications, the existing Hybrid III head and neck were utilized.Nevertheless, a manikin neck that can correctly respond under +Gz dynamicload is currently being developed and is discussed in Section 8.7. Themanikin limbs are designed to undergo significant dynamic motions if limbflail occurs at speeds up to 700 KEAS. In order to duplicate as closely aspossible the degrees of freedom in the human body, there are 43 degrees offreedom designed into ADAM. A partial listing of the joint degrees of free-dom and rotation limits are shown in Table 29. "Soft stops" were designed toduplicate the increasing resistance to joint rotation as the limits ofrotation are being approached. Figure 51 shows a representative joint rota-tive force of the human elbow. The data presented in Figure 51 indicate thatas the lower arm reaches its limits of motion with respect to the upper arm(flexion/extension), the Fx force resisting the motion increases signi-ficantly. The lower arm is extended when the angle at the elbow is approxi-mately 180 degrees, and flexed %hen the lower arm to upper arm angle is closeto 10 degrees. At the time of publication the ADAM was currently undergoingverification testing for use in the CREST development program (Refer-ence 103).
101
Downloaded from http://www.everyspec.com

TABLE 29. JOINT DEGREES OF FREEUOM AND ROTATION LIMITS OF ADAM MANIKIN
Angular MotionJoint _ Mesorttior, of Motion (Dearees)
Wrist Flexion 85Extension 85Abduction 45
Adduction 25Elbow Flexion 140
Forearm Supination 95Pronation 75
Shoulder Flexion 178
Extension 57Traverse Abduction 134Traverse Adduction 48
Coronal Abduction 170
Sternoclavicular Joint Pronation 10
Retraction 10Elevation 10
Depression 10Upper Arm Rotations 115
15
Ankle Flexion 45
Extension 25Inversion 34
Eversion 18Knee Standing Flexion 125
Tibial Rotation at 900 Flexion
Internal 35
External 45
Tibial Rotation at 00 Flexion
Internal 0
External 0Hip Flexion 115
Extensicn 0
Supine Abduction 60Supine Adduction 30900 Flexion Abduction 50900 Flexion Adduction 30
Rotation 900 Hip Flexion 4040
Rotation Full Extension 40
40Rotation Prone 900 Knee 40
40
102
Downloaded from http://www.everyspec.com

80 FX
S 1X IxN 70
LL 60 -F
U-
50z y .- xwz0 40 0a-00- 30
0 20ILL
I-EL0 AIR FORCE COORDINATE SYSTEMC"
W!
Co
U" -10 z
VOLUNTARY RANGE OF ~MOTION--20 --
0 20 40 60 80 100 120 140 160 180
FORCED SWEEP OF THE LOWER ARM FORELBOW EXTENSION/FLEXION
FIGURE 51. ELBOW RESISTIVE FORCE VERSUS ROTATION ANGLE.
* 8.6 INSTRUMENTATION IN MANIKINS
A major current development effort sponsored by the U.S. Navy involves a newinstrumentation system for incorporation into the Hybrid III dummy (Refer-ences 123 and 124). The objectives of the prugram are: (1) to make anexisting dummy more suitable for ejection system testing, (2) to develop aninstrumentation package that will allow the three-dimensional tracking ofdummy-based coordinate systems within the seat, (3) to incorporate a micro-processor controlled data acquisition and storage system irto the manikin,
103
Downloaded from http://www.everyspec.com

and (4) to establish the degree of biofidelity exhibited by the manikin. Theinstrumentation package consists of miniature accelerometers, both linear andangular, and rate gyros which will be used to monitor the responses of themanikin's head center of gravity, the base of the neck segment, and the baseof the lumbar spine. The data acquisition, recording, and storage systemconsists of on-board signal conditioning, A/D conversion, and RAM storagewhich can support 50 channels of data sampled at 2000 Hz for 6.6 seconds.The configuration is volume compatible with the space available in theHybrid III dummy and could be adopted for mounting without miniaturization.
The Data Acquisition and Storage System (DASS) has been tested independentlyand in a Hybrid III dummy on the ejection tower, horizontal accelerator, anddunker of the Navy. The Navy dunker subjected the instrumented dummy in asimulated a4rcraft cockpit section to a shock pulse caused by water impactand subseq,-it contact with springs at the end of the submerged dunkertrack. The tests demonstrated the advantages of having a self-containedportable data acquisiticn system. Miniaturization of the data acquisitionand storage system has been initiated to minimize weight and power consump-tion and, consequently, minimize further manikin modifications to accommodatechanges in weight and center of gravity locations.
The authors point out that the instrumentation system is an integral part ofthe dummy design and that it cannot be tacked on later as requirementschange. The dummy instrumentation must be consistent with Lhat used indeveloping the human response data in order to maximize ease of performancevalidation. Standardization is essential in order to have repeatable databetween test series and test facilities. This is illustrated in figure bZwhich shows the seat acceleration profile filtered at 500 Hz (top) and 15 Hz(bottom). The higher frequency filter maintains the exhibited accelerationprofile. However, the higher frequency filter presents d problem in quantify-ing peak G's since it is not obvious howv best to fit the data with a smoothfunction. Excessive filtering, as shown in the bottom of Figure 52, may givean insight into the waveform of the underlying driving function, but it willalso tend to underestimate the peak G attained and impart a phase shift tothe time scale. The basic question is whether or not an occupant can respondto an acceleration profile as demonstrated in Figure 52 at the top or whetherthe individual spikes are of such short duration and contain so little energyas to be absorbed by the deformable body tissue, rib cage, and iitervertebraldiscs. If the latter is the case, then some signal averaging is in order.
Gragg analyzed anthropomorphic dummy and ejection seat data from two sledtest programs to determine the value of the dumny data for predicting theprobability of spinal arid/or disabling injury (Reference 125). He comparedGx, G and Dynamic Response Index (DRI) data. The DRi was computed fromG.. ragg concluded that the anthropomorphic dummy data should never beused if the seat bucket data are available. In some instances, it would bepossible to substitute dummy DRI data for seat DRI data, but Gx and Gydummy data should never be substituted for Gx and Gy seat data.
Laananen and Coltman measured the forces transmitted through the lumbar spineof anthropomorphic dummies to determine repeatability and biofidelity duringseat testing. Two Alderson anthropomorphic dummies, one a 50th-percentileand one a 95th-percentile and both having the pelvic structure and lumbar
104
Downloaded from http://www.everyspec.com

I ii
25.0 -
0
12.5 R
6.25
-6.25
4.5-
5. -1 5 H z
1.5I H 10.0-
R* RELATIVE TIME (MS)SL- -- I I . ..
0 125 250 375 500 625 750 875 1000
FIGURE 52. ACCELERATION DATA FILTERED AT 500 Hz AND 15 Hz.
region of the Part 572 configuration, were modified to accept a load cell aLthe base of the lumbar spine. The dummies were then subjected to +G7 accel-erations in rigid and energy-absorbing helicopter seats. Detailed data arepresented in Reference 126. The results of the program indicated that forcesand moments in the spine of a Part 572 or similarly designed anthropomorphicdummy could be measured with a rather simple modification. However, the modi-fications made to the dummies appeared to have altered the x direction dynamicresponse of the upper torso. The change in response was observed only in theenergy-absorbing seat test. where the peak chest acceleration reached 20 G andhigher and probably resulted from an altered natural frequency for torso bend-ing due to installation of the load cell and adapters. Any future design of astandardized transducer installation must consider the dynamic response char-acteristics of the torso.
The test data showed that the interaction between the Part 572 dummy and seatpan is very similar to the response measured with human cadavers, but there isnot a good correlation between dummy and cadaver body accelerations. Thus,
105
Downloaded from http://www.everyspec.com

seat performance criteria based on seat pan acceleration may not be as sensi-tive to occupant type as criteria based on body segment acceleration.
However, the authors also point out that the data might indicate that injurymechanism within the body, e.g., spinal deformation, cannot be reliably predic-ted from seat pan acceleration since internal body response can vary signifi-cantly for various occupant types with similar inputs from the seats.
8.7 IMPROVED MANIKIN NECK
Efforts are being made to upgrade the biofidelity of the neck of anthropomor-phic dummies. Wismans conducted a detailed analysis of a large number ofhuman volunteer tests conducted by the Naval Biodynamics Laboratory (NBDL).These human subjects were exposed to frontal, lateral, and oblique acceler-ations with a severity of up to 15 G and 17 m/sec. This analysis resulted ina simple analog system for each direction that completely specifies theobserved dynamic behavior. The most important finding was that the observedhuman head/ neck response can be represented adequately by a linkage systemwith two pivots. This simulation is discussed in some detail in Section5.9.2.4. The detailed analysis done by Wismans is found in Reference 38.
Richards and Van Ingen developed performance guidelines for an improved mani-kin neck based on investigation and analysis of human neck dynamic responses.The optimum biofidelic manikin neck system should be designed so that a directrelationship exists between the moment exerted on the head at the occipitalcondyles and the relative change in head/torso angle. This moment-anglerelationship consists of the head rotatinq forward due to inertial forces anda reacting moment at the occipital condyles that occurs in the oppositedirection and tends to rotate the head backward. Also, a high forward momentshould be exerted by the neck on the head when a critical head/neck angle isexceeded (head rotating backward with respect to the neck). The neck struc-ture should exhibit ordinary elastic properties, with the moment generated atthe base of the neck a direct relation of the change in neck/torso angle(moment backward as neck rotates forward). They found that the Hybrid IIIneck system is designed so that the moment applied to the head is a functionof head/neck angle, not head/torso angle. Therefore, it is not possible tofaithfully model the motion of the human head using such a design.
Work on the design of a more biofidelic neck was in progress at the time ofpublication.
106
Downloaded from http://www.everyspec.com

REFERENCES
1. Military Standard, MIL-STD-129OA(AV), LIGHT FIXED- AND ROTARY-WING AIR-CRAFT CRASH RESISTANCE, Department of Defense, Washington, DC, 20301, 26September 1988.
2. Gell, C. F., TABLE OF EQUIVALENTS FOR ACCELERATION TERMINOLOGY, Aero-space Medicine, Vol. 32, No. 12, December 1961, pp. 1109-1111.
3. Gupta, B. P., HELICOPTER OBSTACLE STRIKE TOLERANCE CONCEPTS ANALYSIS,Bell Helicopter Textron; Technical Report 78-46. Applied TechnologyLaboratory, U.S. Army Research and Technology Laboratories (AVRADCOM),Fort Eustis, VA, April 1979; AD A069877.
4. Haley, J., "Analysis of U.S. Army Helicopter Accidents to Define ImpactInjury Problems," Paper 9-1, Linear Acceleration of Impact Type Sym-posium, AGARD-CP-88-71.
5. Shanahan, D. F., and Shanahan, M. 0., INJURY IN U.S. ARMY HELICOPTERCRASHES, September 1979 through October 1985, Journal of Trauma,April 1989.
6. Department of the Army Regulation: Accident Reporting and Records,Washington, DC, Headquarters Department of the Army, 1980; AR 385-40.
7. Department of the Army Pamphlet, AIRCRAFT ACCIDENT TMISI1TTATTAN ANDREPORTING, Headquarters, Department of the Army, Washington D.C., 1983;DA PAM 385-95.
8. Shanahan, D. F., and Shanahan, M. 0., KINEMATICS OF U.S. ARMY HELICOPTERCRASHES, 1979-1985, Aviation, Space. and Environmental Medicine, Vol 60,Pages 12-21, February 1989.
9. Snyder, R. G., HUMAN IMPACT TOLERANCE, Paper 700398, International Auto-mobile Safety Compendium, Society of Automotive Engineers, New York,1970, pp. 712-782.
10. Rothe, V. E., et al., CREW SEAT DESIGN CRITERIA FOR ARMY AIRCRAFT,TRECOM Technical Report 63-4, U.S. Army Transportation Research Command,Fort Eustis, Virginia, February 1963.
11. Laananen, D. H., WHOLE-BODY HUMAN TOLERANCE TO IMPACT WITH LAP BELT-ONLYRESTRAINT, TI-83405, Simula Inc., Phoenix, Arizona, Department of Trans-portation, FAATC, July 28, 1983.
12. Military Specification, MIL-S-58095A(AV), SEAT SYSTEM: CRASH-RESISTANT,NON-EJECTION, AIRCREW, GENERAL SPECIFICATION FOR, Deparment of Defense,Washington, D.C., 31 January 1986.
13. Eiband, A. M., HUMAN TOLERANCE TO RAPIDLY APPLIED ACCELERATIONS: ASUMMARY OF THE LITERATURE, NASA Memorandum 5-19-59E, National Aero-nautics and Space Administration, Washington, D. C., June 1959.
107
Downloaded from http://www.everyspec.com

REFERENCES (CONTP.1
14. Snyder, R. G., HUMAN TOLERANCE 10 EXTREME IMPACTS IN FREE FALL, Aero-space Medicine, Vol. 34, No. 8, August 1963, pp. 695-709,
15. Stapp, J. P., JOLT EFFECTS OF IMPACT ON MAN, Brooks Air Force Base, SanAntonio, Texas, November 1961.
16. Beeding, E. L., Jr., and Mosely, J. D., HUMAN DECELERATION TESTS, AirForce Missile Development Center; AFMDC Technical Note 60-2, HollomanAir Force Base, New Mexico, January 1960, AD 23148.
17. Zaborowski, A. V., HUMAN TOLERANCE TO LATERAL IMPACT WIIH LAP BELT ONLY,Proceedings, Eighth Stapp Car Crash and Field Demonstration Conference,Society of Automotive Engineers, New York, 1964.
18. Zaborowski, A. V., LATERAL IMPACT STUDIES - LAP BELT SHOULDER HARNESSINVESTIGATIONS, Proceedings. Ninth Stapp Car Crash Conference, Societyof Automotive Engineers, New York, 1965.
19. Ewing, C. L., et al., DYNAMIC RESPONSE OF THE HUMAN HEAD AND NECK TO+G, IMPACT ACCELERATION, Proceedings, Twenty-first Staop Car CrashConference, Society of Automotive Engineers, New York, 1977, pp.547-586.
20. Hollister, N. R., et al., BIOPHYSICS OF CONCUSSION, Wright Air Develop-ment Center; WADC Technical Report 58-193, Wright-Patterson Air ForceBase, Ohio, 1958.
21. Ommaya, A. K., and Hirsch, A. E., TOLERANCES FOR CEREBRAL CONCUSSIONFROM HEAD IMPACT AND WHIPLASH IN PRIMATES, Journal of Biomechanics,Vol. 4, 1971, pp. 13-21.
22. Slobodnik, B. A., SPH-4 Helmet Damage and Head Injury Correlation,Aviation, Space, and Environmental Medicine, February 1979, pp 139-146.
23. Goldsmith, W., BIOMECHANICS OF HEAD INJURY, In Biomechanics-Its Foun-dation and Objetives, ed. by Fung, Y. C., Perrone, N., and Anliker, M.,Prentice-Hall, Inc., Englewood Cliffs, New Jersey, 1972, pp. 585-634.
24. Gurdjian, E. S., Roberts, V. L., and Thomas, L. M., TOLERANCE CURVES OFACCELERATION AND INTRACRANIAL PRESSURE AND PROTECTIVE INDEX IN EXPERI-MENTAL HEAD INJURY, Journal of Trauma, Vol. 6, 1966, pp. 600-604.
25. Holburn, A. H. S., MECHANICS OF BRAIN INJURIES, British Medical Bul-letin, Vol. 3(6) 1945, pp. 147-149.
25. Kornhauser, M., PREDICTION AND EVALUATION OF SENSITIVITY TO TRANSIENTACCELERATION, Journal of Applied Mechanics, Vol. 21, 1945, p. 371.
108
Downloaded from http://www.everyspec.com

REFERENCU (CONTO)
27. Ommaya, A. K., et al., SCALING OF EXPERIMENTAL DATA ON CEREBRAL CONCUS-SION IN SUB-HUMAN PRIMATES TO CONCUSSION THRESHOLD FOR MAN, Proceedings,Eleventh Stapp Car Crash Conference, Society of Automotive Engineers,New York, October 10-11, 1967.
28. Onimaya, A. K., et al., COMPARATIVE TOLERANCE FOR CEREBRAL CONCUSSION BYHEAD IMPACT AND WHIPLASH INJURY IN PRIMATES, 1970 International Auto-mobile Safety Conference ComDendiun, Society of Automotive Engineers,New York, 1970.
29. Patrick, L. M., Lissner, H. R., and Gurdjian, E. S., SURVIVAL BY DESIGN- HEAD PROTECTION, Proceedings, Seventh StdDp Car !rash Conference,Society of Automotive Engineers, New York, 1963.
30. Gadd, C. W., USE OF A WEIGHTED--IMPULSE CRITERION FOR ESTIMATING INJURYHAZARD, Proceedings. Tenth Stap Car Crash Conference, Society of Auto-motive Engineers, New York, 1966.
31. SAE Information Report, HUMAN TOLERANCE TO IMPACT CONDITIONS AS RELATEDTO MOTOR VEHICLE DESIGN--SAE J885a, SAE Handbook, Part 2, Society ofAutomotive Engineers, Warrendale, Pennsylvania, 1979, pp. 34.114 -34.117.
32. HUMAN TOLERANCE TO IMPACT CONDITIONS AS RELATED TO MOTOR VEHICLE DESIGN- SAEJ885 APR 80, SAEJ885, Society of Automotive Engineers, Inc.,Warrendale, Pennsylvania, April 1980.
33. FEDERAL MOTOR VEHICLE SAFETY STANDARD NO. 208, OCCUPANT CRASH PROTEC-TION, Code of Federal Regulations, Title 49, Part 571.208, U.S. Govern-ment Printing Office, Washington, D.C., 1987.
34. Nusholtz, G. S., et al., CRITICAL LIMITATIONS ON SIGNIFICANT FACTORS INHEAD INJURY RESEARCH, Thirtieth Stapp Car Crash Conference Proceedings,Society of Automotive Engineers, Inc., Warrendale, Pennsylvania, October1986.
35. Lockett, F. J., BIOMECHANICS OF HEAD TOLERANCE CRITERIA, N83-29990,National Physical Laboratory, Teddington, Middlesex, TWIl OLW, GreatBritain.
36. Smith, R. W., THE RESPONSE OF THE UNEMBALNED CADAVERIC AND LIVINGCEREBRAL VESSELS TO GRADED INJURY - A PILOT STUDY, University ofCalifornia, San Diego, SAE 791021, Society of Automotive Engineers,Inc,, Warrendale, Pennsylvania, 1979.
37. Rodden, B. E., et al., AN ALGORITHM FOR DETERMINING THE HEAD INJURYCRITERION (HIC) FROM RECORDS OF HEAD ACCELERATION, Defence and CivilInstitute of Environmental Medicine, SAE 830469, Society of AutomotiveEngineers, Inc., Warrendale, Pennsylvania, March 1983.
109
Downloaded from http://www.everyspec.com

REFERENCES (CONTD)
38. Slattenschek, A., and Tauffkirchen, W., CRITICAL EVALUATION OF ASSESS-MENT METHODS FOR HEAD IMPACT APPLIED IN APPRAISAL OF BRAIN INJURYHAZARD, IN PARTICULAR IN HEAD IMPACT ON WINDSHIELDS, Paper 700426, 1970International Automobile Safety Conference Compendium, Society of Auto-motive Engineers, New York, 1970, pp. 1084, 1112.
39. Brinn, J., and Staffeld, S. E., THE EFFECTIVE DISPLACEMENT INDEX - ANANALYSIS TECHNIQUE FOR CRASH IMPACTS OF ANTHROPONETRIC DUMMIES, Pro-ceedings, Fifteenth $tappCar Conference, Society of AutomotiveEngineers, New York, 1971, pp. 817-824.
40. Melvin, J. W., and Evans, F. G., A STRAIN ENERGY APPROACH TO THE MECHAN-ICS OF SKULL FRACTURE, Proceedings, Fifteenth Stapp Car Crash Confer-ence, Society of Automotive Engineers, New York, 1971, pp. 666-685.
41. Enouen, S. W., THE DEVELOPMENT OF EXPERIMENTAL HEAD IMPACT PROCEDURESFOR SIMULATING PEDESTRIAN HEAD INJURY, Thirtieth Stapp Car CrashConference Proceedings, Society of Automotive Engineers, Inc.,Warrendale, Pennsylvania, October 1986.
42. Hodgson, V. R., and Thomas, L. M., COMPARISON OF HEAD ACCELERATION IN-JURY INDICES IN CADAVER SKULL FRACTURE, Proceedings, Fifteenth StapCar Crash Conference, Society of Automotive Engineers, New York, 1971,pp. 190-206.
4j. Fan, W. R. S., INTERNAL HEAD iNJURY ASSESSMENT, Proceedings, FifteenthStapp Car Crash Conference, Society of Automotive Engineers, New York,1971, pp. 645-665.
44. Nyquist, G. W., FACIAL IMPACT TOLERANCE AND RESPONSE, Thirtieth StappCar Crash Conference Proceedings, Society of Automotive Engineers, Inc.,Warrendale, Pennsylvania, October 1986.
45. Swearingen, J. J., EVALUATION OF HEAD AND FACE INJURY POTENTIAL OF CUR-RENT AIRLINE SEATS DURING CRASH DECELERATIONS, AM 66-18, Office ofAviation Medicine, Federal Aviation Agency, Washington, D.C., June 1966.
46. Mertz, H. J., and Patrick, L. M., SIRENGTH AND RESPONSE OF THE HUMANNECK, Proceedings, Fitteenth Stapp Car Crash Conference, Society of Auto-motive Engineers, New York, 1971, pp. 207-255.
47. King, A. 1., TOLERANCE OF THE NECK TO DIRECT IMPACT, Wayne State Univer-sity) N00014-75-C-1015, Office of Naval Research, Department of theNavy, Arlington, Virginia, March 1979, AD A066797.
48. Gadd, C. W., Culver, C. C., and Nahum, A. M., A STUDY OF RESPONSES ANDTOLERANCES OF THE NECK, Proceedings, Fifteenth Stapp Car Crash Confer-ence, Society of Automotive Engineers, New York, 1971, pp. 256-268.
110
Downloaded from http://www.everyspec.com

REFERENCES (CONTD)
49. Hodgson, V. R., TOLERANCE OF THE HEAD AND NECK TO -Gx INERTIAL LOADINGOF THE HEAD, Wayne State University, N00014-75-C-1015, Office of NavalResearch, Department of the Navy, Arlington, Virginia, March 1981, ADA097632.
50. Muzzy, W. H. Il1, et al., THE EFFECT OF MASS DISTRIBUTION PARAMETERS ONHEAD/NECK DYNAMIC RESPONSE, Thirtieth Stapp Car Crash Conference Pro-ceedings, Society of Automotive Engineers, Inc., Warrendale, Pennsyl-vania, October 1986.
51. Seeman, M. R., et al., COMPARISON OF HUMAN AND HYBRID III HEAD AND NECKDYNAMIC RESPONSE, Thirtieth Stapp Car Crash Conference Proceedings,Society of Automotive Engineers, Inc., Warrendale, Pennsylvania, October1986.
52. Basio, A. C. and Bowman, B. M., SIMULATIONS OF HEAD-NECK DYNAMIC RE-SPONSE IN -Gx AND +Gy, Thirtieth Stapp Car Crash Conference Proceedings,Society of Automotive Engineers, Warrendale, Pennsylvania, October 1986.
53. Wismans, J., et al., OMNI-DIRECTIONAL HUMAN HEAD-NECK RESPONSE,Thirt;eth Stapp Car Crash Conference Proceedings, Society of AutomotiveEngineers, Inc., Warrendale, Pennsylvania, Octover 1986.
54. Guill, F. C., FACTORS INFLUENCING THE INCIDENCE AND SEVERITY OF "EJEC-TION ASSOCIATED" NECK I.. ..N rJUIRIES. SUTAI rLiU ED U S. '11AtiV , [JCTIIS -LULI JANUARY 1969 THROUGH 31 DECEMBER 1979 - A PRELIMINARY REPORT, Pro-ceedings of the Twenty-first Annual SAFE Symposium, SAFE Association,Van Nuys, California, November 1983.
55. Melvin, J. W., HUMAN NECK INJURY TOLERANCE, SAE 790135, in The HumpqNeck Anatomy, Injury Mechanisms and Biomechanics, Society of Autom AveEngineers, Inc., Warrendale, Pennsylvania, 1979.
56. Kroell, C. K., Schneider, D. C., and Nahum, A. M., IMPACT TOLERANCE ANDRESPONSE OF THE HUMAN THORAX II, Proceedings, Eighteenth Stapp Car Crash_oafqree, Society of Automotive Engineers, New York, 1974,
pp. 383-457.
57. THE ABBREVIATED INJURY SCALE (AIS), Joint Committee of the AmericanMedicai Association, American Association for Automotive Medicine, andthe Society of Automotive Engineers; American Association for AutomotiveMedicine, Morton Grove, Illinois, 1976 Revision.
58. Neathery, R. F., ANALYSIS OF CHEST IMPACT RESPONSE DATA AND SCALED PER-FORMANCE RECOMMENDATIONS, Proceedings, Eighteenth Stapp Car Crash Confer-ence, Society of Automotive Engineers, New York, 1974, pp. 459-493.
59. Mertz, H. J., and Gadd, C. W., THORACIC TOLERANCE TO WHOLEBODY DECELER-ATION, Proceedings, Fifteenth Stapp Car Crash Conference, Society ofAutomotive Engineers, New York, 1971, pp. 135-157.
111
Downloaded from http://www.everyspec.com

REFERENCES (CONTD)
60. Kroell, C. K., et al., INTERRELATIONSHIP OF VELOCITY AND CHEST COMPRES-SION IN BLUNT THORACIC IMPACT TO SWINE II, Thirtieth Stapp Car CrashConference Proceedings, Society of Automotive Engineers, Inc., Warren-dale, Pennsylvania, October 1986.
61. Lau, I. V., and Viano, D. C., THE VISCOUS CRITERION - BASES AND APPLI-CATIONS OF AN INJURY SEVERITY INDEX FOR SOFT TISSUES, Thirtieth StappCar Crash Conference Proceedings, Society of Automotive Engineers, Inc.,Warrendale, Pennsylvania, October 1986.
62. Morgan, R. M., et al., SIDE IMPACT - THE BIOFIDELITY OF NHTSA'S PROPOSEDATD AND EFFICACY OF TTI, Thirtieth Stapp Car Crash Conference Pro-ceedings, Society of Automotive Engineers, Inc., Warrendale, Pennsyl-vania, October 1986.
63. Huelke, D. F. and Melvin, J. W., ANATOMY, INJURY FREQUENCY, BIO-MECHANICS, AND HUMAN TOLERANCES, University of Michigan Medical School,SAE 800098, Society of Automotive Engineers, Inc., Warrendale,Pennsylvania, 1980.
64. Gogler, E., et al., BIOMECHANICAL EXPERIMENTS WITH ANIMALS ON ABDOMINALTOLERANCE LEVELS, Proceedings, Twenty-First Stapp Car Crash Conference,Society of Automotive Engineers, New York, 1977, pp. 713-751.
65. Nahum, A. M. and Melvin, J.. The Binnmphanics of Trauma, Appleton-Century-Crofts, Norwalk, Connecticut, 1985, pg. 175.
66. Cavanaugh, J. M., et al., LOWER ABDOMINAL TOLERANCE AND RESPONSE,Thirtieth Stapp Car Crash Conference Proceedings, Society of AutomotiveEngineers, Inc., Warrendale, Pennsylvania, October 1986.
67. Rouhana, S. W., et al., THE EFFECT OF LIMITING IMPACT FORCE ON ABDOMINALINJURY: A PRELIMINARY STUDY, Thirtieth Stapp Car Crash ConferenceProceedings, Society of Automotive Engineers, Inc., Warrendale, Pennsyl-vania, October 1986.
68. Von Gierke, H. E., and Brinkley, J. W., IMPACT ACCELERATIONS, In Foun-dation of Space BioloQy and Medicine, Volume II, Book One, Scientificand Technical Information Office, National Aeronautics and Space Admini-stration, Washington, D. C., 1975, pp. 214-246.
69. Stech, E. I., Payne, P. R., DYNAMIC MODELS OF THE HUMAN BODY,AMRL-TR-66-157, Aerospace Medical Research Laboratory, Wright-PattersonAir Force Base, Ohio, 1969.
70. Kazarian, L. E., STANDARDIZATION AND INTERPRETATION OF SPINAL INJURYCRITERIA, AMRL-TR-75-85, Aerospace Medical Research Laboratory, AirForce Systems Command, Wright-Patterson Air Force Base, Ohio, April1978, AD A054959.
112
Downloaded from http://www.everyspec.com
REFERENCES (CONTD)
71. Coltman, J. W., et al., CRASH-RESISTANT CREWSEAT LIMIT-LOAD OPTIMIZATIONTHROUGH DYNAMIC TESTING WITH CADAVERS, Simula Inc., USAAVSCOMTR-85-D-11, Aviation Applied Technology Directorate, U.S. Army AviationResearch and Technology Activity, Fort Eustis, Virginia, January 1986.
72. Hodgson, V. R. and Thomas, L. M., A MODEL TO STUDY CERVICAL SPINE INJURYMECHANISMS DUE TO HEAD IMPACT, Engineering Aspects of the Spine, I MechE Conference Publications 1980-2, Mechanical Engineering PublicationsLimited, London, May 1980, pp 89-91.
73. Soechting, J. F., RESPONSE OF THE HUMAN SPINAL COLUMN TO LATERAL DECELER-ATION, Journal of Applied Mechanics, Vol. 40, 1973, pp. 643-649.
74. Orne, D., and Liu, Y. K., A MATHEMATICAL MODEL OF SPINAL RESPONSE TOIMPACT, Journal of Biomechanics, Vol. 4, 1971, pp. 49-71.
75. Stech, E. L., and Payne, P. R., DYNAMIC MODELS OF THE HUMAN BODY, FrostEngineering Development Corp.; AMRL Technical Report 66-157, AerospaceMedical Research Lab, Wright-Patterson Air Force Base, Ohio, November1969, AD 701383.
76. Brinkley, J. W., and Shaffer, J. T., DYNAMIC SIMULATION TECHNIQUES FORTHE DESIGN OF ESCAPE SYSTEMS: CURRENT APPLICATIONS AND FUTURE AIR FORCEREQUIREMENTS, Aerospace Medical Research Lab; AMRL TechnicalReport 71-292, Wright-Patterson Air Force Base, Ohio, December 1971,AD 740439.
77. Military Specification, MIL-S-9479, SEAT SYSTEM, UPWARD EJECTION, AIR-CRAFT, GENERAL SPECIFICATION FOR, Department of Defense, Washington,D. C., March 1971.
78. King, A. I., and Prasad, P., AN EXPERIMENTALLY VALIDATED MODEL OF THESPINE, Journal of Applied Mechanics, Vol. 41, No. 3, September 1974,pp. 546-550.
79. Hakim, N. S., and King, A. I., STATIC AND DYNAMIC ARTICULAR FACET LOADS,Proceedings, Twentieth Stapp Car Crash Conference, Society of AutomotiveEngineers, New York, 1976, pp. 607-639.
80. Belytschko, T., Schwer, L., and Schultz, A., A MODEL FOR ANALYTICALINVESTIGATION OF THREE-DIMENSIONAL HEAD-SPINE DYNAMICS - FINAL REPORT,University of Illinois at Chicago Circle; AMRL Technical Report 76-10,Aerospace Medical Research Laboratory, Wright-Patterson Air Force Base,Ohio, April 1976, AD A025911.
81. MODELS AND ANALOGUES FOR THE EVALUATION OF HUMAN BIODYNAMIC RESPONSE,PERFORMANCE, AND PROTECTION, AGARD Conference Proceedings No. 253, NATOAdvisory Group for Aerospace Research and Development, Neuilly surSeine, France, 1968.
113
Downloaded from http://www.everyspec.com

REFERENCES (CONTO)
82. Kazarian, L., and Graves, G. A., COMPRESSIVE STRENGTH CHARACTERISTICS OFTHE HUMAN VERTEBRAL CENTRUM, AMRL Technical Report 77-14, Aerospace Medi-cal Research Laboratory, Wright-Patterson Air Force Base, Ohio, 1977.
83. Hodgson, V. R., and Thomas, L. M., HEAD IMPACT RESPONSE -PROPOSAL NUMBERVRI 7.2, Society of Automotive Engineers, Inc., New York, 1975.
84. Patrick, L. M., Kroell, C. K., and Mertz, H. G., FORCES ON THE HUMANBODY IN SIMULATED CRASHES, Proceedings, Ninth Stapp Car Crash Confer-ence, Society of Automotive Engineers, New York, 1965, pp. 237-259.
85. King, J. J., Fan, W. R. S., and Vargovick, R. J., FEMUR LOAD INJURYCRITERIA - A REALISTIC APPROACH, Proceedings, Seventeenth StagW CarCrash Conference, Society of Automotive Engineers, New York, 1973,pp. 509-524.
86. Powell, W. R., et al., INVESTIGATION OF FEMUR RESPONSE TO LONGITUDINALIMPACT, Proceedings, Eighteenth Stapp Car Crash Conference, Society ofAutomotive Engineers, New York, 1974, pp. 539-556.
87. Viano, C. C., CONSIDERATIONS FOR A FEMUR INJURY CRITERION, Proceedings,Twenty-First Stapp Car Crash Conference, Society of Automotive Engi-neers, New York, 1977, pp. 445-473.
88. StdLes, M. M . , eb al., rFILELD nA r'r'L IC AI UL'VLLOA ,,,D LE IV' OF TJr, ,I INL . . .RI l oATED INJURY SCALE, Proceedings, Fifteenth Stapp Car Crash Conference,Society of Automotive Engineers, New York, 1971, pp. 710-738.
89. THE ABBREVIATED INJURY SCALE, 1985 REVISION, American Association forAutomotive Medicine, Des Plaines, Illinois, 1985.
90. Singley, G. T., III, TEST AND EVALUATION OF IMPROVED AIRCREW RESTRAINTSYSTEMS, USAAVRADCOM-TR-81-D-27, Applied Technology Laboratory, U.S.Army Research and Technology Laboratories, Fort Eustis, Virginia,September 1981, AD A107576.
91. Domzalski, L., INFLATABLE BODY AND HEAD RESTRAINT SYSTEM (IBAHRS): DYNA-MIC Gx CRASH SIMULATION TEST PROGRAM, Naval Air Development Center,NADC-84140-60, Naval Air Systems Command, Washington, D.C., June 1984.
92. Roe, R. W., and Kyropoulos, P., THE APPLICATION OF ANTHROPOMETRY TOAUTOMOTIVE DESIGN, Paper 700553, Society of Automotive Engineers, NewYork, 1970.
93. Churchill, E., et al., ANTHROPOME1RY OF U.S. ARMY AVIATORS - 1970,Anthropology Research Project, Yellow Springs, Ohio; Technical Re-port 72-52-CE, U.S. Army Natick Laboratories, Natick, Massachusetts,December 1971, AD 743528.
114
Downloaded from http://www.everyspec.com

REFERENCES (CONT)-
94. THE BODY SIZE OF SOLDIERS - U.S. ARMY ANTHROPOMETRY-1966, USANL Tech-nical Report 72-51-CE, U.S. Army Natick Laboratories, Natick, Massachu-setts December 1971, AD743465.
95. Churchill, E., et al., ANTHROPOMETRY OF WOMAN OF THE U.S. ARMY - 1977,Webb Associates, Inc., Yellow Springs, Ohio, Tech. Rep. 77/024, U.S.Army Natick Research and Development Command, Natick, Massachusetts,June 1977.
96. Dempster, W. T., SPACE REQUIREMENTS FOR THE SEATED OPERATOR, Wright AirDevelopment Center; WADC Technical Report 55-159, Wright-Patterson AirForce Base, Ohio, 1955, AD 087892,
97. Dempster, W. T., and Gaughran, G. R. L., PROPERTIES OF BODY SEGMENTSBASED ON SIZE AND WEIGHT, American Journal of Anatomy, Vol. 120, 1967,pp. 33-54.
98. Glanville, A. D., and Kreezer, G., THE MAXIMUM AMPLITUDE AND VELOCITY OFJOINT MOVEMENTS IN NORMAL MALE HUMAN ADULTS, Human Biologi, Vol. 9,1937, pp. 197-211,
99. Santischi, W. R., DuBois, J., and Omoto, C., MOMENTS OF INERTIA ANDCENTERS OF GRAVITY OF THE LIVING HUMAN BODY, AMRL Technical Data Report63-36, Aerospace Medical Research Lab, Wright-Patterson Air Force Base,Ohio, 1963.
100. Clauser, C. E., McConville, J. T., and Young, J. W., WEIGHT, VOLUME, ANDCENTER OF MASS OF SEGMENTS OF THE HUMAN BODY, Antioch College; AMRL Tech-nical Report 69-70, Aerospace Medical Research Lab, Wright- PattersonAir Force Base, Ohio, August 1969, AD 710622.
101. Chandler, R. F., et al., INVESTIGATION OF INERTIAL PROPERTIES OF THEHUMAN BODY, Report No. DOT-HS-801-430, U.S. Department of Transpor-tation, Washington, D.C., March 1975.
102. Laananen, D. H., et al., COMPUTER SIMULATION OF AN AIRCRAFT SEAT ANDOCCUPANT IN A CRASH ENVIRONMENT, VOLUME I - TECHNICAL REPORT, TR-82401,Simula Inc., Tempe, Arizona, DOT/FAA/CT-82/33-I, March 1983.
103. ANTHROPOMETRY AND MASS DISTRIBUTION HUMAN ANALOGUES, VOLUME I: MILITARYMALE AVIATORS, Aerospace Division, Air Force Systems Command, Wright-Patterson Air Force Base, Dayton, Ohio, June 1987.
104. LeFevre, R. L., and Silver, J. N., DUMMIES - THEIR FEATURES AND USE,Proceedings, Automotive Safety Engineering Seminar, Society of Auto-motive Engineers, New York, June 20-21, 1973.
105. Swearingen, J. J., DESIGN AND CONSTRUCTION OF A CRASH TEST DUMMY FORTESTING SHOULDER HARNESS AND SAFETY BELTS, Civil Aeronautics Admini-stration, Civil Aeronautics Medical Research Laboratory (now FAA CivilAeromedical Institute), Oklahoma City, Oklahoma, April 1951.
115
Downloaded from http://www.everyspec.com

REFERENCES (CONTO)
106. SAE Recommended Practice, ANTHROPOMORPHIC TEST DEVICE FOR USE IN DYNAMICTESTING OF MOTOR VEHICLES, SAE J963, SAE Handbook, Society of AutomotiveEngineers, Warrendale, Pennsylvania, 1978, pp. 34.107 - 34.110.
107. Code of Federal Regulations, ANTHROPOMORPHIC TEST DUMMY, Title 49,Chapter 5, Part 572, Federal Register, Vol. 38, No. 62, April 2, 1973,pp. 8455-8458.
108. Massing, D. E., Naab, K. N., and Yates, P. E., PERFORMANCE EVALUATION OFNEW GENERATION OF 50TH-PERCENTILE ANTHROPOMORPHIC TEST DEVICES:VOLUME I - TECHNICAL REPORT, Calspan Corporation; DOT-HS TechnicalReport 801-431, Department of Transportation, National Highway TrafficSafety Administration, Washington, D. C., March 1975, PB 240-920.
109. Foster, J. K., Kortge, J. 0., and Wallanin, M. J., HYBRID III-A BIO-MECHANICALLY-BASED CRASH TEST DUMMY, Proceedings, Twenty-First Stapp CarCrash Conference, Society of Automotive Engineers, New York, 1977,pp. 973-1014.
110. Part 572 - ANTHROPOMORPHIC TEST DUMMIES, SUBPART E - HYBRID III TESTDUMMY, Code of Federal Regulations, Title 49, Part 572, U.S. GovernmentPrinting Office, Washington, D.C., 1987.
111. Kaleps, I., and Whitestone, J., HYBRID III GEOMETRICAL AND INERTIALnnflrnOrfl r, r i nn[S, e t~fly ̂ , U ,O- -. eA 4 ** "-rrLI LO SAE raper U I L I MU 1,m1 LI I,R • Ln rap• Qvanu~, EI ee9sI8cWarrendale, Pennsylvania, 1988o
112. FEDERAL MOTOR VEHICLE SAFETY STANDARDS; SIDE IMPACT PROTECTION,Docket 88-09,; Notice 1, Federal Register, Volume 53, No. 17, January27, 1988, pp. 2239-2260.
113. Stalnaker, R. L., et a!., MODIFICATION OF PART 572 DUMMY FOR LATERALIMPACT ACCORDING TO BIOMECHANICAL DATA, SAE Paper 791031, Society ofAutomotive Engineers, Inc., Warrendale, Pennsylvania, 1979.
114. Neilson, L., et al., THE EUROSID SIDE IMPACT DUMMY, Tenth InternationalTechnical Conference on Experimental Safety Vehicles, National HighwayTraffic Safety Administration, Washington, D.C., July 1985,pp. 153 - 164.
115. Walsh, M. M., and Romeo, D. M., RESULTS OF CADAVER AND ANTHROPOMORPHICDUMMY TESTS iN IDENTICAL CRASH SITUATIONS, Proceedings..Twentieth StappCar Crash Conference, Society of Automotive Engineers, Warrendale,Pennsylvania, 1976, pp. 108-131.
116. Chandler, R. F., and Christian, R. A., COMPARATIVE EVALUATION OF DUMMYPERFORMANCE UNDER -G< IMPACT, Proceedings. Thirteenth Stapp Car CrashConference, Society of Automotive Engineers, New York, 1969,pp. 61 - 75.
116
Downloaded from http://www.everyspec.com

REFERENCES (CONTU
117. Saul, R. A., FRONTAL CRASH RESPONSES: PART 572 VERSUS HYBRID III DUMMYRESPONSE EVALUATION, DOT HS 807 048, National Highway Traffic SafetyAdministration, Washington, D.C., July 1986, PB 87-15110 6.
118. Backaitis,-S. H., and St. Laurent, A., CHEST DEFLECTION CHARACTERISTICSOF VOLUNTEERS AND HYBRID III DUMMIES, Thirtieth Stapp Car Crash Confer-ence Proceedings, Society of Automotive Engineers, Inc., Warrendale,Pennsylvania, October 1986.
119. Leung, Y.C., et al., AN ANTI-SUBMARINING SCALE DETERMINED FROM THEORETI-CAL AND EXPERIMENTAL STUDIES USING THREE-DIMENSIONAL GEOMETRICAL DEFINI-TION OF THE LAP-BELT, SAE Paper 811020, Society of Automotive Engineers,Inc., Warrendale, Pennsylvania, 1981.
120. Tieber, J. A., THE STATE OF THE ART OF ANTHROPOMORPHIC MANIKINS ANDREQUIREMENTS FOR THE EVALUATION OF ADVANCED AIRCRAFT EJECTION SYSTEMS,Proceedings of the Twenty-second Annual SAFE Symposium, SAFE Asso-ciation, Van Nuys, California, December 1984.
121. White, R. P., Jr., ADAM: THE NEXT STEP IN DEVELOPMENT OF THE TRUE HUMANANALOG, Procedings of the Twenty-fourth Annual Symposium SAFE Associa-tion, SAFE Association, Van Nuys, California, December 1986.
122. White, R. P., Jr., ADAM: THE PHYSICAL BEING, Proceedings of the Twenty-fifth Annual SAFE symposium, SAFE Association, Van Nuys, California,November 1987.
123. Frisch, G. D., and Frisch, P. H., THE DEVELOPMENT OF A DYNAMIC RESPONSESENSING AND RECORDING SYSTEM FOR INCORPORATION INTO A SlATE-OF-THE-ART-MANIKIN, Proceedings of the Twenty-first Annual SAFE Symposium, SAFEAssociation, Van Nuys, California, November 1983.
124. Frisch, G. D., et al., STRUCTURAL INTEGRITY TESTS OF A MODIFIED HYBRIDIII MANIKIN AND SUPPORTING INSTRUMENTATION SYSTEM, Proceedings of theTwenty-second Annual SAFE Symposium, SAFE Association, Van Nuys,California, December 1984.
125. Gragg, C. D., COULD ANTHROPOMETRIC DUMMY DATA BE USED TO PRLDICT INJURYTO HUAANS?, Proceedings of the Twenty-second Annual SAFE Symposium, SAFEAssociation, Van Nuys, California, December 1984,
126. Laananen, D. H., and Coltman, J. W., MEASUREMENT OF SPINAL LOADS IN TWOMODIFIED ANTHROPOMORPHIC DUMMIES, Simula Inc., TR-82405, U.S. ArmyAeromedical Research Laboratory, Fort Rucker, Alabama, May 1982.
117
Downloaded from http://www.everyspec.com

BIBLIOGRAPHY
Daniel, R. P., A BIO-ENGINEERING APPROACH TO CRASH PADDING, Paper 680001,Society of Automotive Engineers, New York, 1968.
DeHaven, H., MEAN DECELERATIONS SUSTAINED BY NINE (9) SURVIVORS OF FREEFALL --- 55 TO 185 FEET, Human Factors Design Sheet, Aviation Crash InjuryResearch, Phoenix,rizona, 1958.
Ewing, C. L., and Thomas, D. J., HUMAN HEAD AND NECK RESPONSE TO IMPACTACCELERATION, Joint Report issued by Naval Aerospace Medical ResearchLaboratory (NAMRL Monograph 21) and U.S. Army Aeromedical Research Laboratory(USAARL 73-1), August, 1972.
Ewing, C. L., and Unterharnscheidt, F., NEUROPATHOLOGY AND CAUSE OF DEATH INU.S. NAVAL AIRCRAFT ACCIDENTS, Recent Experience/Advances in AviationPathology, Conference Proceedings No. 190, North Atlantic Treaty OrganizationAdvisory Group for Aerospace Research and Development, Neuilly sur Seine,France, June 1977, AD AO 40356.
Gadd, C. W., TOLERABLE SEVERITY INDEX IN WHOLE-HEAD, NONMECHANICAL IMPACT,Proceedi-5s._Fifteenth Stapp Car Crash Conference, Society of AutomotiveEngineev:, New York, 1971.
Glanceiy, J. J., and DesJardins, S. P., A SURVEY OF NAVAL AIRCRAFT CRASHENVIRONMENTS WITH EMPHASIS ON STRUCTURAL RESPONSE, Dynamic Science; Depart-ment of the Navy, Office of Naval Re search, Arlington, Virginia, December1971, AD 739 37,
GrifFin, L. I., III, ANALYSIS OF THE BENEFITS DERIVED FROM CERTAIN PRESENTLYEXISTING MOTOR VEHICLE SAFETY DEVICES: A REVIEW OF THE LITERATURE, Univer-sity of Nor+L Carolina; MVMAHSRC Technical Report 7303, Motor Vehicle Manu-facturers A )ciation of the United States, Inc., Detroit, Michigan, Decem-ber 1973.
Haley, J. L., Jr., et al., HELMET DESIGN CRITERIA FOR IMPROVED CRASH SURVI-VAL, Aviation Safety Engineering and Research, A Division of Flight SafetyFoundations; USAAVLABS Technical Report 65-44, U.S. Army Aviation MaterielLaboratories, F -t Eustis, Virginia, January 1966, AD 628 678.
Headley, R. N cýt al., HUMAN FACTORS RESPONSES DURING GROUND IMPACT, WrightAir Development Center; WADC Technical Report 60-590, Wright-Patterson AirForce Base, Ohio, November 1959.
Horsch, J. D., and Patrick, L. M., CADAVER AND DUMMY KNEE IMPACT RESPONSE,Paper 760799, Automobile Engineering Meeting, at earborn. Michiqan, Societyof Automotive Engineers, Warrendale, Pennsylvania, October, 1976.
King, A. I., HUMAN TOLERANCE LIMITATIONS RELATED TO AIRCRAFT CRASHWORTHINESS,Wayne State University, Detroit, Michigan.
118
Downloaded from http://www.everyspec.com

BIBLIOGRAPHY (CONTD)
Kornhauser, M., THEORETICAL PREDICTION OF THE EFFECT OF RATE-TO-ONSET ONMAN'S G-TOLERANCE, Aerospace Medicine, Vol. 32, No. 5, May 1961, pp. 412-421.
Kroell, C. K., Schneider, D. C., and Nahum, A. M., IMPACT TOLERANCE AND R-ESPONSE OF THE HUMAN THORAX, Paper 710851, Proceedings, Fifteenth Stapp CarCrash Conference, Society of Automotive Engineers, New York, 1971.
McElhaney, J. H., et al., ANALYSIS OF DAISY TRACK HUMAN TOLERANCE TESTS, Uni-versity of Michigan; U.S. Department of Transportation, National HighwayTraffic Safety Administration, Washington, D. C., February 1971.
Nahum, A. M., et al., LOWER EXTREMITY INJURIES OF FRONT SEAT OCCUPANTS, Paper680483, Mid-Year Meeting at Detroit. Michigan, Society of AutomotiveEngineers, New York, 1968.
Nyquist, G. W., STATIC FORCE-PENETRATION RESPONSE OF THE HUMAN KNEE, Paper741189, Proceedings, Eighteenth Stapp Car Crash Conference, Society ofAutomotive Engineers, New York, 1974.
Patrick, L. M., and Levine, R. S., INJURY ASSESSMENT OF BELTED CADAVERS,Wayne State University; DOT Technical Report HS-801-59831, U.S. Department ofTransportation, National Highway Traffic Administration, Washington, D. C.,May 1975.
Reynolds, H. M., et al., MASS DISTRIBUTION PROPERTIES OF THE MALE CADAVER,Paper 750424, presented at Automotive Engineering Congress, Society ofAutomotive Engineers, New York, February 1975.
Roebuck, J. A., Jr., Kroemer, K. H. E., and Thomson, W. D., ENGINEERINGANTHROPOMETRY METHCDS, New York, John Wiley & Sons, 1975.
Ruff, S., BRIEF ACCELERATIONS: LESS THAN ONE SECOND, Vol 1, Part VI-C ofGerman Aviation Medicine -_World War IT, Department of the Air Force,Washington, D. C., 1950, pp. 384-599.
Sarrailhe, S. R., and Wood, C. F., HEAD IMPACT PROTECTION ON AN AIRLINE SEAT,Department of Supply, Austrailian Defence Scientific Service, AeronauticalResearch Laboratories, Structure and Materials, Note 319, June 1967.
Snyder, R. G., et al., SEAT BELT INJURIES IN IMPACT, Office of AviationMedicine, Department of Transportation, Federal Aviation Administr3tion,Washington, D. C., March 1969, AD 698289.
Stapp, J. P., HUMAN EXPOSURES TO LINEAR DECELERATION, PART II-THE FORWARD-FACING POSITION AND DEVELOPMENT OF A CRASH HARNESS, Wright Air DevelopmentCenter; AF Technical Report No. 5915, Part 2, Wright-Patterson Air ForceBase, Dayton, Ohio, December 1951.
119
Downloaded from http://www.everyspec.com

BIBLIOGRAPHY (CONTD)
Stapp, J. P., HUMAN TOLERANCE TO DECELERATION, American Journal of AviationMedicine, Vol. 26, No. 4, August 1955, pp. 268-288.
Stapp, J. P., HUMAN TOLERANCE TO DECELERATION, American Journal of Surgery,Vol. 93, April 1957.
States, J. D., CAN SEVERITY INDEX CURVES BE DEVELOPED FOR OTHER ORGAN SYSTEMSAND TISSUES? Proceedings, Fifteenth Stapp Car Crash Conference, Society ofAutomotive Engineers, New York, 1971, pp. 825-827.
Versace, J., A REVIEW OF THE SEVERITY INDEX, Paper 710881, Proceedings, Fif-teenth StaprCar Crash Conference, Society of Automotive Engineers New York,1971, pp. 771-796.
White, R. M., and Churchill, E., THE BODY SIZE OF SOLDIERS: U.S. ARMY ANTHRO-POMETRY - 1966, Technical Report 72-51-CE, U.S. Army Natick Laboratories,Natick, Massachusetts, 1971, AD 743465.
White, R. M., UNITED STATES ARMY ANTHROPOMETRY: 1946-1977, Natick TechnicalReport 79/007, U.S. Army Natick Research and Development Command, Natick,Massachusetts, 1978.
Yost, C. A., and Oates, R. W., HUMAN SURVIVAL IN AIRCRAFT EMERGENCIES, Sten-cel Aero Engineering Corporation; NASA CR Technical Report 1262, NationalAerornautics and Space Administration, Washington, D. C., 1968.
120 *U.S. GOVERNMENT PIJNUNG OMCE: IM - 727-M/W0619
Downloaded from http://www.everyspec.com