t i I Commodity Market Monthly Beverage Indices fell more modestly, by 2.8 and 1.9 percent...
23
1 April 18, 2017 1 www.imf.org/commodities [email protected] Commodity prices fell by 3.8 percent in March 2017. (Figure 1.) This decrease in the IMF’s commodity price index was largely driven by the 5.6 percent fall in the fuel index. The Food and Beverage Indices fell more modestly, by 2.8 and 1.9 percent respectively. The metal price index fell by 1.0 percent. Figure 1 Energy Monthly average crude oil prices decreased 6.3 percent in March to $50.91/bbl. During the month of March (from the end of February to the end of March), Average Petroleum Spot Price (simple average of U.K. Brent, Dubai Fateh, and West Texas Intermediate; APSP) decreased 5.7 percent. It has since rebounded to around $54 as of mid- April. 1 Fan charts are based on the closing price of April 12, 2017. Figure 2 Oil prices declined sharply in the middle of March as the U.S. inventories accumulated more than expected. A few outages, the possible extension of OPEC production cut, and geopolitical tensions helped prices to rebound. OPEC production in March declined partly because of Libya and Nigeria, both exempted from the quota, and partly because Saudi Arabia cut more than they had agreed. Nigeria’s decline is due to scheduled maintenance but Libya lost production due to intensification of fighting. In March, OPEC’s overall compliance rate exceeded 100 percent. That non-OPEC countries agreed to cut production with OPEC helps to explain this 20 25 30 35 40 45 50 55 60 65 70 Jan-15 Jul-15 Feb-16 Aug-16 Mar-17 Crude Oil Daily Prices ($/barrel) Brent Dubai WTI Commodity Market Monthly Research Department, Commodities Unit
Transcript of t i I Commodity Market Monthly Beverage Indices fell more modestly, by 2.8 and 1.9 percent...

1
April 18, 20171 www.imf.org/commodities [email protected]
Commodity prices fell by 3.8 percent in March
2017. (Figure 1.) This decrease in the IMF’s
commodity price index was largely driven by
the 5.6 percent fall in the fuel index. The Food
and Beverage Indices fell more modestly, by
2.8 and 1.9 percent respectively. The metal
price index fell by 1.0 percent.
Figure 1
Energy
Monthly average crude oil prices decreased 6.3
percent in March to $50.91/bbl. During the month
of March (from the end of February to the end of
March), Average Petroleum Spot Price (simple
average of U.K. Brent, Dubai Fateh, and West
Texas Intermediate; APSP) decreased 5.7 percent.
It has since rebounded to around $54 as of mid-
April.
1 Fan charts are based on the closing price of April 12, 2017.
Figure 2
Oil prices declined sharply in the middle of March
as the U.S. inventories accumulated more than
expected. A few outages, the possible extension
of OPEC production cut, and geopolitical tensions
helped prices to rebound.
OPEC production in March declined partly
because of Libya and Nigeria, both exempted
from the quota, and partly because Saudi Arabia
cut more than they had agreed. Nigeria’s decline
is due to scheduled maintenance but Libya lost
production due to intensification of fighting. In
March, OPEC’s overall compliance rate exceeded
100 percent. That non-OPEC countries agreed to
cut production with OPEC helps to explain this
20
25
30
35
40
45
50
55
60
65
70
Jan-15 Jul-15 Feb-16 Aug-16 Mar-17
Crude Oil Daily Prices($/barrel)
Brent Dubai WTI
Commodity Market Monthly
Research Department, Commodities Unit

2
high compliance rate. Canada’s production
declined sharply due to fire at an oil sands plant.
The U.S. rig count increased so strongly that
completion activity may not be able to keep up
(Figure 3). This implies an increase of DUCs
(drilled but uncompleted wells). IEA revised its
production estimate upwards to 13 mbd in 2017.
Figure 3
Oil prices and rig counts in the U.S.
On the demand side, the International Energy
Agency (IEA) has revised its global oil demand
growth downwards to 1.3 mbd for 2017 as actual
OECD demand was weak in the first quarter. Non-
OECD demand was mixed as China’s demand
grew strongly while India’s slowed.
OECD inventories decreased in February,
following the buildup in January. This is partly
because OPEC increased production and
exported before January and floating inventories
showed up at that time. Global inventories in the
first quarter are expected to represent a minor
buildup since weak demand in OECD will likely
offset the OPEC production cut and a few
outages.
Futures contracts point to oil prices (APSP)
increasing gradually to $54.41 in 2017 (compared
to the current IMF baseline of $55.23) and $55.13
in 2018 (compared to current IMF baseline of
$55.06). Future curves are almost flat for the next
5 years. (Figure 4.)
Figure 4
Average monthly natural gas prices in the U.S.
increased by 1.9 percent to an average of
$2.87/MMBtu in March from an average of
$2.82/MMBtu in February. Daily prices increased
23.3 percent to $3.10 at the end of March from
$2.52 at the end of February, due to unseasonably
cold weather. In Europe, long-term contract
prices (Russian Natural Gas border price in
Germany) have decreased 1.2 percent to
$5.81/MMBtu. Spot NCG prices (converted to
USD) have also declined by 7.9 percent in March.
LNG spot prices in Asia have decreased in March,
as the season of high demand is over.
Coal prices in Australia have increased by 0.3
percent in March due to a cyclone in Australia.
The U.S. shows signs of revoking the Clean Power
Plan but the impact on coal prices is probably
limited as uncertainty regarding the future energy
policy under the next administration would
discourage the investment in coal power plants.
0
200
400
600
800
1000
1200
1400
1600
1800
0
20
40
60
80
100
120
11 12 13 14 15 16 17
USD/bbl
WTI
Oil Rig Count (RHS)
35
40
45
50
55
60
65
70
75
2 14 26 38 50 62
Months to expiration
Brent WTI
Day's Oil Future Curves($/barrel)

3
Metals
Base Metals
The IMF metal price index, comprising of 8 base
metals (Table 1), fell a modest 1.0 percent in
March 2017, month-on-month. After continuing
to rise at the beginning of 2017, most metal
prices declined: copper (-1.9%), nickel (-4.2%),
zinc (-2.3%), lead (-1.3%), iron ore (-1.3%), and
uranium (-1.4%). Aluminum and tin were the two
exceptions, increasing by 2.1 and 2.0 percent,
respectively.
The price of iron ore fell 1.3 percent, month-on-
month, increased 1.3 percent year-to-date, and
stands at $81/MT, its lowest point since February
6, 2017. The recent fall in prices can be attributed
to Beijing raising interest rates for housing loans
(for the third time in three months) to rein in the
home loan growth and cool overheating property
markets, adding concern that Chinese steel
demand will fall this year (by an estimated 2%),
putting further downward pressure on iron ore
prices. This downward trend is expected to
continue as inventories at 50 Chinese ports have
reached their highest point in more than a decade
(134 million MT in late March). Some ports appear
to be running low on storage capacity. Prices are
projected to fall through 2018.
Copper prices fell 1.9 percent, month-on-month,
and by 2.5 percent from the end of February to
the end of March, to reach $5,816/MT. The recent
downturn in prices can be attributed to the end
of the strikes at Escondida, Chile and Cerro Verde,
Peru. The Escondida strike is estimated to have
cost parent company BHP Billiton more than
200,000MT in copper production or 20% of its
2016 output. Conversely, workers at Southern
Copper’s Cuajone and Toquepala mines in Peru
started an indefinite strike on Monday, April 10.
These two mines produced about 310,000 MT of
copper in 2016, compared to 502,600 MT
produced by Cerro Verde. Grasberg will resume
copper exports after Indonesia issued parent
company Freeport a temporary mining license,
valid for eight months. Future markets indicate
roughly constant prices.
The price of nickel dropped 4.2 percent, month-
on-month, and stands at $9,963/MT returning to
where it began the year. Eight miners in the
Philippines, which had previously been ordered to
suspend operations for environmental reasons,
have recently been granted permission to export
nickel ore. These shipments are estimated to be
between 1 and 5 million MT. LME nickel stocks
have been increasing, by about 10,000 MT year-
to-date. Prices are projected to remain constant.
Aluminum prices increased 2.1 percent, month-
on-month, and 14.6 percent year-to-date. Prices
hit $1,962 on March 30, a 22-month high amid
tightening supplies. LME aluminum stocks fell to
1.73 million MT, their lowest since December
2008. Fueling the acceleration in aluminum’s price
is China’s crackdown on its polluting smelters.
Since January, when China’s pollution problems
worsened, the government announced that it
Table 1
Current Base Metal Prices and % changes
(as of March 31, 2017)
Metal Price ($) % change
Month-
on-Month
Year-to-
Date
Copper 5,816/MT -1.9 5.3
Aluminum 1,952/MT 2.1 14.6
Tin 20,230/MT 2.0 -4.6
Nickel 9,963/MT -4.2 0.0
Zinc 2,750/MT -2.3 7.5
Lead 2,331/MT -1.3 16.6
Iron Ore 81.0/MT -1.3 1.3
Uranium 23.25/lb -1.4 14.0
Sources: London Metal Exchange (Copper,
aluminum, tin, nickel, zinc, and lead); DataStream
CIF China United States (FE63.5%, iron ore); and
New York Mercantile Exchange (uranium).
4
would enforce a shutdown of about a third of its
aluminum capacity between mid-November and
mid-March, threatening 1.3 million MT of
aluminum production. In addition, rising coking
coal prices have increased the cost of aluminum
production in China.
Precious Metals
Precious metals have seen their prices fall in
March, month-on-month. Platinum prices fell 4.4
percent, silver fell 1.8 percent, and gold was more
stable, falling 0.4 percent. Palladium’s average
price was unchanged between February and
March, but increased 2.8 percent from the end of
February to the end of March. Year-to-date price
changes for all precious metals are positive.
The US Federal Reserve raised the short-term
interest rate from 0.75 percent to 1 percent on
March 15. Following the announcement, the price
of gold rallied, increasing 3.8 percent between
March 15 and 31 as the Fed indicated a dovish
tone. In April, geopolitical tensions (Syria and
North Korea) put upward pressure on precious
metals.
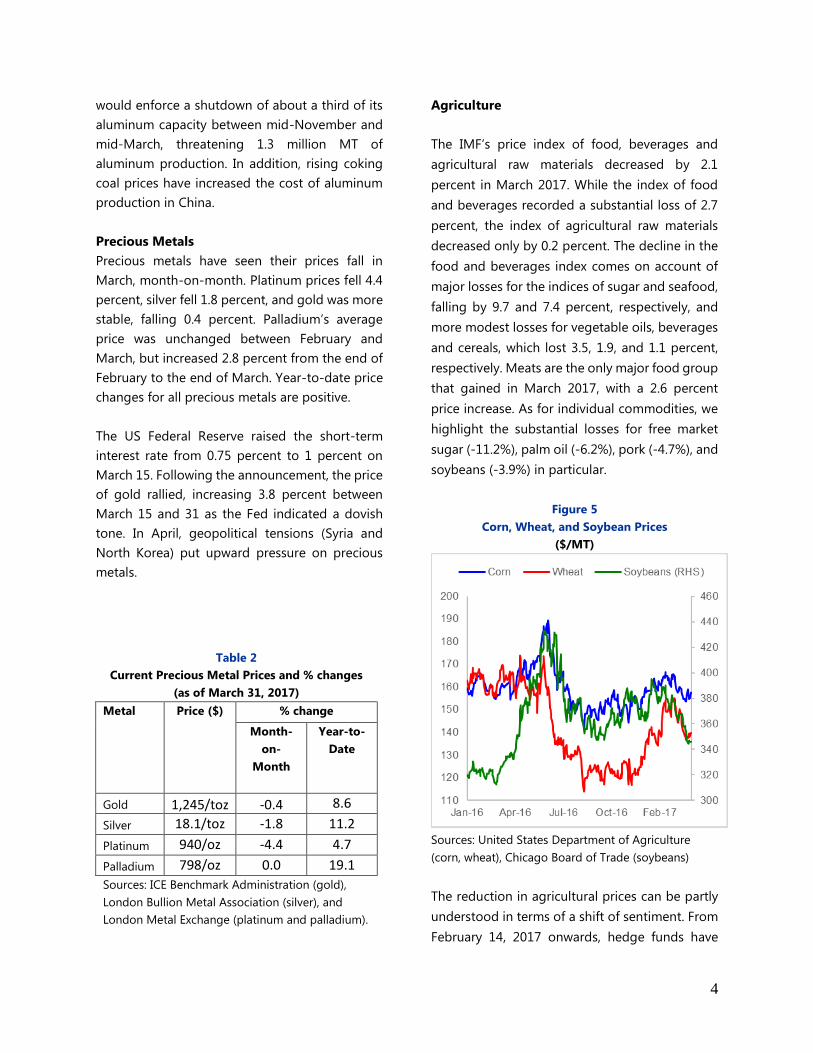
Agriculture
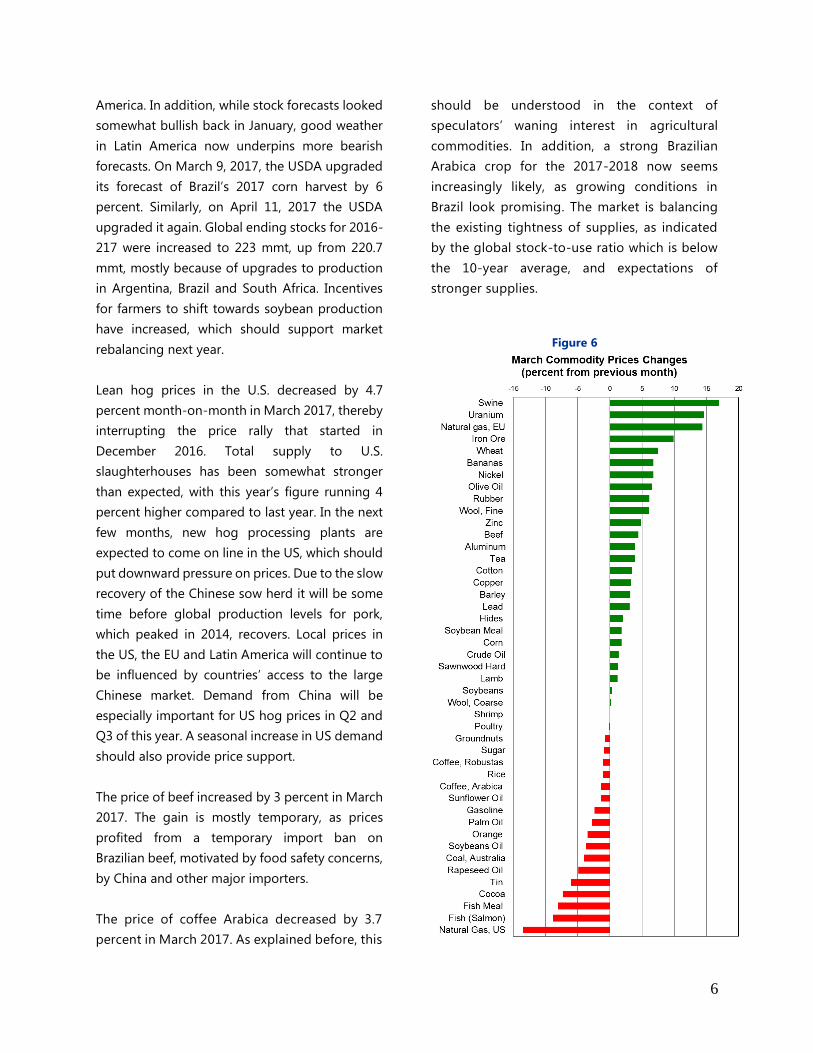
The IMF’s price index of food, beverages and
agricultural raw materials decreased by 2.1
percent in March 2017. While the index of food
and beverages recorded a substantial loss of 2.7
percent, the index of agricultural raw materials
decreased only by 0.2 percent. The decline in the
food and beverages index comes on account of
major losses for the indices of sugar and seafood,
falling by 9.7 and 7.4 percent, respectively, and
more modest losses for vegetable oils, beverages
and cereals, which lost 3.5, 1.9, and 1.1 percent,
respectively. Meats are the only major food group
that gained in March 2017, with a 2.6 percent
price increase. As for individual commodities, we
highlight the substantial losses for free market
sugar (-11.2%), palm oil (-6.2%), pork (-4.7%), and
soybeans (-3.9%) in particular.
Figure 5
Corn, Wheat, and Soybean Prices
($/MT)
Sources: United States Department of Agriculture
(corn, wheat), Chicago Board of Trade (soybeans)
The reduction in agricultural prices can be partly
understood in terms of a shift of sentiment. From
February 14, 2017 onwards, hedge funds have
Table 2
Current Precious Metal Prices and % changes
(as of March 31, 2017)
Metal Price ($) % change
Month-
on-
Month
Year-to-
Date
Gold 1,245/toz -0.4 8.6
Silver 18.1/toz -1.8 11.2
Platinum 940/oz -4.4 4.7
Palladium 798/oz 0.0 19.1
Sources: ICE Benchmark Administration (gold),
London Bullion Metal Association (silver), and
London Metal Exchange (platinum and palladium).
5
been reducing their net long position in futures
and options in the top 13 US-traded agricultural
commodities for seven consecutive weeks. This
recent reversal, from a net bullish bet to a net
bearish one, means that hedge funds are now
roughly holding the same position as in June
2015. Hedge funds’ current stance seems to be
more in line with the fundamentals, as supply is
still ample in many markets. For example, on April
11, 2017 the United States Department of
Agriculture (USDA) upgraded its forecast of 2016-
2017 global ending stock of all grains to 628.4
million metric ton (mmt), up from 622.6 mmt. The
selling, and resulting fall in agricultural prices,
also coincides with the reduced prospects of
inflationary pressures amid increased skepticism
that US President Donald Trump would introduce
economic stimulus measures, which would have
increased commodity prices.
Annual food prices are expected to increase by 3
percent in 2017 year-on-year, mostly reflecting
the relatively low level of prices that prevailed in
agricultural markets in 2016H1. Recent upgrades
to the forecasts for production of wheat, corn,
and soybeans by the USDA may put downward
pressure on prices for the remainder of this year.
Downside risks to the price outlook remain
unchanged and include (i) increased agricultural
supplies from China and (ii) greater overall
economic uncertainty. The US weather service
now notes there are increasing odds for El Niño
toward the second half of 2017 (50-55% chance
from approximately July-December 2017), adding
upside risk to the outlook.
The price of palm oil decreased by 6.2 percent,
month-on-month, in March 2017, reaching a low
not seen since August 2016. The downward
pressure on prices comes from a faster-than-
expected recovery of output, after last year’s El
Niño induced crunch. Malaysian palm oil
production was up by 20 percent year-on-year in
March 2017. In addition, Malaysian inventories
grew faster than expected as well, to 1.55 million
tons, as data from the Malaysian Palm Oil Board
released on April 10, 2017, even though exports
increased by 14 percent month-on-month in
March 2017.
In March 2017, free market prices of sugar
decreased by 11.2 percent, month-on-month.
Prospects for the upcoming harvest season in
Brazil, which starts in April, are strong as weather
has been good. In addition, observers expect that
sugar cane mills in Brazil will continue to favor the
production of sugar at the expense of ethanol
production, even more so than last season, as
sugar prices continue to be relatively high. Data
from the Commodity Futures Trading
Commission (CFTC) show that managed money,
a proxy for speculators, reduced their net long
in sugar throughout March.
Prices of soybeans decreased by 3.9 percent in
March 2017. Rabobank argues that the drop
coincides with the fall in crude oil prices, with
hedge funds reducing their net long positions in
commodities. On the soybean supply side, most
news have been bearish. On March 9, 2017, the
USDA upgraded its 2016-2017 soybean forecast
for top producer Brazil by 4 percent. On April 10,
2017, the USDA upgraded its forecast of Brazilian
output once more, and upgraded its 2016/2017
global ending stock forecast by 5.6 percent to
87.4 mmt, exceeding expectations of most
analysts. Finally, sowings of soybean in the United
States are expected to increase to 86.4 million
acres, somewhat below expectations, thereby
providing some bullish news.
Like its rival soybean, prices of corn decreased in
March 2017, down by 2.4 percent from February
2017, on account of large recent crops in Latin
6
America. In addition, while stock forecasts looked
somewhat bullish back in January, good weather
in Latin America now underpins more bearish
forecasts. On March 9, 2017, the USDA upgraded
its forecast of Brazil’s 2017 corn harvest by 6
percent. Similarly, on April 11, 2017 the USDA
upgraded it again. Global ending stocks for 2016-
217 were increased to 223 mmt, up from 220.7
mmt, mostly because of upgrades to production
in Argentina, Brazil and South Africa. Incentives
for farmers to shift towards soybean production
have increased, which should support market
rebalancing next year.
Lean hog prices in the U.S. decreased by 4.7
percent month-on-month in March 2017, thereby
interrupting the price rally that started in
December 2016. Total supply to U.S.
slaughterhouses has been somewhat stronger
than expected, with this year’s figure running 4
percent higher compared to last year. In the next
few months, new hog processing plants are
expected to come on line in the US, which should
put downward pressure on prices. Due to the slow
recovery of the Chinese sow herd it will be some
time before global production levels for pork,
which peaked in 2014, recovers. Local prices in
the US, the EU and Latin America will continue to
be influenced by countries’ access to the large
Chinese market. Demand from China will be
especially important for US hog prices in Q2 and
Q3 of this year. A seasonal increase in US demand
should also provide price support.
The price of beef increased by 3 percent in March
2017. The gain is mostly temporary, as prices
profited from a temporary import ban on
Brazilian beef, motivated by food safety concerns,
by China and other major importers.
The price of coffee Arabica decreased by 3.7
percent in March 2017. As explained before, this
should be understood in the context of
speculators’ waning interest in agricultural
commodities. In addition, a strong Brazilian
Arabica crop for the 2017-2018 now seems
increasingly likely, as growing conditions in
Brazil look promising. The market is balancing
the existing tightness of supplies, as indicated
by the global stock-to-use ratio which is below
the 10-year average, and expectations of
stronger supplies.
Figure 6

7
Units 2014 2015 2016 2016Q1 2016Q2 2016Q3 2016Q4 Feb-17 Mar-17
Food
Cereals
Wheat $/MT 242.5 185.6 143.2 162.6 159.2 128.2 122.6 147.3 146.4
Maize $/MT 192.9 169.8 159.2 159.9 171.1 153.4 152.2 162.9 159.0
Rice $/MT 426.5 380.0 388.3 367.7 401.8 418.2 365.3 368.5 367.8
Barley $/MT 146.1 127.9 129.4 119.7 137.4 131.1 129.3 136.2 137.3
Vegetable oils and protein meals
Soybeans $/MT 457.8 347.4 362.7 323.4 387.8 372.2 367.3 380.9 366.1
Soybean meal $/MT 467.0 352.7 350.2 294.9 392.9 370.0 342.9 371.4 356.9
Soybean oil $/MT 812.7 672.2 721.2 686.9 719.7 701.4 776.6 742.9 723.4
Palm oil $/MT 739.4 565.1 639.8 586.9 647.8 647.0 677.7 706.8 663.3
Fish meal $/MT 1921.5 1759.2 1418.5 1466.4 1511.5 1409.7 1286.2 1125.5 1069.0
Sunflower Oil $/MT 1080.3 1022.2 1009.7 1024.5 1028.6 982.0 1003.7 967.0 936.8
Olive oil $/MT 3780.6 4292.8 3978.5 4085.7 3897.5 3982.3 3948.3 4424.2 4434.1
Groundnuts $/MT 2148.3 1946.2 1798.3 1821.3 1855.4 1804.7 1711.8 1806.4 1882.1
Rapeseed oil $/MT 904.4 774.6 822.0 774.7 797.7 810.6 904.7 872.3 839.9
Meat
Beef cts/lb 224.1 200.5 178.2 168.9 179.3 185.4 179.3 184.6 190.2
Lamb cts/lb 130.6 107.9 106.9 95.5 100.6 110.8 120.8 123.7 128.3
Swine Meat cts/lb 102.8 67.9 62.4 60.3 72.6 66.6 50.1 71.8 68.4
Poultry cts/lb 110.1 114.7 111.5 112.1 111.8 110.9 111.1 114.4 124.0
Seafood
Fish $/kg 6.6 5.3 7.1 6.5 7.3 7.2 7.5 7.9 7.2
Shrimp $/kg 16.6 14.1 11.0 11.0 10.6 10.7 11.8 12.1 12.1
Sugar
Free market cts/lb 17.1 13.2 18.5 14.8 17.6 20.8 20.9 20.3 18.1
United States cts/lb 24.9 24.8 27.0 25.6 26.4 27.2 28.9 30.4 29.8
EU cts/lb 27.4 25.4 22.5 23.8 23.9 21.8 20.7 20.8 20.5
Bananas $/MT 931.9 958.7 1002.4 1028.2 993.0 1023.2 965.4 1040.1 1071.6
Oranges $/MT 782.5 675.0 889.1 686.2 784.7 992.5 1093.1 902.6 921.3
Beverages
Coffee
Other milds cts/lb 202.8 160.5 164.5 150.7 158.5 173.6 175.3 165.6 159.4
Robusta cts/lb 105.6 94.2 94.3 82.1 90.4 98.5 106.1 110.1 110.0
Cocoa Beans $/MT 3062.8 3135.2 2892.0 2980.8 3099.9 2987.9 2499.6 2034.1 2063.1
Tea cts/kg 237.9 340.4 287.4 290.3 251.4 284.7 323.4 382.9 356.1
Agricultural raw materials
Timber
Hardwood
Logs 1/ $/M3 282.0 246.0 274.4 258.2 275.7 290.7 272.8 263.5 263.5
Sawnwood 1/ $/M3 897.9 833.3 738.9 780.3 782.3 716.2 676.8 680.5 672.5
Softwood
Logs 1/ $/M3 174.3 162.0 156.8 168.4 143.5 151.7 163.7 157.6 157.6
Sawnwood 1/ $/M3 307.3 308.7 297.1 267.2 309.2 307.6 304.7 287.4 287.4
Cotton cts/lb 83.1 70.4 74.2 66.9 71.2 79.7 79.0 85.2 86.8
Wool
Fine cts/kg 1074.4 1005.8 1112.0 1023.4 1092.8 1140.3 1191.4 1368.1 1454.8
Coarse cts/kg 1034.6 927.8 1016.4 959.1 1009.0 1082.2 1015.1 1029.6 1059.6
Rubber cts/lb 88.8 70.7 74.5 59.3 75.2 76.1 87.3 123.0 107.4
Hides cts/lb 110.2 87.7 74.1 72.8 73.5 74.2 75.9 76.6 77.9
1/ Provisional.
2/ Average Petroleum Spot Price (APSP). Average of U.K. Brent, Dubai, and West Texas Intermediate, equally weighted.
Table 1. Market Prices for Non-Fuel and Fuel Commodities

8
Units 2014 2015 2016 2016Q1 2016Q2 2016Q3 2016Q4 Feb-17 Mar-17
Metals
Copper $/MT 6863.4 5510.5 4867.9 4674.7 4736.4 4779.6 5280.8 5940.9 5824.6
Aluminum $/MT 1867.4 1664.7 1604.2 1514.5 1571.8 1620.2 1710.3 1860.8 1901.5
Iron Ore $/MT 97.4 56.1 58.6 48.4 56.4 58.6 70.8 88.8 87.2
Tin $/MT 21898.9 16066.6 17933.8 15438.6 16902.1 18584.3 20810.1 19446.5 19875.2
Nickel $/MT 16893.4 11862.6 9595.2 8507.7 8822.5 10263.5 10787.0 10643.3 10204.7
Zinc $/MT 2161.0 1931.7 2090.0 1677.3 1916.9 2251.6 2514.2 2845.6 2776.9
Lead $/MT 2095.5 1787.8 1866.7 1738.0 1717.6 1872.7 2138.3 2311.5 2280.9
Uranium $/lb 33.5 36.8 26.3 32.6 27.5 25.5 19.6 25.3 24.6
Energy
Spot Crude 2/ $/bbl 96.2 50.8 42.8 32.8 44.8 44.7 49.1 54.4 50.9
U.K. Brent $/bbl 98.9 52.4 44.0 34.4 46.0 45.8 50.1 55.5 52.0
Dubai $/bbl 96.7 51.2 41.2 30.7 42.9 43.4 47.9 54.2 51.2
West Texas Intermediate $/bbl 93.1 48.7 43.2 33.3 45.5 44.9 49.2 53.4 49.6
Natural Gas
Russian in Germany $/mmbtu 10.5 7.3 4.4 4.7 4.0 4.2 4.6 5.9 5.8
Indonesian in Japan (LNG) $/mmbtu 17.0 11.0 7.4 8.2 6.9 7.4 7.4 8.0 7.8
US, domestic market $/mmbtu 4.4 2.6 2.5 2.0 2.1 2.8 3.0 2.8 2.9
Coal
Australian, export markets $/MT 75.1 61.6 70.6 54.5 55.6 72.3 99.8 86.2 86.4
1/ Provisional.
2/ Average Petroleum Spot Price (APSP). Average of U.K. Brent, Dubai, and West Texas Intermediate, equally weighted.
Table 1. Market Prices for Non-Fuel and Fuel Commodities (Continued)
(weights) 1/ 2014 2015 2016 2016Q1 2016Q2 2016Q3 2016Q4 Feb-17 Mar-17
All Primary Commodities 2/ 100.0 171.9 111.2 100.1 86.5 101.4 102.7 109.7 118.7 114.2
Non-Fuel Commodities 36.9 162.3 134.0 131.5 123.8 132.8 133.4 135.9 145.2 142.7
Agriculture 26.2 161.5 136.9 136.3 129.4 139.8 138.6 137.1 143.0 140.0
Food 16.7 170.1 140.8 143.8 136.3 149.2 145.9 143.9 151.8 147.6
Cereals 3.6 180.2 149.0 131.4 136.5 142.0 126.4 120.6 133.3 131.8
Vegetable oils and protein meals 4.4 190.5 152.8 155.9 143.1 163.8 158.6 158.0 162.7 157.0
Meat 3.7 160.5 137.4 126.6 122.3 131.4 130.9 121.9 134.6 138.1
Seafood 3.2 162.0 131.7 161.6 149.1 164.8 163.0 169.5 178.2 165.0
Beverages 1.8 178.0 172.6 163.9 158.7 163.5 169.8 163.8 155.7 152.8
Agricultural raw materials 3/ 7.7 138.8 120.1 113.3 107.6 113.7 115.5 116.3 120.7 120.4
Timber 3.4 109.3 104.5 100.2 96.7 103.0 101.6 99.4 95.9 95.6
Metals 10.7 164.4 126.6 119.7 109.9 115.6 120.6 132.9 150.9 149.4
Edibles 4/ 18.5 170.9 143.9 145.8 138.5 150.6 148.2 145.8 152.2 148.1
Industrial Inputs 5/ 18.4 153.7 123.9 117.0 108.9 114.8 118.5 125.9 138.2 137.3
Energy 6/ 63.1 177.4 97.9 81.7 64.7 83.0 84.8 94.3 103.2 97.4
Petroleum 7/ 53.6 181.1 95.6 80.4 61.5 84.1 84.0 92.2 102.2 95.8
Natural Gas 6.9 159.9 106.8 70.0 73.5 64.1 69.3 73.1 85.0 83.7
Coal 2.6 149.1 121.3 138.4 107.8 110.8 141.7 193.3 170.5 167.7
3/ Includes Forestry Products.
4/ Edibles comprised of Food and Beverages
5/ Industrial (Non-Fuel) Inputs comprised of Agriculture and Metals
6/ Includes Petroleum, Natural Gas and Coal
7/ Average Petroleum Spot Price (APSP). Average of U.K. Brent, Dubai, and West Texas Intermediate, equally weighted.
Table 2. Indices of Market Prices for Non-Fuel and Fuel Commodities, 2014-2016(2005=100, in terms of U.S. dollars) 1/
1/ Weights based on 2002-2004 average world export earnings.
2/ Non-Fuel Primary Commodities and Energy Index.

9
Monthly (from 2005) Daily (from 2011)
Commodity Prices Movements
25
50
75
100
125
150
05 07 09 11 13 15 17
Crude oil ($/bbl)
Brent
WTI
15
40
65
90
115
140
11 12 13 14 15 16 17
Crude oil ($/bbl)
Brent
WTI
0
5
10
15
20
05 07 09 11 13 15 17
Natural Gas ($/mmbtu)
Germany
United States
Sources: Energy Intelligence; Bloomberg , L.P.
Japan
0
5
10
15
11 12 13 14 15 16 17
Natural Gas ($/mmbtu)
Source: Bloomberg , L.P.
United States
Germany
0
25
50
75
100
125
150
175
200
05 07 09 11 13 15 17
Iron Ore ($/ton)
20
45
70
95
120
145
170
195
11 12 13 14 15 16 17
Iron Ore ($/ton)

10
Commodity Prices Movements (Continued)
Monthly (from 2005) Daily (from 2011)
2500
3500
4500
5500
6500
7500
8500
9500
05 07 09 11 13 15 17
Copper ($/ton)
3000
4000
5000
6000
7000
8000
9000
10000
11000
11 12 13 14 15 16 17
Copper ($/ton)
1000
1500
2000
2500
3000
3500
05 07 09 11 13 15 17
Aluminium ($/ton)
1300
1500
1700
1900
2100
2300
2500
2700
2900
11 12 13 14 15 16 17
Aluminium ($/ton)
0
10000
20000
30000
40000
50000
60000
05 07 09 11 13 15 17
Nickel ($/ton)
6000
11000
16000
21000
26000
11 12 13 14 15 16 17
Nickel ($/ton)

11
Commodity Prices Movements (Continued)
Monthly (from 2005) Daily (from 2011)
0
5000
10000
15000
20000
25000
30000
35000
05 07 09 11 13 15 17
Tin ($/ton)
50
100
150
200
250
300
350
05 07 09 11 13 15 17
Corn ($/ton)
10000
15000
20000
25000
30000
35000
11 12 13 14 15 16 17
Tin ($/ton)
100
150
200
250
300
350
400
11 12 13 14 15 16 17
Wheat ($/ton)
120
170
220
270
320
370
11 12 13 14 15 16 17
Corn ($/ton)
100
200
300
400
500
05 07 09 11 13 15 17
Wheat ($/ton)
12
Commodity Prices Movements (Continued)
Monthly (from 2005) Daily (from 2011)
1000
1500
2000
2500
3000
3500
4000
05 07 09 11 13 15 17
Cocoa ($/ton)
0
50
100
150
200
250
300
350
05 07 09 11 13 15 17
Coffee (cents/lb)
0
20
40
60
80
100
120
140
05 07 09 11 13 15 17
Swine (cents/lb)
40
50
60
70
80
90
100
110
120
130
140
11 12 13 14 15 16 17
Swine (cents/lb)
100
150
200
250
300
350
11 12 13 14 15 16 17
Coffee (cents/lb)
1800
2000
2200
2400
2600
2800
3000
3200
3400
3600
3800
11 12 13 14 15 16 17
Cocoa ($/ton)

13
Commodity Prices Movements (Continued)
Monthly (from 2005) Daily (from 2011)
75
100
125
150
175
200
225
250
275
05 07 09 11 13 15 17
Beef (cents/pound)
Source: Meat & Livestock Australia.
150
250
350
450
550
650
05 07 09 11 13 15 17
Soybeans ($/ton)
0
50
100
150
200
250
05 07 09 11 13 15 17
Cotton (cents/pound)
90
100
110
120
130
140
150
160
170
180
11 12 13 14 15 16 17
Beef (cents/lb)
Source: Bloomberg , L.P.
250
300
350
400
450
500
550
600
650
700
11 12 13 14 15 16 17
Soybeans ($/ton)
50
70
90
110
130
150
170
190
210
230
250
11 12 13 14 15 16 17
Cotton (cents/lb)
14
Commodity Prices Movements (Continued)
Monthly (from 2005)
800
1300
1800
2300
2800
3300
3800
4300
05 07 09 11 13 15 17
Zinc ($/ton)
0
50
100
150
200
05 07 09 11 13 15 17
Coal ($/ton)
Australia
South Africa
0
20
40
60
80
100
120
140
160
05 07 09 11 13 15 17
Uranium($/lb)
100
200
300
400
500
05 07 09 11 13 15 17
Logs ($/cubic meter)
Soft
Hard
0
50
100
150
200
250
300
05 07 09 11 13 15 17
Rubber ($/lb)
250
500
750
1000
1250
1500
1750
2000
05 07 09 11 13 15 17
Wool (cents/kg)
Fine
Coarse

15
Commodity Prices Movements (Continued)
Monthly (from 2005)
200
400
600
800
1000
1200
05 07 09 11 13 15 17
Rice ($/ton)
300
400
500
600
700
800
900
1000
1100
1200
05 07 09 11 13 15 17
Bananas ($/ton)
300
500
700
900
1100
1300
05 07 09 11 13 15 17
Palm Oil ($/ton)
6
8
10
12
14
16
18
20
05 07 09 11 13 15 17
Shrimp ($/kg)
5
10
15
20
25
30
05 07 09 11 13 15 17
Sugar (cents/pound)
150
200
250
300
350
400
450
05 07 09 11 13 15 17
Tea (cents/kg)

16
Commodity Prices Movements (Continued)
Daily (from 2011)
900
1100
1300
1500
1700
1900
11 12 13 14 15 16 17
Gold ($/troy ounce)
600
800
1000
1200
1400
1600
1800
2000
11 12 13 14 15 16 17
Platinum ($/ounce)
0
10
20
30
40
50
60
11 12 13 14 15 16 17
Silver ($/troy ounce)
300
400
500
600
700
800
900
1000
11 12 13 14 15 16 17
Palladium ($/ounce)

17
0
20
40
60
80
100
120
10 11 12 13 14 15 16 17 18
WTI Crude Oil (U.S. dollars a barrel)
0
20
40
60
80
100
120
140
10 11 12 13 14 15 16 17 18
Brent Crude Oil (U.S. dollars a barrel)
0
1
2
3
4
5
6
7
8
10 11 12 13 14 15 16 17 18
Natural Gas (U.S. dollars a MMBtu)
25
75
125
175
225
275
325
375
10 11 12 13 14 15 16 17
Gasoline (U.S. cents a gallon)
50
100
150
200
250
300
350
400
450
500
10 11 12 13 14 15 16 17 18
Copper (U.S. cents a pound)
600
800
1000
1200
1400
1600
1800
2000
10 11 12 13 14 15 16 17 18
Gold(U.S. dollars a troy ounce)
Selected Commodities—Market Price Outlook and Risks

18
100
200
300
400
500
600
700
800
900
10 11 12 13 14 15 16 17 18
Corn(U.S. cents a bushel)
0
50
100
150
200
250
300
350
10 11 12 13 14 15 16 17 18
Coffee(U.S. cents a pound)
4
6
8
10
12
14
16
18
20
10 11 12 13 14 15 16 17
Rough Rice(U.S. cents a hundredweight)
200
300
400
500
600
700
800
900
1000
1100
10 11 12 13 14 15 16 17 18
Wheat Price(U.S. cents a bushel)
300
500
700
900
1100
1300
1500
1700
1900
10 11 12 13 14 15 16 17 18
Soybeans (U.S. cents a bushel)
100
150
200
250
300
350
400
450
500
550
600
10 11 12 13 14 15 16 17 18
Soybean Meal (U.S. dollars a short ton)
Selected Commodities—Market Price Outlook and Risks
(concluded)

19
3 6 9 12 3 6 9 12
< 25 0.0 0.1 0.4 0.2 < 30 0.0 0.1 0.0 0.9
< 30 0.0 0.8 2.2 2.0 < 35 0.0 0.7 0.3 4.3
< 35 0.1 3.3 6.8 7.6 < 40 0.1 3.8 3.0 12.6
< 40 1.4 8.7 14.9 18.8 < 45 2.0 11.9 12.3 26.1
< 45 8.8 19.2 27.4 34.4 < 50 12.7 27.6 30.4 42.6
< 50 30.1 38.1 44.7 51.2 < 55 43.9 50.0 52.8 58.8
< 55 63.7 61.9 63.1 66.3 < 60 80.8 72.0 72.8 72.6
> 60 12.1 19.0 21.7 21.8 > 65 4.4 13.2 13.7 17.2
> 65 3.2 8.4 11.8 13.4 > 70 0.9 5.7 6.1 10.3
> 70 0.8 3.8 6.2 7.9 > 75 0.1 2.4 2.4 5.9
> 75 0.2 1.8 3.3 4.5 > 80 0.0 1.0 0.9 3.3
3 6 9 12 3 6 9 12
< 1.50 0.0 0.5 1.6 1.6 < 0.75 0.0 0.2 0.7
< 2.00 1.3 4.9 9.1 10.5 < 1.00 0.1 3.7 6.7
< 2.50 9.5 17.4 24.8 36.7 < 1.25 3.7 19.2 25.0
< 3.00 31.3 41.2 47.7 68.7 < 1.50 25.0 48.0 53.6
< 3.50 70.8 69.6 69.7 87.3 < 1.75 60.7 75.5 77.6
> 4.00 6.9 12.1 15.7 5.3 < 2.00 86.1 90.5 90.8
> 4.50 1.6 4.2 7.9 2.4 > 2.25 3.6 3.3 3.5
> 5.00 0.4 1.5 4.1 1.1 > 2.50 0.7 1.0 1.2
> 5.50 0.1 0.6 2.1 0.5 > 2.75 0.1 0.3 0.4
> 6.00 0.0 0.2 1.1 0.3 > 3.0 0.0 0.1 0.1
> 6.5 0.0 0.1 0.6 0.1 > 3.0 0.0 0.0 0.0
3 6 9 12 3 6 9 12
< 1.50 0.0 0.0 0.6 1.7 < 800 0.0 0.0 0.3 0.6
< 1.75 0.0 0.9 3.9 6.6 < 900 0.0 0.3 1.5 2.2
< 2.00 0.8 6.0 13.1 16.6 < 1000 0.3 1.8 4.7 6.0
< 2.25 7.8 19.4 28.9 31.9 < 1100 1.9 6.7 12.2 14.5
< 2.50 37.6 43.7 49.5 51.5 < 1200 12.9 22.7 30.3 32.7
< 2.75 81.6 72.8 70.2 70.5 > 1300 41.5 42.0 42.0 41.9
> 3.00 3.4 9.9 15.0 16.1 > 1400 7.5 14.1 19.2 20.8
> 3.25 0.6 3.5 7.1 8.5 > 1500 1.5 4.6 8.1 9.4
> 3.50 0.1 1.2 3.2 4.5 > 1600 0.4 1.7 3.7 4.5
> 4.00 0.0 0.1 0.6 1.2 > 1700 0.1 0.6 1.8 2.3
> 4.5 0.0 0.0 0.1 0.3 > 1800 0.0 0.2 0.9 1.2
WTI Crude Oil
(probabilities in percent; prices in U.S. dollars a barrel)
Threshold
Prices
Months Forward
Brent Crude Oil
(probabilities in percent; prices in U.S. dollars a barrel)
Threshold
Prices
Months Forward
U.S. Natural Gas
(probabilities in percent; prices in U.S. dollars an MMBtu)
Threshold
Prices
Months Forward
Gasoline
(probabilities in percent; prices in U.S. dollars a gallon)
Threshold
Prices
Months Forward
Copper
(probabilities in percent; prices in U.S. dollars a pound)
Threshold
Prices
Months Forward
Gold
(probabilities in percent; prices in U.S. dollars a troy ounce)
Threshold
Prices
Months Forward
Options-based Price Thresholds

20
Options-based Price Thresholds (concluded)
3 6 9 12 3 6 9 12
< 2.0 0.0 0.0 0.2 0.3 < 0.6 0.0 0.0 0.1 0.1
< 2.5 0.0 1.3 2.1 2.3 < 0.8 0.0 0.3 1.2 1.5
< 3.0 0.2 8.7 9.5 11.1 < 1.0 0.2 3.8 6.1 7.6
< 3.5 22.0 33.2 33.6 33.0 < 1.2 10.3 18.0 22.4 25.9
> 4.0 13.9 27.3 31.7 38.8 > 1.4 45.0 45.3 45.6 46.4
> 4.5 0.3 8.1 11.1 17.7 > 1.6 9.1 14.4 18.7 23.1
> 5.0 0.0 2.6 4.1 7.1 > 1.8 0.8 4.4 6.7 10.1
> 5.5 0.0 0.8 1.7 2.7 > 2.0 0.0 1.4 2.6 4.3
> 6.0 0.0 0.2 0.7 1.1 > 2.2 0.0 0.4 1.2 1.9
> 6.5 0.0 0.1 0.3 0.5 > 2.4 0.0 0.1 0.5 0.9
> 7.0 0.0 0.0 0.1 0.2 > 2.6 0.0 0.0 0.2 0.5
3 6 9 12 3 6 9 12
< 0.05 0.0 0.0 0.0 0.2 < 2.5 0.0 0.1 0.3 0.3
< 0.06 0.0 0.2 0.3 1.3 < 3.0 0.0 1.3 2.0 1.7
< 0.07 0.0 1.3 1.8 5.1 < 3.5 2.7 6.3 6.9 6.0
< 0.08 0.8 4.8 6.0 13.3 < 4.0 25.2 23.0 21.0 18.0
< 0.09 5.8 15.8 17.7 28.1 > 4.5 32.6 43.0 51.1 58.9
> 0.10 64.1 59.0 59.0 51.0 > 5.0 7.3 14.7 24.3 33.2
> 0.11 19.3 30.8 33.4 31.1 > 5.5 0.9 3.8 9.6 15.8
> 0.12 5.0 13.7 16.4 17.4 > 6.0 0.1 1.0 3.5 7.2
> 0.13 1.5 6.4 8.2 9.7 > 6.5 0.0 0.3 1.2 3.5
> 0.14 0.4 3.2 4.3 5.5 > 7.0 0.0 0.1 0.4 1.8
> 0.15 0.1 1.7 2.4 3.1 > 7.5 0.0 0.0 0.1 1.0
3 6 9 12 3 6 9 12
< 5 0.0 0.0 0.1 0.3 < 150 0.0 0.0 0.0 0.1
< 6 0.0 0.5 0.8 1.7 < 200 0.0 0.7 1.5 2.3
< 7 0.1 3.6 3.9 6.0 < 250 0.6 7.2 9.9 12.1
< 8 2.8 13.6 13.6 17.7 < 300 27.6 37.6 40.6 42.8
< 9 22.6 40.1 39.9 42.7 > 350 15.3 17.0 19.3 20.4
> 10 19.1 25.5 27.1 29.3 > 400 0.8 3.6 4.7 5.5
> 11 2.8 8.6 9.4 12.2 > 450 0.0 0.9 1.4 1.7
> 12 0.4 3.2 3.5 5.0 > 500 0.0 0.2 0.4 0.6
> 13 0.0 1.1 1.5 2.3 > 550 0.0 0.0 0.1 0.2
> 14 0.0 0.4 0.6 1.1 > 600 0.0 0.0 0.0 0.1
> 15 0.0 0.1 0.2 0.6 > 650 0.0 0.0 0.0 0.0
Corn
(probabilities in percent; prices in U.S. dollars a bushel)
Threshold
Prices
Months Forward
Coffee
(probabilities in percent; prices in U.S. dollars a pound)
Threshold
Prices
Months Forward
Rough Rice
(probabilities in percent; prices in U.S. dollars a hundredweight)
Threshold
Prices
Months Forward
Wheat
(probabilities in percent; prices in U.S. dollars a bushel)
Threshold
Prices
Months Forward
Soybeans
(probabilities in percent; prices in U.S. dollars a bushel)
Threshold
Prices
Months Forward
Soybean Meal
(probabilities in percent; prices in U.S. dollars a short ton)
Threshold
Prices
Months Forward

21
Options-based Probabilities of Price Changes (in percent)
22
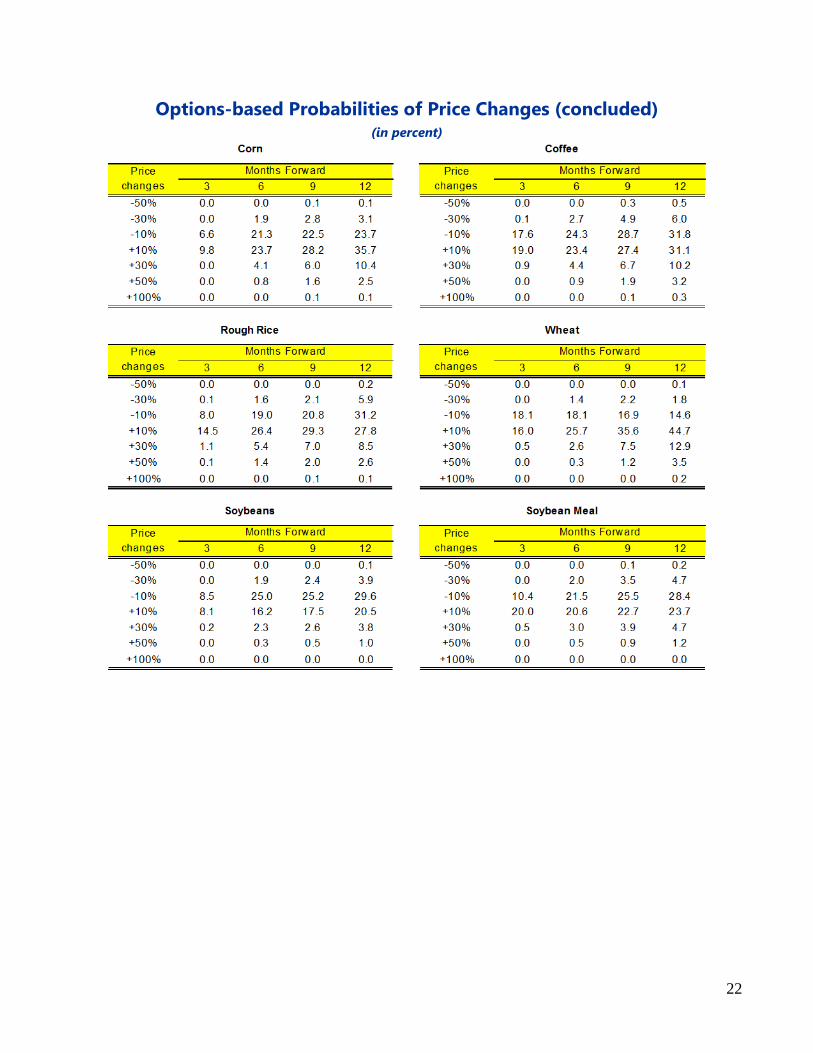
Options-based Probabilities of Price Changes (concluded) (in percent)

23
Commodity Exchange Contract Physical Characteristics Contract Size Pricing Unit Months Traded
Futures Light sweet crude oil 1,000 barrels U.S. dollars per barrel
OptionsOne crude oil futures
contract of 1,000 barrels
Futures Light sweet crude oil 1,000 barrels U.S. dollars per barrel
OptionsOne crude oil futures
contract of 1,000 barrels
FuturesNatural gas delivered at Henry
Hub, LA10,000 MMBtu U.S. dollars per MMBtu
OptionsOne natural gas futures
contract of 10,000 MMBtu
Futures New York Harbor RBOB 42,000 gallons U.S. cents per gallon
OptionsOne gasoline futures
contract of 42,000 gallons
FuturesGold (a minimum of 995
fineness)100 troy ounces
U.S. dollars per troy
ounce
OptionsOne COMEX Gold futures
contract
Futures Yellow corn grade #2 5,000 bushels (127 MT) U.S. cents per bushel
Options
One corn futures contract (of
a specified month) of 5,000
bushels
Futures
Arabica coffee from 19
countries of origin37,500 lbs U.S. cents per pound
Options
One coffee futures contract
(of a specified month) of
37,500 lbs
Futures
U.S. #2 long grain rough rice
with a total milling yield of
65%+
2,000 hundredweights (CWT)U.S. cents per
hundredweight
Options
One rough rice futures
contract of 2,000
hundredweights (CWT)
Futures #2 soft red winter wheat 5,000 bushels (136 MT) U.S. cents per bushel
Options
One Wheat futures contract
(of a specified month) of
5,000 bushels
FuturesMeal with minimum protein of
48%100 short tons U.S. dollars per ton
Options
One soybean meal futures
contract (of a specified
month) of 100 short tons
Futures Yellow soybean grade #2 5,000 bushels (136 MT) U.S. cents per bushel
Options
One soybean futures
contract (of a specified
month) of 5,000 bushels
Sources: Chicago Board of Trade, ICE, Bloomberg, L.P.
Current calendar month; the
next two calendar months;
any Feb, Apr, Aug, and Oct
falling within a 23-month
period; and any Jun and Dec
falling within a 72-month
period beginning with the
current month.
Consecutive months up to
and including February 2020
WTI crude oil
Consecutive months are
listed for the current year
and the next five years; in
addition, the Jun and Dec
contract months are listed
beyond the sixth year.
Gasoline
Consecutive months for the
current year plus the next
twelve full calendar years.
Consecutive months for 36
months
Brent crude
oil
Natural Gas
ICE Europe
New York
Mercantile
Exchange
New York
Mercantile
Exchange
New York
Mercantile
Exchange
Corn
Wheat
Soybeans
Gold
Chicago
Mercantile
Exchange
Coffee
Rough rice
Soybean meal
Chicago
Mercantile
Exchange
ICE
Chicago
Mercantile
Exchange
Chicago
Mercantile
Exchange
Chicago
Mercantile
Exchange
Chicago
Mercantile
Exchange
Jan, Mar, May, Jul, Aug, Sep,
Nov. The monthly option
contract exercises into the
nearby futures contract.
Mar, May, Jul, Sep, Dec. The
monthly option contract
exercises into the nearby
futures contract.
Mar, May, Jul, Sep, Dec. The
monthly option contract
exercises into the nearby
futures contract.
Jan, Mar, May, Jul, Sep, Nov.
The monthly option contract
exercises into the nearby
futures contract.
Mar, May, July, Sep, Dec. The
monthly option contract
exercises into the nearby
futures contract.
Jan, Mar, May, Jul, Aug, Sep,
Oct, Dec. The monthly option
contract exercises into the
nearby futures contract.
Commodity Derivative Contract Specifications