T HE N ATIONAL P ROGRAM ON D AIRY M ARKETS AND P OLICY MPP-Dairy Update Overview of margin forecast...
45
THE NATIONAL PROGRAM ON DAIRY MARKETS AND POLICY MPP-Dairy Update • Overview of margin forecast for the year ahead • Updates to MPP-Dairy Decision Tool • Understanding financial risks farmers face • Demonstrate new “Advanced Features” of decision tool
-
Upload
leona-richards -
Category
Documents
-
view
215 -
download
2
Transcript of T HE N ATIONAL P ROGRAM ON D AIRY M ARKETS AND P OLICY MPP-Dairy Update Overview of margin forecast...

THE NATIONAL PROGRAM ON DAIRY MARKETS AND POLICY
MPP-Dairy Update• Overview of margin forecast for the year ahead• Updates to MPP-Dairy Decision Tool• Understanding financial risks farmers face• Demonstrate new “Advanced Features” of decision tool

Remember When…

MPP Ration Value

Annual MPP Margin
Highest Margin Ever!

Average Daily U.S. Milk ProductionM
illio
ns o
f Pou
nds

Percent Change in U.S. Milk Production

A Tale of Two Regions…

Worst CA Drought in 1200 Years

Comparative Feed Cost Data
Wisconsin• Price of Hay = $150• Price of Corn = $3.47• Price of SBM = $370
California• Price of Hay = $260• Price of Corn = $5.01• Price of SBM = $420

Impact of Feed Costs

All Milk Price

Opinions Change Over Time

Opinions Change Over Time

MPP Margin Forecast
Opinion as of Sept 30, 2014
Opinion as of Sep 2, 2015

Consumer Confidence

We Need Exports!

U.S. Versus International Prices

U.S. Versus International Prices

Global Dairy Trade Index

U.S. Farm Milk Prices are Holding Up Better than Most
$18.38
$13.61
$10.61

Exports Need a Boost

Other Factors
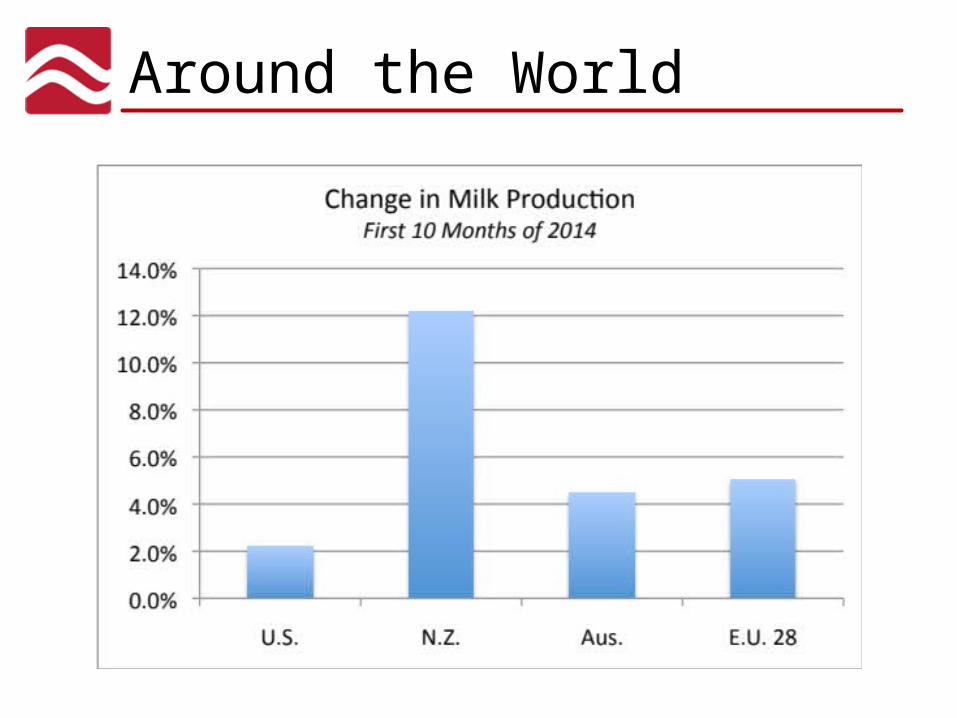
Around the World

Can We Tap on the Brakes?Strongest El Niño in 50 Years!

The Option to Producing Milk

My Forecast…
• Our strong U.S. economy is helping consume dairy products
• Dairy exports will become more of an issue in the next few months
• I think that the MPP margin will be worse than futures forecasts now suggest through the first half of 2016

OLD APPROACH TO DAIRY RISK MANAGEMENT
I KNOW WHERE PRICES ARE GOING! – You selectively hedge only when you disagree with the market consensus. Let’s be frank, you’re speculating.
DAIRY POLICY AS A PROFIT OPPORTUNITY – If subsidies are high, sign up, otherwise skip it.
“LEARN RISK MANAGEMENT!” – Extension, DMaP, brokers and policy makers all shoving risk management down your throat.

NEW APPROACH TO DAIRY RISK MANAGEMENT
FRAGILE – If your farm would have serious problems surviving a major downturn in profit margins.
ROBUST – If your financial position and cost of production allow you to withstand a very large and prolonged unexpected downturn in profit margins.
ANTIFRAGILE – If your farm benefits from milk and feed price volatility. For example, if you have very strong financial position, low cost of production, and have protected against downside in margins. Then as your competitors go out of business, you will have an opportunity to buy their farm at a great price.

NEW APPROACH TO DAIRY RISK MANAGEMENT
Our goal today, is to give you a tool to answer one key question:
Is my farm fragile, robust, or antifragile?
To answer that question, you need to:1) Know your farm (costs of production, financials)2) Execute a ruthless stress-test analysis

NEW APPROACH TO DAIRY RISK MANAGEMENT
Our goal today, is to give you a tool to answer one key question:
Is my farm fragile, robust, or antifragile?
To answer that question, you need to:1) Know your farm (costs of production, financials)2) Execute a ruthless stress-test analysis

KNOW YOUR FARM: PLANS, COSTS AND FINANCIALS

FARM-SPECIFIC DASHBOARD: PRODUCTION & PRICES
Basis tends to be lower in regions where costs of production are lower.

MPP-DAIRY: INCOME OVER FEED COSTS MARGIN BASIS
2007 2008 2009 2010 2011 2012 2013-5.00
-4.00
-3.00
-2.00
-1.00
0.00
1.00
2.00
3.00
Upper Midwest TexasIdaho California

OTHER OPERATING COSTS (EXCLUDING FEED, HERD REPLACEMENT, DEPRECIATION)
2007 2008 2009 2010 2011 2012 2013$0.00
$1.00
$2.00
$3.00
$4.00
$5.00
$6.00
$7.00
$8.00
$9.00
Upper Midwest TexasIdaho California

DASHBOARD: PRODUCTION & PRICES – KEY POINTS
Historical average MPP-Dairy margin is approx. $8.50/cwt.
Basis tends to be lower in western United States.
Basis tends to be lower in regions where costs of production are lower.
Most dairies, across the entire country, will have MPP-Dairy cash-flow break-even point below $8.50/cwt.

KNOW YOUR FARM: PLANS, COSTS AND FINANCIALS

FARM-SPECIFIC DASHBOARD: FARM FINANCIALS
Working capital per cow: Any losses will first be absorbed by cash reserves or by utilizing operating lines of credit.
Debt-to-Asset Ratio: If losses are deep and cannot be absorbed by working capital, long-term debt will be increased.
Assets Per Cow: Farms will more land will be able to spread losses over more assets.

NAME YOUR OWN PRICE (BE RUTHLESS)

NAME YOUR OWN PRICE (BE RUTHLESS)

KNOW YOUR FARM: PLANS, COSTS AND FINANCIALS

FARM-SPECIFIC DASHBOARD: RISK MANAGEMENT
Some common question include:• Do I need to hedge if I use MPP-Dairy? How much?• Should % hedged plus coverage percentage be lower than
total milk production?• When should I hedge?

FARM-SPECIFIC DASHBOARD: RISK MANAGEMENT

FARM-SPECIFIC DASHBOARD: RISK MANAGEMENT

DASHBOARD: RISK MANAGEMENT – KEY POINTS
MPP-Dairy and private risk management tools may be combined to keep profitability, liquidity and solvency above desired thresholds at least hedging costs.

Questions?
![SolidRun - Docs start [Wiki | SolidRun ] using MPP multiplexing option of SDIO on {MPP [40:37], MPP[28:24], MPP[21]} 0X32 BootROM Enabled, Boot from SPI: Controller #0. 24 address](https://static.fdocuments.in/doc/165x107/5f829700fe27b20dc10133f6/solidrun-docs-start-wiki-solidrun-using-mpp-multiplexing-option-of-sdio-on.jpg)